falcon - university of notre dameseniordesign.ee.nd.edu/2017/design teams/falcon/documents... ·...
TRANSCRIPT

FALCON Innovation on Wings
William Bloebaum, Alexander Rosner, Albert Lee
1
Table of Contents
1. Introduction 2
2. Detailed System Requirements 5
3. Detailed Project Description 6 3a System Theory of Operation 6 3b System Block Diagram 7 3c Detailed Design and Operation of Microphone 9 3d Detailed Design and Operation of ADC Data Collection 12 3e Detailed Design and Operation of MicroSD Data Transfer 15 3f System Interfaces 17
4. System Integration Testing 21 4a Subsystem Integration Testing 21
5. User Manual 22 5a Installation and Setup 22 5c Troubleshooting 28
6. To-Market Changes 28
7. Conclusions 29
8. Appendices 30 8a Parts List 30 8b Hardware Schematics 31 8c Software Listing 33

2
1. Introduction
The FALCON Pack is part of a larger research project headed by Professor Lauren
Kloepper from St. Mary’s College, which aims to reveal more about the communication patterns
of Mexican Free-Tailed Bats. These bats come out of caves in swarms of over a million, and
must communicate with each other to avoid colliding with each other and other environmental
factors. They do this by transmitting and receiving intense (100-120 dB), short (~10 ms),
ultrasonic down-sweeps from ~60 kHz to ~20 kHz. Little is known, however, about how the
signals don’t interfere with each other, and how the bats are able to echolocate the others, all
while flying at high speeds and densities. Furthermore, the bats produce different signals when
threatened by a predator to warn the others in the colony of the danger. Biologists tentatively
suggest that bats produce more of a tonal signal for these warning calls, rather than the normal
frequency downsweep, but that has not been confirmed. Recording the bat calls in different
contexts will hopefully shed more light on exactly how they communicate and process the
signals. Because findings from this research project can be relevant to military drone
communication technology, some funding was provided by the United States Navy.
With the help of Professors Robert Stevenson, Lauren Kloepper, and Mike Schafer, our
group was set to design and build an electronic rig that would record and store the
high-frequency audio signals emitted by the bats. This package would be attached to a live,
trained Harris’s Hawk, which would in turn fly through the swarms of bats as they exited their
cave. The audio portion of the electronics package would also be integrated with Postdoc Felix
Fu’s project, which would record and store video footage from the falcon’s point of view. The
3
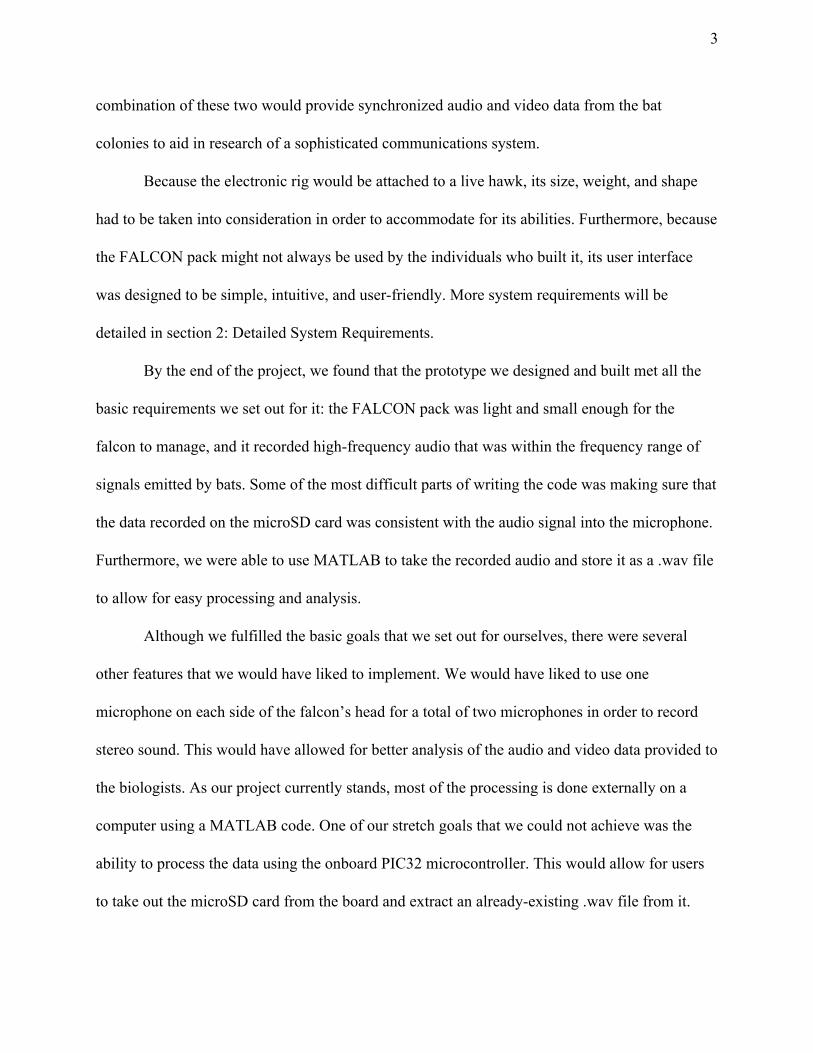
combination of these two would provide synchronized audio and video data from the bat
colonies to aid in research of a sophisticated communications system.
Because the electronic rig would be attached to a live hawk, its size, weight, and shape
had to be taken into consideration in order to accommodate for its abilities. Furthermore, because
the FALCON pack might not always be used by the individuals who built it, its user interface
was designed to be simple, intuitive, and user-friendly. More system requirements will be
detailed in section 2: Detailed System Requirements.
By the end of the project, we found that the prototype we designed and built met all the
basic requirements we set out for it: the FALCON pack was light and small enough for the
falcon to manage, and it recorded high-frequency audio that was within the frequency range of
signals emitted by bats. Some of the most difficult parts of writing the code was making sure that
the data recorded on the microSD card was consistent with the audio signal into the microphone.
Furthermore, we were able to use MATLAB to take the recorded audio and store it as a .wav file
to allow for easy processing and analysis.
Although we fulfilled the basic goals that we set out for ourselves, there were several
other features that we would have liked to implement. We would have liked to use one
microphone on each side of the falcon’s head for a total of two microphones in order to record
stereo sound. This would have allowed for better analysis of the audio and video data provided to
the biologists. As our project currently stands, most of the processing is done externally on a
computer using a MATLAB code. One of our stretch goals that we could not achieve was the
ability to process the data using the onboard PIC32 microcontroller. This would allow for users
to take out the microSD card from the board and extract an already-existing .wav file from it.

4
Furthermore, there is currently no interfacing at all between the audio and video data, as they are
recorded by separate systems. We would have liked to implement an onboard synchronization
feature that would merge the audio and video data together to create a single, playable file. More
about future changes can be found in section 6: To-Market Design Changes.
Despite not accomplishing all of the stretch goals we set out for ourselves, the final
prototype that we developed is sufficient to use in the field and will provide valuable data for the
research of bat communications.
2. Detailed System Requirements
Due to restrictions set by the falcon’s size and strength, the final package’s weight was
limited to ~30g. The final board is divided into two separate parts: a smaller unit containing the
microphone located on the falcon’s head, and a larger unit containing the microcontroller,
storage device, battery, and other accessory components located on the falcon’s back. Both of
these components are attached to the falcon via training harness. The combined surface area of
these two boards were to be minimized as much as possible, and the final design had a surface
area of about 1.5 square inches. The rig would also be rugged enough to handle jostling from
colliding bats, movement of the falcon itself, and other environmental factors.
Because minimizing weight played the largest part in our decision-making, a low-power
PIC32MX270F256B microcontroller was used to process the incoming data from the
microphone and store it in a microSD card. The microphone must be able to measure a range of
frequencies from 15kHz to 100kHz with amplitudes of up to 120dB, to guarantee it recorded all
5
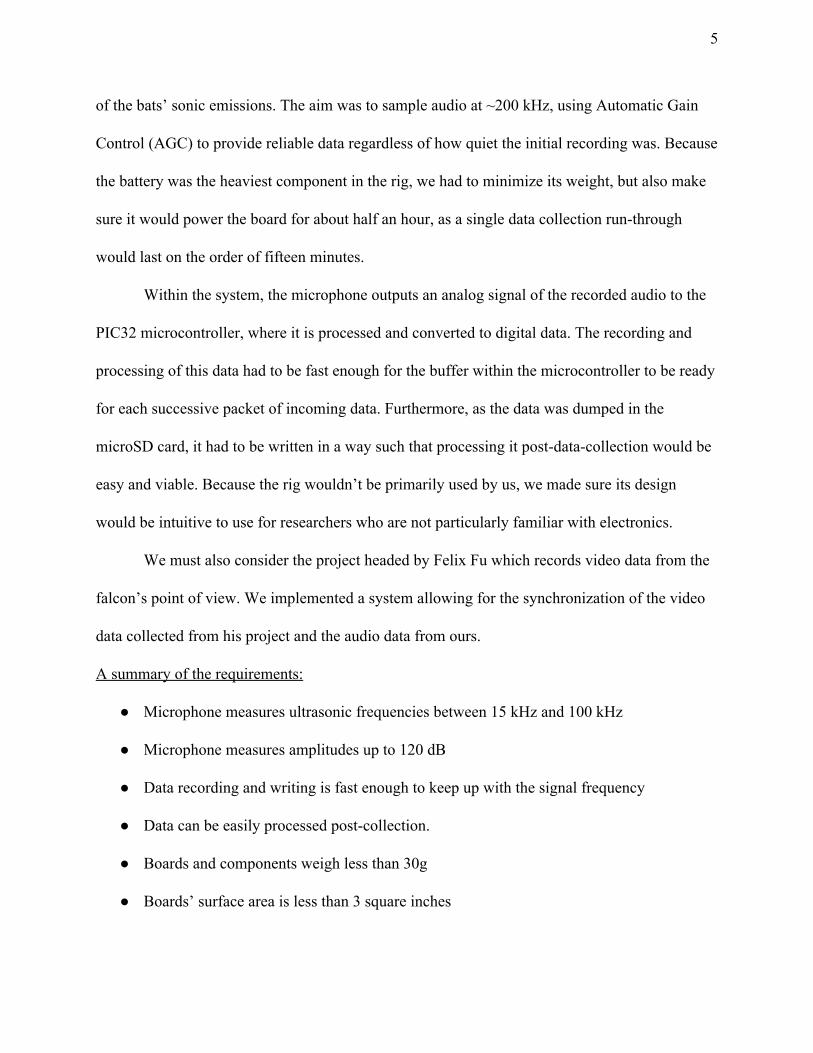
of the bats’ sonic emissions. The aim was to sample audio at ~200 kHz, using Automatic Gain
Control (AGC) to provide reliable data regardless of how quiet the initial recording was. Because
the battery was the heaviest component in the rig, we had to minimize its weight, but also make
sure it would power the board for about half an hour, as a single data collection run-through
would last on the order of fifteen minutes.
Within the system, the microphone outputs an analog signal of the recorded audio to the
PIC32 microcontroller, where it is processed and converted to digital data. The recording and
processing of this data had to be fast enough for the buffer within the microcontroller to be ready
for each successive packet of incoming data. Furthermore, as the data was dumped in the
microSD card, it had to be written in a way such that processing it post-data-collection would be
easy and viable. Because the rig wouldn’t be primarily used by us, we made sure its design
would be intuitive to use for researchers who are not particularly familiar with electronics.
We must also consider the project headed by Felix Fu which records video data from the
falcon’s point of view. We implemented a system allowing for the synchronization of the video
data collected from his project and the audio data from ours.
A summary of the requirements:
● Microphone measures ultrasonic frequencies between 15 kHz and 100 kHz
● Microphone measures amplitudes up to 120 dB
● Data recording and writing is fast enough to keep up with the signal frequency
● Data can be easily processed post-collection.
● Boards and components weigh less than 30g
● Boards’ surface area is less than 3 square inches
6
3. Detailed Project Description
3a System Theory of Operation
Ideally, the user of the FALCON pack would simply attach the rig onto the falcon’s
training harness and press a button on the board that would initiate audio recording. Once that
has begun, the microphone will continuously send analog audio data to the PIC32
microcontroller. The PIC32 will create a new file in the microSD card and convert the
microphone’s output to digital data by sampling the incoming signal at a rate of 200 kHz. This
data is then dumped into the newly-created file within the microSD card also using Serial
Peripheral Interface (SPI). After the falcon flies through a swarm of bats, it would presumably
return to the owner, who would press the button again to stop recording audio. The microSD card
would then be ejected from the board and inserted into an external computer for data processing
and analysis.

7
3b System Block Diagram
Below is the block diagram of the overall system:
Figure 3.1- System Block Diagram
The block diagram that we followed for the development of this project is a relatively
simple one, as it follows a single linear path.
1) The signal source produces an ultrasonic frequency waveform. For testing
purposes, we used a 40 kHz chirp signal generator, but live bats will serve as the
signal source in the field.
2) The signals will be recorded by a high-frequency microphone that will output an
analog electrical signal corresponding to the audio it reads. This signal is fed
directly into the AGC.

8
3) The Automatic Gain Control (AGC) takes the incoming signal and adjusts its
amplitude, depending on the gain setting (manual vs. automatic) and strength of
the original signal. Faint signals produced by distant bats will be amplified, and
stronger signals will be attenuated in order to prevent clipping of the waveforms.
This signal is also run through a passband filter, allowing only frequencies
between 10 kHz and 100 kHz to go to the PIC32.
4) The PIC32 does the bulk of the processing, as it samples the analog signal to
produce digital data with the ADC. It then creates a file within the microSD card
and writes the digital data into it.
5) The microSD acts upon the PIC32 and simply stores the digital audio data in a
newly-created file that is closed once data collection is ended.
3c Detailed Design and Operation of Microphone
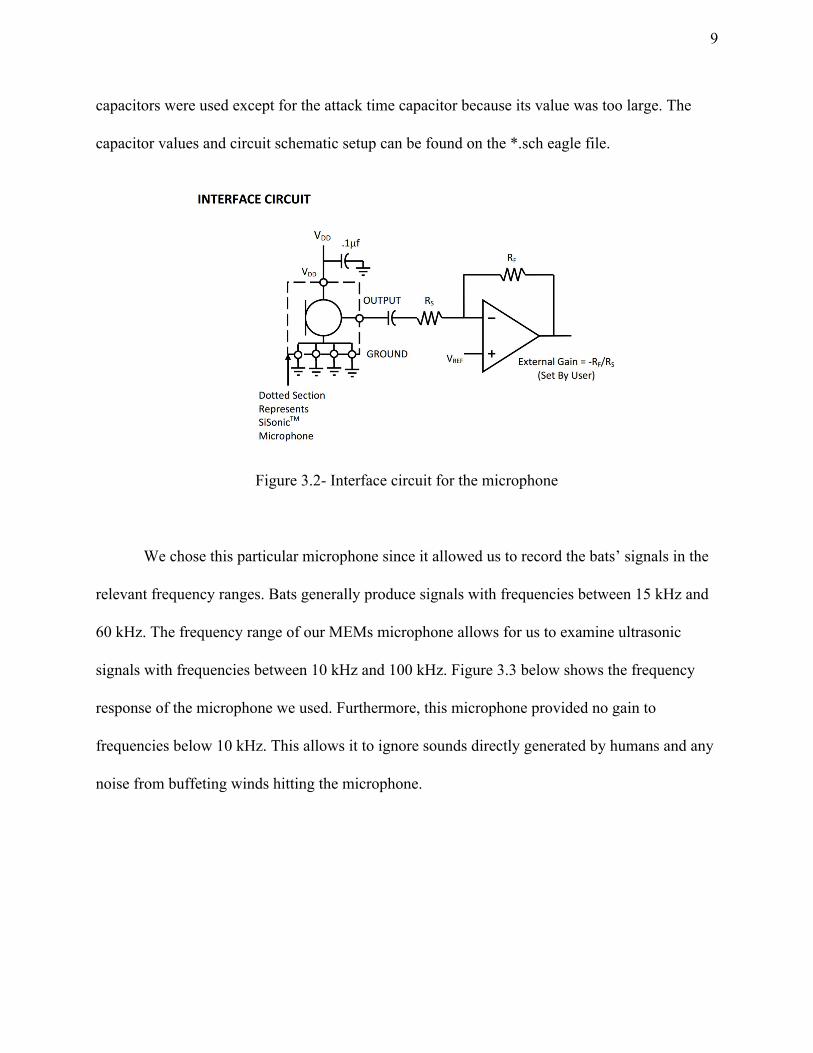
The board used Knowles’ SiSonic MEMS microphone (SPU0410LR5H) which has a flat
frequency response in the desired 10-100 kHz range. It is AC coupled into an amplifier
(AD8338) equipped with both automatic gain control (AGC) and manual gain control. The
coupling capacitors at the input to the chip and the capacitors at the output are designed to be a
first order bandpass filter from 10-100 kHz. The capacitor connected to the gain I/O pin is
designed to produce and attack time of 80 ms to respond to the 10 ms duration of the bat calls.
To combat the possibility of the capacitors emitting sound waves back to the microphone, class I
9
capacitors were used except for the attack time capacitor because its value was too large. The
capacitor values and circuit schematic setup can be found on the *.sch eagle file.
Figure 3.2- Interface circuit for the microphone
We chose this particular microphone since it allowed us to record the bats’ signals in the
relevant frequency ranges. Bats generally produce signals with frequencies between 15 kHz and
60 kHz. The frequency range of our MEMs microphone allows for us to examine ultrasonic
signals with frequencies between 10 kHz and 100 kHz. Figure 3.3 below shows the frequency
response of the microphone we used. Furthermore, this microphone provided no gain to
frequencies below 10 kHz. This allows it to ignore sounds directly generated by humans and any
noise from buffeting winds hitting the microphone.

10
Figure 3.3 - The MEMS microphone frequency response
Because our project was largely software based, much of the testing for the individual
subsystems was straightforward and easy to do, but actually getting them to work proved to be
the most difficult part. For our first subsystem, the microphone, testing was easily done by
looking up its specifications on the data sheet to confirm that it could record audio at our desired
frequency ranges. We also examined its frequency response to see that the gain would be fairly
constant throughout the same range of frequencies. Making sure that the microphone functioned
the way we thought it would was as simple as connecting its output to an oscilloscope or logic
analyzer. We would play a high-frequency tone into the microphone, and examine the data
coming out from the microphone. To see if the microphone was tuned correctly, we would
generate a tone with a known frequency and confirm that the frequency produced by the
microphone would match that of the original tone.

11
3d Detailed Design and Operation of ADC Data Collection
The analog to digital conversion (ADC) system was relatively simple. We set up the
configuration bits for the system to sample at 200kS/s and made sure to select the correct analog
pin for our input as well as turn that pin on with the ANSELx register. The ADC was set up to
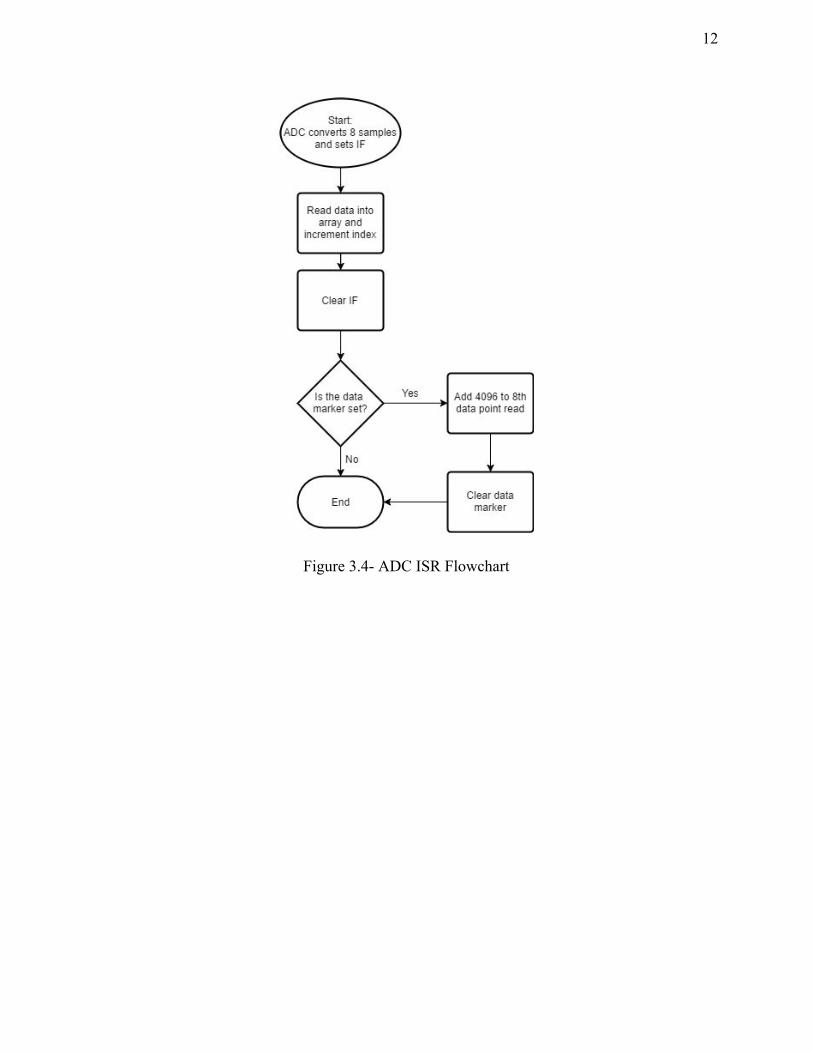
operate using two 8-sample buffers and output data as unsigned integers. The interrupt flag for
the ADC triggers after 8 sample conversions. The interrupt service routine (ISR) reads the
samples into a global short array with the index determined by a global index variable. The
index is incremented after each sample is read and once all 8 samples are read the program clears
the interrupt flag. If the synchronization data marker is set then the program will add 4096 to the
most recently read sample (equivalent to toggling the 12th bit of the short), then exit the ISR.
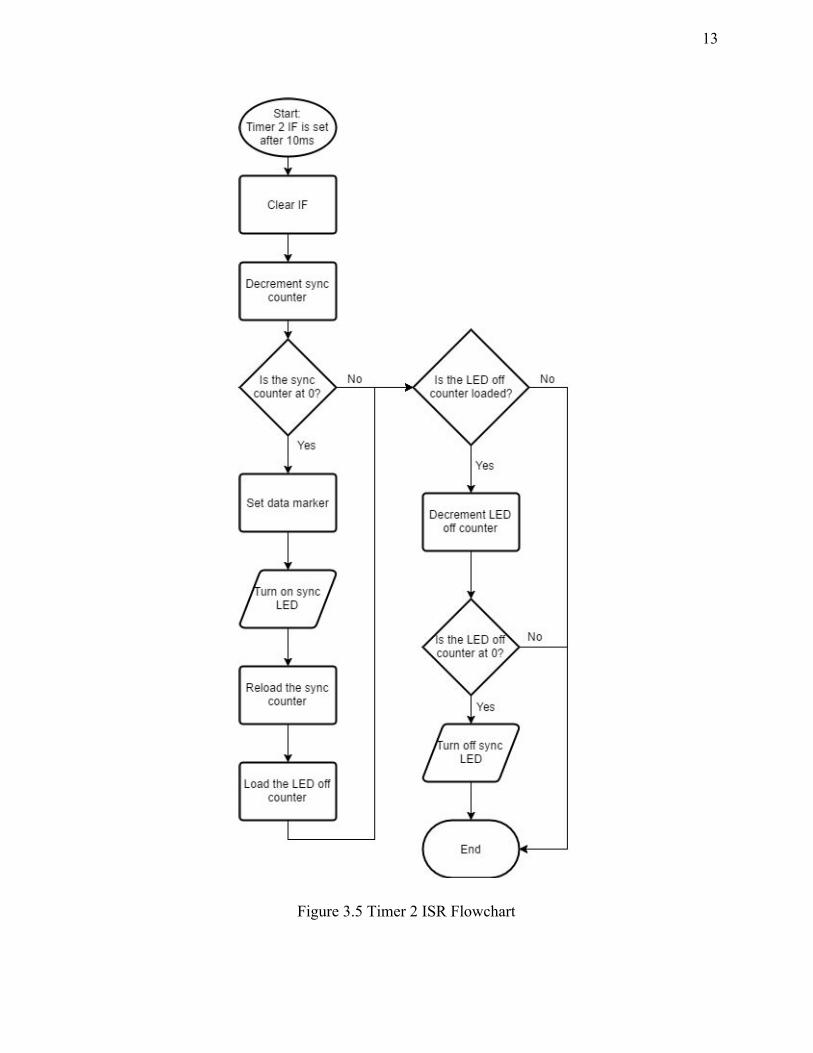
The synchronization data marker is determined by the ISR of a 100 Hz timer that sets the data
marker after a user-defined number of 10ms interrupts. The timer ISR also flashes an LED that
will be used to match the video capture data to the sound capture data. A flowchart of the ISR
and the synchronization timer ISR that governs the data marker can be seen below.
12
Figure 3.4- ADC ISR Flowchart
13
Figure 3.5 Timer 2 ISR Flowchart
14
There is some overflow control in case the SD card gets hung up on an abnormally long
write where the last 8 samples in the global array are overwritten. In our testing we never saw
this overflow occur when the data was stored as shorts. We chose to use shorts because the
output of the ADC is only 10 bits, so using full 32 bit integers was using twice the space for no
extra information. Also, using uint32 variables caused the data array to overflow during longer
SD card writes. Using shorts eliminated 16 bits of headroom while still having enough
headroom to place the data marker. Upon testing of the system, it turned out that even though
the system was set up for 200kS/s the actual sample rate was about 5% slower than the spec
sheets were detailing (even with multiple equivalent register configurations), so we increased the
sample rate by about 5% and adjusted the MATLAB data processing code to use the actual
sample rate: 199450 S/s which was determined using a known function generator input to the
ADC system.
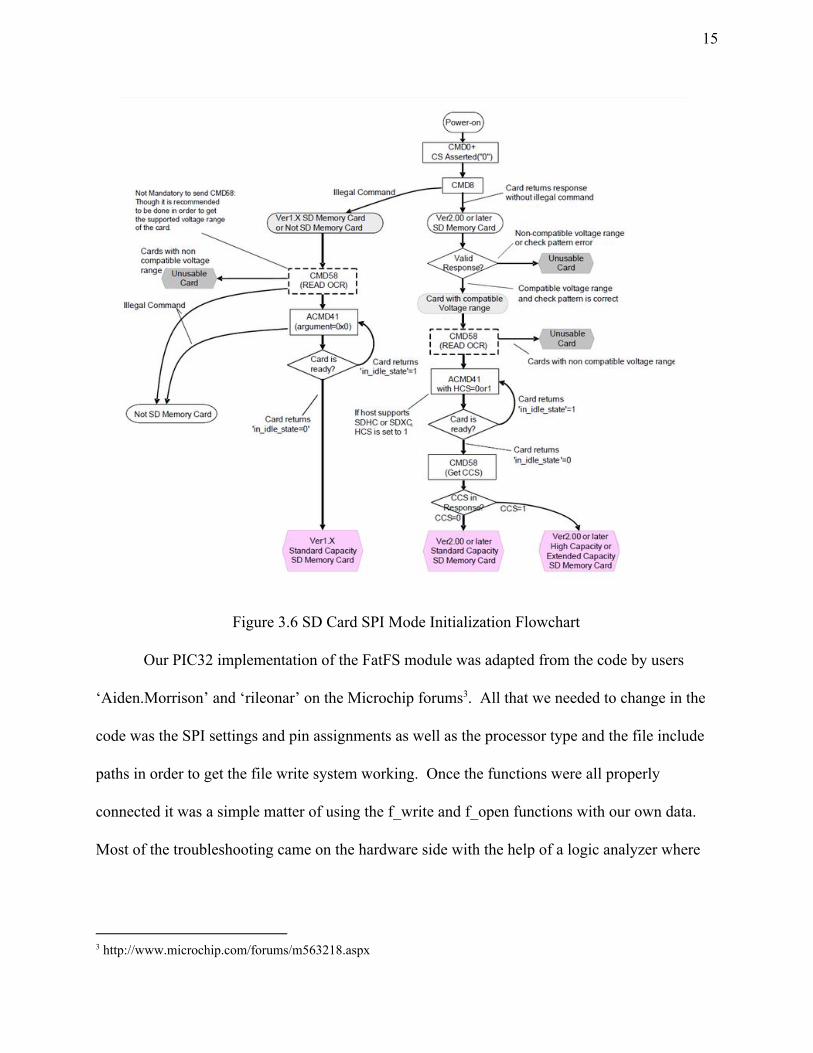
3e Detailed Design and Operation of MicroSD Data Transfer
Information about the SD protocol and how to implement it came mostly from ChaN’s
website . This website describes how to connect to the SD card and what the commands are that 1
should be sent and received by the card. The microSD card data transfer was handled by the SPI
system on the PIC32. Initialization and use of a microSD card in SPI mode is complicated so we
used the FatFS module developed by ChaN to manage the file system and file write functions. 2
A flowchart of the SD card SPI initialization sequence can be seen below.
1 http://elm-chan.org/docs/mmc/mmc_e.html 2 http://elm-chan.org/fsw/ff/00index_e.html
15
Figure 3.6 SD Card SPI Mode Initialization Flowchart
Our PIC32 implementation of the FatFS module was adapted from the code by users
‘Aiden.Morrison’ and ‘rileonar’ on the Microchip forums . All that we needed to change in the 3
code was the SPI settings and pin assignments as well as the processor type and the file include
paths in order to get the file write system working. Once the functions were all properly
connected it was a simple matter of using the f_write and f_open functions with our own data.
Most of the troubleshooting came on the hardware side with the help of a logic analyzer where
3 http://www.microchip.com/forums/m563218.aspx

16
we discovered we needed to pull up the MISO line in order for the SD card system to properly
enter its ready states.
The SPI system for this project initializes at 400 kHz and then ramps up to 20 MHz
post-initialization for the writing. Initially we were concerned the data throughput of the SPI
protocol into the SD card would not be fast enough to do 200kS/s, but upon testing of the system
we found that we were able to write 4k of data faster than we collected 4k of data. The reason
we chose to use SPI to communicate with the microSD instead of the SD protocol is because of
our familiarity with the SPI protocol and the PIC32’s proven compatibility with SD cards using
the SPI protocol. Our system block writes 4k sections of the SD card every time the ADC output
array is full of data using the f_write command in the FatFS module.
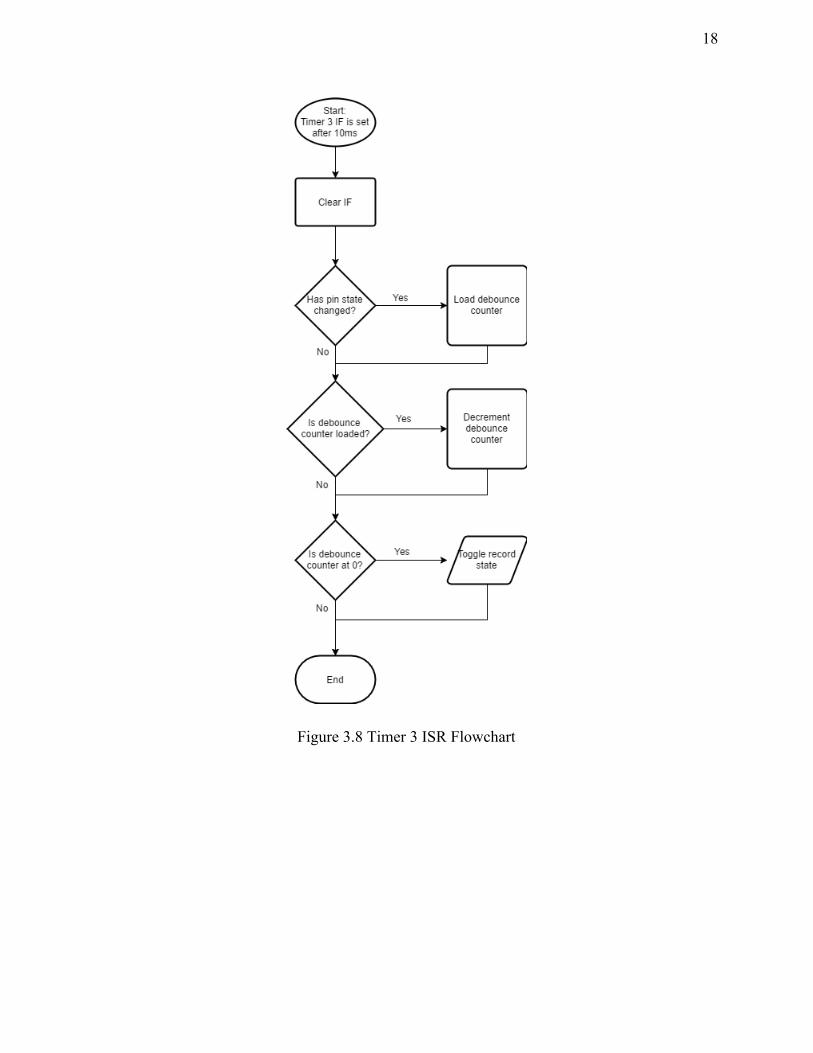
3f System Interfaces
Below is the overall software flowchart. Keep in mind the interrupt service routines of
the ADC and timers 2 and 3 will be executing and being handled as well. The flowchart for the
timer 3 interrupt which handles the button pressing and debouncing is also shown below after the
overall system flowchart. The system operates with a double while loop controlled by the user’s
pressing of the start/stop recording button. After initialization of all the systems the program
waits for the user to press the start/stop recording button. Once the button is pressed, the
recording LED is turned on and the system starts recording data and writing it in 4k blocks to the
SD card in a newly created *.DAT file until the user presses the button again. Next the program
closes the data file and unmounts the SD card, flashes the record LED twice, then waits for the
next button press so it can create a new file and record another data run.

17
Figure 3.7 Overall System Flowchart
18
Figure 3.8 Timer 3 ISR Flowchart

19
4. System Integration Testing
4a Subsystem Integration Testing
Because the data written to the microSD would not be valid if the prior subsystems were
not working, all we had to do to verify the successful integration of the subsystems was to
examine the final block from our block diagram: the data written on our microSD card. This was
done by playing a 40 kHz chirp from a high-frequency audio generator, and confirming that the
same waveform was written in the microSD card.
4b Demonstration of Overall System Requirements
We were able to demonstrate the functionality of the entire system by relying on one
output: the data written into the microSD card which would not be accurate if any of the prior
subsystems did not work correctly. Because our block diagram was made up of just one line,
each subsystem directly affected the performance of the final block.
The final block being the microSD card, we simply had to demonstrate that the data
written into to the microSD storage was the same as that played into the microphone. The
process involved use of an ultrasonic frequency generator that produces chirps of exactly 40
kHz, given to us by Professor Kloepper. We would play these chirps into our microphone, which
would send an analog waveform through the Automatic Gain Control (AGC), where its gain
would be modified accordingly. The analog data would then go through the PIC32
microcontroller and be sampled to produce digital data. This digital data would be then written to
a file in the microSD card, from where it could be easily read or analyzed.
20
To actually verify that the recorded data in the microSD card would be consistent with
the 40 kHz chirp we played into the microphone, the SD card was inserted into a computer and
the data file was analyzed by our custom MATLAB code, “readSoundData.m.” This code will
open up graphs showing the characteristics of the recorded sound and also create a *.wav file
corresponding to the data. We observed that there were peaks at 40 kHz and 80 kHz on the
Fourier Transform graph of the data, confirming that the data is consistent with the original
sound. Note that the 80 kHz peak is a harmonic arising from the imperfect nature of the sine
waves we recorded.
5. User Manual
5a Installation and Setup
To install the FALCON pack, the user must provide power to the unit by connecting a
battery rated for voltages between 3.3V and 10V to the MOLEX connector on the larger board.
Both of the boards should then be attached to the falcon’s training harness by means of a custom
casing or other non-intrusive measure. The larger board should be placed on the falcon’s back,
and the smaller one on the top of the falcon’s head alongside the camera module. A microSD
card must also be inserted in the microSD slot located on the larger board.
Once power is supplied to the boards, a single red LED labelled “POWER” will light up
on the back board and stay on as long as the boards have power from the battery. When the
falcon is ready for data collection, the user must press the button labelled “START/STOP
21
RECORDING” on the back board, which will light up a red LED alongside the button. Once the
falcon has returned from flying the same button should be pressed to stop audio recording. The
adjacent LED should turn off, but the POWER LED should stay lit. If the module has responded
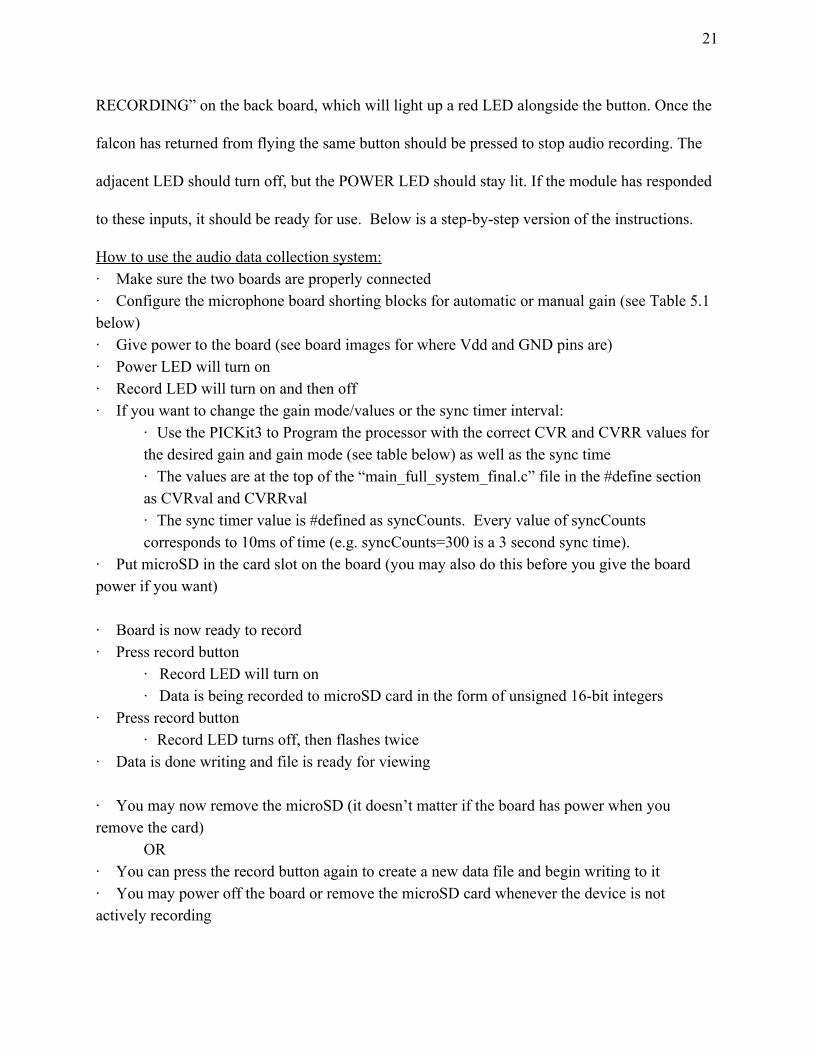
to these inputs, it should be ready for use. Below is a step-by-step version of the instructions.
How to use the audio data collection system: · Make sure the two boards are properly connected · Configure the microphone board shorting blocks for automatic or manual gain (see Table 5.1 below) · Give power to the board (see board images for where Vdd and GND pins are) · Power LED will turn on · Record LED will turn on and then off · If you want to change the gain mode/values or the sync timer interval:
· Use the PICKit3 to Program the processor with the correct CVR and CVRR values for the desired gain and gain mode (see table below) as well as the sync time · The values are at the top of the “main_full_system_final.c” file in the #define section as CVRval and CVRRval · The sync timer value is #defined as syncCounts. Every value of syncCounts corresponds to 10ms of time (e.g. syncCounts=300 is a 3 second sync time).
· Put microSD in the card slot on the board (you may also do this before you give the board power if you want) · Board is now ready to record · Press record button
· Record LED will turn on · Data is being recorded to microSD card in the form of unsigned 16-bit integers
· Press record button · Record LED turns off, then flashes twice
· Data is done writing and file is ready for viewing · You may now remove the microSD (it doesn’t matter if the board has power when you remove the card)
OR · You can press the record button again to create a new data file and begin writing to it · You may power off the board or remove the microSD card whenever the device is not actively recording
22
When microSD card is in the PC: · Copy the desired file to the folder where the “readSoundData.m” file is located · Open “readSoundData.m” · Change the variables at the top of the file “readSoundData.m” to read the desired data file and name the outputted *.wav file · If you don’t want to make/edit the *.wav file, change “makeWavFile” to equal 0 · If you don’t want MATLAB to output the graphical waveform and fast Fourier transform, change “makePlots” to equal 0 · Run the MATLAB script · You now have a *.wav file of the data · The sample numbers where the sync markers were made are in the “markerPoints” variable · The raw and corrected data as well as voltage and -1 to +1 normalized data arrays are written into column vectors.

23
CVRR=0
CVRR=1
CVR<3:0> Voltage
(V) Gain (dB)
Voltage (V) Gain(dB)
0 0.83 21.6
0
1 0.93 13.6
0.14 76.8
2 1.03 5.6
0.28 65.6
3 1.13
0.41 55.2
4 1.24
0.55 44
5 1.34
0.69 32.8
6 1.44
0.83 21.6
7 1.55
0.96 11.2
8 1.65
1.1 0
9 1.75
1.24
10 1.86 AGC Mode
1.38
11 1.96
1.51
12 2.06
1.65
13 2.17
1.79
14 2.27
1.93
15 2.37
2.06
*Don’t use the highlighted cell values
Table 5.1. Voltage Reference Values and Associated Gains
24
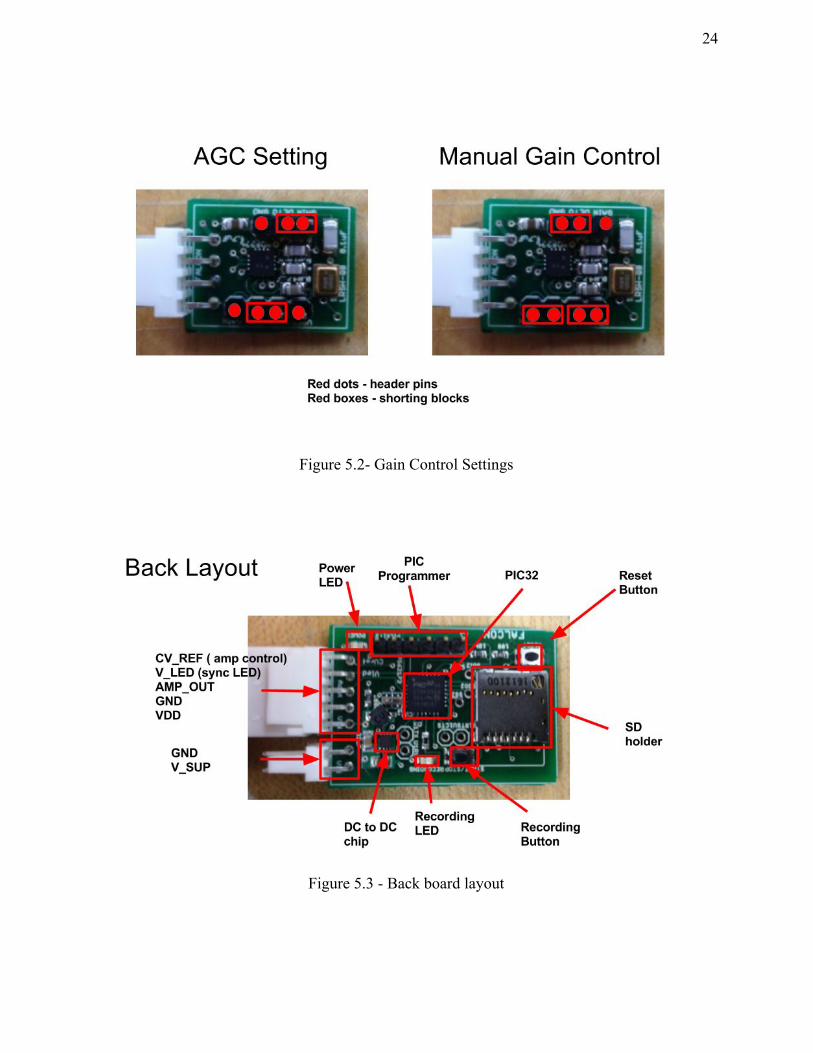
Figure 5.2- Gain Control Settings
Figure 5.3 - Back board layout
25
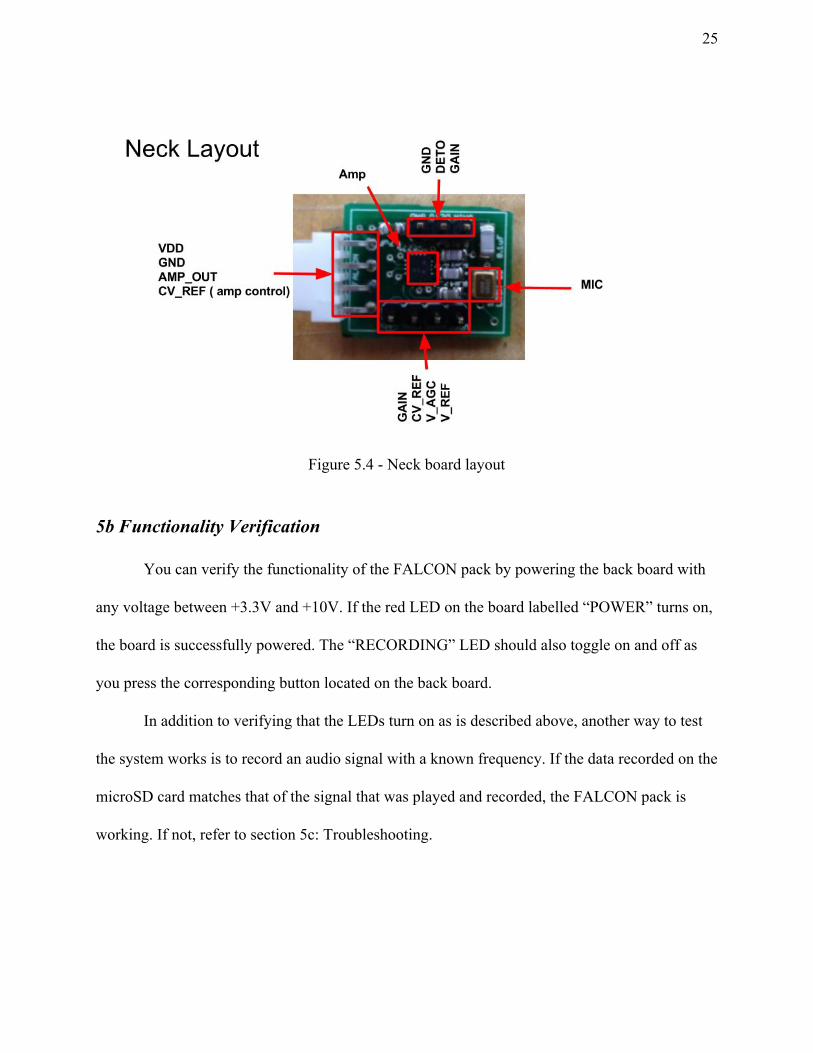
Figure 5.4 - Neck board layout
5b Functionality Verification
You can verify the functionality of the FALCON pack by powering the back board with
any voltage between +3.3V and +10V. If the red LED on the board labelled “POWER” turns on,
the board is successfully powered. The “RECORDING” LED should also toggle on and off as
you press the corresponding button located on the back board.
In addition to verifying that the LEDs turn on as is described above, another way to test
the system works is to record an audio signal with a known frequency. If the data recorded on the
microSD card matches that of the signal that was played and recorded, the FALCON pack is
working. If not, refer to section 5c: Troubleshooting.

26
5c Troubleshooting
If the “POWER” LED doesn’t turn on after connecting a battery to the terminals, the
battery may be discharged. Replace the battery with a charged, or try connecting the board to an
external power source. NOTE: The smaller board does not need to be powered separately; it is
powered by the larger board, which is in turn powered by the battery.
If the “POWER” LED still doesn’t turn on, check that all the connections to and on the
boards are still intact. If any wires are broken or frayed, solder the wire back together. If the
board still doesn’t turn on, the power and ground leads may have been shorted together, or
overvoltage may have rendered the board broken.
Be careful not to press the reset button or remove the SD card during recording or the
currently open file will become corrupted. If you find that the files are not being properly
written, the SD card may have been unmounted while the files were open and our programming
cannot re-initialize it. Simply put the SD card into a computer and open up the file system. This
will re-initialize the SD card and close any files left opened from an unexpected shutdown. You
should be able to put the SD card back into the board and record normally.
For more information, contact [email protected]

27
6. To-Market Changes
Due to time and budget constraints, the prototype we created is not the ideal product that
would be sold on the market. Below are several features we would have added or modified if we
were to have had the necessary resources to finish the project to the best of our ability.
One of the stretch goals we were trying to fulfill was the ability to record stereo audio
with the board. However, because we were utilizing practically every single clock pulse for one
microphone, we would not have been able to write the data from two different microphones with
the same hardware setup. A different writing protocol than real-time SPI would have to be used
(e.g. DMA) in order to implement stereo because the necessary sample rate would have to
double to accommodate two microphones. Largely due to lack of processing resources available,
we were also unable to accomplish onboard synchronization of the audio and video data. The
synchronization must be done externally on a computer with the recorded data. Furthermore, we
also would have implemented onboard processing of the recorded data, so we wouldn’t have to
use MATLAB or some other software to show the recorded frequencies.
In terms of hardware, we would have developed a more robust casing system for the
boards in order to prevent connections from loosening, components from breaking off, etc.
Furthermore, we would have developed a more user-friendly interface with clearer labels for
buttons and more status LEDs indicating exactly what the PIC32 is doing at any given moment
to prevent confusion.

28
7. Conclusions
This experience allowed us to learn more about the effects of working on a supervised
project with real deadlines. Because we were working for a research team funded and overseen
by actual professor research teams, not fulfilling requirements would have real-life
repercussions. Especially because much of the scope of what we were working on was not
specifically covered over the course of our studies, we were challenged in many different ways;
much of the hardware we worked with was custom-made or bought from a third party and thus
required more attention to work with. We learned much about working in a team, and the process
of developing a working prototype from start to finish.
Overall, we are very happy with the final prototype. Despite the various difficulties faced
throughout the process, we were able to create something that fulfills all the basic design
requirements that we initially set out for ourselves and have a working prototype that will be
used in the field to actually aid in the research of bat communications.

29
8. Appendices
8a Parts List
Manufacturer Part No. Description Price Quantity
Microchip PIC32MX270U Microcontroller $5.49 1
MOLEX 1040310811 microSD Card Connector Socket
$1.92 1
Texas Instruments TPS6217X DC-DC Step-down converter $2.00 1
Murata CSTCE-10M0G Ceramic Resonator $0.48 1
Knowles SPU0410LR5H-QB
Zero-Height SiSonic Microphone
$0.94 1
Analog Devices AD8338 Variable Gain Amplifier $8.09 1
MOLEX WM-4302 4-pin Connector $0.20 1
4PCB N/A Custom PCB $30.00 1
Total $49.12
Table 8.1- Bill of Materials for the FALCON Pack
30
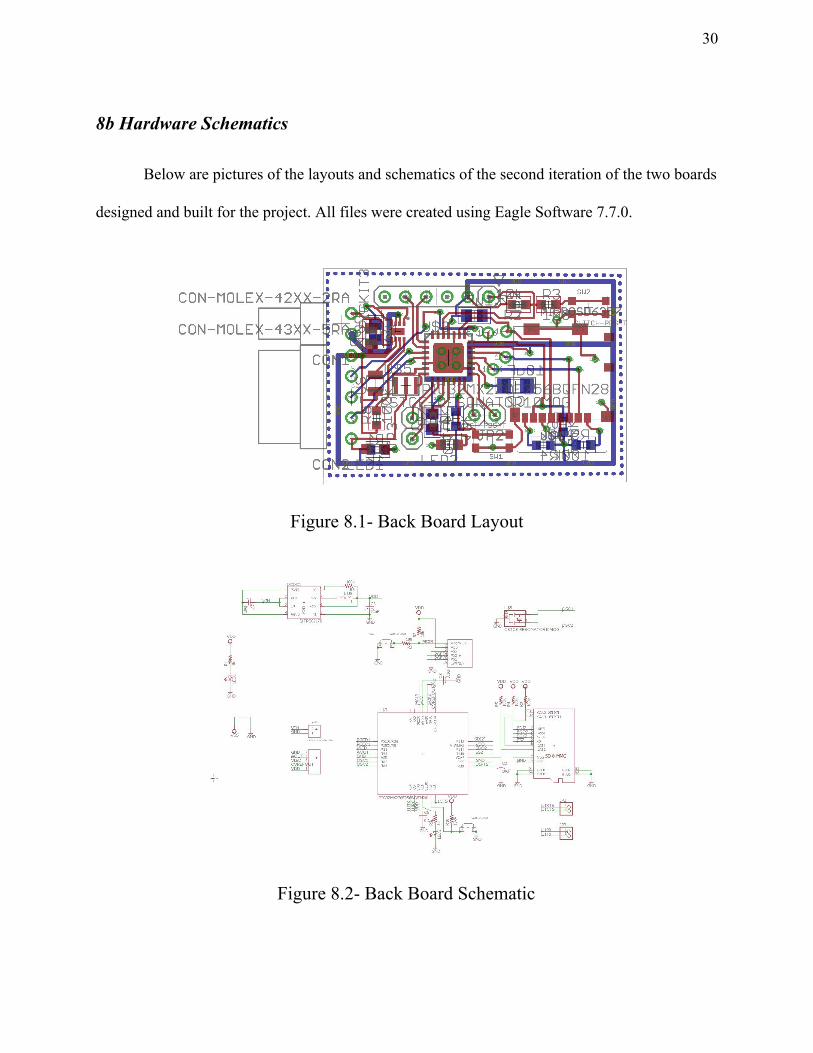
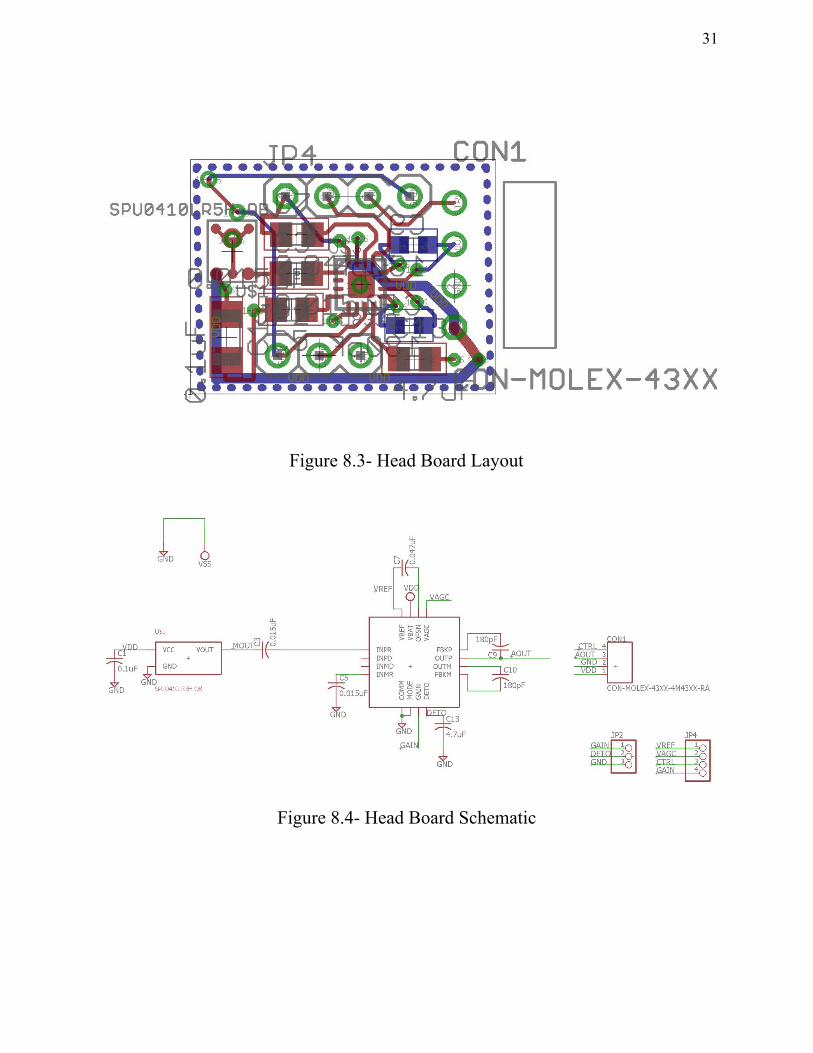
8b Hardware Schematics
Below are pictures of the layouts and schematics of the second iteration of the two boards
designed and built for the project. All files were created using Eagle Software 7.7.0.
Figure 8.1- Back Board Layout
Figure 8.2- Back Board Schematic
31
Figure 8.3- Head Board Layout
Figure 8.4- Head Board Schematic
32
8c Software Listing
Below are links to our utilized code: MatLab Code for processing sound data:
https://drive.google.com/open?id=0B8ZNvCeAuqyVd0o2bzlaaUY2MUE
MPLabX Code for PIC32:
https://drive.google.com/open?id=0B8ZNvCeAuqyVZWdtYWFPT3lld0E