fall 1433h (2012g) saturday, monday & wednesday … · metrology & quality control fall...
TRANSCRIPT

Metrology & Quality Control
Fall 1433H (2012G)
Saturday, Monday & Wednesday 11:00am -
11:50am and Saturday 13:00am - 14:50pm
MENG 436 Class FA
Dr. Walid A. AissaDr. Walid A. Aissa
Associate Professor, Mech. Engg. Dept.
Faculty of Engineering at Rabigh, KAU, KSA
Chapter #5
September XX, 2012

Announcements:
Dr. Walid’s e-mail and Office Hours
Office hours for Metrology & Quality Control will be
every Sunday and Tuesday from 11:00 – 13:00 am in Dr.
Walid’s office (Room 5-109).
Text book:Text book:
1-Metrology for Engineers, J.F.W. Galyer & C. R.
Shotbolt, 4th Edition, Cassell Ltd., London, ISBN-0-
304 30612 6, 1980.
2-Essentials of Quality With Cases and
Experimental Exercises, Victor E. Sower, John Wiley
& Sons Inc., London, ISBN-978-0-470-50959-3, 2011.

Chapter 5Surface Texture
MEASUREMENTSMEASUREMENTS

Objectives of CH5: To
• Recognize
-Why we measure surface roughness?.
-Tracing Surface Irregularities.-Different Parameters for Surface Roughness
.Interpretation.
-Surface Roughness Value Conversions.
- Surface Roughness symbol in drawing.
5. SURFACE TEXTURE (TOPOGRAPHY)
MEASUREMENTS
Chapter 5

A surface is a boundary that separates an objectfrom another object or substance .Surface finish is
one of the most common measures of surface
quality and a wide variety of methods and
parameters have been developed to measure it.
5.1. Introduction:
parameters have been developed to measure it.
Methods for their measurement range from naked
eye viewing and rubbing with a thumb to the use
of ellipsometers and sophisticated atomic force
microscopes.

5.2. Why we measure surface roughness?
Figure 1

Figure 2

Figure 3

5.3. General:
Surface finish affects how a part will fit, wear,
reflect light, transmit heat, distribute lubrication
and accept coatings.
The finish should be determined by the part's
function: you want a surface that fulfills the function: you want a surface that fulfills the
engineering requirements of the application,
without wasting time and effort on a higher
quality finish than is necessary.
(In fact, many applications do better with a certain
amount of "texture," and too fine a finish can be as
bad as too coarse.).

Thirty years ago, most dimensional tolerances were
measured in thousandths of an inch.
Now that tolerances of "tenths" or even tens of
millionths are commonplace.

As shown in Figure 4, surface finish -- also known
as profile -- is composed of two components:
waviness and roughness.
5.4.Tracing Surface Irregularities:
Figure 4

Conical
diamond
stylus
• Traces are typically done 90° to “lay,” with a
conical diamond stylus.
• To separate surface wavelengths, a filter is applied
to the profile data.
Figure 5

Waviness, is the more widely spaced
component of surface texture. Roughness may
be considered superposed on a “wavy” surface
or longer-wavelength variation, is caused by
macro-type influences, like worn spindle
bearings, or vibration from other equipment on the
shop floor.shop floor.
Roughness – the short-wavelength pattern of tool
marks from grinding, milling or other machining
processes --is influenced by the condition and
quality of the tooling.

Both can be influenced by the operator's choice
of feed rate and depth of cut.

Few of the most popular methods of surface
roughness plot interpretation are:
� Distance between peak to centerline.
There can be many ways, through which the surface
roughness plot can be interpreted.
5.5. Different Parameters for Surface Roughness
Interpretation:
� Distance between peak to centerline.
�Average distance between peaks and valleys for
sample length.
� Sum of average of first 5 peaks and valleys.
�Maximum peak to valley height.
�Maximum peak height.
� RMS of peak and valley average.

Because of this reason only, there are varieties of
methods prevailing in the engineering world for
indicating surface roughness values in the drawing.
As per the data, worldwide more than 128 different
formulae with which to calculate surface finish
parameters from the same measurement data.

The most common and popular method amongst all is
interpreting thro average roughness indication. This is
known as Ra – in which, R stands for “Roughness”
and “a” stands for ‟average‟. The other methods are
Rz, Rt, Rmax etc. Below is the list of popular
parameters:

Parameter Name
Ra Roughness Average (Ra)
Rq Root Mean Square (RMS) Roughness
Rt Maximum Height of the Profile
Rv, Rm Maximum Profile Valley Depth
Rp Maximum Profile Peak Height
Rpm Average Maximum Profile Peak Height
Rz Average Maximum Height of the Profile
Rmax Maximum Roughness Depth
Rc Mean Height of Profile Irregularities
Rz(iso) Roughness Height
Ry Maximum Height of the Profile

Ra – Average Roughness
The average roughness is the area between the
roughness profile and its mean line, or the integral of
the absolute value of the roughness profile height
over the evaluation length.
Average Roughness; Ra
(Mean line)
Figure 6

where, ι is the sampling length and y is the ordinate
of the profile.
Graphically, the average roughness is the area
(1)
Graphically, the average roughness is the area
between the roughness profile and its center line
divided by the evaluation length (normally five
sample lengths with each sample length equal to one
cutoff).

You might have seen the symbols like – Ra 0.8 or
Ra 25 or N9 on various features of component.
Many of these (about half-dozen parameters) are
very application-specific and are used to describe
the measurements. In almost all cases,
measurements are presented in microinch or micron measurements are presented in microinch or micron
units.
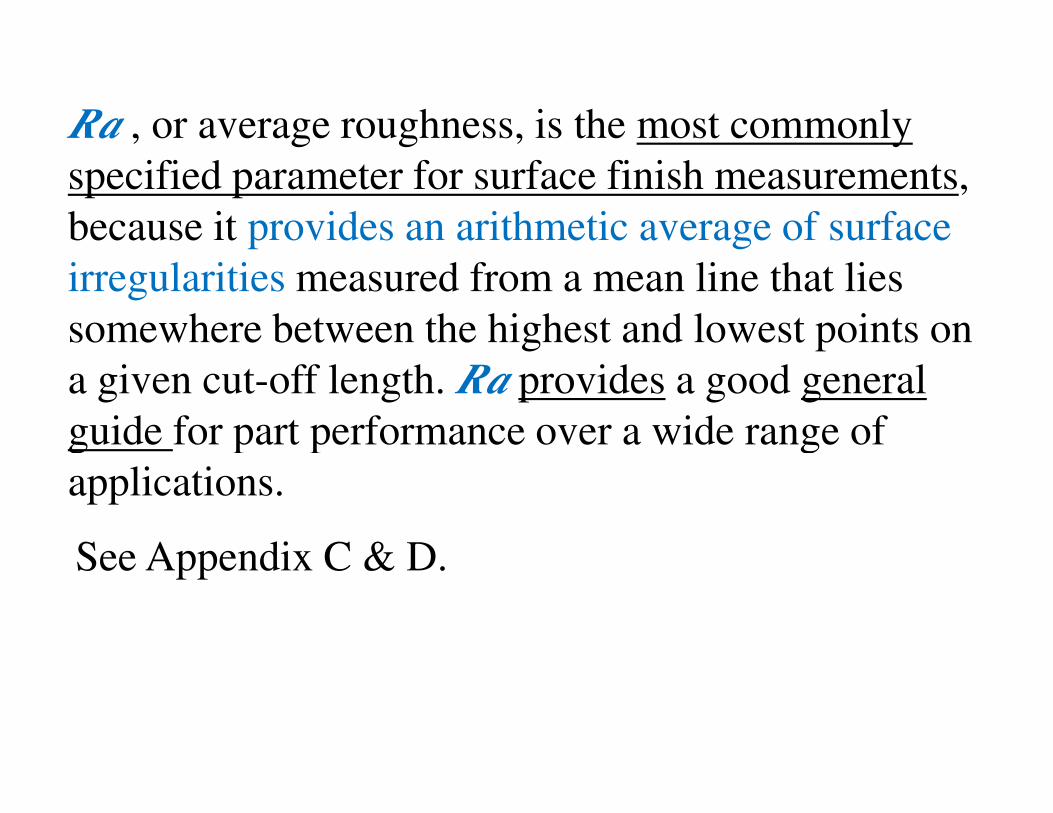
Ra , or average roughness, is the most commonly
specified parameter for surface finish measurements,
because it provides an arithmetic average of surface
irregularities measured from a mean line that lies
somewhere between the highest and lowest points on
a given cut-off length. Ra provides a good general
guide for part performance over a wide range of guide for part performance over a wide range of
applications.
See Appendix C & D.

Figure 7

When performing an Ra measurement, it is essential
to choose a cutoff length appropriate to the process.
The cutoff length should be short enough so that the
measurement will not be influenced by waviness. On
the other hand, it must not be so short that only a
portion of a tool mark is measured, as shown in
Figure 8. Figure 8.
Figure 8

Although Ra is universally accepted as a means of
expressing surface parameters can often be
misleading. It is possible that two surfaces having
A cutoff long enough to include five complete sets
of tool marks is desirable to obtain a good average
roughness measurement.
misleading. It is possible that two surfaces having
widely different profiles could have the same, but
perform quite differently.

Ra is not the end of the story
Ra does not tell the whole story about a surface. For
example, here three surfaces that all have the same
Ra, but you need no more than your eyes to know
that they are quite different surfaces. In some
applications they will perform very; differently as
well. well.
Figure 9: Surfaces with same Ra, but a lot of
difference.

Hence, Ra has numerous limitations when
applications are highly specific, or when small details
of surface finish can make a big difference in part
performance.
The value of Ra is normally measured in the
microinches or in microns in the metric system.microinches or in microns in the metric system.

If we want to distinguish between surfaces that differ
in shape or spacing, we need to calculate other
parameters for a surface that measure peaks and
valleys and profile shape and spacing.
The more complicated the shape of the surface, we
want and the more critical the function of the want and the more critical the function of the
surface, the more sophisticated we need to be in
measuring parameters beyond Ra.

The roughness parameter, Rq, represent the root
mean square (RMS) of the peak heights and is more
sensitive to the occurrence of occasional high and
low points. The RMS is the geometric average
height of roughness irregularities over the sampling
length. RMS is expressed in microns or microinches.

Figure 10

Parameter Rv – Maximum depth
Rv is the maximum distance between valley and
mean line in the limits of a sampling length L.
Parameter Rp – Maximum height
Rp is the maximum distance between peak and
mean line in the limits of a sampling length L.
mean line in the limits of a sampling length L.
Parameter Rt – Total height
Rt is the maximum distance between valley and
peak in the limits of a sampling length L.

The maximum peak-to-valley height on a surface;
Rt is usually four or five times greater than the
average surface finish, as measured by the Ra
method. A part with an Ra value of 16µµµµ",
therefore, probably has a peak-to-valley height ;
Rt of 64 µµµµ " or greater.

Also useful is Rz -- the "ten-point height" parameter
-- which calculates the average of ten maximum
peak-to-valley differences within the sampling
range.
Parameter Rz
The Rz value is known as the ISO 10-point height The Rz value is known as the ISO 10-point height
parameter. It is measures over a single sampling
length and is itself an average of positive and
negative peak values. It is useful parameter when
only a short length of the surface is available for
assessment.

Figure 11 shows how Rz values are determined
graphically. The five highest peaks and the five
deepest valleys are conveniently measured from an
arbitrary datum line A … B drawn parallel to the
centre line AB for a chosen length L, so that:
Rz = [(P1+P2+……+P5)/5-(V1+V2+….+V5)/5] (2)
Figure 11

In Europe, the more common parameter for
roughness is Mean Roughness depth (Rz).
Rz is calculated by measuring the vertical distance
from the highest peak to the lowest valley within
five sampling lengths, then averaging these
distances. Rz averages only the five highest peaks
and the five deepest valleys — therefore extremesand the five deepest valleys — therefore extremes
have a much greater influence on the final value.
Over the years the method of calculating Rz has
changed, but the symbol Rz has not. As a result,
there are three different Rz calculations still in use,
and it is very important to know which calculation
is being defined before making the measurement

Different machining processes naturally generate
different tool patterns. The roughness produced by
grinding, for example, is generally of a shorter
wavelength than that left by turning.
Milling leaves even longer wavelength patterns,
though not as long as those produced by single point
boring. (Note that the wavelength we're referring toboring. (Note that the wavelength we're referring to
here is the spacing of the individual tool marks, not
the waviness component of surface profile.)

Example 5-1: if a surface has heights and depths as
illustrated below, evaluate Ra, Rp, Rv, Rt , Rz , Rq
values (in units of height):
Solution:
Ra = Average (1,4,6,8,5,2,1,4,1,2,1,4,7,4,1,2,5,8,5,2,1,4,1,1)
(in units of height) = 3.333 (in units of height)
n = 24
Figure 12

Rp (maximum distance between peak and mean line )
= 8.0 (in units of height).
Rv (maximum distance between valley and mean
line) = 7.0 (in units of height).
Rt (maximum distance between valley and peak) = Rt (maximum distance between valley and peak) =
15.0 (in units of height).
As illustrated in Slide 33; Rt is [15.0/3.333 = 4.5]
four or five times greater than the average
surface finish, as measured by the Ra

P1
P2 P3
P4
P5
V1 V2 V3 V4 V5
Evaluation of Rz
P1
p1
v1
V1
A
Figure 13

Rz = [(P1+P2+……+P5)/5-(V1+V2+….+V5)/5]
where, P1……P5 are the five highest peaks, and ,
V1……V5 are the five deepest valleys measured
= [(P1-V1)+(P2-V2)+(P3-V3)+(P4-V4)+(P5-V5)]/5
(2′′′′)
But, from figure 13,
from an arbitrary datum line.
Pi =pi+A, Vi=A-vi, i = 1-5.
Hence, Pi-Vi=pi+vi (#-1)

Hence, from Eqs. (2′′′′) and (#-1),
Rz = [(p1+v1)+(p2+v2)+(p3+v3)+(p4+v4)+(p5+v5)]/5
Rz = [(p1+p2+p3+p4+p5)+(v1+v2+v3+v4+v5)]/5
i.e.,
(2′′′′′′′′)(2′′′′′′′′)
Rz = [(8+8+6+5+5)+(7+4+4+4+4)]/5 = 11
Hence,
(in units of height)

Rq =
√(12+42+62+82+52+22+12+42+12+22+12+42+72+42+12+22+52
+82+52+22+12+42+12+12)/24 = 4.041 (in units of height)

5.6. Surface Roughness Value Conversions:

5.7. Surface Roughness symbol in drawing:
Surface roughness symbol is given to convey
manufacturing process related information only.
Unless written specifically on the symbol, they do
not carry the surface texture type (i.e. plated / milled
/ cold drawn). These symbols are given irrespective/ cold drawn). These symbols are given irrespective
of material and its surface condition.

Though the surface roughness symbol is capable of
conveying lot much information (as mentioned later
in this article), presently it is mentioned to convey
only manufacturing process related information. Also,
note that the raw material type is not controlled
through the surface roughness symbol given in the
drawing. Presently, either of following information isdrawing. Presently, either of following information is
conveyed through symbols:
�We do not need to remove material.
�We need machining operation.
�We need to manufacture by any process.

It is required to give surface finish to each feature
– irrespective of its importance and manufacturing
process. And, as in tolerance, designer should
select the most “Rough” surface permissible for the
performance. However, unlike to tolerances where we
have a concept of “Open Tolerance”, we have to
specify each surface roughness in the drawing. specify each surface roughness in the drawing.
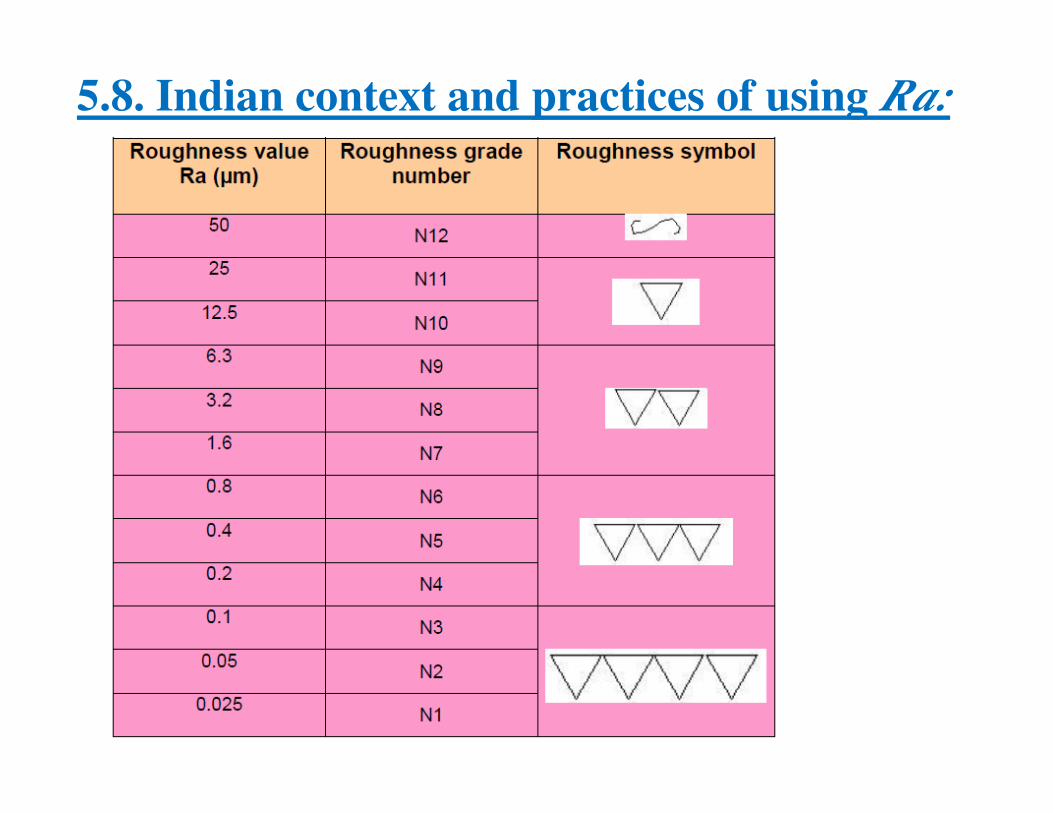
5.8. Indian context and practices of using Ra:

Surface texture obtained by any
manufacturing process (e.g., turning,
grinding, plating, bending)
Surface texture obtained by material
removal by machining Operation (e.g.,
turning, drilling, Milling, slotting) turning, drilling, Milling, slotting)
Surface texture obtained by WITHOUT
removal of material (e.g., casting
surfaces, welding faces, Procurement
size surface)

Excepting the symbol of “Without removal of
material”, both the other symbols are defined with
value of Ra required for a particular manufacturing
process.

a = Roughness value Ra in
micrometer or grade number.
b = Production method, treatment
or coating.
Meaning of complete surface finish symbol is as below:
c = Sampling length.
d = Direction of lay.
e = Machining allowance.
f = Other roughness value than Ra.

5.9. MEASURING INSTRUMENTS
A variety of instruments are available for
measuring surface roughness. The majority of
these devices employ a diamond stylus, which is
moved at a constant rate across the surface,
perpendicular to the lay pattern. The rise and fall of
the stylus is detected electronically, amplified andthe stylus is detected electronically, amplified and
recorded on a strip chart, or processed
electronically to produce readings for a meter (see
figure 14).

Figure 14 Electronic equipment for measuring surface
roughness

Problem 5–1: if a surface has heights and depths as
illustrated below, evaluate Ra, Rp, Rv, Rt , Rz , Rq values
(in units of height).
Sheet # 5
6
8
7
8
11
22
4
11
1
4
1
4
6
5
2
2
4
55
1
4
1

Problem 5–2: if a surface has heights and depths as
illustrated below, evaluate Ra, Rp, Rv, Rt , Rz , Rq values
(in units of height).
44
2
11
2
11
1
2
3
1
2
3
2 2
11
1111
1
2
11
1 1
2
1