fall 2002biostat 511275 nonparametric tests nonparametric tests are useful when normality or the clt...
TRANSCRIPT

Fall 2002 Biostat 511 1
Nonparametric Tests
• Nonparametric tests are useful when normality or the CLT can not be used.
• Nonparametric tests base inference on the sign or rank of the data as opposed to the actual data values.
• When normality can be assumed, nonparametric tests are less efficient than the corresponding t-tests.
• Sign test (binomial test on +/-)• Wilcoxon signed rank (paired t-test on ranks)• Wilcoxon rank sum (unpaired t-test on ranks)

Fall 2002 Biostat 511 2
Nonparametric Tests
In the tests we have discussed so far (for continuous data) we have assumed that either the measurements were normally distributed or the sample size was large so that we could apply the central limit theorem. What can be done when neither of these apply?
• Transform the data so that normality is achieved.
• Use another probability model for the measurements e.g. exponential, Weibull, gamma, etc.
• Use a nonparametric procedure
Nonparametric methods generally make fewer assumptions about the probability model and are, therefore, applicable in a broader range of problems.
BUT! No such thing as a free lunch...
Fall 2002 Biostat 511 3
Nonparametric Tests
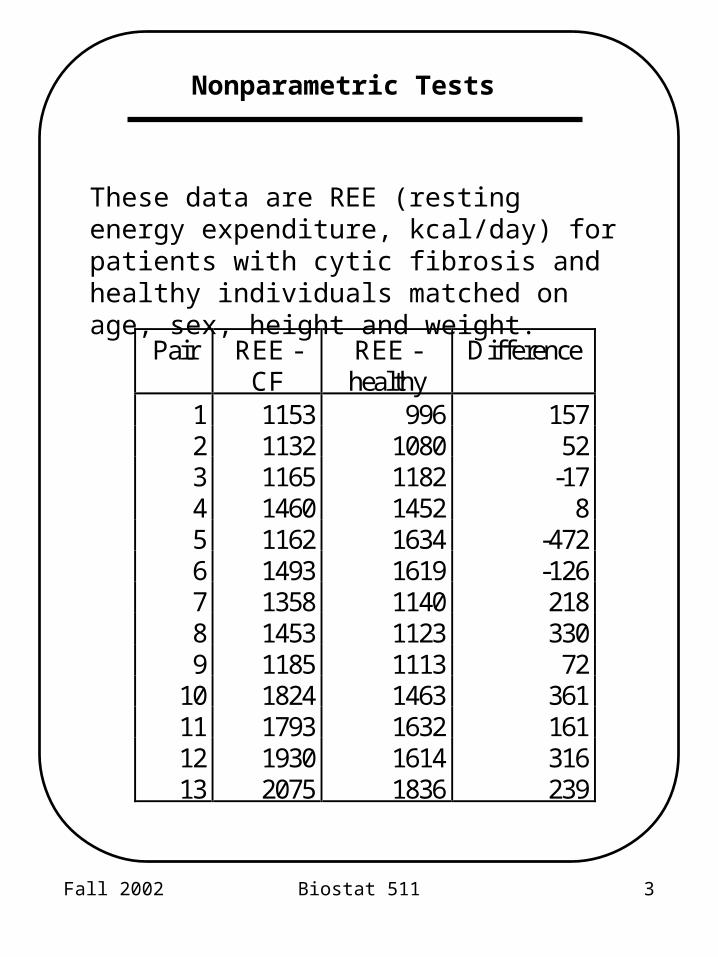
These data are REE (resting energy expenditure, kcal/day) for patients with cytic fibrosis and healthy individuals matched on age, sex, height and weight.
Pair REE -CF
REE -healthy
Difference
1 1153 996 1572 1132 1080 523 1165 1182 -174 1460 1452 85 1162 1634 -4726 1493 1619 -1267 1358 1140 2188 1453 1123 3309 1185 1113 72
10 1824 1463 36111 1793 1632 16112 1930 1614 31613 2075 1836 239

Fall 2002 Biostat 511 4
Nonparametric Tests
with #5 w/o #5mean 99.9 147.6
std.dev 225.7 152.9n 13 12t 1.59 3.34
What’s your conclusion?

Fall 2002 Biostat 511 5
Nonparametric Tests
Pair REE -CF
REE -healthy
Difference Sign
1 1153 996 157 +2 1132 1080 52 +3 1165 1182 -17 -4 1460 1452 8 +5 1162 1634 -472 -6 1493 1619 -126 -7 1358 1140 218 +8 1453 1123 330 +9 1185 1113 72 +
10 1824 1463 361 +11 1793 1632 161 +12 1930 1614 316 +13 2075 1836 239 +
Let’s simplify by just looking at the direction of the difference ...

Fall 2002 Biostat 511 6
Nonparametric Tests
We want to test:
H
Ho d
a d
:
:
0
0
Can we construct a test based only on the sign of the difference (no normality assumption)?
If d = 0 then we might expect half the differences to be positive and half the differences to be negative. In this example we find 10 positive differences out of 13. What’s the probability of that (or more extreme)?
P X P X P X[ ] [ ] [ ]
. . . .
.
10 10 1313
100 5 0 5
13
130 5 0 5
0 046
10 3 13 0

Fall 2002 Biostat 511 7
Sign Test
Looks like a hypothesis test (p-value method). What we really tested was that the median difference was zero. The probability model used to calculate the p-value was the binomial model with p = P[positive difference] = 0.5. Note that there is no normality assumption involved.
So the hypothesis that the Sign Test addresses is:
Ho : median difference = 0
Ha : median difference > (<, ) 0
Q: If it is more generally applicable then why not always use it?
A: It is less efficient than the t-test when the population is normal. Using a sign test is like using only 2/3 of the data (when the “true” probability distribution is normal)

Fall 2002 Biostat 511 8
Sign Test
Sign Test Overview:
1.Testing for a single sample (or differences from paired data).
2.Assign + to all data points where Xi > o for Ho: =o.
3.Hypothesis is in terms of , the median.
4.Let T= total number of +’s out of n observations.
5.Under H0, T is binomial with n and p=1/2.
6.Get the p-value from binomial distribution or approximating normal, T/n ~ N(n/2,n/4)
7.This is a valid test of the median without assuming a probability model for the original measurements.

Fall 2002 Biostat 511 9
Sign Test
“I tend to use the sign test as a quick test or a screening device. If the data are clearly statistically significant and the sign test will prove this, it is a marvelous device for hurriedly getting the client out of the office. He or she will be happy because the data have received an official stamp of statistical significance, and you will be happy because you can get back to your own research. It is also useful for rapidly scanning data to acquire a feeling as to whether the data might be statistically significant. If the sign statistic… is near to being significant, then a more refined analysis may be worthwhile. If, on the other hand, (the sign statistic) is nowhere close to being significant, it is very unlikely that a significant result can be produced by more elaborate means.”
Ruppert Miller,Beyond ANOVA, Basics of Applied Statistics

Fall 2002 Biostat 511 10
Nonparametric Tests
Q: Can we use some sense of the magnitude of the observations, without using the observations themselves?
A: Yes! We can consider the rank of the observations
Pair REE -CF
REE -healthy
Difference Sign rankof |di|
1 1153 996 157 + 62 1132 1080 52 + 33 1165 1182 -17 - 24 1460 1452 8 + 15 1162 1634 -472 - 136 1493 1619 -126 - 57 1358 1140 218 + 88 1453 1123 330 + 119 1185 1113 72 + 410 1824 1463 361 + 1211 1793 1632 161 + 712 1930 1614 316 + 1013 2075 1836 239 + 9

Fall 2002 Biostat 511 11
Nonparametric Tests
A nonparametric test that uses the ranked data is the Wilcoxon Signed-Rank Test.
1.Rank the absolute value of the differences (from the null median).
2.Let R+ equal the sum of ranks of the positive differences.
3.Then
4.Let
5. Use normal approximation to the distribution of T (i.e. compute p-value based on (T)).
E Rn n
V R n n n
( )( )
( ) ( )( ) /
1
41 2 1 24
TR n n
n n n
( ) /
( )( ) /
1 4
1 2 1 24

Fall 2002 Biostat 511 12
Wilcoxon Signed Rank Test
Note:
• If any di = 0 we drop them from the analysis (but assuming continuous data, so shouldn’t be many).
• For “large” samples (number of non-zero di > 15), can use a normal approximation.
• If there are many “ties” then a correction to V(R+) must be made (see Rosner pg 560); computer does this automatically.
• Efficiency relative to t-test is about 95% if the true distribution is normal.
Fall 2002 Biostat 511 13
Wilcoxon Signed Rank Test
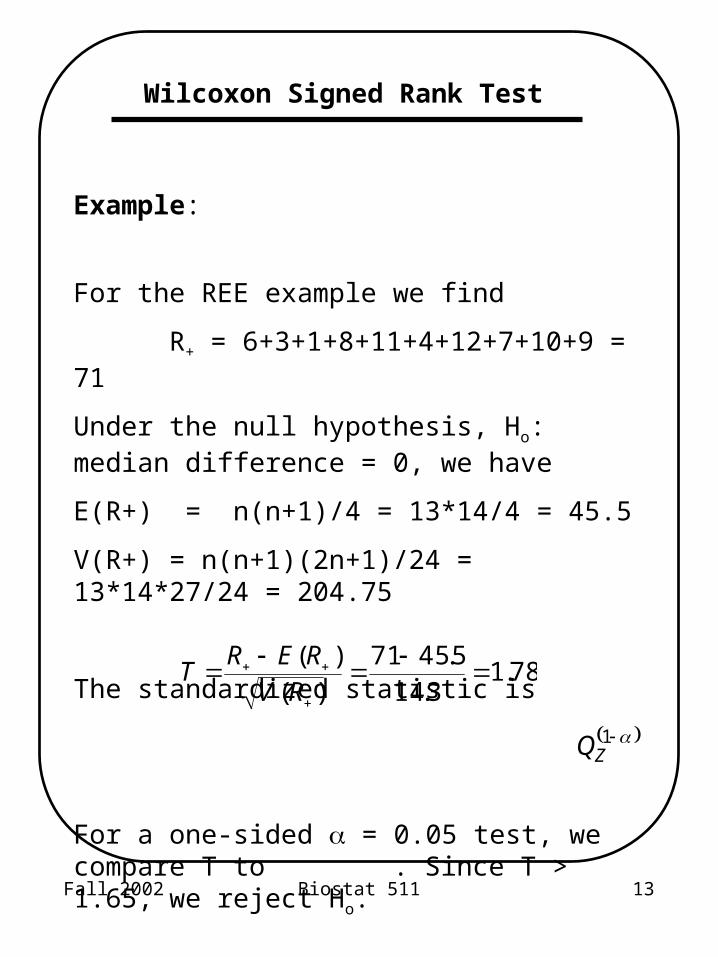
Example:
For the REE example we find
R+ = 6+3+1+8+11+4+12+7+10+9 = 71
Under the null hypothesis, Ho: median difference = 0, we have
E(R+) = n(n+1)/4 = 13*14/4 = 45.5
V(R+) = n(n+1)(2n+1)/24 = 13*14*27/24 = 204.75
The standardized statistic is
For a one-sided = 0.05 test, we compare T to . Since T > 1.65, we reject Ho.
78.13.14
5.4571
)(
)(
RV
RERT
1ZQ

Fall 2002 Biostat 511 14
Nonparametric Tests2 samples
The same issues that motivated nonparametric procedures for the 1-sample case arise in the 2-sample case, namely, non-normality in small samples, and the influence of a few observations. Consider the following data, taken from Miller (1991):
These data are immune function measurements obtained on healthy volunteers. One group consisted of 16 Epstein-Barr virus (EBV) seropositive donors. The other group consisted of 10 EBV seronegative donors. The measurements represent lymphocyte blastogenesis with p3HR-1 virus as the antigen (Nikoskelain et al (1978) J. Immunology, 121:1239-1244).

Fall 2002 Biostat 511 15
Nonparametric Tests2 samples
# Seropositive Seronegative1 2.9 4.52 12.1 1.33 2.6 1.04 2.5 1.05 2.8 1.36 15.8 1.97 3.2 1.38 1.8 2.19 7.8 2.110 2.9 1.011 3.212 8.013 1.514 6.315 1.216 3.5

Fall 2002 Biostat 511 16
Nonparametric Tests2 samples
Can we transform to normality?

Fall 2002 Biostat 511 17
Nonparametric Tests2 samples
Does the 2-sample t statistic depend heavily on the transformation selected?
Does our interpretation depend on the transformation selected?
RAW SQRT LOGY
s
1
12
4.8817.11
2.060.68
1.310.54
Y
s
2
22
1.751.13
1.280.12
0.440.23
F-ratiop-value
sp2
15.21<0.00111.12
5.710.0080.47
2.380.17.42
pooled-tdf
p-value
2.3324
0.029
2.8224
0.009
3.3324
0.003Welsh’s t
dfp-value
2.8817
0.01
3.3421
0.003
3.6823
0.001

Fall 2002 Biostat 511 18
Nonparametric TestsWilcoxon Rank-Sum Test
Idea: If the distribution for group 1 is the same as the distribution for group 2 then pooling the data should result in the two samples “mixing” evenly. That is, we wouldn’t expect one group to have many large values or many small values in the pooled sample.
Procedure:
1. Pool the two samples
2. Order and rank the pooled sample.
3. Sum the ranks for each sample.
R1 = rank sum for group 1
R2 = rank sum for group 2
4. The average rank is (n1+n2+1)/2.
5. Under Ho: same distribution, we expect R1 to be
E(R1)
nn n
11 2 1
2
Fall 2002 Biostat 511 19
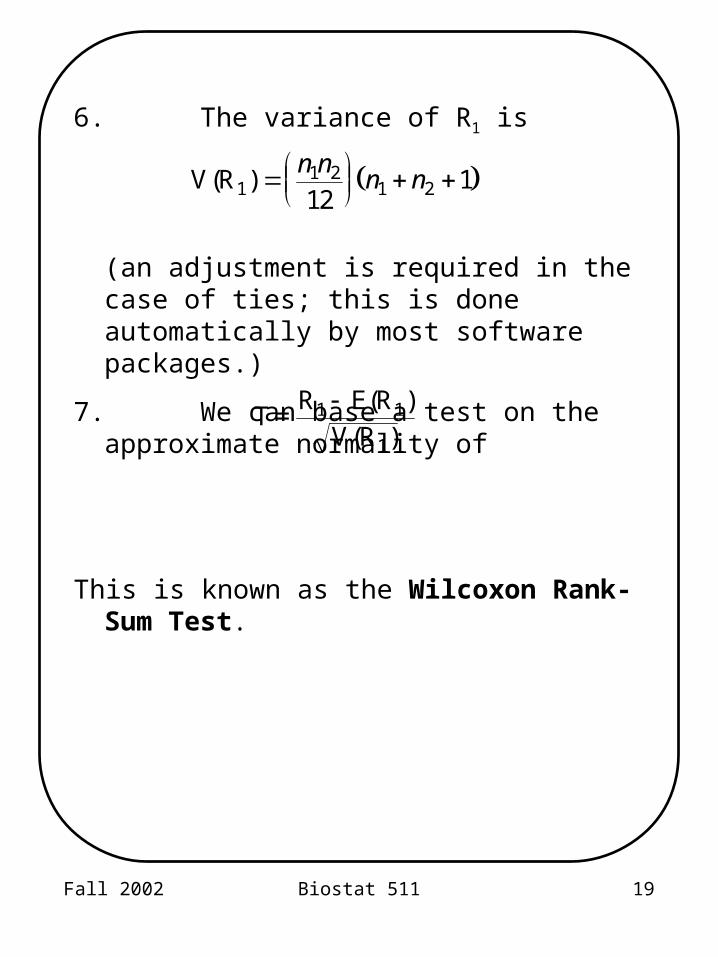
6. The variance of R1 is
(an adjustment is required in the case of ties; this is done automatically by most software packages.)
7. We can base a test on the approximate normality of
This is known as the Wilcoxon Rank-Sum Test.
V(R1)
n nn n1 2
1 2121
T =R E(R )
V(R1 1
1
)

Fall 2002 Biostat 511 20
Wilcoxon Rank-Sum Test
Order and rank the pooled sample ...
# Sero + Rank S+ Sero - Rank S-1 2.9 16.5 4.5 21.02 12.1 25.0 1.3 6.03 2.6 14.0 1.0 2.04 2.5 13.0 1.0 2.05 2.8 15.0 1.3 6.06 15.8 26.0 1.9 10.07 3.2 18.5 1.3 6.08 1.8 9.0 2.1 11.59 7.8 23.0 2.1 11.510 2.9 16.5 1.0 2.011 3.2 18.512 8.0 24.013 1.5 8.014 6.3 22.015 1.2 4.016 3.5 20.0
273 78

Fall 2002 Biostat 511 21
Wilcoxon Rank-Sum Test
Find the sum of the ranks for either group …
R1 = 273 n1 = 16
Under the null hypothesis, Ho: median1 = median2, we have:
E(R )1
nn n
11 2 1
2
1627
2216
V(R1)
( ).
n nn n correction1 2
1 2121
16 10
1216 10 1
66
26 26 1358 65
Here the “correction” is for tied values. The correction is given as
t t n n n ni ii
g( ) / (( )( ))2
1 2 1 21
1 1

Fall 2002 Biostat 511 22
The standardized statistic is
Therefore, since 2*P(Z>3.01) < 0.01, we reject H0 at = 0.05 or = 0.01
How does this compare to the t-tests?
T =R E(R
V(R1 1
1
)
) ..
273 216
18 943 01
Fall 2002 Biostat 511 23
Wilcoxon Rank-Sum Test
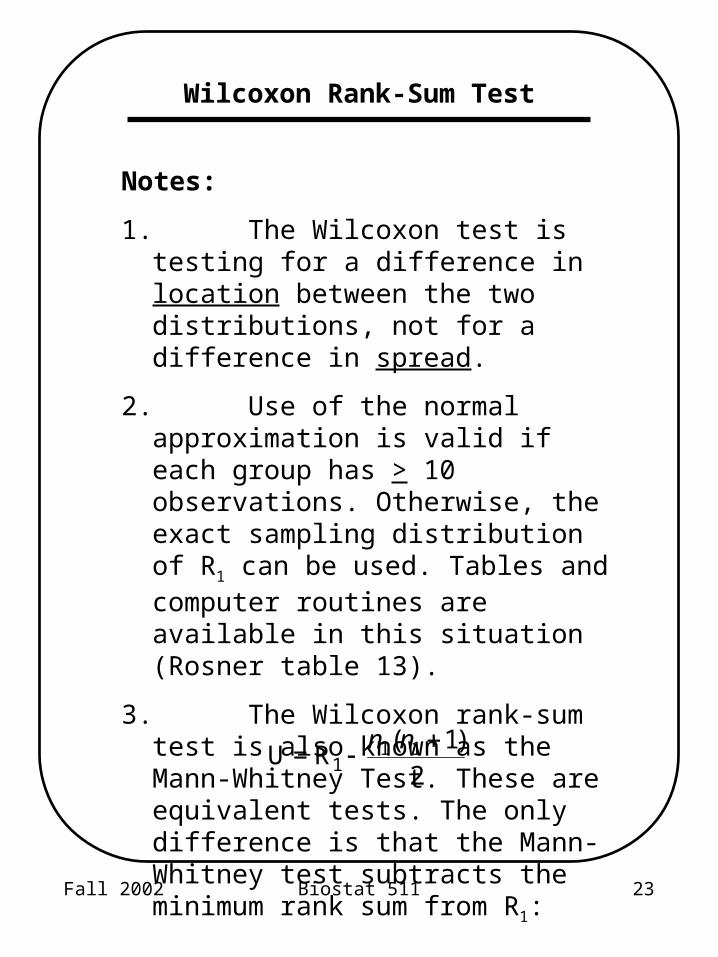
Notes:
1. The Wilcoxon test is testing for a difference in location between the two distributions, not for a difference in spread.
2. Use of the normal approximation is valid if each group has > 10 observations. Otherwise, the exact sampling distribution of R1 can be used. Tables and computer routines are available in this situation (Rosner table 13).
3. The Wilcoxon rank-sum test is also known as the Mann-Whitney Test. These are equivalent tests. The only difference is that the Mann-Whitney test subtracts the minimum rank sum from R1:
U = R1 n n1 1 1
2
( )

Fall 2002 Biostat 511 24
Nonparametric Tests
Summary
• Nonparametric tests are useful when normality or the CLT can not be used.
• Nonparametric tests base inference on the sign or rank of the data as opposed to the actual data values.
• When normality can be assumed, nonparametric tests are less efficient than the corresponding t-tests.