fall 2008 september 9 class #3 - university of wisconsin–madison
TRANSCRIPT

Fall 2008 – September 9
Class #3
Review Stellar Classification
◦ Photometry/classification
Stellar Evolution Interpreting H-R diagrams Reading: “Old Main Sequence Turnoff
Photometry in the Small Magellanic Clouds”◦ What is the data they use?◦ Compare Figures 3 and 7 to some of the CMDs in
the lecture notes – what are the similarities and differences?

Big Bang Cosmology and Reionizations
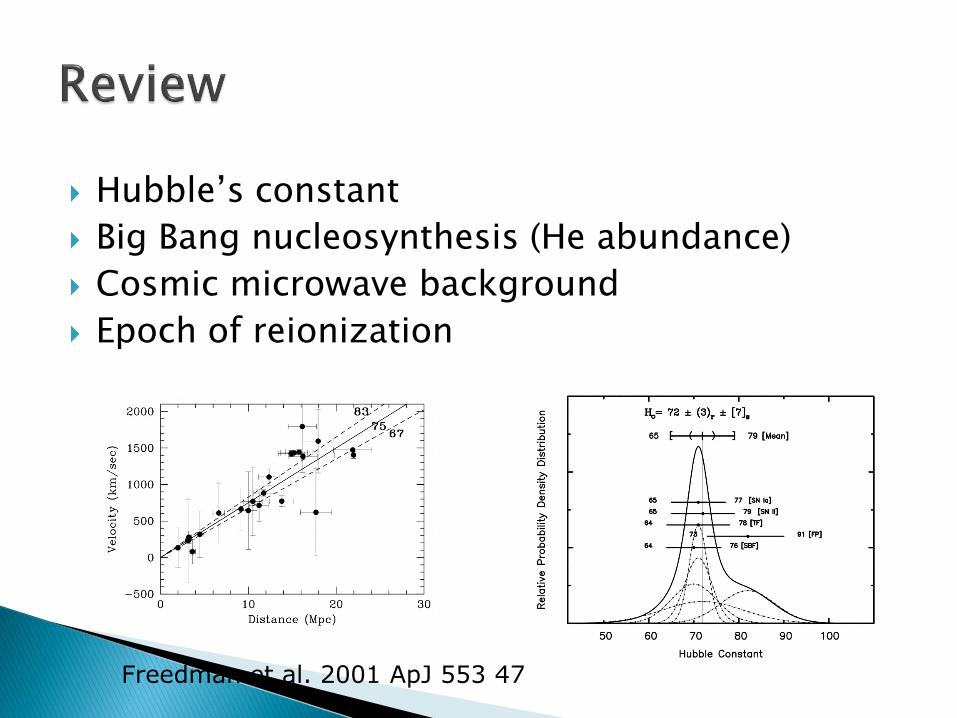
Hubble’s constant
Big Bang nucleosynthesis (He abundance)
Cosmic microwave background
Epoch of reionization
Freedman et al. 2001 ApJ 553 47

Stars as point masses◦ Dynamical models, simulations◦ Distinctions between stars irrelevant◦ But, which stars most accurately trace the “true”
morphology and dynamics of a galaxy?
Chemical evolution◦ Stars are responsible for producing and distributing the
elements
Metric of evolution◦ SFR, SFH, H-R diagram are all diagnostics of evolution
Feedback◦ evolution/organization of ISM in galaxies driven by gravity,
hydrodynamics, and input of energy from stars
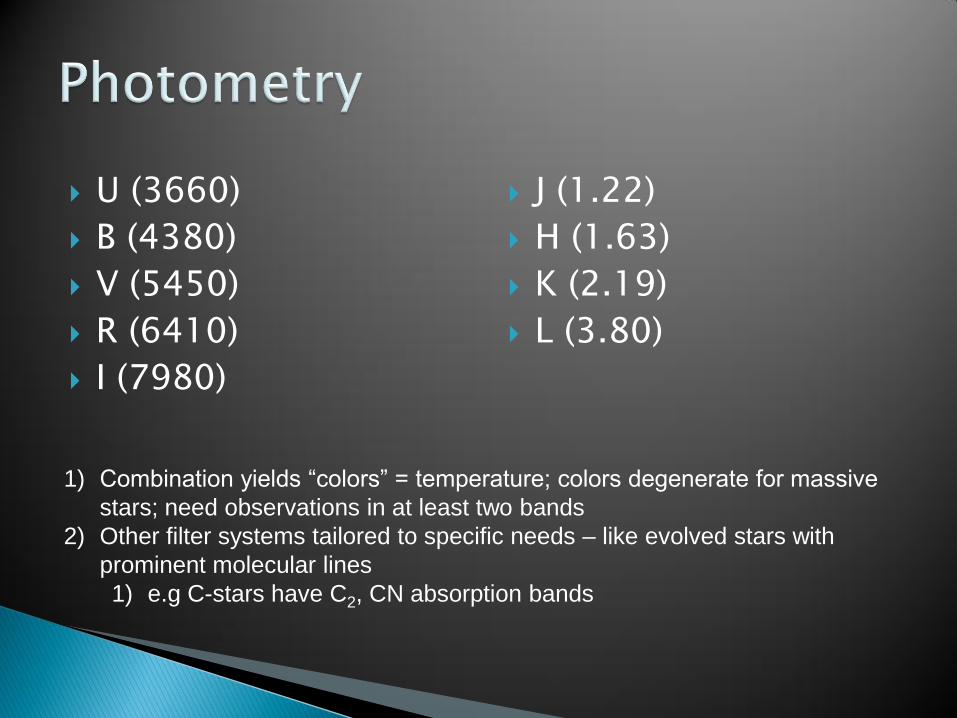
U (3660)
B (4380)
V (5450)
R (6410)
I (7980)
J (1.22)
H (1.63)
K (2.19)
L (3.80)
1) Combination yields “colors” = temperature; colors degenerate for massive
stars; need observations in at least two bands
2) Other filter systems tailored to specific needs – like evolved stars with
prominent molecular lines
1) e.g C-stars have C2, CN absorption bands

Based on optical colors – treat stars as a blackbody so any two points constrain temperature (photometry)◦ Yields the OBAFGKM classification◦ Further sub-classification is the luminosity class
Spectroscopy – individual line ratios very tightly constrain temperature, surface gravity, etc.
Narrow band photometry to isolated specific features (e.g. 20nm wide filter to isolate 810.4nm TiO & CN absorption)

Ia – most extreme supergiants
Ia – moderate supergiants
Ib – less luminous supergiants
II – bright giants
III – normal giants
IV – subgiants
V - dwarfs

Spectral typeAbsorption
linesTeff Mv (V, I) (B-V)
O He II, C III 40-50,000K -6,-8 <-0.33
B He I, S III, H 12-30,000K -1.5, -7 -0.2
A H, Mg II 7-9,000 K 1.0, -70
F Ca II 6-7,000K 3.0,-7 0.4
G Ca II, CH 5.5-6,000 K 5.0,-7 0.6
K CH, CN 4-5,500 K 6.0,-7 1.2
M TiO 2.5-4000 K 9.0,-7 1.6


Spectral types based on temperature, temperature based on mass◦ LMS/Lo ~ (M/Mo)
2.14 (M > 20)
◦ LMS/Lo ~ (M/Mo)3.5 (2 < M < 20)
◦ LMS/Lo ~ (M/Mo)4.8 (M < 2)
So: τ = 10 (M/Mo)(L/Lo)-1 Gyr

History: BBNS cannot account for the abundances of all the elements; Burbridge, Burbridge, Fowler, & Hoyle laid out the model for stellar nucleosynthesis
Main sequence: H to He (proton-proton chain)
Post-MS: complete conversion of H in core, interior pressure decreases, collapse of core – H shell burning, envelope expands and star becomes a red giant
Note: because H burning lifetime depends on mass there is a nice correlation between turn-off mass and age

RGB to Horizontal Branch (HB)◦ Core contraction/core mass increases◦ T~108 K, ρ ~ 104 g cm-3 get He burning 2α → 8Be, 8Be + α → 12C
In stars w/ M > 2, its not degenerate and we get core expansion
Essentially a He-burning main sequence
In more massive stars get 12C + α → 16O; for stars with M up to 8 M we’re left with a degenerate CO core (white dwarf)
◦ He-burning lifetime ~108 years
Evolution to Asymptotic Giant Branch (M > 8 Mo)
Further Burning Stages

Evolution to AGB◦ He-burning, growing CO core
Low mass stars can’t lift degeneracy, end up as planetary nebula + white dwarf
◦ Eventually get He shell burning that drives expansion of envelope and luminosity increases (plus unburned H, H shell burning)
Occurs with a series of “dredge-ups” that produce chemically bizarre stars (convection)
Site of “s-process” nucleosynthesis

Further Burning Stages◦ 12C + 12C → 20Ne + α
◦ 16O + 16O → 28Si + α
◦ 20Ne + 4He → 24Mg + γ
◦ Leads ultimately to the production of 56Fe, core collapse, and supernova explosion (SNe)
◦ Can also get n production via, e.g., 12C + 12C → 23Na + n
Neutron capture processes◦ S-process (“slow”) – yields elements like Ba and Tc
largely in AGB stars (all those free n from previous burning processes)
◦ R-process (“rapid”) – yields very heavy elements like Ur, usually in SNe

Color – temperature – mass – lifetime relationships mean the observed “color-magnitude” diagram can tell us something about the age/evolutionary status of a stellar population (especially if it’s a single age)
CMD can also hint at the production of metals

M3 – globular
cluster

Tracing evolution of a stellar population
(B-V) = temperature
V = luminosity
Globular cluster 47 Tuc
(Edmonds et al. 2002)
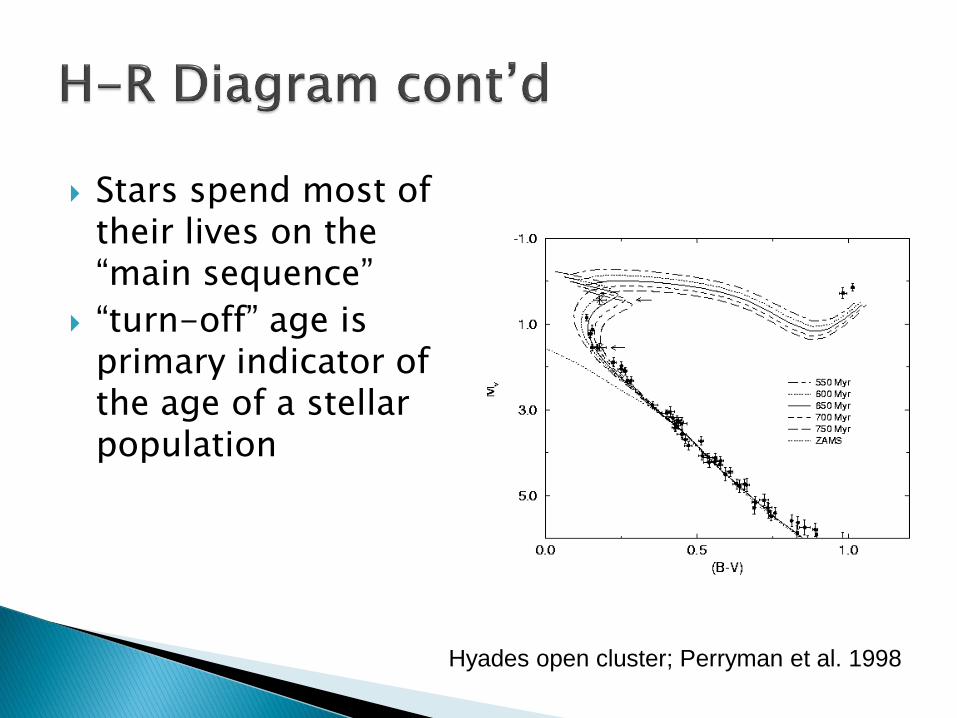
Stars spend most of their lives on the “main sequence”
“turn-off” age is primary indicator of the age of a stellar population
Hyades open cluster; Perryman et al. 1998

Gets more complicated with a mixed-age stellar population
Multiple turn-offs, multiple HBs
Dwarf spheroidal galaxies are ideal labs for this

Stellar luminosity function◦ Another observed one; we’ll get into this later
Stellar initial mass function◦ dN = Noξ(M)dM
◦ ∫dM M ξ(M) = total mass of burst/episode
◦ Observationally: ξ(M) goes as M-2.35
Slight variation with mass, according to some
“Salpeter IMF”

Integrated Colors◦ Population I – “Disk Population” – open clusters, circular
orbits, confined to a disk, “blue”◦ Population II – “Halo Population” – globular clusters, large
random velocities, elliptical orbits, spherical distribution, “red”
◦ Population III – extremely metal poor, not yet detected
Correlations◦ Color vs kinematics Blue stars are disk-like
◦ Color vs metallicity Red stellar populations tend to be metal poor, strong Galactic
correlation between kinematics and metallicity
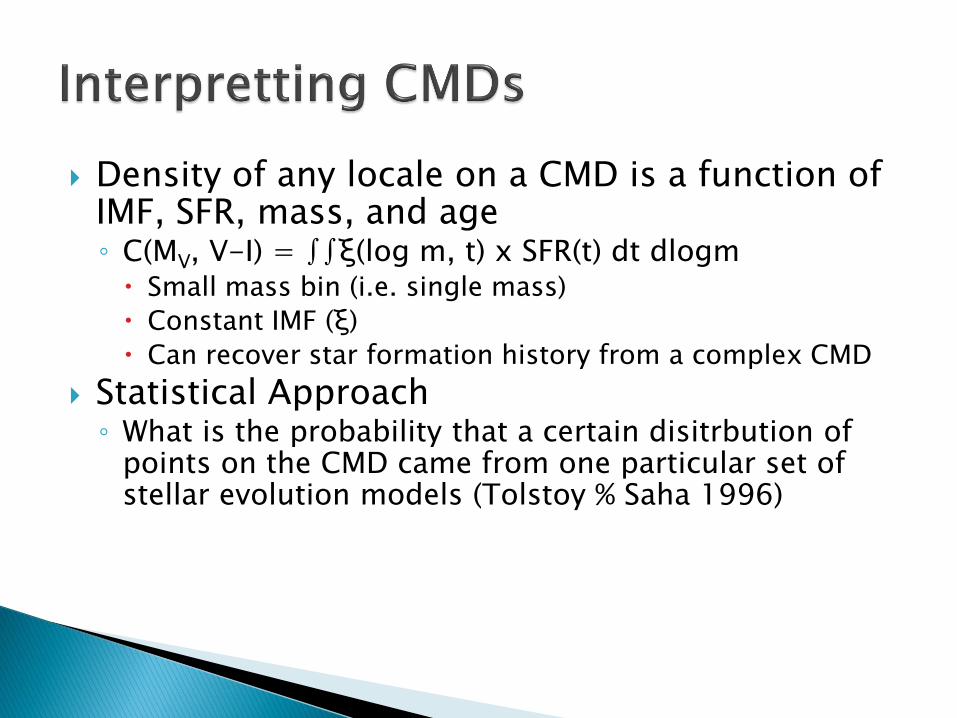
Density of any locale on a CMD is a function of IMF, SFR, mass, and age◦ C(MV, V-I) = ∫∫ξ(log m, t) x SFR(t) dt dlogm Small mass bin (i.e. single mass)
Constant IMF (ξ)
Can recover star formation history from a complex CMD
Statistical Approach◦ What is the probability that a certain disitrbution of
points on the CMD came from one particular set of stellar evolution models (Tolstoy % Saha 1996)
