families - city of toronto · web viewcouples without children grew by 8.0% in toronto and 10.5% in...
TRANSCRIPT

Backgrounder2016 Census: Families, households and marital status; LanguageDate Prepared: August 3, 2017 (Revised September 14, 2017)
The 2016 Census was held on May 10, 2016. On August 2, 2017, Statistics Canada released data from the 2016 Census of Population on families, households and marital status, and on language.
On August 31, 2017, Statistics Canada released a revision to the language data that had been released. The data correction primarily affected French language speakers, and this backgrounder has been revised to reflect the updated data.
KEY POINTS The number of families and households continues to grow in Toronto, but the City's
proportion in the Greater Toronto Area continues to decline slightly.
Common-law couples are the family type that has grown the fastest since the last Census. The percentage of couples with children continues to drop. This trend is seen across the City and the Greater Toronto Area. Over the past two decades, the number of married couples has remained stable in Toronto, while increasing significantly in the rest of the GTA.
More people are living on their own. One-person households continue to increase.
Multigenerational households (those with at least three generations of the same family) have seen significant increases in most areas of the GTHA with the exception of Toronto.
Toronto continues to be a mosaic of languages. According to the 2016 Census, 43.9% of Toronto residents had a mother tongue other than English or French.
Just over one half of all Toronto residents reported English as their mother tongue. An additional 3.4% of Toronto residents identified English and a non-official language as their multiple mother tongues.
Families, Households and Marital Status
Families In 2016 there were 718,755 census families in Toronto (up 28,415 or 4.1% from
2011) and 1,767,145 in the Greater Toronto Area (GTA) – up 101,945 (or 6.1%) over 2011. Toronto housed 40.7% of the GTA total, but the City's proportion continues to decline slightly, from 44.0% in 2006 and 41.5% in 2011.
Family structure continues to change. Since 2011, the number of common-law couples in Toronto increased by 21.6%, lone-parent families by 3.8%, whereas

married couples showed a slight increase of 1.6%. The number of lone-parent families in the rest of the GTA, which had surpassed the total in the City of Toronto in 2011, continued to grow at a faster rate of 10.9%.
Within Toronto, the largest concentrations of lone-parent families can be found in the Jane-Weston corridor in the city's northwest and in mid-Scarborough (see Map 1).
The number of couple families with children in Toronto reversed the trend of decline seen in the past decade and grew slightly, at a rate of 1.4% since 2011, reaching a total of 316,070. However, because the number of couples without children grew at a faster rate (8.0%), the percentage of couples with children continued to drop. In Toronto in 2016, 55.8% of couples had children, down from 57.4% in 2011. In the rest of the GTA, the percentage of couple families with children also followed this downward trend, falling to 64.9% from 66.0% in 2011.
Couples without children grew by 8.0% in Toronto and 10.5% in the rest of the GTA between 2011 and 2016. In the GTA outside of Toronto, most of the growth in the number of census families without children has been due to an increase in seniors 65 and older. Within Toronto, the increase in childless couples corresponds to an increase not only in seniors but also to an increase in the working age population (25-44 year olds).
Households In 2016, the number of Toronto households stood at 1,112,930 growing 6.2% since
2011.
Toronto households consist of 38.5% non-family households, 58.7 % single-family households and 2.8% multiple-family households. Since 2011, non-family households increased by 9.5%, single-family households increased by 4.4% while multiple-family households grew by 1.5%.
As a percentage of all GTHA households, the highest proportion of non-family households is in Toronto (58.7%) while the highest proportion of single-family (61.6%) and multiple-family (69.2%) households are in the rest of the GTHA. The multiple-family household type was the fastest growing type of household across the GTHA over the past five years.
In 2016, the number of one-person households in Toronto was 359,960 and the number of two-person non-family households was 68,010 which represented 58% of all one-person households and 65% of all two-person non-family households in the GTHA.
In 2016, one quarter of all one-person households in Toronto were located in the Downtown and Centres. As can be seen in Map 3, the largest concentration of one- person households is in the Downtown, but can also be found in other areas of the City. (e.g., Liberty Village, Sheppard corridor east, Etobicoke Mimico area).
The number of one-person households in Toronto grew by 28,780 (8.7%) between 2011 and 2016. Toronto's share of the increase in one-person households represented 52% of the growth in this household type across the GTHA.
The number of two-person non-family households also grew more in Toronto than in the rest of the GTHA combined between 2011 and 2016. Toronto's share of the
Census 2016: Families, households and marital status; Language Page 2 of 21

increase in two-person non-family households represented 72% of the growth in this household type across the GTHA.
Multigenerational households (those with at least three generations of the same family) have seen significant increases in most areas of the GTHA while Toronto has seen a marginal increase since 2011. In Toronto, multigenerational households represent only 3.7% of all households. Between 2011 and 2016, the share of multigenerational households in Toronto dropped from 3.9% whereas all other GTHA regions saw increases in this household type.
Marital status Toronto is home to 481,125 married couples, 85,030 common-law couples, and
152,600 lone-parent families. Over the past two decades, the number of married individuals had remained stable in Toronto, while increasing significantly in the rest of the GTA. This trend continued but at a slower pace in 2016, with couple families in Toronto increasing at 1.6%, compared to 6.6% for the rest of the GTA.
From 2011 to 2016 in Toronto, the number of legally married people age 15 and older increased by 19,485 (or 2.0%), while the number of people living in common law relationships increased by 30,095 (or 21.5%).
Toronto's number of single (and never married) people rose by 60,080 (up 8.1%). The number of divorced people also rose by a similar percentage, 8.4% (or 11,760 people). The number of separated and widowed people in Toronto dropped between 2011 and 2016, by 885 (-1.3%) for separated, and by 1,285 (-1.0%) for widowed people.
Data about same-sex couples was released only at the Census Metropolitan Area (CMA) level. In the Toronto CMA in 2016, there were 9,750 same-sex married spouses and 16,675 same-sex common-law partners. This comprises 20.0% of all same-sex married spouses in Canada and 17.2% of all same-sex common-law partners in Canada, while the Toronto CMA population as a whole comprises 16.9% of the population of Canada.
Family characteristics of children aged 0 to 14 Children under the age of 15 in Toronto live in a variety of family settings. The 2016
Census identified 396,880 children under the age of 15 in Toronto. The majority of these children (73.5%) live in families where they are the biological or adopted child of both partners in a couple family. A further 3.3% live in a family with one biological or adoptive parent and one step-parent. Nearly a quarter, 22.2%, of children in Toronto live in a lone parent family. Of those, 88.5% (78,055 children) live with a female lone parent. Additionally, 1,360 (0.3%) children live with their grandparents without a parent present ("skip generation families"), and 2,105 (0.5%) live in other "non-census family" arrangements, such as, with other relatives, or foster families.
A larger proportion of children in Toronto live in lone parent families than in other regions of the GTA. The 22.2% in Toronto is higher than the rest of the GTA municipalities, with Durham the next closest at 19.1%, followed by Peel at 16.4%, and York and Halton much lower at 12.2% and 11.8% respectively.
Census 2016: Families, households and marital status; Language Page 3 of 21

Older children (age 10 to 14) in Toronto were more likely to be living in a lone parent family (26.3%), and less likely to be living with two biological or adoptive parents (67.8%). This trend is typical and not specific to Toronto.
Family characteristics of young adults (aged 20 to 34) In Toronto, just over one third of single young adults aged 20 to 34 (34.3% or
222,655 people) were living within their parents' household. This proportion is almost unchanged from 2011, when 34.6% of single young adults lived with their parents. This rate is lower than the province of Ontario (39.5%), as well as the other GTA municipalities (52.3%), especially Peel Region (53.5%) and York Region (58.6%). With the City of Toronto, more young adults living with parents in the suburban areas of the city, with much lower rates of adults living at home in the downtown and centres (see Map 2).
Family characteristics of older adults (aged 65 and older) There were 107,215 adults age 65 and over living alone in private households in
Toronto in 2016, an increase of 12.6% over the 2011 Census. This translates into 26.7% of the population age 65 and older, which is a very slight 0.1% decrease from the 2011 of 26.8%.
Toronto continues to have the highest share of people age 65+ living alone in the GTA (26.7% in Toronto, versus 16.4% in the rest of the GTA). However, at 26.6%, Hamilton has a comparable share of people aged 65 and over living alone.
Language
Knowledge of Official Languages 4.9% of Torontonians had no knowledge of either official language, down slightly
from 5.3% in 2011. Within the city, there is a high concentration of people with no knowledge of either official languages in north-west Scarborough (north of the 401 expressway, west of Markham Rd, east of the Don Valley and south of Steeles). This area is one of the City's traditional immigrant reception areas. Other smaller pockets can be found in the downtown such as Regent Park area; North York centre; and north Etobicoke (see Map 4).
Mother Tongue Toronto continues to be a mosaic of languages. According to the 2016 Census,
43.9% of Toronto residents had a mother tongue other than English or French. This represents a decrease from the 2011 figure of 44.6%.
The City of Toronto, York Region, and Peel Region have the highest proportion of non-official mother tongues in the Greater Toronto and Hamilton Area. Statistics Canada has identified over 140 mother tongues in the Toronto Census Metropolitan Area. This is a conservative estimate given the exclusion of some languages and dialects that are suppressed due to sampling purposes.
Census 2016: Families, households and marital status; Language Page 4 of 21

Just over one half of all Toronto residents (50.9%) reported English as their mother tongue. An additional 3.4% of Toronto residents identified English and a non-official language as their multiple mother tongues.
Languages spoken regularly at home (Home Language) 25.9% of people in Toronto regularly spoke a language other than English or French
at home (down from the 2011 figure of 28.3%).
245,950 people, or 9.1% of Toronto residents reported regularly speaking multiple languages at home, up from 7.1% in 2011
There are notable shifts among the number of speakers of Toronto's most spoken home languages. French saw an increase of 26% in speakers at home, despite only an 8% increase in native tongue French speakers. Losses in Tamil and Italian native speakers were accompanied by even larger drops in the number using these languages as their primary home language.
Mandarin, Cantonese, Tagalog, Tamil, and Spanish were the top non-English languages spoken at home.
GLOSSARY Statistics Canada maintains a Census Dictionary for the Census of Population,
2016, available online at: http://www12.statcan.gc.ca/census-recensement/2016/ref/dict/index-eng.cfm. Many more terms associated with the Census can be found there.
Age: The age of a person on the day of the Census, May 10, 2016.
Census family: is any of (1) a married couple and the children, if any, of either and/or both spouses; (2) a couple living common law and the children, if any, of either and/or both partners; or (3) a lone parent of any marital status with at least one child living in the same dwelling and that child or those children. All members of a particular census family live in the same dwelling. A couple may be of opposite or same sex. Children may be children by birth, marriage, common-law union or adoption regardless of their age or marital status as long as they live in the dwelling and do not have their own married spouse, common-law partner or child living in the dwelling. Grandchildren living with their grandparent(s) but with no parents present also constitute a census family.
Census Metropolitan Area (CMA): one or more adjacent municipalities centred on a core population centre. To be included in a CMA, the adjacent municipalities must have a high degree of integration with the core. Integration is measured by commuting flows.
Census Tract (CT): a small, geographic area, typically with a population smaller than 10,000 persons. Their geography is relatively stable over time to allow for comparison of changes from Census to Census.
Centre: as seen in the attached Maps, Centres are defined in the City of Toronto Official Plan. They play an important role in how the City manages growth. The Scarborough, North York, Etobicoke and Yonge-Eglinton Centres are places with excellent transit accessibility where jobs, housing and services will be concentrated
Census 2016: Families, households and marital status; Language Page 5 of 21

in dynamic mixed use settings with different levels of activity and intensity. More information can be found in the Toronto Official Plan.
Economic family: a broader definition of family than the census family concept, meaning a group of two or more persons who live in the same dwelling and are related to each other by blood, marriage, common-law union, adoption or a foster relationship. A couple may be of opposite or same sex. By definition, all persons who are members of a census family are also members of an economic family. Examples of the broader concept of economic family include: two co-resident census families who are related to one another are considered one economic family; co-resident siblings who are not members of a census family are considered as one economic family; and, nieces or nephews living with aunts or uncles are considered one economic family.
GTA refers to the Greater Toronto Area. This area is comprised of the single-tier municipality of Toronto, the regional municipalities of York, Durham, Peel, and Halton, and the cities and towns within the GTA regional municipalities. This is not the same geography as the Toronto Census Metropolitan Area as defined by Statistics Canada.
GTHA refers to the Greater Toronto and Hamilton Area. This area is comprised of the single-tier municipalities of Toronto and Hamilton, the regional municipalities of York, Durham, Peel, and Halton, and the cities and towns within the GTHA regional municipalities. This is not the same geography as the Toronto Census Metropolitan Area as defined by Statistics Canada.
Home language: Language spoken most often at home or on a regular basis at home.
Household: refers to the division of living arrangements into census family and non-family households. Family household refers to a household that contains at least one census family. One-family household refers to a single census family (with or without other persons) that occupies a private dwelling. Multiple-family household refers to a household in which two or more census families (with or without additional persons) occupy the same private dwelling. Family households may also be divided based on the presence of persons not in a census family. Non-family household refers to either one person living alone in a private dwelling or to a group of two or more people who share a private dwelling, but who do not constitute a census family. Multigenerational household refers to a household with three or more generations. These households have at least one person who is the grandparent and the parent of someone in the household
Mother tongue: First language learned at home in childhood and still understood at the time of the Census.
Undercoverage: is the number of persons excluded by the Census who should have been counted, as determined by Statistics Canada. Although Statistics Canada makes a great effort to count every person, in each Census a notable number of people are left out for a variety of reasons. For example, people may be traveling, some dwellings are hard to find, and some people simply refuse to participate. Overcoverage can also occur, when people are counted more than once or should not have been counted in a given population. Undercoverage is generally more
Census 2016: Families, households and marital status; Language Page 6 of 21

common than overcoverage. The total impact of the coverage errors is the net undercoverage.
NOTESAll data in this backgrounder are based on geographic boundaries available at time of writing. In the event of any future boundary revisions, some data totals may change. This is especially the case for small area units such as Census Tracts.
The age and sex figures in this Backgrounder are not adjusted for undercoverage. See the Glossary for an explanation of undercoverage.
All figures in this backgrounder are randomly rounded to multiples of 5 by Statistics Canada as a privacy measure.
The information previously collected by the long-form Census questionnaire was collected in 2011 as part of the voluntary National Household Survey. In 2016, Statistics Canada restored the mandatory long-form Census questionnaire in an effort to improve data collection. The data reported in this backgrounder are based on the mandatory short-form component of the Census for both 2011 and 2016, and therefore can be compared.
This backgrounder was revised from a previous version in order to correct an error in Tables 6 and 7. Please use this version.
WARD PROFILES AND NEIGHBOURHOOD PROFILESWard Profiles are based on a series of custom tabulations from the Census. City Planning staff will update the Ward Profiles when Statistics Canada can provide the necessary custom tabulations based on 2016 data, beginning in late 2017. The current Ward Profiles can be found at: http://app.toronto.ca/wards/jsp/wards.jsp
Neighbourhood Profiles are being redesigned to better respond to the information needs of the community. New profiles are anticipated to be available in late 2017. In the meantime, 2016 Census data will be made available via the Wellbeing online mapping application, available at: http://www.toronto.ca/wellbeing. The current Neighbourhood Profiles can be found at: http://www.toronto.ca/demographics.
Census 2016: Families, households and marital status; Language Page 7 of 21

FUTURE CENSUS RELEASESThe City of Toronto will be releasing more backgrounders coinciding with each Census release, except for the Census of Agriculture. The Census release schedule is available from Statistics Canada, online at: https://www12.statcan.gc.ca/census-recensement/index-eng.cfm. The City of Toronto will be preparing backgrounders for the following releases:
September 13, 2017 Income
October 25, 2017 Immigration and ethnocultural diversityHousingAboriginal peoples
November 29, 2017 EducationLabourJourney to workLanguage of workMobility and migration
REFERENCESPrepared by staff from:
City Planning, Research and Information Social Development, Finance and Administration,
Social Policy Analysis and Research
With assistance by staff from: Children's Services, Policy & Planning Economic Development and Culture, Research & Information Services
Media contact: Bruce Hawkins, Strategic Communications, 416-392-3496, [email protected]
Staff contact: Harvey Low, Social Development, Finance & Administration, 416-392-8660, [email protected]
Census 2016: Families, households and marital status; Language Page 8 of 21

TABLES, CHARTS AND MAPS
Table 1: Census Families by Family Structure, Toronto & GTA, 1996-2016..................10Table 2: Lone Parent Families in the GTHA, 1996-2016...............................................11Table 3: Change in persons in Census Families without Children, GTA, 2011-2016.....11Table 4: Households by Household Type, GTHA, 2006 to 2016....................................13Table 5: Households by Household Type, GTHA, 5 and 10 year Percent Change........13Table 6: Households by Household Types, Including Multigenerational Households,
Greater Toronto and Hamilton Area, 2011 – 2016....................................14Table 7: Households by Household Types, Including Multigenerational Households,
Rest of the Greater Toronto and Hamilton Area, 2011 - 2016..................15Table 8: Top 15 Mother Tongue Languages in the City of Toronto (Excluding English) 16Table 9: Top 15 Home Languages in the City of Toronto (Excluding English)...............16
Figure 1: Households by Household Type, City of Toronto, 2016..................................12Figure 2: Top 75 Mother tongue languages, Toronto, 2016 (Excluding English)...........17Figure 3: Top 75 Home languages, Toronto, 2016 (Excluding English).........................18
Map 1: City of Toronto Lone-Parent Families 2016……...……………………………….. 19Map 2: City of Toronto Percent of Young Adults Living At Home 2016…………...……. 20Map 3: City of Toronto Single-Person Households 2016………………………………… 21Map 4: City of Toronto No Knowledge of Official Languages 2016…………………….. 22
Census 2016: Families, households and marital status; Language Page 9 of 21

Table 1: Census Families by Family Structure, Toronto & GTA, 1996-2016
Number of Census Families by Family Structure, Toronto, 1996-2016
1996 2001 2006 2011 2016Total Couple Families 502,655 532,310 533,960 543,355 566,155Total Couple Families without Children 201,065 212,780 219,345 231,595 250,085Total Couple Families with Children 301,590 319,530 314,615 311,760 316,070Married Couples 460,630 476,430 472,410 473,445 481,125Common Law Couples 42,025 55,880 61,550 69,910 85,030
Change in Census Family Structure, Toronto, 1996-2016
1996-2001 2001-2006 2006-2011 2011-2016 1996-2016Total Couple Families +5.9% +0.3% +1.8% +4.2% +12.6%Total Couple Families without Children +5.8% +3.1% +5.6% +8.0% +24.4%Total Couple Families with Children +5.9% -1.5% -0.9% +1.4% +4.8%Married Couples +3.4% -0.8% +0.2% +1.6% +4.4%Common Law Couples +33.0% +10.1% +13.6% +21.6% +102.3%
Number of Census Families by Family Structure, Rest of Greater Toronto Area, 1996-2016
1996 2001 2006 2011 2016Total Couple Families 545,590 636,740 742,440 826,580 884,005Total Couple Families without Children 174,425 208,400 244,230 280,990 310,425Total Couple Families with Children 371,165 428,340 498,210 545,590 573,585Married Couples 507,185 584,640 680,960 756,240 806,145Common Law Couples 38,405 52,100 61,480 70,340 77,865
Change in Census Family Structure, Rest of Greater Toronto Area, 1996-2016
1996-2001 2001-2006 2006-2011 2011-2016 1996-2016Total Couple Families +16.7% +16.6% +11.3% +6.9% +62.0%Total Couple Families without Children +19.5% +17.2% +15.1% +10.5% +78.0%Total Couple Families with Children +15.4% +16.3% +9.5% +5.1% +54.5%Married Couples +15.3% +16.5% +11.1% +6.6% +58.9%Common Law Couples +35.7% +18.0% +14.4% +10.7% +102.7%
Toronto
Toronto
Rest of the GTA
Rest of the GTA
Census 2016: Families, households and marital status; Language Page 10 of 21

Table 2: Lone Parent Families in the GTHA, 1996-2016
Number and Change in Lone Parent Families, Greater Toronto and Hamilton Area, 1996-2016
Toronto 1996 2001 2006 2011 2016 2001-2006 2006-2011 2011-2016All Census Families 619,995 663,180 670,105 690,340 718,755 +1.0 +3.0 +4.1Lone Parent Families 117,340 130,875 136,135 146,985 152,595 +4.0 +8.0 +3.8Lone Parents as % of all 18.9 19.7 20.3 21.3 21.2
Rest of GTAAll Census Families 618,265 732,310 863,555 974,860 1,048,390 +17.9 +12.9 +7.5Lone Parent Families 72,665 95,545 121,115 148,290 164,385 +26.8 +22.4 +10.9Lone Parents as % of all 11.8 13.0 14.0 15.2 15.7
DurhamAll Census Families 127,800 143,540 160,410 174,635 186,135 +11.8 +8.9 +6.6Lone Parent Families 16,715 21,065 25,720 30,830 33,850 +22.1 +19.9 +9.8Lone Parents as % of all 13.1 14.7 16.0 17.7 18.2
PeelAll Census Families 233,020 276,090 324,115 361,975 386,185 +17.4 +11.7 +6.7Lone Parent Families 30,250 39,945 49,600 59,770 65,665 +24.2 +20.5 +9.9Lone Parents as % of all 13.0 14.5 15.3 16.5 17.0
YorkAll Census Families 161,135 204,530 252,400 294,280 319,535 +23.4 +16.6 +8.6Lone Parent Families 15,455 22,275 30,570 38,805 43,940 +37.2 +26.9 +13.2Lone Parents as % of all 9.6 10.9 12.1 13.2 13.8
HaltonAll Census Families 96,310 108,150 126,630 143,970 156,535 +17.1 +13.7 +8.7Lone Parent Families 10,245 12,260 15,225 18,885 20,930 +24.2 +24.0 +10.8Lone Parents as % of all 10.6 11.3 12.0 13.1 13.4
HamiltonAll Census Families 127,960 135,980 140,810 144,120 149,355 +3.6 +2.4 +3.6Lone Parent Families 19,725 22,545 25,085 27,220 28,635 +11.3 +8.5 +5.2Lone Parents as % of all 15.4 16.6 17.8 18.9 19.2
GTAAll Census Families 1,238,260 1,395,490 1,533,660 1,665,200 1,767,145 +9.9 +8.6 +6.1Lone Parent Families 190,005 226,420 257,250 295,275 316,980 +13.6 +14.8 +7.4Lone Parents as % of all 15.3 16.2 16.8 17.7 17.9
GTHAAll Census Families 1,366,220 1,531,470 1,674,470 1,809,320 1,916,500 +9.3 +8.1 +5.9Lone Parent Families 209,730 248,965 282,335 322,495 345,615 +13.4 +14.2 +7.2Lone Parents as % of all 15.4 16.3 16.9 17.8 18.0
Number Percent Change
Table 3: Change in persons in Census Families without Children, GTA, 2011-2016
Change in Persons in Census Families without Children, GTA, 2011-2016 Age Group # % # % # % # % # %
Total +36,985 +8.0% +8,895 +7.9% +25,060 +15.4% +19,520 +10.3% +5,400 +5.5%15-24 +050 +0.4% -400 -16.4% -210 -9.4% -840 -20.4% -315 -19.7%25-44 +20,020 +13.0% +385 +1.7% -630 -1.7% +760 +1.6% -1,615 -7.0%45-64 -1,810 -1.2% -825 -1.7% +3,070 +4.9% -575 -0.8% -820 -2.2%65+ +18,715 +12.3% +9,715 +26.3% +22,820 +37.7% +20,170 +31.4% +8,160 +22.9%
HaltonPeelYorkDurhamToronto
Census 2016: Families, households and marital status; Language Page 11 of 21

Figure 1: Households by Household Type, City of Toronto, 2016
Census 2016: Families, households and marital status; Language Page 12 of 21

Table 4: Households by Household Type, GTHA, 2006 to 2016
2006# % # % # % # % # % # %
GTHA 2,160,400 100.0 575,360 100.0 1,502,700 100.0 82,340 100.0 499,805 100.0 75,555 100.0Toronto 979,440 45.3 344,565 59.9 602,235 40.1 32,640 39.6 295,520 59.1 49,045 64.9Rest of the GTHA 1,180,960 54.7 230,795 40.1 900,465 59.9 49,700 60.4 204,285 40.9 26,510 35.1 Durham 194,670 9.0 39,715 6.9 149,705 10.0 5,250 6.4 35,135 7.0 4,580 6.1 Peel 359,060 16.6 60,880 10.6 275,045 18.3 23,135 28.1 52,555 10.5 8,325 11.0 York 275,685 12.8 39,190 6.8 221,760 14.8 14,735 17.9 34,835 7.0 4,355 5.8 Halton 157,085 7.3 33,660 5.9 120,365 8.0 3,060 3.7 30,030 6.0 3,630 4.8 Hamilton 194,460 9.0 57,350 10.0 133,590 8.9 3,520 4.3 51,730 10.4 5,620 7.4
2011# % # % # % # % # % # %
GTHA 2,370,920 100.0 660,600 100.0 1,618,765 100.0 91,555 100.0 567,575 100.0 93,025 100.0Toronto 1,047,880 44.2 390,920 59.2 625,820 38.7 31,140 34.0 331,180 58.3 59,740 64.2Rest of the GTHA 1,323,040 55.8 269,680 40.8 992,945 61.3 60,415 66.0 236,395 41.7 33,285 35.8 Durham 213,740 9.0 45,865 6.9 161,365 10.0 6,510 7.1 40,030 7.1 5,835 6.3 Peel 402,940 17.0 72,345 11.0 302,415 18.7 28,180 30.8 61,910 10.9 10,435 11.2 York 323,540 13.6 48,350 7.3 257,490 15.9 17,700 19.3 42,440 7.5 5,915 6.4 Halton 179,015 7.6 39,180 5.9 135,900 8.4 3,935 4.3 35,085 6.2 4,090 4.4 Hamilton 203,805 8.6 63,940 9.7 135,775 8.4 4,090 4.5 56,930 10.0 7,010 7.5
2016# % # % # % # % # % # %
GTHA 2,532,680 100.0 726,980 100.0 1,702,940 100.0 102,760 100.0 622,430 100.0 104,545 100.0Toronto 1,112,930 43.9 427,975 58.9 653,360 38.4 31,600 30.8 359,960 57.8 68,010 65.1Rest of the GTHA 1,419,745 56.1 299,005 41.1 1,049,580 61.6 71,160 69.2 262,470 42.2 36,535 34.9 Durham 227,905 9.0 50,450 6.9 169,205 9.9 8,250 8.0 44,385 7.1 6,070 5.8 Peel 430,180 17.0 80,360 11.1 316,910 18.6 32,910 32.0 68,345 11.0 12,015 11.5 York 357,085 14.1 59,350 8.2 277,380 16.3 20,350 19.8 52,505 8.4 6,850 6.6 Halton 192,975 7.6 41,625 5.7 146,465 8.6 4,890 4.8 37,660 6.1 3,960 3.8 Hamilton 211,595 8.4 67,220 9.2 139,620 8.2 4,760 4.6 59,575 9.6 7,640 7.3
Non-FamilyAll Households Non-Family Single-Family Multiple-Family 1 Person 2+ Persons
Non-FamilyAll Households Non-Family Single-Family Multiple-Family 1 Person 2+ Persons
Non-FamilyAll Households Non-Family Single-Family Multiple-Family 1 Person 2+ Persons
Source: Statistics Canada, Censuses 2006-2016Note: Table totals may vary slightly due to rounding.
Table 5: Households by Household Type, GTHA, 5 and 10 year Percent Change
Toronto # % # % # % # % # %Total Households 1,112,930 100.0 1,047,880 100.0 979,440 100.0 65,050 6.2 133,490 13.6Non-Family Households 427,975 38.5 390,920 37.3 344,565 35.2 37,055 9.5 83,410 24.2 1 Person Households 359,960 32.3 331,180 31.6 295,520 30.2 28,780 8.7 64,440 21.8 2 or more Person Households 68,010 6.1 59,740 5.7 49,045 5.0 8,270 13.8 18,965 38.7Single-Family Households 653,360 58.7 625,820 59.7 602,235 61.5 27,540 4.4 51,125 8.5Multiple-Family Households 31,600 2.8 31,140 3.0 32,640 3.3 460 1.5 -1,040 -3.2
GTHA # % # % # % # % # %Total Households 2,532,680 100.0 2,370,920 100.0 2,160,400 100.0 161,760 6.8 372,280 17.2Non-Family Households 726,980 28.7 660,600 27.9 575,360 26.6 66,380 10.0 151,620 26.4 1 Person Households 622,430 24.6 567,575 23.9 499,805 23.1 54,855 9.7 122,625 24.5 2 or more Person Households 104,545 4.1 93,025 3.9 75,555 3.5 11,520 12.4 28,990 38.4Single-Family Households 1,702,940 67.2 1,618,765 68.3 1,502,700 69.6 84,175 5.2 200,240 13.3Multiple-Family Households 102,760 4.1 91,555 3.9 82,340 3.8 11,205 12.2 20,420 24.8
5 Year Change 10 Year Change2016 2011 2006 2011-2016 2006-2016
5 Year Change 10 Year Change2016 2011 2006 2011-2016 2006-2016
Source: Statistics Canada, Censuses 2006-2016Note: Table totals may vary slightly due to rounding.
Census 2016: Families, households and marital status; Language Page 13 of 21

Table 6: Households by Household Types, Including Multigenerational Households, Greater Toronto and Hamilton Area, 2011 – 2016
Count 2011 2016 2011 2016Total Households 2,370,930 2,532,670 1,047,880 1,112,930 One-census-family households without additional persons: 1,469,935 1,545,990 565,615 592,755
Couple census families - Without children 465,005 502,920 194,975 212,630 Couple census families - With children 769,765 792,340 260,395 265,695 Lone parent 235,165 250,730 110,245 114,430
Multigenerational households 123,580 137,935 40,500 41,535 Other census family households 116,805 121,780 50,840 50,665 Non-Census family Households: 660,610 726,965 390,920 427,970 1 Person Households 567,585 622,415 331,180 359,955 2 or more Person Households 93,025 104,550 59,740 68,015
% Distribution 2011 2016 2011 2016Total Households 100.0 100.0 100.0 100.0 One-census-family households without additional persons 62.0 61.0 54.0 53.3
Couple census families - Without children 19.6 19.9 18.6 19.1 Couple census families - With children 32.5 31.3 24.8 23.9 Lone parent 9.9 9.9 10.5 10.3
Multigenerational households 5.2 5.4 3.9 3.7 Other census family households 4.9 4.8 4.9 4.6 Non-Census family Households 27.9 28.7 37.3 38.5 1 Person Households 23.9 24.6 31.6 32.3 2 or more Person Households 3.9 4.1 5.7 6.1
# % # %Total Households 161,740 6.8 65,050 6.2 One-census-family households without additional persons: 76,055 5.2 27,140 4.8
Couple census families - Without children 37,915 8.2 17,655 9.1 Couple census families - With children 22,575 2.9 5,300 2.0 Lone parent 15,565 6.6 4,185 3.8
Multigenerational households 14,355 11.6 1,035 2.6 Other census family households 4,975 4.3 (175) (0.3) Non-Census family Households: 66,355 10.0 37,050 9.5 1 Person Households 54,830 9.7 28,775 8.7 2 or more Person Households 11,525 12.4 8,275 13.9
GTHA Toronto
GTHA Toronto
GTHA Toronto
5 Year Change 5 Year Change
Source: Statistics Canada, Censuses 2011-2016, Highlight Tables – Families, Households and Marital Status Highlight Tables, Census year 2016, Catalogue 98-402-X2016004Note: Table totals may vary slightly due to rounding.
Census 2016: Families, households and marital status; Language Page 14 of 21
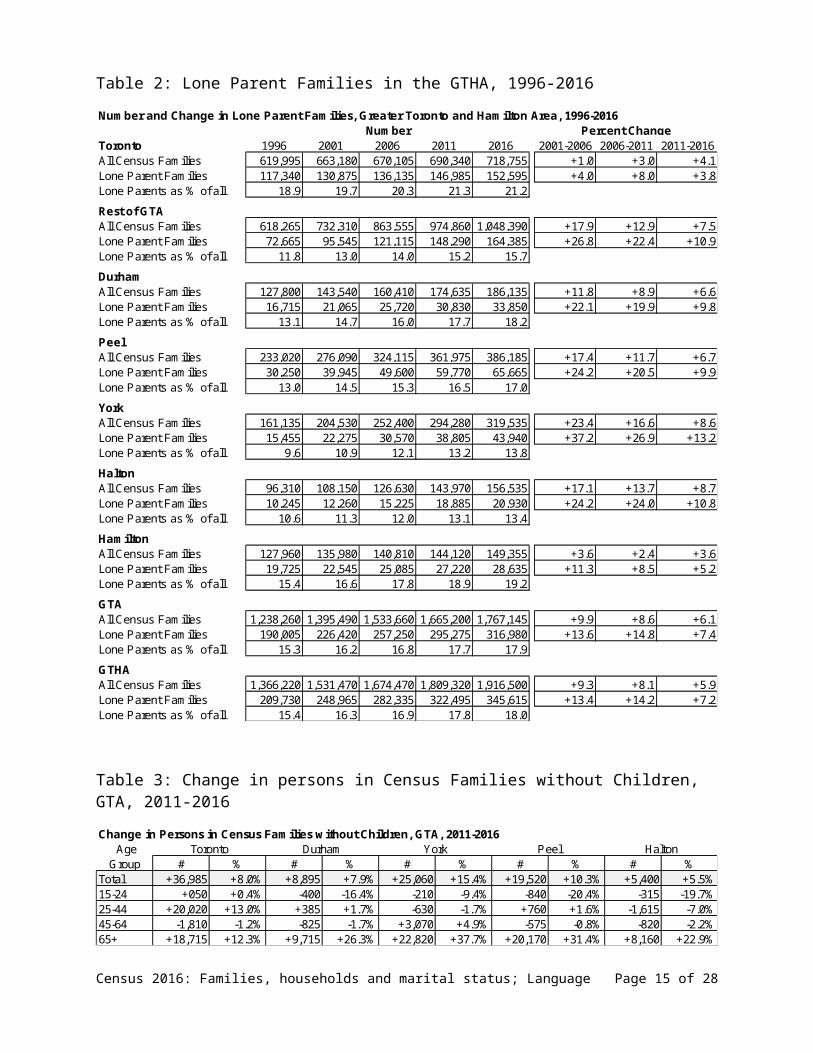
Table 7: Households by Household Types, Including Multigenerational Households, Rest of the Greater Toronto and Hamilton Area, 2011 - 2016
Count 2011 2016 2011 2016 2011 2016 2011 2016 2011 2016 2011 2016Total Households 1,323,050 1,419,740 213,750 227,905 323,545 357,085 402,940 430,180 179,010 192,975 203,805 211,595 One-census-family households without additional persons: 904,320 953,235 148,065 154,745 232,240 250,225 269,160 280,445 128,135 137,815 126,720 130,005
Couple census families - Without children 270,030 290,290 48,585 51,430 62,715 71,715 68,070 72,800 43,815 45,525 46,845 48,820 Couple census families - With children 509,370 526,645 77,245 79,350 142,945 148,290 161,715 164,700 69,255 75,585 58,210 58,720 Lone parent 124,920 136,300 22,235 23,965 26,580 30,220 39,375 42,945 15,065 16,705 21,665 22,465
Multigenerational households 83,080 96,400 9,880 12,020 24,340 27,915 36,590 42,040 5,920 7,360 6,350 7,065 Other census family households 65,965 71,115 9,935 10,685 18,610 19,595 24,840 27,340 5,785 6,185 6,795 7,310 Non-Census family Households: 269,690 298,995 45,865 50,450 48,355 59,350 72,345 80,360 39,185 41,620 63,940 67,215 1 Person Households 236,405 262,460 40,025 44,380 42,445 52,500 61,915 68,345 35,090 37,660 56,930 59,575 2 or more Person Households 33,285 36,535 5,840 6,070 5,910 6,850 10,430 12,015 4,095 3,960 7,010 7,640
% Distribution 2011 2016 2011 2016 2011 2016 2011 2016 2011 2016 2011 2016Total Households 100.0 100.0 100.0 100.0 100.0 100.0 100.0 100.0 100.0 100.0 100.0 100.0 One-census-family households without additional persons 68.4 67.1 69.3 67.9 71.8 70.1 66.8 65.2 71.6 71.4 62.2 61.4
Couple census families - Without children 20.4 20.4 22.7 22.6 19.4 20.1 16.9 16.9 24.5 23.6 23.0 23.1 Couple census families - With children 38.5 37.1 36.1 34.8 44.2 41.5 40.1 38.3 38.7 39.2 28.6 27.8 Lone parent 9.4 9.6 10.4 10.5 8.2 8.5 9.8 10.0 8.4 8.7 10.6 10.6
Multigenerational households 6.3 6.8 4.6 5.3 7.5 7.8 9.1 9.8 3.3 3.8 3.1 3.3 Other census family households 5.0 5.0 4.6 4.7 5.8 5.5 6.2 6.4 3.2 3.2 3.3 3.5 Non-Census family Households 20.4 21.1 21.5 22.1 14.9 16.6 18.0 18.7 21.9 21.6 31.4 31.8 1 Person Households 17.9 18.5 18.7 19.5 13.1 14.7 15.4 15.9 19.6 19.5 27.9 28.2 2 or more Person Households 2.5 2.6 2.7 2.7 1.8 1.9 2.6 2.8 2.3 2.1 3.4 3.6
# % # % # % # % # % # %Total Households 96,690 7.3 14,155 6.6 33,540 10.4 27,240 6.8 13,965 7.8 7,790 3.8 One-census-family households without additional persons: 48,915 5.4 6,680 4.5 17,985 7.7 11,285 4.2 9,680 7.6 3,285 2.6
Couple census families - Without children 20,260 7.5 2,845 5.9 9,000 14.4 4,730 6.9 1,710 3.9 1,975 4.2 Couple census families - With children 17,275 3.4 2,105 2.7 5,345 3.7 2,985 1.8 6,330 9.1 510 0.9 Lone parent 11,380 9.1 1,730 7.8 3,640 13.7 3,570 9.1 1,640 10.9 800 3.7
Multigenerational households 13,320 16.0 2,140 21.7 3,575 14.7 5,450 14.9 1,440 24.3 715 11.3 Other census family households 5,150 7.8 750 7.5 985 5.3 2,500 10.1 400 6.9 515 7.6 Non-Census family Households: 29,305 10.9 4,585 10.0 10,995 22.7 8,015 11.1 2,435 6.2 3,275 5.1 1 Person Households 26,055 11.0 4,355 10.9 10,055 23.7 6,430 10.4 2,570 7.3 2,645 4.6 2 or more Person Households 3,250 9.8 230 3.9 940 15.9 1,585 15.2 (135) (3.3) 630 9.0
5 Year Change 5 Year Change 5 Year Change5 Year Change 5 Year Change 5 Year Change
Halton Hamilton
Rest of the GTHA Durham York Peel Halton Hamilton
Rest of the GTHA Durham York Peel
Halton HamiltonRest of the GTHA Durham York Peel
Source: Statistics Canada, Censuses 2011-2016, Highlight Tables – Families, Households and Marital Status Highlight Tables, Census year 2016, Catalogue 98-402-X2016004 Note: Table totals may vary slightly due to rounding
Census 2016: Families, households and marital status; Language Page 15 of 21

Table 8: Top 15 Mother Tongue Languages in the City of Toronto (Excluding English)
Rank in 2016 Mother Tongue Persons
% of Toronto (single
responses)Rank in
2011Change
since 20111 Cantonese 114,670 4.4% 2* n/a*2 Mandarin 111,405 4.3% 1* n/a*3 Tagalog 83,230 3.2% 5 +18%4 Spanish 72,855 2.8% 4 +3%5 Italian 62,635 2.4% 3 -13%6 Portuguese 59,360 2.3% 8 +2%7 Tamil 57,530 2.2% 6 -7%8 Persian (Farsi) 49,190 1.9% 9 +17%9 Urdu 37,420 1.4% 10 -2%
10 Russian 36,145 1.4% 11 -2%11 French 35,440 1.4% 13 +8%12 Korean 33,665 1.3% 14 +8%13 Arabic 29,825 1.1% 18 +14%14 Bengali 28,460 1.1% 19 +17%15 Greek 27,840 1.1% 15 -4%
Table 9: Top 15 Home Languages in the City of Toronto (Excluding English)
Rank in 2016 Home Language Persons
% of Toronto (single
responses)Rank in
2011Change
since 20111 Mandarin 87,760 3.6% 3* n/a*2 Cantonese 83,405 3.4% 1* n/a*3 Tagalog 42,515 1.7% 6 +14%4 Tamil 42,015 1.7% 4 -14%5 Spanish 41,530 1.7% 5 -8%6 Portuguese 33,425 1.4% 8 -3%7 Persian (Farsi) 33,375 1.4% 9 +9%8 Italian 27,130 1.1% 7 -23%9 Urdu 23,625 1.0% 11 -11%
10 Korean 23,625 1.0% 12 +1%11 Russian 23,075 0.9% 10 -14%12 Bengali 18,930 0.8% 14 +6%13 French 17,060 0.7% 20 +26%14 Vietnamese 17,020 0.7% 15 -4%15 Gujarati 16,525 0.7% 13 -14%
* Note: for the 2016 Census, new instructions in the electronic questionnaire resulted in a sharp increase in certain Chinese languages, particularly Mandarin and Cantonese. For this reason, 2011 totals are not directly comparable.
Census 2016: Families, households and marital status; Language Page 16 of 21

Census 2016: Families, households and marital status; Language Page 17 of 21
Figure 3: Top 75 Home languages, Toronto, 2016 (Excluding English)
Figure 2: Top 75 Mother tongue languages, Toronto, 2016 (Excluding English)
Indo-Iranian languages, n.i.e.
Thai
Creole languages, n.i.e.
Bosnian
Finnish
Khmer (Cambodian)
Maltese
Serbo-Croatian
Yoruba
Latvian
Kurdish
Hiligaynon
Marathi
Slovene (Slovenian)
Creole, n.o.s.
Lithuanian
Niger-Congo languages, n.i.e.
Malay
Estonian
Swahili
Yiddish
Sindhi
Nepali
Wu (Shanghainese)
Hakka
Czech
Slovak
Dutch
Sinhala (Sinhalese)
Cebuano
Telugu
Tigrigna
Akan (Twi)
Bulgarian
Hebrew
Pashto
Malayalam
Tibetan
940
1,005
1,025
1,110
1,315
1,365
1,430
1,470
1,585
1,605
1,650
1,695
1,760
1,785
1,825
1,885
1,900
1,930
1,945
2,230
2,350
2,440
2,540
2,665
2,855
2,860
3,095
3,185
3,280
3,390
4,125
4,150
4,345
4,345
4,350
4,355
4,560
4,595

Census 2016: Families, households and marital status; Language Page 18 of 21

Census 2016: Families, households and marital status; Language Page 19 of 21

Census 2016: Families, households and marital status; Language Page 20 of 21

Census 2016: Families, households and marital status; Language Page 21 of 21