family feud: succession tournaments and risk-taking … · family feud: succession tournaments and...
TRANSCRIPT

Family Feud: Succession Tournaments and Risk-taking in Korean Chaebols†
Jongsub Lee, Hojong Shin, and Hayong Yun*
† We thank for the many helpful comments from participants of the workshop at the Korea Capital Market Institute Symposium, Korea University, Michigan State University, SKK GSB, and the University of Florida. All remaining errors are our own. * Jongsub Lee, [email protected], Department of Finance Insurance & Real Estate, Warrington College of Business, University of Florida, PO Box 117168, 315E STZ, Gainesville, Florida 32611-7168, Tel. (352) 273-4966; Hojong Shin, [email protected], Department of Finance, Eli Broad College of Business, Michigan State University, 363 Eppley Center, East Lansing, MI 48824, Tel. (517) 353-1705; Hayong Yun, [email protected], Department of Finance, Eli Broad College of Business, Michigan State University, 339 Eppley Center, East Lansing, MI 48824, Tel. (517) 884-0549. All errors are our own. Please address correspondence to authors via email.

Family Feud: Succession Tournaments and Risk-taking in Korean Chaebols
Abstract We study the impact of succession tournaments on corporate risk-taking in Korean family business groups known as chaebols. We find that business groups with more sons tend to have higher income volatility and lower performance. In contrast, business groups with more daughters ─ particularly with married ones ─ tend to have lower income volatility and higher performance. These effects are evident for opaque private firms in pyramidal business groups. We also find evidence of sons’ managerial myopia, such as higher dividend payouts and less investment in R&D. Our findings suggest that succession tournaments in a family business group induce risk-taking and managerial myopia among sons, but the positive externalities that high quality sons-in-law could bring in to the family through marriage help mitigate the concerns. Using a sudden death of a business group chairman as an exogenous shock to succession tournament, we confirm a causal link between increased competition among succession contestants and corporate risk-taking.
JEL Codes: G30; Keywords: succession tournaments, business group, tournament theory, risk shifting, family composition, sons, daughters, sons-in-law.

1
1 Introduction
Around the world, family firms are prevalent and comprise a large portion of the economy. La
Porta, Lopez-de-Silanes, and Shleifer (1999) document that, except for a few advanced
economies with strong investor protection, firms are often controlled by families. Even in the
United States, family firms contribute 57% of the GDP (Annual Family Business Survey) and
employ 63% of the workforce in the country (Family Enterprise USA, 2011).1 Reflecting their
importance in the world economy, family firms have attracted attention in the recent literature.
Many papers describe various aspects of family firms. However, studies that examine potential
conflicts within a family during succession processes are relatively rare. Specifically, the
literature has not fully explored the cultural, institutional factors that determine how succession
tournaments are played out within a family, or how these tournaments affect corporate outcomes
in family-run business organizations. We fill this void in this paper.
We examine whether succession tournaments in a family business group induce risk-
taking behavior by the heirs of the business group. To determine whether the risks taken are
excessive in the short run, we also study their performance consequences.2 We answer these key
questions using Korean family business group data, which provide an interesting laboratory to
empirically test our key research questions. First, standard prescriptions for remedy, such as
optimal financial contracting arrangements, often do not work well in Korea because exogenous,
unalterable factors such as bloodline, gender, or seniority within a family play important roles in
determining the successor of a business group. The long-standing Confucian culture in Korea
1 Family Enterprise USA, “Annual Family Business Survey: General Results and Conclusions.” 2011. 2 Our hypothesis is based on zero-effort, noisy tournament equilibrium, which leads to excess risk-taking (Hvide, 2002). However, our data are a 2004 cross-section, and therefore, we are limited to state long-run consequences of such risk-taking. We can only show that risk-taking activity increases, and performance decreases at least in the short run.
2
implies that succession tournaments in family business groups are primarily between male, direct
bloodline heirs rather than female heirs or any external male family members who join the
family through adoption or marriage. Understanding the impact of such innate factors on firms is
a first step towards finding solutions to steer family firms back to profit maximization. Second,
succession tournaments are more likely in Korean business groups because controlling stakes
within a group are interconnected by the web of cross-ownership among member firms, making
it very important to strategically control several key firms, rather than just owning stakes in
many firms within the business group. Typically, a tournament winner is endowed with the
controlling stakes in those key firms, through which the winner controls the whole business
group. This steep option-like payoff structure in the succession process in Korean family
business groups implies strong tournament incentives among the heirs of the business groups.
Using the cross-section of firms in Korean family business groups known as chaebols and
detailed information on their family trees and marital histories as of 2004, we find higher cash
flow volatility of member firms of a chaebol when the controlling family of the chaebol has a
large number of sons in the generation immediately following the current chair generation
(chair+1 generation). For example, one standard deviation increase in the number of sons in the
chair+1 generation is associated with a 5.39% higher income volatility. This effect is
concentrated in business groups where the age gap among sons is narrow and deep pyramidal
ownership chains are present. Interestingly, the income volatility decreases as the number of
daughters in the business group increases, and this daughter effect is especially strong when the
daughters are married. These findings suggest that risk shifting among sons in a succession
tournament reduces when a married daughter brings in a high external quality standard through
her spouse and disciplines the sons’ potentially value-destroying excessive risk-taking incentives.

3
Conditional tests reveal that the increasing income volatility effect of sons is stronger for
unregulated private firms (as opposed to regulated public firms), for business groups whose
founders are the current chairs, and for recent marriages to other powerful chaebols (as opposed
to old, non-chaebol marriages).
Next we examine the performance consequences of these risk-taking practices in Korean
chaebol families. Consistent with the notion of excess risk-taking destroying value in the short-
run, we find that firm performance decreases as the number of sons increases. For a one standard
deviation increase in the number of sons (3.98), we find that return on assets (ROA) decreases by
1.29% (=0.32477*3.98). This is a 21.54% reduction in ROA from its sample average (6%).
However, we find that sons-in-law mitigate this performance inefficiency.
We further examine ownership, managerial participation (measured by board positions),
and myopia (measured by payout ratio and R&D expenses) among family members within each
Chaebol. While ownership by sons/daughters increases with the number of sons/daughters,
ownership by sons-in-law does not. Also, board positions held by sons/sons-in-law increases
when their ownership increases, but we find no managerial participation by daughters, even if
they own some of the company. These results suggest that daughters engage more through
ownership stakes, while sons-in-law are mainly contributing though managerial talent. Also,
consistent with managerial myopia induced by succession tournaments, firms owned by sons in
the chair+1 generation tend to pay more dividends but invest less in long-term R&D projects.
Finally, we investigate whether the positive relation between the number of succession
contestants (i.e., the number of adult sons) and firm volatility is causal. Hyundai group chairman
committed a sudden suicide in his fifth year in office. Using this exogenous shock to succession
tournament, which is suddenly re-open to his old rivalries – his brothers, we confirm that

4
increased competition in the succession tournament (changes in the number of adult male
succession contenders) lead to an increase in firms’ income volatility. The effect is indeed
concentrated in firms controlled by the chair’s brothers, while insignificant in firms controlled by
his uncles in the founder’s generation, who are less likely involved in the suddenly re-open
succession tournament.
Our work relates to the literature on succession in family firms. Our focus is on risk-
taking incentives among heirs in succession tournaments, whereas prior work focuses on the
impact of successions on firm performance. For example, Perez-Gonzalez (2006) and Bennedsen,
Nielsen, Perez-Gonzalez, and Wolfenzon (2007) document that family CEOs perform worse than
non-family CEOs. Mehrotra, Morck, Shim, and Wiwattanakantang (2013) also show that non-
consanguineous-heir-run firms outperform heir-run and professional-manager-run firms.
Bunkanwanicha, Fan, and Wiwattanakantang (2013) show that a network marriage between a
controlling family member and a member of a prominent business or political family is followed
by increasing stock prices. Bertrand, Johnson, Samphantharak, and Schoar (2008), in a work
closely related to ours, also focus on performance inefficiency in 586 firms in Thai business
groups where sons “race to the bottom” in tunneling resources out of group firms following a
founder’s death. Our work differs from these studies as we focus on corporate risk-taking, one of
the most widely studied corporate policies, as a specific channel that affects performance
inefficiency. None of the aforementioned studies directly test this corporate risk implication of
succession tournaments as an important background risk of family-run organizations. We show
that firms with severe succession games tend to have riskier cash flows, which is consistent with
(potentially excessive, value-decreasing) risk-taking behavior among succession game
contestants. We also show evidence of managerial myopia that stems from the succession

5
tournaments. We provide causal evidence on these succession tournament effects using a quasi-
natural experiment based on the sudden death of a Hyundai chairman, which is also a novel
contribution to the literature on succession in family firms.
Our work also relates to the gender and corporate finance literature. Adhikari, Agrawal,
and Malm (2015), Cronqvist and Yu (2015), Faccio, Marchica, and Mura (2015), and Nguyen
(2015) find differences in corporate decision-making outcomes based on the gender of CEOs and
the CEOs’ children. Ongena and Popov (2015) show differences in access to the credit market
based on the gender of companies' CEOs. Our work shows the importance of gender within a
family in explaining corporate risk-taking outcomes: daughters are crucial to mitigating risk-
taking incentives in tournament games. Our results emphasize that it is not mere biological
gender differences that leads to such outcomes, but rather different social roles within a family:
sons and sons-in-law have opposing effects on corporate risk-taking.
We also apply messages from the tournament and risk-taking literature to the family firm
literature. Theories on tournaments and risk-taking incentives (Hvide, 2002, Cabral, 2003;
Anderson and Cabral, 2007, Taylor, 2003. and Goel and Thakor, 2008, among others) are
extensively applied to mutual funds (Brown, Harlow, and Starks, 1996, Chevalier and Ellison,
1997, and Kempf and Ruenzi, 2008, among others) and U.S. stand-alone corporation analyses
(Kini and Williams, 2012, among others). However, investigation of the implications for family
business groups around the globe is rare. To the best of our knowledge, we are the first to use
tournament theories to understand risk-taking incentives in family-run business organizations.
Finally, our work extends the literature on chaebols. Existing studies (Bae, Kang, and
Kim, 2002; Joh, 2003; Baek, Kang, and Lee, 2006; Almeida, Park, Subrahmanyam, and
Wolfenzon, 2011) mainly focus on the prevailing pyramidal control structure and/or resulting

6
agency problems such as resource tunneling. Our approach differs from theirs, as we introduce
potential succession tournaments within a family that arise due to the option-like payoff structure
to heirs when deep ownership pyramids are present. Our work also explains how cultural factors
shape and affect the scope of succession games. Our results indicate that these cultural
considerations are important keys to understanding the “family” side of business group
operations in Korea.
Our paper is organized as follows: in Section 2, we provide background on Korean
business groups and develop hypotheses. In Section 3, we describe the sample and variables used
in our test. Section 4 discusses our main results. In Section 5, we conclude.
2. Institutional Background and Hypothesis Development
2.1 Institutional Background
One of the predominant business organization models in Korea is the chaebol ─ a family-run
business group that consists of multiple independent legal entities. Since 1960, chaebols have
emerged under a series of government-driven economic development plans and expanded
economically; by now, they control more than 57% of Korean national wealth (Economic
Reform Research Institute, Feb 11, 2014).3
While chaebols have grown economically, one of the central concerns to a controlling
family has been the succession of leadership of the business group to the next generations. To
economize on succession costs (e.g., inheritance taxes), at many chaebols, families control the
whole group of affiliates through miniscule control stakes in several key entities known as
3 “The concentration of economic power in large corporations and conglomerates and their dynamic change analysis (1987 – 2012).” Economic Reform Research Institute Report, Feb 11, 2014.

7
“central” firms (Almeida et al., 2011). Such a concentrated control structure extensively uses a
complex pyramidal ownership web that often also accompanies circular ownership links. Group
succession has occurred exclusively within the direct bloodline of a family, and, as of 2015, most
chaebol families are preparing for succession to their third generation (Nikkei Asian Review,
Aug 20, 2015).4
Although smooth and efficient transition of group control to the next generation is a
common interest of a chaebol family, there could be significant within-family conflicts that may
arise from different incentives among heirs. The highly concentrated control structure of a
chaebol implies a steep option-like payoff that can induce a succession tournament among the
heirs, where the winner takes all, i.e., the ultimate control over the entire business group.5
Chaebol succession tournaments have recently received substantial attention, as the
media popularize the brutal succession battle between two sons of the Lotte group, the fourth-
largest Korean chaebol, whose market capitalization amounts to $96 billion. In this infighting
situation, the younger brother has dismissed his father, the founder of the Lotte group, from
group chairmanship, and is engaging in a legal battle over group control against his elder brother,
who insists he is the next chairman, approved by their father. This on-going succession debate is
costly to their shareholders; the group’s key company, Lotte Shopping, lost 8% of its market
capitalization in just over a week following the announcement of the family feud by the media
4 Ogura, Kentaro “Hereditary Succession Rankles ‘Chaebol’ Investors, Public.” Nikkei Asian Review, Aug 20, 2015. 5 Some of the competing sons who lose in the succession tournament may still keep their management position in a group, but some others are eventually excluded from family management. For example, Cho, Hyun Moon, the second son of Hyosung, recently sold all of his shares and left his family in the mid of succession game. He led a complaint to prosecutors accusing his family and executives for suspected breach of trust and embezzlement of company funds (“Hyosung president may face probe.” The Korea Times, Oct 23, 2014). Similar cases are found for Park, Yong Oh, of Doosan group (Pressian, Nov 4, 2009).

8
(CNBC, Aug 5, 2015).6 Rivalries over inheritance are not uncommon in chaebols. According to
Chaebul.com, which tracks chaebol inheritance issues, roughly half of the top 40 chaebols have
been embroiled in disputes over founders’ succession plans (Economist, Aug 15, 2015).7
The scope and design of succession tournaments are influenced by both family- and non-
family factors. On the one hand, sibling rivalry, whose origin goes back to the Darwinian Theory
that most offspring have to compete for parental favor and investment, is widespread among
human families (Sulloway, 2001). The desire to get "ahead of the Joneses” (Roussanov, 2010)
within a family is common and tends to be severe when the age gap between siblings is narrow
(New York Times, Aug 31 1989).8 In the family firm context, Bertrand and Schoar (2006)
document an unintended consequence of severe sibling rivalry in a succession that ended in a
brutal siblicide in a Thai family business group.
In addition to sibling rivalry, there are also several important cultural factors that affect
how the succession game is played. Through the social norms established by a long tradition of
Confucian culture in Korea, preferences for male, more senior, and direct bloodline heirs, i.e.,
male-preference cognatic primogeniture, are widely perceived as key norms in Korean culture,
and these cultural factors imply that succession tournaments in Korea tend to be driven by male
family members – in particular, by sons.9
Strict preference for heirs from direct bloodlines suggests the unique role played by
daughters and their spouses in chaebol succession games. Sons-in-law, despite their potentially
strong managerial quality, cannot rule over the whole group; they can only partially engage in
6 Nyshka Chandran, “Vicious South Korean family feud exposes chaebol peril.” CNBC Aug 5, 2015. 7 Economist, “A Whole Lotte Drama: a fraternal feud over inheritance fires up South Koreans and regulators.” Aug 15, 2015. 8 Lawrence Kutner, “Parent & Child.” New York Times Aug 31 1989. 9 We only consider direct bloodline sons from the same mother. Adopted sons and stepsons are rare in Korean families. Divorces were also rare in chaebol families in 2004 when our data were collected.

9
the family’s business as professional managers (Burkhart et al., 2003). Anecdotal evidence
suggests that daughters own group firms, while sons-in-law manage them, often without
ownership (The Korean Herald, April 21, 2014).10 Through this separation between ownership
and management, daughters’ marital status can indirectly influence the mode of a succession
tournament by setting a higher managerial quality standard for the winner of the tournament. If
the winner of the succession tournament cannot prove that he has superior managerial talent
when compared to external family members, his victory would be bittersweet. This notion of
chaebol marriage is in line with Mehrotra et al. (2013) and Bunkanwanicha et al. (2013), who
document adopted heirs and marriages to other renowned families as ways a founding family can
overcome the human capital risk that originates from the cultural guidelines on who can inherit
the corporate empire.
Based on the discussions above, we make the following three assumptions about the
chaebol succession game:
A1: Succession tournaments exist exclusively among sons in the generation that
immediately follows the generation of the current group chairman. For natural reasons,
tournament intensity is high when the age gap among sons is narrow.
A2: Daughters own group affiliates but tend to not manage them.
A3: Sons-in-law can manage group affiliates but do not own them. They cannot receive
family benefits that are exclusively available to those in the direct bloodline. Therefore,
they do not compete against sons in succession tournaments.
10 Korean Herald, “Superrich Sons-in-law.” April 21, 2014.
10
2.2 Hypothesis Development
In this section, we hypothesize about how family composition factors, such as gender, age, and
marital status, would affect corporate risk-taking in a family business group as an outcome of a
succession tournament.
Main Hypothesis
H1: A succession tournament induces excessive risk-taking by sons, which could result
in performance inefficiency. The greater the number of sons within a family, the more
pervasive excessive risk-taking is in group-affiliated entities.
To illustrate the key point in H1, let’s consider the following stylized version of Hvide’s (2002)
two-son tournament game; the results can easily be generalized to hold for an arbitrary number
of sons by pairing them. We consider a father and his two sons, 1 and 2, all of whom are risk-
neutral. If a son i=1,2 chooses the effort level of μ� for a unit of his initial capital, then a
stochastic outcome, Y�, is achieved with an i.i.d. standard normal performance shock of ϵ� , i.e.,
Y� = �� + � where E[ϵ�] = 0, E[ϵ��] = ��
�. Hence, ϵ� is an unpriced risk, and the priced risk is
normalized to be zero. Effort is costly, with a quadratic cost function of c/2μ� where c>0. The
initial wealth of son 1 is k ≥ 1 , where son 2’s is normalized to be 1. The father sets the
tournament rule such that the son with the greater end of period performance wins the
tournament, and the winner receives the group control benefit, W, whereas the loser receives
nothing. Hence W is the marginal payoff to the tournament winner, which is assumed to be
substantial. With no tournament reward (W=0), we assume that sons behave as if they were
profit maximizers.

11
Son 1 maximizes U� = � ⋅ � − �� ��
� over μ� and �� , and son 2 maximizes U� = � ⋅
(1 − �) − �� ��
� over μ� and �� , where P = Pr(k ⋅ Y� > %�) = Φ ' (⋅)*+),√((,⋅.*,/., , )0 and Φ is the c.d.f
of a standard normal distribution. From the first order condition (FOC), μ� = (1√((,⋅.*,/., , ) ⋅ � ⋅
2 ' (⋅)*+),√((,⋅.*,/., , )0 and μ� = �
1√((,⋅.*,/., , ) ⋅ � ⋅ 2 ' (⋅)*+),√((,⋅.*,/., , )0, where ϕ is the p.d.f. of a standard
normal distribution. The FOC implies μ� = 4��.
Proposition 1: When risk-taking is unlimited (i.e., σ� ∈ [0, ∞] for ∀i = 1,2) and for a finite
k ≥ 1, excessive risk-taking (σ� = �� = ∞) with no effort (μ� = �� = 0) is a unique Nash
equilibrium.
Proof: In a symmetric tournament (k = 1), see the proof in Hvide (2002). For an asymmetric
tournament with a finite k > 1, son 1, the leader, tries to exert more effort (μ�) and minimize the
risk (σ�) to ensure his current leading status in the succession game. However, the best response
of the laggard son 2 is to increase his risk to infinite with no effort, thereby nullifying any
disadvantage in his initial wealth. Given this best response of son 2, which effectively equalizes
the winning probability of each son to ½ irrespective of son 1’s effort, son 1’s best response is
also zero effort (μ� = 0) with infinite risk-taking (σ� = �� = ∞). It should be noted that zero
effort with finite risk-taking by son 1 doesn’t lead to a Nash equilibrium, as it induces an
incentive for son 2 to increase his effort from zero while reducing his risk to further improve his
winning probability from ½. ∎
Proposition 1 constructs H1, the lazy, excessively risky equilibrium in the succession
tournament. The intuition of this proposition is that when effort is costly and when the
tournament outcome is eventually random, the sons don’t work hard but rather increase the noise
in their performances to win the tournament by luck. In terms of performance efficiency, this
12
equilibrium is inferior to the one with the first best level effort of each son, i.e., μ� = �� = �1 > 0,
where the sons maximize their net outputs without tournament concerns.
Effects of Marriage
From our assumption A3, sons-in-law maximize a chaebol's profits because they are
external male family members who are excluded from the succession tournament. High quality
sons-in-law whose marginal costs of effort are small could outperform even the winning son of
the tournament, which in turn implies significant reputation damage to the direct bloodline heir
as a formal successor of a renowned chaebol family with superior managerial talent.
The primary component of the tournament reward (W), exclusively available to the
winning son, could be this reputational value, because any diverted corporate resources could
also be enjoyed by external family members (Burkhart et al., 2003). Without the reputational
reward of the succession tournament, sons’ ex ante incentives to pursue lazy, excessively risky
tournament strategies therefore would greatly reduce.
H2: Daughters’ marriage to high quality sons-in-law could mitigate excessive risk-taking
by sons in a succession tournament.
Biological Gender Effects versus Different Social Roles within a Family
One could argue that biological gender effects, “males take greater risks than females”
(Faccio et al. 2015, among others), could explain H1 and H2. To sharpen our identification, we
further hypothesize the following:
H1-1: Only male family members who are eligible for the succession tournament drive
the lazy, excessively risky tournament equilibrium. Sons who are younger than 15, male

13
relatives in the same generation as the current group chairman, and, most importantly,
sons-in-law should not drive our tournament results.
H1-2: Daughter effects that mitigate sons’ excess risk-taking would be evident for
married daughters. With higher quality sons-in-law, risk mitigation will be greater.
Moreover, the more recent the marriages, the better the disciplining effects on sons’
excess risk-taking, due in part to the reduced likelihood of coalitions between sons and
sons-in-law.
Succession Tournaments and Managerial Myopia
A succession tournament in a chaebol would hurt the “family” value of a business group
that is known to help set up long-term managerial goals that could facilitate, for example,
technological developments and innovations (Bertrand and Schoar, 2006). When a succession
tournament is active in a family business group, such long-term-oriented family benefits could
disappear (Cabral, 2003). Therefore, instead of investing corporate resources into long-term
research and development (R&D) projects, sons in a tournament are tempted to cash out
corporate resources as dividends and use them to build up their own control stakes in key firms
to be better prepared for the succession tournament. This leads to our final hypothesis:
H3: Sons in succession tournaments show managerial myopia. They pay out dividends
more aggressively in the firms they own, while cutting down on long-term R&D
expenses.

14
3 Data
To build family trees for chaebols, we start with a publication by the Institute for
Participatory Society, entitled The Chaebol of Korea: The Management Structure and Personal
Network of Korean Chaebol. This book covers the family trees of the 30 largest Korean chaebols
based on their total assets in 2004. We could merge 16 large Korean chaebols controlled by 20
families from this list with the ownership information from the Korean Fair Trade Commission
(KFTC, a Korean anti-trust authority) in 2004.11 The total amount of assets controlled by these
chaebols represents more than 56% of the nominal GDP of the Korean economy in 2004 (778.4
trillion KRW).
A family tree starts with the founder’s parents and includes the founder him/herself, their
siblings and their spouses and all direct and indirect (via marriage) descendants of the founder
and the founder’s siblings, and their spouses. Family members who are younger than 15 years as
of 2004 are excluded, as they are not legally eligible to work in Korea. The generation of the
founder’s parents is coded as generation zero and the founder as generation one and so on. We
allocate a unique ID to each family member in the family tree and collect detailed information on
birth order, gender, direct or indirect (via marriage) descendants, marriage status, father’s ID,
and presence (dead or not). From this family tree, we define sons [daughters, sons-in-law, and
daughters-in-law] of the current chair and the chair’s siblings as sons [daughters, sons-in-law,
and daughters-in-law] in the current chair +1 (c+1) generation. The Chaebol of Korea: The
Management Structure and Personal Network of Korean Chaebol does not provide full coverage
of specific marriage year information. We therefore manually collect the relevant information.
11 Our classification of business groups is based on family roots so, for example, the pan-Samsung group includes all of the Samsung, Shinsaegae, CJ, and Hansol groups, which have the same founder but are separately classified by KFTC. Our sample includes only family-run business groups in Korea in the year 2004.

15
From Korean news articles, we secure marriage year information for 70% of the (c+1)-
generations. For the remaining 30%, we extrapolate the marriage years from the first children’s
birth years.
Our family tree and marriage data are then merged with firm-level financial, individual
family member’s ownership, and board position data from companies' annual reports submitted
to the Financial Services Commission and Korea Exchange (equivalent to 10-K filings in the
U.S). Any listed or unlisted corporation obligated to have an external audit under Article 2 of the
decree of the Act on External Audit of Stock Companies is legally mandated to submit a
comprehensive summary annual report containing information such as ownership, board
positions, and financial performance. In 2004, the 16 largest family business groups in our
sample had 580 firms in total as group-affiliated entities. Among them, we could collect financial
data for 287 firms using the Data Guide Pro, a database managed by the leading Korean financial
data provider, FnGuide.12 We obtain information on individual ownership and board position
data for these 287 firms from the repository of Korea’s corporate filings called DART (Data
Analysis, Retrieval, and Transfer System) operated by Financial Supervisory Service in Korea.
We collect additional background information on education and careers for individual family
members who have ownership or a board position. We find that chaebol family members directly
own only 90 out of 287 firms, which indicates the popular use of deep ownership pyramids in
Korean chaebols. With disproportionately small key control stakes, the family controls the entire
group of firms.
12 The information in this database is approximately equivalent to the information reported in CRSP and Compustat for U.S. firms. Among the 580 firms that belong to the 16 chaebols in our sample, all 140 public firms and 147 out of the 440 private firms submitted their annual reports in 2004.

16
To more clearly identify the degree of such a concentrated control structure in each
business group, we collect aggregate family-level ownership data from the KFTC, which, since
the mid-1990s, has required the top Korean chaebols to report extremely detailed ownership
status information. These types of public data are generally unavailable in most countries. Our
final dataset consists of 16 large Korean business groups from 20 chaebol families with 287
firms (90 directly owned by the families) as of 2004. Appendix provides the details of our
variable definitions.
[Table 1 around here]
Table 1 is an overview of the 16 large Korean business groups from the 20 chaebol
families in our sample. As indicated in Panel A, the average family has 54.35 members; there is
substantial cross-sectional variation in family size due to the variation in the number of family
generations. The majority of the current chairs belong to the second generation, and the average
numbers of male and female family members are 27.4 and 24.7, respectively. In the current
chair+1 (c+1) generation, there is on average 6.85 sons, 5.40 daughters, 2.30 sons-in-law, and
2.05 daughters-in-law.13 We observed four chaebol families whose founders are alive as of 2004.
Panels B and C of Table 1 respectively show involvement in equity ownership and board
positions across different family members. We summarize the statistics separately for the current
chair+1 and current chair generations. In Panel B where we report ownership involvement by
different family members, we find that on average, 20.8 family members own stakes in at least
one firm within the group. For the current chair+1 generation, 4 sons on average hold 20% of the
total family stakes, while 1.75 daughters hold just 3%. In-laws in the chair+1 generation rarely
13 The family members in the (c+1) generation include the children and their spouses of the current chair and the chair’s siblings.
17
own the controlling stakes of the family. For the current chair generation, similar male
dominance in equity ownership is found, although it should be noted that the fraction of family
ownership held by external (i.e., married in) male members (5%) exceeds the average fraction
held by internal female members (4%). In Panel C of the same table, we find similar tendencies
in involvement in board positions ─ the dominant presence of direct bloodline male heirs in the
current chair+1 generation.
[Table 2 around here]
In Table 2, we summarize financial characteristics (Panel A) and ownership structure
metrics (Panel B) for our sample firms. As shown in Panel A, as our sample comprehensively
covers chaebol member firms in 2004, their financial characteristics are similar to those reported
in the existing studies that also focused on large listed firms in Korea (Bae et al., 2002, Almeida
et al., 2011). ROA, dividends paid, and cash holding on assets are 6%, 1%, and 7% respectively
for both our sample and those used in the other studies. Operating income volatility, sales
volatility, and cash-flow volatility are 67%, 40%, and 60%, respectively. See Appendix for the
details of these variable definitions. Panel A also reports that 99 out of the 287 firms in our
sample are public firms, and that the average age of our sample firms is 21.32 years.
Looking at the ownership structures of Korean business groups, in Panel B we find that
public firms are, on average, a distance of 1.91 away from the controlling family. The average
position of private firms is 2.23.14 These average positions imply that public (private) firms are
more (less) likely to be directly owned by the controlling family. The maximal pyramidal depth
of a group is 5.05, and the average discrepancy between cash-flow right and voting right is 34.80%
14 Position refers to the distance between the family and a firm in a group. A value of 1 indicates that the firm is directly controlled by founding family.

18
for public firms, whereas it is 70.65% for private firms. These ownership metrics confirm that
there is typically a highly concentrated control structure in chaebols (Almeida et al., 2011),
where small stakes in one or two key companies allow the owner of the stakes be the ultimate
controller of the entire business group.
[Table 3 around here]
Finally, we summarize the correlations between our main variables in Table 3. The
number of sons is positively correlated with operating income volatility, whereas the correlation
coefficients for the number of daughters and sons-in-law are close to zero. These univariate
results are largely in line with our predictions.
4 Results
4.1 Succession Tournaments and Risk-taking in Korean Chaebols
In Table 4, using firm-level cross-sectional regressions, we test our H1 to discover how
succession tournaments among sons affect corporate risk-taking in chaebols. In Column 1 of the
table, we regress each firm’s income volatility measured over a 7-year window around 2004 on
the number of sons in the chair+1 generation of the business group that the firm belongs to.
Following Bertrand et al. (2008), we control for the log of total assets and group age and cluster
the standard errors at the business group level. The estimated effect of sons’ succession
tournaments is both economically and statistically significant. Column 1 shows that for a one
standard deviation increase in the number of sons in the chair+1 generation, the risks of group-
affiliated entities increase by 5.39% (5.39=1.35395*3.98). In Columns 2 and 3, we repeat the

19
same analysis using different corporate risk proxies ─ sales and cash flow volatilities; we find
similar 8.18% to 9.35% impacts on these alternative risk measures. In both columns, the number
of sons in a chaebol family significantly increases corporate risks at the 5% statistical
significance level.15
[Table 4 around here]
In Columns 4 and 5, we conduct several placebo tests and identification tests for our
underlying economic stories. We count the sons who are not eligible for the succession games: (1)
sons below age 15, who cannot legally work in Korea, and (2) male relatives in the current chair
generation whose succession tournaments are officially over as of 2004. We find that the
presence of these sons reduces rather than increases corporate risks. For example, in Column 4,
where we use the number of sons younger than 15, sons’ effects on risks are negative (-6.07218)
and statistically significant at the 1% level. Similar negative effects (-0.09311) are found for
bloodline male relatives in the chair generation (column 5). These results confirm that the results
shown in Columns 1 to 3 are not driven by sons who are uninvolved in the succession
tournaments. Moreover, the Column 5 result effectively eliminates the possibility that the results
in Columns 1 to 3 are driven by any background risk defined at the current chair generation, i.e.,
the father’s effects, not the sons'.
In the remaining columns of Table 4, we conduct several conditional tests that are based
on the “tournament” view of chaebol succession. Tournament incentives are high when players
are symmetric in their competitive positions (Hvide, 2002). Sibling rivalry is also high when the
15 All our results are robust to various alternative specification tests, including the use of residual volatility from SIC one-digit-level industry-fixed effect regressions, scaling the measured volatilities by total assets, and dropping the largest family outliers from our testing sample, among others. These results are available on request.
20
age gap among sons is narrow (Sulloway, 2001; see also our A1). In general, the more convex
the payoff structure of the tournament reward is, the more severe competitions are among
contestants. In Columns 6 to 8, we test these general predictions based on tournament theories.
When the age gap between sons is small, corporate risks increase sharply with the number of
sons in the family (column 6). Deep ownership pyramids imply a steep, option-like payoff for
the winner of the succession tournament. Column 7 confirms greater risk-taking incentives for
the sons of highly pyramidal family business groups. The pyramidal depth of a business group is
measured as the difference between the maximum and minimum position values of group
member firms. Lastly, in Column 8, we find severe risk-taking in highly reputable chaebols
whose total assets belong to the top one-third of our sample. This result is consistent with the
notion that succession tournaments are more intense when sons compete for the higher reputation
value of the family.
4.2 Marriage Effects
To examine the effects of family composition and a daughter’s marriage on corporate risk-taking,
we extend our baseline model, shown in Column 1 of Table 4. We add variables related to family
composition in the chair+1 generation to the right-hand-side (RHS) of our regression: (1) the
number of daughters (married and unmarried), (2) the number of sons-in-law, and (3) a marriage
dummy.
[Table 5 around here]
21
In Column 1 of Table 5, we first add the number of daughters in the chair+1 generation to
the RHS of our baseline regression. We find that income volatility decreases as the number of
daughters in a business group increases, whereas we find that the number of sons still
significantly increases income volatility. The point estimates of the sons’ (2.72425) and
daughters’ (-1.34747) effects on risks are both statistically significant at the 1% level.
Next, in Column 2 of Table 5, we decompose the number of daughters into unmarried
and married daughters (these two variables are standardized to have zero means and a standard
deviation of one), we find that married daughters' effects dominate unmarried daughters’ effects
both economically and statistically. The economic magnitude of the number of married
daughters is almost twice as large as that of the number of unmarried daughters. As we
hypothesize in H2, this could be a result of the positive externalities that sons-in-law bring in to
the family. When we directly test the effects of sons-in-law in Column 3, we consistently find
that they reduce corporate income volatility. This conclusion holds when we further control for
the stand-alone marriage effect in Column 4. There we add a marriage dummy that takes the
value of 1 if a given chaebol has at least one son-in-law in the chair+1 generation to the RHS of
our regression.
Finally, in Column 5 of Table 5, we test whether daughters’ marriages could discipline
the risk-shifting behaviors of sons in the chair+1 generation. In Column 5, we interact the
number of sons with the daughters’ marriage dummy. The point estimate of the interaction term
(-1.87041) implies that sons’ risk-taking incentives reduce by a net 66% (= -1.87041/2.82592)
when new sons-in-law join the family. The interaction effect is statistically significant at the 10%
level.

22
4.3 Performance
In Table 6, we report the correlation between family composition and operating performance.
Based on the tournament theory described in Section 2.2 and our risk-taking results from Tables
4 and 5, we expect that higher corporate risks are likely to be associated with excessive, unpriced
risks. As a result, we also expect negative performance consequences of the number of sons in
succession tournaments and positive impacts for the number of daughters and sons-in-law.
[Table 6 around here]
In Column 1 of Table 6, we regress each firm’s ROA on the number of sons in the
chair+1 generation of the business group the firm belongs to. As with our corporate risk
regressions, standard errors are clustered at the business group level, and we also control for the
log of total assets and group age. The point estimate of the number of sons is -0.32477, which is
statistically significant at the 5% level. All other variables being at their means, the estimate
implies a 1.29% (1.69=0.32477*3.98) decrease in operating performance when the number of
sons in the chair+1 generation increases by one standard deviation from its mean. This Column 1
result is consistent with Bertrand et al. (2008), who find similar operating inefficiency in Thai
family business groups when founders have many sons. We supplement and extend their
proposition on “race to the bottom” effects by providing evidence on a specific channel that
affects performance ─ the (at least in the short-run) excessive risk-taking by sons in succession
tournaments.
In Columns 2 and 3 of Table 6, we continue to examine whether our earlier risk-taking
results for the number of daughters and sons-in-law consistently explain group performance. In
both columns, we find positive, statistically significant performance effects for daughters

23
(0.37396) and sons-in-law (0.30189) in the current chair+1 generation. In Column 4 of the same
table, we further provide evidence that a daughter’s marriage mitigates performance inefficiency
induced by sons in succession tournaments. A statistically significant, positive point estimate of
the interaction term, Number of Sons × Daughters’ marriages, implies that performance
inefficiency could reduce by a net 69% (=0.51788/0.75254) when new sons-in-law join the
family. This is an economically significant effect.
In Columns 5 to 8 of Table 6, we repeat the analyses from Columns 1-4 using the residual
ROA, where the variable is measured as the difference between original ROA and the one-digit
SIC average of ROAs for all Korean firms in our full 2004 financial dataset. In Columns 5 to 8
we show results that are largely consistent with our earlier results.
4.4 Who Owns and Manages Chaebols?
In this section, we validate our key assumptions, A1 to A3. To this end, we examine who owns
and manages family business groups. Heirs who participate in succession tournaments are likely
to have both ownership and managerial positions in certain group firms, although those heirs
could indirectly influence the managerial decisions of other group firms that are controlled by
professional managers who ally with them in succession tournaments. To define the roles each
family member plays in succession tournaments, we analyze ownership and board positions held
by sons, daughters, and sons-in-law in the chair+1 generation. The variable of interest is the
proportion of family ownership (or board positions) held by sons [daughters and sons-in-law] in
the chair+1 generation. It is defined as the ratio of ownership (or the number of board positions)
held by sons [daughters and sons-in-law] in the chair+1 generation divided by the entire

24
ownership (or the number of board positions) held by all family members in a particular firm of a
business group. We control for the number of generations to address family supply side effects
on ownership and board positions. We cluster the standard errors at the business group level.
[Table 7 around here]
Table 7 reports the results. In Column 1 of Panel A, we find that family size is negatively
related to the number of family members with ownership, which is possibly due to the deep
pyramidal structure of a Koran chaebol, where the controlling family owns only small direct
stakes in several key firms. Column 2 of Panel A shows that, when we control for total family
size, the proportion of sons’ ownership increases with the number of sons. The estimated
coefficient of 2.49003 implies a marginal 2.5% higher group ownership for every marginal son
added to the family. This value is around 10 times bigger than the same value for daughters (0.25%
in column 3). Interestingly, Column 4 shows no significant relation between the number of sons-
in-law and their proportional ownership.
In Panel B, we examine family board positions. In Column 1, we show that family size is
positively related to the number of family members with a board position, implying that the
family’s control influence goes beyond their ownership level. Column 2 of Panel B shows that
when we control for total family size, the proportion of sons’ board positions increases sharply
with the number of sons. The point estimate of 2.32067 implies that with one extra son in the
family, 2.3% more board positions are held by sons. Columns 3 (and 4) of the same panel report
no significant relation between the number of daughters (sons-in-law) and their proportional
board positions. However, in Panel C, we find a positive relation between the number of family
owners and the number of family members with a board position, and male family members such

25
as sons and sons-in-law have a strong positive relation between their proportion of ownership
and their board positions. However, we still find no such evidence for daughters; their ownership
does not lead to the managerial participation.
Summing up, we confirm in Table 7 that sons both own and manage the family business
(A1). Daughters have ownership yet do not hold managerial positions commensurate with their
ownership (A2), whereas external male members like sons-in-law are tapped for managerial
positions despite their lack of ownership (A3). When they participate in the family business, they
seem to own some of the business, though. The fact that sons-in-law show a strong relation
between ownership and managerial participation implies that sons-in-law whose ownership is
supplemented by their wife’s ownership may put pressure on the laggard sons in succession
tournaments. Such external disciplining effects on the laggard heirs could spill over to the
leading sons in the tournaments, thereby mitigating excess risk-taking by sons in succession
tournaments. Our results in Table 7, put together, suggest the strong cultural influence of the
Confucian culture in Korea on the business and succession practices employed by chaebol
families.
4.5 Succession Tournaments and Managerial Myopia
Tournaments by definition are more likely in a finite-period game. However, Cabral (2003)
shows that even in an infinite period game, a sufficiently small discount factor guarantees
tournament incentives spill over to longer time periods. If true, in every period, contestants in the
tournament exhibit myopia in their decisions. In Table 8, we investigate this possibility (our H3).
We expect sons in the chair+1 generation to prefer short-term wealth gains to long-term
26
investment commitments. Those sons can cash out corporate resources quickly from the firms in
which they already have high ownership stakes, and then spend the money to accumulate stakes
in other strategically important group member firms. We do not necessarily expect the same
behavior for the male relatives in the current chair generation, whose succession tournaments are
officially over.
[Table 8 around here]
Table 8 reports our results. Short-term wealth gains are measured with the payout ratio.
We use long-term R&D expenses as a proxy for long-term investment commitment. We create a
dummy variable for firms with a son’s ownership and test whether sons exhibit managerial
myopia in those firms. Regression specifications are similar to our other regressions.
In Column 1, we show that the number of sons in the chair+1 generation has a negative
correlation with payout ratio. In Column 2, however, where the son’s ownership dummy variable
is interacted with the number of sons variable, we find a positive, statistically significant point
estimate of 3.75937 at the 5% level. In Columns 3 and 4, where we repeat the Columns 1 and 2
analyses for male, bloodline relatives in the current chair generation, we do not find such short-
term payout preferences.
When we test sons’ long-term R&D investment behaviors, in Columns 5 and 6, we find
negative point estimates for both the number of sons in the chair+1 generation and its interaction
term with the son’s ownership dummy. The point estimate of the interaction term (-52.17473) is
statistically significant at the 1% level, which indicates that sons in the chair+1 generation avoid
long-term investment commitments when their tournament outcomes are still uncertain. In
Columns 7 and 8, we find no similar, significant trend of cutting R&D expenses among male

27
relatives in the current chair's generation. R&D results seem more likely to be concerns for the
heir-generations.
4.6 Other Conditional Tests
In Table 9, we present the results of several conditional tests conducted to further ensure that our
results identify the effects of succession tournaments. Risk-taking is relatively more limited in
public firms than in private firms due to regulatory requirements. Thus we expect greater
tournament effects on risk-taking in a group's private firms. In Columns 1 and 2 of Table 9, we
split the sample into public and private firms and re-run our analysis. We find that sons are more
likely to take extra risks in less-regulated private firms where a substantial degree of managerial
discretion is allowed.
[Table 9 around here]
We also expect sons' risk-taking behaviors to be reduced over generations, because the
gap between leader and laggards has loosened overtime as the family tree expands in the
horizontal dimension. Moreover, it could arguably be true that an heir selected by the founder of
the corporate empire is most rewarded from a reputation point of view. We split the sample into
groups that have their founder as the current chair and groups that do not. Columns 3 and 4 of
Table 9 show that the number of sons has the most positive relation with corporate risks when
the founder is the current group chairperson.
In Columns 5 to 8 of the same table, we examine how different types of marriages affect
sons’ risk-taking incentives. Columns 5 and 6 compare a powerful chaebol marriage

28
(Bunkanwanicha et al., 2013) to a non-chaebol marriage. The chaebol marriage dummy equals
one if a particular business group has at least one son-in-law from a chaebol family in the current
chair+1 generation. The results, presented in Columns 5 and 6, show that a chaebol marriage
more effectively mitigates sons’ risk-taking behavior than a non-chaebol marriage. Sons tend to
suffer reputation damage when sons-in-law from rival chaebols outperform them managerially.
In Columns 7 and 8, we further compare a recent marriage (one that has taken place in the five
years prior to 2004) to an old marriage (one that occurred more than five years before 2004). We
find that a recent marriage more effectively reduces corporate risks, which is consistent with the
notion that the disciplining effect of sons-in-law on sons in tournaments is greater for a newly
joining son-in-law, as he is less likely to have formed a coalition with the sons in succession
tournaments.
4.7. Natural Experiment: The Sudden Death of a Hyundai Chairman
One concern from previous tests is whether the positive relation between the number of
succession contestants (i.e., the number of adult sons) and firm volatility is causal. In order to
address this issue, we examine changes in firms' riskiness surrounding the sudden death of a
group chairman. We examine the effects of the death of Mong-hun Chung, who became the
chairman of the Hyundai Group in 1998 and committed suicide on August 4th, 2003. Succession
tournaments exogenously reopened to the c-generation male relatives (i.e., Mong-hun’s brothers)
following this event. Using this exogenous increase in the number of sons in the Hyundai
succession tournament, we estimate the causal impact of succession competition on corporate
risk-taking using a difference in difference in differences (DiDiD) test setup.

29
The dependent variable of our regression is the change in a firm’s riskiness, for which we
use change in income volatility measured by the difference of 5-year income volatility before
and after the chairman’s death.16 We exclude the year 2004, as well as the firms that were
directly controlled by the chairman who died suddenly, to avoid any confounding effect, namely
the increasing business uncertainty around the CEO’s sudden death. We cluster standard errors
at the business group level.
[Table 10 around here]
In Columns 1 and 2 of Table 10, we assume that chair generation (i.e., the generation of
Mong-hun) bloodline male relatives are back in the succession tournament, competing with sons
in the c+1 generation. The variable – Number of New Sons in Tournament (add c-generation) –
is zero for all groups but Hyundai. For the Hyundai Group, the variable is the number of sons in
the current chair generation (= the total number of sons in the current chair and current chair+1
generations − the number of sons in the current chair+1 generation). When the number of sons in
the tournament exogenously increases, group entities’ risk increases. In Column 1, the economic
magnitude of this increasing competition effect is 0.78378% for every marginal increase in the
number of sons who newly join this reopened succession tournament. In Column 2, we further
control for the change in 5-year average log total assets before and after Mong-hun’s death on
the RHS, and find similar results.
To further tease out the succession tournament effects within the Hyundai Group, in
Column 3, we partition the Hyundai affiliates into (1) firms controlled by the brothers of Chung
16 Because Mong-hun Chung became the group chairman in 1998, we use the 5-year window before and after Mong-hun’s death in 2003 for our volatility estimation. Our results are virtually unchanged when we instead use the 7-year estimation window as we did in our earlier analyses. These results are available on request.

30
Mong-hun, the chairman who died suddenly, and (2) firms controlled by Mong-hun’s uncles,
who are in the same generation as the founder, Chung Ju Young, Mong-hun’s father. When
Chung Mong-hun was appointed as group chairman, his brothers were strong competitors
(Asiaweek, June 16, 2000).17 For them, Mong-hun’s death was a second chance, with a realistic
possibility of winning the succession game. However, the (c-1) generation males were least
likely to be involved in the succession tournaments after Chung Mong-hun’s death because they
were in the same generation as the founder, Chung Ju Young.
Using this additional layer of difference, we run a DiDiD regression. The variable,
Number of New Sons in Tournament (add c-generation), is now decomposed into (1) Number of
New Sons in Tournament (add c) × Strong Contender and (2) Number of New Sons in
Tournament (add c) × Weak Contender. Strong Contender is an indicator for the Hyundai firms
controlled by Mong-hun’s brothers in the c-generation, whereas Weak Contender indicates the
Hyundai firms controlled by Mong-hun’s uncles in the (c-1) generation. This within-Hyundai-
Group analysis shows that the increasing number of sons in the succession tournament increases
corporate risks, particularly for the group entities managed by Mong Hun’s brothers. This DiDiD
effect of Number of New Sons in Tournament (add c) × Strong Contender (0.89004) is
statistically significant at the 1% level, whereas we find insignificant income volatility change
for Hyundai-affiliated firms managed by the founder's brothers (0.24085). This result sharply
identifies succession effects on corporate risk-taking in Korean chaebols.
In Columns 4 to 6, we repeat the same analysis with a different assumption, that the chair
generation male relatives replace sons in the c+1 generation. That means we take the difference
17
Laxmi Nakarmi, “Of Father and Sons.” Asiaweek June 16 2000.

31
in the numbers of sons in the c and c+1 generations, and use it as an exogenous variation in the
number of sons in succession tournaments. Both difference in differences (DiD) (Columns 4 and
5) and DiDiD (Column 6) tests confirm our earlier findings shown in Columns 1- 3. In Columns
7 to 9, we simply use a Hyundai Event indicator as an alternative explanatory variable and re-run
the DiD and DiDiD analyses. Our results are robust to this alternative specification.
Overall, our findings in Table 10 suggest that the sudden death of the Hyundai Group
chairman, which exogenously increases the competition in succession tournament, results in
significant increase in corporate risks. This effect is likely causal.
Further Discussions on Potential Channels of Sons’ Risk-taking
What are the potential channels of risk-taking by sons in succession tournaments?
Corporate risks could increase (or reduce) in various ways that may or may not be directly
observable. One potential channel of risk-taking that is both observable and relevant to earlier
performance inefficiency results (Table 6) is overinvestment or empire-building by sons, which
could, to a certain extent, to be reflected in massive merger and acquisition (M&A) attempts. It is
difficult to define overinvestment without knowing the optimal level of investment; however, to
examine the possibility that sons in succession tournaments could behave like risk-seeking
empire-builders, we investigate their M&A transactions in Table 11. We retrieve M&A data
from Thomson Reuters SDC Platinum.
[Table 11 around here]

32
We employ the same empirical specification as in Table 10 based on the sudden death of
the Hyundai Group chairman Mong-hun Chung. We test whether newly joining contestants in
this exogenously reopened succession tournament show empire-building incentives. We use the
change in the total amount of M&A transactions 5 years before and after Mong-hun’s death in
2003 as a dependent variable (Panel A), or the change in 5-year average number of M&A
transactions before and after his sudden death (Panel B). We focus only on large deals whose
transaction amounts exceed 50 million US dollars.
Panels A and B of Table 11 show that exogenous change in the number of sons in
succession tournaments induces larger M&A transactions in terms of deal amounts and
frequencies. Such trends are primarily driven by Mong-hun’s brothers following his sudden
death. For instance, in Column 9 of Panel A, the DiDiD effect of Hyundai Event × Strong
Contender is 235.00725 million US dollars, whereas we find a significant decrease in total M&A
transaction amounts over the same period for group firms managed by Mong-hun’s uncles (-
112.15200). A similar tendency is found in Panel B, where we inspect the number of M&A
transactions; in Column 9, we find that in firms managed by Mong-hun’s brothers, the annual
average number of large M&A transactions increases by 0.43674 (i.e., approximately 2 more
large M&A transactions in the post-5 year period), whereas fewer transactions are initiated by
his uncles (-0.25600).
In summary, we find a significant increase in the operating risk of the firms managed by
Strong Contenders (i.e., Mong-hun’s brothers) in Hyundai Group following the group chair’s
death (Table 10), which coincides with the expansionary investment policies of his brothers.

33
Such connections could indicate how the primary risk-taking moves are potentially played by
sons who are suddenly re-invited to the group succession tournament due to a brother’s death.
5 Conclusion
We study the impact of succession tournaments on risk-taking incentives in Korean family
business groups. Consistent with theories documented in the tournament and risk-taking
literature, we find that business groups with more sons tend to have higher income volatility. In
contrast, business groups with more daughters tend to have lower income volatility. We show
that these risks are (at least in the short-run) excessive and unpriced – a greater number of sons
(daughters) in a group leads to lower (higher) performance outcomes. These effects are strongest
in opaque business groups with a highly concentrated equity control structure. We also find
evidence consistent with managerial myopia in tournament contestants. We show that firms
owned by sons in succession tournaments have greater dividend payouts but invest less in long-
term investment projects. Overall, our findings are consistent with the notion that succession
tournaments lead to risk-shifting behaviors that may be mitigated by the externalities that outside
family member (sons-in-law) bring to the family.
Our results emphasize the importance of human capital risk in family-run business groups.
In particular, negative externalities among potential heirs could have large social costs as these
family business groups represent a substantial part of the world's wealth. Indexing heirs’
performance to a higher external standard could be a way to regulate succession-related
managerial dysfunctions. We show that the cross-sectional expansion of a wealthy family
through marriages is one way to overcome temporal family succession problems. However,

34
ultimately, the goal of our economic deliberation is to design an optimal succession plan for the
family business from a perspective taken for shareholders’ value. The plan will create
appropriate managerial incentives for the heirs of these socially, politically, and economically
important business organizations around the world. As the groups are controlled by “families,”
our work further emphasizes the cultural aspects that must be considered when such optimal
succession plans are discussed.
35
References Almeida, Heitor, Sang Yong Park, Marti G. Subrahmanyam, and Daniel Wolfenzon, 2011, The Structure and Formation of Business Groups: Evidence from Korean Chaebols, Journal of Financial Economics 99, 447-475. Adhikari, Binay K., Anup Agrawal, and James Malm, 2015, Do Women Stay Out of Trouble? Evidence from Corporate Litigation, Working paper. Anderson, Axel, and Luis Cabral, 2007, Go for broke or play it safe? Dynamic Competition with Choice
of Variance, RAND Journal of Economics 38, 593-609.
Bae, Kee-Hong, Jun-Koo Kang, and Jin-Mo Kim, 2002, Tunneling or Value Added? Evidence from
Mergers by Korean Business Groups, Journal of Finance 57, 2695-2740.
Baek, Jae-Seng, Jun-Koo Kang, and Inmoo Lee, 2006, Business Groups and Tunneling: Evidence from
Private Securities Offerings by Korean Chaebols, Journal of Finance 61, 2415-2449.
Bennedsen, Morten, Kasper Meisner Nielsen, Francisco Perez-Gonzalez, and Daniel Wolfenzon, 2007,
Inside the Family Firm: The Role of Families in Succession Decisions and Performance, Quarterly
Journal of Economics 12, 647-691.
Bertrand, Marianne, and Antoinette Schoar, 2006, The Role of Family in Family Firms, Journal of
Economic Perspectives 20, 73-96.
Bertrand, Marianne, Simon Johnson, Krislert Samphantharak, and Antoinette Schoar, 2008, Mixing Family with Business: A Study of Thai Business Groups and the Families behind Them, Journal of
Financial Economics 88, 466-498. Brown, Keith C., W.V. Harlow, and Laura T. Starks, 1996, Of Tournaments and Temptations: An Analysis of Managerial Incentives in the Mutual Fund Industry, Journal of Finance 51, 85-110. Bunkanwanicha, Pramuan. Joseph P.H. Fan, and Yupana Wiwattanakantang, 2013, The Value of
Marriage to Family Firms, Journal of Financial and Quantitative Analysis 48, 611-636.
Burkart, Mike, Fausto Panunzi, Andrei Shleifer, 2003, Family Firms, Journal of Finance 58, 2167-2202.
Cabral, Lu´is M. B., 2003, R&D Competition When Firms Choose Variance, Journal of Economics &
Management Strategy 12, 139-150. Chevalier, Judith, and Glenn Ellison, 1997, Risk Taking by Mutual Funds as a Response to Incentives,
Journal of Political Economy 105, 1167-1200.
Cronqvist, Henrik, and Frank Yu, 2015, Shaped by Their Daughters: Executives, Female Socialization, and Corporate Social Responsibility, Working paper. Faccio, Mara, Maria-Teresa Marchica, and Roberto Mura, 2015, CEO Gender, Corporate Risk-Taking, and the Efficiency of Capital Allocation, Working paper.
36
Goel, Anand M. and Anjan V. Thakor, 2008. Overconfidence, CEO Selection, and Corporate Governance, Journal of Finance 63, 2737–2784. Hvide, Hans K., 2002, Tournament Rewards and Risk Taking, Journal of Labor Economics 20, 877-898. Joh, Sung Wook, 2003, Corporate Governance and Firm Profitability: Evidence from Korea before the
Economic Crisis, Journal of Financial Economics 68, 287-322.
Kempf, Alexander, and Stefan Ruenzi, 2008. Tournaments in Mutual-Fund Families, Review of Financial
Studies 21, 1013-1036.
Kini, Omesh, and Ryan Williams, 2012, Tournament Incentives, Firm Risk, and corporate Policies,
Journal of Financial Economics 103, 350-376.
La Porta, Rafael, Florencio López de Silanes, and Andrei Shleifer, 1999, Corporate Ownership around the
World, Journal of Finance 54, 471-517.
Mehrotra, Vikas, Randall Morck, Jungwook Shim, and Yupana Wiwattanakantang, 2013, Adoptive Expectations: Rising Sons in Japanese Family Firms, Journal of Financial Economics 108, 840-854. Nguyen, Vinh, 2015, Does Your Daughter Make You a Better CEO?, Working paper. Ongena, Steven, and Alexander Popov, 2015, Gender Bias and Credit Access, Working paper. Pérez-González, Francisco, 2006, Inherited Control and Firm Performance, American Economic Review
96, 1559-1588.
Roussanov, Nikolai, 2010, Diversification and Its Discontents: Idiosyncratic and Entrepreneurial Risk in the Quest for Social Status, Journal of Finance 65, 1755-1788. Sulloway, Frank J., 2001, Birth Order, Sibling Competition, and Human Behavior, Conceptual
Challenges in Evolutionary Psychology 27, 39-83.
Taylor, Jonathan, 2003, Risk-taking Behavior in Mutual Fund Tournaments, Journal of Economic
Behavior & Organization 50, 373-383.

37
Table 1: Family Summary Statistics
The sample consists of Korea’s top 16 large business groups from 20 chaebol families designated by the Korean Fair
Trade Commission (KFTC) as of 2004. The number for observation is 20 families for Panel A and 16 business
groups for Panels B and C, except for a small fraction of family board positions, as three chaebol families do not
hold any board positions in their business group. Each variable is computed as the arithmetic average across firms in
a business group.
Panel A: Family size refers to the total number of direct and indirect descendants of the parents of a founder of a
business group and the founder’s parents themselves. Family size includes the founder’s siblings and descendants of
the founder’s siblings, and their spouses. Family members who are younger than 15 years as of 2004 are excluded.
The number of generations refers to the distance between the founder (generation 1) and the most recent generation
that is included in family size. The generation of the founder’s parents (generation 0) is excluded. The current chair's
generation refers to the generation to which the current chairman of a business group belongs. Current chair tenure
refers to the number of years the current chair of each business group has held the chairmanship since he was
officially appointed, as of 2004. The number of male family members refers to the total number of direct and
indirect male family members in a business group. The number of female family members refers to the total number
of direct and indirect female family members in a business group. The number of sons [daughters, sons-in-law, and
daughters-in-law] in the current chair+1 generation (c+1 generation) refers to the total number of sons [daughters,
sons-in-law, and daughters-in-law] of the current chair and the chair’s siblings. The founder dead is an indicator
variable that equals one if the founder is dead as of 2004, and zero otherwise.
Panels B and C: The number of family members with ownership (board positions) refers to the total number of family members that directly own (hold at least one board position) in a particular firm of a business group. Current chair+1 generation refers to the generation following the current chair’s. For the current chair+1 generation, the number of sons [daughters, sons-in-law, and daughters-in-law] with ownership (board positions) is the total number of sons [daughters, sons-in-law, and daughters-in-law] of the current chair and his/her siblings with ownership (board positions) in at least one of the group firms. The proportion of family ownership (board positions) held by sons [daughters, members] refers to the ratio of ownership (the number of board positions) held by sons [daughters, members] of the current chair and his/her siblings divided by the entire ownership (number of board positions) held by family members in a particular firm in a business group. For the current chair generation, male [female, married male, married female] family members indicate the current chair and the chair’s brothers [chair’s sisters, chair’s brothers-in-law, chair’s sisters-in-law]. In that generation, the number of male [female, married male, and married female] family members with ownership (board positions) refers to the total number of male [female, married male, and married female] family members with ownership (board positions) in at least one of the group firms. The proportion of family ownership (board positions) held by male [female, married male, and married female] family members refers to the ratio of ownership (the number of board positions) held by male [female, married male, and married female] family members in the current chair and his/her siblings generation divided by the entire ownership (number of board positions) held by family members in a particular firm in a business group.
Panel A: Family characteristics N Mean Std. Dev Min Median Max
Family size 20 54.35 32.22 15 48 143
Number of generation 20 3.05 0.60 2 3 4
Current chair generation 20 1.85 0.67 1 2 3
Current chair tenure (years) 20 13.75 10.96 0 10 38
Number of male family members 20 27.40 15.21 7 28 69
Number of female family members 20 24.70 16.07 7 20 74
Number of sons (c+1 generation) 20 6.85 3.98 0 6 15
Number of daughters (c+1 generation) 20 5.40 4.06 0 4 16
Number of sons in law (c+1 generation) 20 2.30 3.50 0 1 11
Number of daughters in law (c+1 generation) 20 2.05 3.05 0 0 9
Founder dead 20 0.80 0.41 0 1 1

38
Panel B: Involvement in ownership
N Mean Std. Dev Min Median Max
Number of family members with ownership 16 20.8 13.0 2 20 51
Current chair+1 generation
Number of sons with ownership 16 4.00 5.20 0 3 19
Number of daugeters with ownership 16 1.75 1.95 0 2 7
Number of sons in law with ownership 16 0.31 0.87 0 0 3
Number of daugeters in law with ownership 16 0.38 1.50 0 0 6
Fraction of family ownership held by sons 16 0.20 0.26 0 0 0.7
Fraction of family ownership held by daughters 16 0.03 0.04 0 0 0.1
Fraction of family ownership held by sons in law 16 0.00 0.01 0 0 0
Fraction of family ownership held by daughters in law 16 0.00 0.00 0 0 0
Current chair generation
Number of male family members with ownership 16 6.94 4.49 1 7 15
Number of female family members with ownership 16 1.50 1.86 0 1 5
Number of married male members with ownership 16 1.13 1.82 0 0 6
Number of married female members with ownership 16 0.94 1.44 0 0 4
Fraction of family ownership held by male family member 16 0.51 0.27 0 0 1.0
Fraction of family ownership held by female family member 16 0.04 0.10 0 0 0.4
Fraction of family ownership held by married male member 16 0.05 0.15 0 0 0.6
Fraction of family ownership held by married female member 16 0.02 0.04 0 0 0.1
Panel C: Involvement in board position
N Mean Std. Dev Min Median Max
Number of family members with board position 16 3.88 3.12 0.00 3 11.00
Current chair+1 generation
Number of sons with board position 16 0.63 1.15 0 0 4
Number of daughters with board position 16 0.13 0.50 0 0 2
Number of sons in law with board position 16 0.06 0.25 0 0 1
Number of daughters in law with board position 16 0.00 0.00 0 0 0
Fraction of family board position held by sons 13 0.16 0.25 0 0 1
Fraction of family board position held by daughters 13 0.02 0.06 0 0 0.2
Fraction of family board position held by sons in law 13 0.01 0.03 0 0 0.1
Fraction of family board position held by daugeters in law 13 0.00 0.00 0 0 0
Current chair generation
Number of male family member with board position 16 2.44 2.28 0 3 7
Number of female family member with board position 16 0.06 0.25 0 0 1
Number of married male member with board position 16 0.13 0.34 0 0 1
Number of married female member with board position 16 0.06 0.25 0 0 1
Fraction of family board position held by male family member 13 0.63 0.30 0 1 1
Fraction of family board position held by female family member 13 0.02 0.07 0 0 0.3
Fraction of family board position held by married male member 13 0.03 0.09 0 0 0.3
Fraction of family board position held by married female member 13 0.04 0.14 0 0 1

39
Table 2: Firm Summary Statistics
The sample consists of 287 firms that are legally required to submit a comprehensive summary report of their performance (equivalent to 10-K filings in the U.S.) and complete shareholder ownership from16 large Korean business groups designated by the Korean Fair Trade Commission (KFTC) as of 2004. Analysis is based on data compiled as of the year-end of 2004. In Panel A, Log of total assets refers to the logarithm of a firm’s total assets in millions of KRW. Log of sales refers to the logarithm of a firm’s total sales in millions of KRW. Leverage refers to a debt ratio calculated as a firm’s total debt divided by its total equity. ROA refers to the ratio of a firm’s earnings before interest and tax (EBIT) divided by its total assets. Operating income volatility refers to the standard deviation of the logarithm of a firm’s annual operating income from t-3 to t+3 periods. Sales volatility refers to the standard deviation of the logarithm of a firm’s annual sales from t-3 to t+3 periods. Cash-flow volatility refers to the standard deviation of the logarithm of a firm’s annual net operating cash flow from t-3 to t+3 periods. Public firm is an indicator variable that equals one if a firm is listed on the KOSPI or KOSDAQ exchange, and zero otherwise. Firm age is the age of a firm in a business group as of 2004. Panel B shows the ownership structure of sample firms based on KFTC reports. Group chair ownership refers to the average percentage of direct ownership held by a group chairperson in a business group. Family ownership refers to the average percentage of direct ownership held by founding family members except the chairperson in a business group. Subsidiary ownership refers to the average percentage of direct ownership held by subsidiaries in a business group. Position refers to the distance between the family and a firm in a business group; a value of 1 indicates that the firm is directly controlled by founding family. Cash-flow right refers to the sum of direct equity ownership held by the founding family after excluding treasury stocks and cross shareholdings. Voting right refers to the ratio of the maximum number of stocks that founding family members can exercise for voting divided by the total number of the group’s outstanding stocks. Discrepancy between ownership and control refers to the gap between cash-flow rights and voting rights.
Panel A: Financial characteristics
Number of firms Mean Std. Dev Min Median Max
Log of total assets 287 12.72 2.15 7.43 13 17.88
Log of sales 279 12.55 2.28 5.11 12 17.79
Leverage 287 0.56 0.24 0.01 1 1.13
ROA 284 0.06 0.09 -0.29 0.06 0.57
Dividend paid/Total asset 287 0.01 0.03 0 0 0.29
Cash holding/Total asset 287 0.07 0.10 0 0.04 0.52
Operating income volatility (t-3~t+3) 286 0.67 0.51 0 0.51 3.06
Sales volatility (t-3~t+3) 285 0.40 0.40 0 0.29 3.33
Cashflow volatility (t-3~t+3) 282 0.60 0.41 0 0.49 2.40
Public firm (dummy) 287 0.34 0.48 0 0 1
Firm age 287 21.32 15.37 1 18 72
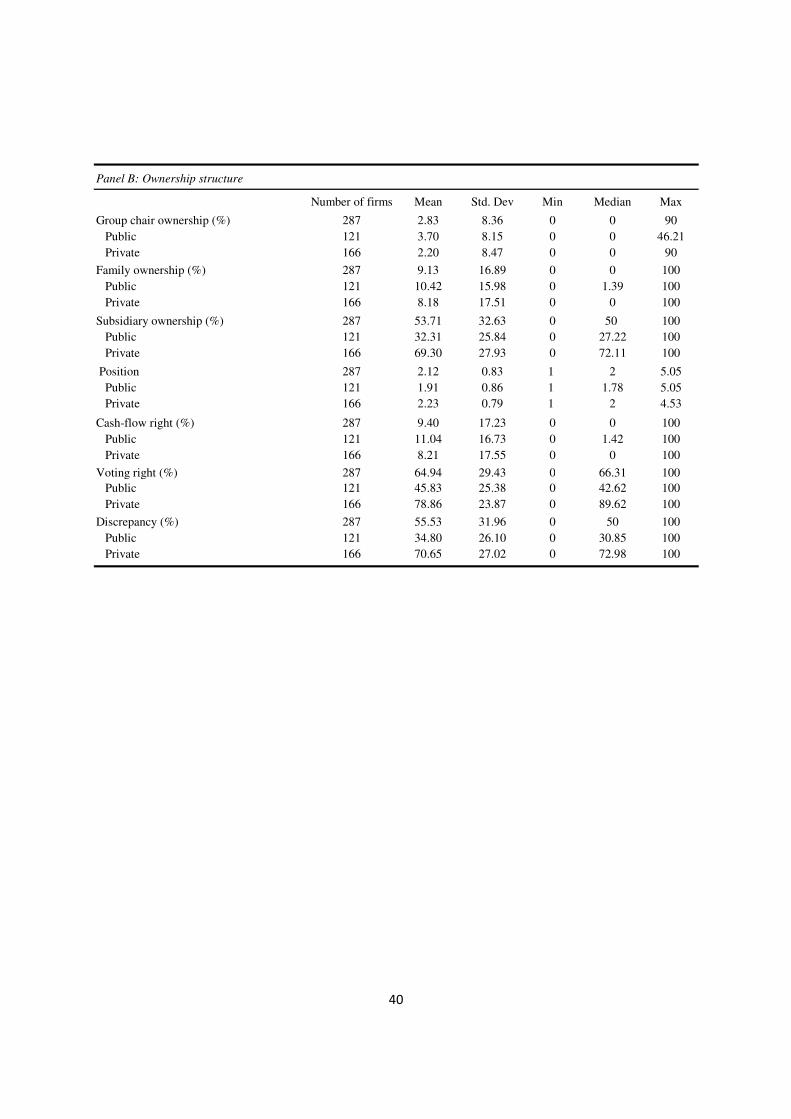
40
Panel B: Ownership structure
Number of firms Mean Std. Dev Min Median Max
Group chair ownership (%) 287 2.83 8.36 0 0 90
Public 121 3.70 8.15 0 0 46.21
Private 166 2.20 8.47 0 0 90
Family ownership (%) 287 9.13 16.89 0 0 100
Public 121 10.42 15.98 0 1.39 100
Private 166 8.18 17.51 0 0 100
Subsidiary ownership (%) 287 53.71 32.63 0 50 100
Public 121 32.31 25.84 0 27.22 100
Private 166 69.30 27.93 0 72.11 100
Position 287 2.12 0.83 1 2 5.05
Public 121 1.91 0.86 1 1.78 5.05
Private 166 2.23 0.79 1 2 4.53
Cash-flow right (%) 287 9.40 17.23 0 0 100
Public 121 11.04 16.73 0 1.42 100
Private 166 8.21 17.55 0 0 100
Voting right (%) 287 64.94 29.43 0 66.31 100
Public 121 45.83 25.38 0 42.62 100
Private 166 78.86 23.87 0 89.62 100
Discrepancy (%) 287 55.53 31.96 0 50 100
Public 121 34.80 26.10 0 30.85 100
Private 166 70.65 27.02 0 72.98 100

41
Table 3: Correlation
Table 3 reports correlations among the main variables summarized in previous tables for all our sample firms. Family size refers to the total number of direct and indirect descendants of the parents of the founder of a business group and the founder’s parents themselves. Family size includes the founder’s siblings and descendants of the founder’s siblings, and their spouses. Family members who are younger than 15 years as of 2004 are excluded. The number of descendants here refers to the current chair+1 generation, the generation following that of the current chairperson. The number of sons [daughters and sons-in-law] refers to the total number of sons [daughters and sons-in-law] of the current chair and his/her siblings. Group age refers to the number of years since the year of incorporation of a business group as of 2004. Operating income volatility refers to the standard deviation of the logarithm of a firm’s annual operating income from t-3 to t+3 periods. Log of sales refers to the logarithm of a firm’s total sales in millions of KRW. ROA refers to the ratio of a firm’s earnings before interest and tax (EBIT) divided by its total assets. Payout ratio refers to the ratio of a firm’s net dividends paid divided by its net income.
(1) (2) (3) (4) (5) (6) (7) (8) (9)
(1) Family size 1.00
(2) Number of sons 0.42 1.00
(3) Number of daughters 0.65 0.74 1.00
(4) Number of sons in law 0.47 0.66 0.92 1.00
(5) Group age 0.08 0.14 0.15 0.30 1.00
(6) Operating Income (t-3~t+3) Volatility ( × 100) -0.04 0.09 0.00 0.01 0.01 1.00
(7) Log of total assets 0.04 0.01 0.00 -0.03 0.04 -0.11 1.00
(8) ROA -0.02 -0.13 -0.01 -0.03 -0.04 -0.25 -0.05 1.00
(9) Payout ratio -0.11 -0.15 -0.14 -0.08 0.14 -0.15 0.04 0.17 1.00
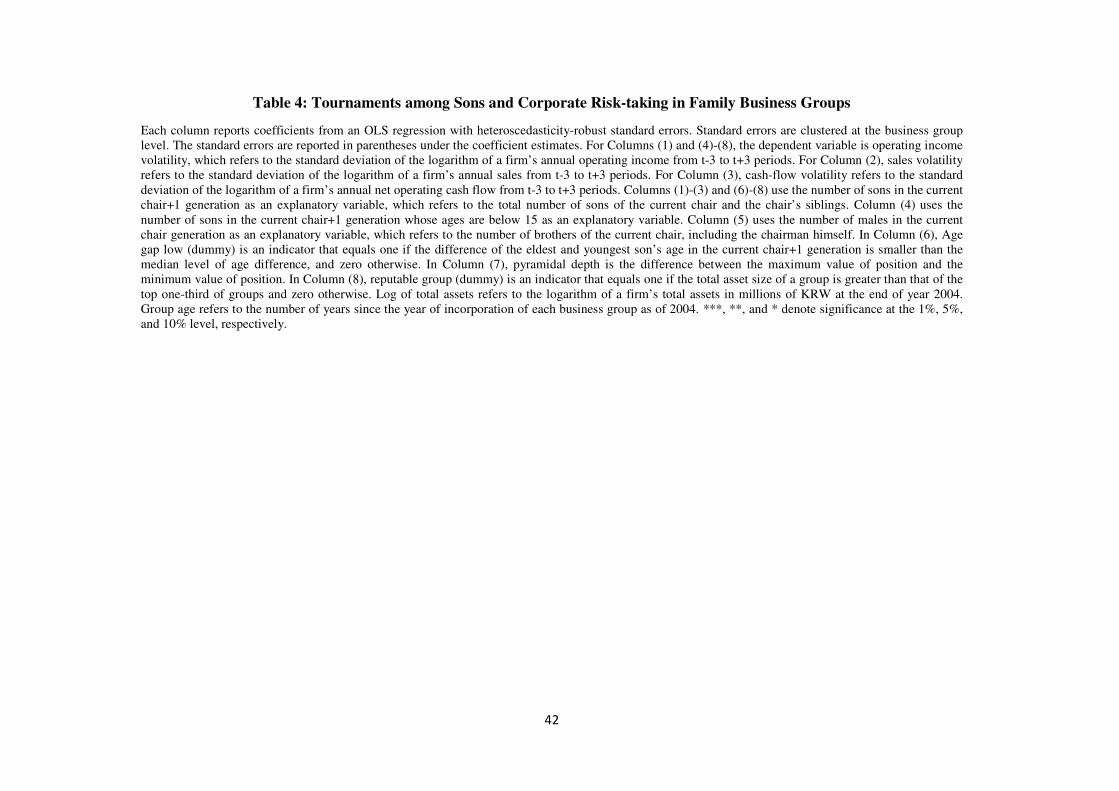
42
Table 4: Tournaments among Sons and Corporate Risk-taking in Family Business Groups
Each column reports coefficients from an OLS regression with heteroscedasticity-robust standard errors. Standard errors are clustered at the business group level. The standard errors are reported in parentheses under the coefficient estimates. For Columns (1) and (4)-(8), the dependent variable is operating income volatility, which refers to the standard deviation of the logarithm of a firm’s annual operating income from t-3 to t+3 periods. For Column (2), sales volatility refers to the standard deviation of the logarithm of a firm’s annual sales from t-3 to t+3 periods. For Column (3), cash-flow volatility refers to the standard deviation of the logarithm of a firm’s annual net operating cash flow from t-3 to t+3 periods. Columns (1)-(3) and (6)-(8) use the number of sons in the current chair+1 generation as an explanatory variable, which refers to the total number of sons of the current chair and the chair’s siblings. Column (4) uses the number of sons in the current chair+1 generation whose ages are below 15 as an explanatory variable. Column (5) uses the number of males in the current chair generation as an explanatory variable, which refers to the number of brothers of the current chair, including the chairman himself. In Column (6), Age gap low (dummy) is an indicator that equals one if the difference of the eldest and youngest son’s age in the current chair+1 generation is smaller than the median level of age difference, and zero otherwise. In Column (7), pyramidal depth is the difference between the maximum value of position and the minimum value of position. In Column (8), reputable group (dummy) is an indicator that equals one if the total asset size of a group is greater than that of the top one-third of groups and zero otherwise. Log of total assets refers to the logarithm of a firm’s total assets in millions of KRW at the end of year 2004. Group age refers to the number of years since the year of incorporation of each business group as of 2004. ***, **, and * denote significance at the 1%, 5%, and 10% level, respectively.

43
(1) (2) (3) (4) (5) (6) (7) (8)
Variables Sales Volatility CF Volatility Sons below age 15Sons in c-generation Son's age gap Pyramidal depth Reputable group
Number of sons (c+1 generation) 1.35395** 2.05450** 2.34986*** -6.07218*** -0.09311 0.91094 -0.70450 0.88010
[0.508] [0.844] [0.782] [1.386] [0.214] [0.581] [0.950] [0.543]
Number of sons (c+1 gen.) x Age gap low 2.19219**
[0.943]
Age gap low (dummy) -10.00719
[9.930]
Number of sons (c+1 gen.) x Pyramidal depth 0.61212**
[0.261]
Pyramidal depth -9.32298***
[2.357]
Number of Sons (c+1 gen.) x Reputable group 1.73863*
[0.966]
Reputable group (dummy) -10.26824
[8.810]
Log total assets -2.26369* -2.10943 -2.78809** -2.10619 -2.21222 -2.27209 -2.28543 -2.21890
[1.279] [1.275] [1.052] [1.383] [1.314] [1.333] [1.353] [1.329]
Group age 0.04057 -0.32180 -0.27958 0.22788* 0.09164 0.04844 0.20407 0.06912
[0.182] [0.261] [0.250] [0.109] [0.154] [0.155] [0.136] [0.167]
Constant 82.31033*** 68.02715** 91.77584*** 88.46039*** 91.26098*** 84.81790*** 107.34586*** 83.79638***
[22.939] [26.281] [24.426] [20.989] [23.536] [20.681] [23.483] [21.366]
Observations 275 285 282 275 275 275 273 275
R-squared 0.017 0.046 0.062 0.024 0.010 0.023 0.026 0.020
Dependent Variable: Income (t-3~t+3) Volatility ( × 100)

44
Table 5: Tournaments by Sons, Daughters’ Marriage, and Risk Reduction
Each column reports the coefficients from an OLS regression with heteroscedasticity-robust standard errors. Standard errors are clustered at the business group level. The standard errors are reported in parentheses under the coefficient estimates. Operating income volatility is computed as the standard deviation of the logarithm of a firm’s annual operating income from t-3 to t+3 periods. Number of sons in (c+1 generation) refers to the total number of sons of the current chair and his/her siblings. The number of daughters in (c+1 generation) refers to the total number of daughters of the current chair and the chair’s siblings. In Column (2), the number of daughters in (c+1 generation) is decomposed into unmarried daughters and married daughters in the chair+1 generation. The number of married daughters (c+1 generation) is equivalent to the number of sons-in-law (c+1 generation) which refers to the number of indirect (married in) male descendants of the chair and his/her siblings. All explanatory variables in Column (2) are standardized, and therefore, their point estimates represent economic magnitudes of their effects. Daughter’s marriage is a dummy that equals one if a particular business group has at least one son-in-law in the current chair +1 generation, and zero otherwise. Log of total assets refers to the logarithm of a firm’s total assets in millions of KRW at the end of 2004. Group age refers to the number of years since the year of incorporation of each business group as of 2004. ***, **, and * denote significance at the 1%, 5%, and 10% level, respectively.
Variables (1) (2) (3) (4) (5)
Number of sons (c+1 generation) 2.72425*** 9.57604*** 2.23375*** 2.66236*** 2.82592***
[0.575] [1.953] [0.592] [0.576] [0.764]
Number of daughters (c+1 generation) -1.34747***
[0.378]
Number of unmarried daughters (c+1 gen., standardized) -3.22696**
[1.206]
Number of married daughters (c+1 gen., standardized) -5.69444***
[1.806]
Number of sons-in-law (c+1 generation) -1.04936** -1.94624***
[0.444] [0.531]
Number of sons × Daughters' marriage -1.87041*
[0.888]
Daughters' marriage (c+1 generation) 7.72676 10.83726
[5.429] [8.183]
Log total assets -2.26652 -4.81643 -2.33335 -2.31612 -2.19301
[1.335] [2.901] [1.354] [1.373] [1.359]
Group age 0.06722 0.51762 0.12737 0.17125 0.07564
[0.142] [2.194] [0.168] [0.124] [0.177]
Constant 80.13925*** 67.39359*** 75.63567*** 68.46488*** 71.04144**
[21.224] [1.591] [20.659] [19.615] [24.116]
Observations 275 275 275 275 275
R-squared 0.024 0.024 0.022 0.023 0.021
Dependent Variable: Income (t-3~t+3) Volatility ( × 100)

45
Table 6: Family Composition and Operating Performance
Each column reports the coefficients from an OLS regression with heteroscedasticity-robust standard errors. Standard errors are clustered at the business group level. The standard errors are reported in parentheses under the coefficient estimates. For columns (1)-(4), the dependent variable is ROA, which refers to the ratio of returns, calculated as a firm’s earnings before interest and tax (EBIT) divided by its total assets. For columns (5)-(8), the dependent variable is the alternative ROA measure, residual ROA, which refers to the difference between ROA and the one-digit SIC average ROA for all firms in the full sample. The number of sons [daughters and sons-in-law] in c+1 generation refers to the total number of sons [daughters and sons-in-law] of the current chair and his/her siblings. Daughter’s marriage is an indicator that equals one if a particular business group has at least one son-in-law in the current chair +1 generation, and zero otherwise. Log of total assets refers to the logarithm of a firm’s total assets in millions of KRW at the end of year 2004. Group age refers to the number of years since the year of incorporation of each business group as of 2004. ***, **, and * denote significance at the 1%, 5%, and 10% level, respectively.
Variables (1) (2) (3) (4) (5) (6) (7) (8)
Number of sons (c+1 generation) -0.32477** -0.70656*** -0.57790*** -0.75254*** -0.28835** -0.66893*** -0.53124** -0.71798***
[0.126] [0.151] [0.187] [0.226] [0.114] [0.152] [0.200] [0.241]
Number of daughters (c+1 generation) 0.37396*** 0.37278***
[0.112] [0.116]
Number of sons-in-law (c+1 generation) 0.30189* 0.28968
[0.154] [0.170]
Number of sons × Daughters' marriage 0.51788* 0.53108*
[0.251] [0.258]
Daughters' marriage (c+1 generation) -2.40291 -2.67202*
[1.736] [1.461]
Log total assets 0.06383 0.06886 0.08677 0.05181 -0.03878 -0.03376 -0.01676 -0.05319
[0.295] [0.309] [0.312] [0.301] [0.309] [0.327] [0.330] [0.320]
Group age -0.00202 -0.00961 -0.02709 -0.01410 -0.02313 -0.03069 -0.04719 -0.03477
[0.049] [0.036] [0.040] [0.043] [0.046] [0.032] [0 .035] [0.038]
Constant 8.44023 9.00611* 10.32913** 11.38151** 4.27631 4.84039 6.08879 7.33230
[4.903] [4.383] [4.264] [4.346] [5.084] [4.416] [4.182] [4.544]
Observations 284 284 284 284 284 284 284 284
R-squared 0.016 0.035 0.029 0.031 0.016 0.037 0.030 0.032
Dependent variable
ROA (×100) Residual ROA (×100)

46
Table 7: Who Owns and Manages Family Business Groups? Gender Effects in Succession
Each column reports the coefficients from an OLS regression with heteroscedasticity-robust standard errors. Standard errors are clustered at the business group level. The standard errors are reported in parentheses under the coefficient estimates. The sample consists of 90 firms that are directly owned by family members based on KFTC reports. Fraction of family ownership (board positions) in Panels A, B, and C considers the current chair+1 generation. The proportion of family ownership (board positions) held by sons [daughters and sons-in-law] refers to the ratio of ownership (the number of board positions) held by sons [daughters and sons-in-law] of the current chair and his/her siblings divided by the entire ownership (number of board positions) held by family members in a particular firm in the business group. The number of sons [daughters and sons-in-law] in c+1 generation refers to the total number of sons [daughters and sons-in-law] of the current chair and his/her siblings. The number of generation refers to the family's current generation, with the founder's generation being counted as the first generation. ***, **, and * denote significance at the 1%, 5%, and 10% level, respectively.
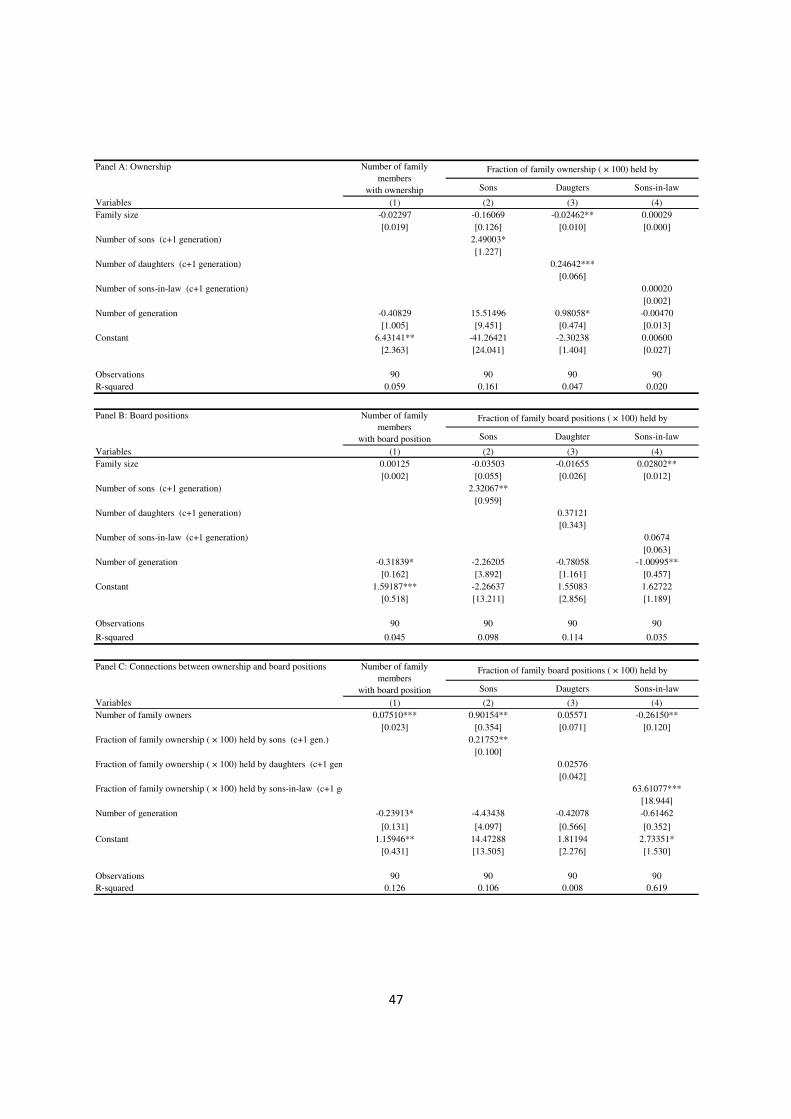
47
Panel A: Ownership
Sons Daugters Sons-in-law
Variables (1) (2) (3) (4)
Family size -0.02297 -0.16069 -0.02462** 0.00029
[0.019] [0.126] [0.010] [0.000]
Number of sons (c+1 generation) 2.49003*
[1.227]
Number of daughters (c+1 generation) 0.24642***
[0.066]
Number of sons-in-law (c+1 generation) 0.00020
[0.002]
Number of generation -0.40829 15.51496 0.98058* -0.00470
[1.005] [9.451] [0.474] [0.013]
Constant 6.43141** -41.26421 -2.30238 0.00600
[2.363] [24.041] [1.404] [0.027]
Observations 90 90 90 90
R-squared 0.059 0.161 0.047 0.020
Panel B: Board positions
Sons Daughter Sons-in-law
Variables (1) (2) (3) (4)
Family size 0.00125 -0.03503 -0.01655 0.02802**
[0.002] [0.055] [0.026] [0.012]
Number of sons (c+1 generation) 2.32067**
[0.959]
Number of daughters (c+1 generation) 0.37121
[0.343]
Number of sons-in-law (c+1 generation) 0.0674
[0.063]
Number of generation -0.31839* -2.26205 -0.78058 -1.00995**
[0.162] [3.892] [1.161] [0.457]
Constant 1.59187*** -2.26637 1.55083 1.62722
[0.518] [13.211] [2.856] [1.189]
Observations 90 90 90 90
R-squared 0.045 0.098 0.114 0.035
Panel C: Connections between ownership and board positions
Sons Daugters Sons-in-law
Variables (1) (2) (3) (4)
Number of family owners 0.07510*** 0.90154** 0.05571 -0.26150**
[0.023] [0.354] [0.071] [0.120]
Fraction of family ownership ( × 100) held by sons (c+1 gen.) 0.21752**
[0.100]
Fraction of family ownership ( × 100) held by daughters (c+1 gen 0.02576
[0.042]
Fraction of family ownership ( × 100) held by sons-in-law (c+1 gen 63.61077***
[18.944]
Number of generation -0.23913* -4.43438 -0.42078 -0.61462
[0.131] [4.097] [0.566] [0.352]
Constant 1.15946** 14.47288 1.81194 2.73351*
[0.431] [13.505] [2.276] [1.530]
Observations 90 90 90 90
R-squared 0.126 0.106 0.008 0.619
Number of family
members
with board position
Fraction of family board positions ( × 100) held by
Fraction of family ownership ( × 100) held byNumber of family
members
with ownership
Number of family
members
with board position
Fraction of family board positions ( × 100) held by
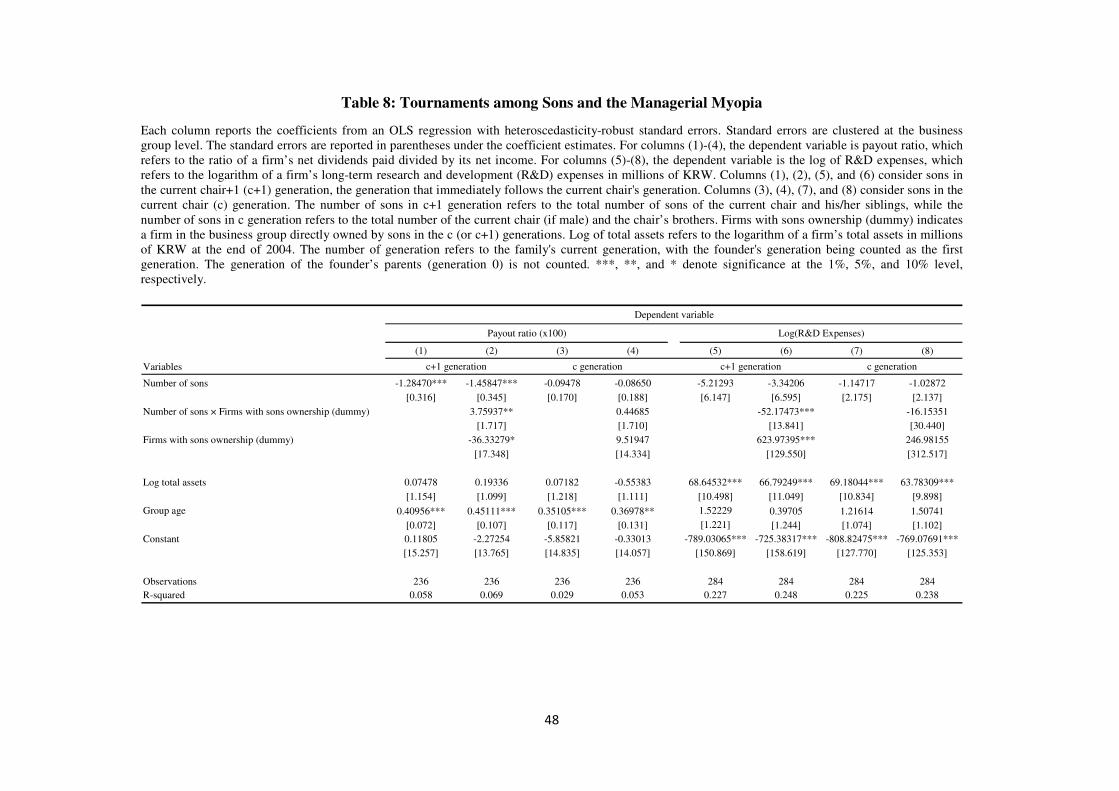
48
Table 8: Tournaments among Sons and the Managerial Myopia
Each column reports the coefficients from an OLS regression with heteroscedasticity-robust standard errors. Standard errors are clustered at the business group level. The standard errors are reported in parentheses under the coefficient estimates. For columns (1)-(4), the dependent variable is payout ratio, which refers to the ratio of a firm’s net dividends paid divided by its net income. For columns (5)-(8), the dependent variable is the log of R&D expenses, which refers to the logarithm of a firm’s long-term research and development (R&D) expenses in millions of KRW. Columns (1), (2), (5), and (6) consider sons in the current chair+1 (c+1) generation, the generation that immediately follows the current chair's generation. Columns (3), (4), (7), and (8) consider sons in the current chair (c) generation. The number of sons in c+1 generation refers to the total number of sons of the current chair and his/her siblings, while the number of sons in c generation refers to the total number of the current chair (if male) and the chair’s brothers. Firms with sons ownership (dummy) indicates a firm in the business group directly owned by sons in the c (or c+1) generations. Log of total assets refers to the logarithm of a firm’s total assets in millions of KRW at the end of 2004. The number of generation refers to the family's current generation, with the founder's generation being counted as the first generation. The generation of the founder’s parents (generation 0) is not counted. ***, **, and * denote significance at the 1%, 5%, and 10% level, respectively.
(1) (2) (3) (4) (5) (6) (7) (8)
Variables
Number of sons -1.28470*** -1.45847*** -0.09478 -0.08650 -5.21293 -3.34206 -1.14717 -1.02872
[0.316] [0.345] [0.170] [0.188] [6.147] [6.595] [2.175] [2.137]
Number of sons × Firms with sons ownership (dummy) 3.75937** 0.44685 -52.17473*** -16.15351
[1.717] [1.710] [13.841] [30.440]
Firms with sons ownership (dummy) -36.33279* 9.51947 623.97395*** 246.98155
[17.348] [14.334] [129.550] [312.517]
Log total assets 0.07478 0.19336 0.07182 -0.55383 68.64532*** 66.79249*** 69.18044*** 63.78309***
[1.154] [1.099] [1.218] [1.111] [10.498] [11.049] [10.834] [9.898]
Group age 0.40956*** 0.45111*** 0.35105*** 0.36978** 1.52229 0.39705 1.21614 1.50741
[0.072] [0.107] [0.117] [0.131] [1.221] [1.244] [1.074] [1.102]
Constant 0.11805 -2.27254 -5.85821 -0.33013 -789.03065*** -725.38317*** -808.82475*** -769.07691***
[15.257] [13.765] [14.835] [14.057] [150.869] [158.619] [127.770] [125.353]
Observations 236 236 236 236 284 284 284 284
R-squared 0.058 0.069 0.029 0.053 0.227 0.248 0.225 0.238
Dependent variable
c+1 generation
Payout ratio (x100) Log(R&D Expenses)
c generation c+1 generation c generation
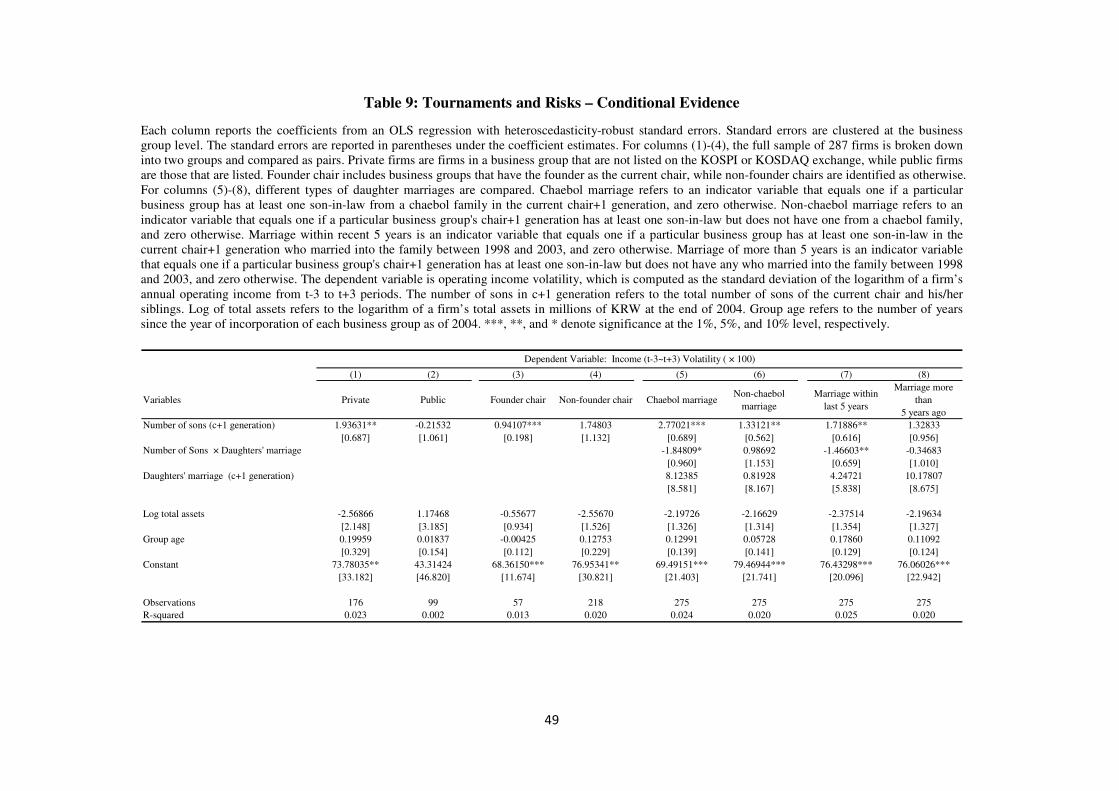
49
Table 9: Tournaments and Risks – Conditional Evidence
Each column reports the coefficients from an OLS regression with heteroscedasticity-robust standard errors. Standard errors are clustered at the business group level. The standard errors are reported in parentheses under the coefficient estimates. For columns (1)-(4), the full sample of 287 firms is broken down into two groups and compared as pairs. Private firms are firms in a business group that are not listed on the KOSPI or KOSDAQ exchange, while public firms are those that are listed. Founder chair includes business groups that have the founder as the current chair, while non-founder chairs are identified as otherwise. For columns (5)-(8), different types of daughter marriages are compared. Chaebol marriage refers to an indicator variable that equals one if a particular business group has at least one son-in-law from a chaebol family in the current chair+1 generation, and zero otherwise. Non-chaebol marriage refers to an indicator variable that equals one if a particular business group's chair+1 generation has at least one son-in-law but does not have one from a chaebol family, and zero otherwise. Marriage within recent 5 years is an indicator variable that equals one if a particular business group has at least one son-in-law in the current chair+1 generation who married into the family between 1998 and 2003, and zero otherwise. Marriage of more than 5 years is an indicator variable that equals one if a particular business group's chair+1 generation has at least one son-in-law but does not have any who married into the family between 1998 and 2003, and zero otherwise. The dependent variable is operating income volatility, which is computed as the standard deviation of the logarithm of a firm’s annual operating income from t-3 to t+3 periods. The number of sons in c+1 generation refers to the total number of sons of the current chair and his/her siblings. Log of total assets refers to the logarithm of a firm’s total assets in millions of KRW at the end of 2004. Group age refers to the number of years since the year of incorporation of each business group as of 2004. ***, **, and * denote significance at the 1%, 5%, and 10% level, respectively.
(1) (2) (3) (4) (5) (6) (7) (8)
Variables Private Public Founder chair Non-founder chair Chaebol marriageNon-chaebol
marriage
Marriage within
last 5 years
Marriage more
than
5 years ago
Number of sons (c+1 generation) 1.93631** -0.21532 0.94107*** 1.74803 2.77021*** 1.33121** 1.71886** 1.32833
[0.687] [1.061] [0.198] [1.132] [0.689] [0.562] [0.616] [0.956]
Number of Sons × Daughters' marriage -1.84809* 0.98692 -1.46603** -0.34683
[0.960] [1.153] [0.659] [1.010]
Daughters' marriage (c+1 generation) 8.12385 0.81928 4.24721 10.17807
[8.581] [8.167] [5.838] [8.675]
Log total assets -2.56866 1.17468 -0.55677 -2.55670 -2.19726 -2.16629 -2.37514 -2.19634
[2.148] [3.185] [0.934] [1.526] [1.326] [1.314] [1.354] [1.327]
Group age 0.19959 0.01837 -0.00425 0.12753 0.12991 0.05728 0.17860 0.11092
[0.329] [0.154] [0.112] [0.229] [0.139] [0.141] [0.129] [0.124]
Constant 73.78035** 43.31424 68.36150*** 76.95341** 69.49151*** 79.46944*** 76.43298*** 76.06026***
[33.182] [46.820] [11.674] [30.821] [21.403] [21.741] [20.096] [22.942]
Observations 176 99 57 218 275 275 275 275
R-squared 0.023 0.002 0.013 0.020 0.024 0.020 0.025 0.020
Dependent Variable: Income (t-3~t+3) Volatility ( × 100)

50
Table 10: Natural Experiment: The Sudden Death of a Group Chairman – Corporate Risks Each column reports coefficients from an OLS regression with heteroscedasticity-robust standard errors. Standard errors are clustered at the business group level and reported in parentheses under the coefficient estimates. The dependent variable of our regression is the change in a firm’s riskiness, for which we use the change in income volatility measured by the difference of the 5-year income volatility before and after the Hyundai chairman’s death on Aug 4th, 2003. We exclude the year 2004, as well as the firms that were controlled by the chairman who died suddenly, to avoid any confounding effect, namely the increasing business uncertainty around the CEO’s death. Columns (1) and (2) use Number of New Sons in Tournament (add c-generation) as an explanatory variable, which is the total number of sons in the current chair's generation for Hyundai Group and is zero for all other groups. In Column (3), Number of New Sons in Tournament (add c-generation) is interacted with Strong Contender and Weak Contender dummies. Strong Contender is a dummy for firms controlled by sons in the current chair generation in Hyundai Group. Weak Contender is a dummy for firms controlled by sons in the current chair-1 generation. Columns (4) and (5) use Number of New Sons in Tournament (swap c+1 with c generation) as an explanatory variable, which is the difference of the total number of sons in the current chair generation and the current chair+1 generation for Hyundai Group, and zero for all other groups. In Column (6), we interact Number of New Sons in Tournament (swap c+1 with c generation) with the Strong Contender and Weak Contender dummies. In Columns (7) and (8), Hyundai Event (indicator) is a dummy that is one for Hyundai Group firms and is zero otherwise. In Column (9), Hyundai Event (indicator) is interacted with the Strong Contender and Weak Contender dummies. We control for ∆ Log total assets, which refers to the difference of the 5-year average logarithm of a firm’s total assets (in KRW millions) before and after (excluding 2004) the chairman’s death in 2003. ***, **, and* denote significance at the 1%, 5%, and 10% level, respectively.
Variables (1) (2) (3) (4) (5) (6) (7) (8) (9)
Number of New Sons in Tournament (add c-generation) 0.78378*** 0.71248***
[0.124] [0.149]
Number of New Sons in Tournament (add c) × Strong Contender 0.89004***
[0.134]
Number of New Sons in Tournament (add c) × Weak Contender 0.24085
[0.200]
Number of New Sons In Tournament (swap c+1 with c generation) 1.32639*** 1.20574***
[0.210] [0.252]
Number of New Sons in Tournament (swap c) × Strong Contender 1.50622***
[0.227]
Number of New Sons in Tournament (swap c) × Weak Contender 0.40759
[0.338]
Hyundai (indicator) 17.24306*** 15.67456***
[2.731] [3.272]
Hyundai Event × Strong Contender 19.58089***
[2.956]
Hyundai Event × Weak Contender 5.29870
[4.396]
Δ Log total assets 6.64469 6.78696 6.64469 6.78696 6.64469 6.78696
[13.284] [13.342] [13.284] [13.342] [13.284] [13.342]
Constant -6.51342** -10.82419 -10.91649 -6.51342** -10.82419 -10.91649 -6.51342** -10.82419 -10.91649
[2.731] [10.035] [10.074] [2.731] [10.035] [10.074] [2.731] [10.035] [10.074]
Observations 240 240 240 240 240 240 240 240 240
R-squared 0.006 0.009 0.010 0.006 0.009 0.010 0.006 0.009 0.010
Dependent Variable: Δ Income Volatility ( × 100)

51
Table 11: Natural Experiment: The Sudden Death of a Group Chairman – Mergers and Acquisitions Each column reports coefficients from an OLS regression with heteroscedasticity-robust standard errors. Standard errors are clustered at the business group level and reported in parentheses under the coefficient estimates. The dependent variable of Panel A is the change in the total amount of M&A transactions, which refers to the difference of the 5-year total M&A transaction amounts before and after the Hyundai chairman’s death on Aug 4th, 2003. In Panel B, the change in the number of M&As refers to the change in the 5-year average number of M&A transactions before and after the event. We exclude the year 2004, as well as the firms that were controlled by the chairman who died suddenly, to avoid any confounding effect, namely the increasing business uncertainty around the CEO’s sudden death. Columns (1) and (2) use Number of New Sons in Tournament (add c-generation) as an explanatory variable; this is the total number of sons in the current chair generation for Hyundai Group, and is zero for all other groups. In Column (3), Number of New Sons in Tournament (add c-generation) is interacted with Strong Contender and Weak Contender dummies. Strong Contender is a dummy for firms controlled by sons in the current chair generation in Hyundai Group. Weak Contender is a dummy for firms controlled by sons in the current chair-1 generation. Columns (4) and (5) use Number of New Sons in Tournament (swap c+1 with c generation) as an explanatory variable, which is the difference of the total number of sons in the current chair generation and the current chair+1 generation for Hyundai Group, and is zero for all other groups. In Column (6), we interact Number of New Sons in Tournament (swap c+1 with c generation) with the Strong Contender and Weak Contender dummies. In Columns (7) and (8), Hyundai Event (indicator) is a dummy that is one for Hyundai Group firms and zero otherwise. In Column (9), Hyundai Event (indicator) is interacted with the Strong Contender and Weak Contender dummies. We control for ∆ Log total assets, which refers to the difference of the 5-year average logarithm of a firm’s total assets (in KRW millions) before and after (excluding 2004) the chairman’s death in 2003. ***, **, and* denote significance at the 1%, 5%, and 10% level, respectively.
Panel A: Total transaction
Variables (1) (2) (3) (4) (5) (6) (7) (8) (9)
Number of New Sons in Tournament (add c-generation) 6.13057*** 5.91797***
[1.384] [1.351]
Number of New Sons in Tournament (add c) × Strong Contender 10.68215***
[1.376]
Number of New Sons in Tournament (add c) × Weak Contender -5.09782***
[1.369]
Number of New Sons In Tournament (swap c+1 with c generation) 10.37481*** 10.01502***
[2.342] [2.286]
Number of New Sons in Tournament (swap c) × Strong Contender 18.07748***
[2.329]
Number of New Sons in Tournament (swap c) × Weak Contender -8.62708***
[2.318]
Hyundai (indicator) 134.87248*** 130.19531***
[30.446] [29.714]
Hyundai Event × Strong Contender 235.00725***
[30.274]
Hyundai Event × Weak Contender -112.15200***
[30.128]
Δ Log total assets 22.09895 28.07351 22.09895 28.07351 22.09895 28.07351
[21.401] [25.157] [21.401] [25.157] [21.401] [25.157]
Constant 89.14701** 76.23667* 72.74630* 89.14701** 76.23667* 72.74630* 89.14701** 76.23667* 72.74630*
[30.446] [36.479] [37.202] [30.446] [36.479] [37.202] [30.446] [36.479] [37.202]
Observations 279 279 279 279 279 279 279 279 279
R-squared 0.006 0.006 0.016 0.006 0.006 0.016 0.006 0.006 0.016
Dependent Variable: Δ Total transaction of M&A (million USD)

52
Panel B: Number of M&A
Variables (1) (2) (3) (4) (5) (6) (7) (8) (9)
Number of New Sons in Tournament (add c-generation) 0.01077*** 0.01035***
[0.003] [0.003]
Number of New Sons in Tournament (add c) × Strong Contender 0.01985***
[0.003]
Number of New Sons in Tournament (add c) × Weak Contender -0.01164***
[0.003]
Number of New Sons In Tournament (swap c+1 with c generation) 0.01823*** 0.01751***
[0.006] [0.005]
Number of New Sons in Tournament (swap c) × Strong Contender 0.03360***
[0.005]
Number of New Sons in Tournament (swap c) × Weak Contender -0.01969***
[0.005]
Hyundai (indicator) 0.23699*** 0.22759***
[0.072] [0.071]
Hyundai Event × Strong Contender 0.43674***
[0.071]
Hyundai Event × Weak Contender -0.25600***
[0.071]
Δ Log total assets 0.04441 0.05633 0.04441 0.05633 0.04441 0.05633
[0.034] [0.037] [0.034] [0.037] [0.034] [0.037]
Constant 0.05147 0.02553 0.01856 0.05147 0.02553 0.01856 0.05147 0.02553 0.01856
[0.072] [0.078] [0.079] [0.072] [0.078] [0.079] [0.072] [0.078] [0.079]
Observations 279 279 279 279 279 279 279 279 279
R-squared 0.004 0.004 0.012 0.004 0.004 0.012 0.004 0.004 0.012
Dependent Variable: Δ Number of M&A
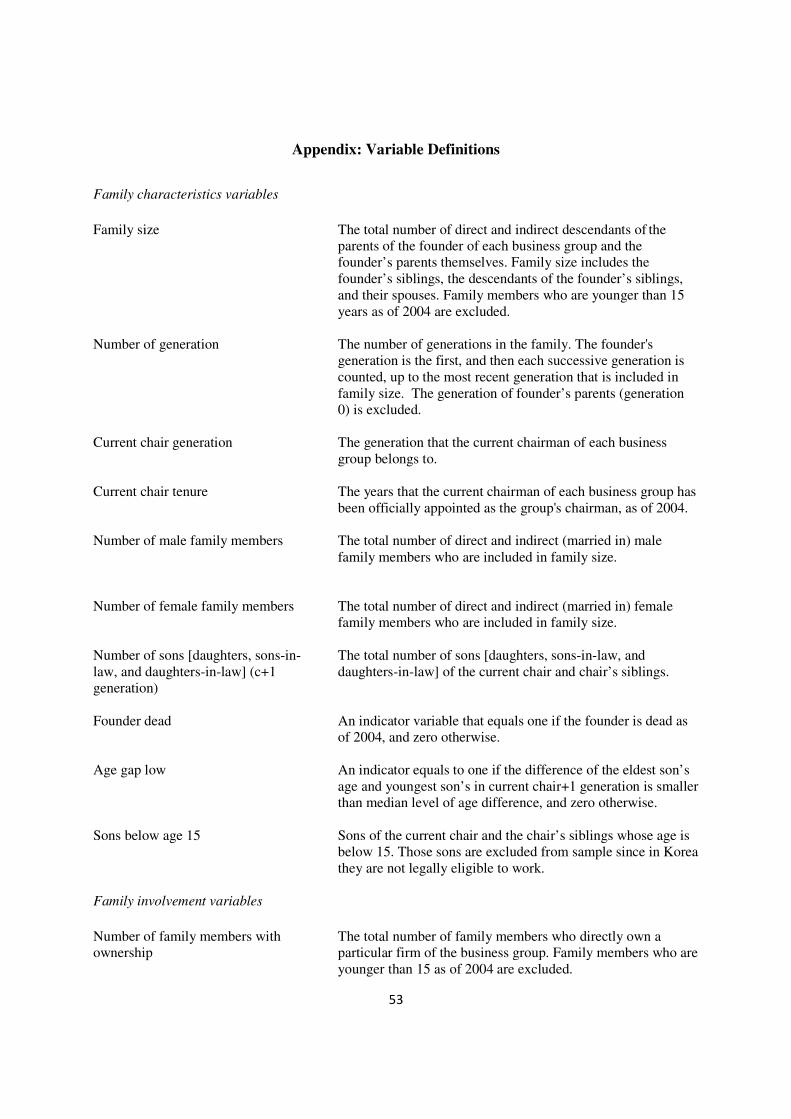
53
Appendix: Variable Definitions
Family characteristics variables
Family size Number of generation Current chair generation Current chair tenure Number of male family members Number of female family members Number of sons [daughters, sons-in-law, and daughters-in-law] (c+1 generation) Founder dead Age gap low Sons below age 15
The total number of direct and indirect descendants of the parents of the founder of each business group and the founder’s parents themselves. Family size includes the founder’s siblings, the descendants of the founder’s siblings, and their spouses. Family members who are younger than 15 years as of 2004 are excluded. The number of generations in the family. The founder's generation is the first, and then each successive generation is counted, up to the most recent generation that is included in family size. The generation of founder’s parents (generation 0) is excluded. The generation that the current chairman of each business group belongs to. The years that the current chairman of each business group has been officially appointed as the group's chairman, as of 2004. The total number of direct and indirect (married in) male family members who are included in family size. The total number of direct and indirect (married in) female family members who are included in family size. The total number of sons [daughters, sons-in-law, and daughters-in-law] of the current chair and chair’s siblings. An indicator variable that equals one if the founder is dead as of 2004, and zero otherwise. An indicator equals to one if the difference of the eldest son’s age and youngest son’s in current chair+1 generation is smaller than median level of age difference, and zero otherwise. Sons of the current chair and the chair’s siblings whose age is below 15. Those sons are excluded from sample since in Korea they are not legally eligible to work.
Family involvement variables
Number of family members with ownership
The total number of family members who directly own a particular firm of the business group. Family members who are younger than 15 as of 2004 are excluded.
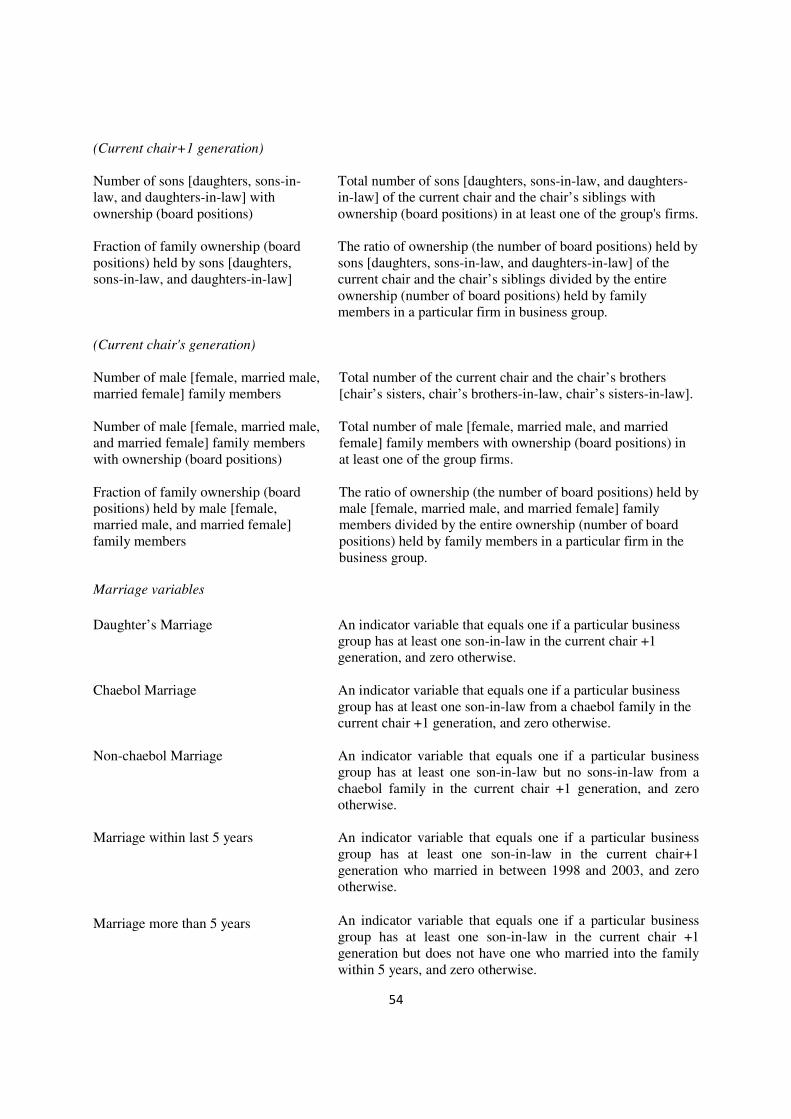
54
(Current chair+1 generation)
Number of sons [daughters, sons-in-law, and daughters-in-law] with ownership (board positions) Fraction of family ownership (board positions) held by sons [daughters, sons-in-law, and daughters-in-law]
Total number of sons [daughters, sons-in-law, and daughters-in-law] of the current chair and the chair’s siblings with ownership (board positions) in at least one of the group's firms. The ratio of ownership (the number of board positions) held by sons [daughters, sons-in-law, and daughters-in-law] of the current chair and the chair’s siblings divided by the entire ownership (number of board positions) held by family members in a particular firm in business group.
(Current chair's generation)
Number of male [female, married male, married female] family members Number of male [female, married male, and married female] family members with ownership (board positions) Fraction of family ownership (board positions) held by male [female, married male, and married female] family members
Total number of the current chair and the chair’s brothers [chair’s sisters, chair’s brothers-in-law, chair’s sisters-in-law]. Total number of male [female, married male, and married female] family members with ownership (board positions) in at least one of the group firms. The ratio of ownership (the number of board positions) held by male [female, married male, and married female] family members divided by the entire ownership (number of board positions) held by family members in a particular firm in the business group.
Marriage variables
Daughter’s Marriage Chaebol Marriage Non-chaebol Marriage Marriage within last 5 years
Marriage more than 5 years
An indicator variable that equals one if a particular business group has at least one son-in-law in the current chair +1 generation, and zero otherwise. An indicator variable that equals one if a particular business group has at least one son-in-law from a chaebol family in the current chair +1 generation, and zero otherwise. An indicator variable that equals one if a particular business group has at least one son-in-law but no sons-in-law from a chaebol family in the current chair +1 generation, and zero otherwise. An indicator variable that equals one if a particular business group has at least one son-in-law in the current chair+1 generation who married in between 1998 and 2003, and zero otherwise.
An indicator variable that equals one if a particular business group has at least one son-in-law in the current chair +1 generation but does not have one who married into the family within 5 years, and zero otherwise.

55
Firm and group characteristics variables
Log of total assets Log of sales Leverage ROA Residual ROA Payout ratio Log of R&D investment Income volatility Sales volatility Cash-flow volatility Group age Firm age Public Firms Reputable Group
The logarithm of total assets of each firm in millions of KRW. The logarithm of total sales of each firm in millions of KRW.
The debt ratio calculated by total debt divided by total equity.
The ratio of earnings before interest and tax (EBIT) divided by total assets
The difference between ROA and the one-digit SIC average ROA for all firms in the full sample. The ratio of net dividends paid divided by net income.
The logarithm of long-term research and development (R&D) expenses in millions of KRW. R&D expenses only include long-term R&D investment, which is regarded as assets, but excludes short-term R&D expenses, which are regarded as costs in the balance sheet.
The standard deviation of the logarithm of annual operating income from t-3 to t+3 periods.
The standard deviation of the logarithm of annual sales from t-3 to t+3 periods. The standard deviation of the logarithm of annual net operating cash flow from t-3 to t+3 periods. Age of business group as of 2004. Age of each firm in the business group as of 2004. An indicator variable that equals one if firms are listed on the KOSPI or KOSDAQ exchange, and zero otherwise. An indicator variable that equals one if the total asset size of the group is greater than that of the top one third of groups, and zero otherwise.
Ownership Structure variables
Group chair ownership
The average percentage of direct ownership held by the group chairperson in a particular business group.
Family ownership
The average percentage of direct ownership held by founding families in a business group. The group chair's ownership is excluded.

56
Subsidiary ownership Position Pyramidal depth Cash-flow right Voting right Discrepancy
The average percentage of direct ownership held by subsidiaries in a business group. The distance between the family and a firm in a group. A value of 1 indicates that the firm is directly controlled by the founding family. The difference between the max value of position and minimum value of position. The sum of direct equity ownership held by the founding family after excluding treasury stocks and cross shareholdings. The ratio of maximum number of stocks that the founding family can possibly exercise for voting divided by the total number of stocks outstanding This includes direct and indirect voting shares held by the founding family, subsidiaries, senior managers in special relationships, and non-profit organizations. The difference between cash-flow rights and voting rights.