family violence in canada: a statistical profile, 2018
TRANSCRIPT
Juristat
Catalogue no. 85-002-XISSN 1209-6393
by Shana Conroy, Marta Burczycka and Laura Savage
Family violence in Canada: A statistical profile, 2018
Release date: December 12, 2019

How to obtain more informationFor information about this product or the wide range of services and data available from Statistics Canada, visit our website, www.statcan.gc.ca. You can also contact us by email at [email protected] telephone, from Monday to Friday, 8:30 a.m. to 4:30 p.m., at the following numbers:
• Statistical Information Service 1-800-263-1136 • National telecommunications device for the hearing impaired 1-800-363-7629 • Fax line 1-514-283-9350
Depository Services Program
• Inquiries line 1-800-635-7943 • Fax line 1-800-565-7757
Note of appreciationCanada owes the success of its statistical system to a long-standing partnership between Statistics Canada, the citizens of Canada, its businesses, governments and other institutions. Accurate and timely statistical information could not be produced without their continued co-operation and goodwill.
Standards of service to the publicStatistics Canada is committed to serving its clients in a prompt, reliable and courteous manner. To this end, Statistics Canada has developed standards of service that its employees observe. To obtain a copy of these service standards, please contact Statistics Canada toll-free at 1-800-263-1136. The service standards are also published on www.statcan.gc.ca under “Contact us” > “Standards of service to the public.”
Published by authority of the Minister responsible for Statistics Canada
© Her Majesty the Queen in Right of Canada as represented by the Minister of Industry, 2019
All rights reserved. Use of this publication is governed by the Statistics Canada Open Licence Agreement.
An HTML version is also available.
Cette publication est aussi disponible en français.
Statistics Canada—Catalogue no. 85-002-X
3
Juristat Article—Family violence in Canada: A statistical profile, 2018
Family violence in Canada: A statistical profile, 2018
Family violence in Canada: A statistical profile is an annual report produced by the Canadian Centre for Justice Statistics under the Federal Family Violence Initiative. Since 1998, this report has provided current data on the nature and extent of family violence in Canada, as well as analysis of trends over time. The information presented here is used extensively to monitor changes that inform policy makers and the public.
The 2018 edition of the report features sections dedicated to police-reported data on family violence against children and youth, intimate partner violence and family violence against seniors. Presented in a fact sheet format accompanied by detailed data tables, these sections provide readers with key findings for 2018 from the Incident-based Uniform Crime Reporting Survey and the Homicide Survey.
Section 1: Police-reported family violence against children and youth in Canada, 2018
Section 2: Police-reported intimate partner violence in Canada, 2018
Section 3: Police-reported family violence against seniors in Canada, 2018
Survey description
Statistics Canada—Catalogue no. 85-002-X
4
Juristat Article—Family violence in Canada: A statistical profile, 2018
Section 1: Police-reported family violence against children and youth in Canada, 2018 by Shana Conroy
Police-reported family violence against children and youth increased since 2017
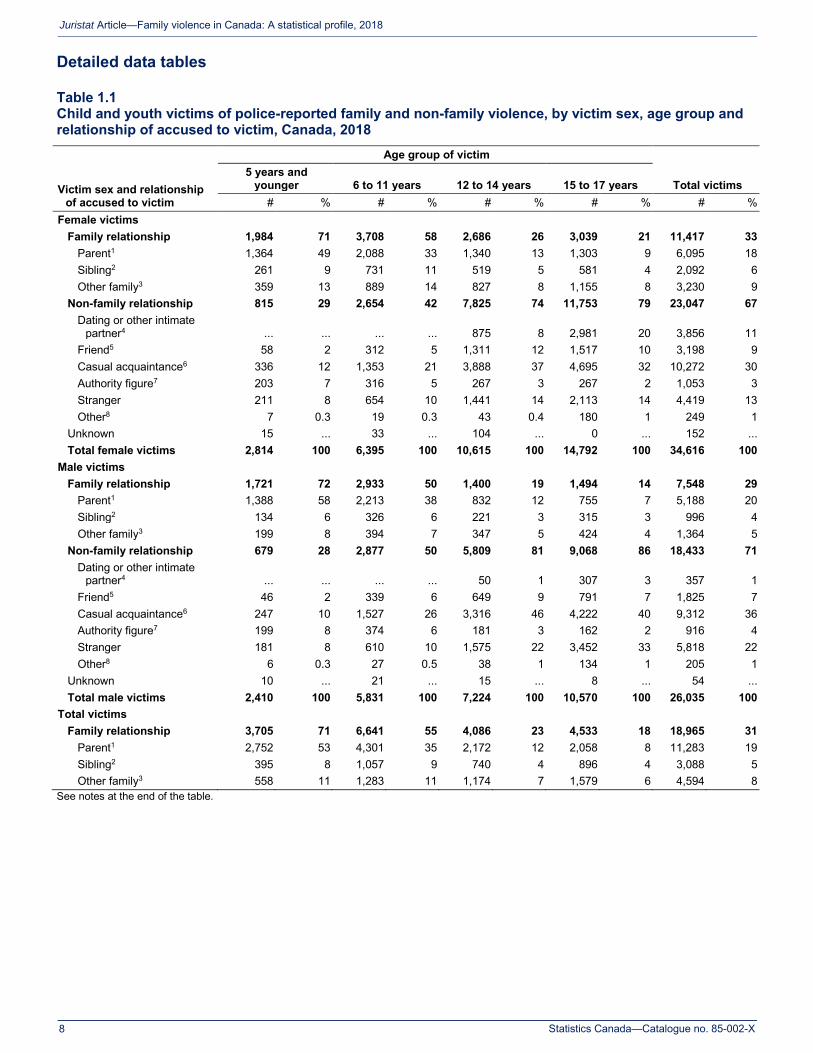
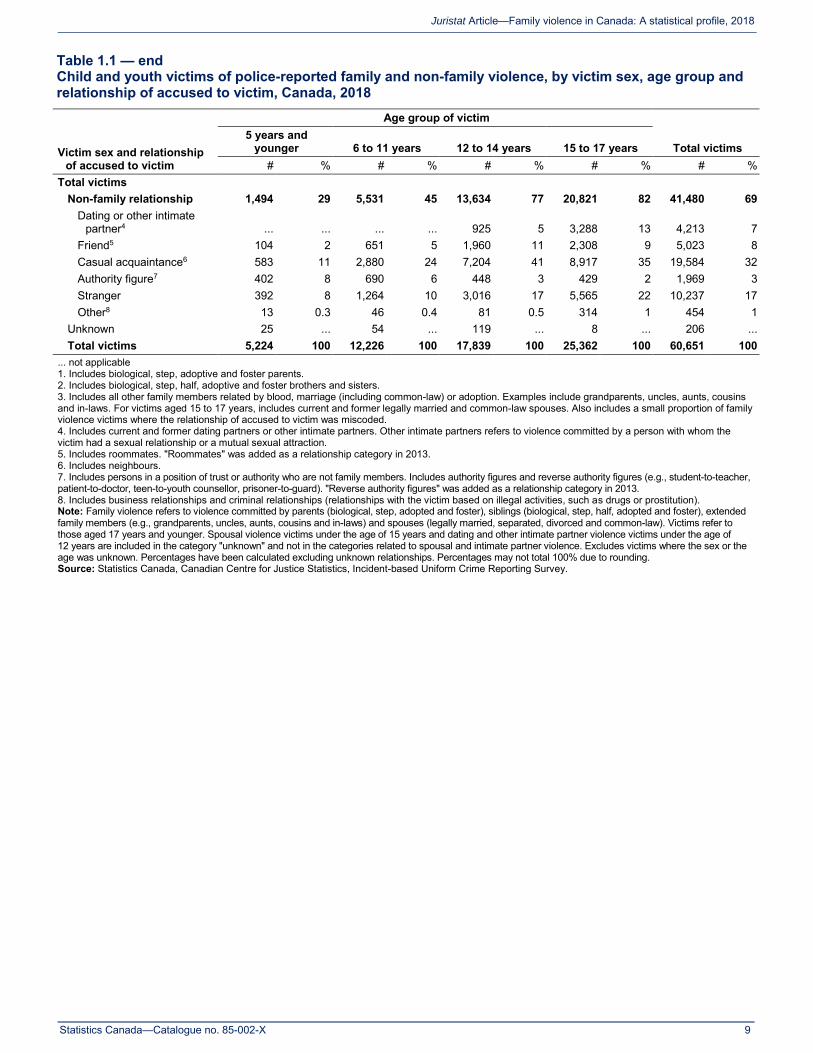
In 2018, there were 60,651 child and youth victims (aged 17 and younger) of police-reported violence in Canada.1 Of these victims, 57% were female and 43% were male. Overall, child and youth victims of violence were most often victimized by a casual acquaintance (32%) or a family member (31%), while a stranger (17%) was relatively less common (Table 1.1).
For the 18,965 child and youth victimized by a family member, a parent (59%) was the most common perpetrator, followed by another type of family member—such as a grandparent, uncle or aunt—or a sibling (24% and 16%, respectively). This pattern applied for both female and male victims (Table 1.1).
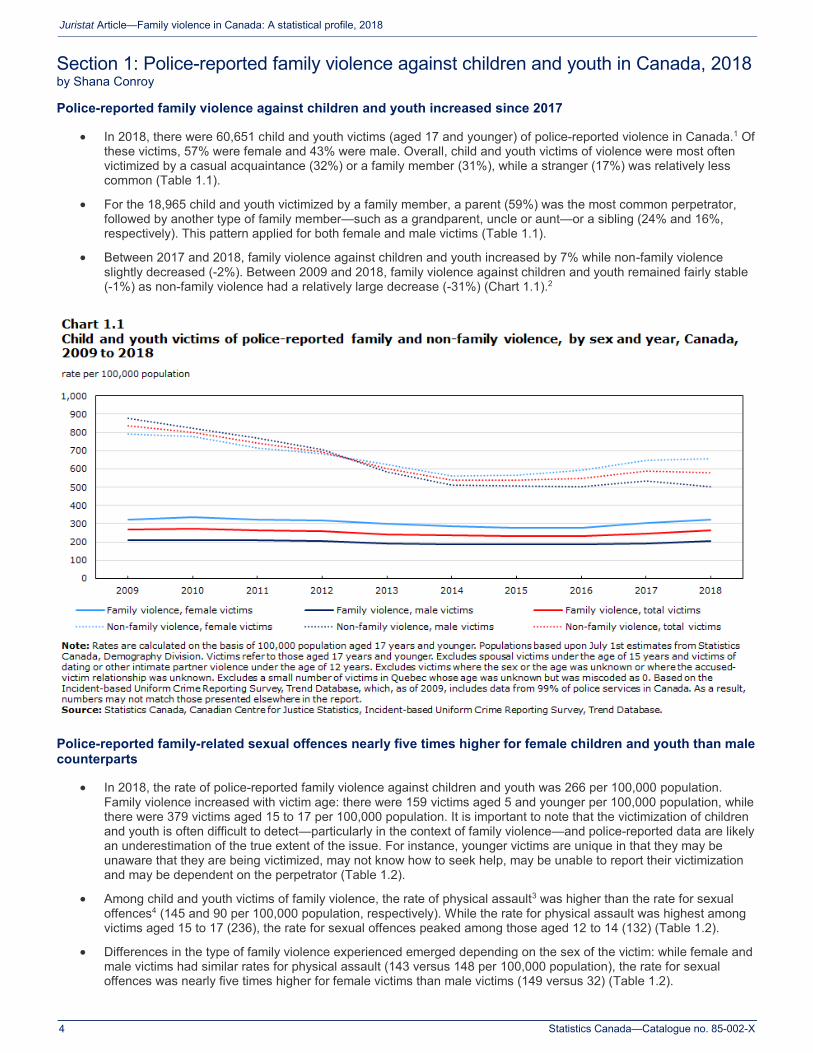
Between 2017 and 2018, family violence against children and youth increased by 7% while non-family violence slightly decreased (-2%). Between 2009 and 2018, family violence against children and youth remained fairly stable (-1%) as non-family violence had a relatively large decrease (-31%) (Chart 1.1).2
Police-reported family-related sexual offences nearly five times higher for female children and youth than male counterparts
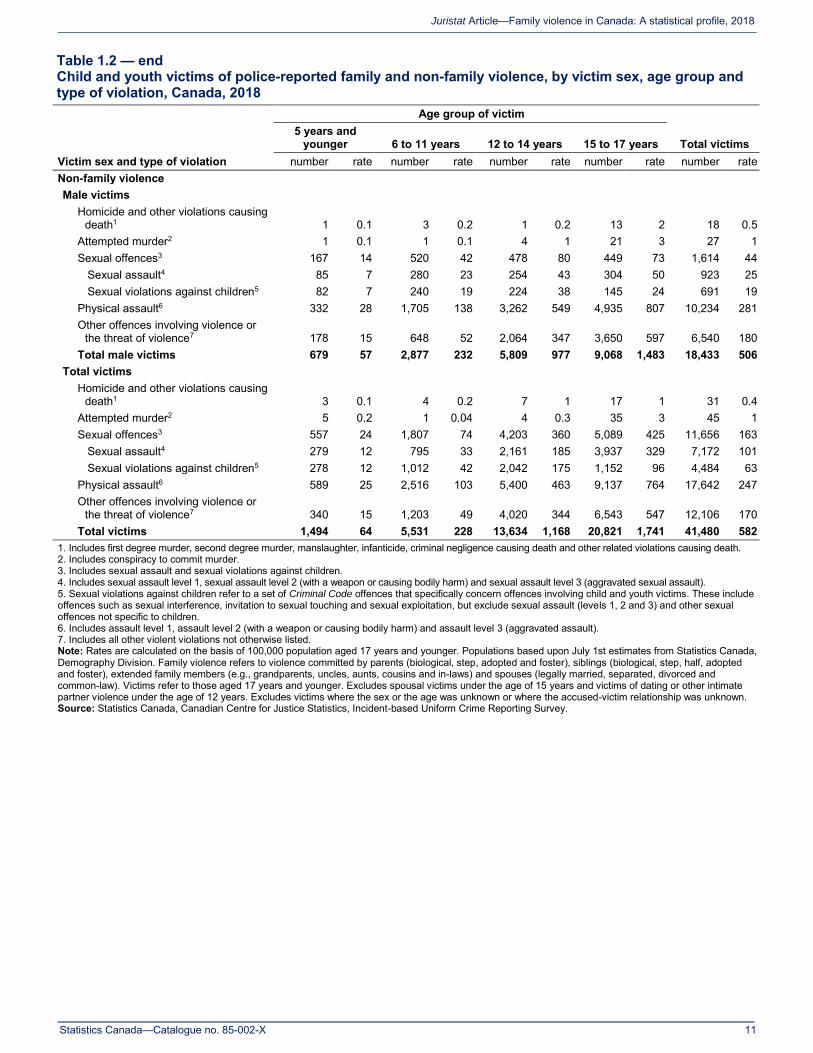
In 2018, the rate of police-reported family violence against children and youth was 266 per 100,000 population. Family violence increased with victim age: there were 159 victims aged 5 and younger per 100,000 population, while there were 379 victims aged 15 to 17 per 100,000 population. It is important to note that the victimization of children and youth is often difficult to detect—particularly in the context of family violence—and police-reported data are likely an underestimation of the true extent of the issue. For instance, younger victims are unique in that they may be unaware that they are being victimized, may not know how to seek help, may be unable to report their victimization and may be dependent on the perpetrator (Table 1.2).
Among child and youth victims of family violence, the rate of physical assault3 was higher than the rate for sexual offences4 (145 and 90 per 100,000 population, respectively). While the rate for physical assault was highest among victims aged 15 to 17 (236), the rate for sexual offences peaked among those aged 12 to 14 (132) (Table 1.2).
Differences in the type of family violence experienced emerged depending on the sex of the victim: while female and male victims had similar rates for physical assault (143 versus 148 per 100,000 population), the rate for sexual offences was nearly five times higher for female victims than male victims (149 versus 32) (Table 1.2).

Statistics Canada—Catalogue no. 85-002-X
5
Juristat Article—Family violence in Canada: A statistical profile, 2018
Police-reported family violence against children and youth more often cleared by charge than non-family violence
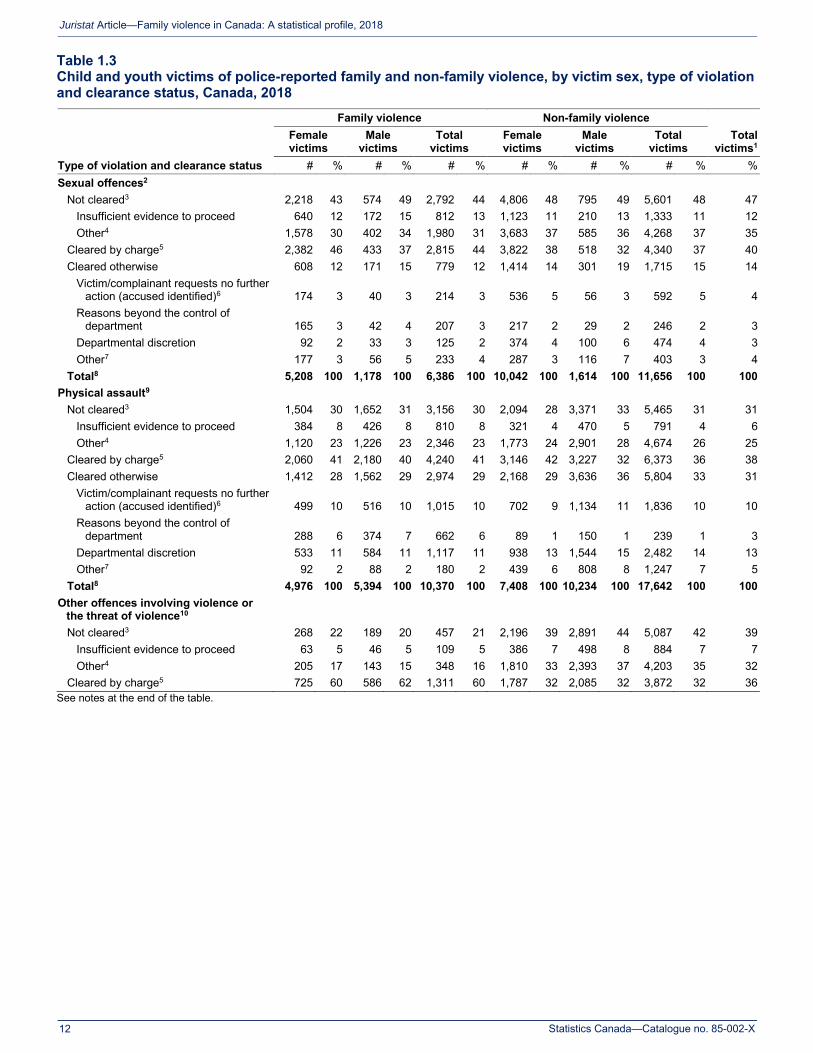
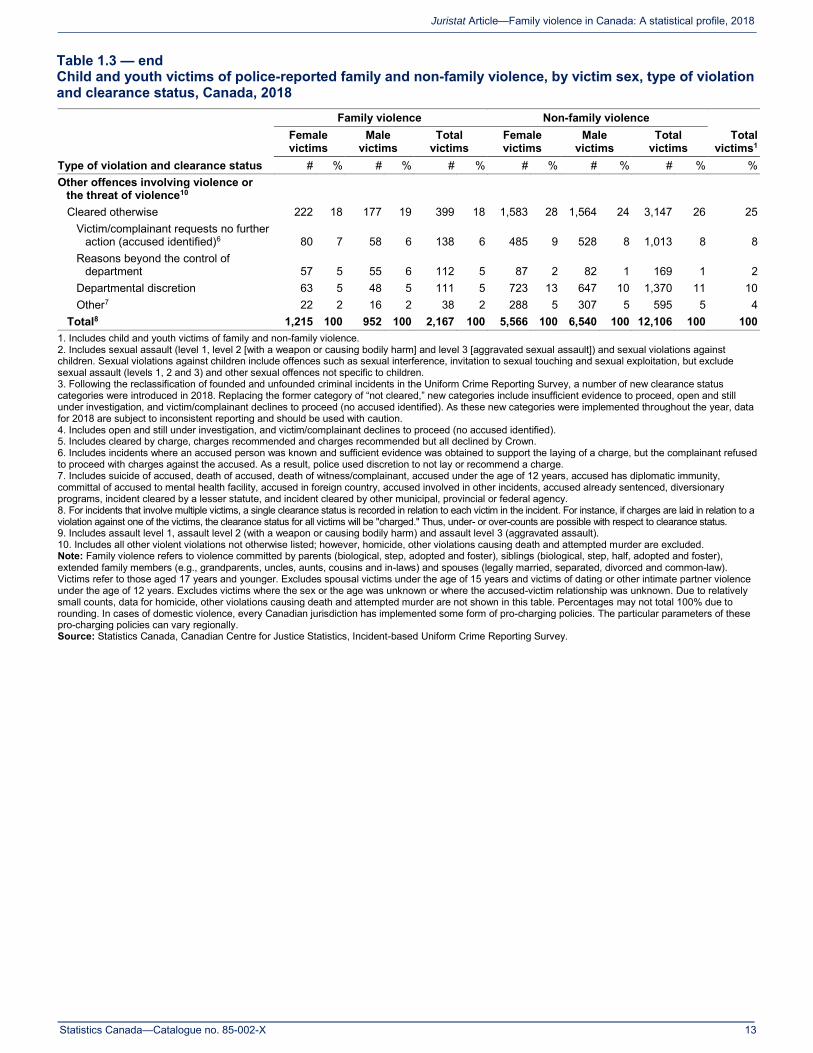
Regardless of the type of violation, police-reported family violence against children and youth was more often cleared by charge—or charge recommended—than non-family violence. In terms of incidents cleared by charge, the largest difference between victims of family and non-family violence was for other offences involving violence or the threat of violence5 (60% versus 32%), followed by sexual offences (44% versus 37%) and physical assault (41% versus 36%) (Table 1.3).
Among child and youth victims of family violence, incidents most often remained not cleared when they were sexual offences (44%). This was less common for physical assault (30%) and other offences involving violence or the threat of violence (21%). A larger proportion of sexual offence incidents remained not cleared for male victims of family violence than for their female counterparts (49% versus 43%) (Table 1.3).
Majority of child and youth victims of police-reported family violence live with the person who victimized them
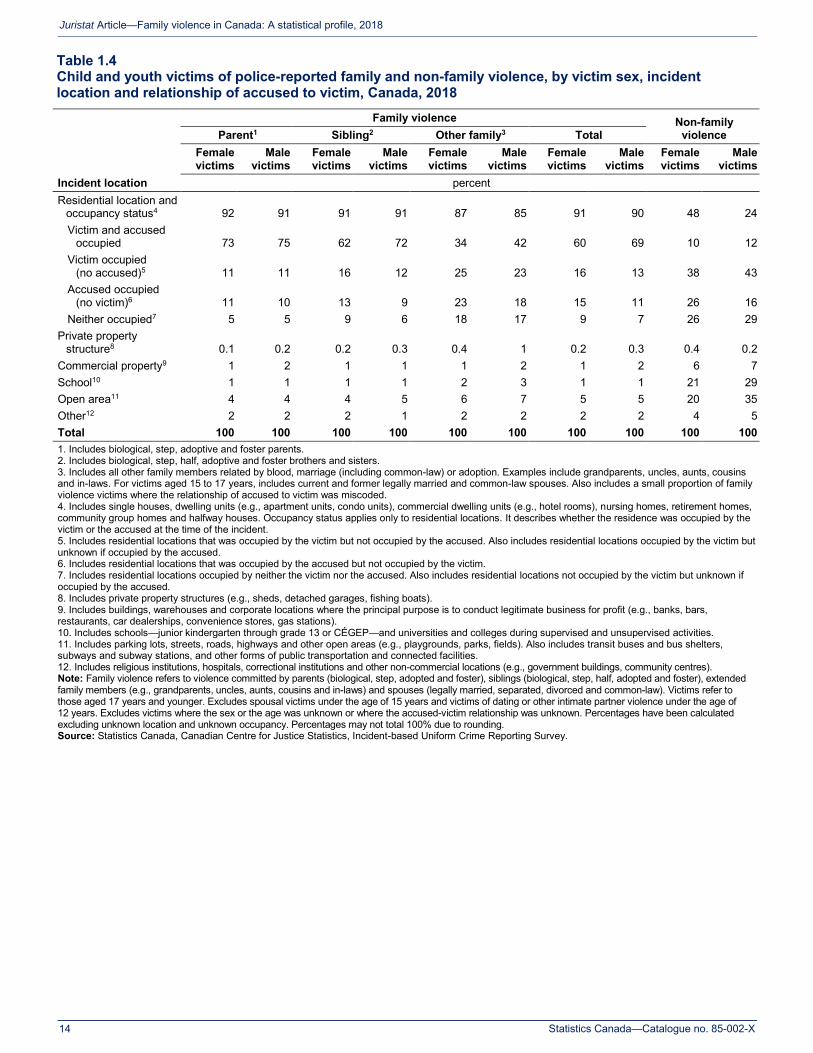
The vast majority of child and youth victims of police-reported family violence were victimized at a residential location (91% of females and 90% of males) (Table 1.4).
Of the child and youth victims of family violence at a residential location, the majority lived with the person who victimized them, and this was somewhat more common for male victims than their female counterparts (69% versus 60%). A further 16% of female victims and 13% of male victims experienced violence in their own home where the accused did not live (Table 1.4).
Among child and youth victims who experienced family violence at a residential location, it was more common for males to live with the accused—regardless of the type family relationship—than their female counterparts. Among males, 75% lived with the parent, 72% lived with the sibling and 42% lived with another family member who victimized them (compared with 73%, 62% and 34% of females, respectively) (Table 1.4).
Physical force often used against child and youth victims of police-reported family violence
Physical force was used against three-quarters (75%) of child and youth victims of police-reported family violence. Approximately one in six (15%) child and youth victims of family violence were involved in incidents where a weapon was present, and the presence of a firearm was rare (1%) (Table 1.5).6
Despite the use of physical force or the presence of a weapon in 91% of incidents, six in ten (62%) child and youth victims of family violence had no physical injury as a result of the incident they experienced. Meanwhile, of the four in ten (38%) that did have a physical injury, nearly all were minor in nature. An injury was more common for male victims of family violence than their female counterparts (45% versus 34%). It is not possible to determine the short- and long-term emotional impacts of violent victimization with police-reported data (Table 1.5).
Text box 1.1 Self-reported experiences of harsh parenting
In 2018, Statistics Canada conducted the Survey of Safety in Private and Public Spaces (SSPPS) as part of It’s Time: Canada’s Strategy to Prevent and Address Gender-based Violence. Canadians aged 15 and older were asked about their experiences of inappropriate sexual behaviour at home, in the workplace, in public and online, as well as experiences of physical and sexual assault. The SSPPS also included retrospective questions about harsh parenting experienced before age 15. While certain forms of harsh parenting may not be considered a criminal act, research has noted that early caregiving can have a significant impact on the well-being and development of a child.7
On the topic of harsh parenting, the SSPPS asked the following:
Before age 15…did your parents or other caregivers do any of the following?
Spank you with their hand or slap you on the hand? Say things that really hurt your feelings? Made you feel like you were not wanted or loved? Did not take care of your basic needs, such as keeping you clean or providing food or clothing?
Among those living in the provinces, 64% of Canadians stated that they had experienced some form of harsh parenting (65% of women and 62% of men). The most common type of harsh parenting was spanking or slapping (experienced by 55% of Canadians overall), followed by hurt feelings (38%), feeling unwanted or unloved (19%) and unmet basic needs (4%). This pattern was the same for both women and men.

Statistics Canada—Catalogue no. 85-002-X
6
Juristat Article—Family violence in Canada: A statistical profile, 2018
Perpetrators of police-reported family violence against children and youth most often aged 18 to 44
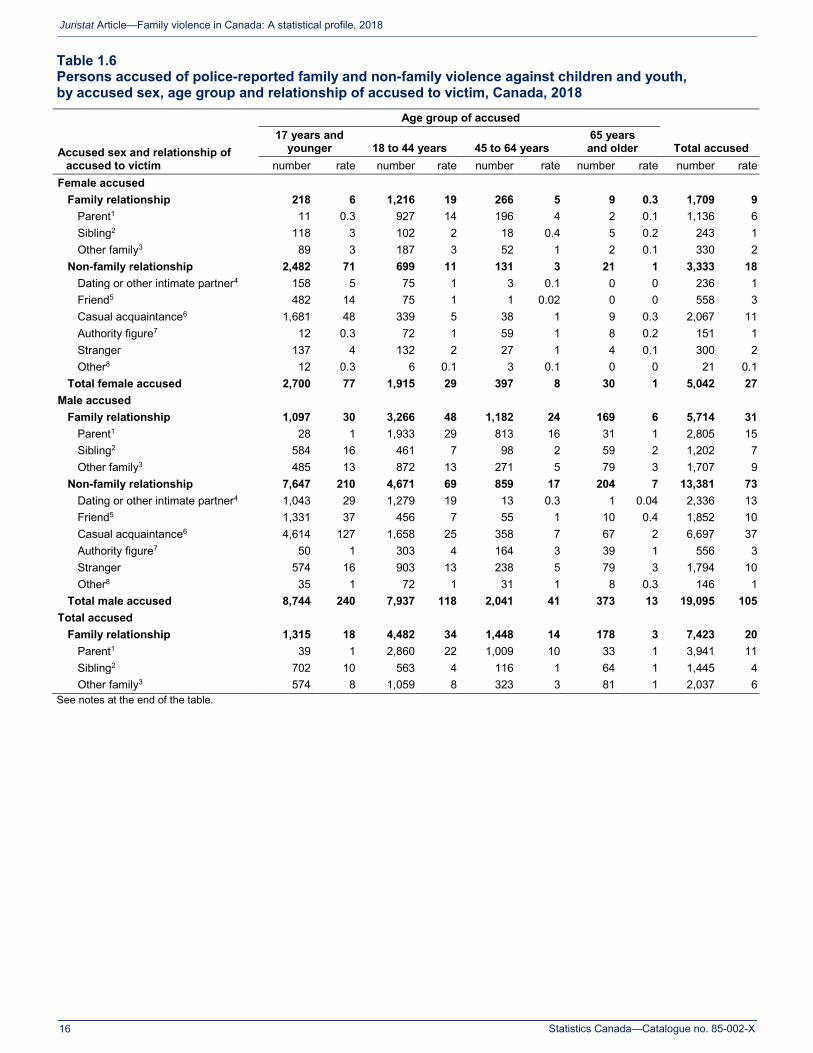
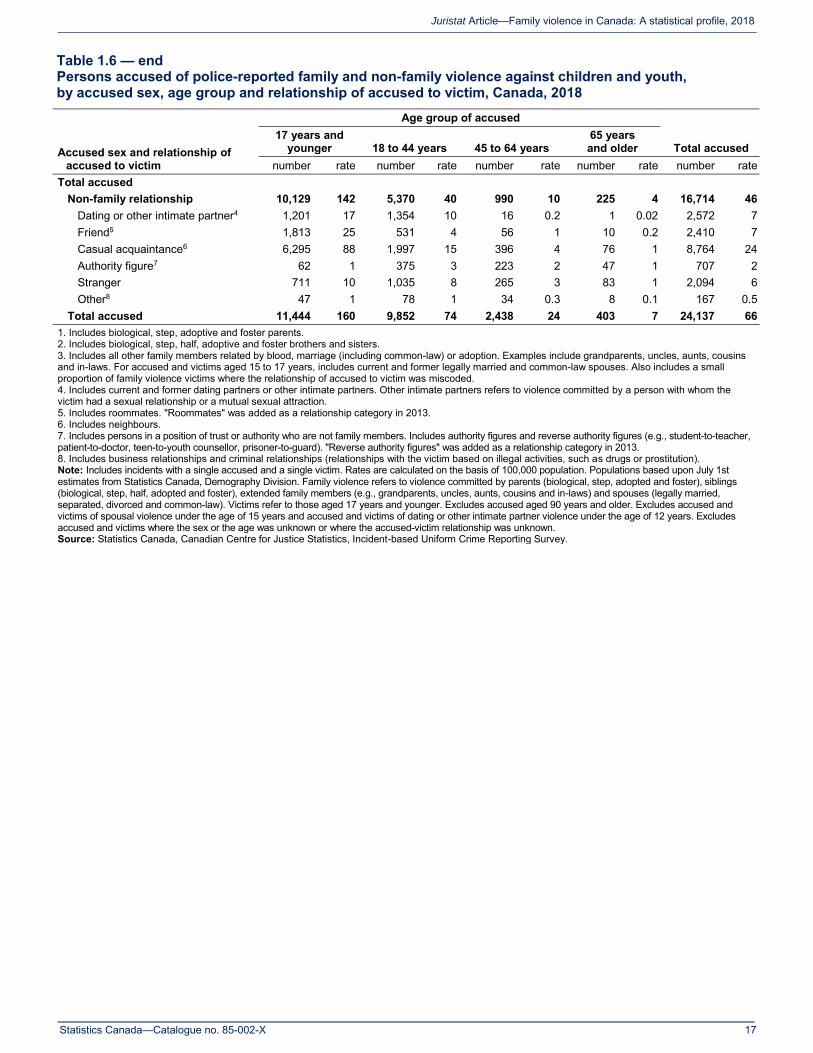
Of all perpetrators of police-reported violence against children and youth, 34% of female accused and 30% of male accused victimized a family member. For every 100,000 population, there were 9 females and 31 males accused of family violence against children and youth (Table 1.6).8
Overall, those accused of family violence against children and youth were most commonly aged 18 to 44 (34 per 100,000 population). This pattern applied to both female and male accused (Table 1.6).
Police-reported family violence against children and youth increased in nearly all provinces and territories since 2017
Among the provinces, the rate of police-reported family violence against children and youth was highest in Saskatchewan (453 per 100,000 population), Manitoba (370) and Quebec (368), while it was lowest in Ontario (182), British Columbia (200) and Alberta (244). Similar to crime in general, rates of family violence against children and youth were highest in the territories (Table 1.7).
Similar to non-family violence, rates of family violence against and children and youth were higher for female victims than their male counterparts in every province and territory. The largest differences between female and male victims were noted in the Northwest Territories (1,647 versus 723), Manitoba (483 versus 262), Nunavut (1,845 versus 1,001) and New Brunswick9 (434 versus 241) (Table 1.7).
Between 2017 and 2018, police-reported family violence increased in every province and territory, with the exception of Saskatchewan (-7%), which had the highest rate among the provinces in 2018, and Alberta (-1%). The largest increase was noted in Prince Edward Island (+62%) followed by the Northwest Territories (+21%) and Yukon (+12%); however, given the relatively small number of victims in these respective areas, any change in the counts impacts the rate significantly. The overall increase in Yukon was attributable to a 30% increase for female victims while there was a 7% decrease for male victims (Table 1.7).10
Rural rates of police-reported family violence against children and youth nearly twice as high as urban rates
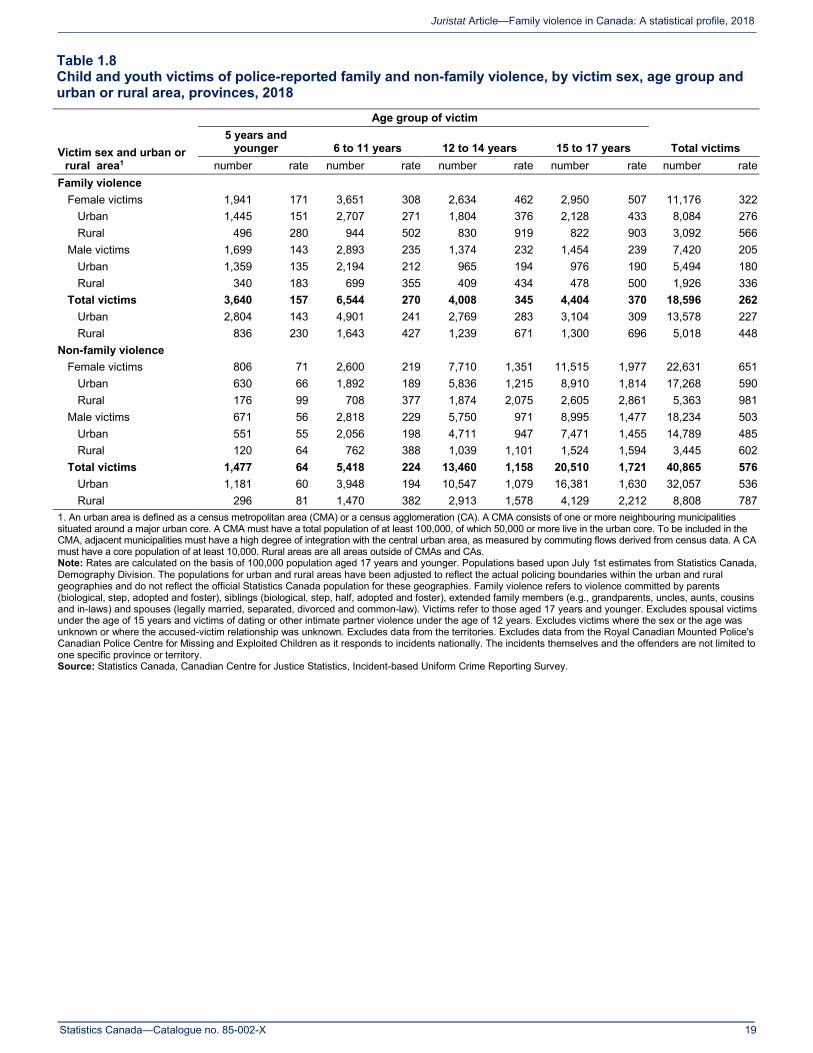
In 2018, police-reported family violence against children and youth was nearly twice as high in rural areas than urban areas (448 versus 227 per 100,000 population). This pattern applied for female and male victims of family violence, although the rural-urban difference was larger for females (566 versus 276) than males (336 versus 180) (Table 1.8).11
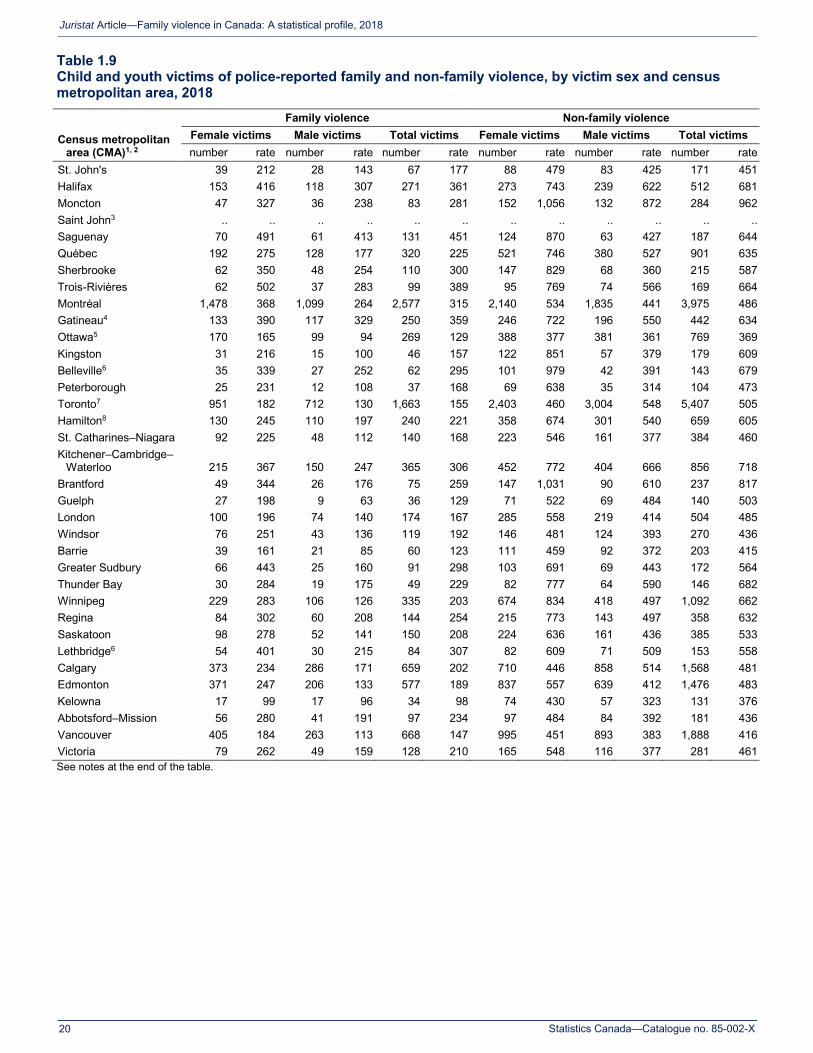
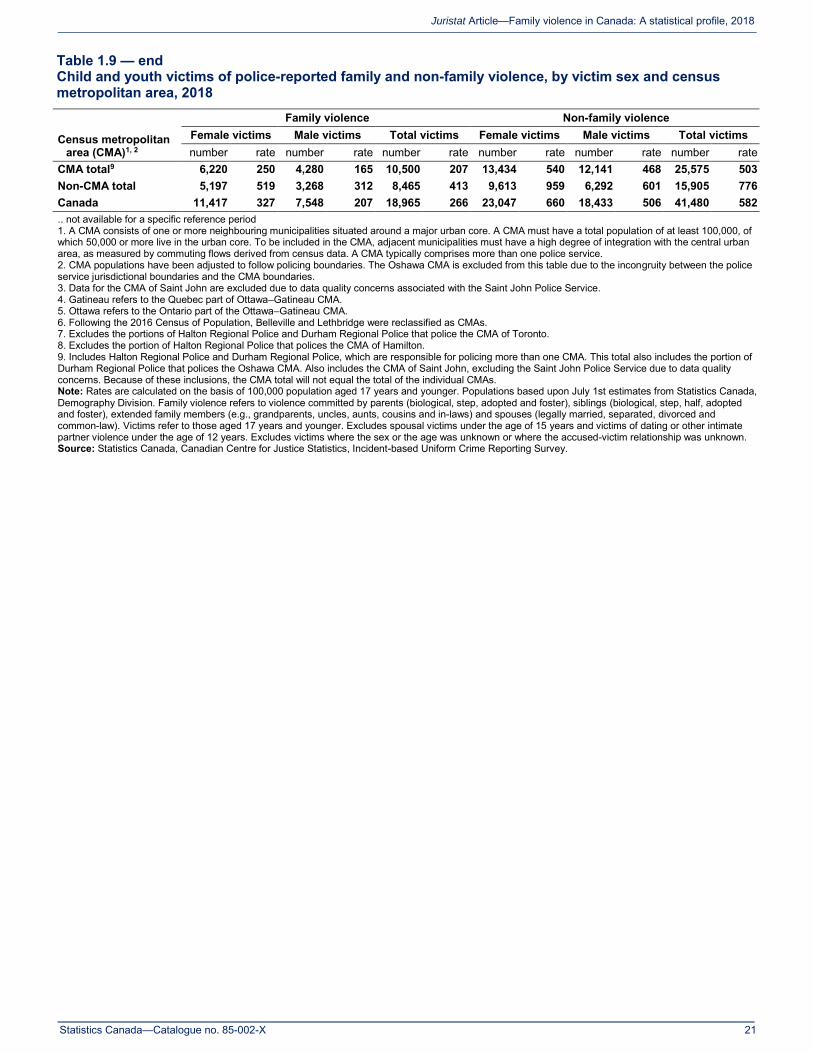
The rate of family violence against children and youth was lower in Canada’s largest cities—referred to as census metropolitan areas or CMAs—than it was in non-CMAs (207 versus 413 per 100,000 population).12 Family violence against children and youth was highest in Saguenay, Trois-Rivières, Halifax and Gatineau (451, 389, 361 and 359, respectively), while it was lowest in Kelowna, Barrie, Ottawa and Guelph (98, 123, 129 and 129, respectively) (Table 1.9).
Rates of violence were higher for females in every CMA. The difference between females and males was largest in Guelph (198 versus 63 per 100,000 population) and Greater Sudbury (443 versus 160) (Table 1.9).
Family-related homicide against children and youth most commonly motivated by frustration, anger or despair
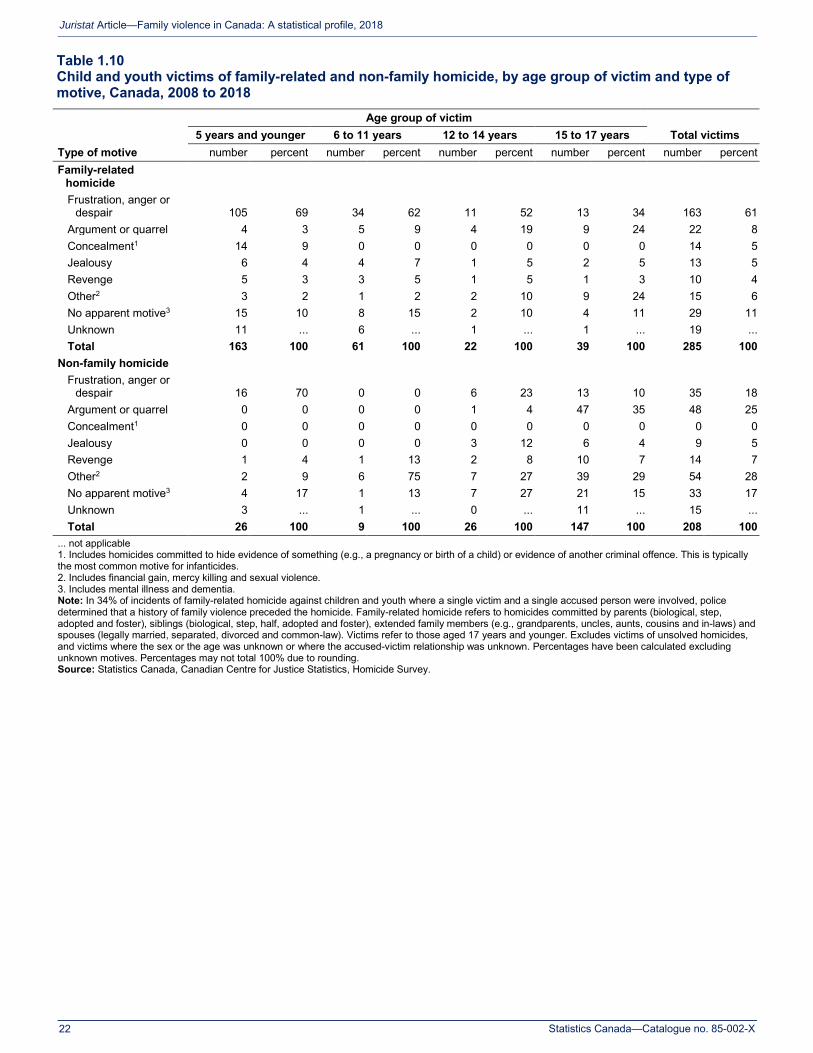
Family-related homicides occur within complex interpersonal contexts that often involve a history of violence.13 Between 2008 and 2018, the most common primary motive for family-related homicide involving child and youth victims was by far frustration, anger or despair (61%). Regardless of age group, this remained the most common motive for family-related homicide involving child and youth victims. For victims aged 12 to 14 and victims aged 15 to 17, an argument or quarrel was also common (19% and 24%, respectively) (Table 1.10).
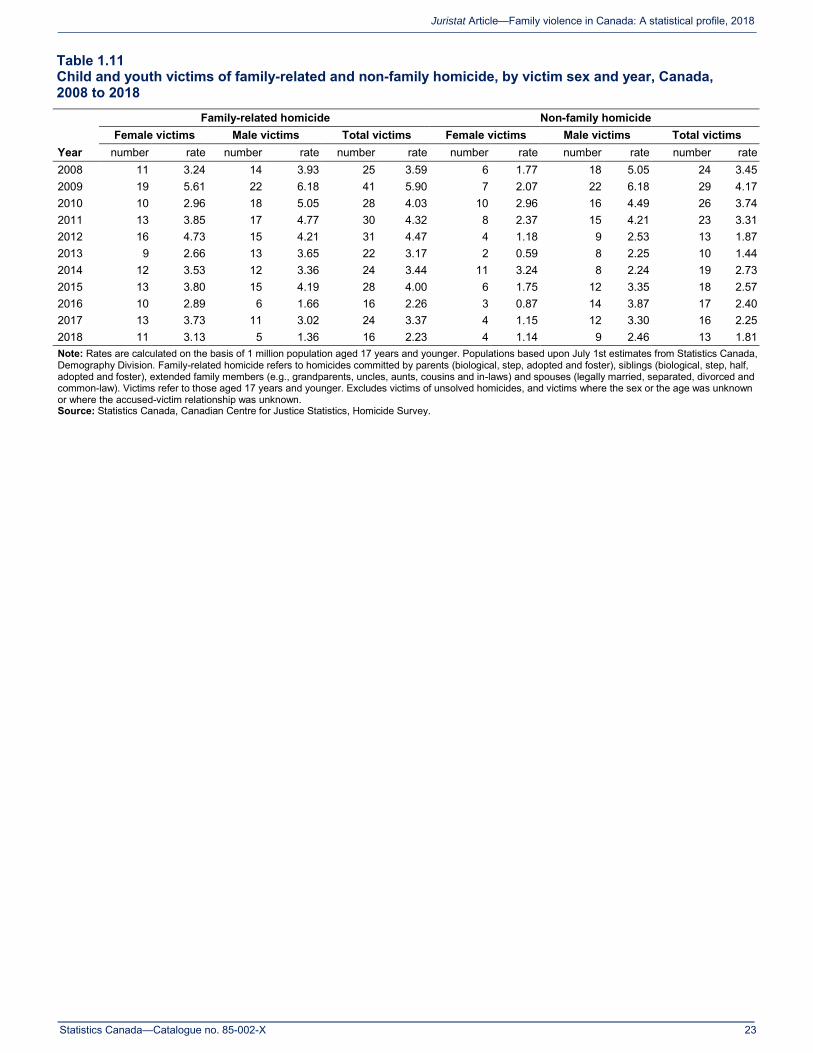
Children and youth are more commonly victims of family-related homicide than non-family homicide (2.23 versus 1.81 per 1 million population). Between 2008 and 2018, the rate of family-related homicide against children and youth decreased by 38%, from 3.59 to 2.23 per 1 million population (a decrease from 25 victims in 2008 to 16 victims in 2018) (Table 1.11).
Notes
1. Excludes victims where the sex or the age was unknown. Counts represent the number of victims involved in incidents of violence. It is possible that individual victims may have experienced more than one incident, and would therefore be counted more than once here.
2. Trend numbers are based on the Incident-based Uniform Crime Reporting Survey, Trend Database, which, as of 2009, includes data from 99% of police services in Canada. As a result, trend numbers may not match those presented elsewhere in the report.
3. Physical assault includes assault level 1, assault level 2 (with a weapon or causing bodily harm) and assault level 3 (aggravated assault).
Statistics Canada—Catalogue no. 85-002-X
7
Juristat Article—Family violence in Canada: A statistical profile, 2018
4. Sexual offences includes sexual assault (level 1, level 2 [with a weapon or causing bodily harm] and level 3 [aggravated sexual assault]) and sexual violations against children.
5. Includes all other violent violations; however, homicide, other violations causing death and attempted murder are excluded.
6. Data on type of weapon present and level of injury exclude the province of Quebec due to data quality concerns.
7. See, for example, Luecken, L. J. and K. S. Lemery. 2004. “Early caregiving and physiological stress responses.” Clinical Psychology Review. Vol. 24, no. 2. p. 171-191.
8. Includes incidents with a single accused and a single victim.
9. Excludes data from the Saint John Police Service due to data quality concerns.
10. Trend numbers are based on the Incident-based Uniform Crime Reporting Survey, Trend Database, which, as of 2009, includes data from 99% of police services in Canada. As a result, trend numbers may not match those presented elsewhere in the report.
11. Excludes data from the territories. An urban area is defined as a census metropolitan area (CMA) or a census agglomeration (CA). A CMA consists of one or more neighbouring municipalities situated around a major urban core. A CMA must have a total population of at least 100,000, of which 50,000 or more live in the urban core. To be included in the CMA, adjacent municipalities must have a high degree of integration with the central urban area, as measured by commuting flows derived from census data. A CA must have a core population of at least 10,000. Rural areas are all areas outside of CMAs and CAs. The populations for urban and rural areas have been adjusted to reflect the actual policing boundaries within the urban and rural geographies and do not reflect the official Statistics Canada population for these geographies. Excludes data from the Royal Canadian Mounted Police's Canadian Police Centre for Missing and Exploited Children as it responds to incidents nationally. The incidents themselves and the offenders are not limited to one specific province or territory.
12. For a definition of a census metropolitan area, see endnote 11.
13. Between 2008 and 2018, 34% of incidents of family-related homicide against children and youth where a single victim and a single accused person were involved, police determined that a history of family violence preceded the homicide.
Statistics Canada—Catalogue no. 85-002-X
8
Juristat Article—Family violence in Canada: A statistical profile, 2018
Detailed data tables
Table 1.1 Child and youth victims of police-reported family and non-family violence, by victim sex, age group and relationship of accused to victim, Canada, 2018
Victim sex and relationship of accused to victim
Age group of victim
Total victims 5 years and
younger 6 to 11 years 12 to 14 years 15 to 17 years # % # % # % # % # %
Female victims Family relationship 1,984 71 3,708 58 2,686 26 3,039 21 11,417 33
Parent1 1,364 49 2,088 33 1,340 13 1,303 9 6,095 18 Sibling2 261 9 731 11 519 5 581 4 2,092 6 Other family3 359 13 889 14 827 8 1,155 8 3,230 9
Non-family relationship 815 29 2,654 42 7,825 74 11,753 79 23,047 67 Dating or other intimate
partner4 ... ... ... ... 875 8 2,981 20 3,856 11 Friend5 58 2 312 5 1,311 12 1,517 10 3,198 9 Casual acquaintance6 336 12 1,353 21 3,888 37 4,695 32 10,272 30 Authority figure7 203 7 316 5 267 3 267 2 1,053 3 Stranger 211 8 654 10 1,441 14 2,113 14 4,419 13 Other8 7 0.3 19 0.3 43 0.4 180 1 249 1
Unknown 15 ... 33 ... 104 ... 0 ... 152 ... Total female victims 2,814 100 6,395 100 10,615 100 14,792 100 34,616 100
Male victims Family relationship 1,721 72 2,933 50 1,400 19 1,494 14 7,548 29
Parent1 1,388 58 2,213 38 832 12 755 7 5,188 20 Sibling2 134 6 326 6 221 3 315 3 996 4 Other family3 199 8 394 7 347 5 424 4 1,364 5
Non-family relationship 679 28 2,877 50 5,809 81 9,068 86 18,433 71 Dating or other intimate
partner4 ... ... ... ... 50 1 307 3 357 1 Friend5 46 2 339 6 649 9 791 7 1,825 7 Casual acquaintance6 247 10 1,527 26 3,316 46 4,222 40 9,312 36 Authority figure7 199 8 374 6 181 3 162 2 916 4 Stranger 181 8 610 10 1,575 22 3,452 33 5,818 22 Other8 6 0.3 27 0.5 38 1 134 1 205 1
Unknown 10 ... 21 ... 15 ... 8 ... 54 ... Total male victims 2,410 100 5,831 100 7,224 100 10,570 100 26,035 100
Total victims Family relationship 3,705 71 6,641 55 4,086 23 4,533 18 18,965 31
Parent1 2,752 53 4,301 35 2,172 12 2,058 8 11,283 19 Sibling2 395 8 1,057 9 740 4 896 4 3,088 5 Other family3 558 11 1,283 11 1,174 7 1,579 6 4,594 8
See notes at the end of the table.
Statistics Canada—Catalogue no. 85-002-X
9
Juristat Article—Family violence in Canada: A statistical profile, 2018
Table 1.1 — end Child and youth victims of police-reported family and non-family violence, by victim sex, age group and relationship of accused to victim, Canada, 2018
Victim sex and relationship of accused to victim
Age group of victim
Total victims 5 years and
younger 6 to 11 years 12 to 14 years 15 to 17 years # % # % # % # % # %
Total victims Non-family relationship 1,494 29 5,531 45 13,634 77 20,821 82 41,480 69
Dating or other intimate partner4 ... ... ... ... 925 5 3,288 13 4,213 7
Friend5 104 2 651 5 1,960 11 2,308 9 5,023 8 Casual acquaintance6 583 11 2,880 24 7,204 41 8,917 35 19,584 32 Authority figure7 402 8 690 6 448 3 429 2 1,969 3 Stranger 392 8 1,264 10 3,016 17 5,565 22 10,237 17 Other8 13 0.3 46 0.4 81 0.5 314 1 454 1
Unknown 25 ... 54 ... 119 ... 8 ... 206 ... Total victims 5,224 100 12,226 100 17,839 100 25,362 100 60,651 100
... not applicable 1. Includes biological, step, adoptive and foster parents. 2. Includes biological, step, half, adoptive and foster brothers and sisters. 3. Includes all other family members related by blood, marriage (including common-law) or adoption. Examples include grandparents, uncles, aunts, cousins and in-laws. For victims aged 15 to 17 years, includes current and former legally married and common-law spouses. Also includes a small proportion of family violence victims where the relationship of accused to victim was miscoded. 4. Includes current and former dating partners or other intimate partners. Other intimate partners refers to violence committed by a person with whom the victim had a sexual relationship or a mutual sexual attraction. 5. Includes roommates. "Roommates" was added as a relationship category in 2013. 6. Includes neighbours. 7. Includes persons in a position of trust or authority who are not family members. Includes authority figures and reverse authority figures (e.g., student-to-teacher, patient-to-doctor, teen-to-youth counsellor, prisoner-to-guard). "Reverse authority figures" was added as a relationship category in 2013. 8. Includes business relationships and criminal relationships (relationships with the victim based on illegal activities, such as drugs or prostitution). Note: Family violence refers to violence committed by parents (biological, step, adopted and foster), siblings (biological, step, half, adopted and foster), extended family members (e.g., grandparents, uncles, aunts, cousins and in-laws) and spouses (legally married, separated, divorced and common-law). Victims refer to those aged 17 years and younger. Spousal violence victims under the age of 15 years and dating and other intimate partner violence victims under the age of 12 years are included in the category "unknown" and not in the categories related to spousal and intimate partner violence. Excludes victims where the sex or the age was unknown. Percentages have been calculated excluding unknown relationships. Percentages may not total 100% due to rounding. Source: Statistics Canada, Canadian Centre for Justice Statistics, Incident-based Uniform Crime Reporting Survey.

Statistics Canada—Catalogue no. 85-002-X
10
Juristat Article—Family violence in Canada: A statistical profile, 2018
Table 1.2 Child and youth victims of police-reported family and non-family violence, by victim sex, age group and type of violation, Canada, 2018
Victim sex and type of violation
Age group of victim
Total victims 5 years and
younger 6 to 11 years 12 to 14 years 15 to 17 years number rate number rate number rate number rate number rate
Family violence Female victims Homicide and other violations causing
death1 6 1 1 0.1 2 0.3 4 1 13 0.4 Attempted murder2 2 0.2 1 0.1 0 0 2 0.3 5 0.1 Sexual offences3 861 76 1,998 168 1,345 235 1,004 172 5,208 149
Sexual assault4 400 35 808 68 616 107 660 113 2,484 71 Sexual violations against children5 461 40 1,190 100 729 127 344 59 2,724 78
Physical assault6 792 69 1,404 118 1,134 198 1,646 281 4,976 143 Other offences involving violence or
the threat of violence7 323 28 304 25 205 36 383 65 1,215 35 Total female victims 1,984 174 3,708 311 2,686 469 3,039 520 11,417 327
Male victims Homicide and other violations causing
death1 7 1 1 0.1 1 0.2 2 0.3 11 0.3 Attempted murder2 4 0.3 7 1 0 0 2 0.3 13 0.4 Sexual offences3 320 27 547 44 195 33 116 19 1,178 32
Sexual assault4 144 12 277 22 101 17 90 15 612 17 Sexual violations against children5 176 15 270 22 94 16 26 4 566 16
Physical assault6 1,060 89 2,089 169 1,063 179 1,182 193 5,394 148 Other offences involving violence or
the threat of violence7 330 28 289 23 141 24 192 31 952 26 Total male victims 1,721 144 2,933 237 1,400 236 1,494 244 7,548 207
Total victims Homicide and other violations causing
death1 13 1 2 0.1 3 0.3 6 1 24 0.3 Attempted murder2 6 0.3 8 0.3 0 0 4 0.3 18 0.3 Sexual offences3 1,181 51 2,545 105 1,540 132 1,120 94 6,386 90
Sexual assault4 544 23 1,085 45 717 61 750 63 3,096 43 Sexual violations against children5 637 27 1,460 60 823 70 370 31 3,290 46
Physical assault6 1,852 79 3,493 144 2,197 188 2,828 236 10,370 145 Other offences involving violence or
the threat of violence7 653 28 593 24 346 30 575 48 2,167 30 Total victims 3,705 159 6,641 273 4,086 350 4,533 379 18,965 266
Non-family violence Female victims Homicide and other violations causing
death1 2 0.2 1 0.1 6 1 4 1 13 0.4 Attempted murder2 4 0.4 0 0 0 0 14 2 18 1 Sexual offences3 390 34 1,287 108 3,725 650 4,640 794 10,042 288
Sexual assault4 194 17 515 43 1,907 333 3,633 621 6,249 179 Sexual violations against children5 196 17 772 65 1,818 317 1,007 172 3,793 109
Physical assault6 257 23 811 68 2,138 373 4,202 719 7,408 212 Other offences involving violence or
the threat of violence7 162 14 555 47 1,956 341 2,893 495 5,566 159 Total female victims 815 71 2,654 223 7,825 1,366 11,753 2,010 23,047 660
See notes at the end of the table.
Statistics Canada—Catalogue no. 85-002-X
11
Juristat Article—Family violence in Canada: A statistical profile, 2018
Table 1.2 — end Child and youth victims of police-reported family and non-family violence, by victim sex, age group and type of violation, Canada, 2018
Victim sex and type of violation
Age group of victim
Total victims 5 years and
younger 6 to 11 years 12 to 14 years 15 to 17 years number rate number rate number rate number rate number rate
Non-family violence Male victims Homicide and other violations causing
death1 1 0.1 3 0.2 1 0.2 13 2 18 0.5 Attempted murder2 1 0.1 1 0.1 4 1 21 3 27 1 Sexual offences3 167 14 520 42 478 80 449 73 1,614 44
Sexual assault4 85 7 280 23 254 43 304 50 923 25 Sexual violations against children5 82 7 240 19 224 38 145 24 691 19
Physical assault6 332 28 1,705 138 3,262 549 4,935 807 10,234 281 Other offences involving violence or
the threat of violence7 178 15 648 52 2,064 347 3,650 597 6,540 180 Total male victims 679 57 2,877 232 5,809 977 9,068 1,483 18,433 506
Total victims Homicide and other violations causing
death1 3 0.1 4 0.2 7 1 17 1 31 0.4 Attempted murder2 5 0.2 1 0.04 4 0.3 35 3 45 1 Sexual offences3 557 24 1,807 74 4,203 360 5,089 425 11,656 163
Sexual assault4 279 12 795 33 2,161 185 3,937 329 7,172 101 Sexual violations against children5 278 12 1,012 42 2,042 175 1,152 96 4,484 63
Physical assault6 589 25 2,516 103 5,400 463 9,137 764 17,642 247 Other offences involving violence or
the threat of violence7 340 15 1,203 49 4,020 344 6,543 547 12,106 170 Total victims 1,494 64 5,531 228 13,634 1,168 20,821 1,741 41,480 582
1. Includes first degree murder, second degree murder, manslaughter, infanticide, criminal negligence causing death and other related violations causing death. 2. Includes conspiracy to commit murder. 3. Includes sexual assault and sexual violations against children. 4. Includes sexual assault level 1, sexual assault level 2 (with a weapon or causing bodily harm) and sexual assault level 3 (aggravated sexual assault). 5. Sexual violations against children refer to a set of Criminal Code offences that specifically concern offences involving child and youth victims. These include offences such as sexual interference, invitation to sexual touching and sexual exploitation, but exclude sexual assault (levels 1, 2 and 3) and other sexual offences not specific to children. 6. Includes assault level 1, assault level 2 (with a weapon or causing bodily harm) and assault level 3 (aggravated assault). 7. Includes all other violent violations not otherwise listed. Note: Rates are calculated on the basis of 100,000 population aged 17 years and younger. Populations based upon July 1st estimates from Statistics Canada, Demography Division. Family violence refers to violence committed by parents (biological, step, adopted and foster), siblings (biological, step, half, adopted and foster), extended family members (e.g., grandparents, uncles, aunts, cousins and in-laws) and spouses (legally married, separated, divorced and common-law). Victims refer to those aged 17 years and younger. Excludes spousal victims under the age of 15 years and victims of dating or other intimate partner violence under the age of 12 years. Excludes victims where the sex or the age was unknown or where the accused-victim relationship was unknown. Source: Statistics Canada, Canadian Centre for Justice Statistics, Incident-based Uniform Crime Reporting Survey.
Statistics Canada—Catalogue no. 85-002-X
12
Juristat Article—Family violence in Canada: A statistical profile, 2018
Table 1.3 Child and youth victims of police-reported family and non-family violence, by victim sex, type of violation and clearance status, Canada, 2018
Type of violation and clearance status
Family violence Non-family violence Total
victims1 Female victims
Male victims
Total victims
Female victims
Male victims
Total victims
# % # % # % # % # % # % % Sexual offences2
Not cleared3 2,218 43 574 49 2,792 44 4,806 48 795 49 5,601 48 47 Insufficient evidence to proceed 640 12 172 15 812 13 1,123 11 210 13 1,333 11 12 Other4 1,578 30 402 34 1,980 31 3,683 37 585 36 4,268 37 35
Cleared by charge5 2,382 46 433 37 2,815 44 3,822 38 518 32 4,340 37 40 Cleared otherwise 608 12 171 15 779 12 1,414 14 301 19 1,715 15 14
Victim/complainant requests no further action (accused identified)6 174 3 40 3 214 3 536 5 56 3 592 5 4
Reasons beyond the control of department 165 3 42 4 207 3 217 2 29 2 246 2 3
Departmental discretion 92 2 33 3 125 2 374 4 100 6 474 4 3 Other7 177 3 56 5 233 4 287 3 116 7 403 3 4
Total8 5,208 100 1,178 100 6,386 100 10,042 100 1,614 100 11,656 100 100 Physical assault9
Not cleared3 1,504 30 1,652 31 3,156 30 2,094 28 3,371 33 5,465 31 31 Insufficient evidence to proceed 384 8 426 8 810 8 321 4 470 5 791 4 6 Other4 1,120 23 1,226 23 2,346 23 1,773 24 2,901 28 4,674 26 25
Cleared by charge5 2,060 41 2,180 40 4,240 41 3,146 42 3,227 32 6,373 36 38 Cleared otherwise 1,412 28 1,562 29 2,974 29 2,168 29 3,636 36 5,804 33 31
Victim/complainant requests no further action (accused identified)6 499 10 516 10 1,015 10 702 9 1,134 11 1,836 10 10
Reasons beyond the control of department 288 6 374 7 662 6 89 1 150 1 239 1 3
Departmental discretion 533 11 584 11 1,117 11 938 13 1,544 15 2,482 14 13 Other7 92 2 88 2 180 2 439 6 808 8 1,247 7 5
Total8 4,976 100 5,394 100 10,370 100 7,408 100 10,234 100 17,642 100 100 Other offences involving violence or
the threat of violence10 Not cleared3 268 22 189 20 457 21 2,196 39 2,891 44 5,087 42 39
Insufficient evidence to proceed 63 5 46 5 109 5 386 7 498 8 884 7 7 Other4 205 17 143 15 348 16 1,810 33 2,393 37 4,203 35 32
Cleared by charge5 725 60 586 62 1,311 60 1,787 32 2,085 32 3,872 32 36 See notes at the end of the table.
Statistics Canada—Catalogue no. 85-002-X
13
Juristat Article—Family violence in Canada: A statistical profile, 2018
Table 1.3 — end Child and youth victims of police-reported family and non-family violence, by victim sex, type of violation and clearance status, Canada, 2018
Type of violation and clearance status
Family violence Non-family violence Total
victims1 Female victims
Male victims
Total victims
Female victims
Male victims
Total victims
# % # % # % # % # % # % % Other offences involving violence or
the threat of violence10 Cleared otherwise 222 18 177 19 399 18 1,583 28 1,564 24 3,147 26 25
Victim/complainant requests no further action (accused identified)6 80 7 58 6 138 6 485 9 528 8 1,013 8 8
Reasons beyond the control of department 57 5 55 6 112 5 87 2 82 1 169 1 2
Departmental discretion 63 5 48 5 111 5 723 13 647 10 1,370 11 10 Other7 22 2 16 2 38 2 288 5 307 5 595 5 4
Total8 1,215 100 952 100 2,167 100 5,566 100 6,540 100 12,106 100 100 1. Includes child and youth victims of family and non-family violence. 2. Includes sexual assault (level 1, level 2 [with a weapon or causing bodily harm] and level 3 [aggravated sexual assault]) and sexual violations against children. Sexual violations against children include offences such as sexual interference, invitation to sexual touching and sexual exploitation, but exclude sexual assault (levels 1, 2 and 3) and other sexual offences not specific to children. 3. Following the reclassification of founded and unfounded criminal incidents in the Uniform Crime Reporting Survey, a number of new clearance status categories were introduced in 2018. Replacing the former category of “not cleared,” new categories include insufficient evidence to proceed, open and still under investigation, and victim/complainant declines to proceed (no accused identified). As these new categories were implemented throughout the year, data for 2018 are subject to inconsistent reporting and should be used with caution. 4. Includes open and still under investigation, and victim/complainant declines to proceed (no accused identified). 5. Includes cleared by charge, charges recommended and charges recommended but all declined by Crown. 6. Includes incidents where an accused person was known and sufficient evidence was obtained to support the laying of a charge, but the complainant refused to proceed with charges against the accused. As a result, police used discretion to not lay or recommend a charge. 7. Includes suicide of accused, death of accused, death of witness/complainant, accused under the age of 12 years, accused has diplomatic immunity, committal of accused to mental health facility, accused in foreign country, accused involved in other incidents, accused already sentenced, diversionary programs, incident cleared by a lesser statute, and incident cleared by other municipal, provincial or federal agency. 8. For incidents that involve multiple victims, a single clearance status is recorded in relation to each victim in the incident. For instance, if charges are laid in relation to a violation against one of the victims, the clearance status for all victims will be "charged." Thus, under- or over-counts are possible with respect to clearance status. 9. Includes assault level 1, assault level 2 (with a weapon or causing bodily harm) and assault level 3 (aggravated assault). 10. Includes all other violent violations not otherwise listed; however, homicide, other violations causing death and attempted murder are excluded. Note: Family violence refers to violence committed by parents (biological, step, adopted and foster), siblings (biological, step, half, adopted and foster), extended family members (e.g., grandparents, uncles, aunts, cousins and in-laws) and spouses (legally married, separated, divorced and common-law). Victims refer to those aged 17 years and younger. Excludes spousal victims under the age of 15 years and victims of dating or other intimate partner violence under the age of 12 years. Excludes victims where the sex or the age was unknown or where the accused-victim relationship was unknown. Due to relatively small counts, data for homicide, other violations causing death and attempted murder are not shown in this table. Percentages may not total 100% due to rounding. In cases of domestic violence, every Canadian jurisdiction has implemented some form of pro-charging policies. The particular parameters of these pro-charging policies can vary regionally. Source: Statistics Canada, Canadian Centre for Justice Statistics, Incident-based Uniform Crime Reporting Survey.
Statistics Canada—Catalogue no. 85-002-X
14
Juristat Article—Family violence in Canada: A statistical profile, 2018
Table 1.4 Child and youth victims of police-reported family and non-family violence, by victim sex, incident location and relationship of accused to victim, Canada, 2018
Incident location
Family violence Non-family violence Parent1 Sibling2 Other family3 Total
Female victims
Male victims
Female victims
Male victims
Female victims
Male victims
Female victims
Male victims
Female victims
Male victims
percent Residential location and
occupancy status4 92 91 91 91 87 85 91 90 48 24 Victim and accused
occupied 73 75 62 72 34 42 60 69 10 12 Victim occupied
(no accused)5 11 11 16 12 25 23 16 13 38 43 Accused occupied
(no victim)6 11 10 13 9 23 18 15 11 26 16 Neither occupied7 5 5 9 6 18 17 9 7 26 29
Private property structure8 0.1 0.2 0.2 0.3 0.4 1 0.2 0.3 0.4 0.2
Commercial property9 1 2 1 1 1 2 1 2 6 7 School10 1 1 1 1 2 3 1 1 21 29 Open area11 4 4 4 5 6 7 5 5 20 35 Other12 2 2 2 1 2 2 2 2 4 5 Total 100 100 100 100 100 100 100 100 100 100 1. Includes biological, step, adoptive and foster parents. 2. Includes biological, step, half, adoptive and foster brothers and sisters. 3. Includes all other family members related by blood, marriage (including common-law) or adoption. Examples include grandparents, uncles, aunts, cousins and in-laws. For victims aged 15 to 17 years, includes current and former legally married and common-law spouses. Also includes a small proportion of family violence victims where the relationship of accused to victim was miscoded. 4. Includes single houses, dwelling units (e.g., apartment units, condo units), commercial dwelling units (e.g., hotel rooms), nursing homes, retirement homes, community group homes and halfway houses. Occupancy status applies only to residential locations. It describes whether the residence was occupied by the victim or the accused at the time of the incident. 5. Includes residential locations that was occupied by the victim but not occupied by the accused. Also includes residential locations occupied by the victim but unknown if occupied by the accused. 6. Includes residential locations that was occupied by the accused but not occupied by the victim. 7. Includes residential locations occupied by neither the victim nor the accused. Also includes residential locations not occupied by the victim but unknown if occupied by the accused. 8. Includes private property structures (e.g., sheds, detached garages, fishing boats). 9. Includes buildings, warehouses and corporate locations where the principal purpose is to conduct legitimate business for profit (e.g., banks, bars, restaurants, car dealerships, convenience stores, gas stations). 10. Includes schools—junior kindergarten through grade 13 or CÉGEP—and universities and colleges during supervised and unsupervised activities. 11. Includes parking lots, streets, roads, highways and other open areas (e.g., playgrounds, parks, fields). Also includes transit buses and bus shelters, subways and subway stations, and other forms of public transportation and connected facilities. 12. Includes religious institutions, hospitals, correctional institutions and other non-commercial locations (e.g., government buildings, community centres). Note: Family violence refers to violence committed by parents (biological, step, adopted and foster), siblings (biological, step, half, adopted and foster), extended family members (e.g., grandparents, uncles, aunts, cousins and in-laws) and spouses (legally married, separated, divorced and common-law). Victims refer to those aged 17 years and younger. Excludes spousal victims under the age of 15 years and victims of dating or other intimate partner violence under the age of 12 years. Excludes victims where the sex or the age was unknown or where the accused-victim relationship was unknown. Percentages have been calculated excluding unknown location and unknown occupancy. Percentages may not total 100% due to rounding. Source: Statistics Canada, Canadian Centre for Justice Statistics, Incident-based Uniform Crime Reporting Survey.

Statistics Canada—Catalogue no. 85-002-X
15
Juristat Article—Family violence in Canada: A statistical profile, 2018
Table 1.5 Child and youth victims of police-reported family and non-family violence, by sex of victim, type of weapon present and level of injury, Canada, 2018
Type of weapon present and level of injury
Family violence Non-family violence Female victims Male victims Total victims Female victims Male victims Total victims
# % # % # % # % # % # % No weapon1 544 7 204 4 748 6 2,271 13 746 5 3,017 10 Threats2 240 3 188 4 428 3 1,600 9 1,539 11 3,139 10 Physical force 5,884 78 3,533 72 9,417 75 11,382 67 7,909 56 19,291 62 Weapon 920 12 1,015 21 1,935 15 1,792 11 3,895 28 5,687 18
Firearm 34 0.4 44 1 78 1 220 1 671 5 891 3 Knife or other piercing
instrument3 196 3 227 5 423 3 525 3 1,522 11 2,047 7 Club or other blunt instrument 112 1 129 3 241 2 134 1 316 2 450 1 Other weapon4 578 8 615 12 1,193 10 913 5 1,386 10 2,299 7
Unknown 505 ... 201 ... 706 ... 750 ... 324 ... 1,074 ... Total type of weapon present 8,093 100 5,141 100 13,234 100 17,795 100 14,413 100 32,208 100 No injury5 4,797 66 2,551 55 7,348 62 11,647 70 8,389 61 20,036 66 Injury 2,429 34 2,104 45 4,533 38 4,956 30 5,310 39 10,266 34
Minor physical injury6 2,353 33 2,008 43 4,361 37 4,802 29 4,910 36 9,712 32 Major physical injury or
death7 76 1 96 2 172 1 154 1 400 3 554 2 Unknown 867 ... 486 ... 1,353 ... 1,192 ... 714 ... 1,906 ... Total level of injury 8,093 100 5,141 100 13,234 100 17,795 100 14,413 100 32,208 100 ... not applicable 1. Includes no threat, physical force or weapon. 2. Includes threats that are construed to imply that death or injury is possible. 3. Includes other piercing/cutting instruments, such as hatchets, razor blades and arrows. 4. Includes other types of weapons such as explosives, fire, motor vehicles, poison and weapons not otherwise classified. 5. Includes incidents that did not involve the use of weapons or physical force as well as those in which no visible injuries were noted by police. 6. Refers to injuries that required no professional medical treatment or only some first aid (e.g., bandage, ice). 7. Refers to injuries that required professional medical attention at the scene or transportation to a medical facility, or injuries that resulted in death. Note: The weapon present in an incident (if any) may or may not have caused the injury to the victim (if any). Family violence refers to violence committed by parents (biological, step, adopted and foster), siblings (biological, step, half, adopted and foster), extended family members (e.g., grandparents, uncles, aunts, cousins and in-laws) and spouses (legally married, separated, divorced and common-law). Victims refer to those aged 17 years and younger. Excludes spousal victims under the age of 15 years and victims of dating or other intimate partner violence under the age of 12 years. Excludes victims where the sex or the age was unknown or where the accused-victim relationship was unknown. Excludes data from the province of Quebec due to data quality concerns. Percentages have been calculated excluding unknown type of weapon and unknown level of injury. Percentages may not total 100% due to rounding. Source: Statistics Canada, Canadian Centre for Justice Statistics, Incident-based Uniform Crime Reporting Survey.
Statistics Canada—Catalogue no. 85-002-X
16
Juristat Article—Family violence in Canada: A statistical profile, 2018
Table 1.6 Persons accused of police-reported family and non-family violence against children and youth, by accused sex, age group and relationship of accused to victim, Canada, 2018
Accused sex and relationship of accused to victim
Age group of accused
Total accused 17 years and
younger 18 to 44 years 45 to 64 years 65 years and older
number rate number rate number rate number rate number rate Female accused
Family relationship 218 6 1,216 19 266 5 9 0.3 1,709 9 Parent1 11 0.3 927 14 196 4 2 0.1 1,136 6 Sibling2 118 3 102 2 18 0.4 5 0.2 243 1 Other family3 89 3 187 3 52 1 2 0.1 330 2
Non-family relationship 2,482 71 699 11 131 3 21 1 3,333 18 Dating or other intimate partner4 158 5 75 1 3 0.1 0 0 236 1 Friend5 482 14 75 1 1 0.02 0 0 558 3 Casual acquaintance6 1,681 48 339 5 38 1 9 0.3 2,067 11 Authority figure7 12 0.3 72 1 59 1 8 0.2 151 1 Stranger 137 4 132 2 27 1 4 0.1 300 2 Other8 12 0.3 6 0.1 3 0.1 0 0 21 0.1
Total female accused 2,700 77 1,915 29 397 8 30 1 5,042 27 Male accused
Family relationship 1,097 30 3,266 48 1,182 24 169 6 5,714 31 Parent1 28 1 1,933 29 813 16 31 1 2,805 15 Sibling2 584 16 461 7 98 2 59 2 1,202 7 Other family3 485 13 872 13 271 5 79 3 1,707 9
Non-family relationship 7,647 210 4,671 69 859 17 204 7 13,381 73 Dating or other intimate partner4 1,043 29 1,279 19 13 0.3 1 0.04 2,336 13 Friend5 1,331 37 456 7 55 1 10 0.4 1,852 10 Casual acquaintance6 4,614 127 1,658 25 358 7 67 2 6,697 37 Authority figure7 50 1 303 4 164 3 39 1 556 3 Stranger 574 16 903 13 238 5 79 3 1,794 10 Other8 35 1 72 1 31 1 8 0.3 146 1
Total male accused 8,744 240 7,937 118 2,041 41 373 13 19,095 105 Total accused
Family relationship 1,315 18 4,482 34 1,448 14 178 3 7,423 20 Parent1 39 1 2,860 22 1,009 10 33 1 3,941 11 Sibling2 702 10 563 4 116 1 64 1 1,445 4 Other family3 574 8 1,059 8 323 3 81 1 2,037 6
See notes at the end of the table.
Statistics Canada—Catalogue no. 85-002-X
17
Juristat Article—Family violence in Canada: A statistical profile, 2018
Table 1.6 — end Persons accused of police-reported family and non-family violence against children and youth, by accused sex, age group and relationship of accused to victim, Canada, 2018
Accused sex and relationship of accused to victim
Age group of accused
Total accused 17 years and
younger 18 to 44 years 45 to 64 years 65 years and older
number rate number rate number rate number rate number rate Total accused
Non-family relationship 10,129 142 5,370 40 990 10 225 4 16,714 46 Dating or other intimate partner4 1,201 17 1,354 10 16 0.2 1 0.02 2,572 7 Friend5 1,813 25 531 4 56 1 10 0.2 2,410 7 Casual acquaintance6 6,295 88 1,997 15 396 4 76 1 8,764 24 Authority figure7 62 1 375 3 223 2 47 1 707 2 Stranger 711 10 1,035 8 265 3 83 1 2,094 6 Other8 47 1 78 1 34 0.3 8 0.1 167 0.5
Total accused 11,444 160 9,852 74 2,438 24 403 7 24,137 66 1. Includes biological, step, adoptive and foster parents. 2. Includes biological, step, half, adoptive and foster brothers and sisters. 3. Includes all other family members related by blood, marriage (including common-law) or adoption. Examples include grandparents, uncles, aunts, cousins and in-laws. For accused and victims aged 15 to 17 years, includes current and former legally married and common-law spouses. Also includes a small proportion of family violence victims where the relationship of accused to victim was miscoded. 4. Includes current and former dating partners or other intimate partners. Other intimate partners refers to violence committed by a person with whom the victim had a sexual relationship or a mutual sexual attraction. 5. Includes roommates. "Roommates" was added as a relationship category in 2013. 6. Includes neighbours. 7. Includes persons in a position of trust or authority who are not family members. Includes authority figures and reverse authority figures (e.g., student-to-teacher, patient-to-doctor, teen-to-youth counsellor, prisoner-to-guard). "Reverse authority figures" was added as a relationship category in 2013. 8. Includes business relationships and criminal relationships (relationships with the victim based on illegal activities, such as drugs or prostitution). Note: Includes incidents with a single accused and a single victim. Rates are calculated on the basis of 100,000 population. Populations based upon July 1st estimates from Statistics Canada, Demography Division. Family violence refers to violence committed by parents (biological, step, adopted and foster), siblings (biological, step, half, adopted and foster), extended family members (e.g., grandparents, uncles, aunts, cousins and in-laws) and spouses (legally married, separated, divorced and common-law). Victims refer to those aged 17 years and younger. Excludes accused aged 90 years and older. Excludes accused and victims of spousal violence under the age of 15 years and accused and victims of dating or other intimate partner violence under the age of 12 years. Excludes accused and victims where the sex or the age was unknown or where the accused-victim relationship was unknown. Source: Statistics Canada, Canadian Centre for Justice Statistics, Incident-based Uniform Crime Reporting Survey.

Statistics Canada—Catalogue no. 85-002-X
18
Juristat Article—Family violence in Canada: A statistical profile, 2018
Table 1.7 Child and youth victims of police-reported family and non-family violence, by victim sex and province or territory, 2017 to 2018
Province or territory
2018 Percent change in rate:
2017 to 2018
Female victims Male victims Total victims Female victims
Male victims
Total victims
number rate number rate number rate percent Family violence
Newfoundland and Labrador 147 340 111 241 258 289 0.2 7 3 Prince Edward Island 49 339 43 291 92 315 62 64 62 Nova Scotia 322 401 211 251 533 325 4 3 4 New Brunswick1 262 434 151 241 413 336 15 1 9 Quebec 3,324 436 2,407 303 5,731 368 7 13 10 Ontario 2,983 225 1,946 141 4,929 182 10 7 8 Manitoba 699 483 394 262 1,093 370 7 6 6 Saskatchewan 730 565 461 344 1,191 453 -3 -14 -7 Alberta 1,427 302 927 188 2,354 244 -1 -1 -1 British Columbia 1,065 252 668 150 1,733 200 6 17 10 Yukon 25 654 17 404 42 523 30 -7 12 Northwest Territories 88 1,647 39 723 127 1,182 15 40 21 Nunavut 128 1,845 72 1,001 200 1,416 6 8 7 Canada 11,249 324 7,447 206 18,696 264 6 7 7
Non-family violence Newfoundland and Labrador 358 829 283 616 641 719 1 -9 -3
Prince Edward Island 111 769 45 305 156 534 22 -41 -7 Nova Scotia 652 813 506 603 1,158 705 -14 -5 -10 New Brunswick1 532 881 428 684 960 781 12 1 7 Quebec 5,252 689 4,020 506 9,272 596 4 -3 1 Ontario 7,376 557 6,875 497 14,251 526 3 -5 -1 Manitoba 1,720 1,190 1,023 679 2,743 929 -0.2 -7 -3 Saskatchewan 1,362 1,055 977 730 2,339 889 -9 -16 -13 Alberta 2,611 553 2,202 447 4,813 499 -3 -4 -3 British Columbia 2,337 553 1,701 383 4,038 466 5 -5 1 Yukon 83 2,172 33 785 116 1,445 5 8 6 Northwest Territories 153 2,863 77 1,427 230 2,141 -19 -8 -15 Nunavut 180 2,595 89 1,238 269 1,904 28 -15 9 Canada 22,727 655 18,259 504 40,986 578 1 -5 -2
1. Excludes data from the Saint John Police Service due to data quality concerns. Note: Rates are calculated on the basis of 100,000 population aged 17 years and younger. Populations based upon July 1st estimates from Statistics Canada, Demography Division. Family violence refers to violence committed by parents (biological, step, adopted and foster), siblings (biological, step, half, adopted and foster), extended family members (e.g., grandparents, uncles, aunts, cousins and in-laws) and spouses (legally married, separated, divorced and common-law). Victims refer to those aged 17 years and younger. Excludes spousal victims under the age of 15 years and victims of dating or other intimate partner violence under the age of 12 years. Excludes victims where the sex or the age was unknown or where the accused-victim relationship was unknown. Percentages may not total 100% due to rounding. Based on the Incident-based Uniform Crime Reporting Survey, Trend Database, which, as of 2009, includes data for 99% of the population in Canada. As a result, numbers may not match those presented elsewhere in the report. Source: Statistics Canada, Canadian Centre for Justice Statistics, Incident-based Uniform Crime Reporting Survey, Trend Database.
Statistics Canada—Catalogue no. 85-002-X
19
Juristat Article—Family violence in Canada: A statistical profile, 2018
Table 1.8 Child and youth victims of police-reported family and non-family violence, by victim sex, age group and urban or rural area, provinces, 2018
Victim sex and urban or rural area1
Age group of victim
Total victims 5 years and
younger 6 to 11 years 12 to 14 years 15 to 17 years number rate number rate number rate number rate number rate
Family violence Female victims 1,941 171 3,651 308 2,634 462 2,950 507 11,176 322
Urban 1,445 151 2,707 271 1,804 376 2,128 433 8,084 276 Rural 496 280 944 502 830 919 822 903 3,092 566
Male victims 1,699 143 2,893 235 1,374 232 1,454 239 7,420 205 Urban 1,359 135 2,194 212 965 194 976 190 5,494 180 Rural 340 183 699 355 409 434 478 500 1,926 336
Total victims 3,640 157 6,544 270 4,008 345 4,404 370 18,596 262 Urban 2,804 143 4,901 241 2,769 283 3,104 309 13,578 227 Rural 836 230 1,643 427 1,239 671 1,300 696 5,018 448
Non-family violence Female victims 806 71 2,600 219 7,710 1,351 11,515 1,977 22,631 651
Urban 630 66 1,892 189 5,836 1,215 8,910 1,814 17,268 590 Rural 176 99 708 377 1,874 2,075 2,605 2,861 5,363 981
Male victims 671 56 2,818 229 5,750 971 8,995 1,477 18,234 503 Urban 551 55 2,056 198 4,711 947 7,471 1,455 14,789 485 Rural 120 64 762 388 1,039 1,101 1,524 1,594 3,445 602
Total victims 1,477 64 5,418 224 13,460 1,158 20,510 1,721 40,865 576 Urban 1,181 60 3,948 194 10,547 1,079 16,381 1,630 32,057 536 Rural 296 81 1,470 382 2,913 1,578 4,129 2,212 8,808 787
1. An urban area is defined as a census metropolitan area (CMA) or a census agglomeration (CA). A CMA consists of one or more neighbouring municipalities situated around a major urban core. A CMA must have a total population of at least 100,000, of which 50,000 or more live in the urban core. To be included in the CMA, adjacent municipalities must have a high degree of integration with the central urban area, as measured by commuting flows derived from census data. A CA must have a core population of at least 10,000. Rural areas are all areas outside of CMAs and CAs. Note: Rates are calculated on the basis of 100,000 population aged 17 years and younger. Populations based upon July 1st estimates from Statistics Canada, Demography Division. The populations for urban and rural areas have been adjusted to reflect the actual policing boundaries within the urban and rural geographies and do not reflect the official Statistics Canada population for these geographies. Family violence refers to violence committed by parents (biological, step, adopted and foster), siblings (biological, step, half, adopted and foster), extended family members (e.g., grandparents, uncles, aunts, cousins and in-laws) and spouses (legally married, separated, divorced and common-law). Victims refer to those aged 17 years and younger. Excludes spousal victims under the age of 15 years and victims of dating or other intimate partner violence under the age of 12 years. Excludes victims where the sex or the age was unknown or where the accused-victim relationship was unknown. Excludes data from the territories. Excludes data from the Royal Canadian Mounted Police's Canadian Police Centre for Missing and Exploited Children as it responds to incidents nationally. The incidents themselves and the offenders are not limited to one specific province or territory. Source: Statistics Canada, Canadian Centre for Justice Statistics, Incident-based Uniform Crime Reporting Survey.
Statistics Canada—Catalogue no. 85-002-X
20
Juristat Article—Family violence in Canada: A statistical profile, 2018
Table 1.9 Child and youth victims of police-reported family and non-family violence, by victim sex and census metropolitan area, 2018
Census metropolitan area (CMA)1, 2
Family violence Non-family violence Female victims Male victims Total victims Female victims Male victims Total victims number rate number rate number rate number rate number rate number rate
St. John's 39 212 28 143 67 177 88 479 83 425 171 451 Halifax 153 416 118 307 271 361 273 743 239 622 512 681 Moncton 47 327 36 238 83 281 152 1,056 132 872 284 962 Saint John3 .. .. .. .. .. .. .. .. .. .. .. .. Saguenay 70 491 61 413 131 451 124 870 63 427 187 644 Québec 192 275 128 177 320 225 521 746 380 527 901 635 Sherbrooke 62 350 48 254 110 300 147 829 68 360 215 587 Trois-Rivières 62 502 37 283 99 389 95 769 74 566 169 664 Montréal 1,478 368 1,099 264 2,577 315 2,140 534 1,835 441 3,975 486 Gatineau4 133 390 117 329 250 359 246 722 196 550 442 634 Ottawa5 170 165 99 94 269 129 388 377 381 361 769 369 Kingston 31 216 15 100 46 157 122 851 57 379 179 609 Belleville6 35 339 27 252 62 295 101 979 42 391 143 679 Peterborough 25 231 12 108 37 168 69 638 35 314 104 473 Toronto7 951 182 712 130 1,663 155 2,403 460 3,004 548 5,407 505 Hamilton8 130 245 110 197 240 221 358 674 301 540 659 605 St. Catharines–Niagara 92 225 48 112 140 168 223 546 161 377 384 460 Kitchener–Cambridge–
Waterloo 215 367 150 247 365 306 452 772 404 666 856 718 Brantford 49 344 26 176 75 259 147 1,031 90 610 237 817 Guelph 27 198 9 63 36 129 71 522 69 484 140 503 London 100 196 74 140 174 167 285 558 219 414 504 485 Windsor 76 251 43 136 119 192 146 481 124 393 270 436 Barrie 39 161 21 85 60 123 111 459 92 372 203 415 Greater Sudbury 66 443 25 160 91 298 103 691 69 443 172 564 Thunder Bay 30 284 19 175 49 229 82 777 64 590 146 682 Winnipeg 229 283 106 126 335 203 674 834 418 497 1,092 662 Regina 84 302 60 208 144 254 215 773 143 497 358 632 Saskatoon 98 278 52 141 150 208 224 636 161 436 385 533 Lethbridge6 54 401 30 215 84 307 82 609 71 509 153 558 Calgary 373 234 286 171 659 202 710 446 858 514 1,568 481 Edmonton 371 247 206 133 577 189 837 557 639 412 1,476 483 Kelowna 17 99 17 96 34 98 74 430 57 323 131 376 Abbotsford–Mission 56 280 41 191 97 234 97 484 84 392 181 436 Vancouver 405 184 263 113 668 147 995 451 893 383 1,888 416 Victoria 79 262 49 159 128 210 165 548 116 377 281 461 See notes at the end of the table.
Statistics Canada—Catalogue no. 85-002-X
21
Juristat Article—Family violence in Canada: A statistical profile, 2018
Table 1.9 — end Child and youth victims of police-reported family and non-family violence, by victim sex and census metropolitan area, 2018
Census metropolitan area (CMA)1, 2
Family violence Non-family violence Female victims Male victims Total victims Female victims Male victims Total victims number rate number rate number rate number rate number rate number rate
CMA total9 6,220 250 4,280 165 10,500 207 13,434 540 12,141 468 25,575 503 Non-CMA total 5,197 519 3,268 312 8,465 413 9,613 959 6,292 601 15,905 776 Canada 11,417 327 7,548 207 18,965 266 23,047 660 18,433 506 41,480 582 .. not available for a specific reference period 1. A CMA consists of one or more neighbouring municipalities situated around a major urban core. A CMA must have a total population of at least 100,000, of which 50,000 or more live in the urban core. To be included in the CMA, adjacent municipalities must have a high degree of integration with the central urban area, as measured by commuting flows derived from census data. A CMA typically comprises more than one police service. 2. CMA populations have been adjusted to follow policing boundaries. The Oshawa CMA is excluded from this table due to the incongruity between the police service jurisdictional boundaries and the CMA boundaries. 3. Data for the CMA of Saint John are excluded due to data quality concerns associated with the Saint John Police Service. 4. Gatineau refers to the Quebec part of Ottawa–Gatineau CMA. 5. Ottawa refers to the Ontario part of the Ottawa–Gatineau CMA. 6. Following the 2016 Census of Population, Belleville and Lethbridge were reclassified as CMAs. 7. Excludes the portions of Halton Regional Police and Durham Regional Police that police the CMA of Toronto. 8. Excludes the portion of Halton Regional Police that polices the CMA of Hamilton. 9. Includes Halton Regional Police and Durham Regional Police, which are responsible for policing more than one CMA. This total also includes the portion of Durham Regional Police that polices the Oshawa CMA. Also includes the CMA of Saint John, excluding the Saint John Police Service due to data quality concerns. Because of these inclusions, the CMA total will not equal the total of the individual CMAs. Note: Rates are calculated on the basis of 100,000 population aged 17 years and younger. Populations based upon July 1st estimates from Statistics Canada, Demography Division. Family violence refers to violence committed by parents (biological, step, adopted and foster), siblings (biological, step, half, adopted and foster), extended family members (e.g., grandparents, uncles, aunts, cousins and in-laws) and spouses (legally married, separated, divorced and common-law). Victims refer to those aged 17 years and younger. Excludes spousal victims under the age of 15 years and victims of dating or other intimate partner violence under the age of 12 years. Excludes victims where the sex or the age was unknown or where the accused-victim relationship was unknown. Source: Statistics Canada, Canadian Centre for Justice Statistics, Incident-based Uniform Crime Reporting Survey.
Statistics Canada—Catalogue no. 85-002-X
22
Juristat Article—Family violence in Canada: A statistical profile, 2018
Table 1.10 Child and youth victims of family-related and non-family homicide, by age group of victim and type of motive, Canada, 2008 to 2018
Type of motive
Age group of victim Total victims 5 years and younger 6 to 11 years 12 to 14 years 15 to 17 years
number percent number percent number percent number percent number percent Family-related
homicide Frustration, anger or
despair 105 69 34 62 11 52 13 34 163 61 Argument or quarrel 4 3 5 9 4 19 9 24 22 8 Concealment1 14 9 0 0 0 0 0 0 14 5 Jealousy 6 4 4 7 1 5 2 5 13 5 Revenge 5 3 3 5 1 5 1 3 10 4 Other2 3 2 1 2 2 10 9 24 15 6 No apparent motive3 15 10 8 15 2 10 4 11 29 11 Unknown 11 ... 6 ... 1 ... 1 ... 19 ... Total 163 100 61 100 22 100 39 100 285 100
Non-family homicide Frustration, anger or
despair 16 70 0 0 6 23 13 10 35 18 Argument or quarrel 0 0 0 0 1 4 47 35 48 25 Concealment1 0 0 0 0 0 0 0 0 0 0 Jealousy 0 0 0 0 3 12 6 4 9 5 Revenge 1 4 1 13 2 8 10 7 14 7 Other2 2 9 6 75 7 27 39 29 54 28 No apparent motive3 4 17 1 13 7 27 21 15 33 17 Unknown 3 ... 1 ... 0 ... 11 ... 15 ... Total 26 100 9 100 26 100 147 100 208 100
... not applicable 1. Includes homicides committed to hide evidence of something (e.g., a pregnancy or birth of a child) or evidence of another criminal offence. This is typically the most common motive for infanticides. 2. Includes financial gain, mercy killing and sexual violence. 3. Includes mental illness and dementia. Note: In 34% of incidents of family-related homicide against children and youth where a single victim and a single accused person were involved, police determined that a history of family violence preceded the homicide. Family-related homicide refers to homicides committed by parents (biological, step, adopted and foster), siblings (biological, step, half, adopted and foster), extended family members (e.g., grandparents, uncles, aunts, cousins and in-laws) and spouses (legally married, separated, divorced and common-law). Victims refer to those aged 17 years and younger. Excludes victims of unsolved homicides, and victims where the sex or the age was unknown or where the accused-victim relationship was unknown. Percentages have been calculated excluding unknown motives. Percentages may not total 100% due to rounding. Source: Statistics Canada, Canadian Centre for Justice Statistics, Homicide Survey.
Statistics Canada—Catalogue no. 85-002-X
23
Juristat Article—Family violence in Canada: A statistical profile, 2018
Table 1.11 Child and youth victims of family-related and non-family homicide, by victim sex and year, Canada, 2008 to 2018
Year
Family-related homicide Non-family homicide Female victims Male victims Total victims Female victims Male victims Total victims
number rate number rate number rate number rate number rate number rate 2008 11 3.24 14 3.93 25 3.59 6 1.77 18 5.05 24 3.45 2009 19 5.61 22 6.18 41 5.90 7 2.07 22 6.18 29 4.17 2010 10 2.96 18 5.05 28 4.03 10 2.96 16 4.49 26 3.74 2011 13 3.85 17 4.77 30 4.32 8 2.37 15 4.21 23 3.31 2012 16 4.73 15 4.21 31 4.47 4 1.18 9 2.53 13 1.87 2013 9 2.66 13 3.65 22 3.17 2 0.59 8 2.25 10 1.44 2014 12 3.53 12 3.36 24 3.44 11 3.24 8 2.24 19 2.73 2015 13 3.80 15 4.19 28 4.00 6 1.75 12 3.35 18 2.57 2016 10 2.89 6 1.66 16 2.26 3 0.87 14 3.87 17 2.40 2017 13 3.73 11 3.02 24 3.37 4 1.15 12 3.30 16 2.25 2018 11 3.13 5 1.36 16 2.23 4 1.14 9 2.46 13 1.81 Note: Rates are calculated on the basis of 1 million population aged 17 years and younger. Populations based upon July 1st estimates from Statistics Canada, Demography Division. Family-related homicide refers to homicides committed by parents (biological, step, adopted and foster), siblings (biological, step, half, adopted and foster), extended family members (e.g., grandparents, uncles, aunts, cousins and in-laws) and spouses (legally married, separated, divorced and common-law). Victims refer to those aged 17 years and younger. Excludes victims of unsolved homicides, and victims where the sex or the age was unknown or where the accused-victim relationship was unknown. Source: Statistics Canada, Canadian Centre for Justice Statistics, Homicide Survey.
Statistics Canada—Catalogue no. 85-002-X
24
Juristat Article—Family violence in Canada: A statistical profile, 2018
Section 2: Police-reported intimate partner violence in Canada, 2018 by Marta Burczycka
Almost a third of all police-reported violence happens between intimate partners
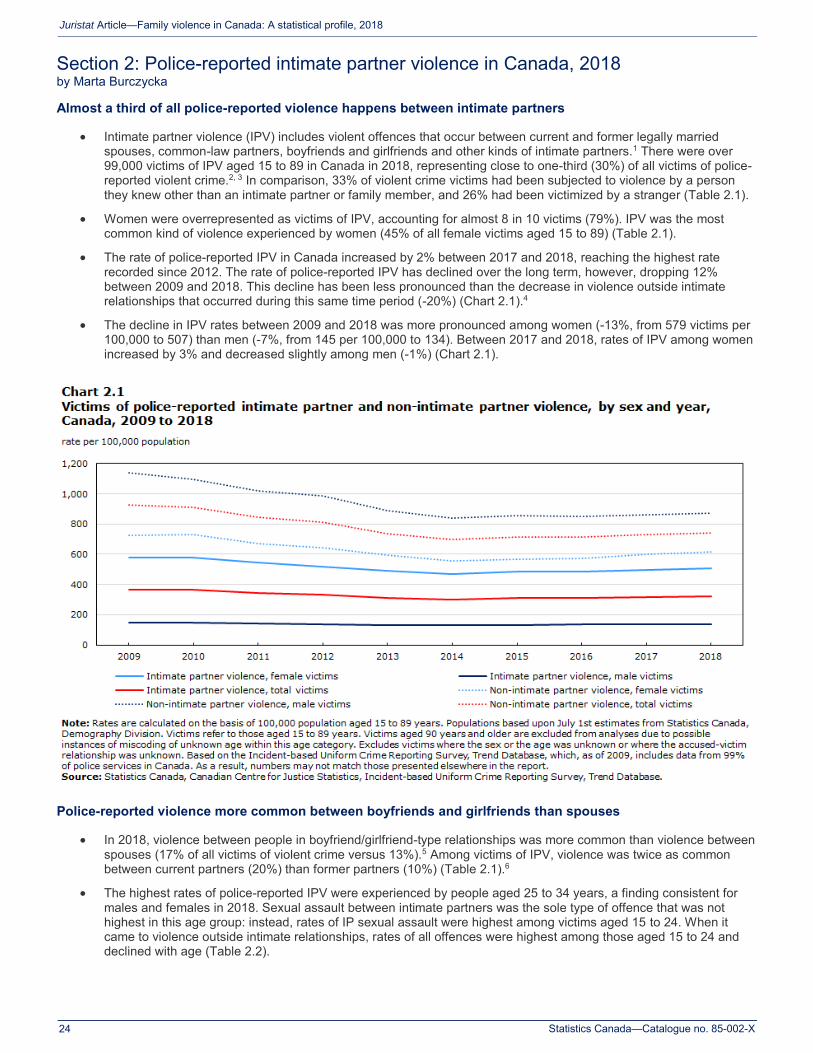
Intimate partner violence (IPV) includes violent offences that occur between current and former legally married spouses, common-law partners, boyfriends and girlfriends and other kinds of intimate partners.1 There were over 99,000 victims of IPV aged 15 to 89 in Canada in 2018, representing close to one-third (30%) of all victims of police-reported violent crime.2, 3 In comparison, 33% of violent crime victims had been subjected to violence by a person they knew other than an intimate partner or family member, and 26% had been victimized by a stranger (Table 2.1).
Women were overrepresented as victims of IPV, accounting for almost 8 in 10 victims (79%). IPV was the most common kind of violence experienced by women (45% of all female victims aged 15 to 89) (Table 2.1).
The rate of police-reported IPV in Canada increased by 2% between 2017 and 2018, reaching the highest rate recorded since 2012. The rate of police-reported IPV has declined over the long term, however, dropping 12% between 2009 and 2018. This decline has been less pronounced than the decrease in violence outside intimate relationships that occurred during this same time period (-20%) (Chart 2.1).4
The decline in IPV rates between 2009 and 2018 was more pronounced among women (-13%, from 579 victims per 100,000 to 507) than men (-7%, from 145 per 100,000 to 134). Between 2017 and 2018, rates of IPV among women increased by 3% and decreased slightly among men (-1%) (Chart 2.1).
Police-reported violence more common between boyfriends and girlfriends than spouses
In 2018, violence between people in boyfriend/girlfriend-type relationships was more common than violence between spouses (17% of all victims of violent crime versus 13%).5 Among victims of IPV, violence was twice as common between current partners (20%) than former partners (10%) (Table 2.1).6
The highest rates of police-reported IPV were experienced by people aged 25 to 34 years, a finding consistent for males and females in 2018. Sexual assault between intimate partners was the sole type of offence that was not highest in this age group: instead, rates of IP sexual assault were highest among victims aged 15 to 24. When it came to violence outside intimate relationships, rates of all offences were highest among those aged 15 to 24 and declined with age (Table 2.2).

Statistics Canada—Catalogue no. 85-002-X
25
Juristat Article—Family violence in Canada: A statistical profile, 2018
Police-reported violence by an intimate partner more likely to result in charges than violence by other people
A criminal incident is considered cleared when a charge is laid or recommended, or when it is dealt with by police in another way (for example, through referral to a diversionary program). When it came to physical assaults, violence committed by a current or former intimate partner was more likely to be cleared by charge than physical violence committed by someone else (74% of IPV physical assault victims versus 40% of non-IPV physical assault victims). Similarly, charges were laid for 50% of victims of sexual assaults committed by an intimate partner. This was true for 32% of victims of sexual assaults committed by someone else. These differences may be related to pro-charging policies, which have been implemented by every Canadian jurisdiction in order to address domestic violence (Table 2.3).7
For 40% of women and 52% of men who were victims of sexual assault by an intimate partner, cases remained uncleared in 2018. This included cases that were uncleared because there was insufficient evidence for police to lay a charge (9% of victims). When it came to victims whose cases were uncleared for this reason, proportions were considerably higher for victims of sexual assault than for victims of physical assault—both those who had been victimized by intimate partners (9% versus 3%) and by someone else (11% versus 4%) (Table 2.3).
Most police-reported IPV occurs in a dwelling occupied by both the victim and accused
In 2018, IPV most often occurred in a private dwelling (84%); half of these dwellings were the homes of both the victim and the accused (50%), and an additional 30% were the homes of only the victim—findings similar for both men and women who were victims.8 For one in ten victims (10%), the violence took place in an open area such as a street, park, or parking lot (Table 2.4).
Text box 2.1 Violence between partners who live together
Intimate partner violence includes violent offences that occur between current and former partners who may or may not live together. In Canada, individuals in an intimate relationship who share a dwelling without being legally married for at least one year (or where children are shared with respect to birth, adoption and/or custody and control) are referred to as “common-law spouses” or “common-law partners”.9 The distinction between a relationship in which individuals live separately (i.e., a boyfriend/girlfriend relationship) and one in which a dwelling is shared is important: leaving a violent relationship can be considerably more difficult if a victim shares children, a home and resources with their abuser.10
As the definition of common-law status varies depending on the nature of the relationship (see endnote 9), some people may live together without being considered common-law partners; alternatively, some partners may have reached common-law status but not be aware of it. The Uniform Crime Reporting Survey collects information on victims’ and accused persons’ relationship status separately from information on whether the people involved lived together at the time of the incident.11 Data from 2018 suggest that many individuals who reported being in a boyfriend or girlfriend relationship—where, unlike with common-law spouses, no cohabitation is implied—actually did live together at the time of the offence (Text table 1). In fact, about half (52%) of IPV victims who were in a boyfriend/girlfriend relationship with the accused lived with the accused at the time of the incident; just under one in ten (9%) of those victimized by a former boyfriend or girlfriend also lived with that person. These proportions were similar for both men and women who were victims of IPV.
Text box 2.1 table Victims of police-reported violence, by victim sex, relationship of accused to victim and whether or not the victim and accused lived together at the time of the incident, Canada, 2018
Relationship between victim and accused
Female victims Male victims Total victims Living
together Not living
together Living
together Not living
together Living
together Not living
together percent
Current spouse1 87 13 86 14 87 13 Former spouse1 18 82 20 80 18 82 Current boyfriend or girlfriend2 51 49 56 44 52 48 Former boyfriend or girlfriend2 9 91 11 89 9 91 Other intimate partner3 27 73 26 74 27 73 Total 49 51 52 48 50 50 1. Includes legally married and common-law spouses. Includes victims aged 15 to 89 years. 2. In previous editions of the Family Violence in Canada Juristat, this category was referred to as "dating partner." Includes victims aged 15 to 89 years. 3. Includes persons with whom victims had a sexual relationship or a mutual sexual attraction. Includes victims aged 15 to 89 years. Note: Excludes homicides, due to differences in reporting of whether or not the victim and accused lived together at the time of the incident. Victims aged 90 years and older are excluded from analyses due to possible instances of miscoding of unknown age within this age category. Excludes victims where the sex or the age was unknown or where the accused-victim relationship was unknown. Percentages may not total 100% due to rounding. Source: Statistics Canada, Canadian Centre for Justice Statistics, Incident-based Uniform Crime Reporting Survey.
Statistics Canada—Catalogue no. 85-002-X
26
Juristat Article—Family violence in Canada: A statistical profile, 2018
One in seven IPV victims experienced violence with a weapon present
The presence of a weapon can add to the severity of the violence, whether or not the weapon is used: its presence increases the potential threat of violence. A weapon was present in IPV involving about one in seven (15%) victims, a proportion that was considerably smaller than among victims of violence perpetrated by people other than intimate partners (25%).12 The presence of a weapon was more common in IPV involving male victims (24%) than female victims (13%) (Table 2.5).
The presence of firearms was rare in incidents of police-reported violence between intimate partners in 2018 (1%). In comparison, 4% of victims of non-IPV were involved in incidents where a firearm was present (Table 2.5). Overall, in 2018, 9% of all victims of police-reported violent crime where firearms were present had been victimized by an intimate partner.13
Over half of IPV victims (56%) sustained some form of physical injury as a result, with almost all injuries being minor (i.e., not requiring medical attention beyond some first aid). Major injuries and death resulted for 2% of victims. These proportions were similar for male and female victims—a contrast to non-IPV, where males were considerably more likely than females to sustain an injury (both minor and major) (Table 2.5).
Police-reported IPV rates highest among accused aged 25 to 34
For both men and women accused of police-reported IPV in 2018, rates were highest among accused aged 25 to 34 years (781 accused men per 100,000 men and 199 accused women per 100,000 women). Overall, people in that age group were accused of IPV at higher rates than any other kind of violence; the same was true for those aged 35 to 44 and 45 to 54 (Table 2.6).14
The rate of men aged 25 to 34 years who were accused of IPV far exceeded that of other types of violence: the rate of men in this age group accused of IPV was more than double the rate of those accused of violence against a friend, acquaintance or other non-family member known to the accused (364 per 100,000 population) (Table 2.6).
Women in rural areas experienced the highest rates of intimate partner violence
The geographical distribution of police-reported IPV generally mirrored that of other forms of violence, with the highest rates among the provinces being in Saskatchewan (655 victims per 100,000 people) and Manitoba (592) and lowest being in Ontario (243) and British Columbia (277). In all provinces, non-IPV rates were two to three times higher than IPV rates (Table 2.7).
In about half of the provinces and territories, rates of IPV recorded in 2018 were fairly stable in comparison to 2017. Elsewhere, in Prince Edward Island, 95 additional victims resulted in a 30% increase. The Northwest Territories (+12%), Nunavut (+9%), New Brunswick (+7%)15 and Ontario (+7%) also reported increases in the rate of IPV. Decreases were noted in Yukon (-4%) and Saskatchewan (-6%)—which, despite reporting the highest rate, recorded the largest decline (Table 2.7).16
Women in rural areas experienced the highest overall rates of IPV (789 victims per 100,000 population), with rates close to four times higher than those for men in these areas (218).17 Male victims in urban areas had the lowest overall rates of IPV in 2018 (117 victims per 100,000 population). IPV rates among female victims were also lower in urban areas, but remained close to four times higher than among their male counterparts (447) (Table 2.8).
Overall, rates of police-reported violent crime were higher in rural areas than in urban ones in 2018, and the same was true for IPV (499 victims per 100,000 population versus 284). However, the gap between urban and rural crime rates was slightly more pronounced when it came to violence between intimate partners: rural crime rates for IPV were 1.8 times higher than in urban areas, compared to 1.4 times higher for non-IPV rates (Table 2.8).
In 2018, Lethbridge (586 victims per 100,000 population), Regina (477), and Moncton (428) were the census metropolitan areas (CMAs) that recorded the highest rates of police-reported IPV.18 Lethbridge and Moncton also reported the two highest rates of violence committed by people other than intimate partners, while Regina ranked 9th of the 34 CMAs in Canada for which data are available (Table 2.9).
Six in ten spousal homicides preceded by a known history of family violence
Intimate partner homicides occur within complex interpersonal contexts that often involve a history of violence. When it came to homicides between spouses specifically,19 six in ten (60%) of those which occurred between 2008 and 2018 were preceded by a known history of family violence. The primary motive in these cases was most often an argument or quarrel (49%), frustration, anger or despair (26%) and jealousy (17%), a range of emotions typical of offenders exerting control over victims.20
Analyses of police-reported motives are important for violence prevention policy. An argument or quarrel was the most common primary motive for intimate partner homicides between 2008 and 2018 (40%), as it was for solved homicides that did not involve intimate partners (41%). Intimate partner homicides were considerably more likely to
Statistics Canada—Catalogue no. 85-002-X
27
Juristat Article—Family violence in Canada: A statistical profile, 2018
be motivated by frustration, anger or despair (28% versus 14%) and by jealousy (19% versus 4%), while homicides committed by people other than intimate partners were more likely to be motivated by financial gain (9% versus 3%) and by revenge (6% versus 2%) (Table 2.10).
Of the 945 intimate partner homicides which occurred between 2008 and 2018, a large majority (79%) involved female victims. Most female victims of intimate partner homicide were killed by a current or former legally married or common-law husband (73%), and boyfriends were responsible for the other quarter (26%) of female victims’ deaths. Most male victims were also killed by current or former legally married or common-law wives (59%) and girlfriends (28%), but a notable proportion were killed by same-sex spouses or dating partners (13%) (Table 2.11).
Notes
1. Other intimate partners include relationships where the people involved had a sexual relationship or a mutual sexual attraction but to which none of the other relationship options apply. This can include “one-night stands” or brief sexual relationships.
2. Excludes victims where the sex or the age was unknown. Counts represent the number of victims involved in incidents of intimate partner violence. It is possible that individual victims may have experienced more than one incident, and would therefore be counted more than once here.
3. Victims aged 90 years and older are excluded from analyses due to possible instances of miscoding of unknown age within this age category. Excludes victims where the sex or age was unknown. Percentages have been calculated excluding unknown relationship.
4. Trend numbers are based on the Incident-based Uniform Crime Reporting Survey Trend Database, which, as of 2009, includes data for 99% of the population in Canada. As a result, trend numbers may not match those presented elsewhere in the report.
5. The Uniform Crime Reporting Survey (UCR) defines boyfriend/girlfriend as “an intimate relationship with another person”. Though this category is separate from common-law partner—a relationship in which the partners live together—data show that in many instances, individuals scored as boyfriend/girlfriend in UCR data are actually cohabitating. For more information, see Text box 2.1.
6. For context, being married or living common-law are more common in the Canadian population than dating: according to the Census of Population, in 2016 57.5% of those aged 15 and older were married or living common-law. The remaining 42.5% were single or widowed (which include those in dating relationships). See Marital status and opposite- and same-sex status by sex for persons aged 15 and over living in private households for both sexes, total, presence and age of children, % distribution 2016, Canada, provinces and territories, 2016 Census.
7. The Final Report of the Ad Hoc Federal-Provincial-Territorial Working Group Reviewing Spousal Abuse Policies and Legislation provides the following information on pro-charging policy in Canada: “From 1983 to 1986, federal and provincial Attorneys General and Solicitors General adopted policy directives that required police and Crown prosecutors to charge and prosecute all incidents of spousal abuse where there were reasonable and probable grounds to believe that an offence had been committed […] Their specific application to spousal abuse cases played a pivotal role in helping to make a critical distinction between the criminal justice system’s treatment of spousal abuse as a ‘criminal matter’ and its historical treatment of spousal abuse as a ‘private matter’.” See https://justice.gc.ca/eng/rp-pr/cj-jp/fv-vf/pol/p2.html.
8. Data related to the occupancy of a dwelling are only collected when an incident takes place in a dwelling. For more information on IPV victims who did and did not live with the person accused of violence, see Text box 2.1.
9. The Canada Revenue Agency defines common-law status as living with a person who is not your spouse, but with whom there is a conjugal relationship, and with whom at least one of the following applies: 1) the persons have been living together in a conjugal relationship for at least 12 continuous months (including any period of separation because of a relationship breakdown that lasted less than 90 days); 2) the persons share a child by birth or adoption; or 3) one person has custody and control of the other’s child (or had custody and control immediately before the child turned 19 years of age) and the child is wholly dependent on that person for support. See Marital status (https://www.canada.ca/en/revenue-agency/services/tax/individuals/topics/about-your-tax-return/tax-return/completing-a-tax-return/personal-address-information/marital-status.html).
10. See Anderson, Deborah K., and Daniel G. Saunders. "Leaving an abusive partner: An empirical review of predictors, the process of leaving, and psychological well-being." Trauma, Violence, & Abuse 4, no. 2 (2003): 163-191.
11. A third data element, related to the location of the incident, also provides information on whether the persons involved lived together at the time of the incident. However, this data element only captures this information when the location of the incident was a dwelling. For more information, see Table 2.4.
12. Data on type of weapon present and level of injury exclude the province of Quebec due to data quality concerns.
13. Includes victims aged 15 to 89 where the age and sex of the victim as well as the relationship between the victim and the accused were known.
14. Includes incidents with a single accused and a single victim.
15. Excludes data from the Saint John Police Service due to data quality concerns.
Statistics Canada—Catalogue no. 85-002-X
28
Juristat Article—Family violence in Canada: A statistical profile, 2018
16. Trend numbers are based on the Incident-based Uniform Crime Reporting Survey Trend Database, which, as of 2009, includes data for 99% of the population in Canada. As a result, trend numbers may not match those presented elsewhere in the report.
17. Excludes data from the territories. An urban area is defined as a census metropolitan area (CMA) or a census agglomeration (CA). A CMA consists of one or more neighbouring municipalities situated around a major urban core. A CMA must have a total population of at least 100,000, of which 50,000 or more live in the urban core. To be included in the CMA, adjacent municipalities must have a high degree of integration with the central urban area, as measured by commuting flows derived from census data. A CA must have a core population of at least 10,000. Rural areas are all areas outside of CMAs and CAs. The populations for urban and rural areas have been adjusted to reflect the actual policing boundaries within the urban and rural geographies and do not reflect the official Statistics Canada population for these geographies. Excludes data from the Royal Canadian Mounted Police's Centre for Missing and Exploited Children as it responds to incidents nationally. The incidents themselves and the offenders are not limited to one specific province or territory.
18. For a definition of a census metropolitan area (CMA), see endnote 17.
19. Includes information on homicides that involved one victim and one accused person. Information on the history of family violence is not available for homicides that occurred between dating partners.
20. Data not shown.
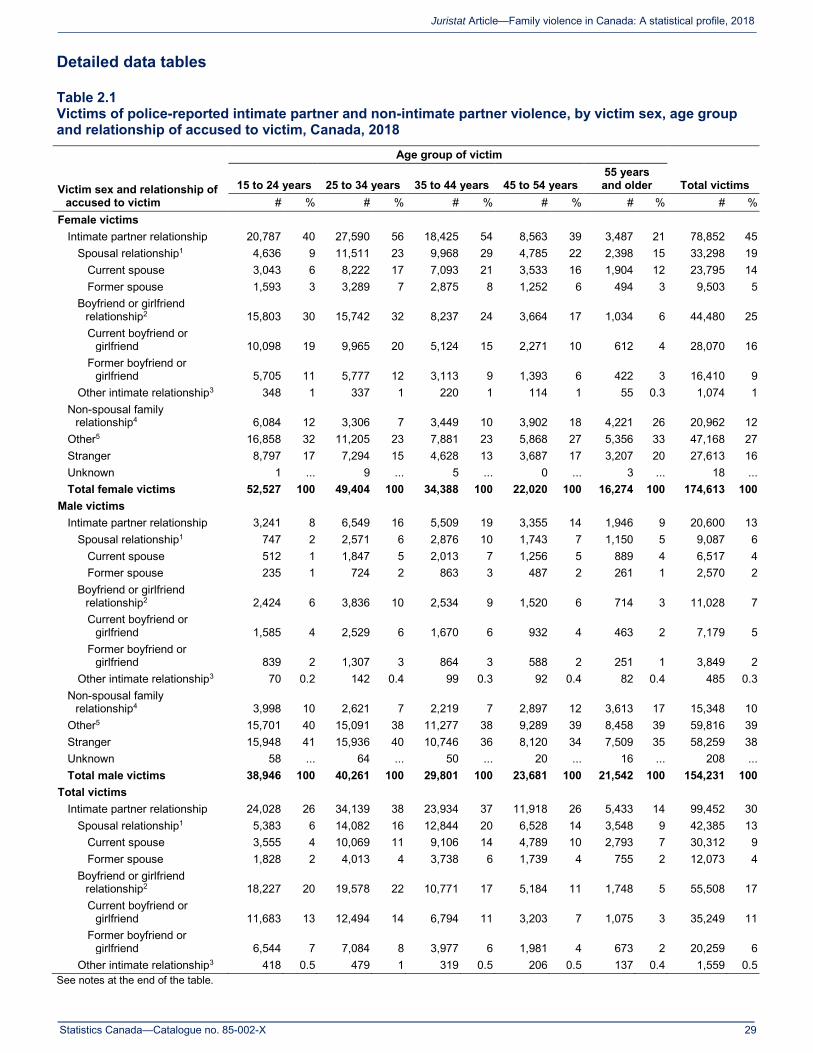
Statistics Canada—Catalogue no. 85-002-X
29
Juristat Article—Family violence in Canada: A statistical profile, 2018
Detailed data tables
Table 2.1 Victims of police-reported intimate partner and non-intimate partner violence, by victim sex, age group and relationship of accused to victim, Canada, 2018
Victim sex and relationship of accused to victim
Age group of victim
Total victims 15 to 24 years 25 to 34 years 35 to 44 years 45 to 54 years 55 years and older
# % # % # % # % # % # % Female victims
Intimate partner relationship 20,787 40 27,590 56 18,425 54 8,563 39 3,487 21 78,852 45 Spousal relationship1 4,636 9 11,511 23 9,968 29 4,785 22 2,398 15 33,298 19
Current spouse 3,043 6 8,222 17 7,093 21 3,533 16 1,904 12 23,795 14 Former spouse 1,593 3 3,289 7 2,875 8 1,252 6 494 3 9,503 5
Boyfriend or girlfriend relationship2 15,803 30 15,742 32 8,237 24 3,664 17 1,034 6 44,480 25 Current boyfriend or
girlfriend 10,098 19 9,965 20 5,124 15 2,271 10 612 4 28,070 16 Former boyfriend or
girlfriend 5,705 11 5,777 12 3,113 9 1,393 6 422 3 16,410 9 Other intimate relationship3 348 1 337 1 220 1 114 1 55 0.3 1,074 1
Non-spousal family relationship4 6,084 12 3,306 7 3,449 10 3,902 18 4,221 26 20,962 12
Other5 16,858 32 11,205 23 7,881 23 5,868 27 5,356 33 47,168 27 Stranger 8,797 17 7,294 15 4,628 13 3,687 17 3,207 20 27,613 16 Unknown 1 ... 9 ... 5 ... 0 ... 3 ... 18 ... Total female victims 52,527 100 49,404 100 34,388 100 22,020 100 16,274 100 174,613 100
Male victims Intimate partner relationship 3,241 8 6,549 16 5,509 19 3,355 14 1,946 9 20,600 13
Spousal relationship1 747 2 2,571 6 2,876 10 1,743 7 1,150 5 9,087 6 Current spouse 512 1 1,847 5 2,013 7 1,256 5 889 4 6,517 4 Former spouse 235 1 724 2 863 3 487 2 261 1 2,570 2
Boyfriend or girlfriend relationship2 2,424 6 3,836 10 2,534 9 1,520 6 714 3 11,028 7 Current boyfriend or
girlfriend 1,585 4 2,529 6 1,670 6 932 4 463 2 7,179 5 Former boyfriend or
girlfriend 839 2 1,307 3 864 3 588 2 251 1 3,849 2 Other intimate relationship3 70 0.2 142 0.4 99 0.3 92 0.4 82 0.4 485 0.3
Non-spousal family relationship4 3,998 10 2,621 7 2,219 7 2,897 12 3,613 17 15,348 10
Other5 15,701 40 15,091 38 11,277 38 9,289 39 8,458 39 59,816 39 Stranger 15,948 41 15,936 40 10,746 36 8,120 34 7,509 35 58,259 38 Unknown 58 ... 64 ... 50 ... 20 ... 16 ... 208 ... Total male victims 38,946 100 40,261 100 29,801 100 23,681 100 21,542 100 154,231 100
Total victims Intimate partner relationship 24,028 26 34,139 38 23,934 37 11,918 26 5,433 14 99,452 30
Spousal relationship1 5,383 6 14,082 16 12,844 20 6,528 14 3,548 9 42,385 13 Current spouse 3,555 4 10,069 11 9,106 14 4,789 10 2,793 7 30,312 9 Former spouse 1,828 2 4,013 4 3,738 6 1,739 4 755 2 12,073 4
Boyfriend or girlfriend relationship2 18,227 20 19,578 22 10,771 17 5,184 11 1,748 5 55,508 17 Current boyfriend or
girlfriend 11,683 13 12,494 14 6,794 11 3,203 7 1,075 3 35,249 11 Former boyfriend or
girlfriend 6,544 7 7,084 8 3,977 6 1,981 4 673 2 20,259 6 Other intimate relationship3 418 0.5 479 1 319 0.5 206 0.5 137 0.4 1,559 0.5
See notes at the end of the table.
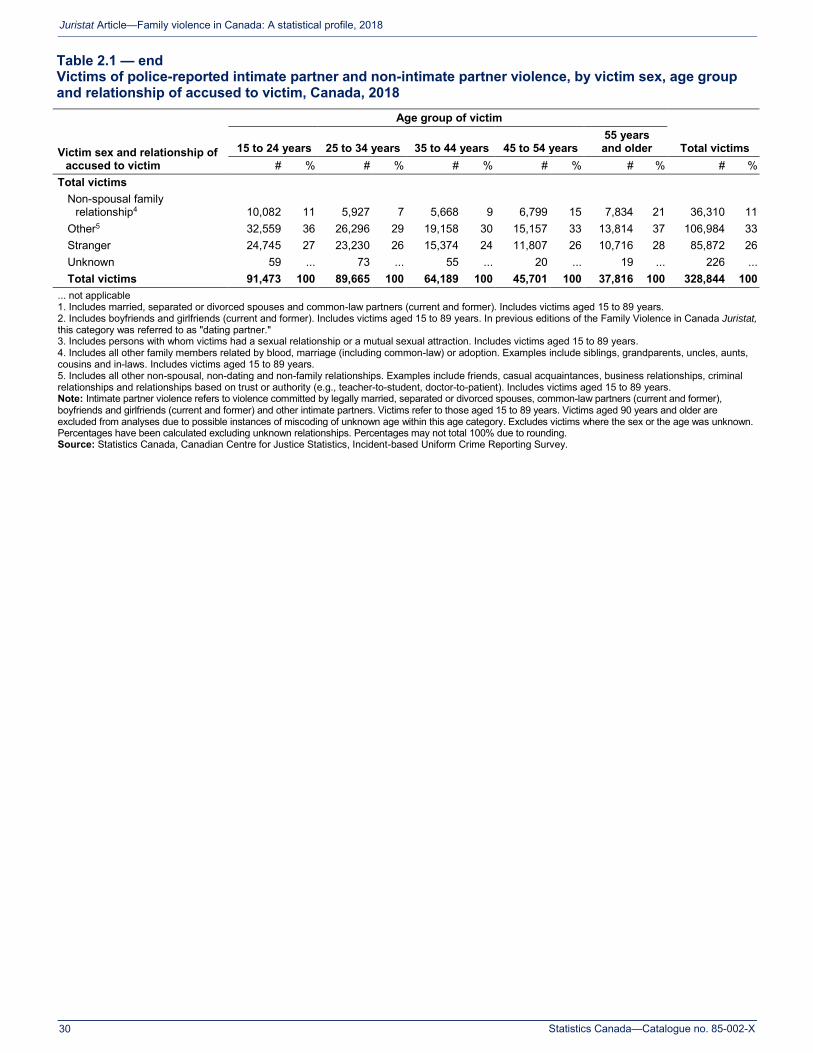
Statistics Canada—Catalogue no. 85-002-X
30
Juristat Article—Family violence in Canada: A statistical profile, 2018
Table 2.1 — end Victims of police-reported intimate partner and non-intimate partner violence, by victim sex, age group and relationship of accused to victim, Canada, 2018
Victim sex and relationship of accused to victim
Age group of victim
Total victims 15 to 24 years 25 to 34 years 35 to 44 years 45 to 54 years 55 years and older
# % # % # % # % # % # % Total victims
Non-spousal family relationship4 10,082 11 5,927 7 5,668 9 6,799 15 7,834 21 36,310 11
Other5 32,559 36 26,296 29 19,158 30 15,157 33 13,814 37 106,984 33 Stranger 24,745 27 23,230 26 15,374 24 11,807 26 10,716 28 85,872 26 Unknown 59 ... 73 ... 55 ... 20 ... 19 ... 226 ... Total victims 91,473 100 89,665 100 64,189 100 45,701 100 37,816 100 328,844 100
... not applicable 1. Includes married, separated or divorced spouses and common-law partners (current and former). Includes victims aged 15 to 89 years. 2. Includes boyfriends and girlfriends (current and former). Includes victims aged 15 to 89 years. In previous editions of the Family Violence in Canada Juristat, this category was referred to as "dating partner." 3. Includes persons with whom victims had a sexual relationship or a mutual sexual attraction. Includes victims aged 15 to 89 years. 4. Includes all other family members related by blood, marriage (including common-law) or adoption. Examples include siblings, grandparents, uncles, aunts, cousins and in-laws. Includes victims aged 15 to 89 years. 5. Includes all other non-spousal, non-dating and non-family relationships. Examples include friends, casual acquaintances, business relationships, criminal relationships and relationships based on trust or authority (e.g., teacher-to-student, doctor-to-patient). Includes victims aged 15 to 89 years. Note: Intimate partner violence refers to violence committed by legally married, separated or divorced spouses, common-law partners (current and former), boyfriends and girlfriends (current and former) and other intimate partners. Victims refer to those aged 15 to 89 years. Victims aged 90 years and older are excluded from analyses due to possible instances of miscoding of unknown age within this age category. Excludes victims where the sex or the age was unknown. Percentages have been calculated excluding unknown relationships. Percentages may not total 100% due to rounding. Source: Statistics Canada, Canadian Centre for Justice Statistics, Incident-based Uniform Crime Reporting Survey.
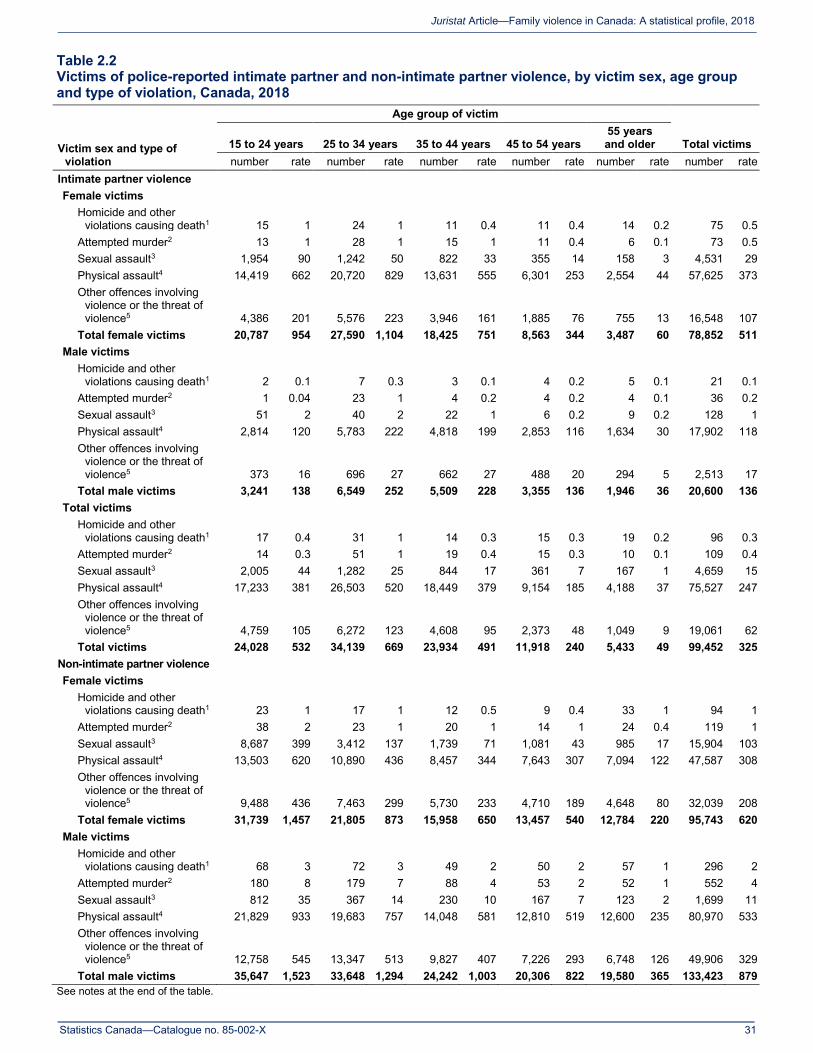
Statistics Canada—Catalogue no. 85-002-X
31
Juristat Article—Family violence in Canada: A statistical profile, 2018
Table 2.2 Victims of police-reported intimate partner and non-intimate partner violence, by victim sex, age group and type of violation, Canada, 2018
Victim sex and type of violation
Age group of victim
Total victims 15 to 24 years 25 to 34 years 35 to 44 years 45 to 54 years 55 years and older
number rate number rate number rate number rate number rate number rate Intimate partner violence
Female victims Homicide and other
violations causing death1 15 1 24 1 11 0.4 11 0.4 14 0.2 75 0.5 Attempted murder2 13 1 28 1 15 1 11 0.4 6 0.1 73 0.5 Sexual assault3 1,954 90 1,242 50 822 33 355 14 158 3 4,531 29 Physical assault4 14,419 662 20,720 829 13,631 555 6,301 253 2,554 44 57,625 373 Other offences involving
violence or the threat of violence5 4,386 201 5,576 223 3,946 161 1,885 76 755 13 16,548 107
Total female victims 20,787 954 27,590 1,104 18,425 751 8,563 344 3,487 60 78,852 511 Male victims
Homicide and other violations causing death1 2 0.1 7 0.3 3 0.1 4 0.2 5 0.1 21 0.1
Attempted murder2 1 0.04 23 1 4 0.2 4 0.2 4 0.1 36 0.2 Sexual assault3 51 2 40 2 22 1 6 0.2 9 0.2 128 1 Physical assault4 2,814 120 5,783 222 4,818 199 2,853 116 1,634 30 17,902 118 Other offences involving
violence or the threat of violence5 373 16 696 27 662 27 488 20 294 5 2,513 17
Total male victims 3,241 138 6,549 252 5,509 228 3,355 136 1,946 36 20,600 136 Total victims
Homicide and other violations causing death1 17 0.4 31 1 14 0.3 15 0.3 19 0.2 96 0.3
Attempted murder2 14 0.3 51 1 19 0.4 15 0.3 10 0.1 109 0.4 Sexual assault3 2,005 44 1,282 25 844 17 361 7 167 1 4,659 15 Physical assault4 17,233 381 26,503 520 18,449 379 9,154 185 4,188 37 75,527 247 Other offences involving
violence or the threat of violence5 4,759 105 6,272 123 4,608 95 2,373 48 1,049 9 19,061 62
Total victims 24,028 532 34,139 669 23,934 491 11,918 240 5,433 49 99,452 325 Non-intimate partner violence
Female victims Homicide and other
violations causing death1 23 1 17 1 12 0.5 9 0.4 33 1 94 1 Attempted murder2 38 2 23 1 20 1 14 1 24 0.4 119 1 Sexual assault3 8,687 399 3,412 137 1,739 71 1,081 43 985 17 15,904 103 Physical assault4 13,503 620 10,890 436 8,457 344 7,643 307 7,094 122 47,587 308 Other offences involving
violence or the threat of violence5 9,488 436 7,463 299 5,730 233 4,710 189 4,648 80 32,039 208
Total female victims 31,739 1,457 21,805 873 15,958 650 13,457 540 12,784 220 95,743 620 Male victims
Homicide and other violations causing death1 68 3 72 3 49 2 50 2 57 1 296 2
Attempted murder2 180 8 179 7 88 4 53 2 52 1 552 4 Sexual assault3 812 35 367 14 230 10 167 7 123 2 1,699 11 Physical assault4 21,829 933 19,683 757 14,048 581 12,810 519 12,600 235 80,970 533 Other offences involving
violence or the threat of violence5 12,758 545 13,347 513 9,827 407 7,226 293 6,748 126 49,906 329
Total male victims 35,647 1,523 33,648 1,294 24,242 1,003 20,306 822 19,580 365 133,423 879 See notes at the end of the table.
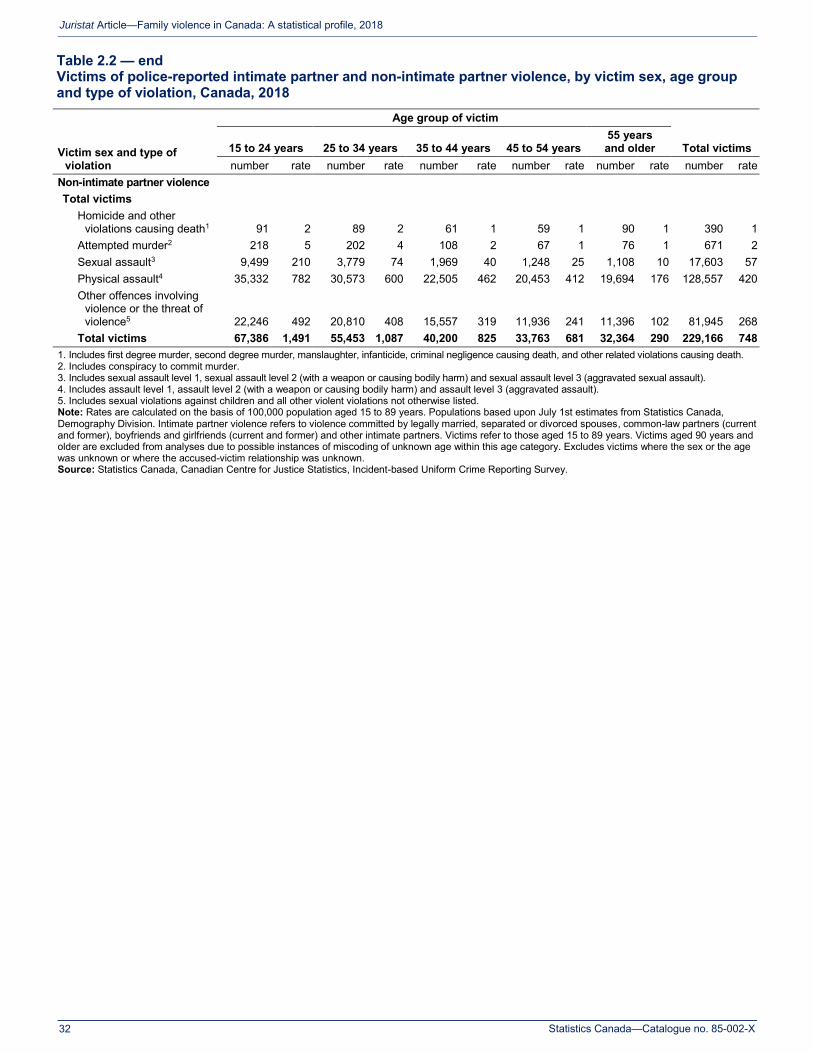
Statistics Canada—Catalogue no. 85-002-X
32
Juristat Article—Family violence in Canada: A statistical profile, 2018
Table 2.2 — end Victims of police-reported intimate partner and non-intimate partner violence, by victim sex, age group and type of violation, Canada, 2018
Victim sex and type of violation
Age group of victim
Total victims 15 to 24 years 25 to 34 years 35 to 44 years 45 to 54 years 55 years and older
number rate number rate number rate number rate number rate number rate Non-intimate partner violence
Total victims Homicide and other
violations causing death1 91 2 89 2 61 1 59 1 90 1 390 1 Attempted murder2 218 5 202 4 108 2 67 1 76 1 671 2 Sexual assault3 9,499 210 3,779 74 1,969 40 1,248 25 1,108 10 17,603 57 Physical assault4 35,332 782 30,573 600 22,505 462 20,453 412 19,694 176 128,557 420 Other offences involving
violence or the threat of violence5 22,246 492 20,810 408 15,557 319 11,936 241 11,396 102 81,945 268
Total victims 67,386 1,491 55,453 1,087 40,200 825 33,763 681 32,364 290 229,166 748 1. Includes first degree murder, second degree murder, manslaughter, infanticide, criminal negligence causing death, and other related violations causing death. 2. Includes conspiracy to commit murder. 3. Includes sexual assault level 1, sexual assault level 2 (with a weapon or causing bodily harm) and sexual assault level 3 (aggravated sexual assault). 4. Includes assault level 1, assault level 2 (with a weapon or causing bodily harm) and assault level 3 (aggravated assault). 5. Includes sexual violations against children and all other violent violations not otherwise listed. Note: Rates are calculated on the basis of 100,000 population aged 15 to 89 years. Populations based upon July 1st estimates from Statistics Canada, Demography Division. Intimate partner violence refers to violence committed by legally married, separated or divorced spouses, common-law partners (current and former), boyfriends and girlfriends (current and former) and other intimate partners. Victims refer to those aged 15 to 89 years. Victims aged 90 years and older are excluded from analyses due to possible instances of miscoding of unknown age within this age category. Excludes victims where the sex or the age was unknown or where the accused-victim relationship was unknown. Source: Statistics Canada, Canadian Centre for Justice Statistics, Incident-based Uniform Crime Reporting Survey.
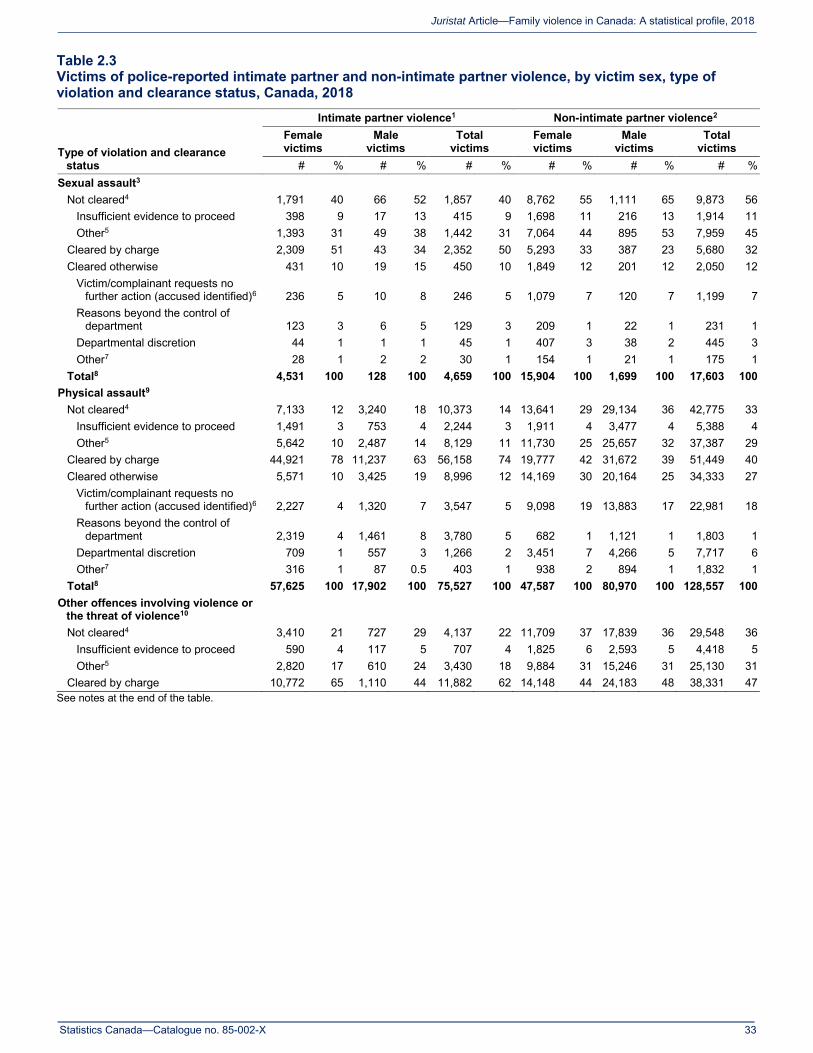
Statistics Canada—Catalogue no. 85-002-X
33
Juristat Article—Family violence in Canada: A statistical profile, 2018
Table 2.3 Victims of police-reported intimate partner and non-intimate partner violence, by victim sex, type of violation and clearance status, Canada, 2018
Type of violation and clearance status
Intimate partner violence1 Non-intimate partner violence2 Female victims
Male victims
Total victims
Female victims
Male victims
Total victims
# % # % # % # % # % # % Sexual assault3
Not cleared4 1,791 40 66 52 1,857 40 8,762 55 1,111 65 9,873 56 Insufficient evidence to proceed 398 9 17 13 415 9 1,698 11 216 13 1,914 11 Other5 1,393 31 49 38 1,442 31 7,064 44 895 53 7,959 45
Cleared by charge 2,309 51 43 34 2,352 50 5,293 33 387 23 5,680 32 Cleared otherwise 431 10 19 15 450 10 1,849 12 201 12 2,050 12
Victim/complainant requests no further action (accused identified)6 236 5 10 8 246 5 1,079 7 120 7 1,199 7
Reasons beyond the control of department 123 3 6 5 129 3 209 1 22 1 231 1
Departmental discretion 44 1 1 1 45 1 407 3 38 2 445 3 Other7 28 1 2 2 30 1 154 1 21 1 175 1
Total8 4,531 100 128 100 4,659 100 15,904 100 1,699 100 17,603 100 Physical assault9
Not cleared4 7,133 12 3,240 18 10,373 14 13,641 29 29,134 36 42,775 33 Insufficient evidence to proceed 1,491 3 753 4 2,244 3 1,911 4 3,477 4 5,388 4 Other5 5,642 10 2,487 14 8,129 11 11,730 25 25,657 32 37,387 29
Cleared by charge 44,921 78 11,237 63 56,158 74 19,777 42 31,672 39 51,449 40 Cleared otherwise 5,571 10 3,425 19 8,996 12 14,169 30 20,164 25 34,333 27
Victim/complainant requests no further action (accused identified)6 2,227 4 1,320 7 3,547 5 9,098 19 13,883 17 22,981 18
Reasons beyond the control of department 2,319 4 1,461 8 3,780 5 682 1 1,121 1 1,803 1
Departmental discretion 709 1 557 3 1,266 2 3,451 7 4,266 5 7,717 6 Other7 316 1 87 0.5 403 1 938 2 894 1 1,832 1
Total8 57,625 100 17,902 100 75,527 100 47,587 100 80,970 100 128,557 100 Other offences involving violence or
the threat of violence10 Not cleared4 3,410 21 727 29 4,137 22 11,709 37 17,839 36 29,548 36
Insufficient evidence to proceed 590 4 117 5 707 4 1,825 6 2,593 5 4,418 5 Other5 2,820 17 610 24 3,430 18 9,884 31 15,246 31 25,130 31
Cleared by charge 10,772 65 1,110 44 11,882 62 14,148 44 24,183 48 38,331 47 See notes at the end of the table.

Statistics Canada—Catalogue no. 85-002-X
34
Juristat Article—Family violence in Canada: A statistical profile, 2018
Table 2.3 — end Victims of police-reported intimate partner and non-intimate partner violence, by victim sex, type of violation and clearance status, Canada, 2018
Type of violation and clearance status
Intimate partner violence1 Non-intimate partner violence2 Female victims
Male victims
Total victims
Female victims
Male victims
Total victims
# % # % # % # % # % # % Other offences involving violence or
the threat of violence10 Cleared otherwise 2,366 14 676 27 3,042 16 6,182 19 7,884 16 14,066 17
Victim/complainant requests no further action (accused identified)6 994 6 326 13 1,320 7 3,207 10 4,348 9 7,555 9
Reasons beyond the control of department 610 4 154 6 764 4 609 2 848 2 1,457 2
Departmental discretion 616 4 172 7 788 4 1,888 6 2,184 4 4,072 5 Other7 146 1 24 1 170 1 478 1 504 1 982 1
Total8 16,548 100 2,513 100 19,061 100 32,039 100 49,906 100 81,945 100 1. Includes current and former married, separated or divorced spouses and common-law partners, boyfriends and girlfriends and other intimate partners. Includes victims aged 15 to 89 years. 2. Includes victims aged 15 to 89 years. Excludes unknown relationships. 3. Includes sexual assault level 1, sexual assault level 2 (with a weapon or causing bodily harm) and sexual assault level 3 (aggravated sexual assault). 4. Following the reclassification of founded and unfounded criminal incidents in the Uniform Crime Reporting Survey, a number of new clearance status categories were introduced in 2018. Replacing the former category of “not cleared,” new categories include insufficient evidence to proceed, open and still under investigation, and victim/complainant declines to proceed (no accused identified). As these new categories were implemented throughout the year, data for 2018 are subject to inconsistent reporting and should be used with caution. 5. Includes open and still under investigation, and victim/complainant declines to proceed (no accused identified). 6. Includes incidents where an accused person was known and sufficient evidence was obtained to support the laying of a charge, but the complainant refused to proceed with charges against the accused. As a result, police used discretion to not lay or recommend a charge. 7. Includes suicide of accused, death of accused, death of witness/complainant, accused under the age of 12 years, accused has diplomatic immunity, committal of accused to mental health facility, accused in foreign country, accused involved in other incidents, accused already sentenced, diversionary programs, incident cleared by a lesser statute, and incident cleared by other municipal, provincial or federal agency. 8. For incidents that involve multiple victims, a single clearance status is recorded in relation to each victim in the incident. For instance, if charges are laid in relation to a violation against one of the victims, the clearance status for all victims will be "charged." Thus, under- or over-counts are possible with respect to clearance status. 9. Includes assault level 1, assault level 2 (with a weapon or causing bodily harm) and assault level 3 (aggravated assault). 10. Includes sexual violations against children and all other violent violations not otherwise listed; however, homicide, other violations causing death and attempted murder are excluded. Note: Intimate partner violence refers to violence committed by legally married, separated or divorced spouses, common-law partners (current and former), boyfriends and girlfriends (current and former) and other intimate partners. Victims refer to those aged 15 to 89 years. Victims aged 90 years and older are excluded from analyses due to possible instances of miscoding of unknown age within this age category. Excludes victims where the sex or the age was unknown or where the accused-victim relationship was unknown. Due to relatively small counts, data for homicide, other violations causing death and attempted murder are not shown in this table. Percentages may not total 100% due to rounding. In cases of domestic violence, every Canadian jurisdiction has implemented some form of pro-charging policies. The particular parameters of these pro-charging policies can vary regionally. Source: Statistics Canada, Canadian Centre for Justice Statistics, Incident-based Uniform Crime Reporting Survey.
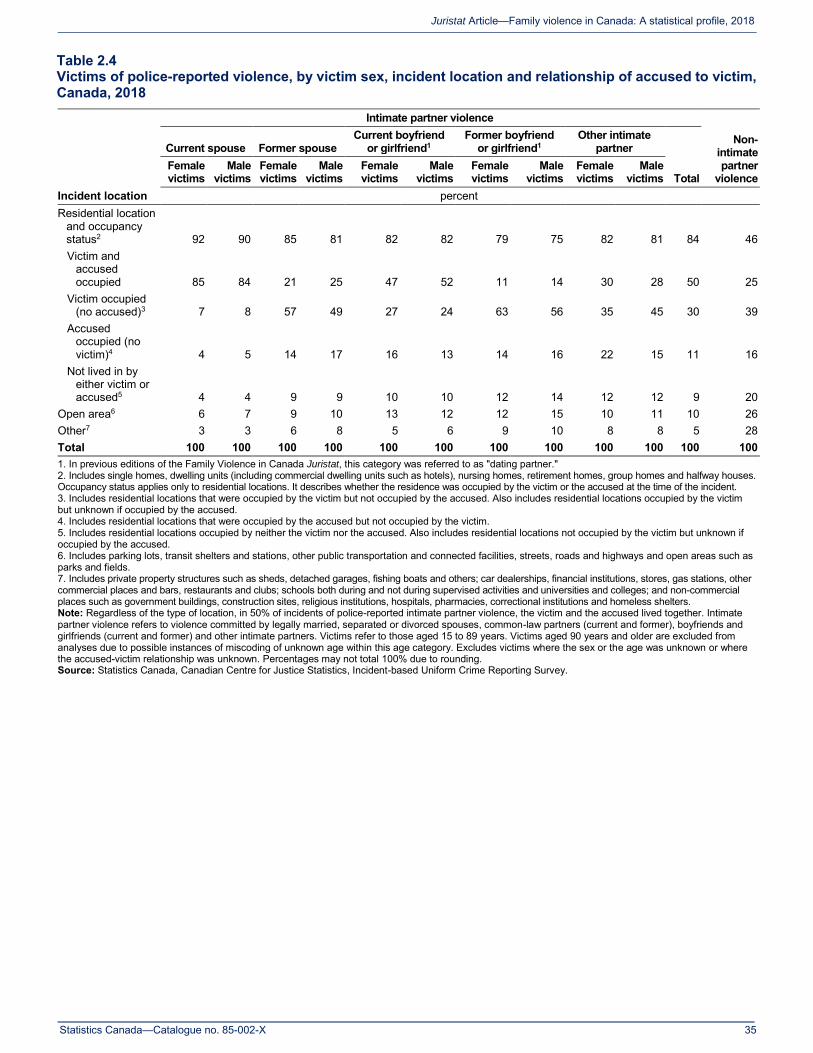
Statistics Canada—Catalogue no. 85-002-X
35
Juristat Article—Family violence in Canada: A statistical profile, 2018
Table 2.4 Victims of police-reported violence, by victim sex, incident location and relationship of accused to victim, Canada, 2018
Incident location
Intimate partner violence
Non-intimate partner
violence
Current spouse Former spouse Current boyfriend
or girlfriend1 Former boyfriend
or girlfriend1 Other intimate
partner
Total Female victims
Male victims
Female victims
Male victims
Female victims
Male victims
Female victims
Male victims
Female victims
Male victims
percent Residential location
and occupancy status2 92 90 85 81 82 82 79 75 82 81 84 46 Victim and
accused occupied 85 84 21 25 47 52 11 14 30 28 50 25
Victim occupied (no accused)3 7 8 57 49 27 24 63 56 35 45 30 39
Accused occupied (no victim)4 4 5 14 17 16 13 14 16 22 15 11 16
Not lived in by either victim or accused5 4 4 9 9 10 10 12 14 12 12 9 20
Open area6 6 7 9 10 13 12 12 15 10 11 10 26 Other7 3 3 6 8 5 6 9 10 8 8 5 28 Total 100 100 100 100 100 100 100 100 100 100 100 100 1. In previous editions of the Family Violence in Canada Juristat, this category was referred to as "dating partner." 2. Includes single homes, dwelling units (including commercial dwelling units such as hotels), nursing homes, retirement homes, group homes and halfway houses. Occupancy status applies only to residential locations. It describes whether the residence was occupied by the victim or the accused at the time of the incident. 3. Includes residential locations that were occupied by the victim but not occupied by the accused. Also includes residential locations occupied by the victim but unknown if occupied by the accused. 4. Includes residential locations that were occupied by the accused but not occupied by the victim. 5. Includes residential locations occupied by neither the victim nor the accused. Also includes residential locations not occupied by the victim but unknown if occupied by the accused. 6. Includes parking lots, transit shelters and stations, other public transportation and connected facilities, streets, roads and highways and open areas such as parks and fields. 7. Includes private property structures such as sheds, detached garages, fishing boats and others; car dealerships, financial institutions, stores, gas stations, other commercial places and bars, restaurants and clubs; schools both during and not during supervised activities and universities and colleges; and non-commercial places such as government buildings, construction sites, religious institutions, hospitals, pharmacies, correctional institutions and homeless shelters. Note: Regardless of the type of location, in 50% of incidents of police-reported intimate partner violence, the victim and the accused lived together. Intimate partner violence refers to violence committed by legally married, separated or divorced spouses, common-law partners (current and former), boyfriends and girlfriends (current and former) and other intimate partners. Victims refer to those aged 15 to 89 years. Victims aged 90 years and older are excluded from analyses due to possible instances of miscoding of unknown age within this age category. Excludes victims where the sex or the age was unknown or where the accused-victim relationship was unknown. Percentages may not total 100% due to rounding. Source: Statistics Canada, Canadian Centre for Justice Statistics, Incident-based Uniform Crime Reporting Survey.
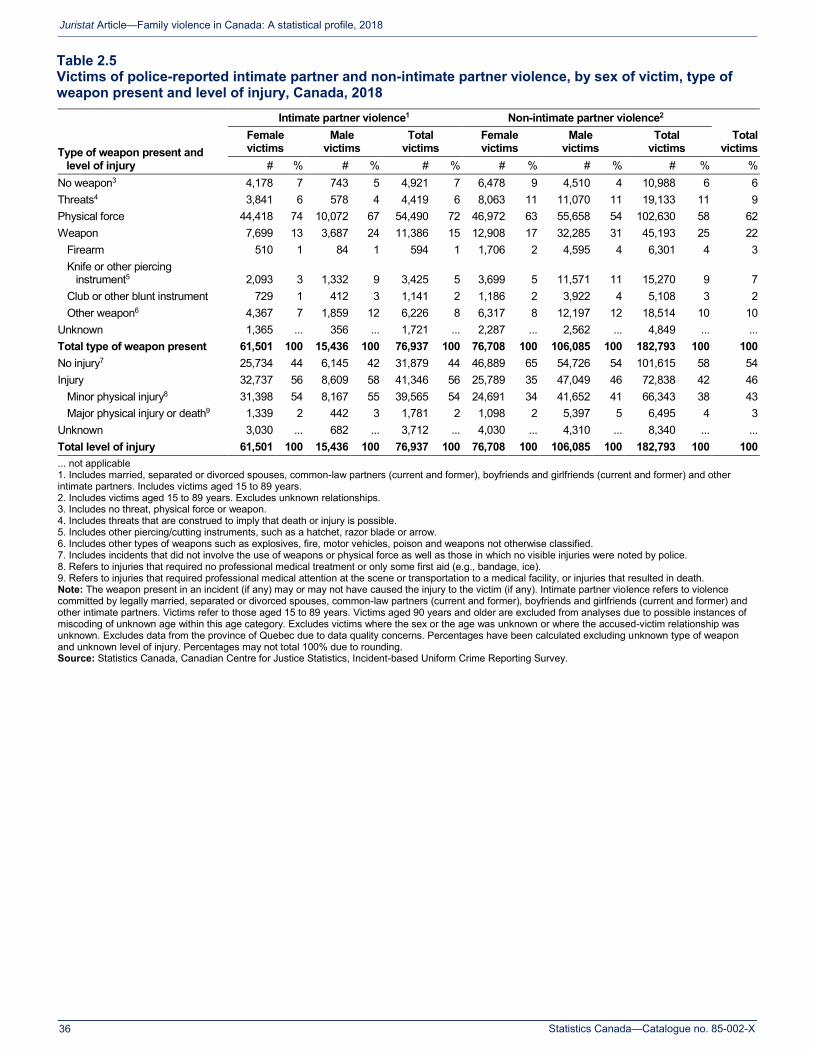
Statistics Canada—Catalogue no. 85-002-X
36
Juristat Article—Family violence in Canada: A statistical profile, 2018
Table 2.5 Victims of police-reported intimate partner and non-intimate partner violence, by sex of victim, type of weapon present and level of injury, Canada, 2018
Type of weapon present and level of injury
Intimate partner violence1 Non-intimate partner violence2 Total
victims Female victims
Male victims
Total victims
Female victims
Male victims
Total victims
# % # % # % # % # % # % % No weapon3 4,178 7 743 5 4,921 7 6,478 9 4,510 4 10,988 6 6 Threats4 3,841 6 578 4 4,419 6 8,063 11 11,070 11 19,133 11 9 Physical force 44,418 74 10,072 67 54,490 72 46,972 63 55,658 54 102,630 58 62 Weapon 7,699 13 3,687 24 11,386 15 12,908 17 32,285 31 45,193 25 22
Firearm 510 1 84 1 594 1 1,706 2 4,595 4 6,301 4 3 Knife or other piercing
instrument5 2,093 3 1,332 9 3,425 5 3,699 5 11,571 11 15,270 9 7 Club or other blunt instrument 729 1 412 3 1,141 2 1,186 2 3,922 4 5,108 3 2 Other weapon6 4,367 7 1,859 12 6,226 8 6,317 8 12,197 12 18,514 10 10
Unknown 1,365 ... 356 ... 1,721 ... 2,287 ... 2,562 ... 4,849 ... ... Total type of weapon present 61,501 100 15,436 100 76,937 100 76,708 100 106,085 100 182,793 100 100 No injury7 25,734 44 6,145 42 31,879 44 46,889 65 54,726 54 101,615 58 54 Injury 32,737 56 8,609 58 41,346 56 25,789 35 47,049 46 72,838 42 46
Minor physical injury8 31,398 54 8,167 55 39,565 54 24,691 34 41,652 41 66,343 38 43 Major physical injury or death9 1,339 2 442 3 1,781 2 1,098 2 5,397 5 6,495 4 3
Unknown 3,030 ... 682 ... 3,712 ... 4,030 ... 4,310 ... 8,340 ... ... Total level of injury 61,501 100 15,436 100 76,937 100 76,708 100 106,085 100 182,793 100 100 ... not applicable 1. Includes married, separated or divorced spouses, common-law partners (current and former), boyfriends and girlfriends (current and former) and other intimate partners. Includes victims aged 15 to 89 years. 2. Includes victims aged 15 to 89 years. Excludes unknown relationships. 3. Includes no threat, physical force or weapon. 4. Includes threats that are construed to imply that death or injury is possible. 5. Includes other piercing/cutting instruments, such as a hatchet, razor blade or arrow. 6. Includes other types of weapons such as explosives, fire, motor vehicles, poison and weapons not otherwise classified. 7. Includes incidents that did not involve the use of weapons or physical force as well as those in which no visible injuries were noted by police. 8. Refers to injuries that required no professional medical treatment or only some first aid (e.g., bandage, ice). 9. Refers to injuries that required professional medical attention at the scene or transportation to a medical facility, or injuries that resulted in death. Note: The weapon present in an incident (if any) may or may not have caused the injury to the victim (if any). Intimate partner violence refers to violence committed by legally married, separated or divorced spouses, common-law partners (current and former), boyfriends and girlfriends (current and former) and other intimate partners. Victims refer to those aged 15 to 89 years. Victims aged 90 years and older are excluded from analyses due to possible instances of miscoding of unknown age within this age category. Excludes victims where the sex or the age was unknown or where the accused-victim relationship was unknown. Excludes data from the province of Quebec due to data quality concerns. Percentages have been calculated excluding unknown type of weapon and unknown level of injury. Percentages may not total 100% due to rounding. Source: Statistics Canada, Canadian Centre for Justice Statistics, Incident-based Uniform Crime Reporting Survey.
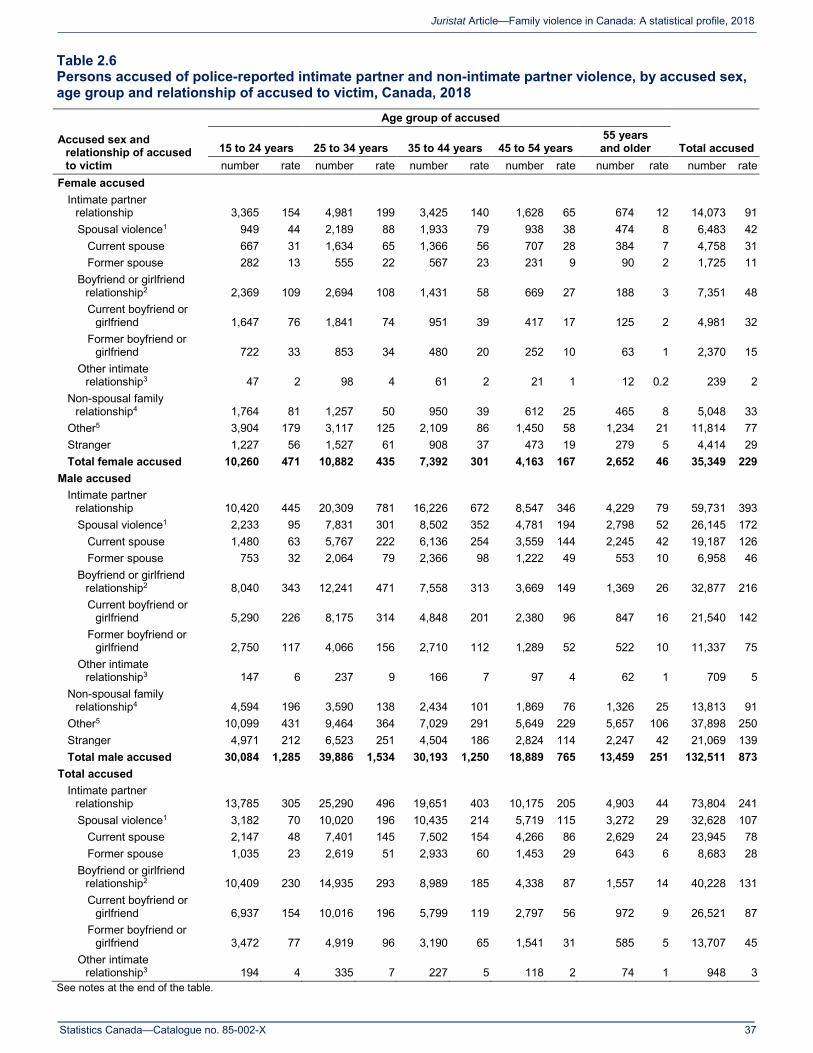
Statistics Canada—Catalogue no. 85-002-X
37
Juristat Article—Family violence in Canada: A statistical profile, 2018
Table 2.6 Persons accused of police-reported intimate partner and non-intimate partner violence, by accused sex, age group and relationship of accused to victim, Canada, 2018
Accused sex and relationship of accused to victim
Age group of accused
Total accused 15 to 24 years 25 to 34 years 35 to 44 years 45 to 54 years 55 years and older
number rate number rate number rate number rate number rate number rate Female accused
Intimate partner relationship 3,365 154 4,981 199 3,425 140 1,628 65 674 12 14,073 91 Spousal violence1 949 44 2,189 88 1,933 79 938 38 474 8 6,483 42
Current spouse 667 31 1,634 65 1,366 56 707 28 384 7 4,758 31 Former spouse 282 13 555 22 567 23 231 9 90 2 1,725 11
Boyfriend or girlfriend relationship2 2,369 109 2,694 108 1,431 58 669 27 188 3 7,351 48 Current boyfriend or
girlfriend 1,647 76 1,841 74 951 39 417 17 125 2 4,981 32 Former boyfriend or
girlfriend 722 33 853 34 480 20 252 10 63 1 2,370 15 Other intimate
relationship3 47 2 98 4 61 2 21 1 12 0.2 239 2 Non-spousal family
relationship4 1,764 81 1,257 50 950 39 612 25 465 8 5,048 33 Other5 3,904 179 3,117 125 2,109 86 1,450 58 1,234 21 11,814 77 Stranger 1,227 56 1,527 61 908 37 473 19 279 5 4,414 29 Total female accused 10,260 471 10,882 435 7,392 301 4,163 167 2,652 46 35,349 229
Male accused Intimate partner
relationship 10,420 445 20,309 781 16,226 672 8,547 346 4,229 79 59,731 393 Spousal violence1 2,233 95 7,831 301 8,502 352 4,781 194 2,798 52 26,145 172
Current spouse 1,480 63 5,767 222 6,136 254 3,559 144 2,245 42 19,187 126 Former spouse 753 32 2,064 79 2,366 98 1,222 49 553 10 6,958 46
Boyfriend or girlfriend relationship2 8,040 343 12,241 471 7,558 313 3,669 149 1,369 26 32,877 216 Current boyfriend or
girlfriend 5,290 226 8,175 314 4,848 201 2,380 96 847 16 21,540 142 Former boyfriend or
girlfriend 2,750 117 4,066 156 2,710 112 1,289 52 522 10 11,337 75 Other intimate
relationship3 147 6 237 9 166 7 97 4 62 1 709 5 Non-spousal family
relationship4 4,594 196 3,590 138 2,434 101 1,869 76 1,326 25 13,813 91 Other5 10,099 431 9,464 364 7,029 291 5,649 229 5,657 106 37,898 250 Stranger 4,971 212 6,523 251 4,504 186 2,824 114 2,247 42 21,069 139 Total male accused 30,084 1,285 39,886 1,534 30,193 1,250 18,889 765 13,459 251 132,511 873
Total accused Intimate partner
relationship 13,785 305 25,290 496 19,651 403 10,175 205 4,903 44 73,804 241 Spousal violence1 3,182 70 10,020 196 10,435 214 5,719 115 3,272 29 32,628 107
Current spouse 2,147 48 7,401 145 7,502 154 4,266 86 2,629 24 23,945 78 Former spouse 1,035 23 2,619 51 2,933 60 1,453 29 643 6 8,683 28
Boyfriend or girlfriend relationship2 10,409 230 14,935 293 8,989 185 4,338 87 1,557 14 40,228 131 Current boyfriend or
girlfriend 6,937 154 10,016 196 5,799 119 2,797 56 972 9 26,521 87 Former boyfriend or
girlfriend 3,472 77 4,919 96 3,190 65 1,541 31 585 5 13,707 45 Other intimate
relationship3 194 4 335 7 227 5 118 2 74 1 948 3 See notes at the end of the table.

Statistics Canada—Catalogue no. 85-002-X
38
Juristat Article—Family violence in Canada: A statistical profile, 2018
Table 2.6 — end Persons accused of police-reported intimate partner and non-intimate partner violence, by accused sex, age group and relationship of accused to victim, Canada, 2018
Accused sex and relationship of accused to victim
Age group of accused
Total accused 15 to 24 years 25 to 34 years 35 to 44 years 45 to 54 years 55 years and older
number rate number rate number rate number rate number rate number rate Total accused
Non-spousal family relationship4 6,358 141 4,847 95 3,384 69 2,481 50 1,791 16 18,861 62
Other5 14,003 310 12,581 247 9,138 188 7,099 143 6,891 62 49,712 162 Stranger 6,198 137 8,050 158 5,412 111 3,297 66 2,526 23 25,483 83 Total accused 40,344 893 50,768 996 37,585 772 23,052 465 16,111 144 167,860 548
1. Includes married, separated or divorced spouses and common-law partners (current and former). Includes accused and victims aged 15 to 89 years. 2. Includes boyfriends and girlfriends (current and former). Includes accused and victims aged 15 to 89 years. In previous editions of the Family Violence in Canada Juristat, this category was referred to as "dating partner." 3. Includes persons with whom victims had a sexual relationship or a mutual sexual attraction. Includes accused and victims ages 15 to 89 years. 4. Includes all other family members related by blood, marriage (including common-law) or adoption. Examples include siblings, grandparents, uncles, aunts, cousins and in-laws. Includes accused and victims aged 15 to 89 years. 5. Includes all other non-spousal, non-dating and non-family relationships. Examples include friends, casual acquaintances, business relationships, criminal relationships and relationships based on trust or authority (e.g., teacher-to-student, doctor-to-patient). Includes accused and victims aged 15 to 89 years. Note: Includes incidents with a single accused and a single victim. Rates are calculated on the basis of 100,000 population aged 15 to 89 years. Populations based upon July 1st estimates from Statistics Canada, Demography Division. Intimate partner violence refers to violence committed by legally married, separated or divorced spouses, common-law partners (current and former), boyfriends and girlfriends (current and former) and other intimate partners. Accused and victims refers to those aged 15 to 89 years. Accused and victims aged 90 years and older are excluded from analyses due to possible instances of miscoding of unknown age within this age category. Excludes accused and victims where the sex or the age was unknown or where the accused-victim relationship was unknown. Source: Statistics Canada, Canadian Centre for Justice Statistics, Incident-based Uniform Crime Reporting Survey.
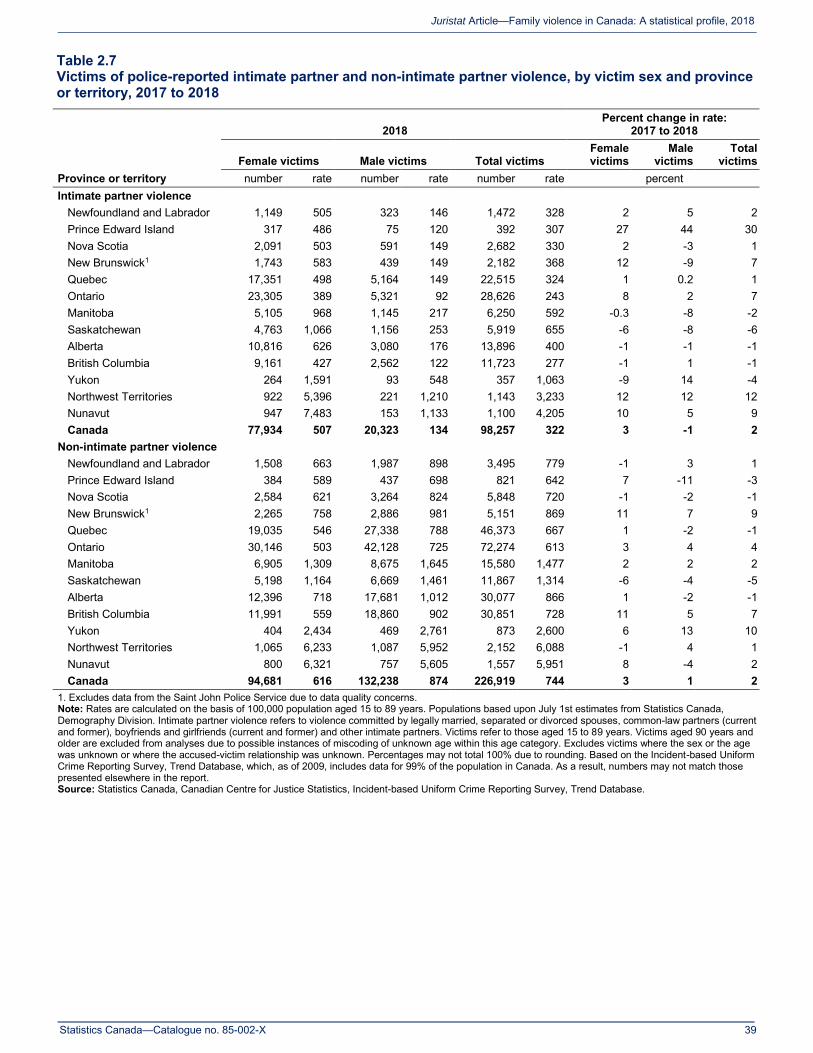
Statistics Canada—Catalogue no. 85-002-X
39
Juristat Article—Family violence in Canada: A statistical profile, 2018
Table 2.7 Victims of police-reported intimate partner and non-intimate partner violence, by victim sex and province or territory, 2017 to 2018
Province or territory
2018 Percent change in rate:
2017 to 2018
Female victims Male victims Total victims Female victims
Male victims
Total victims
number rate number rate number rate percent Intimate partner violence
Newfoundland and Labrador 1,149 505 323 146 1,472 328 2 5 2 Prince Edward Island 317 486 75 120 392 307 27 44 30 Nova Scotia 2,091 503 591 149 2,682 330 2 -3 1 New Brunswick1 1,743 583 439 149 2,182 368 12 -9 7 Quebec 17,351 498 5,164 149 22,515 324 1 0.2 1 Ontario 23,305 389 5,321 92 28,626 243 8 2 7 Manitoba 5,105 968 1,145 217 6,250 592 -0.3 -8 -2 Saskatchewan 4,763 1,066 1,156 253 5,919 655 -6 -8 -6 Alberta 10,816 626 3,080 176 13,896 400 -1 -1 -1 British Columbia 9,161 427 2,562 122 11,723 277 -1 1 -1 Yukon 264 1,591 93 548 357 1,063 -9 14 -4 Northwest Territories 922 5,396 221 1,210 1,143 3,233 12 12 12 Nunavut 947 7,483 153 1,133 1,100 4,205 10 5 9 Canada 77,934 507 20,323 134 98,257 322 3 -1 2
Non-intimate partner violence Newfoundland and Labrador 1,508 663 1,987 898 3,495 779 -1 3 1
Prince Edward Island 384 589 437 698 821 642 7 -11 -3 Nova Scotia 2,584 621 3,264 824 5,848 720 -1 -2 -1 New Brunswick1 2,265 758 2,886 981 5,151 869 11 7 9 Quebec 19,035 546 27,338 788 46,373 667 1 -2 -1 Ontario 30,146 503 42,128 725 72,274 613 3 4 4 Manitoba 6,905 1,309 8,675 1,645 15,580 1,477 2 2 2 Saskatchewan 5,198 1,164 6,669 1,461 11,867 1,314 -6 -4 -5 Alberta 12,396 718 17,681 1,012 30,077 866 1 -2 -1 British Columbia 11,991 559 18,860 902 30,851 728 11 5 7 Yukon 404 2,434 469 2,761 873 2,600 6 13 10 Northwest Territories 1,065 6,233 1,087 5,952 2,152 6,088 -1 4 1 Nunavut 800 6,321 757 5,605 1,557 5,951 8 -4 2 Canada 94,681 616 132,238 874 226,919 744 3 1 2
1. Excludes data from the Saint John Police Service due to data quality concerns. Note: Rates are calculated on the basis of 100,000 population aged 15 to 89 years. Populations based upon July 1st estimates from Statistics Canada, Demography Division. Intimate partner violence refers to violence committed by legally married, separated or divorced spouses, common-law partners (current and former), boyfriends and girlfriends (current and former) and other intimate partners. Victims refer to those aged 15 to 89 years. Victims aged 90 years and older are excluded from analyses due to possible instances of miscoding of unknown age within this age category. Excludes victims where the sex or the age was unknown or where the accused-victim relationship was unknown. Percentages may not total 100% due to rounding. Based on the Incident-based Uniform Crime Reporting Survey, Trend Database, which, as of 2009, includes data for 99% of the population in Canada. As a result, numbers may not match those presented elsewhere in the report. Source: Statistics Canada, Canadian Centre for Justice Statistics, Incident-based Uniform Crime Reporting Survey, Trend Database.
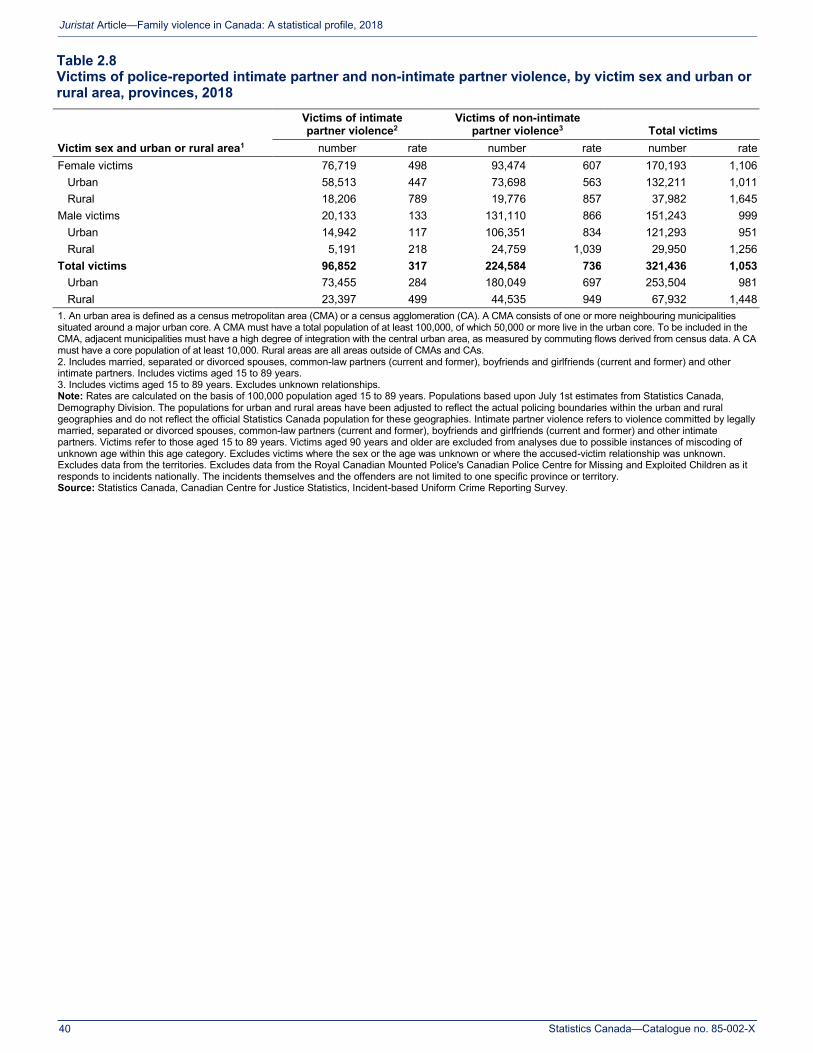
Statistics Canada—Catalogue no. 85-002-X
40
Juristat Article—Family violence in Canada: A statistical profile, 2018
Table 2.8 Victims of police-reported intimate partner and non-intimate partner violence, by victim sex and urban or rural area, provinces, 2018
Victim sex and urban or rural area1
Victims of intimate partner violence2
Victims of non-intimate partner violence3 Total victims
number rate number rate number rate Female victims 76,719 498 93,474 607 170,193 1,106
Urban 58,513 447 73,698 563 132,211 1,011 Rural 18,206 789 19,776 857 37,982 1,645
Male victims 20,133 133 131,110 866 151,243 999 Urban 14,942 117 106,351 834 121,293 951 Rural 5,191 218 24,759 1,039 29,950 1,256
Total victims 96,852 317 224,584 736 321,436 1,053 Urban 73,455 284 180,049 697 253,504 981 Rural 23,397 499 44,535 949 67,932 1,448
1. An urban area is defined as a census metropolitan area (CMA) or a census agglomeration (CA). A CMA consists of one or more neighbouring municipalities situated around a major urban core. A CMA must have a total population of at least 100,000, of which 50,000 or more live in the urban core. To be included in the CMA, adjacent municipalities must have a high degree of integration with the central urban area, as measured by commuting flows derived from census data. A CA must have a core population of at least 10,000. Rural areas are all areas outside of CMAs and CAs. 2. Includes married, separated or divorced spouses, common-law partners (current and former), boyfriends and girlfriends (current and former) and other intimate partners. Includes victims aged 15 to 89 years. 3. Includes victims aged 15 to 89 years. Excludes unknown relationships. Note: Rates are calculated on the basis of 100,000 population aged 15 to 89 years. Populations based upon July 1st estimates from Statistics Canada, Demography Division. The populations for urban and rural areas have been adjusted to reflect the actual policing boundaries within the urban and rural geographies and do not reflect the official Statistics Canada population for these geographies. Intimate partner violence refers to violence committed by legally married, separated or divorced spouses, common-law partners (current and former), boyfriends and girlfriends (current and former) and other intimate partners. Victims refer to those aged 15 to 89 years. Victims aged 90 years and older are excluded from analyses due to possible instances of miscoding of unknown age within this age category. Excludes victims where the sex or the age was unknown or where the accused-victim relationship was unknown. Excludes data from the territories. Excludes data from the Royal Canadian Mounted Police's Canadian Police Centre for Missing and Exploited Children as it responds to incidents nationally. The incidents themselves and the offenders are not limited to one specific province or territory. Source: Statistics Canada, Canadian Centre for Justice Statistics, Incident-based Uniform Crime Reporting Survey.

Statistics Canada—Catalogue no. 85-002-X
41
Juristat Article—Family violence in Canada: A statistical profile, 2018
Table 2.9 Victims of police-reported intimate partner violence, by victim sex and census metropolitan area, 2018
Census metropolitan area (CMA)3, 4
Intimate partner violence1 Non-intimate partner violence2 Female victims Male victims Total victims Female victims Male victims Total victims
number rate number rate number rate number rate number rate number rate St. John's 381 425 103 120 484 276 506 565 719 837 1,225 698 Halifax 896 480 230 129 1,126 309 1,142 611 1,486 835 2,628 720 Moncton 455 667 123 184 578 428 700 1,026 889 1,331 1,589 1,177 Saint John5 .. .. .. .. .. .. .. .. .. .. .. .. Saguenay 320 455 56 77 376 263 384 546 633 874 1,017 712 Québec 1,576 460 463 137 2,039 300 1,908 556 2,797 829 4,705 691 Sherbrooke 284 330 49 59 333 196 395 459 582 695 977 575 Trois-Rivières 325 478 83 126 408 304 380 559 572 866 952 710 Montréal 8,775 495 2,639 152 11,414 326 8,997 508 12,631 730 21,628 617 Gatineau6 731 530 202 150 933 343 888 644 1,356 1,009 2,244 824 Ottawa7 1,496 331 295 68 1,791 202 2,135 472 2,858 657 4,993 563 Kingston 297 404 51 71 348 240 370 503 338 473 708 488 Belleville8 243 517 62 135 305 328 387 823 362 787 749 805 Peterborough 218 390 49 92 267 245 286 512 296 559 582 535 Toronto9 8,175 335 1,701 73 9,876 207 11,997 492 18,322 786 30,319 636 Hamilton10 1,036 433 173 74 1,209 256 1,345 562 1,816 778 3,161 669 St. Catharines–Niagara 506 249 81 41 587 147 897 442 1,146 586 2,043 513 Kitchener–Cambridge–
Waterloo 1,258 529 383 161 1,641 345 1,774 746 2,323 975 4,097 861 Brantford 337 571 97 169 434 373 411 696 503 878 914 786 Guelph 213 360 38 67 251 216 266 449 337 592 603 519 London 1,050 464 204 94 1,254 283 993 439 1,526 702 2,519 568 Windsor 649 495 147 111 796 302 664 506 876 662 1,540 584 Barrie 300 319 60 65 360 193 378 401 558 605 936 502 Greater Sudbury 369 517 65 93 434 307 448 628 564 806 1,012 716 Thunder Bay 331 620 65 123 396 373 440 824 562 1,063 1,002 943 Winnipeg 1,983 585 305 91 2,288 340 2,954 871 4,565 1,369 7,519 1,118 Regina 811 786 181 173 992 477 666 645 1,004 958 1,670 803 Saskatoon 650 497 102 77 752 287 897 686 1,342 1,020 2,239 853 Lethbridge8 436 875 144 293 580 586 524 1,052 739 1,505 1,263 1,277 Calgary 2,873 473 1,043 172 3,916 322 3,612 594 5,356 882 8,968 738 Edmonton 2,757 478 574 99 3,331 288 3,640 632 5,442 936 9,082 785 Kelowna 337 369 118 133 455 253 456 499 787 887 1,243 690 Abbotsford–Mission 394 498 86 107 480 301 372 471 635 790 1,007 631 Vancouver 3,562 309 846 76 4,408 195 5,935 515 9,518 859 15,453 684 Victoria 647 372 189 114 836 246 946 543 1,619 973 2,565 753 See notes at the end of the table.
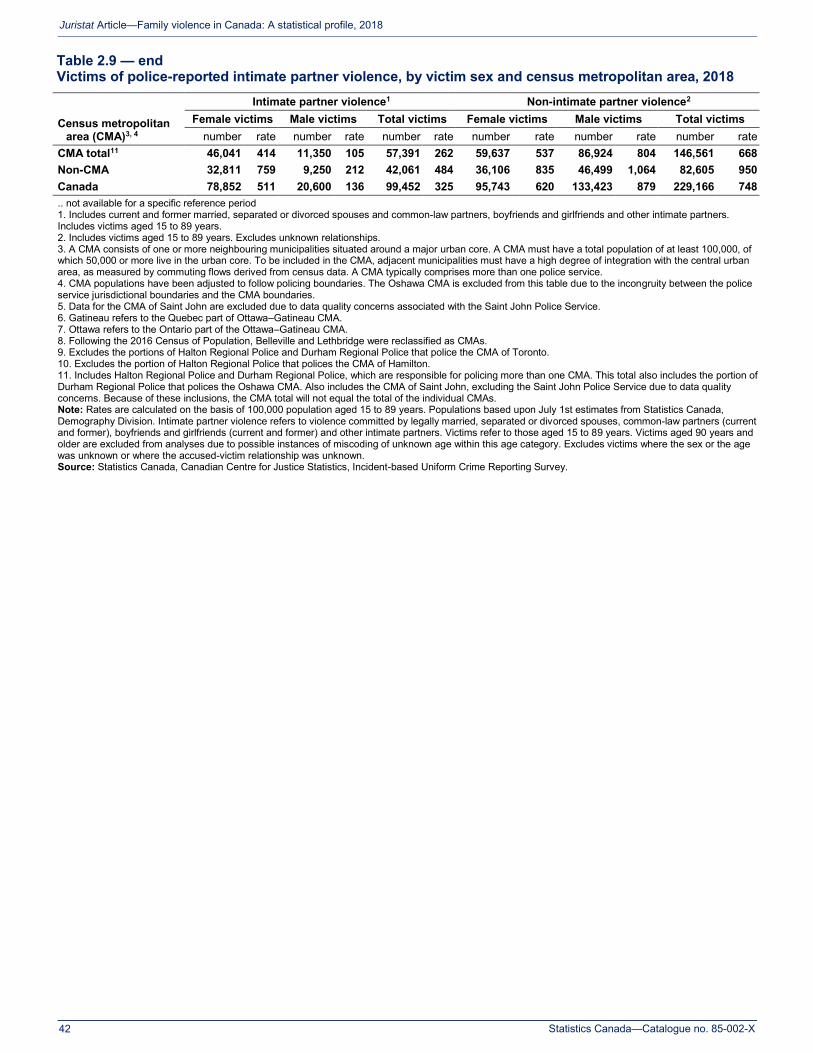
Statistics Canada—Catalogue no. 85-002-X
42
Juristat Article—Family violence in Canada: A statistical profile, 2018
Table 2.9 — end Victims of police-reported intimate partner violence, by victim sex and census metropolitan area, 2018
Census metropolitan area (CMA)3, 4
Intimate partner violence1 Non-intimate partner violence2 Female victims Male victims Total victims Female victims Male victims Total victims
number rate number rate number rate number rate number rate number rate CMA total11 46,041 414 11,350 105 57,391 262 59,637 537 86,924 804 146,561 668 Non-CMA 32,811 759 9,250 212 42,061 484 36,106 835 46,499 1,064 82,605 950 Canada 78,852 511 20,600 136 99,452 325 95,743 620 133,423 879 229,166 748 .. not available for a specific reference period 1. Includes current and former married, separated or divorced spouses and common-law partners, boyfriends and girlfriends and other intimate partners. Includes victims aged 15 to 89 years. 2. Includes victims aged 15 to 89 years. Excludes unknown relationships. 3. A CMA consists of one or more neighbouring municipalities situated around a major urban core. A CMA must have a total population of at least 100,000, of which 50,000 or more live in the urban core. To be included in the CMA, adjacent municipalities must have a high degree of integration with the central urban area, as measured by commuting flows derived from census data. A CMA typically comprises more than one police service. 4. CMA populations have been adjusted to follow policing boundaries. The Oshawa CMA is excluded from this table due to the incongruity between the police service jurisdictional boundaries and the CMA boundaries. 5. Data for the CMA of Saint John are excluded due to data quality concerns associated with the Saint John Police Service. 6. Gatineau refers to the Quebec part of Ottawa–Gatineau CMA. 7. Ottawa refers to the Ontario part of the Ottawa–Gatineau CMA. 8. Following the 2016 Census of Population, Belleville and Lethbridge were reclassified as CMAs. 9. Excludes the portions of Halton Regional Police and Durham Regional Police that police the CMA of Toronto. 10. Excludes the portion of Halton Regional Police that polices the CMA of Hamilton. 11. Includes Halton Regional Police and Durham Regional Police, which are responsible for policing more than one CMA. This total also includes the portion of Durham Regional Police that polices the Oshawa CMA. Also includes the CMA of Saint John, excluding the Saint John Police Service due to data quality concerns. Because of these inclusions, the CMA total will not equal the total of the individual CMAs. Note: Rates are calculated on the basis of 100,000 population aged 15 to 89 years. Populations based upon July 1st estimates from Statistics Canada, Demography Division. Intimate partner violence refers to violence committed by legally married, separated or divorced spouses, common-law partners (current and former), boyfriends and girlfriends (current and former) and other intimate partners. Victims refer to those aged 15 to 89 years. Victims aged 90 years and older are excluded from analyses due to possible instances of miscoding of unknown age within this age category. Excludes victims where the sex or the age was unknown or where the accused-victim relationship was unknown. Source: Statistics Canada, Canadian Centre for Justice Statistics, Incident-based Uniform Crime Reporting Survey.
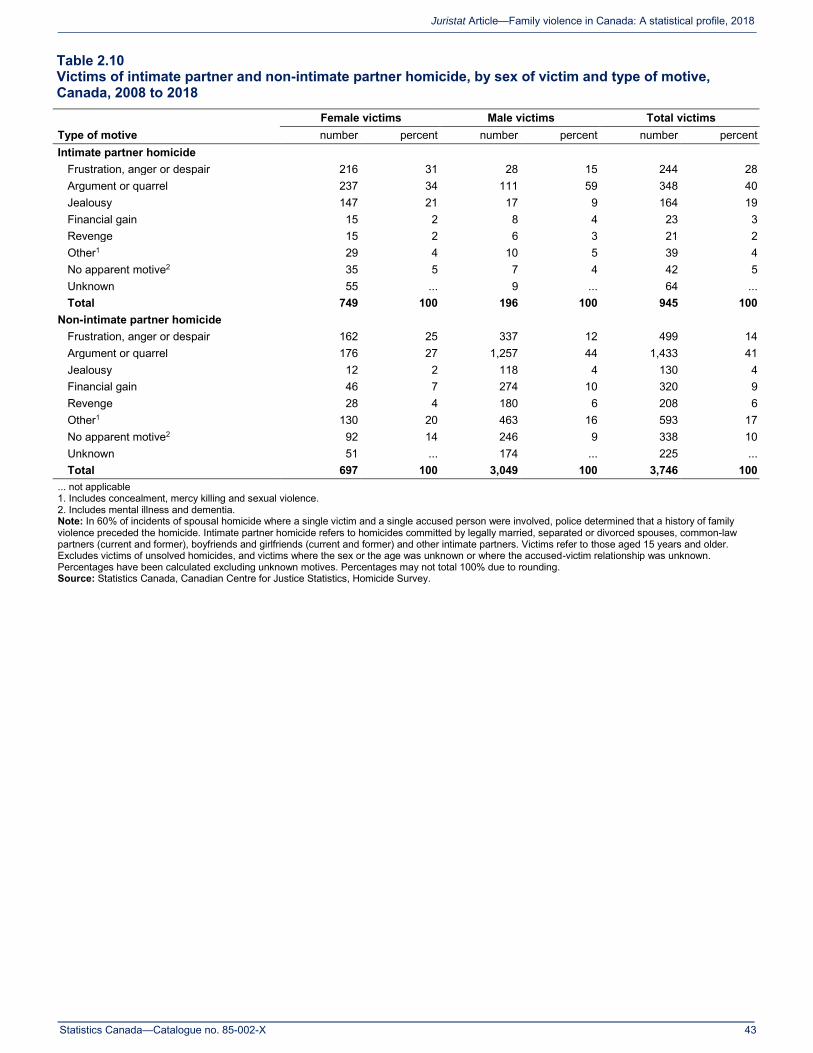
Statistics Canada—Catalogue no. 85-002-X
43
Juristat Article—Family violence in Canada: A statistical profile, 2018
Table 2.10 Victims of intimate partner and non-intimate partner homicide, by sex of victim and type of motive, Canada, 2008 to 2018
Type of motive Female victims Male victims Total victims number percent number percent number percent
Intimate partner homicide Frustration, anger or despair 216 31 28 15 244 28
Argument or quarrel 237 34 111 59 348 40 Jealousy 147 21 17 9 164 19 Financial gain 15 2 8 4 23 3 Revenge 15 2 6 3 21 2 Other1 29 4 10 5 39 4 No apparent motive2 35 5 7 4 42 5 Unknown 55 ... 9 ... 64 ... Total 749 100 196 100 945 100
Non-intimate partner homicide Frustration, anger or despair 162 25 337 12 499 14
Argument or quarrel 176 27 1,257 44 1,433 41 Jealousy 12 2 118 4 130 4 Financial gain 46 7 274 10 320 9 Revenge 28 4 180 6 208 6 Other1 130 20 463 16 593 17 No apparent motive2 92 14 246 9 338 10 Unknown 51 ... 174 ... 225 ... Total 697 100 3,049 100 3,746 100
... not applicable 1. Includes concealment, mercy killing and sexual violence. 2. Includes mental illness and dementia. Note: In 60% of incidents of spousal homicide where a single victim and a single accused person were involved, police determined that a history of family violence preceded the homicide. Intimate partner homicide refers to homicides committed by legally married, separated or divorced spouses, common-law partners (current and former), boyfriends and girlfriends (current and former) and other intimate partners. Victims refer to those aged 15 years and older. Excludes victims of unsolved homicides, and victims where the sex or the age was unknown or where the accused-victim relationship was unknown. Percentages have been calculated excluding unknown motives. Percentages may not total 100% due to rounding. Source: Statistics Canada, Canadian Centre for Justice Statistics, Homicide Survey.
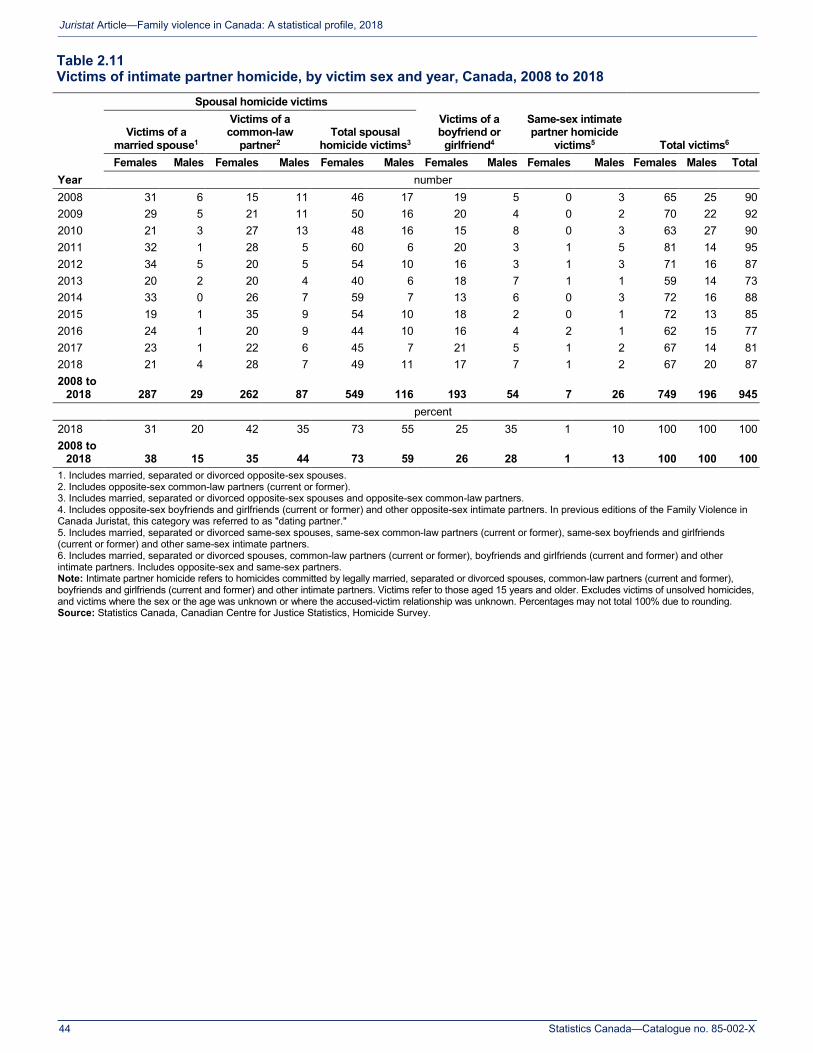
Statistics Canada—Catalogue no. 85-002-X
44
Juristat Article—Family violence in Canada: A statistical profile, 2018
Table 2.11 Victims of intimate partner homicide, by victim sex and year, Canada, 2008 to 2018
Year
Spousal homicide victims Victims of a boyfriend or girlfriend4
Same-sex intimate partner homicide
victims5 Total victims6 Victims of a
married spouse1
Victims of a common-law
partner2 Total spousal
homicide victims3 Females Males Females Males Females Males Females Males Females Males Females Males Total
number 2008 31 6 15 11 46 17 19 5 0 3 65 25 90 2009 29 5 21 11 50 16 20 4 0 2 70 22 92 2010 21 3 27 13 48 16 15 8 0 3 63 27 90 2011 32 1 28 5 60 6 20 3 1 5 81 14 95 2012 34 5 20 5 54 10 16 3 1 3 71 16 87 2013 20 2 20 4 40 6 18 7 1 1 59 14 73 2014 33 0 26 7 59 7 13 6 0 3 72 16 88 2015 19 1 35 9 54 10 18 2 0 1 72 13 85 2016 24 1 20 9 44 10 16 4 2 1 62 15 77 2017 23 1 22 6 45 7 21 5 1 2 67 14 81 2018 21 4 28 7 49 11 17 7 1 2 67 20 87 2008 to
2018 287 29 262 87 549 116 193 54 7 26 749 196 945
percent
2018 31 20 42 35 73 55 25 35 1 10 100 100 100 2008 to
2018 38 15 35 44 73 59 26 28 1 13 100 100 100 1. Includes married, separated or divorced opposite-sex spouses. 2. Includes opposite-sex common-law partners (current or former). 3. Includes married, separated or divorced opposite-sex spouses and opposite-sex common-law partners. 4. Includes opposite-sex boyfriends and girlfriends (current or former) and other opposite-sex intimate partners. In previous editions of the Family Violence in Canada Juristat, this category was referred to as "dating partner." 5. Includes married, separated or divorced same-sex spouses, same-sex common-law partners (current or former), same-sex boyfriends and girlfriends (current or former) and other same-sex intimate partners. 6. Includes married, separated or divorced spouses, common-law partners (current or former), boyfriends and girlfriends (current and former) and other intimate partners. Includes opposite-sex and same-sex partners. Note: Intimate partner homicide refers to homicides committed by legally married, separated or divorced spouses, common-law partners (current and former), boyfriends and girlfriends (current and former) and other intimate partners. Victims refer to those aged 15 years and older. Excludes victims of unsolved homicides, and victims where the sex or the age was unknown or where the accused-victim relationship was unknown. Percentages may not total 100% due to rounding. Source: Statistics Canada, Canadian Centre for Justice Statistics, Homicide Survey.
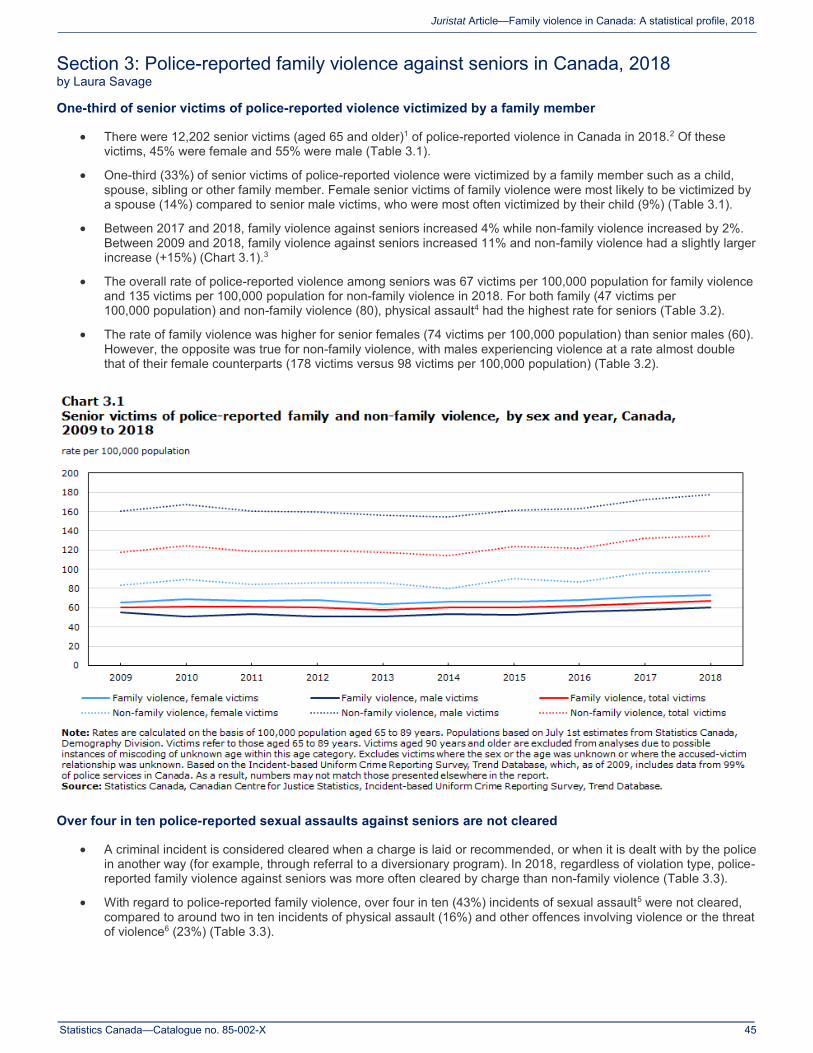
Statistics Canada—Catalogue no. 85-002-X
45
Juristat Article—Family violence in Canada: A statistical profile, 2018
Section 3: Police-reported family violence against seniors in Canada, 2018 by Laura Savage
One-third of senior victims of police-reported violence victimized by a family member
There were 12,202 senior victims (aged 65 and older)1 of police-reported violence in Canada in 2018.2 Of these victims, 45% were female and 55% were male (Table 3.1).
One-third (33%) of senior victims of police-reported violence were victimized by a family member such as a child, spouse, sibling or other family member. Female senior victims of family violence were most likely to be victimized by a spouse (14%) compared to senior male victims, who were most often victimized by their child (9%) (Table 3.1).
Between 2017 and 2018, family violence against seniors increased 4% while non-family violence increased by 2%. Between 2009 and 2018, family violence against seniors increased 11% and non-family violence had a slightly larger increase (+15%) (Chart 3.1).3
The overall rate of police-reported violence among seniors was 67 victims per 100,000 population for family violence and 135 victims per 100,000 population for non-family violence in 2018. For both family (47 victims per 100,000 population) and non-family violence (80), physical assault4 had the highest rate for seniors (Table 3.2).
The rate of family violence was higher for senior females (74 victims per 100,000 population) than senior males (60). However, the opposite was true for non-family violence, with males experiencing violence at a rate almost double that of their female counterparts (178 victims versus 98 victims per 100,000 population) (Table 3.2).
Over four in ten police-reported sexual assaults against seniors are not cleared
A criminal incident is considered cleared when a charge is laid or recommended, or when it is dealt with by the police in another way (for example, through referral to a diversionary program). In 2018, regardless of violation type, police-reported family violence against seniors was more often cleared by charge than non-family violence (Table 3.3).
With regard to police-reported family violence, over four in ten (43%) incidents of sexual assault5 were not cleared, compared to around two in ten incidents of physical assault (16%) and other offences involving violence or the threat of violence6 (23%) (Table 3.3).
Statistics Canada—Catalogue no. 85-002-X
46
Juristat Article—Family violence in Canada: A statistical profile, 2018
The majority of senior victims of police-reported family violence live with the person who victimized them
The vast majority of female (92%) and male (88%) senior victims of family violence were victimized in a residential location (Table 3.4).
Of the senior victims of family violence who were victimized in a residential location, around six in ten (62% of female victims and 58% of male victims) lived with the person who victimized them (Table 3.4).
Physical force used against six in ten senior victims of family violence
About six in ten (63%) senior victims of family violence had physical force used against them. This proportion was similar for senior victims of non-family violence (62%) (Table 3.5).
The presence of weapons, such as firearms, knives and other weapons, was slightly more common among senior male victims of family violence (20%) than senior female victims (15%) (Table 3.5).7
Males accused of family violence against seniors were most commonly seniors themselves
There were 4 female accused and 10 male accused persons of family violence against seniors per 100,000 population (Table 3.6).8
The rate of males accused of family violence against seniors was highest among those aged 65 and older (19 accused per 100,000 population) (Table 3.6).
Slight increase in police-reported violence against seniors between 2017 and 2018
Family violence against seniors was highest overall in Nunavut (1,644 victims per 100,000 population) and the Northwest Territories (1,490). In contrast, it was lowest in Prince Edward Island and Ontario (49 and 53 victims per 100,000 population, respectively) (Table 3.7).
Family violence against seniors increased 4% between 2017 and 2018, with the Northwest Territories recording the largest increase (+27%). Non-family violence against seniors increased 2% between 2017 and 2018 (Table 3.7).9
Regardless of the sex of the victim, family violence against seniors was higher in rural areas (93 victims per 100,000 population) than urban areas (60). Rates of non-family violence against seniors were similar in rural (130) and urban (135) areas (Table 3.8).10
Overall, rates of family violence were lower among seniors living in Canada’s largest cities (census metropolitan areas or CMAs) than non-CMAs (60 victims versus 83 victims per 100,000 population, respectively). Among the CMAs, the rate of family violence against seniors was highest in Kitchener–Cambridge–Waterloo (114 victims per 100,000 population), which was largely driven by the rate of violence against female seniors (134) (Table 3.9).11
The rate of family violence was higher for female seniors in the majority of Canada’s CMAs. The exceptions were in Sherbrooke, St. Catharines–Niagara, Barrie, Thunder Bay, Regina, Abbotsford–Mission and Victoria (Table 3.9).
Over one-third of family-related homicide of seniors motivated by frustration, anger or despair
Family-related homicides occur within complex interpersonal contexts that can be difficult to capture through police-reported data.12 Nonetheless, an analysis of police-reported motives is important for violence prevention policy. Frustration, anger or despair (37%)—a range of emotions typical of offenders exerting control over victims—and argument or quarrel (36%) were the most common primary motives for family-related homicides of seniors between 2008 and 2018. In comparison, these motives accounted for a smaller proportion of non-family related homicide against seniors (25% and 20%, respectively) (Table 3.10).
Between 2008 and 2018, the rate of family-related homicide among seniors increased 32% (from 2.8 victims per 1 million seniors to 3.6). An increase (+34%) was also recorded in the rate of non-family homicide against seniors (3.2 victims per 1 million seniors in 2008 to 4.3 in 2018). In 2018, there were 22 senior victims of family-related homicide (Table 3.11).
Statistics Canada—Catalogue no. 85-002-X
47
Juristat Article—Family violence in Canada: A statistical profile, 2018
Text box 3.1 Violence against seniors living in residences
The proportion of seniors aged 65 and older is expected to continue growing at a rapid pace. According to the most recent population projections, one in five (20%) Canadians could be aged 65 and older by 2024.13
As the population ages, the number of seniors (aged 65 and older) residing in nursing homes continues to grow.14, 15 Of the 12,202 senior victims of police-reported violence in 2018, 946 (8%) occurred in a nursing home or a retirement home. Of this number, most (79%) victims were victims of a physical assault, while almost two in ten (18%) were the victim of a sexual assault. The remaining victims were victims of other violent behaviour.
When looking specifically at incidents involving a single victim and a single accused, over seven in ten (71%) senior victims of violence were victimized by a casual acquaintance, often another senior (85%).
Nursing and retirement homes were added as incident locations in the Uniform Crime Reporting Survey in 2017. As such, some police services may not have fully implemented these categories in their coding practices. This text box reflects the data available for these two locations.
Notes
1. Victims aged 90 years and older are excluded from analyses due to possible instances of miscoding of unknown age within this age category.
2. Excludes victims where the sex or the age was unknown. Counts represent the number of victims involved in incidents of violence. It is possible that individual victims may have experienced more than one incident, and would therefore be counted more than once here.
3. Trend numbers are based on the Incident-based Uniform Crime Reporting Survey, Trend Database, which, as of 2009, includes data from 99% of police services in Canada. As a result, trend numbers may not match those presented elsewhere in the report.
4. Physical assault includes assault level 1, assault level 2 (with a weapon or causing bodily harm) and assault level 3 (aggravated assault).
5. Sexual assault includes sexual assault level 1, sexual assault level 2 (with a weapon or causing bodily harm) and sexual assault level 3 (aggravated sexual assault).
6. Includes all other violent violations; however, homicide, other violations causing death and attempted murder are excluded.
7. Data on the type of weapon present and level of injury exclude the province of Quebec due to data quality concerns.
8. Includes incidents with a single accused and a single victim.
9. Trend numbers are based on the Incident-based Uniform Crime Reporting Survey, Trend Database, which, as of 2009, includes data from 99% of police services in Canada. As a result, trend numbers may not match those presented elsewhere in the report.
10. Excludes data from the territories. An urban area is defined as a census metropolitan area (CMA) or a census agglomeration (CA). A CMA consists of one or more neighbouring municipalities situated around a major urban core. A CMA must have a total population of at least 100,000, of which 50,000 or more live in the urban core. To be included in the CMA, adjacent municipalities must have a high degree of integration with the central urban area, as measured by commuting flows derived from census data. A CA must have a core population of at least 10,000. Rural areas are all areas outside of CMAs and CAs. The populations for urban and rural areas have been adjusted to reflect the actual policing boundaries within the urban and rural geographies and do not reflect the official Statistics Canada population for these geographies.
11. For a definition of a census metropolitan area, see endnote 10.
12. Between 2008 and 2018, 34% of incidents of family-related homicide against seniors where a single victim and a single accused person were involved, police determined that a history of family violence preceded the homicide.
13. Statistics Canada. 2019. Annual Demographic Estimates: Canada, Provinces and Territories. Statistics Canada Catalogue no. 91-215-X.
14. See Garner, R., Tanuseputro, P., Manuel, D. G. and C. Sanmartin. 2018. “Transitions to long-term and residential care among older Canadians.” Health Reports. Statistics Canada Catalogue no. 82-003-X.
15. See Ontario Health Coalition. 2019. “Situation critical: Planning, access, levels of care and violence in Ontario’s long-term care.”
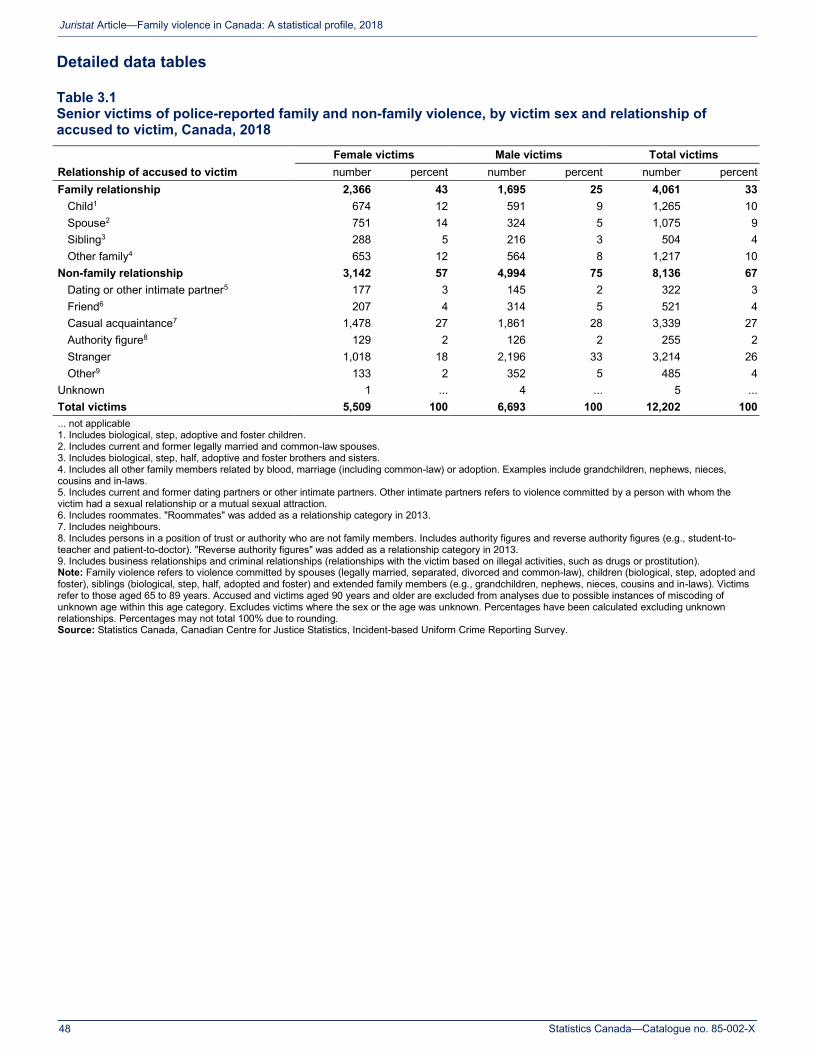
Statistics Canada—Catalogue no. 85-002-X
48
Juristat Article—Family violence in Canada: A statistical profile, 2018
Detailed data tables
Table 3.1 Senior victims of police-reported family and non-family violence, by victim sex and relationship of accused to victim, Canada, 2018
Relationship of accused to victim Female victims Male victims Total victims number percent number percent number percent
Family relationship 2,366 43 1,695 25 4,061 33 Child1 674 12 591 9 1,265 10 Spouse2 751 14 324 5 1,075 9 Sibling3 288 5 216 3 504 4 Other family4 653 12 564 8 1,217 10
Non-family relationship 3,142 57 4,994 75 8,136 67 Dating or other intimate partner5 177 3 145 2 322 3 Friend6 207 4 314 5 521 4 Casual acquaintance7 1,478 27 1,861 28 3,339 27 Authority figure8 129 2 126 2 255 2 Stranger 1,018 18 2,196 33 3,214 26 Other9 133 2 352 5 485 4
Unknown 1 ... 4 ... 5 ... Total victims 5,509 100 6,693 100 12,202 100 ... not applicable 1. Includes biological, step, adoptive and foster children. 2. Includes current and former legally married and common-law spouses. 3. Includes biological, step, half, adoptive and foster brothers and sisters. 4. Includes all other family members related by blood, marriage (including common-law) or adoption. Examples include grandchildren, nephews, nieces, cousins and in-laws. 5. Includes current and former dating partners or other intimate partners. Other intimate partners refers to violence committed by a person with whom the victim had a sexual relationship or a mutual sexual attraction. 6. Includes roommates. "Roommates" was added as a relationship category in 2013. 7. Includes neighbours. 8. Includes persons in a position of trust or authority who are not family members. Includes authority figures and reverse authority figures (e.g., student-to-teacher and patient-to-doctor). "Reverse authority figures" was added as a relationship category in 2013. 9. Includes business relationships and criminal relationships (relationships with the victim based on illegal activities, such as drugs or prostitution). Note: Family violence refers to violence committed by spouses (legally married, separated, divorced and common-law), children (biological, step, adopted and foster), siblings (biological, step, half, adopted and foster) and extended family members (e.g., grandchildren, nephews, nieces, cousins and in-laws). Victims refer to those aged 65 to 89 years. Accused and victims aged 90 years and older are excluded from analyses due to possible instances of miscoding of unknown age within this age category. Excludes victims where the sex or the age was unknown. Percentages have been calculated excluding unknown relationships. Percentages may not total 100% due to rounding. Source: Statistics Canada, Canadian Centre for Justice Statistics, Incident-based Uniform Crime Reporting Survey.
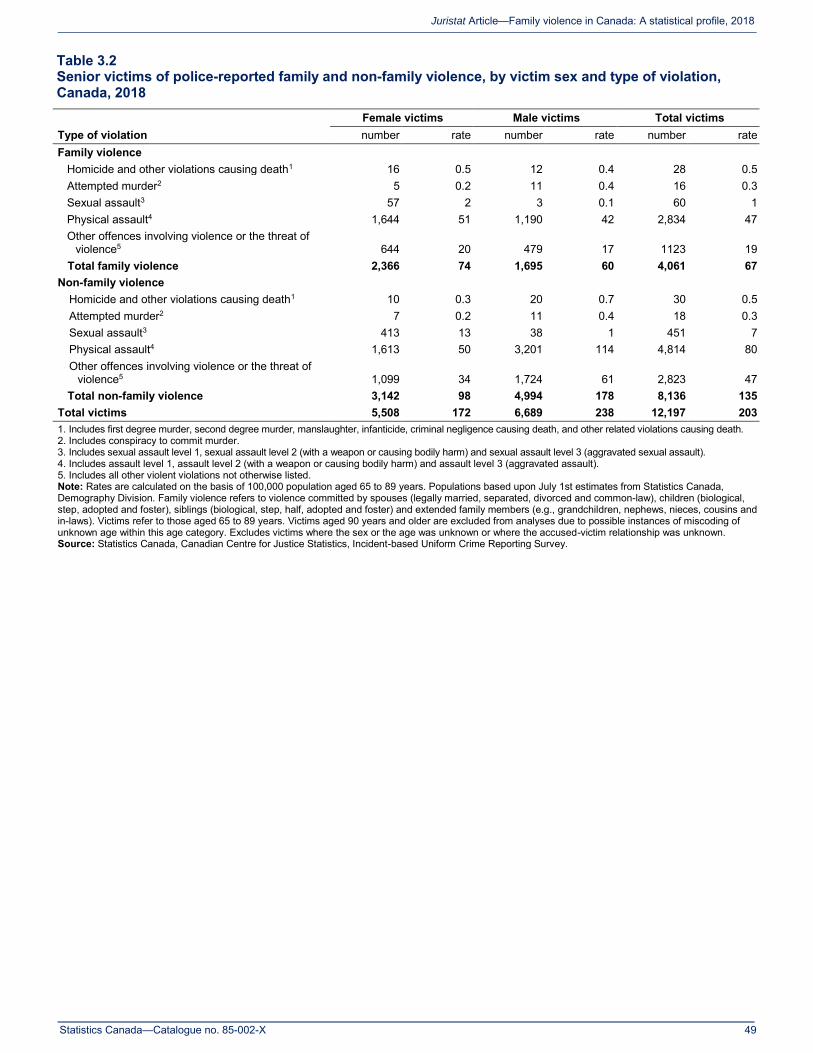
Statistics Canada—Catalogue no. 85-002-X
49
Juristat Article—Family violence in Canada: A statistical profile, 2018
Table 3.2 Senior victims of police-reported family and non-family violence, by victim sex and type of violation, Canada, 2018
Type of violation Female victims Male victims Total victims number rate number rate number rate
Family violence Homicide and other violations causing death1 16 0.5 12 0.4 28 0.5
Attempted murder2 5 0.2 11 0.4 16 0.3 Sexual assault3 57 2 3 0.1 60 1 Physical assault4 1,644 51 1,190 42 2,834 47 Other offences involving violence or the threat of
violence5 644 20 479 17 1123 19 Total family violence 2,366 74 1,695 60 4,061 67
Non-family violence Homicide and other violations causing death1 10 0.3 20 0.7 30 0.5
Attempted murder2 7 0.2 11 0.4 18 0.3 Sexual assault3 413 13 38 1 451 7 Physical assault4 1,613 50 3,201 114 4,814 80 Other offences involving violence or the threat of
violence5 1,099 34 1,724 61 2,823 47 Total non-family violence 3,142 98 4,994 178 8,136 135
Total victims 5,508 172 6,689 238 12,197 203 1. Includes first degree murder, second degree murder, manslaughter, infanticide, criminal negligence causing death, and other related violations causing death. 2. Includes conspiracy to commit murder. 3. Includes sexual assault level 1, sexual assault level 2 (with a weapon or causing bodily harm) and sexual assault level 3 (aggravated sexual assault). 4. Includes assault level 1, assault level 2 (with a weapon or causing bodily harm) and assault level 3 (aggravated assault). 5. Includes all other violent violations not otherwise listed. Note: Rates are calculated on the basis of 100,000 population aged 65 to 89 years. Populations based upon July 1st estimates from Statistics Canada, Demography Division. Family violence refers to violence committed by spouses (legally married, separated, divorced and common-law), children (biological, step, adopted and foster), siblings (biological, step, half, adopted and foster) and extended family members (e.g., grandchildren, nephews, nieces, cousins and in-laws). Victims refer to those aged 65 to 89 years. Victims aged 90 years and older are excluded from analyses due to possible instances of miscoding of unknown age within this age category. Excludes victims where the sex or the age was unknown or where the accused-victim relationship was unknown. Source: Statistics Canada, Canadian Centre for Justice Statistics, Incident-based Uniform Crime Reporting Survey.

Statistics Canada—Catalogue no. 85-002-X
50
Juristat Article—Family violence in Canada: A statistical profile, 2018
Table 3.3 Senior victims of police-reported family and non-family violence, by victim sex, type of violation and clearance status, Canada, 2018
Type of violation and clearance status
Family violence Non-family violence Total
victims1 Female victims
Male victims
Total victims
Female victims
Male victims
Total victims
# % # % # % # % # % # % % Sexual assault2
Not cleared 24 42 2 67 26 43 187 45 24 63 211 47 46 Insufficient evidence to proceed3 8 14 1 33 9 15 53 13 5 13 58 13 13 Other4 16 28 1 33 17 28 134 32 19 50 153 34 33
Cleared by charge5 20 35 1 33 21 35 74 18 5 13 79 18 20 Cleared otherwise 13 23 0 0 13 22 152 37 9 24 161 36 34
Victim/complainant requests no further action (accused identified)6 8 14 0 0 8 13 65 16 4 11 69 15 15
Reasons beyond the control of department 2 4 0 0 2 3 13 3 0 0 13 3 3
Departmental discretion 2 4 0 0 2 3 70 17 5 13 75 17 15 Other7 1 2 0 0 1 2 4 1 0 0 4 1 1
Total8 57 100 3 100 60 100 413 100 38 100 451 100 100 Physical assault9
Not cleared 252 15 194 16 446 16 578 36 1,092 34 1,670 35 28 Insufficient evidence to proceed3 41 2 36 3 77 3 84 5 130 4 214 4 4 Other4 211 13 158 13 369 13 494 31 962 30 1,456 30 24
Cleared by charge5 941 57 590 50 1,531 54 421 26 1,217 38 1,638 34 41 Cleared otherwise 451 27 406 34 857 30 614 38 892 28 1,506 31 31
Victim/complainant requests no further action (accused identified)6 286 17 277 23 563 20 225 14 502 16 727 15 17
Reasons beyond the control of department 57 3 42 4 99 3 56 3 72 2 128 3 3
Departmental discretion 83 5 74 6 157 6 301 19 280 9 581 12 10 Other7 25 2 13 1 38 1 32 2 38 1 70 1 1
Total8 1,644 100 1,190 100 2,834 100 1,613 100 3,201 100 4,814 100 100 Other offences involving violence or
the threat of violence10 Not cleared 152 24 108 23 260 23 515 47 751 44 1,266 45 39
Insufficient evidence to proceed3 19 3 16 3 35 3 65 6 130 8 195 7 6 Other4 133 21 92 19 225 20 450 41 621 36 1,071 38 33
Cleared by charge5 342 53 237 49 579 52 407 37 628 36 1,035 37 41 See notes at the end of the table.
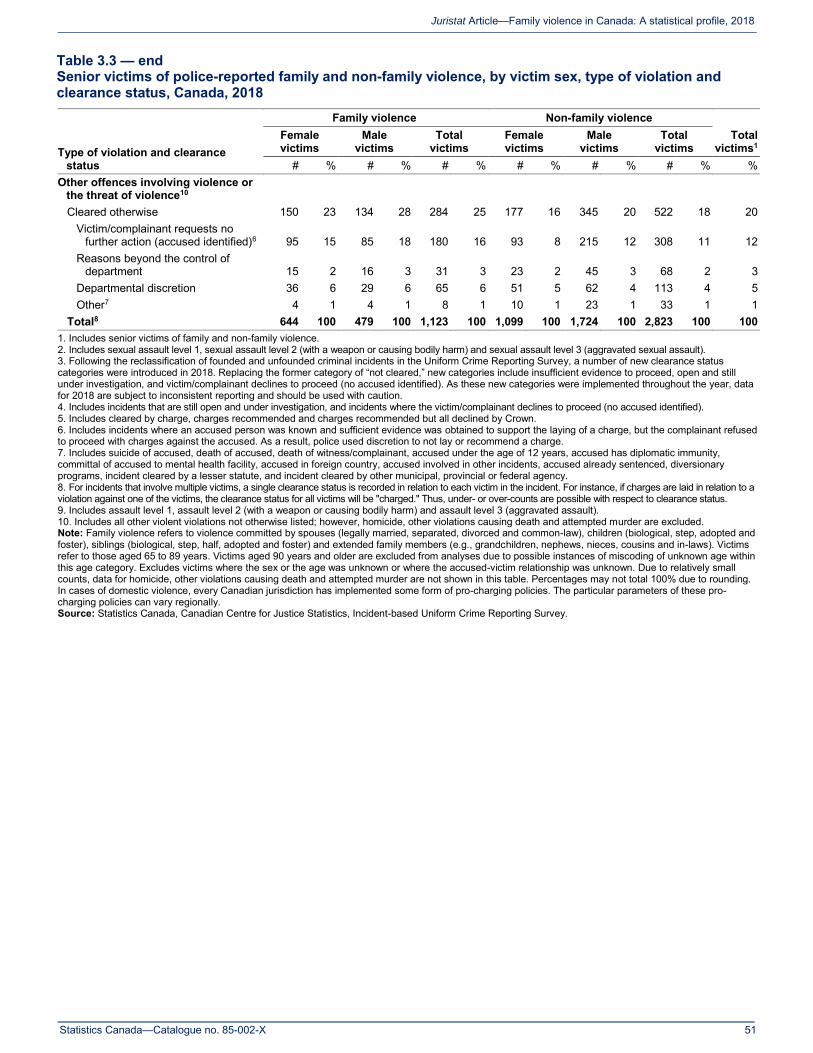
Statistics Canada—Catalogue no. 85-002-X
51
Juristat Article—Family violence in Canada: A statistical profile, 2018
Table 3.3 — end Senior victims of police-reported family and non-family violence, by victim sex, type of violation and clearance status, Canada, 2018
Type of violation and clearance status
Family violence Non-family violence Total
victims1 Female victims
Male victims
Total victims
Female victims
Male victims
Total victims
# % # % # % # % # % # % % Other offences involving violence or
the threat of violence10 Cleared otherwise 150 23 134 28 284 25 177 16 345 20 522 18 20
Victim/complainant requests no further action (accused identified)6 95 15 85 18 180 16 93 8 215 12 308 11 12
Reasons beyond the control of department 15 2 16 3 31 3 23 2 45 3 68 2 3
Departmental discretion 36 6 29 6 65 6 51 5 62 4 113 4 5 Other7 4 1 4 1 8 1 10 1 23 1 33 1 1
Total8 644 100 479 100 1,123 100 1,099 100 1,724 100 2,823 100 100 1. Includes senior victims of family and non-family violence. 2. Includes sexual assault level 1, sexual assault level 2 (with a weapon or causing bodily harm) and sexual assault level 3 (aggravated sexual assault). 3. Following the reclassification of founded and unfounded criminal incidents in the Uniform Crime Reporting Survey, a number of new clearance status categories were introduced in 2018. Replacing the former category of “not cleared,” new categories include insufficient evidence to proceed, open and still under investigation, and victim/complainant declines to proceed (no accused identified). As these new categories were implemented throughout the year, data for 2018 are subject to inconsistent reporting and should be used with caution. 4. Includes incidents that are still open and under investigation, and incidents where the victim/complainant declines to proceed (no accused identified). 5. Includes cleared by charge, charges recommended and charges recommended but all declined by Crown. 6. Includes incidents where an accused person was known and sufficient evidence was obtained to support the laying of a charge, but the complainant refused to proceed with charges against the accused. As a result, police used discretion to not lay or recommend a charge. 7. Includes suicide of accused, death of accused, death of witness/complainant, accused under the age of 12 years, accused has diplomatic immunity, committal of accused to mental health facility, accused in foreign country, accused involved in other incidents, accused already sentenced, diversionary programs, incident cleared by a lesser statute, and incident cleared by other municipal, provincial or federal agency. 8. For incidents that involve multiple victims, a single clearance status is recorded in relation to each victim in the incident. For instance, if charges are laid in relation to a violation against one of the victims, the clearance status for all victims will be "charged." Thus, under- or over-counts are possible with respect to clearance status. 9. Includes assault level 1, assault level 2 (with a weapon or causing bodily harm) and assault level 3 (aggravated assault). 10. Includes all other violent violations not otherwise listed; however, homicide, other violations causing death and attempted murder are excluded. Note: Family violence refers to violence committed by spouses (legally married, separated, divorced and common-law), children (biological, step, adopted and foster), siblings (biological, step, half, adopted and foster) and extended family members (e.g., grandchildren, nephews, nieces, cousins and in-laws). Victims refer to those aged 65 to 89 years. Victims aged 90 years and older are excluded from analyses due to possible instances of miscoding of unknown age within this age category. Excludes victims where the sex or the age was unknown or where the accused-victim relationship was unknown. Due to relatively small counts, data for homicide, other violations causing death and attempted murder are not shown in this table. Percentages may not total 100% due to rounding. In cases of domestic violence, every Canadian jurisdiction has implemented some form of pro-charging policies. The particular parameters of these pro-charging policies can vary regionally. Source: Statistics Canada, Canadian Centre for Justice Statistics, Incident-based Uniform Crime Reporting Survey.
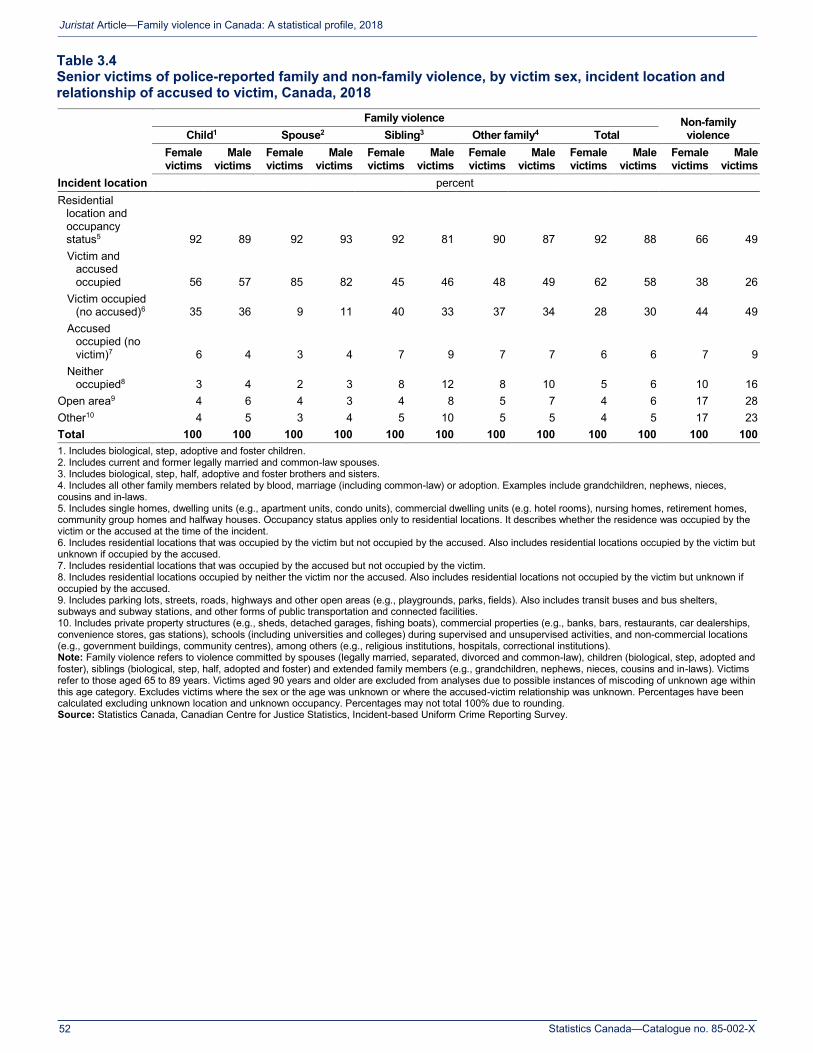
Statistics Canada—Catalogue no. 85-002-X
52
Juristat Article—Family violence in Canada: A statistical profile, 2018
Table 3.4 Senior victims of police-reported family and non-family violence, by victim sex, incident location and relationship of accused to victim, Canada, 2018
Incident location
Family violence Non-family violence Child1 Spouse2 Sibling3 Other family4 Total
Female victims
Male victims
Female victims
Male victims
Female victims
Male victims
Female victims
Male victims
Female victims
Male victims
Female victims
Male victims
percent Residential
location and occupancy status5 92 89 92 93 92 81 90 87 92 88 66 49 Victim and
accused occupied 56 57 85 82 45 46 48 49 62 58 38 26
Victim occupied (no accused)6 35 36 9 11 40 33 37 34 28 30 44 49
Accused occupied (no victim)7 6 4 3 4 7 9 7 7 6 6 7 9
Neither occupied8 3 4 2 3 8 12 8 10 5 6 10 16
Open area9 4 6 4 3 4 8 5 7 4 6 17 28 Other10 4 5 3 4 5 10 5 5 4 5 17 23 Total 100 100 100 100 100 100 100 100 100 100 100 100 1. Includes biological, step, adoptive and foster children. 2. Includes current and former legally married and common-law spouses. 3. Includes biological, step, half, adoptive and foster brothers and sisters. 4. Includes all other family members related by blood, marriage (including common-law) or adoption. Examples include grandchildren, nephews, nieces, cousins and in-laws. 5. Includes single homes, dwelling units (e.g., apartment units, condo units), commercial dwelling units (e.g. hotel rooms), nursing homes, retirement homes, community group homes and halfway houses. Occupancy status applies only to residential locations. It describes whether the residence was occupied by the victim or the accused at the time of the incident. 6. Includes residential locations that was occupied by the victim but not occupied by the accused. Also includes residential locations occupied by the victim but unknown if occupied by the accused. 7. Includes residential locations that was occupied by the accused but not occupied by the victim. 8. Includes residential locations occupied by neither the victim nor the accused. Also includes residential locations not occupied by the victim but unknown if occupied by the accused. 9. Includes parking lots, streets, roads, highways and other open areas (e.g., playgrounds, parks, fields). Also includes transit buses and bus shelters, subways and subway stations, and other forms of public transportation and connected facilities. 10. Includes private property structures (e.g., sheds, detached garages, fishing boats), commercial properties (e.g., banks, bars, restaurants, car dealerships, convenience stores, gas stations), schools (including universities and colleges) during supervised and unsupervised activities, and non-commercial locations (e.g., government buildings, community centres), among others (e.g., religious institutions, hospitals, correctional institutions). Note: Family violence refers to violence committed by spouses (legally married, separated, divorced and common-law), children (biological, step, adopted and foster), siblings (biological, step, half, adopted and foster) and extended family members (e.g., grandchildren, nephews, nieces, cousins and in-laws). Victims refer to those aged 65 to 89 years. Victims aged 90 years and older are excluded from analyses due to possible instances of miscoding of unknown age within this age category. Excludes victims where the sex or the age was unknown or where the accused-victim relationship was unknown. Percentages have been calculated excluding unknown location and unknown occupancy. Percentages may not total 100% due to rounding. Source: Statistics Canada, Canadian Centre for Justice Statistics, Incident-based Uniform Crime Reporting Survey.

Statistics Canada—Catalogue no. 85-002-X
53
Juristat Article—Family violence in Canada: A statistical profile, 2018
Table 3.5 Senior victims of police-reported family and non-family violence, by sex of victim, type of weapon present and level of injury, Canada, 2018
Type of weapon present and level of injury
Family violence Non-family violence Female victims Male victims Total victims Female victims Male victims Total victims
# % # % # % # % # % # % No weapon1 112 7 91 7 203 7 198 8 219 6 417 7 Threats2 225 13 167 13 392 13 252 11 434 12 686 11 Physical force 1,120 65 758 60 1,878 63 1,615 67 2,183 59 3,798 62 Weapon 258 15 248 20 506 17 332 14 853 23 1,185 19
Firearm 19 1 14 1 33 1 45 2 121 3 166 3 Knife or other piercing
instrument3 76 4 90 7 166 6 83 3 222 6 305 5 Club or other blunt instrument 37 2 38 3 75 3 29 1 113 3 142 2 Other weapon4 126 7 106 8 232 8 175 7 397 11 572 9
Unknown 25 ... 18 ... 43 ... 51 ... 75 ... 126 ... Total type of weapon present 1,740 100 1,282 100 3,022 100 2,448 100 3,764 100 6,212 100 No injury5 978 59 687 55 1,665 57 1,652 70 2,091 57 3,743 62 Injury 692 41 554 45 1,246 43 702 30 1,554 43 2,256 38
Minor physical injury6 641 38 523 42 1,164 40 665 28 1,399 38 2,064 34 Major physical injury or death7 51 3 31 2 82 3 37 2 155 4 192 3
Unknown 70 ... 41 ... 111 ... 94 ... 119 ... 213 ... Total level of injury 1,740 100 1,282 100 3,022 100 2,448 100 3,764 100 6,212 100 ... not applicable 1. Includes no threat, physical force or weapon. 2. Includes threats that are construed to imply that death or injury is possible. 3. Includes other piercing/cutting instruments, such as hatchets, razor blades and arrows. 4. Includes other types of weapons such as explosives, fire, motor vehicles, poison and weapons not otherwise classified. 5. Includes incidents that did not involve the use of weapons or physical force as well as those in which no visible injuries were noted by police. 6. Refers to injuries that required no professional medical treatment or only some first aid (e.g., bandage, ice). 7. Refers to injuries that required professional medical attention at the scene or transportation to a medical facility, or injuries that resulted in death. Note: The weapon present (if any) may or may not have caused the injury to the victim (if any). Family violence refers to violence committed by spouses (legally married, separated, divorced and common-law), children (biological, step, adopted and foster), siblings (biological, step, half, adopted and foster) and extended family members (e.g., grandchildren, nephews, nieces, cousins and in-laws). Victims refer to those aged 65 to 89 years. Victims aged 90 years and older are excluded from analyses due to possible instances of miscoding of unknown age within this age category. Excludes victims where the sex or the age was unknown or where the accused-victim relationship was unknown. Excludes data from the province of Quebec due to data quality concerns. Percentages have been calculated excluding unknown type of weapon and unknown level of injury. Percentages may not total 100% due to rounding. Source: Statistics Canada, Canadian Centre for Justice Statistics, Incident-based Uniform Crime Reporting Survey.
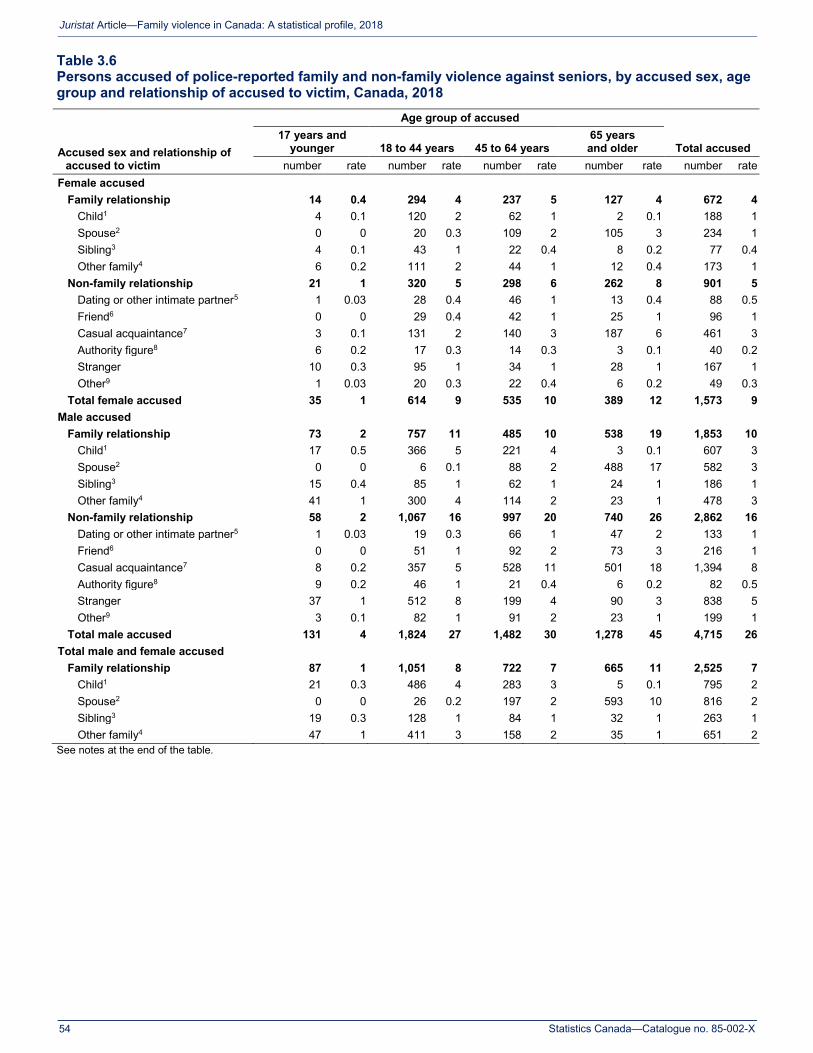
Statistics Canada—Catalogue no. 85-002-X
54
Juristat Article—Family violence in Canada: A statistical profile, 2018
Table 3.6 Persons accused of police-reported family and non-family violence against seniors, by accused sex, age group and relationship of accused to victim, Canada, 2018
Accused sex and relationship of accused to victim
Age group of accused
Total accused 17 years and
younger 18 to 44 years 45 to 64 years 65 years and older
number rate number rate number rate number rate number rate Female accused
Family relationship 14 0.4 294 4 237 5 127 4 672 4 Child1 4 0.1 120 2 62 1 2 0.1 188 1 Spouse2 0 0 20 0.3 109 2 105 3 234 1 Sibling3 4 0.1 43 1 22 0.4 8 0.2 77 0.4 Other family4 6 0.2 111 2 44 1 12 0.4 173 1
Non-family relationship 21 1 320 5 298 6 262 8 901 5 Dating or other intimate partner5 1 0.03 28 0.4 46 1 13 0.4 88 0.5 Friend6 0 0 29 0.4 42 1 25 1 96 1 Casual acquaintance7 3 0.1 131 2 140 3 187 6 461 3 Authority figure8 6 0.2 17 0.3 14 0.3 3 0.1 40 0.2 Stranger 10 0.3 95 1 34 1 28 1 167 1 Other9 1 0.03 20 0.3 22 0.4 6 0.2 49 0.3
Total female accused 35 1 614 9 535 10 389 12 1,573 9 Male accused
Family relationship 73 2 757 11 485 10 538 19 1,853 10 Child1 17 0.5 366 5 221 4 3 0.1 607 3 Spouse2 0 0 6 0.1 88 2 488 17 582 3 Sibling3 15 0.4 85 1 62 1 24 1 186 1 Other family4 41 1 300 4 114 2 23 1 478 3
Non-family relationship 58 2 1,067 16 997 20 740 26 2,862 16 Dating or other intimate partner5 1 0.03 19 0.3 66 1 47 2 133 1 Friend6 0 0 51 1 92 2 73 3 216 1 Casual acquaintance7 8 0.2 357 5 528 11 501 18 1,394 8 Authority figure8 9 0.2 46 1 21 0.4 6 0.2 82 0.5 Stranger 37 1 512 8 199 4 90 3 838 5 Other9 3 0.1 82 1 91 2 23 1 199 1
Total male accused 131 4 1,824 27 1,482 30 1,278 45 4,715 26 Total male and female accused
Family relationship 87 1 1,051 8 722 7 665 11 2,525 7 Child1 21 0.3 486 4 283 3 5 0.1 795 2 Spouse2 0 0 26 0.2 197 2 593 10 816 2 Sibling3 19 0.3 128 1 84 1 32 1 263 1 Other family4 47 1 411 3 158 2 35 1 651 2
See notes at the end of the table.
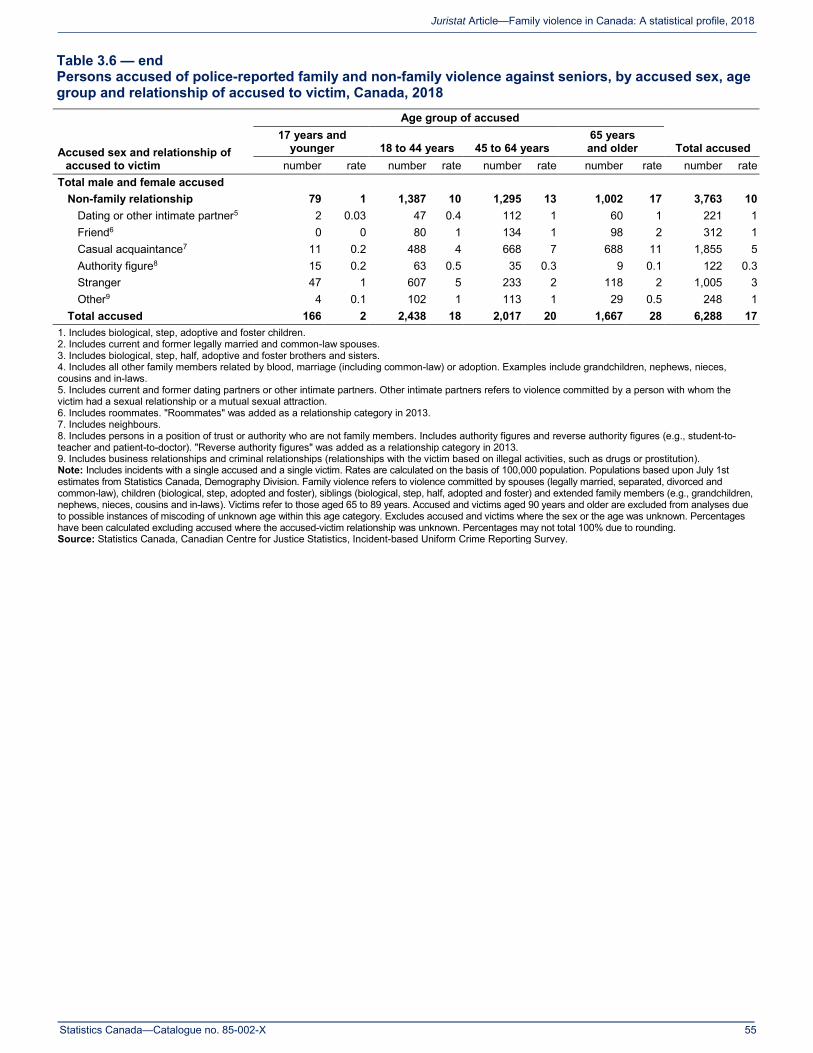
Statistics Canada—Catalogue no. 85-002-X
55
Juristat Article—Family violence in Canada: A statistical profile, 2018
Table 3.6 — end Persons accused of police-reported family and non-family violence against seniors, by accused sex, age group and relationship of accused to victim, Canada, 2018
Accused sex and relationship of accused to victim
Age group of accused
Total accused 17 years and
younger 18 to 44 years 45 to 64 years 65 years and older
number rate number rate number rate number rate number rate Total male and female accused
Non-family relationship 79 1 1,387 10 1,295 13 1,002 17 3,763 10 Dating or other intimate partner5 2 0.03 47 0.4 112 1 60 1 221 1 Friend6 0 0 80 1 134 1 98 2 312 1 Casual acquaintance7 11 0.2 488 4 668 7 688 11 1,855 5 Authority figure8 15 0.2 63 0.5 35 0.3 9 0.1 122 0.3 Stranger 47 1 607 5 233 2 118 2 1,005 3 Other9 4 0.1 102 1 113 1 29 0.5 248 1
Total accused 166 2 2,438 18 2,017 20 1,667 28 6,288 17 1. Includes biological, step, adoptive and foster children. 2. Includes current and former legally married and common-law spouses. 3. Includes biological, step, half, adoptive and foster brothers and sisters. 4. Includes all other family members related by blood, marriage (including common-law) or adoption. Examples include grandchildren, nephews, nieces, cousins and in-laws. 5. Includes current and former dating partners or other intimate partners. Other intimate partners refers to violence committed by a person with whom the victim had a sexual relationship or a mutual sexual attraction. 6. Includes roommates. "Roommates" was added as a relationship category in 2013. 7. Includes neighbours. 8. Includes persons in a position of trust or authority who are not family members. Includes authority figures and reverse authority figures (e.g., student-to-teacher and patient-to-doctor). "Reverse authority figures" was added as a relationship category in 2013. 9. Includes business relationships and criminal relationships (relationships with the victim based on illegal activities, such as drugs or prostitution). Note: Includes incidents with a single accused and a single victim. Rates are calculated on the basis of 100,000 population. Populations based upon July 1st estimates from Statistics Canada, Demography Division. Family violence refers to violence committed by spouses (legally married, separated, divorced and common-law), children (biological, step, adopted and foster), siblings (biological, step, half, adopted and foster) and extended family members (e.g., grandchildren, nephews, nieces, cousins and in-laws). Victims refer to those aged 65 to 89 years. Accused and victims aged 90 years and older are excluded from analyses due to possible instances of miscoding of unknown age within this age category. Excludes accused and victims where the sex or the age was unknown. Percentages have been calculated excluding accused where the accused-victim relationship was unknown. Percentages may not total 100% due to rounding. Source: Statistics Canada, Canadian Centre for Justice Statistics, Incident-based Uniform Crime Reporting Survey.
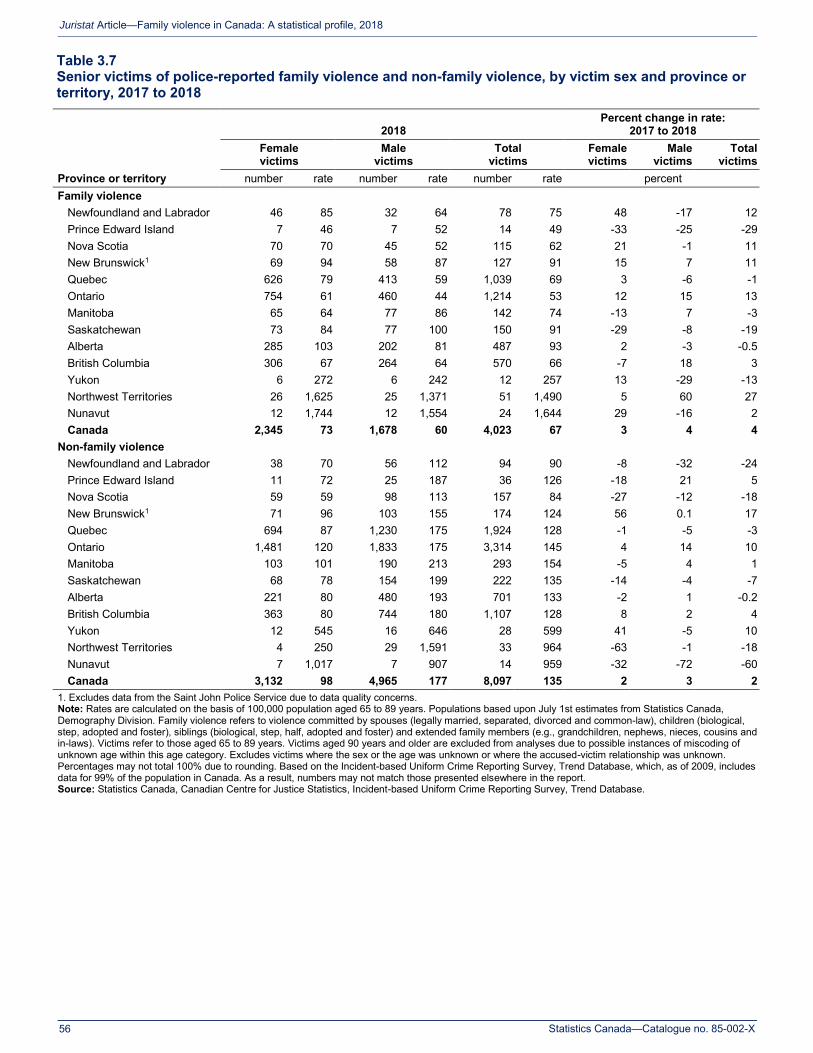
Statistics Canada—Catalogue no. 85-002-X
56
Juristat Article—Family violence in Canada: A statistical profile, 2018
Table 3.7 Senior victims of police-reported family violence and non-family violence, by victim sex and province or territory, 2017 to 2018
Province or territory
2018 Percent change in rate:
2017 to 2018 Female victims
Male victims
Total victims
Female victims
Male victims
Total victims
number rate number rate number rate percent Family violence
Newfoundland and Labrador 46 85 32 64 78 75 48 -17 12 Prince Edward Island 7 46 7 52 14 49 -33 -25 -29 Nova Scotia 70 70 45 52 115 62 21 -1 11 New Brunswick1 69 94 58 87 127 91 15 7 11 Quebec 626 79 413 59 1,039 69 3 -6 -1 Ontario 754 61 460 44 1,214 53 12 15 13 Manitoba 65 64 77 86 142 74 -13 7 -3 Saskatchewan 73 84 77 100 150 91 -29 -8 -19 Alberta 285 103 202 81 487 93 2 -3 -0.5 British Columbia 306 67 264 64 570 66 -7 18 3 Yukon 6 272 6 242 12 257 13 -29 -13 Northwest Territories 26 1,625 25 1,371 51 1,490 5 60 27 Nunavut 12 1,744 12 1,554 24 1,644 29 -16 2 Canada 2,345 73 1,678 60 4,023 67 3 4 4
Non-family violence Newfoundland and Labrador 38 70 56 112 94 90 -8 -32 -24
Prince Edward Island 11 72 25 187 36 126 -18 21 5 Nova Scotia 59 59 98 113 157 84 -27 -12 -18 New Brunswick1 71 96 103 155 174 124 56 0.1 17 Quebec 694 87 1,230 175 1,924 128 -1 -5 -3 Ontario 1,481 120 1,833 175 3,314 145 4 14 10 Manitoba 103 101 190 213 293 154 -5 4 1 Saskatchewan 68 78 154 199 222 135 -14 -4 -7 Alberta 221 80 480 193 701 133 -2 1 -0.2 British Columbia 363 80 744 180 1,107 128 8 2 4 Yukon 12 545 16 646 28 599 41 -5 10 Northwest Territories 4 250 29 1,591 33 964 -63 -1 -18 Nunavut 7 1,017 7 907 14 959 -32 -72 -60 Canada 3,132 98 4,965 177 8,097 135 2 3 2
1. Excludes data from the Saint John Police Service due to data quality concerns. Note: Rates are calculated on the basis of 100,000 population aged 65 to 89 years. Populations based upon July 1st estimates from Statistics Canada, Demography Division. Family violence refers to violence committed by spouses (legally married, separated, divorced and common-law), children (biological, step, adopted and foster), siblings (biological, step, half, adopted and foster) and extended family members (e.g., grandchildren, nephews, nieces, cousins and in-laws). Victims refer to those aged 65 to 89 years. Victims aged 90 years and older are excluded from analyses due to possible instances of miscoding of unknown age within this age category. Excludes victims where the sex or the age was unknown or where the accused-victim relationship was unknown. Percentages may not total 100% due to rounding. Based on the Incident-based Uniform Crime Reporting Survey, Trend Database, which, as of 2009, includes data for 99% of the population in Canada. As a result, numbers may not match those presented elsewhere in the report. Source: Statistics Canada, Canadian Centre for Justice Statistics, Incident-based Uniform Crime Reporting Survey, Trend Database.
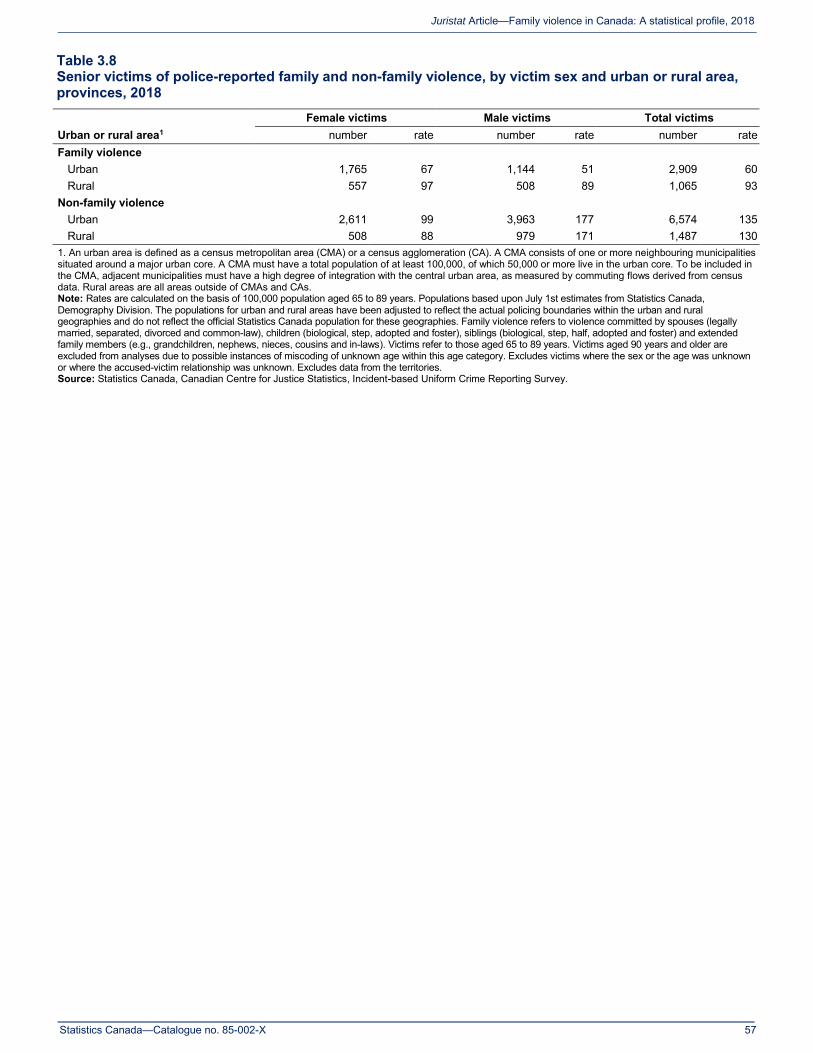
Statistics Canada—Catalogue no. 85-002-X
57
Juristat Article—Family violence in Canada: A statistical profile, 2018
Table 3.8 Senior victims of police-reported family and non-family violence, by victim sex and urban or rural area, provinces, 2018
Urban or rural area1 Female victims Male victims Total victims
number rate number rate number rate Family violence
Urban 1,765 67 1,144 51 2,909 60 Rural 557 97 508 89 1,065 93
Non-family violence Urban 2,611 99 3,963 177 6,574 135
Rural 508 88 979 171 1,487 130 1. An urban area is defined as a census metropolitan area (CMA) or a census agglomeration (CA). A CMA consists of one or more neighbouring municipalities situated around a major urban core. A CMA must have a total population of at least 100,000, of which 50,000 or more live in the urban core. To be included in the CMA, adjacent municipalities must have a high degree of integration with the central urban area, as measured by commuting flows derived from census data. Rural areas are all areas outside of CMAs and CAs. Note: Rates are calculated on the basis of 100,000 population aged 65 to 89 years. Populations based upon July 1st estimates from Statistics Canada, Demography Division. The populations for urban and rural areas have been adjusted to reflect the actual policing boundaries within the urban and rural geographies and do not reflect the official Statistics Canada population for these geographies. Family violence refers to violence committed by spouses (legally married, separated, divorced and common-law), children (biological, step, adopted and foster), siblings (biological, step, half, adopted and foster) and extended family members (e.g., grandchildren, nephews, nieces, cousins and in-laws). Victims refer to those aged 65 to 89 years. Victims aged 90 years and older are excluded from analyses due to possible instances of miscoding of unknown age within this age category. Excludes victims where the sex or the age was unknown or where the accused-victim relationship was unknown. Excludes data from the territories. Source: Statistics Canada, Canadian Centre for Justice Statistics, Incident-based Uniform Crime Reporting Survey.
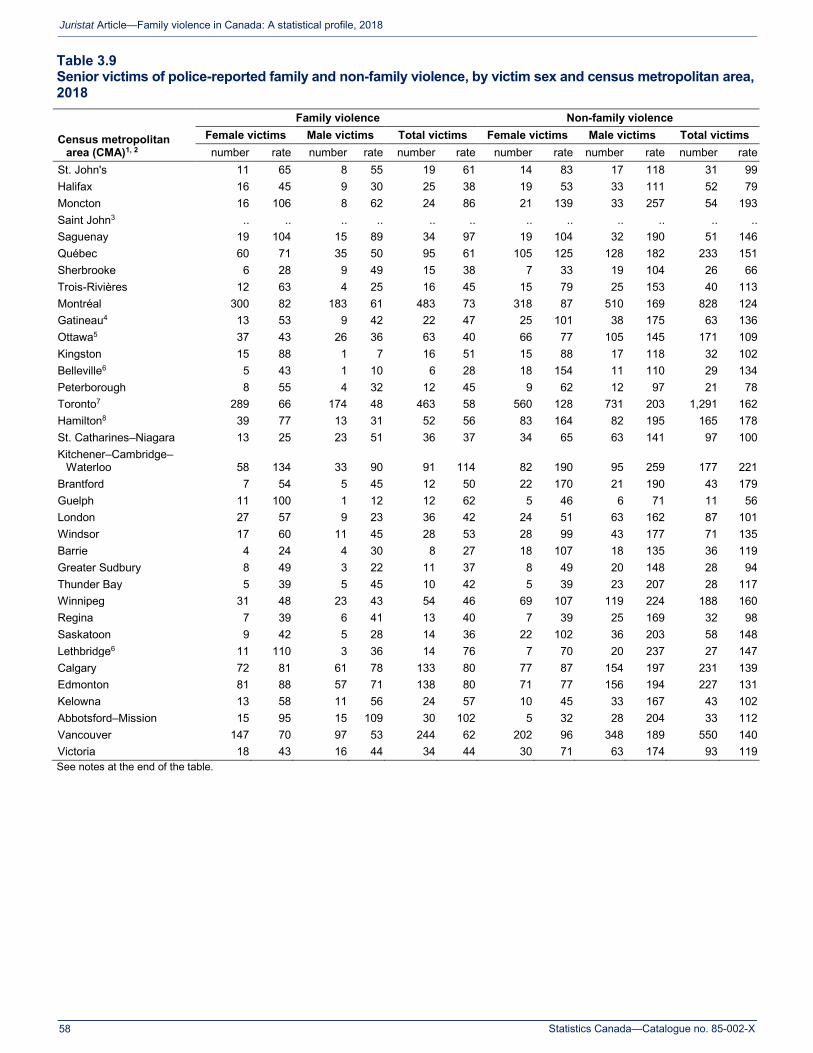
Statistics Canada—Catalogue no. 85-002-X
58
Juristat Article—Family violence in Canada: A statistical profile, 2018
Table 3.9 Senior victims of police-reported family and non-family violence, by victim sex and census metropolitan area, 2018
Census metropolitan area (CMA)1, 2
Family violence Non-family violence Female victims Male victims Total victims Female victims Male victims Total victims number rate number rate number rate number rate number rate number rate
St. John's 11 65 8 55 19 61 14 83 17 118 31 99 Halifax 16 45 9 30 25 38 19 53 33 111 52 79 Moncton 16 106 8 62 24 86 21 139 33 257 54 193 Saint John3 .. .. .. .. .. .. .. .. .. .. .. .. Saguenay 19 104 15 89 34 97 19 104 32 190 51 146 Québec 60 71 35 50 95 61 105 125 128 182 233 151 Sherbrooke 6 28 9 49 15 38 7 33 19 104 26 66 Trois-Rivières 12 63 4 25 16 45 15 79 25 153 40 113 Montréal 300 82 183 61 483 73 318 87 510 169 828 124 Gatineau4 13 53 9 42 22 47 25 101 38 175 63 136 Ottawa5 37 43 26 36 63 40 66 77 105 145 171 109 Kingston 15 88 1 7 16 51 15 88 17 118 32 102 Belleville6 5 43 1 10 6 28 18 154 11 110 29 134 Peterborough 8 55 4 32 12 45 9 62 12 97 21 78 Toronto7 289 66 174 48 463 58 560 128 731 203 1,291 162 Hamilton8 39 77 13 31 52 56 83 164 82 195 165 178 St. Catharines–Niagara 13 25 23 51 36 37 34 65 63 141 97 100 Kitchener–Cambridge–
Waterloo 58 134 33 90 91 114 82 190 95 259 177 221 Brantford 7 54 5 45 12 50 22 170 21 190 43 179 Guelph 11 100 1 12 12 62 5 46 6 71 11 56 London 27 57 9 23 36 42 24 51 63 162 87 101 Windsor 17 60 11 45 28 53 28 99 43 177 71 135 Barrie 4 24 4 30 8 27 18 107 18 135 36 119 Greater Sudbury 8 49 3 22 11 37 8 49 20 148 28 94 Thunder Bay 5 39 5 45 10 42 5 39 23 207 28 117 Winnipeg 31 48 23 43 54 46 69 107 119 224 188 160 Regina 7 39 6 41 13 40 7 39 25 169 32 98 Saskatoon 9 42 5 28 14 36 22 102 36 203 58 148 Lethbridge6 11 110 3 36 14 76 7 70 20 237 27 147 Calgary 72 81 61 78 133 80 77 87 154 197 231 139 Edmonton 81 88 57 71 138 80 71 77 156 194 227 131 Kelowna 13 58 11 56 24 57 10 45 33 167 43 102 Abbotsford–Mission 15 95 15 109 30 102 5 32 28 204 33 112 Vancouver 147 70 97 53 244 62 202 96 348 189 550 140 Victoria 18 43 16 44 34 44 30 71 63 174 93 119 See notes at the end of the table.

Statistics Canada—Catalogue no. 85-002-X
59
Juristat Article—Family violence in Canada: A statistical profile, 2018
Table 3.9 — end Senior victims of police-reported family and non-family violence, by victim sex and census metropolitan area, 2018
Census metropolitan area (CMA)1, 2
Family violence Non-family violence Female victims Male victims Total victims Female victims Male victims Total victims number rate number rate number rate number rate number rate number rate
CMA total9 1,448 68 910 50 2,358 60 2,132 99 3,209 177 5,341 135 Non-CMA total 918 86 785 78 1,703 83 1,010 95 1,785 178 2,795 135 Canada 2,366 74 1,695 60 4,061 67 3,142 98 4,994 178 8,136 135 .. not available for a specific reference period 1. A CMA consists of one or more neighbouring municipalities situated around a major urban core. A CMA must have a total population of at least 100,000, of which 50,000 or more live in the urban core. To be included in the CMA, adjacent municipalities must have a high degree of integration with the central urban area, as measured by commuting flows derived from census data. A CMA typically comprises more than one police service. 2. CMA populations have been adjusted to follow policing boundaries. The Oshawa CMA is excluded from this table due to the incongruity between the police service jurisdictional boundaries and the CMA boundaries. 3. Data for the CMA of Saint John are excluded due to data quality concerns associated with the Saint John Police Service. 4. Gatineau refers to the Quebec part of Ottawa–Gatineau CMA. 5. Ottawa refers to the Ontario part of the Ottawa–Gatineau CMA. 6. Following the 2016 Census of Population, Belleville and Lethbridge were reclassified as CMAs. 7. Excludes the portions of Halton Regional Police and Durham Regional Police that police the CMA of Toronto. 8. Excludes the portion of Halton Regional Police that polices the CMA of Hamilton. 9. Includes Halton Regional Police and Durham Regional Police, which are responsible for policing more than one CMA. This total also includes the portion of Durham Regional Police that polices the Oshawa CMA. Also includes the CMA of Saint John, excluding the Saint John Police Service due to data quality concerns. Because of these inclusions, the CMA total will not equal the total of the individual CMAs. Note: Rates are calculated on the basis of 100,000 population aged 65 to 89 years. Populations based upon July 1st estimates from Statistics Canada, Demography Division. Family violence refers to violence committed by spouses (legally married, separated, divorced and common-law), children (biological, step, adopted and foster), siblings (biological, step, half, adopted and foster) and extended family members (e.g., grandchildren, nephews, nieces, cousins and in-laws). Victims refer to those aged 65 to 89 years. Victims aged 90 years and older are excluded from analyses due to possible instances of miscoding of unknown age within this age category. Excludes victims where the sex or the age was unknown or where the accused-victim relationship was unknown. Source: Statistics Canada, Canadian Centre for Justice Statistics, Incident-based Uniform Crime Reporting Survey.

Statistics Canada—Catalogue no. 85-002-X
60
Juristat Article—Family violence in Canada: A statistical profile, 2018
Table 3.10 Senior victims of family-related and non-family homicide, by victim sex and type of motive, Canada, 2008 to 2018
Type of motive Female victims Male victims Total victims number percent number percent number percent
Family-related homicide Frustration, anger or despair 43 41 22 32 65 37
Argument or quarrel 30 28 32 47 62 36 Mercy killing1 5 5 1 1 6 3 Jealousy 4 4 0 0 4 2 Revenge 2 2 1 1 3 2 Other2 8 8 5 7 13 7 No apparent motive3 14 13 7 10 21 12 Unknown 17 ... 7 ... 24 ... Total 123 100 75 100 198 100
Non-family homicide Frustration, anger or despair 26 39 30 19 56 25
Argument or quarrel 5 8 39 25 44 20 Mercy killing1 0 0 0 0 0 0 Jealousy 1 2 5 3 6 3 Revenge 1 2 8 5 9 4 Other2 20 30 45 29 65 29 No apparent motive3 13 20 29 19 42 19 Unknown 7 ... 10 ... 17 ... Total 73 100 166 100 239 100
... not applicable 1. Includes all homicides where the accused person's primary motive was a mercy killing or to assist a suicide (i.e., when a family member or caregiver kills to relieve a victim's chronic physical pain or suffering). 2. Includes financial gain, concealment, and sexual violence. 3. Includes mental illness and dementia. Note: In 34% of incidents of family-related homicide against seniors where a single victim and a single accused person were involved, police determined that a history of family violence preceded the homicide. Family-related homicide refers to homicide committed by spouses (legally married, separated, divorced and common-law), children (biological, step, adopted and foster), siblings (biological, step, half, adopted and foster) and extended family members (e.g., grandchildren, nephews, nieces, cousins and in-laws). Victims refer to those aged 65 years and older. Excludes victims of unsolved homicides, and victims where the sex or the age was unknown or where the accused-victim relationship was unknown. Percentages have been calculated excluding unknown motives. Percentages may not total 100% due to rounding. Source: Statistics Canada, Canadian Centre for Justice Statistics, Homicide Survey.
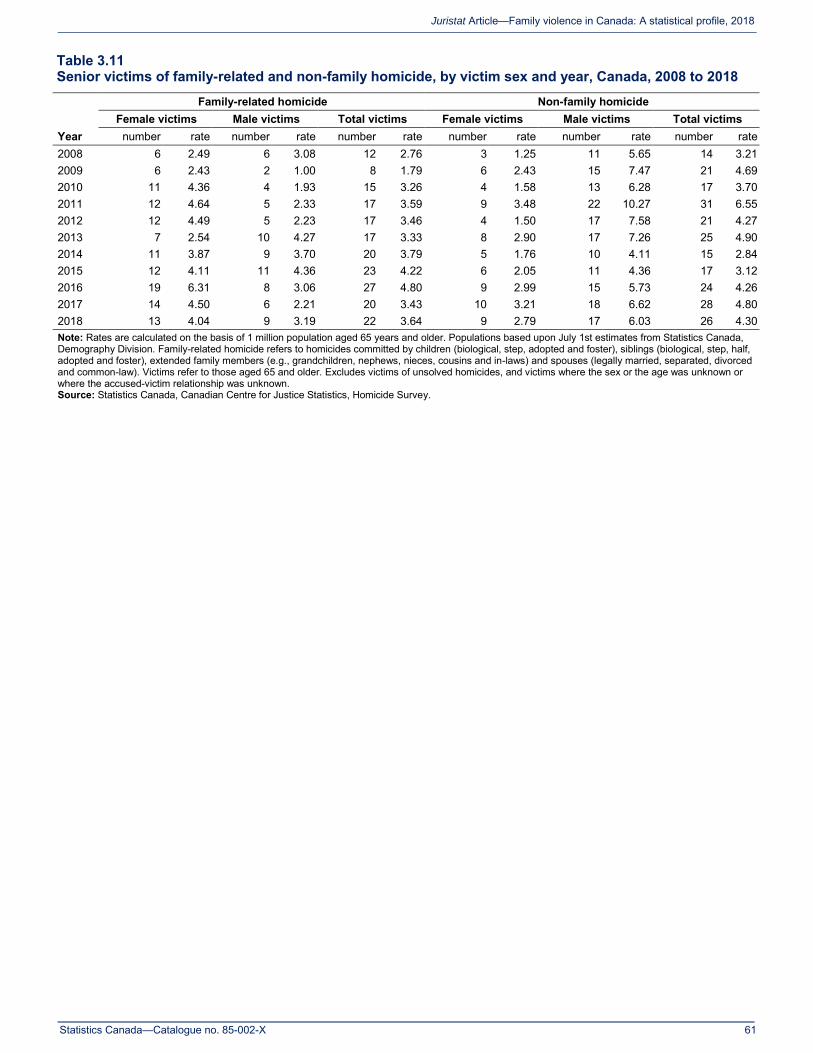
Statistics Canada—Catalogue no. 85-002-X
61
Juristat Article—Family violence in Canada: A statistical profile, 2018
Table 3.11 Senior victims of family-related and non-family homicide, by victim sex and year, Canada, 2008 to 2018
Year
Family-related homicide Non-family homicide Female victims Male victims Total victims Female victims Male victims Total victims
number rate number rate number rate number rate number rate number rate 2008 6 2.49 6 3.08 12 2.76 3 1.25 11 5.65 14 3.21 2009 6 2.43 2 1.00 8 1.79 6 2.43 15 7.47 21 4.69 2010 11 4.36 4 1.93 15 3.26 4 1.58 13 6.28 17 3.70 2011 12 4.64 5 2.33 17 3.59 9 3.48 22 10.27 31 6.55 2012 12 4.49 5 2.23 17 3.46 4 1.50 17 7.58 21 4.27 2013 7 2.54 10 4.27 17 3.33 8 2.90 17 7.26 25 4.90 2014 11 3.87 9 3.70 20 3.79 5 1.76 10 4.11 15 2.84 2015 12 4.11 11 4.36 23 4.22 6 2.05 11 4.36 17 3.12 2016 19 6.31 8 3.06 27 4.80 9 2.99 15 5.73 24 4.26 2017 14 4.50 6 2.21 20 3.43 10 3.21 18 6.62 28 4.80 2018 13 4.04 9 3.19 22 3.64 9 2.79 17 6.03 26 4.30 Note: Rates are calculated on the basis of 1 million population aged 65 years and older. Populations based upon July 1st estimates from Statistics Canada, Demography Division. Family-related homicide refers to homicides committed by children (biological, step, adopted and foster), siblings (biological, step, half, adopted and foster), extended family members (e.g., grandchildren, nephews, nieces, cousins and in-laws) and spouses (legally married, separated, divorced and common-law). Victims refer to those aged 65 and older. Excludes victims of unsolved homicides, and victims where the sex or the age was unknown or where the accused-victim relationship was unknown. Source: Statistics Canada, Canadian Centre for Justice Statistics, Homicide Survey.
Statistics Canada—Catalogue no. 85-002-X
62
Juristat Article—Family violence in Canada: A statistical profile, 2018
Survey description
Incident-based Uniform Crime Reporting Survey
The Incident-based Uniform Crime Reporting Survey collects detailed information on criminal incidents that have come to the attention of, and have been substantiated by, police services in Canada. Information includes characteristics of victims, accused persons and incidents. In 2018, data from police services covered 99% of the population of Canada. The count for a particular year represents incidents reported during that year, regardless of when the incident actually occurred.
One incident can involve multiple offences. In order to ensure comparability, counts are presented based on the most serious offence in the incident as determined by a standard classification rule used by all police services. Counts based on all violations are available upon request.
Victim age is calculated based on the end date of an incident, as reported by the police. Some victims experience violence over a period of time, sometimes years, all of which may be considered by the police to be part of one continuous incident. Information about the number and dates of individual incidents for these victims of continuous violence is not available.
Homicide Survey
The Homicide Survey collects detailed information on all homicide that has come to the attention of, and have been substantiated by, police services in Canada. Information includes characteristics of victims, accused persons and incidents. Since 1961 when recording began, coverage for the Homicide Survey has represented 100% of homicides in Canada. The count for a particular year represents homicide reported during that year, regardless of when the homicide actually occurred.
Survey of Safety in Public and Private Spaces
In 2018, Statistics Canada conducted the first cycle of the Survey of Safety in Public and Private Spaces (SSPPS). The purpose of the survey is to collect information on Canadians’ experiences in public, at work, online and in their intimate partner relationships.
The target population for the SSPPS is the Canadian population aged 15 years and older, living in the provinces and territories. Canadians residing in institutions are not included. Once a household was contacted, an individual 15 years or older was randomly selected to respond to the survey. Data from the territories were collected using a different sampling design and are not yet available.
The sample size for the 10 provinces was 43,296 respondents. The overall response rate was 43.1%. Non-respondents included people who refused to participate, could not be reached, or could not speak English or French. Respondents in the sample were weighted so that their responses represent the non-institutionalized Canadian population aged 15 years and older.