fan gao, phd - faculty/staff websites & bios | web services
TRANSCRIPT

Fan Gao, PhD
Chemical Engineering DepartmentUniversity of Massachusetts Lowell
Feb. 13th 2013

Introduction of BiosensorIntroduction of Biosensor
Nano-Biosensor
Examples of Nano-Biosensor
Electrochemical Biosensor
Lab Session

Diabetes - Glucose Sensor - Blood
Breath alcohol testerBiosensor Breath alcohol tester“…a self-contained integrateddevice which is capable ofproviding specific quantitative orsemi-quantitative analyticalinformation using a biologicalrecognition element which is indirect spatial contact with adirect spatial contact with atransducer element.” - IUPAC
Any analytical device whichor
Any analytical device which converts a biological response into a electrical signal.
Pregnancy test - Urine

Study of biomolecules and how they interact with one another
• Drug Development• In- home medical diagnosis• Environmental field monitoringg• Scientific crime detection• Quality control in small food factory• Food Analysis
•Glucose-based on glucose oxidase•Cholesterol - based on cholesterol oxidase•Antigen-antibody sensors - toxic substances, t ge a t body se so s to c substa ces,pathogenic bacteria•Small molecules and ions in living things: H+, K+, Na+, NO, CO2, H2O2DNA hybridization sequencing mutants and•DNA hybridization, sequencing, mutants and
damage

If I want to measure something small, I need
something small…g

http://www.youtube.com/watch?v=qaFdm6Qj7A4&list=PLC13263D45846876C&index=11
cheaper faster and easier to use analytical toolscheaper, faster, and easier-to-use analytical tools
Synthesis and bioanalytical applications of specific-shaped metallic nanostructures: A review

a b
Electrons/ions
12345 67
c d eElectrons/ions/gases/heat/light/mass
12345.67
Schematic diagram showing the main components of a biosensor. Thebi ti ( ) t th b t t t d t Thi ti i
Reference
bio-reaction (a) converts the substrate to product. This reaction isdetermined by the transducer (b) which converts it to an electrical signal.The output from the transducer is amplified (c), processed (d) anddisplayed (e).d sp ayed (e)

Biological signalingmechanism
Method of Transduction
Antibody/antigen Optical-detectionEnzymes ElectrochemicalNucleic acids Mass-sensitiveCells and viruses Thermal detection

Surface plasmon resonance (SPR) (3 min)
Video (2 min) http://www.youtube.com/watch?v=yEnycUe3mpY
Surface plasmon resonance (SPR) (3 min)http://www.youtube.com/watch?v=sM-VI3alvAI
Optical biosensor - AOptical biosensor A sensor that uses light to detect the effect of a chemical on a biological
tsystem. .
Nature Reviews Drug Discovery 1, 515-528 (July 2002) | doi:10.1038/nrd838

molecular detection using a cantilever’susing a cantilever s bending deflection motion
Nature Nanotechnology 6, 203–215 (2011) doi:10.1038/nnano.2011.44
Nature Biotechnology 19, 856 - 860 (2001) doi:10.1038/nbt0901-856

Thermal biosensors measure thermal energy released or absorbed in biochemical reactions.
A MEMS Thermal Biosensor for MetabolicMonitoring Applications JOURNAL OF MICROELECTROMECHANICAL SYSTEMS, VOL. 17, NO. 2, APRIL 2008
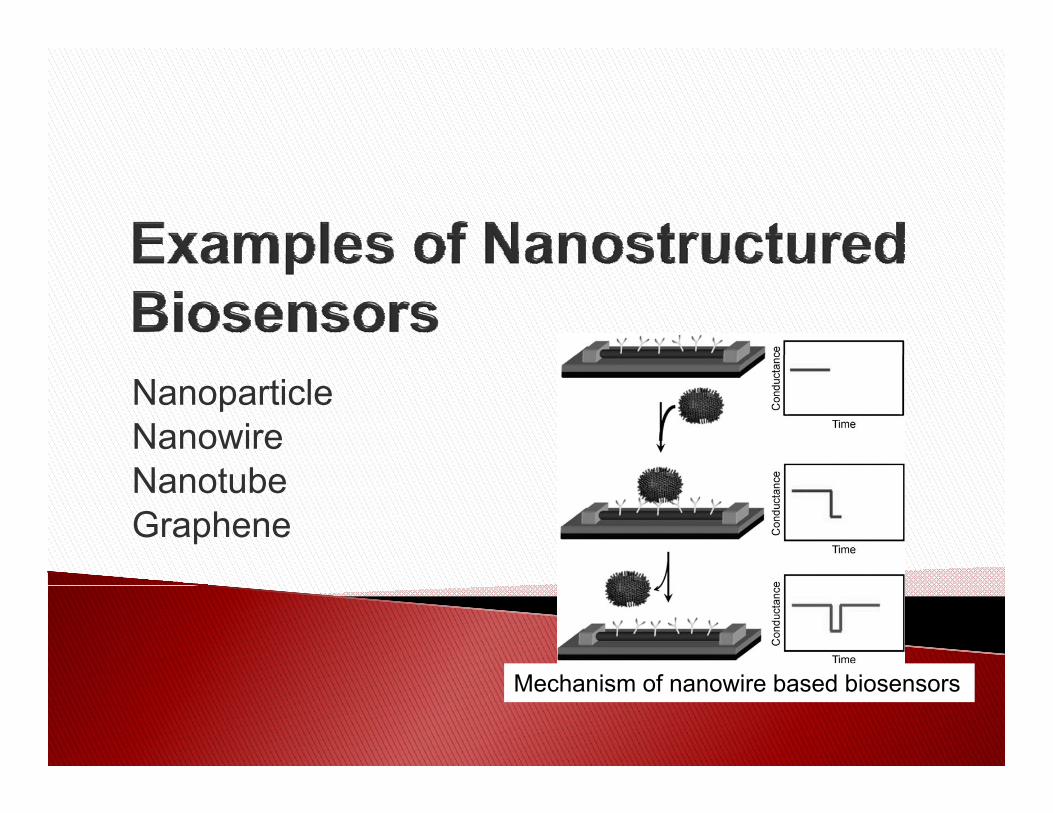
NanoparticleNanowireNanotubeGraphene
Mechanism of nanowire based biosensors
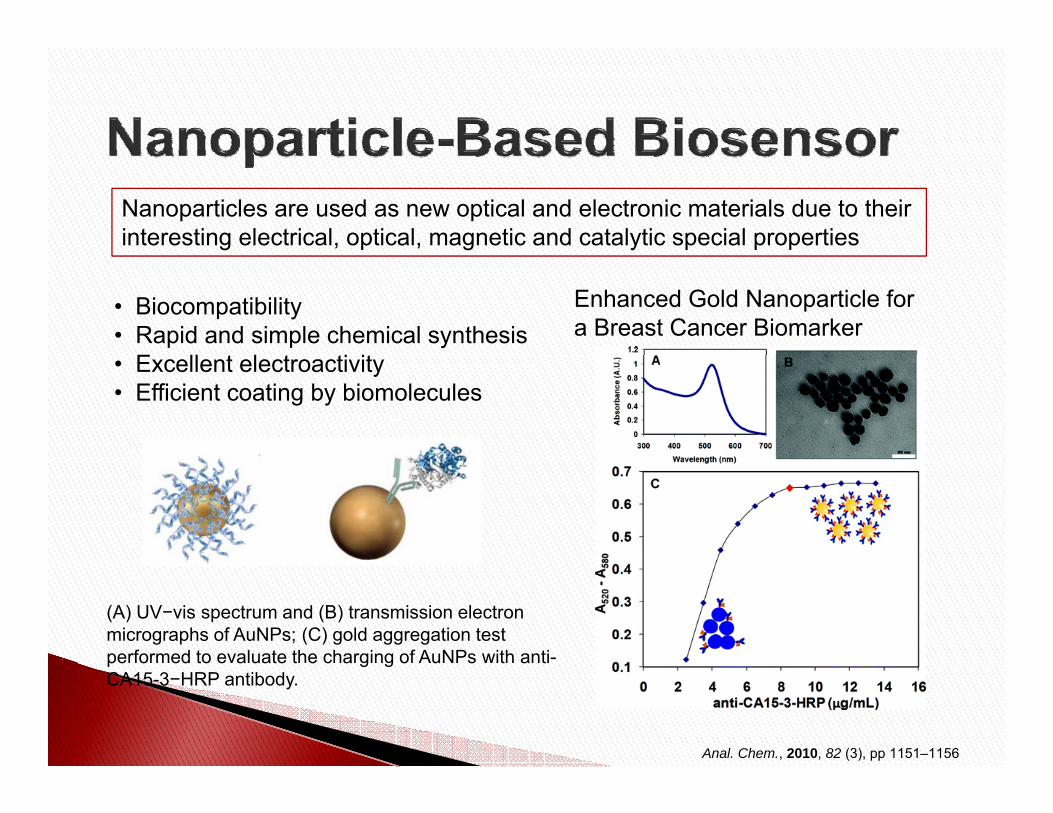
Nanoparticles are used as new optical and electronic materials due to their interesting electrical, optical, magnetic and catalytic special properties
• Biocompatibility• Rapid and simple chemical synthesis
E ll t l t ti it
Enhanced Gold Nanoparticle for a Breast Cancer Biomarker
• Excellent electroactivity• Efficient coating by biomolecules
(A) UV−vis spectrum and (B) transmission electron micrographs of AuNPs; (C) gold aggregation test performed to evaluate the charging of AuNPs with anti-pe o ed to e a uate t e c a g g o u s t a tCA15-3−HRP antibody.
Anal. Chem., 2010, 82 (3), pp 1151–1156

Video of “nanowire biosensor”: (optional) http://www.youtube.com/watch?v=CcIWEkf_FWs
Advantages
1 D structure: high aspect ratio highly sensitivity1-D structure: high aspect ratio highly sensitivity
Different materials: metal, semiconductor, polymers, metal oxidesselectivityselectivity
For example: Au - alkyl thiolsNi - histidinePt – isocyanidesPt – isocyanides
Different types: Single-segment Nanowire / Multi-segment Nanowires
Easily assembled to hybrid system or device FET

Bio molecular Functionalized layer
Nanowire
Bio molecular y
Chemical treatment / Surface modification• Chemical treatment / Surface modificationCovalent functionalization is a chemical process in which a strong bond is formed between the 1-D nanostructured material and the biological molecule or its linkers.e.g. Au-Ni nanowireg
Au alkanethiols with terminal hexa(ethylene glycol) groups (EG6)Ni palmitic
Exposed to a fluorescently tagged proteinNi (hydrophobic) wires bright fluorescenceNi (hydrophobic) wires bright fluorescence
Au (EG6) NoneProteins selectively adsorbed to one portion of these multi-component nanostructures• Enzyme-functionalized nanowiresy
• DNA coated

Disadvantages of CNTMolecular level structure will be easily changed when modified the surface by y g y
chemical which may weak the original properties.Insolubility in water
http://www.kurzweilai.net/new-biosensor-melds-carbon-nanotubes-dnahttp://www.sensorsmag.com/sensors/chemical-gas/nanotechnology-enabled-sensors-possibilities-realities-and-a-1074

(a) Typical amperometric response at the GOD immobilized graphene decorated electrode versus glucose
ul Hasani et al. J Biosens Bioelectron 2012, 3:1http://dx.doi.org/10.4172/2155-6210.1000114
(a) Typical amperometric response at the GOD immobilized graphene decorated electrode versus glucose concentration, (b)The amperometric response versus time as the glucose concentration is modified surrounding the graphene decorated electrode.


Electrochemical biosensors combine the sensitivity of electroanalyticalmethods with the inherent bioselectivity of the biological component.
Enzyme Substrate Product
Chemical reaction enzyme
Oxidation/Reduction
El f
Electrode
Electron transfer
Current change Apply voltage Measure current propagation to Current change pp y g p p gconcentration of substrate

Glucose oxidase (enzyme)
Biggest biosensor success story!
Glucose Gluconic Acid + e-GOx( y )
O + H O +e H O
O2 H2O2Glucose Gluconic Acid
O2 + H2O +e- H2O2
GOx
Nanowire (Electrode)
Apply voltage Measure current propagation to concentration of substrate

How to read those electrochemical signals?

Pt Nanowire Functionalized Glassy Carbon yElectrode towards Sensing of H2O2

1. Linearity: Maximum linear value of the sensor calibration curve. Linearity of the sensor must be high for the detection of high substrate concentration.
2. Sensitivity: The value of the electrode response per substrate concentration.
3 S l ti it I t f f h i l t b i i i d f bt i i th3. Selectivity: Interference of chemicals must be minimized for obtaining the correct result.
4. Response time: The necessary time for having 95% of the response.p y g p

Develop a biosensor with increased sensitivity andDevelop a biosensor with increased sensitivity and selectivity
Fast, accurate, reproducible, and low cost
Use of nanowires have the potential to increaseUse of nanowires have the potential to increase sesitivity and selectivity of sensors• Catalysts for reaction property

Glassy Carbon Electrode (GCE) - is a non-graphitizing carbon which combines glassy and ceramic properties with those ofwhich combines glassy and ceramic properties with those of graphite
Pt Nanowire- was fabricated through electrodeposition method
GCE NafionGCEPt NWs
GCE

Nafion films have been used extensivelyfor the construction of amperometricbiosensors
Cation exchange membrane - Pores allow movement of cations but the membranes do not conduct anions or electrons
•Resistant to chemical attack•High temperatures•Super acid catalyst
http://www.intellectualism.org/questions/Qp g qOTD/dec03/Nafion3.jpg
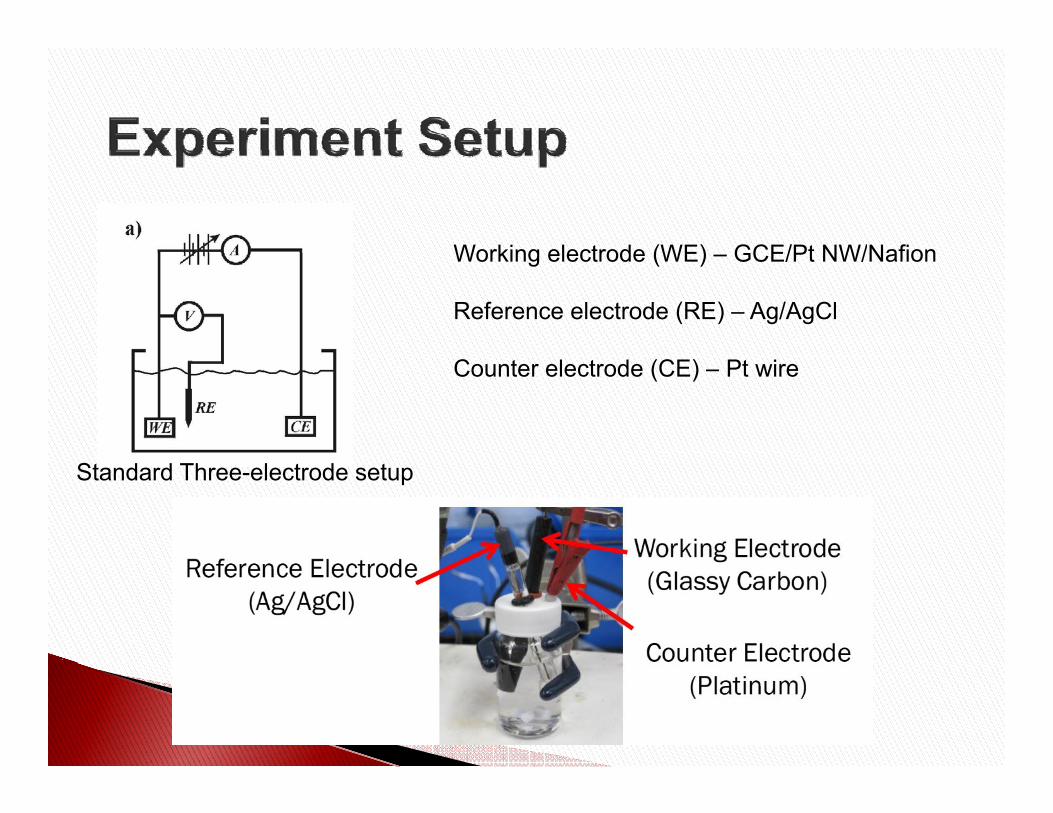
Working electrode (WE) GCE/Pt NW/NafionWorking electrode (WE) – GCE/Pt NW/Nafion
Reference electrode (RE) – Ag/AgCl
Counter electrode (CE) – Pt wire
Standard Three-electrode setup

Cyclic voltammetry (CV) is generally used to study the electrochemicalCyclic voltammetry (CV) is generally used to study the electrochemical properties of an analyte in solution.
The working electrode potential is d li l tiramped linearly versus time

Sensing material: Hydrogen Peroxide (H2O2)
1. Control experimentCV of bare GCE and Pt nanowire functionalized GCE
C f GC / ff f O2. CV curve of GCE/Pt NW in different concentration of H2O2
2 mM, 5 mM, 10 mM, 20 mM, 50 mM
3 Dynamic test of GCE/Pt NW3. Dynamic test of GCE/Pt NW
4. Selectivity test (optional)Compare with other chemical compound such as glucose, AA and UA
5. Data analysis

15
5
10
15
-4
-2
0Reverse Scan
-5
0
PBS only-14
-12
-10
-8
-6
I (uA
)
PBS only 1mM5mM
15
101mM
5mM 10mM 15mM-24
-22
-20
-18
-165mM 10mM 15mM 20mM 25mM 30mM 35mM
30
25
20 20mM 25mM 30mM 35mM
-1.0 -0.5 0.0
E (V)
-1.0 -0.5 0.0 0.5 1.030
E (V)

-4.0x10⁻⁵
-2.0x10⁻⁵
0.0 1 mM
)
2 mM
-40
-20
y=-4.82x-17.63R2=0.9996
-1.0x10⁻⁴
-8.0x10⁻⁵
-6.0x10⁻⁵
Cur
rent
(A)
-80
-60
Cur
rent
(μA
)
R 0.9996
y=-4.65x-20.40R2=0.9987
0 100 200 300 400
-1.4x10⁻⁴
-1.2x10⁻⁴
0 5 10 15 20 25
-120
-100 1 mM 2 mM Linear fit of 1 mM Stepwise Linear fit of 2 mM Stepwise
Time (s) Concentration (mM)

1 Pl t CV f b GCE d Pt i difi d GCE i PBS l ti ith t1. Plot CV of bare GCE and Pt nanowire modified GCE in PBS solution without H2O2.
2. Plot CV of different concentration H2O2 by using GCE/Pt NW biosensor.ot C o d e e t co ce t at o 2O2 by us g GC / t b ose so
3. Plot Current vs. Concentration (I vs. c) based on the dynamic testing result.
4 Calculate the sensitivity linear range of the GCE Pt NW biosensor4. Calculate the sensitivity, linear range of the GCE-Pt NW biosensor.
5. Find at least two reference papers related with hydrogen peroxide sensing by nanostructures and compare the limit of detection (LOD), linear range with p ( ) gexperimental data, and try to explain why they performed different values.