fao agri-environmental indicators - escap...
TRANSCRIPT

FOOD AND AGRICULTURE ORGANIZATION OF THE UNITED NATIONS
Statistics
Division
Robert Mayo
UNECE/FAO/Eurostat Workshop on Environment Statistics
(Budva, Montenegro, May 2013)
Agri-Environmental statistics and
indicators within FAOSTAT
FOOD AND AGRICULTURE ORGANIZATION OF THE UNITED NATIONS
Statistics
Division
Data for:
Agricultural production;
Forestry;
Fisheries;
Land use;
Fertilizers, pesticides, water, etc;
Emissions – agriculture and Land use;
�
FAOSTAT (http://faostat.fao.org)
FOOD AND AGRICULTURE ORGANIZATION OF THE UNITED NATIONS
Statistics
Division
World’s central repository of national agricultural
statistics data and key in:
• The development of environmental indicators;
• Assessing environmental costs and benefits;
• National accounts: with respect to environmental
expenditures, environmental taxes and subsidies;
• Production and trade in environmental goods and
services and hazardous substances, and resource
productivity.
FAOSTAT

FOOD AND AGRICULTURE ORGANIZATION OF THE UNITED NATIONS
Statistics
Division
• Problems of scale: environmental phenomena are site
specific; statistics at the country level may be not very
significant in some cases (e.g. “big countries” like Russia,
with a variety of landscapes).
• Different data sources: questionnaires, surveys, remote
sensing, modeling, field measurements.
• Different data types: statistical data, geo-referenced
maps, etc.
Characteristics of Agri-Environmental
data
FOOD AND AGRICULTURE ORGANIZATION OF THE UNITED NATIONS
Statistics
Division
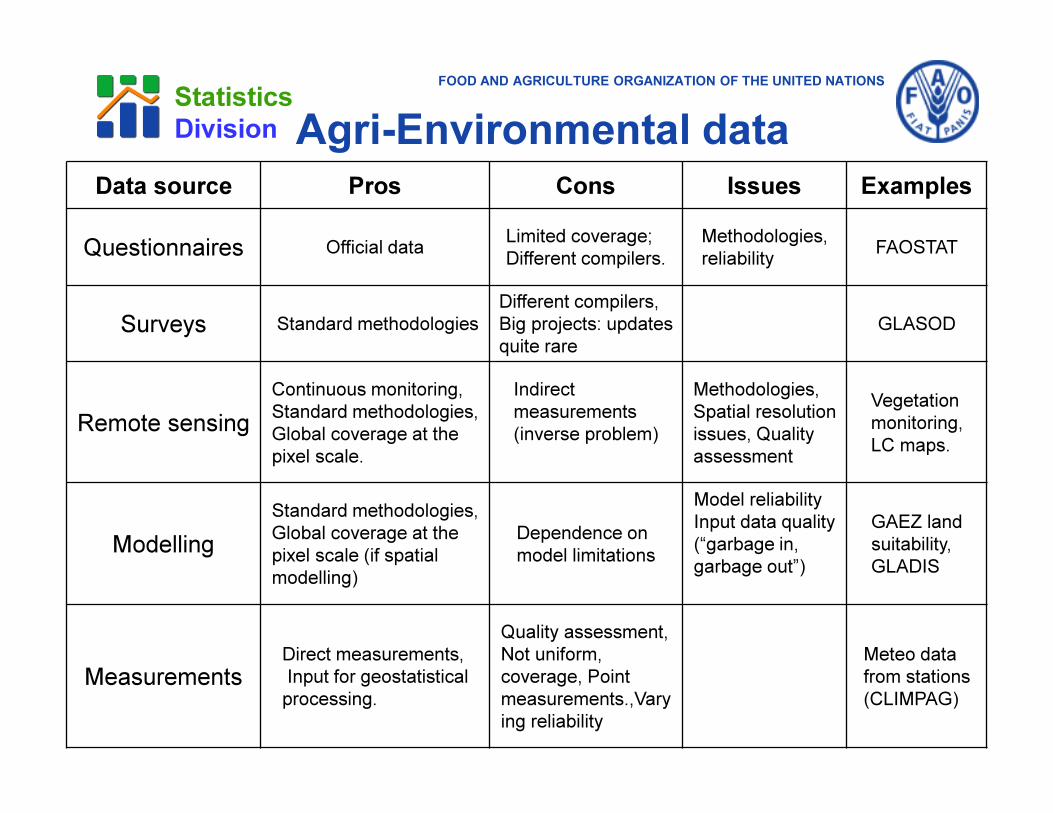
Data source Pros Cons Issues Examples
Questionnaires Official dataLimited coverage;
Different compilers.
Methodologies,
reliabilityFAOSTAT
Surveys Standard methodologies
Different compilers,
Big projects: updates
quite rare
GLASOD
Remote sensing
Continuous monitoring,
Standard methodologies,
Global coverage at the
pixel scale.
Indirect
measurements
(inverse problem)
Methodologies,
Spatial resolution
issues, Quality
assessment
Vegetation
monitoring,
LC maps.
Modelling
Standard methodologies,
Global coverage at the
pixel scale (if spatial
modelling)
Dependence on
model limitations
Model reliability
Input data quality
(“garbage in,
garbage out”)
GAEZ land
suitability,
GLADIS
MeasurementsDirect measurements,
Input for geostatistical
processing.
Quality assessment,
Not uniform,
coverage, Point
measurements.,Vary
ing reliability
Meteo data
from stations
(CLIMPAG)
Agri-Environmental data
FOOD AND AGRICULTURE ORGANIZATION OF THE UNITED NATIONS
Statistics
Division
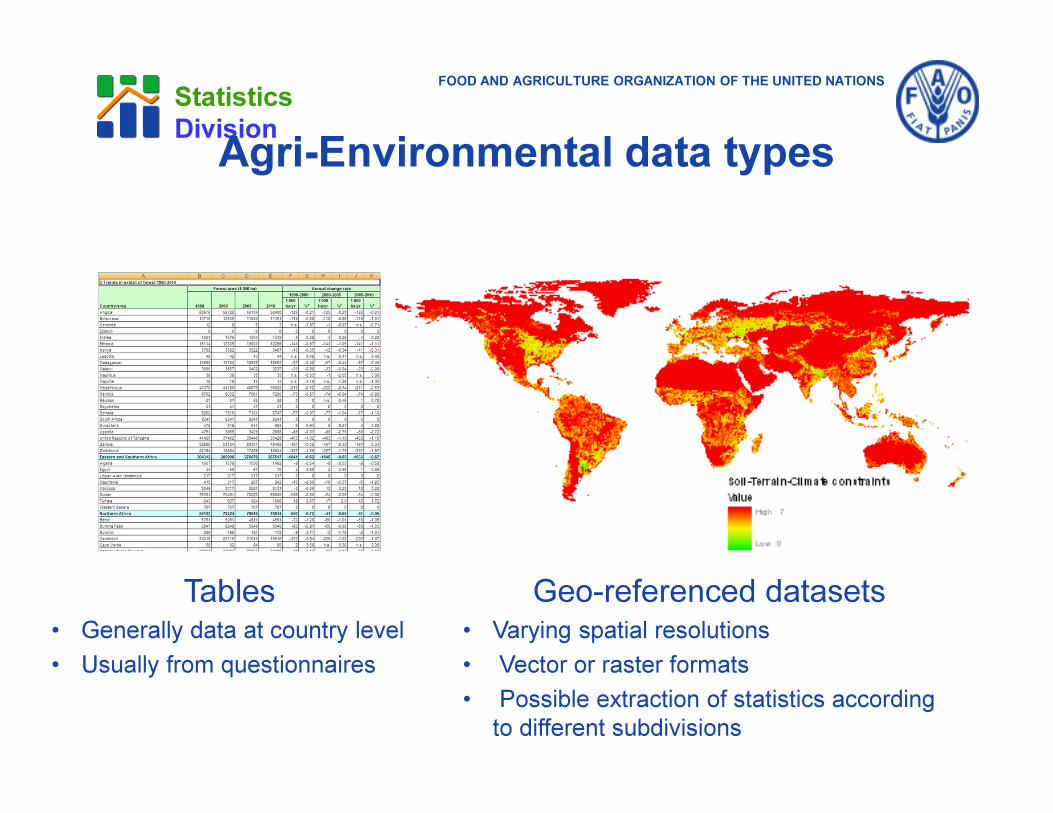
Tables• Generally data at country level
• Usually from questionnaires
Geo-referenced datasets• Varying spatial resolutions
• Vector or raster formats
• Possible extraction of statistics according
to different subdivisions
Agri-Environmental data types

FOOD AND AGRICULTURE ORGANIZATION OF THE UNITED NATIONS
Statistics
Division
Thematic area Database Examples of data
Climate CLIMPAG/ FAOCLIM-NetPrecipitation, ET, Temperature, Vap.Pressure, Wind
speed
Water AQUASTATAverage precip., Tot.Renew.Water Res.,
Agr.withdrawals.
Land &Water Land and Water Digital Media Series
Global map of Irrigated Areas, Soil and Terrain
Database for Southern Africa, Digital Soil Map of
the World and derived soil properites
Agriculture Agro-MAPSProduction, harvested area, Yield for different crops
(1981-2001). Large data gaps.
Environment, land
productivity,
population.
FGGD (Food Insecurity, Poverty and
Environment Global GIS Database)
Length of growing period (LGP) zones of the world,
Coefficient of variation (CV) of length of growing
period (LGP), 1901-1996
Environment,
population.GEONETWORK Catalogue
Global Change In Net Primary Productivity (1981-
2003); Global map of irrigated areas
Livestock GLW (Gridded Livestock of the World) Livestock density, Livestock production systems
Agricultural statistics FAOSTATStatistics on: production, trade, prices, land,
forestry, population, fertilizers, pesticides.
Forests FRA (Forest resource assessment)Forested areas, characteristics, policy, trends,
management.
Thematic area Database Examples of data
Climate CLIMPAG/ FAOCLIM-NetPrecipitation, ET, Temperature, Vap.Pressure, Wind
speed
Water AQUASTATAverage precip., Tot.Renew.Water Res.,
Agr.withdrawals.
Land &Water Land and Water Digital Media Series
Global map of Irrigated Areas, Soil and Terrain
Database for Southern Africa, Digital Soil Map of the
World and derived soil properites
Agriculture Agro-MAPSProduction, harvested area, Yield for different crops
(1981-2001). Large data gaps.
Environment, land
productivity, population.
FGGD (Food Insecurity, Poverty and
Environment Global GIS Database)
Length of growing period (LGP) zones of the world,
Coefficient of variation (CV) of length of growing period
(LGP), 1901-1996
Environment,
population.GEONETWORK Catalogue
Global Change In Net Primary Productivity (1981-
2003); Global map of irrigated areas
Livestock GLW (Gridded Livestock of the World) Livestock density, Livestock production systems
Agricultural statistics FAOSTATStatistics on: production, trade, prices, land, forestry,
population, fertilizers, pesticides.
Forests FRA (Forest resource assessment)Forested areas, characteristics, policy, trends,
management.
Fishery
FI Stat Statistics on : fish production, trade, fleet
FIRMS (Fishery Resources Monitoring
System)
Status and trends of fishery resources, characteristics
of resources and fisheries, management measures
Agri-Environmental databases at FAO
FOOD AND AGRICULTURE ORGANIZATION OF THE UNITED NATIONS
Statistics
Division
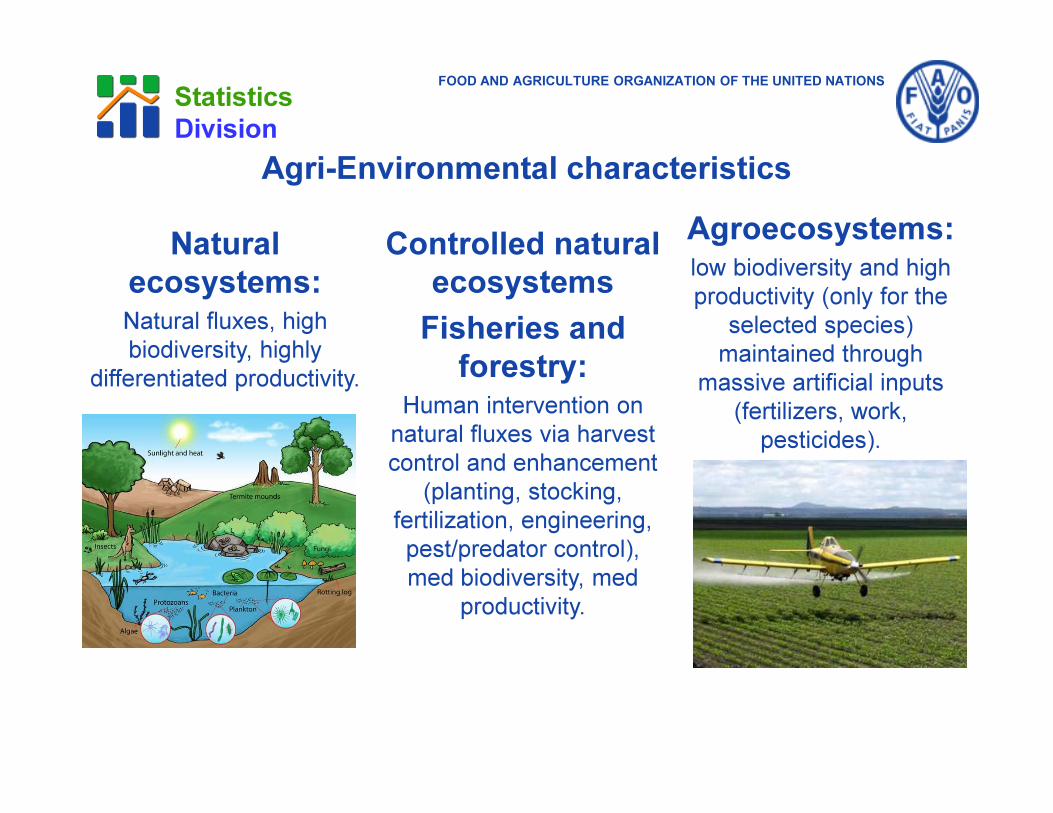
Natural
ecosystems:Natural fluxes, high
biodiversity, highly
differentiated productivity.
Agroecosystems:low biodiversity and high
productivity (only for the
selected species)
maintained through
massive artificial inputs
(fertilizers, work,
pesticides).
Controlled natural
ecosystems
Fisheries and
forestry:Human intervention on
natural fluxes via harvest
control and enhancement
(planting, stocking,
fertilization, engineering,
pest/predator control),
med biodiversity, med
productivity.
Agri-Environmental characteristics

FOOD AND AGRICULTURE ORGANIZATION OF THE UNITED NATIONS
Statistics
Division
Market ResponsesPrices-inputs,crops-
Organizational set-up
Environmental OutcomesDegradation of ecosystem
functions - productivity,
diversity, Natural resource
status
External FactorsFood demand
Preference, Trade,
Technology
AGRICULTURAL POLICY
Land Use and Management1.Land use choices
2. Crop Choice
3. Management practices (fertilizers,
pesticides, rotations)
Linking Policy and Environment
Natural Factors
Climate change,
Productivities,
Natural hazards, Bio-
security
Urbanization
Pollution, Wastages,
Degradation of
natural ecosystems
Fish & Forest Management
1. Harvest control
2. Enhancement (stocking,
plantation, pest control,
engineering)
ECONOMIC
POLICY

FOOD AND AGRICULTURE ORGANIZATION OF THE UNITED NATIONS
Statistics
Division
An agri-environmental indicator is a summary
measure, combining raw data, used to describe the
state of the environment, a risk to the environment, a
change in the environment, or a driving force behind
such a change, that can be attributed wholly or in part
to an agricultural activity or activities.
from OECD 2000
Agri-environmental Indicators
FOOD AND AGRICULTURE ORGANIZATION OF THE UNITED NATIONS
Statistics
Division
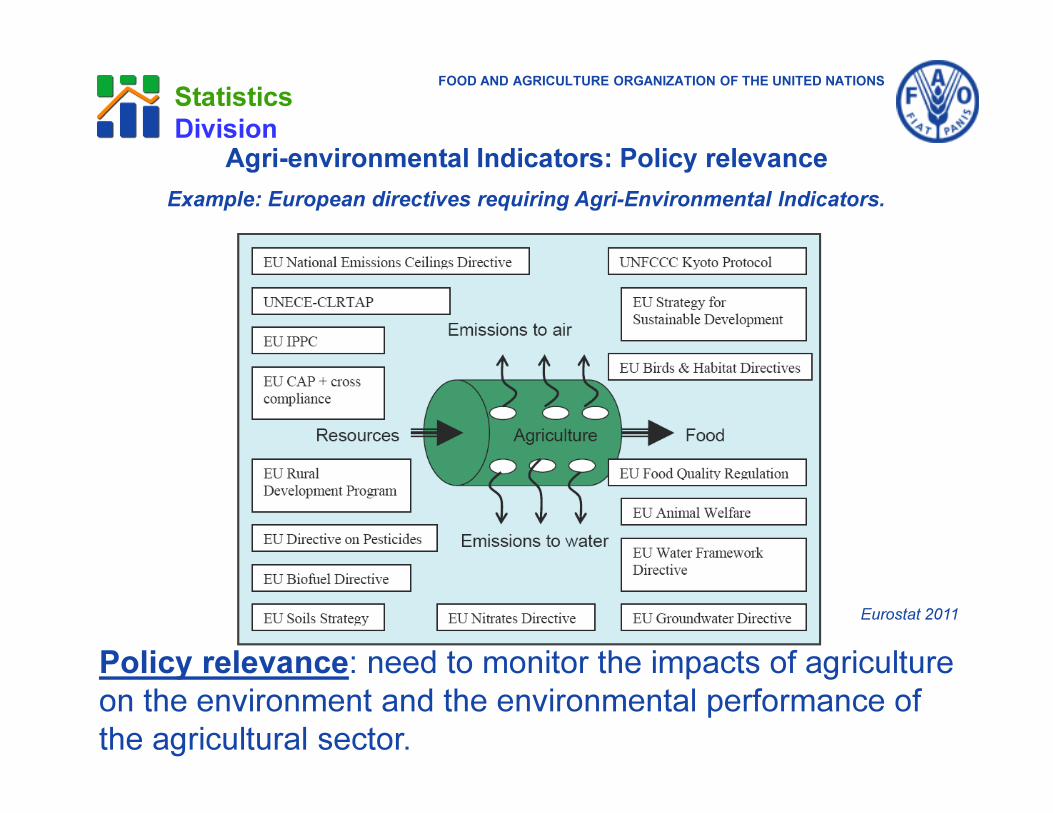
Policy relevance: need to monitor the impacts of agriculture
on the environment and the environmental performance of
the agricultural sector.
Eurostat 2011
Example: European directives requiring Agri-Environmental Indicators.
Agri-environmental Indicators: Policy relevance

FOOD AND AGRICULTURE ORGANIZATION OF THE UNITED NATIONS
Statistics
Division
International activities on Agri-environmental indicators
in the last 15 years
Institution AreaN. of indicators
ReferencesFirst set Latest set
OECDOECD
countries37 18
Environmental
performance of
Agric. At a glance
Eurostat/EE
A/JRCEU-27 40 28
EEA. 1999.
Environmental
indicators:
typology and
overview.
European
Commission.
2006.
Communication
from the
Commission.
Agri-environmental Indicators

FOOD AND AGRICULTURE ORGANIZATION OF THE UNITED NATIONS
Statistics
Division
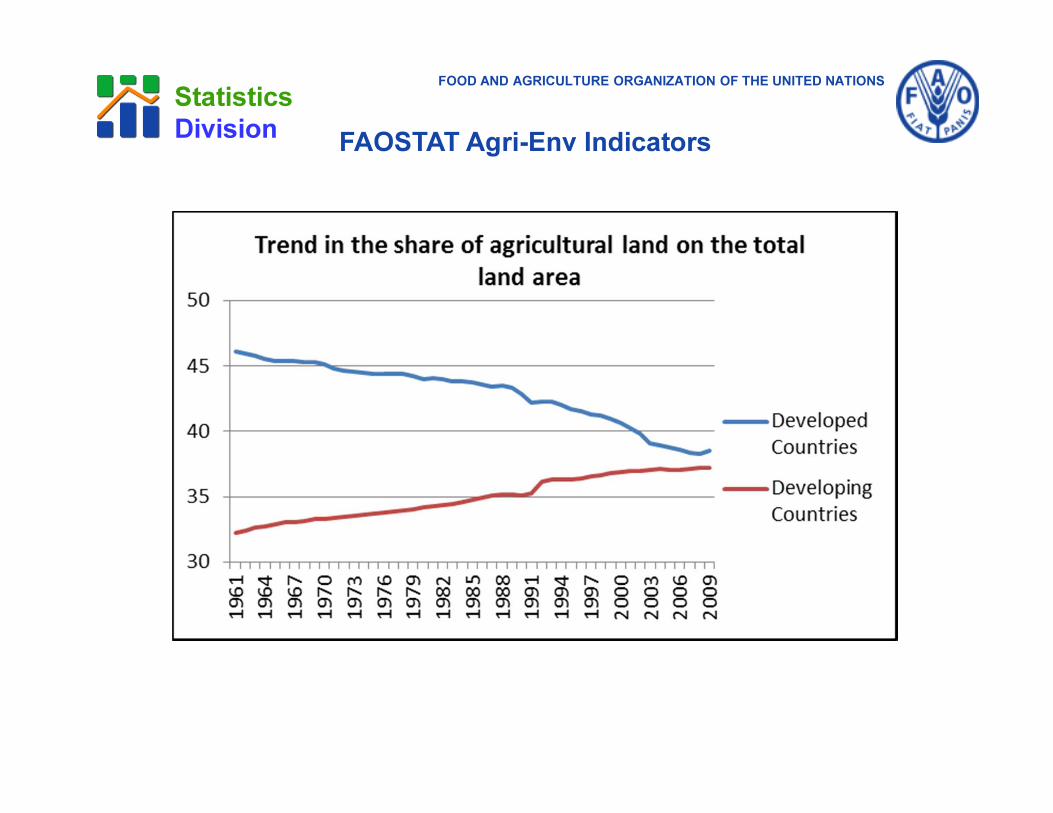
– Dataset developed following as much as possible the
EUROSTAT and OECD frameworks.
– At the moment 25 indicators are available, plus a complete
new domain on Greenhouse Gases (GHG) Emissions.
– Data are from FAO databases and from external sources
(e.g. IEA, IFOAM).
FAOSTAT Agri-Env Indicators

FOOD AND AGRICULTURE ORGANIZATION OF THE UNITED NATIONS
Statistics
Division
• UN/UNECE, World Bank, OECD, EUROSTAT and
other agencies in carrying on this work;
• Framework of the Development of Environment
Statistics(FDES);
• System of National Accounts (SNA);
• The Central Framework for System of
Environmental-Economic Accounting (SEEA).
FAO collaboration and international
methodology

FOOD AND AGRICULTURE ORGANIZATION OF THE UNITED NATIONS
Statistics
Division
Environmental Commitments Protected area as % on total area
Organic Agriculture Organic Agriculture (% of total agricultural land)
N Fertilizers consumption/Arable land&Permanent Crops
P Fertilizers consumption/Arable land&Permanent Crops
N+P (total nutrients) consumption/Arable land&Permanent Crops
Pesticide Consumption Pesticide use by Ha Arable land&Permanent Crops
Area equipped for irrigation Area equipped for irrigation/Arable Land and Permanent Crops
Energy Energy use Share of agricultural energy consumption on the total energy consumption
Agricultural land use change Agricultural land use change compared to the previous year
Share agricultural land Agricultural Area/Land Area
Share Perm.Crops on AgrLand
Share Perm.Pasture on AgrLand
Share arable land on AgrLand
Conservation agriculture Conservation agriculture area as % of cultivated area
Cattle, Pigs, Sheep, Poultry total density
Pigs share on total livestock
Cattle share on total livestock
Poultry share on total livestock
Sheep share on total livestock
Air & Climate Change Ammonia emissions Share of agricultural ammonia emissions on total ammonia emissions
Water Water use in Agriculture Agricultural water withdrawal as % of total water withdrawal
Average Soil Erosion
Average Soil Degradation
Energy Bioenergy Share of bioenergy on total renewable energy production
State Soil Soil Quality Average carbon content in the Topsoil
Pressures
Land
Fertilizers
Driving Forces
Pesticides
Land
Livestock
Soil
Livestock patterns
Cropping patterns
Soil Erosion
Mineral Fertilizers Consumption
Domain Subdomain Indicator title Indicator definition
Responses
FAOSTAT Agri-Env Indicators

FOOD AND AGRICULTURE ORGANIZATION OF THE UNITED NATIONS
Statistics
Division FAOSTAT Agri-Env Indicators

FOOD AND AGRICULTURE ORGANIZATION OF THE UNITED NATIONS
Statistics
DivisionFAOSTAT Agri-Env Indicators
FOOD AND AGRICULTURE ORGANIZATION OF THE UNITED NATIONS
Statistics
DivisionFAOSTAT Agri-Env Indicators

FOOD AND AGRICULTURE ORGANIZATION OF THE UNITED NATIONS
Statistics
Division FAOSTAT GHG emissions database
FOOD AND AGRICULTURE ORGANIZATION OF THE UNITED NATIONS
Statistics
Division
Some Domains within FAOSTAT
FOOD AND AGRICULTURE ORGANIZATION OF THE UNITED NATIONS
Statistics
Division
• Run off the land due to heavy
rainfall/erosion;
• Leaching into groundwater;
• Escape in the form of gas into
atmosphere.
Fertilizers use issues

FOOD AND AGRICULTURE ORGANIZATION OF THE UNITED NATIONS
Statistics
Division
FOOD AND AGRICULTURE ORGANIZATION OF THE UNITED NATIONS
Statistics
Division

FOOD AND AGRICULTURE ORGANIZATION OF THE UNITED NATIONS
Statistics
Division
Fertilizers consumption: patterns per region
FERTILIZER CONSUMPTION TO ARABLE LAND RATIO
0
50
100
150
200
250
300
Worl
d
De
velo
pe
d
Eco
no
mie
s in
tra
nsiti
on
Develo
pin
g
La
tin A
m &
the
Ca
rib
b.
Ne
ar
Ea
st &
Nort
h A
fric
a
Su
b-S
ah
ara
n A
fric
a
E. A
sia
, S
outh
E. A
sia
& C
hin
a
So
uth
Asia
Afr
ica
La
tin A
me
rica
Ca
rib
be
an
Asia
Oce
an
ia
Austr
alia
and
Ne
w Z
ea
l.
kh/ha
1980/81 1990/91 2002 2005

FOOD AND AGRICULTURE ORGANIZATION OF THE UNITED NATIONS
Statistics
Division FAOSTAT: Pesticides page

FOOD AND AGRICULTURE ORGANIZATION OF THE UNITED NATIONS
Statistics
Division
Pesticides use issues
• Overuse and abuse of pesticides at many places E.g.: cotton, vegetables, rice;
• Highly toxic products: Some countries are lagging behind in phasing out high incidence of accidental and self poisoning;
• Food safety and other public health risks (residues);
• Environmental risks ;
• Market access Pesticide residue requirements are increasingly important in trade;
• Pesticide quality (Illegal trade in pesticides; counterfeit products; some countries lack sufficient quality control);
• Obligations under international instruments.

FOOD AND AGRICULTURE ORGANIZATION OF THE UNITED NATIONS
Statistics
Division
Pesticides consumption (hundreds of tonnes, 2008)

FOOD AND AGRICULTURE ORGANIZATION OF THE UNITED NATIONS
Statistics
Division
Indicator: Pesticides average usage (tonnes /Ha agricultural area, 2008 )
As seen in the previous
slide, China is the biggest
consumer of pesticides.
However, to evaluate the
environmental impact it is
important to consider the
actual average usage (an
AgriEnv Indicator).
FOOD AND AGRICULTURE ORGANIZATION OF THE UNITED NATIONS
Statistics
Division
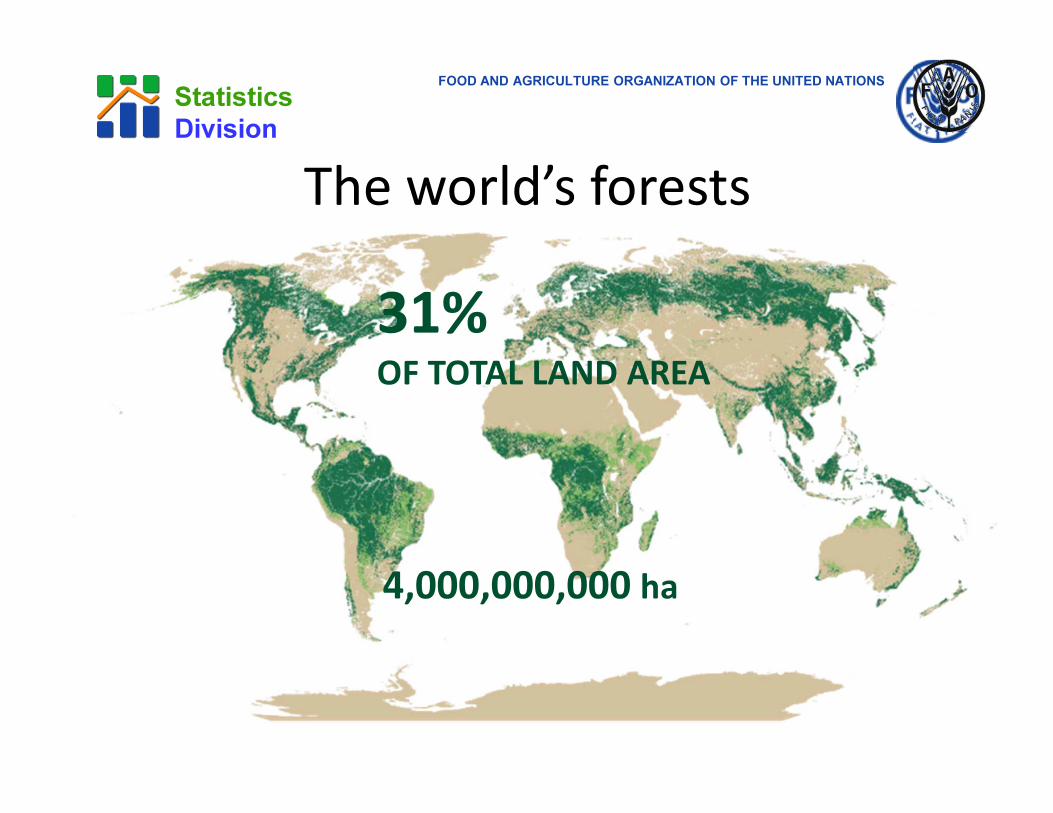
4,000,000,000 ha
31%OF TOTAL LAND AREA
The world’s forests

FOOD AND AGRICULTURE ORGANIZATION OF THE UNITED NATIONS
Statistics
Division

FOOD AND AGRICULTURE ORGANIZATION OF THE UNITED NATIONS
Statistics
Division
1990-2000: -8.3 million ha/year
2000-2010: -5.2 million ha/year
Net change = Σ(gain) - Σ(loss)

FOOD AND AGRICULTURE ORGANIZATION OF THE UNITED NATIONS
Statistics
Division
FOOD AND AGRICULTURE ORGANIZATION OF THE UNITED NATIONS
Statistics
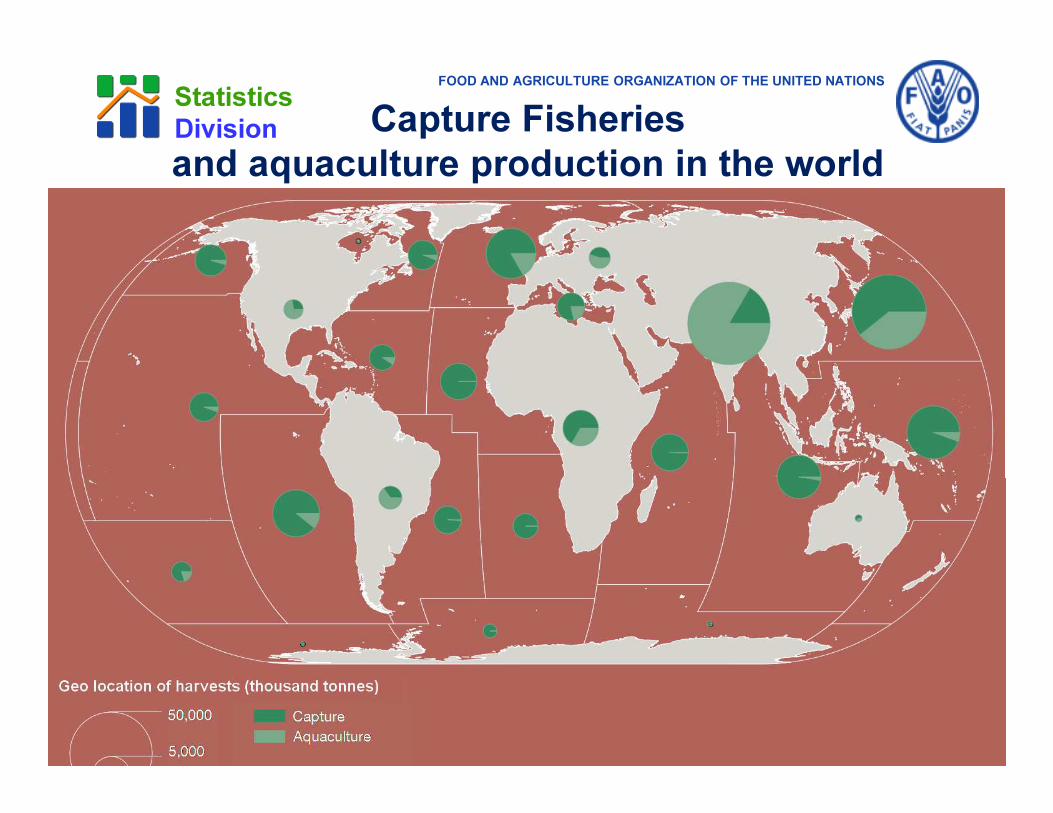
Division Capture Fisheries
and aquaculture production in the world

FOOD AND AGRICULTURE ORGANIZATION OF THE UNITED NATIONS
Statistics
Division
Status of world marine stocks
0
10
20
30
40
50
60
70
80
1974 1979 1984 1989 1994 1999 2004 2009
%
Non-fully exploited
Fully exploited
Overexploited
FOOD AND AGRICULTURE ORGANIZATION OF THE UNITED NATIONS
Statistics
Division
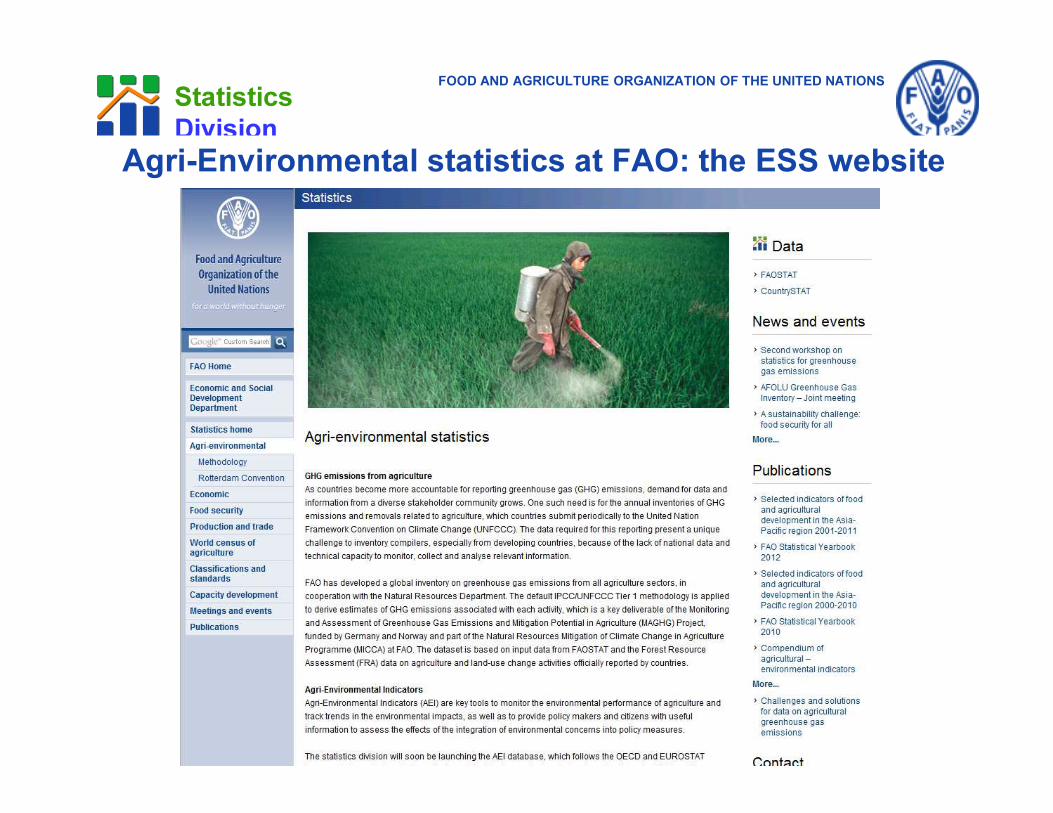
Agri-Environmental statistics at FAO: the ESS website

FOOD AND AGRICULTURE ORGANIZATION OF THE UNITED NATIONS
Statistics
Division
Further information and acknowledgements
Further information available at:
FAO Statistics Division: http://www.fao.org/economic/ess/ess-agri/ess-resource-meth/en/
FAOSTAT : Land, Fertilizers and Pesticides: http://faostat.fao.org/site/575/default.aspx#ancor
FAOSTAT : Emissions - Agriculture: http://faostat3.fao.org/home/index.html#DOWNLOAD
Acknowledgements:
The input of Dominic Ballayan, Giorgia De Santis and Simona
Mosco is very much appreciated in preparing this presentation.