fao investment centre - food and agriculture · pdf fileinvestment centre division food and...
TRANSCRIPT

Please address questions and comments to:Investment Centre DivisionFood and Agriculture Organization of the United Nations (FAO)Viale delle Terme di Caracalla – 00153 Rome, Italy [email protected]://www.fao.org/investment/en
Russian Federation: Meat sector reviewReport No. 15 - July 2014 I3
533E
/1/1
1.13
FAO Investment CentreCOUNTRy HIGHLIGHTS
Russian FederationMeat sector review
Ru
ssian Fed
eration
– Meat secto
r reviewR
epo
rt No
. 15

FAO Investment Centre

Rome, 2014
Russian Federation
Meat sector review
Dmitry PrikhodkoEconomist, Investment Centre Division, FAO
Albert DavleyevNational Meat Consultant, Investment Centre Division, FAO
country highlightsprepared under the FAO/EBRD Cooperation

The designations employed and the presentation of material in this information product do not imply the expression of any opinion whatsoever on the part of the Food and Agriculture Organization of the United Nations (FAO) or the European Bank for Reconstruction and Development (EBRD) concerning the legal or development status of any country, territory, city or area or of its authorities, or concerning the delimitation of its frontiers or boundaries. The mention of specific companies or products of manufacturers, whether or not these have been patented, does not imply that these have been endorsed or recommended by FAO or EBRD in preference to others of a similar nature that are not mentioned.
The views expressed in this information product are those of the author(s) anddo not necessarily reflect the views or policies of FAO or EBRD.
© FAO 2014
FAO encourages the use, reproduction and dissemination of material in this information product. Except where otherwise indicated, material may be copied, downloaded and printed for private study, research and teaching purposes, or for use in non-commercial products or services, provided that appropriate acknowledgement of FAO as the source and copyright holder is given and that FAO’s endorsement of users’ views, products or services is not implied in any way.
All requests for translation and adaptation rights, and for resale and other commercial use rights should be made via www.fao.org/contact-us/licencerequest or addressed to [email protected].
FAO information products are available on the FAO website (www.fao.org/ publications) and can be purchased through [email protected].
For further information on this publication, please contact:DirectorInvestment Centre DivisionFood and Agriculture Organization of the United Nations (FAO)Viale delle Terme di Caracalla, 00153 Rome, Italy
Cover photo: ©Dreamstime

iii
TABLE OF CONTENTS
Foreword v
Acknowledgements vi
Acronyms and abbreviations viii
Executive summary xi
1 Global medium-term meat market outlook with focus on the Russian Federation 1
2 The Russian Federation meat sector in brief 11
3 Detailed review of the meat sector 25
4 Meat processing 60
5 Meat market concentration 68
6 Meat trade 87
7 Meat prices 96
8 Policy 99
Annex 1 Distribution of poultry, swine and cattle inventories by region and type of farm in 2010 120
Annex 2 Main breeds and crosses 133
Annex 3 Meat production technologies 140
Annex 4 Applicable state standards in the Russian Federation 149
Annex 5 Profitability of poultry, pork, and beef production in various administrative subjects of the Russian Federation 153
Annex 6 Leading meat brands 156
Annex 7 Major agroholdings and meat producers in the Russian Federation 158
Annex 8 Recent investments in the poultry sector 168

iv
Annex 9 Broiler meat production (Far East Russian Federation): investment model assumptions, results and sensitivity 171
Annex 10 Recent investments in the pork sector 174
Annex 11 Recent investments in the beef sector 178
Annex 12 Foreign meat trade 180

v
FOrEwOrd
In recent years, the rise of agroholding farms, combined with strong consumer demand, higher incomes and substantial state support, have prompted an increase of meat production in the Russian Federation. Despite its improved self-sufficiency in the sector, the country will remain one of the principle global meat importers in the foreseeable future. The reduced import tariffs following Russia’s accession to the World Trade Organization (WTO) will put pressure on local meat producers to become more competitive. To do so, they will need to invest in the efficiency of primary production and higher food quality and safety standards.
This review of the Russian meat sector, conducted by the Food and Agriculture Organization of the United Nations (FAO) and the European Bank for Reconstruction and Development (EBRD), aims to inform policy makers and investors and promote a more efficient and inclusive meat sector. It provides information on the role of the Russian Federation in global meat markets, on production and consumption of meat in the country, as well as relevant trade and policy measures. The review presents international comparisons on meat production efficiency, sector concentration and support measures. It also provides information on major players in the Russian meat market and identifies key sector constraints and opportunities.
Readers interested in learning about mid-term prospects in the meat market are encouraged to read the latest version of the Agricultural Outlook jointly produced by the Organization for Economic Co-operation and Development (OECD) and FAO1.
1 http://www.oecd.org/site/oecd-faoagriculturaloutlook/.
vi
ACkNOwLEdgEmENTS
This sector review was prepared by the Investment Centre Division of FAO in the context of the cooperation between FAO and the EBRD. It was financed by FAO and EBRD’s Special Shareholder Fund.
Dimitry Prikhodko, Economist, Investment Centre Division, FAO, and Albert Davleyev, President, Agrifood Strategies, a Moscow-based agribusiness consultancy company, are the main authors of this report. Mr Prikhodko also led the team of other co-authors that contributed to the study. Inna Punda, Agribusiness Officer, Investment Centre Division, FAO, reviewed the initial version of the report and carried out desk research on Russia’s meat trade with Ukraine and within the Customs Union of Belarus, Kazakhstan and the Russian Federation. Vasyl Hovhera, Economist, Investment Centre Division, FAO, provided inputs on meat consumption and on the profitability of broiler meat production. Arianna Carità, Economist, Investment Centre Division, FAO, assisted in reviewing the study and prepared the executive summary. On the EBRD side, Marta Bruska, Operational Leader for this project, provided leadership and coordination.
The FAO/EBRD team would like to express its sincere gratitude to Natalya Zhukova, Senior Banker, Agribusiness, EBRD, Moscow, and Oona Schreiner, Banker, Agribusiness, EBRD, for their constructive comments on current issues and trends in the Russian meat sector. The authors would also like to thank Eugenia Serova, Director, Rural Infrastructure and Agro-industries Division, FAO, for her guidance and inputs at the initial stages of the review.
The report benefited from useful comments by Pedro Marcelo Arias, Economist, Trade and Markets Division, FAO. Specials thanks are extended to Hsin Huang, Secretary General of the International Meat Secretariat (IMS), for his careful review and valuable suggestions.
The authors would also like to thank Emmanuel Hidier, Senior Economist, Investment Centre Division, FAO, and Claudio Gregorio, Chief, Europe, Central Asia, Near East, North Africa, Latin American and Caribbean Service, FAO, for their support and guidance, and Genevieve Joy, Sarah Mercadante and Maria Ricci,

vii
Communications support, Investment Centre Division, FAO, for assisting with the finalization and publication of the report. Maaike Loogman, Joana Maison Aidoo, Eleonora De Feo and Monica Romanelli, Investment Centre Division, FAO, provided excellent administrative support throughout the course of this project.

viii
ACrONymS ANd ABBrEviATiONS
AI avian influenzaAMS aggregate measurement of supportASF African swine fever
EBITDA earnings before interest, taxes depreciation and amortization
EBRD European Bank for Reconstruction and Development
EU European Union
FAO Food and Agriculture Organization of the United Nations
FAPRI Food and Agricultural Policy Research Institute
FIRA First Independent Rating Agency
FMD foot-and-mouth disease
FOB free on board
FSSS Federal Service of State Statistics
GDP gross domestic product
GK group of companies
GNI gross national income
GOR Government of Russian Federation
HACCP hazard analysis and critical control points
HORECA retail, hotel, restaurant and catering services
HS harmonized system
IMS International Meat Secretariat
IRR internal rate of return
KMPP Kornshtadt meat processing plant
LSE London Stock Exchange
MPS market price support
NPC nominal protection coefficient
NPV net present value
OECD Organisation for Economic Co-operation and Development
OIE World Organisation for Animal Health
OJSC open joint-stock company

ix
OKVED Russian Classification of Economic Activities
PPP purchasing price parity
PSE producer support estimate
PSF private subsidiary farming
RAAS Russian Academy of Agricultural Sciences
RUR Russian rouble
SANPIN sanitary norms and rules
SCT single commodity transfers
SPS sanitary and phytosanitary (measures)
TCI Investment Centre Division of the Food and Agricultural Organization
TRQ tariff-rate quota
USDA United States Department of Agriculture
VAT value added tax
VNIIMP All-Russia Scientific Research Institute of Meat Processing Industry
VNIIMS All-Russia Scientific Research Institute Of Meat Cattle Breeding
VNIIZZH All-Russia Scientific Research Institute of Animal Protection
VPSS Veterinary and Phytosanitary Surveillance Service
WB World Bank
WTO World Trade Organization

Russian Federation - Meat sector review
xi
ExECuTivE SummAry
Market development and business considerations
The Russian Federation in the global meat market
World food demand has seen massive changes, including a shift from staple foods to animal proteins and vegetable oils. In the short to medium term, this trend in global food demand will continue. There will be an increased demand for vegetable oils, meat, sugar, dairy products and livestock feed made from coarse grains and oilseed meals.
There are numerous mid-term forecasts for the Russian Federation’s meat sector. Most of them agree on the following trends: (i) the consumption of poultry and pork meat will increase; (ii) the consumption of beef will decrease or stabilize; and (iii) the Russian Federation will remain a net importer of meat on the world market.
According to OECD and FAO projections, meat imports from the Russian Federation will decrease from 3 to 1.3 million tonnes, owing to an anticipated growth in domestic chicken meat and pork production. The country’s share in global meat imports is anticipated to decrease from 12 percent in 2006–2010, to 4 percent in 2021. While the Russian Federation will continue to play an important role in the international meat market, it will fall from its position as the largest meat importing country in 2006–2010 to the fourth largest global meat importer by 2021, behind Japan, sub-Saharan African countries, and Saudi Arabia.
A growing and evolving domestic market
Between 2005 and 2010, the value of the Russian meat market increased by 75 percent, reaching about RUR 930 billion in current prices (equivalent to USD 31 billion) due to growing meat consumption. As a result of higher consumers income, meat consumption in the Russian Federation has been on the rise since the late 1990s. From 2005–2010, the per capita consumption of all meats and meat products increased by 22 percent to reach 64 kg per person per year. Poultry meat consumption increased by 31 percent between 2005 and 2010 to reach 25 kg per person, while pork consumption increased by 38 percent to reach 21 kg per capita. On the other hand, the per capita consumption of beef

xii
and veal decreased by 0.5 percent, down to only 17 kg, during the same period.
Despite a significant anticipated growth by 2021, the per capita consumption of meat in the Russian Federation will most likely remain below that in the United States of America (USA), Brazil, Argentina, Australia and the European Union EU-27, but will exceed the consumption of meat in Ukraine, Mexico, South Korea and China. In recent years, the Russian meat market has experienced some notable transformations, in particular (i) a shift from beef to poultry meat consumption; (ii) the progressive exit of household farms from the market and the expansion of larger commercial farms involved in meat production; and (iii) an increased supply of fresh, chilled meat at the expense of frozen products. The emergence of a large newly affluent urban population in Russian cities has also boosted the development of the retail sector in the country, which has influenced the way meat is sold and consumed. Chicken meat, especially in the form of chicken meat cuts, has replaced beef in everyday diets. However, pork consumption is likely to grow even faster, as it is consumed in many processed ways: sausages, smoked meat, meat delicacies and other value-added products.
From 2005 to 2010, total meat production increased from 7.7 million tonnes to 10.6 million tonnes, with chicken meat production growing from 1.4 million tonnes to 2.8 million tonnes and pork production increasing from 1.6 million tonnes to 2.3 million tonnes, according to official statistics. On the other hand, beef production decreased by 5 percent from 1.8 to 1.7 million tonnes during the same period, reflecting ongoing adjustments in the closely related dairy sector.
The production, processing and supply structure of the meat sector has shown a clear trend towards vertical integration, with inefficient producers going bankrupt and an increased share of commercial farms at the expense of smallholder producers. The share of larger commercial farms in poultry meat production increased from 79 percent in 2005 to 88 percent in 2010 and from 33 to 53 percent in the pork sector, with the remainder being produced by smallholder farms. As beef production is not generally considered profitable by commercial farms, their share in cattle meat production decreased from 36 percent in 2005 to 32 percent in 2010, while the remaining share of smallholders and individual farms increased.
Russian Federation - Meat sector review
xiii
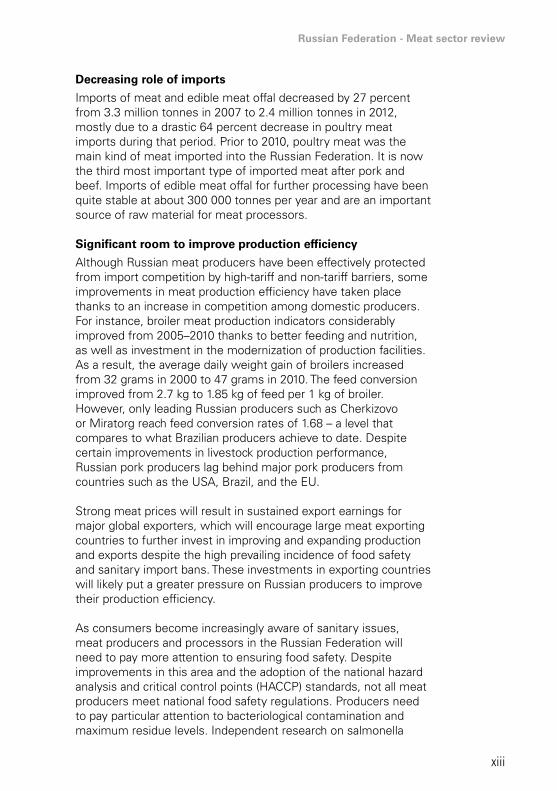
Decreasing role of imports
Imports of meat and edible meat offal decreased by 27 percent from 3.3 million tonnes in 2007 to 2.4 million tonnes in 2012, mostly due to a drastic 64 percent decrease in poultry meat imports during that period. Prior to 2010, poultry meat was the main kind of meat imported into the Russian Federation. It is now the third most important type of imported meat after pork and beef. Imports of edible meat offal for further processing have been quite stable at about 300 000 tonnes per year and are an important source of raw material for meat processors.
Significant room to improve production efficiency
Although Russian meat producers have been effectively protected from import competition by high-tariff and non-tariff barriers, some improvements in meat production efficiency have taken place thanks to an increase in competition among domestic producers. For instance, broiler meat production indicators considerably improved from 2005–2010 thanks to better feeding and nutrition, as well as investment in the modernization of production facilities. As a result, the average daily weight gain of broilers increased from 32 grams in 2000 to 47 grams in 2010. The feed conversion improved from 2.7 kg to 1.85 kg of feed per 1 kg of broiler. However, only leading Russian producers such as Cherkizovo or Miratorg reach feed conversion rates of 1.68 – a level that compares to what Brazilian producers achieve to date. Despite certain improvements in livestock production performance, Russian pork producers lag behind major pork producers from countries such as the USA, Brazil, and the EU.
Strong meat prices will result in sustained export earnings for major global exporters, which will encourage large meat exporting countries to further invest in improving and expanding production and exports despite the high prevailing incidence of food safety and sanitary import bans. These investments in exporting countries will likely put a greater pressure on Russian producers to improve their production efficiency.
As consumers become increasingly aware of sanitary issues, meat producers and processors in the Russian Federation will need to pay more attention to ensuring food safety. Despite improvements in this area and the adoption of the national hazard analysis and critical control points (HACCP) standards, not all meat producers meet national food safety regulations. Producers need to pay particular attention to bacteriological contamination and maximum residue levels. Independent research on salmonella

xiv
prevalence revealed that salmonella was present for 32 percent of whole chickens sold in the Russian Federation, compared to 4 to 16 percent in the USA and the EU. Continuous improvements and investment in food safety will be a key factor for local producers to gain market shares.
Recent investments, risks and profitability
The Russian meat sector has recently experienced an investment boom due to high profits and growing demand sustained by market protection and state support programmes. According to available information on ongoing and planned investments for 2009–2014, the Russian meat sector has attracted a total of USD 7.2 billion in investment. Poultry production on its own has attracted about 44 percent of all meat sector investments, while pork and beef production have attracted 33 percent and 15 percent respectively. An additional USD 540 million in investment was also observed in the meat processing sector. It should be noted, however, that the recent global economic recession has forced some Russian companies to review their ambitious business expansion plans and put some meat production projects on hold.
Similar to those in other countries, Russian meat producers face a number risks: (i) adverse production conditions and poor infrastructure (low production efficiency, poor feed quality, exposure to volatile feed grain prices, difficult access to transportation infrastructure, power outages, etc.); (ii)) animal and poultry disease outbreaks and food safety hazards (avian influenza, African swine fever, foot-and-mouth disease, etc.); (iii)) investment and financial risks (increase in interest rates, etc.); and (iv) policy-related risks (changing government priorities, high level of market protection, etc.). These are described in Chapter 2 of this report.
The analysis conducted in this review shows that, while investments in new broiler meat production can still be profitable in the Russian Federation under standard market assumptions on local input/output prices and the cost of capital, such investments have a rather long average payback period of nine years and are highly sensitive to feed price increases. An increase in feed costs of only 10 percent would make these investments unprofitable. At the same time, a reasonable improvement in feed conversion would increase the investments internal rate of return (IRR) from 15 to 18 percent and decrease the payback period to eight years.

Russian Federation - Meat sector review
xv
Foreseen meat processing consolidation
Russian meat processing, unlike poultry meat production, is characterized by rather low consolidation owing to the country’s vast national territory, consumers’ preferences for local regional producers and trademarks, and a general lack of the processors’ capacity to market brands at the national level. It is very likely that sector consolidation will occur in the near future. In order to meet its potential, the private sector needs to modernize and improve its basic production efficiency. These improvements would require substantial private investment in areas such food safety and biosecurity, environmental sustainability through the introduction of better livestock management practices, and improved breeding stock.
Policy considerations
The fast growth experienced by the meat sector in the Russian Federation in recent years has been supported by policy measures, including import tariffs and domestic support. Although competitiveness features as one of Russia’s main agricultural policy goals, the country’s agricultural support system has been driven by a progressive policy orientation towards import substitution and higher self-sufficiency in meat and other food products. While livestock production may play an important role in economic growth and the need for adequate investment in that sector is clear, Russia’s food self-sufficiency approach may be questioned from an economic point of view.
Meat market protection and support come at a high price
Russia’s agricultural policy objectives have been pursued at a relatively high cost to Russian taxpayers and consumers. Most support is provided through market price support, supply of inputs and fixed capital (investment subsidies and interest rates), all of which are among the most market distorting policy measures.
According to OECD’s monitoring of annual monetary transfers from consumers and taxpayers to farmers, measured as the Producer Support Estimate (PSE), Russian producers of grains and oilseeds – the main sources of feed protein in the country – appear to be “taxed”. At the same time, annual transfers to domestic producers of poultry and livestock averaged RUR 227 billion (USD 6,3 billion) throughout 2008–2010. More specifically, 20 percent of gross income received by beef and veal farmers, 45 percent of incomes from pork and 34 percent of incomes from poultry meat came from consumers and taxpayers. Russia’s main interventions in the sector consist of market-price support. Due to tariff and non-tariff

xvi
measures, domestic prices for beef, pork and poultry end up being much higher that international reference prices.
Improving competitiveness
Russian meat producers have a favourable access to feed grains and meals as the country is a net exporter of wheat, barley, corn and sunflower meals and other compound feed ingredients. Therefore, improving the competitiveness of Russian meat producers primarily means bridging the gap between the domestic and import parity prices. The gap between domestic and international prices increased considerably from USD 470–900 per tonne of various kinds of meat in 2001 to USD 900–1 200 in 2010. Domestic pork prices were often twice as high as international pork prices at import parity levels. Domestic beef appeared to be more competitive with imports than poultry and pork.
Protectionist policies will not help the domestic meat industry to become competitive in the long-term. While the level of domestic market protection and state support remain very high in the Russian Federation, other major meat producers, like the USA and Brazil, have limited price-distorting support measures or, as it is the case for the EU, tend to reduce their support measures to meat producers.
WTO accession
The Russian Government managed to defend a substantial domestic market protection level at World Trade Organization (WTO) accession, including Tariff-Rate Quotas (TRQs) for poultry meat and beef with high out-of-quota rates. For pork, the Russian Federation has agreed to a TRQ of 400 000 tonnes for fresh, chilled and frozen pork with a zero in-quota tariff. As of 1 January 2020, the Russian Federation will adopt a tariff-only regime for pork with a bound duty of 25 percent. Therefore, the domestic pork market will be more open to import competition.
State support programmes
State support programmes focus on extending long-term credit at low interest rates to livestock breeding and other regional programmes. They have attracted many entrepreneurs. For example, interest rate subsidies for livestock production from the federal budget – aimed at supporting the construction, reconstruction and modernization of livestock and poultry facilities – totaled RUR 2.36 billion (USD 66 million) and attracted RUR 155 billion (USD 4,3 billion) worth of credit to 492 projects

Russian Federation - Meat sector review
xvii
in 2010 alone. In 2011, overall state subsidies to the livestock and poultry industries, disbursed under various support programmes, amounted to RUR 22.8 billion (USD 636 million). As domestic meat markets appear to be highly distorted, the extent to which investment decisions have been driven by rational business considerations is unclear. Many companies also complain about the excessive documentation requirements and the lack of transparency in decision making by officials responsible for the distribution of state support.
To ensure the long-term competitiveness of Russia’s meat sector, it would be highly desirable to refocus domestic budget support to food safety improvements, feed quality monitoring, research, education, training and other non-distorting support measures. Effective food safety vs. sanitary-based trade restrictions
While ensuring food safety is a paramount task for all governments, it appears that the attention of Russia’s food safety authorities primarily focuses on imported meat products. Furthermore, some WTO member countries have pointed out that Russia’s sanitary regulations regarding maximum residue levels are often not scientifically based.
It would be highly desirable for the Russian Federation to build a comprehensive national food safety monitoring system. This system would monitor microbiological, antibiotic and other residue levels on a continuous basis and keep track of improvements in food safety over time, thus building consumer confidence regardless of product origin.
As knowledge becomes increasingly important in the livestock and poultry sectors, public investment in education and training will also be critically important. For the moment, the lack of professional skills at all levels – from nutritionists to farm managers – often forces private companies to invest in their own educational programmes. Public-private partnerships in the field of agricultural education could also address this critical gap.


Russian Federation - Meat sector review
1
Chapter 1 - global medium-term meat market outlook with focus on the russian Federation
Production
Global demand for meats will increase and mostly stem from large economies in Asia, crude oil exporting countries and Latin America according to the FAO-OECD Agricultural Outlook (2012)2. Poultry meat will lead this anticipated growth as the cheapest and most accessible source of meat protein overtaking pork as the largest meat sector by 2021 (see Figure 1).
Figure 1: World beef, pork and poultry production and forecast, 1998-2021
0
20
40
60
80
100
120
140
1998
2000
2002
2004
2006
2008
2010
2012
2014
2016
2018
2020
Forecast
mill
ion
to
nn
es
Poultry meat (rtc)Pig meat (cwe)Beef and veal (cwe)
Source: OECD-FAO Agricultural Outlook 2012.
High feed costs in 2010-2012, a slowdown in demand and weak economic conditions combined to reduce producer returns in the livestock sector, encouraging producers to reduce animal inventories, which slowed total meat production in the years prior
2 This chapter includes findings from the FAO-OECD Agricultural Outlook and its medium-term projections for the period 2012-2021. Because FAO and OECD Secretariats revise projections on an annual basis, the readers are encouraged to refer to the latest projections available. The outlook database, including historical data and projections, is available through the joint OECD-FAO internet site: www.agri-outlook.org.

2
to 2012. Higher producer prices, with feed costs easing in the short term, can be expected to improve meat margins and set the stage for some expansion in production of red meats and poultry in 2012-2013.
It is anticipated that global production of beef, pork and poultry meat will increase from 262 million tonnes in 2005-2010 (average annual) to 330 million tonnes in 2021 (up 26 percent) in response to growing demand. During the same period, production of the same kinds of meat in the Russian Federation is anticipated to increase from 6 million tonnes to 9.4 million tonnes (up 56 percent). Because of anticipated increases in poultry meat, the Russian Federation will increase its share in global meat production from 2 percent in 2006-2010 (on average) to 3 percent by 2021 (see Figure 2).
Figure 2: Global meat production, share of the Russian Federation’s production and forecast, 2001-2021
7,3-
200
250
mill
ion
to
nn
es
350
300
150
100
50
20012005
20062010
20112012
20132014
20152016
20172018
20192020
2021
234262
278 282 286 292 298 303 309 314 319 325 330
4.6 6.0 7.3 7.7 8.0 8.3 8.4 8.6 8.7 8.9 9.0 9.2 9.4
percen
t
Share of Russian Federationin production (right axis)
Russian production(left axis)
World production(left axis)
3
2
1
0
Source: OECD-FAO Agricultural Outlook 2012.
Note: The meat total combines beef, pork and poultry meat only.
Global bovine production, which has stagnated in recent years, is anticipated to start growing more rapidly as herds rebuild. However, poultry will likely remain the fastest growing sector (2.2 percent p.a.) and will produce the highest volume of all meats worldwide by 2021.
Productivity growth throughout the global meat production chain has been significant in recent years. Herds have improved through better breeding and herd management practices, especially improved feeding practices. These improvements have enabled

Russian Federation - Meat sector review
3
growth in meat production efficiency. Despite rising input costs, meat production has grown about 300 percent in the past50 years, and livestock inventories – the number of cattle, swine, chicken and ovine animals – have grown by 57 percent, 137 percent, 400 percent and 49 percent respectively. The change in offtake3, or the quantity of meat produced per animal, has therefore increased substantially over time.
Historical growth in offtake ratios has been high for a number of emerging countries, particularly Brazil and China. In India and the Russian Federation, growth in offtake ratios has been for pork (see Table 1). The offtake ratios depend on many factors, such as the type of meat production system (intensive, pastoral, etc.), consumer preferences and other factors that vary greatly among countries. For instance, offtake ratios and their growth appear very low for some countries in Africa as animals may be kept for farm and work purposes.
Apart from increased farm productivity, improvements in supply chain management, in particular cold chain management, have and will continue to have a very important impact on the growth of this sector. This is especially true in many developing countries where storage and transportation of meat have been limited.
3 Offtake ratios are computed as gross meat production divided by animal inventories.

4
Tab
le 1
: Tre
nd
s in
mea
t o
ffta
ke r
atio
s in
sel
ecte
d c
ou
ntr
ies
Bov
ine
mea
tPo
rkPo
ult
ry m
eat
Off
take
ra
tio
Gro
wth
Pro
ject
edO
ffta
ke
rati
oG
row
thPr
oje
cted
Off
take
ra
tio
Gro
wth
Pro
ject
ed
2005
-09
1985
-201
120
12-2
120
05-0
919
85-2
011
2012
-21
2005
-09
1985
-201
120
12-2
1
kg/h
ead
per
cen
t/yr
per
cen
t/yr
kg/h
ead
per
cen
t/yr
per
cen
t/yr
kg/h
ead
per
cen
t/yr
per
cen
t/yr
Arg
entin
a60
0.5
0.3
122
4.2
2.3
144.
62.
5A
ustr
alia
158
1.3
0.7
144
1.2
0.7
91.
40.
8B
razi
l45
2.5
1.5
835.
33.
29
4.4
2.7
Can
ada
126
0.1
017
42
1.1
70.
70.
4
Chi
na55
8.5
4.9
108
31.
7 3
3.2
1.8
EU
-27
910.
10
144
10.
78
0.5
0.3
Japa
n13
3-0
.3-0
.213
0-0
.2-0
.113
1.8
1.1
Ru
ssia
n
Fed
erat
ion
80-2
.7-1
.712
23.
22
58.
41.
1
Sou
th A
fric
a57
1.1
0.5
139
2.9
1.5
7.7
0.1
0U
nite
d S
tate
s of
Am
eric
a12
00.
80.
515
30.
90.
58
1.4
0.8
Wor
ld42
0.3
0.3
111
1.5
1.2
4.6
1.2
0.8
Sou
rce:
OE
CD
and
FA
O S
ecre
taria
ts.
Not
e: G
row
th e
stim
ates
for
the
Eur
opea
n U
nion
(EU
-27)
and
the
wor
ld a
re li
mite
d to
the
per
iod
star
ting
from
199
6, t
he R
ussi
an F
eder
atio
n fr
om 1
992.

Russian Federation - Meat sector review
5
Trade
The latest available OECD-FAO projections at the time of preparing this report suggested that global imports of beef, pork and poultry meat will increase from 24 million tonnes per year (on average) in 2006-2010 to 31 million tonnes in 2021, an increase of 27 percent. The Russian Federation will decrease its meat imports from 3 to 1.3 million tonnes in the same period (down 57 percent) due to anticipated growth in domestic chicken meat and pork production. The share of the Russian Federation in global meat imports will also decrease from 12 percent in 2006-2010 to about 4 percent in 2021 (see Figure 3). From being the largest meat importers in the world in 2006-2010, by 2021 the Russian Federation is anticipated to move to the fourth position on the global import list after Japan, the sub-Saharan African countries and Saudi Arabia (see Figure 4). Figure 3: Global imports of meat, share of the Russian Federation’s imports and forecast, 2001-2021
19
2427 27 28 28 28 29 29 30 30 30 31
2.4 3.0 2.3 2.0 1.9 1.7 1.7 1.6 1.6 1.5 1.5 1.3 1.3
1312
9
77
6 6 6 5 5 54 4
0
5
10
15
20
25
30
35
20112012
20132014
20152016
20172018
20192020
2021
0
2
4
6
8
10
12
14
mill
ion
to
nn
es
percen
t
2006-2010
2001-2005
Share of Russian Federationin production (right axis)
Russian imports(left axis)
World trade(left axis)
avg
avg
Source: OECD-FAO Agricultural Outlook 2012.
Note: The meat total combines beef, pork and poultry meat.

6
Figure 4: Net meat trade balance in 2006-2010 and forecast for 2021 of major exporters and importers
-3 000 -1 000 1 000 3 000 5 000 7 000JapanSub Sharan AfricaSaudi ArabiaRussian FederationKoreaMexicoViet NamEgyptPhilippinesRepublic of South AfricaChinaIndonesiaMalaysiaTurkeyKazakhstanUkraine
UruguayNew Zealand
ArgentinaIndia
ThailandAustraliaCanada
European Union-27United States
Brazil
2021 (forecast)2006-2010 (average)
Source: OECD-FAO Agricultural Outlook 2012.
Note: The meat total combines beef, pork and poultry meat.
The growth in world meat imports is forecast despite strong anticipated meat prices through 2021. Population, income growth and high-income elasticity of demand will drive meat imports of developing countries.
Led mostly by an expansion of poultry and beef shipments, world meat exports will increase to respond to the growing demand. The bulk of the growth is expected to originate largely from North and South America, which will account for nearly 70 percent of the total increase in all meat exported by 2021. The two largest contributors to export growth are the USA and Brazil, both of which will strengthen their dominance in world meat trade. By 2021, the USA and Brazil will generate nearly 80 percent of the expansion of world poultry trade.

Russian Federation - Meat sector review
7
Brazil, Australia, India, Canada, Argentina, New Zealand, Uruguay and Paraguay will be the main exporters of beef. Japan, the Russian Federation, the USA, Korea and Egypt will be its major importers. It is also expected that Iran and Viet Nam will continue increasing beef imports in the future.
The EU, USA, Canada and Brazil will remain the main exporters of pork with Japan, the Koreas, Mexico, the Russian Federation and the sub-Saharan Africa countries being the main buyers by 2021. As for poultry meat, Brazil, the USA, Thailand, the EU and Argentina are expected to be the main exporters with the sub-Saharan Africa countries, Saudi Arabia, Viet Nam, Mexico and China being the main poultry meat importers by 2021.
Consumption
World consumption of beef, pork and poultry meat will continue to grow at one of the highest rates among major agricultural commodities. Together with other factors such as changing consumer attitudes and preferences and relative prices, overall meat demand will be affected by two factors: population and income growth. In the past 30 years worldwide population growth contributed 60 percent to the overall growth in meat consumption with the remaining 40 percent being attributed to an increase of per capita income and per capita consumption growth. As shown on Figure 5, average global meat per capita consumption directly correlated4 with the per capita gross national income (GNI) measured at the purchasing price parity basis (PPP).
4 The correlation index between per capita meat consumption and gross national income (GNI) in 1980-2009 was 0.978 – pointing to a very strong correlation. Although the correlation was direct, it was less than proportionate. An average of 4.79 percent annual increase in per capita GNI generated an average 1.06 percent annual increase in per capita meat consumption, as consumers were also allocating income to other products and services.

8
Figure 5: World per capita meat consumption and income, 1980-2009
2 000
4 000
6 000
8 000
10 000
12 000
19801982
19841986
19881990
19921994
19961998
20002002
20042006
2008
18
23
28
33
38
43
PPP GNI per capita (left axis)
cur
rent
inte
rnat
iona
l dol
lars
kg
0
Consumption per capita (right axis)
Source: Authors’ calculations based on FAO Stat and World Bank Data.
It is expected that global per capita meat consumption will increase until 2021 with poultry accounting for 70 percent of anticipated growth (see Figure 6).
Growth in developing countries is forecast to capture 82 percent of the additional global consumption by 2021. The per capita consumption of meat in the USA, the EU and Japan is not anticipated to change significantly from the levels observed in 2006-2010. However, it is anticipated to increase considerably in Uruguay, Brazil, Argentina, Chile, Malaysia, the Russian Federation, Ukraine and other countries, reflecting consumer income growth. In Eastern Europe, consumption of red meat still has a substantial growth potential and will also increase.

Russian Federation - Meat sector review
9
Figure 6: Annual per capita meat consumption in 2006-2010 and forecast until 2021
Isra
el
Uru
guay
Uni
ted
State
s
Brazil
Argen
tina
Austra
lia
Chile
Euro
pean
Uni
on-2
7
Russi
an F
eder
atio
nM
alay
sia
Ukr
aine
Korea
Mex
ico
China
Kanza
khst
an
Saudi
Ara
bia
Viet N
am
Japa
n
Wor
ld a
vera
ge
Turk
eyTh
aila
nd
Repub
lic o
f Sau
th A
frica
7597 87
78 7861 65
50 50 38 44 46 41 42 41 38 35 33 31 18 19
97 97 93 90 87 8370 64 61 60 54 53 53 52 49 49 47 46
34 3425 2371
2006 - 2010 (average)
120
100
80
60
40
20
0
2021 (average)
kg
Source: OECD-FAO Agricultural Outlook 2012.
Note: The meat total combines of beef, pork and poultry meat. Data may differ from
official consumption estimates made by the Russian Government provided in this report.
Uncertainties
The meat sector is highly sensitive to macroeconomic conditions policy conditions and animal health and food safety issues; this poses a significant risk to the validity of the projections provided in this chapter. Changes in oil prices and civil unrest have the potential to impact world meat trade. Animal diseases and changes in food safety regulations have the potential to affect domestic and regional meat production and consumers’ preferences. For instance, the Russian Federation imposed sanitary restrictions on meat imports from a number of Brazilian states in May 2011. The ban resulted in a substantial contraction of bilateral trade on beef and pork and the end of two years of almost uninterrupted monthly increases of world meat prices.
Increasing consumer awareness of the livestock sector’s use of water resources, its contribution to greenhouse gas emissions and animal welfare issues will also likely affect demand for different kinds of meat, especially in developed countries. These factors affecting demand also need to be considered by potential investors.

10
It is currently expected that strong meat prices will result in sustained export earnings, which will encourage large meat exporting countries to further invest in production and exports despite the high incidence of food-safety and sanitary import bans. This investment in exporting countries will likely put increased competitive pressure on producers in the Russian Federation as the country is expected to liberalize meat imports in line with its WTO commitments.

Russian Federation - Meat sector review
11
Chapter 2 - The russian Federation meat sector in brief
Importance of the meat sector for the economy
Agriculture accounted for about 6 percent of Russian Federation’s gross domestic product (GDP) in 2010. The livestock sector inclusive of all livestock, dairy and poultry – accounted for about 50-55 percent of agriculture output with the remaining output coming from crops and plant products (mostly grain, oilseeds, pulses, fruits, vegetables, etc.). Beef, veal, pork, poultry, sheep, goat and other kinds of meat accounted for about 38-43 percent of overall livestock sector production in 2005-2010 and 19-23 percent of the total agricultural production (see Table 2).
Table 2: Role of livestock and meat in Russian agriculture and economy, billion RUR, 2005-2010
Indicator 2005 2006 2007 2008 2009 2010
GDP 21 610 26 917 33 248 41 277 38 809 45 166
of which:
Agricultural products 1 381 1 571 1 932 2 461 2 516 2 619
Agricultural products, % GDP 6.4 5.8 5.8 6 6.5 5.8
of which:
Livestock sector 711 806 929 1 155 1 277 1 439
of which:
Meat from livestock and poultry 295 328 367 442 556 591
Meat, % GDP 1.4 1.2 1.1 1.1 1.4 1.3
Meat, % ag output 21.4 20.9 19 18 22.1 22.6
Meat, % livestock sector 41.5 40.7 39.5 38.3 43.6 41.1
Source: Based on Federal Service of State Statistics (FSSS) of Russian Federation.
Note: Found in “Russian Classification of Economic Activities (OKVED), # 01.02, under
subsection DA 15.1 “Production of meat and meat products”.

12
The percentage of the population employed in agriculture (including both crop and livestock production) declined from 10 percent in 2005 to 8 percent in 2011 according to official statistics (FSSS) as trade, finance, construction and other sectors attract more employees.
According to official statistics, 606 000 people were employed in meat production in 20105. As their productivity increases, the number of employees involved in meat production and processing declines and incomes increase (see Table 3).
Table 3: Employees and incomes in meat and meat product production, 2005-2010
2005 2006 2007 2008 2009 2010Change 2011 vs.
2005
Payroll fund for all employees, RUR billion/year
50 54 63 72 77 82 65%
Average number of all employees, thousand persons
1 167 1 003 888 695 639 606 - 48%
Average annual gross income per employee, RUR/month
3 544 4 515 5 948 8 583 10 056 11 294 219%
Source: FSSS.
Note: Income in current prices.
The meat processing industry alone accounts for about 7 percent of the 2.5 million people employed in the country’s food processing industry. The number of employees in the meat processing sector increased from 165 000 people in 2005 to 189 000 people in 2010, reflecting an overall expansion. This expansion underlines the importance of the industry as a source of local job creation.
In addition to formal employment, raising livestock and poultry play a significant role in informal or self-employment in the Russian Federation as smallholder producers still account for a sizable share in total livestock production. Despite the decreasing share of smallholder farms in total livestock production – from 54 percent (2.7 million tonnes of livestock in slaughter height) in 2003 to 34
5 Found in “Russian Classification of Economic Activities (OKVED), # 01.02, under subsection DA 15.1 “Production of meat and meat products”.

Russian Federation - Meat sector review
13
percent (2.5 million tonnes) in 2011,compared with commercial farms that increased livestock production from 2.2 to4.8 million tonnes – small livestock producers are still an important source of rural employment and incomes in the Russian Federation. Poultry, pork and beef account for 91 percent of all meat products in the Russian Federation (2010, FAO Stat) namely: poultry meat for 38 percent of all meat output, pork for 32 percent and beef and veal for 21 percent. According to national statistics, mutton and lamb are important meats especially in the Southern and North Caucasian Federal Districts. The latter types of meat were not included in this review because sheep meat accounts for only 2 percent, horse meat for 1 percent and other types of meat for 4 percent of the nation-wide total meat output.
Meat market development and outlook until 2021
The Russian meat sector has been undergoing a major transition, which is largely unprecedented in modern history and has followed the breakup of the Soviet Union in 1991. The downward trend in cattle inventories began in 1990. Cattle numbers declined from 59 million heads to 28 million heads in 2000 and then below 21 million heads in 2010, thus registering a tremendous 65 percent decrease in livestock numbers since 1990. This downward trend has slowed in recent years, but it is still ongoing. Amongst all transition economies in the EBRD regions of operation, only Ukraine witnessed such a drastic decrease in the number of cattle herds: from 25 million heads in 1990 to 5 million in 2010, or an 80 percent decrease.
The decrease in livestock inventories can partially be attributed to the adjustments in the closely related dairy sector. As farmers increased productivity of the milk heard, they continued slaughtering dairy and dual-purpose cows. Specialized beef production is almost non-existent in the Russian Federation, so dairy and dual-purpose cows slaughter has been reflected in lower cattle inventories and decrease of domestic beef production potential. This downward trend in cattle inventories inevitably resulted in decreased domestic beef production and increased imports.
Swine inventories also decreased dramatically from 40 million heads in 1990 to 18 million in 2000. But the downward trend was reversed in 2005 owing to generous state support and trade measures. Nevertheless, the Russian Federation still witnessed a 57 percent decrease in swine numbers from 1990 to 2010. Poultry production has witnessed the fastest recovery during the

14
same period, because it is a sector that allows for a shorter payback period on investments as compared with pork and beef production. In 2006, poultry meat became the most important meat type produced in the Russian Federation, and by 2010 farmers produced 180 percent more chicken meat than in the early 1990s.
There are number of outlooks on the short- and medium-term perspectives of the Russian meat sector. These outlooks are prepared at national and international levels and use different approaches. Box 1 below briefly discusses the main sector development forecasts available.

Russian Federation - Meat sector review
15
Box 1: Mid-term meat production forecasts for the Russian Federation and their various sources
According to official statistics, production of all kinds of meat in Russia has been growing fast while meat imports have decreased since 2009 (see Table 4). The Russian Government, in its Strategy of Livestock Production Development in the Russian Federation untill 20201, forecasts that the total production of all types of meat will reach 9.6 million tonnes, imports will decrease to 0.6 million and domestic consumption will increase to 9.9 million tonnes by 2020. The same strategy envisages that Russia will export 0.6 million tonnes of meat, including 400 000 tonnes of poultry and 200 000 tonnes of pork (Table 4).
The latest available forecast by OECD-FAO at the time of report finalization2 suggested that the Russian meat production (beef, pork and poultry) might increase to 9.4 million tonnes by 2020 – an estimate very similar to the Russian Ministry of Agriculture’s. The latest results of meat trade simulations conducted by FAO in February 2013 suggest that meat imports may decrease from earlier forecasted levels; however, it is doubtful that the Russian Federation would be able to export 0.6 million tonnes of all kinds of meat considering its strong domestic demand.
In this review, forecasts from both the government of the Russian Federation and the OECD-FAO Mid-term Agricultural Outlook are mostly used.
Similar to OECD-FAO Agricultural Outlook, there are other sources of mid-term market outlook that are based on global partial-equilibrium econometric models. For instance, the USDA’s international baseline projections3, suggest that Russian meat production will increase to 12.5 million tonnes by 2020 (including 6.7 million tonnes of beef, 2.4 million tonnes of pork and 3.4 million tonnes of poultry meat) while imports will remain high at about 2 million tonnes (e.g. will not show signs of drastic decrease and will reflect more rapidly increasing domestic consumption).
Interested readers can also refer to the outlook by the Food and Agricultural Policy Research Institute (FAPRI), which covers beef, pork and poultry sectors in the Russian Federation and Ukraine among other countries.
1 Approved by the Order No. 267 by the Russian Federation Ministry of Agriculture, dated 10 August 2011; published by the Ministry of Agriculture of the Russian Federation in August 2011, http://mcx.ru/documents/document/show/16974.77.htm, Russian version only).
2 May 2012, http://www.oecd.org/site/oecd-faoagriculturaloutlook).
3 (January 2013), available at http://www.ers.usda.gov/data-products/international-baseline-data aspx.

16
Figure 7 shows a historical perspective of beef and veal, pork and poultry meat production in the Russian Federation starting in 1998. It also provides a medium-term OECD-FAO meat production outlook until 2021 based on the 2012 projections.
Figure 7: Russian Federation’s production of beef, pork and poultry in 1998-2011 and mid-term outlook until 2021
4 500
4 000
3 500
3 000
2 500
2 000
1 500
1 000
500
0
10
9
8
7
6
5
4
3
2
11998
20002002
20042006
20082010
20142020
20182016
2012
th
ou
san
d t
on
nes
percen
t
4 113
3 1191
2 068
3 179
2 461
1 710
Beef and veal (cwe) (left axis) Pigmeat (cwe) (left axis)
Poultry meat (rtc) (left axis)
Share of Russian Federation in world poultry meat (right axis)
Share of Russian Federation in world pigmeat meat (right axis)
Share of Russian Federation in world beef and veal production (right axis)
Source: OECD-FAO 2012.
Production of meat in the Russian Federation has been growing fast while meat imports have decreased since 2009, according to official statistics. This trend is expected to continue in the future (see Table 4 and for more details Box 1).
Table 4: All meats supply and demand, thousand tonnes, 2005-2020
2005 2006 2007 2008 2009 2010 2015* 2020*
Production 4 920 5 209 5 722 6 202 6 648 7 090 8 688 9 636
Consumption 7 505 7 894 8 505 9 134 9 072 9 139 9 678 9 876
Import 2 585 2 685 2 784 2 935 2 423 1 930 1 050 640
Export 0 0 1 3 6 19 100 600
Source: FSSS of Russian Federation, Meat Union of Russia and Meatinfo.
* Forecast from Strategy on Livestock Production Development in the Russian Federation until 2020.
Russian Federation - Meat sector review
17
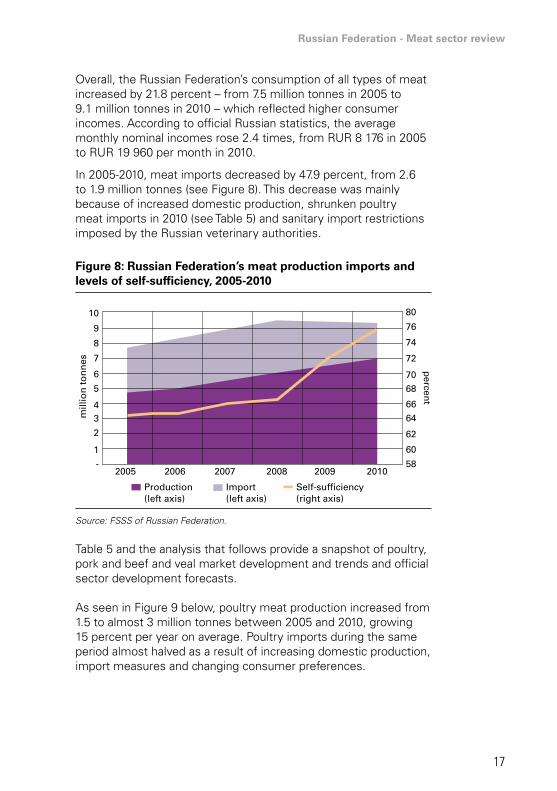
Overall, the Russian Federation’s consumption of all types of meat increased by 21.8 percent – from 7.5 million tonnes in 2005 to 9.1 million tonnes in 2010 – which reflected higher consumer incomes. According to official Russian statistics, the average monthly nominal incomes rose 2.4 times, from RUR 8 176 in 2005 to RUR 19 960 per month in 2010.
In 2005-2010, meat imports decreased by 47.9 percent, from 2.6 to 1.9 million tonnes (see Figure 8). This decrease was mainly because of increased domestic production, shrunken poultry meat imports in 2010 (see Table 5) and sanitary import restrictions imposed by the Russian veterinary authorities.
Figure 8: Russian Federation’s meat production imports and levels of self-sufficiency, 2005-2010
10
6
8
7
9
5
4
2
1-
2005 2006 2007 2008 2009 2010
64
62
6870
66
72
74
60
58
3mill
ion
to
nn
es percen
t
80
76
Import(left axis)
Production(left axis)
Self-sufficiency(right axis)
Source: FSSS of Russian Federation.
Table 5 and the analysis that follows provide a snapshot of poultry, pork and beef and veal market development and trends and official sector development forecasts.
As seen in Figure 9 below, poultry meat production increased from 1.5 to almost 3 million tonnes between 2005 and 2010, growing 15 percent per year on average. Poultry imports during the same period almost halved as a result of increasing domestic production, import measures and changing consumer preferences.

18
Table 5: Supply and demand for different types of meat and its forecast, thousand tonnes, 2005-2020
Indicator 2005 2006 2007 2008 2009 2010 2015* 2020*
Production 1 388 1 632 1 925 2 217 2 555 2 847 3 850 4 251
Poultry
Consumption** 2 706 2 906 3 219 3 438 3 541 3 512 4 030 3 941
Import 1 318 1 274 1 295 1 224 986 661 240 90
Export 0 0 1 3 6 19 *** 60 400
Pork
Production 1 569 1 699 1 930 2 042 2 170 2 331 2 925 3 389
Consumption 2 154 2 361 2 615 2 864 2 836 2 970 3 165 3 439
Import 585 662 685 822 667 639 240 50
Export 0 0 0 0 0 0 40 200
Beef
Production 1 809 1 722 1 699 1 769 1 741 1 727 1 715 1 786
Consumption 2 484 2 456 2 488 2 643 2 502 2 463 2 285 2 286
Import 674 734 789 874 760 621 570 500
Export 0 0 0 0 0 0 0 0
Source: FSSS, Meat Union of Russia and Meatinfo.
* Forecast from Strategy on Livestock Production Development in the Russian
Federation until 2020.
** Consumption of meat and meat products calculated as raw meat equivalent. Data
exclude pork fat and edible by-products.
*** Other sources state 15 000 tonnes.

Russian Federation - Meat sector review
19
Figure 9: Russian Federation’s production, imports and self-sufficiency in poultry meat, 2005-2010
4.0
3.5
3.0
2.5
2.0
1.5
1.0
0.5
- 0
10
20
30
40
50
60
70
80
2005 2006 2007 2008 2009 2010
Production(left axis)
Import(left axis)
Self-sufficiency(right axis)
mill
ion
to
nn
es percen
t
Source: FSSS of Russian Federation
Poultry inventories, slaughter and live weight (yield6) directly influenced meat production, and Table 6 illustrates these relations in the Russian Federation using chicken inventories and slaughter. It is clear that the growth in chicken inventories and slaughter was the main reason behind increased meat production. It should be noted that the information provided in Table 6 includes all chickens, those raised by private households for meat and eggs as well as the meat received from spent hens at the commercial egg production farms.
In six years, from 2005 to 2011, chicken slaughter increased by 91 percent, while meat yield increased by only 13 percent, from 1.4 kg per head in 2005 to 1.58 kg per head in 2011. Broiler yields are believed to have increased even more rapidly.
6 Meat yields indicate the carcass weight equivalent after animal slaughter (for cattle or swine) or ready-to-cook equivalent for poultry meat.

20
Table 6: Chicken inventories, slaughter, yields and meat production in the Russian Federation, 2005-2011
2005 2006 2007 2008 2009 2010 2011Change 2011 vs.
2005
Chicken inventories as of Jan. 1, mln head
329 343 358 351 366 391 406 24%
Chicken slaughter, mln head 96 108 125 132 151 166 184 91%
Chicken meat production, mln tonnes
1.35 1.58 1.87 2.00 2.31 2.56 2.91 116%
Yield, kg/head 1.40 1.47 1.50 1.52 1.53 1.55 1.58 13%
Source: FAO Stat based on official Russian statistics.
Note: Includes only chicken inventories and production.
The Russian Federation’s pork production expanded by 49 percent from 2005 to 2010 and was accompanied by a 38 percent increase in consumption. Imports continued to grow over the same period, however, even if at the low pace of 9 percent. In 2010 imported pork, which mostly goes for further processing, held 22 percent of the domestic market share, compared with 27 percent in 2005.
Figure 10: Russian Federation’s production, imports and self-sufficiency in pork, 2005-2010
Source: FSSS of Russian Federation.
percen
t
mill
ion
to
nn
es
3.5
3.0
2.5
2.0
1.5
1.0
-
0.5
2005 2006 2007 2008 2009 2010
80
76
78
74
72
70
68
66
Import(left axis)
Production(left axis)
Self-sufficiency(right axis)

Russian Federation - Meat sector review
21
Similar to the poultry sector, the main sources of increasing pork production in 2005-2011 were the rise of pig inventories and slaughter. Pig inventories in the Russian Federation increased from 13.4 million heads in 2005 to 17.2 million heads in 2011, or by 28 percent. The increase in slaughter during the same period was even more impressive at 59 percent (see Table 7). Although slaughter yields have remained almost unchanged at 84 kilograms per head, it should be noted that pork production efficiency has improved. In 2005, the number of slaughtered animals exceeded beginning pig inventories by 36 percent. In 2011, pig slaughter exceeded beginning inventories by 69 percent, pointing to intensified pork production, shorter growing cycles and faster animal turnover in swine production facilities.
Table 7: Pig inventories, slaughter, yields and meat production in the Russian Federation, 2005-2011
2005 2006 2007 2008 2009 2010 2011Change 2011 vs.
2005
Pig inventories as of Jan 1, mln head
13.4 13.5 15.9 16.3 16.2 17.2 17.2 28%
Pig slaughter, mln head 18.3 19.4 22.3 24.1 26.0 28.0 29.1 59%
Pig slaughter, percent of inventories
136 145 140 147 161 162 169 24%
Yield, kg/head 83 84 84 85 83 83 84 1%
Pork production, mln tonnes 1.52 1.64 1.87 2.04 2.17 2.33 2.43 60%
Source: FAO Stat based on official Russian statistics.
Unlike the increase of domestic production of poultry and pork, beef production has continued to decline. As can be seen in Figure 11, imports of beef experienced a peak in 2008 and then started declining, which resulted in a decreasing beef supply.

22
Figure 11: Russian Federation’s production, imports and level of self-sufficiency in beef, 2005-2010
2005 2006 2007 2008 2009 2010
3 000
2 500
2 000
1 500
1 000
500
0 0
74
72
70
68
66
64
Self-sufficiency(right axis)
Production(left axis)
Import(left axis)
mill
ion
to
nn
es percen
t
Source: FSSS of Russian Federation.
The beef and veal production decline has reflected decreasing cattle inventories and slaughter as indicated in Table 8. During the period of 2005-2011, Russian farmers continued cattle slaughter at a faster pace than the cattle heard was rebuilt owing to low profitability of raising animals. From 2005 to 2011, there was a decrease of three million cattle heads: a drop of 13 percent.
Another reason behind decreasing cattle inventories is ongoing adjustments in the dairy sector. As cow yields increase and feed conversion rates improve, farmers continue to decrease the number of dairy cows. Since Soviet Union times (and, to a considerable extent, now) beef has been a by-product of the milk production. Despite some success of the federal programme “Development of meat cattle breeding in Russia for 2009-2012” and the launch of several big projects, the pure-bred beef cattle inventories remain very low: between 450 and 500 thousand heads, according to different estimates.
The Russian beef sector has shown some signs of recovery in recent years. Farmers tend to feed their cattle better and slaughter them at higher slaughter weights. The average yield of cattle in the Russian Federation increased from 168 kilograms per head in 2005 to 190 kilograms in 2011: a 13 percent increase as indicated in Table 8.

Russian Federation - Meat sector review
23
Table 8: Cattle inventories, slaughter, yields and beef and veal production in the Russian Federation, 2005-2011
2005 2006 2007 2008 2009 2010 2011Change 2011 vs.
2005
Cattle inventories as of 1 Jan, mln head
23.0 21.5 21.5 21.5 21.0 20.7 20.0 -13%
Cattle slaughter, mln head 10.7 9.6 9.5 9.6 9.4 9.3 8.6 -20%
Yield, kg/head 168 177 178 184 185 185 190 13%
Beef and veal production, mln tonnes
1.8 1.7 1.7 1.8 1.7 1.7 1.6 -9%
Source: FAO Stat based on official Russian statistics.
Summary of main risks and opportunities in the meat industry
Table 9 summarizes the industry’s main risks, opportunities and risk mitigation options. The types of risks are divided into the following broad categories: production and infrastructure, animal disease and epizootic situation, investment-related and policy.
Table 9: Main risks, opportunities and risk mitigation options in the Russian meat sector
Type of risk
Risk description Possible consequencesMitigation and
opportunities
Pro
duct
ion/
Infr
astr
uctu
re
• high volatility in feed prices • additional costs for project’s startup development
• vertical integration with feed production
• poor quality of purchased feeds
• decreasing margin and lack of working capital
• feed price risk hedging for outsourced grain/feed
• lack of experience and knowledge of key staff and
(nutrition, vet services, management, etc.)
• low quality/food safety of the final product
• investment in staff training and education, outsourcing of key services to result in
better production indicators
• poor infrastructure (electricity outages, road transportation blocked in
winter, etc.)
• low competitiveness and loss of market share
• location in areas with well-developed infrastructure
• lack of effective food safety control/monitoring system
• inability to improve feed conversion and other efficiency indicators

24
Type of risk
Risk description Possible consequencesMitigation and
opportunities
Epi
zoot
ic
• African swine fever • risk of flocks/heard depopulation
• investment in veterinary services and biosecurity
measures
• avian influenza • loss of investment• work with local
communities to create buffer zones around production facilities
• other diseases
• trade disruptions and bans
• disease • significantly delayed
payback period
• significant additional expenditures on eradication
leading to bankruptcy
Inve
stm
ent
and
finan
cial
• long payback periods, especially in cattle/beef
production• limited expansion capacity
• investment planning at market rather than
subsidized interest rates
• cancellation or reduction of current interest rate subsidies due to policy
changes
• reduced profitability, increased costs
• legally binding commitments from
government/local authorities and banking
sector
• increase of credit interest rates
• reduced or negative margins and higher risks of loan
defaults
• lack of operating capital due to financial sector crisis.
• inability to purchase inputs and feed in a timely manner
(reduces production volumes and cash flow
income to critical levels)
Polic
y
• reduced availability of public funding due to lower budget
revenues or public focus shifting to other priorities
• higher interest rates and lack of state co-financing
• investment planning assuming stiffer import
competition and minimum tariff protection
• the Russian Federation’s accession to the WTO and
decreased import tariff protection
• lack of operating and investment capital as
financial institutions shift focus away from agriculture/
meat sector
• investment planning without price support
payments
• the need to restrict overall domestic support in line with WTO commitments
• reduced sales and incomes• plan investment
considering the latest environmental, animal
production and advanced food safety systems
• changes in standards and regulations (environmental,
waste treatment, food safety, animal welfare)
• slow growth, extended payback or bankruptcy
Source: Author/LMC International, based on calculations and estimates.

Russian Federation - Meat sector review
25
Chapter 3 - detailed review of the meat sector
Meat production structure: increasing the role of commercial farms
There are three main types of farms that raise livestock and poultry in the Russian Federation: agricultural enterprises (commercial farms), individual (peasant) farms and rural households (smallholders that produce food for own consumption and often have extra non-farm income). The recent growth in livestock and poultry inventories has been accompanied by the changing roles of different farm types. The role of commercial meat producers has increased considerably owing to their better access to state financing, economy of scale, growing industry consolidation, the decreasing role of traditional meat markets and the increasing role of modern retail chains. The latter demands steady meat supplies, high quantities, uniform quality and food safety standards. Most of the support programmes described later in this report require that farms be registered as official businesses to receive state support or qualify for an interest rate subsidy on credit.
Rural households decreased their inventories of all kinds of poultry (chickens, turkey, ducks, geese, etc.) from 113 million head in 2005 to 97 million head in 2010 (down 15 percent), and agricultural enterprises increased their poultry numbers from 241 million head in 2005 to 348 million during the same period (up 44 percent). Correspondingly, the share of agricultural enterprises in poultry inventories increased from 68 percent in 2005 to 77 percent in 2010 while the share of rural households decreased from 32 percent in 2005 to 21 percent in 2010 (see Figure 12).
Alongside economic reasons, social and demographic factors – such as an ageing rural population and migration of young people to urban areas – cause this decrease of livestock and poultry production by rural households. Gender does not play a significant role in the development of the meat sector in the Russian Federation and was not reviewed in this report.
The individual (peasant) farms have maintained 1 percent of poultry inventories in 2005-2010 (see Figure 12). The outgrowing farming schemes involving individual farmers contracted by meat processors

26
to raise chickens are not popular in the Russian Federation because individual farmers are not considered to be reliable suppliers. This may explain their low share in total poultry inventories.
Figure 12: Structure of poultry inventories by type of farm, 2005-2010
68% 68% 71% 74% 76%
1% 1% 1% 1% 1%
32% 31% 28% 25% 23%
77%
1%
21%
0
20
40
60
80
100
2005 2006 2007 2008 2009 2010
per
cen
t
Agricultural enterprise Individual (peasant) farm Rural households(smallholder)
Source: FSSS of Russian Federation.
While poultry production structure varies considerably by region, each subsector has its peculiarities. Raising chickens in rural households is popular in all rural territories of the Russian Federation as hens are mostly used to supply eggs for in-house consumption. However, in southern regions (Rostov, Krasnodar and Stavropol and North Caucasian Republics) backyard commercial broiler farms supply a considerable volume of broilers, turkeys, ducks and geese to the local meat markets. This is explained by availability of feed wheat, corn, sunflower and other feeds at affordable prices, favorable climate and a tradition of raising backyard poultry. Similar backyard production is registered in the Republics of Tatarstan and Bashkortostan. The regional production structure is described later in this report.
Similar trends were observed in the structure of pig inventories in 2005-2010: agricultural enterprises increased pig inventories from 7 million to 11 million heads (up 48 percent) while rural households decreased, from 6 million to 5.6 million heads (down 5.5 percent). Therefore, rural households’ share of total pig inventories decreased by 9 percent from 2005 until 2010 (see Figure 13). Individual farms also played a more important role in

Russian Federation - Meat sector review
27
pork production than in poultry as they accounted for 4 percent of all pig inventories.
Figure 13: Structure of pig inventories by type of farm, 2005-2010
4%
53%
5%
52%
5%
53%
5%
57%
4%
62%
5%
63%
43% 43% 41% 38% 34% 33%
per
cen
t
80
100
60
40
20
02005 2006 2007 2008 2009 2010
Agricultural enterprise Individual (peasant) farm Rural households(smallholder)
Source: FSSS of Russian Federation.
The cattle inventories held by both major types of farms continued to decline. Agricultural enterprises decreased cattle numbers from 11 million in 2005 to 9.3 million heads in 2010 (down 16 percent). Rural households also continued cattle slaughter although at a slower pace: from 9.6 million heads in 2005 to 9.2 million in 2010 (down 4 percent).
An emerging growth of individual farmers as producers is the main difference in cattle inventories and their structure as compared with poultry and swine. The cattle inventories held by the individual farmers increased from 0.9 million heads in 2005 to 1.5 million in 2010 according to official Russian statistics (up 58 percent). Correspondingly, the share of individual farmers in total cattle production increased from 4 percent in 2005 to 7 percent in 2010 (see Figure 14).

28
Figure 14: Structure of cattle inventories by type of farm, 2005-2010
0
20
40
60
80
100
2005 2006 2007 2008 2009 2010
per
cen
t
51% 49% 48% 48% 46% 46%
49% 48% 47% 46% 46%51%
4% 5% 6% 6% 7% 7%
Individual (peasant) farmAgricultural enterprise Rural household(smallholder)
Source: FSSS of Russian Federation.
As already mentioned, raising and slaughtering cattle is closely linked with dairy herd replacements (Box 2). Cattle inventories diminished as milk yields and production increased and farmers reduced cow numbers. In 2010, an average milk yield per cow in the Russian Federation was about 3 800 kg per year, or 18 percent more than in 2005. The increase in cow milk productivity occurred despite the decrease of cattle inventories from 9.6 million cows in 2005 to 8.3 million in 2010 (down 13 percent).
Box 2: Beef cattle production perspectives
According to the state scientific institution All-Russia Scientific Research Institute Of Meat Cattle Breeding, only about 5 percent of local beef comes from beef cattle or cross-breeds (more information on cattle breeds in the Russian Federation is provided in the Annex 2 of this report).
The Ministry of Agriculture of the Russian Federation identified two areas of improvement in its "Development of Beef Cattle in Russia 2009-2012" programme: (i) intensification of the use of cattle feedlots to increase daily weight gains and slaughter weights and decrease cattle age at slaughter to below 24 months; and (ii) increase in cattle inventories.
With regards to the beef market, high quality beef has become available only recently when the country started importing beef from the USA, Brazil, Australia, the EU and Argentina. Beef production will likely continue to develop as a niche market limited to the demand of high-income consumers in big cities.

Russian Federation - Meat sector review
29
Meat supply
In 2010, the Russian meat market (calculated in raw meat equivalent as domestic production, added to by meat imports and subtracted from by exports) increased by 22 percent as compared with 2005 (see Table 10).
Table 10: Meat market, thousand tonnes
Meat type 2005 2006 2007 2008 2009 2010Change2010 vs.
2005
Poultry 2 706 2 906 3 219 3 438 3 541 3 512 +30%
Pork 2 154 2 361 2 615 2 864 2 836 2 970 +38%
Beef 2 484 2 456 2 488 2 643 2 502 2 463 -0.8%
Other kinds of meat** 161 171 183 189 193 194 +20.5%
Total 7 505 7 894 8 505 9 134 9 072 9 139 +22%
Source: FSSS of Russian Federation, Meat Union of Russia and Meatinfo.
* Calculated as production + imports - exports = consumption.** Lamb and goat meat.
Within this trend, the poultry meat and pork subsectors experienced the highest growth rate of 30 and 38 percent respectively. Changes in the beef supply were insignificant (down 0.8 percent).
The major changes in the structure of the Russian meat market occurred because of the expansion of poultry production and reduction of beef supply (see Figure 15).

30
Figure 15: Recent developments in the meat market structure, 2005-2010
33%
29%
36%
31%
30%
37%
29%29%
31%
38%
28%
31%
39%
27%
33%
38%
0
10
20
30
40
50
60
per
cen
t
70
80
90
100
2005 2006 2007 2008 2009 2010
2% 2% 2% 2% 2% 2%
29%
31%
38%
PoultryVeal & beef Other types of meatPork
Source: FSSS of Russian Federation, Meat Union of Russia and Meatinfo.
In 2010, the meat market value in the Russian Federation increased by 75 percent as compared with 2005, reaching about RUR 930 billion (in current prices). The pork market was a growth leader expanding at a 94 percent by value because of demand and price increases. Poultry and beef market turnovers grew at an equal pace of about 65 percent (see Table 11).
Table 11: Meat market value, million RUR, excl. value added tax (VAT), 2005-2010
Meat type 2005 2006 2007 2008 2009 2010Change2010 vs.
2005
Poultry 150.7 148.9 181.8 216.7 252.7 248.9 +65%
Pork 177.4 197.8 206.4 294.3 324.8 343.6 +94%
Beef 191.3 216.6 221.9 272.6 287.6 314.0 +64%
Other kinds of meat 11.1 15.3 16.4 20.1 24.6 22.1 +99%
Total 530.4 578.5 626.6 803.8 889.8 928.6 +75%
Source: FSSS of Russian Federation, Meat Union of Russia and Meatinfo.
Note: Calculations based on slaughter weight and producers’ prices.

Russian Federation - Meat sector review
31
While poultry is an absolute leader on the Russian meat market for volume, it held 27 percent share by value in 2010. Pork held 38 percent of the total meat market in 2010 and was followed by beef at 33.8 percent (see Figure 16 and Figure 17).
Figure 16: Meat market structure, 2010, in value
Poultry
Pork
Beef
Other types of meat38%
33%
27.0%
2.1%
Source: FSSS of Russian Federation, Meat Union of Russia and Meatinfo.
Figure 17: Meat market structure, 2010, in volume
Poultry
Pork
Beef
Other types of meat
26%
2.1%
27.0%
38%
Source: FSSS of Russian Federation, Meat Union of Russia and Meatinfo.

32
Meat consumption
According to FAO Stat, per capita meat consumption in the Russian Federation started declining in the 1990s. It bottomed out in 2000 when about 40 kg of all kinds of meat were consumed per person as compared with more than 60 kg consumed in the early 1990s. Since 2000, meat consumption has increasingly reflected higher consumer incomes and overall economic growth driven by high oil and gas prices (see Figure 18). In 2005, the Russian Federation became a high-income country according to the World Bank. Meat consumption and sales increased at a pace of 12 percent p.a. on average during 2005-2010.
Figure 18: Per capita meat consumption and GNI in the Russian Federation, 1992-2009
0
20
40
60
1992 1994 1996 1998 2000 2002 2004 2006 20080
5 000
10 000
15 000
20 000
kg
curren
t intern
ation
al do
llars
Meat consumption per capita(left axis)
PPP GNI per capita(right axis)
Source: FAO Stat and World Bank Data.
In 2010, Russian consumers ate about 9.1 million tonnes of meat each year. This figure corresponds to about 64 kilograms per capita as compared with 52 kg per capita in 2005. Figure 19 describes the estimated per capita consumption of the main types of meat.

Russian Federation - Meat sector review
33
Figure 19: Per capita meat and meat products consumption in the Russian Federation, calculated in fresh meat equivalent, 2005-2010
Source: FSSS of Russian Federation, Meat Union of Russia and Meatinfo.
18.9
15.1
17.4
20.4
16.6
17.2
22.7
18.4
17.5
24.2
20.2
18.6
25.0
20.0
17.6
24.7
20.9
17.3
0.0
10.0
20.0
30.0
40.0
50.0
60.0
70.0
2005 2006 2007 2008 2009 2010
Other types of meatBeefPork
1.11.2
1.31.3 1.4 1.4
kg/y
ear
Poultry
According to official statistics, the share of other kinds of meat – such as lamb, mutton and rabbit – in overall meat consumption was not important.
Although meat consumption has increased considerably, it still has not reached the so-called “rational norm of consumption” (in Russian, рациональная норма потребления) of 75 kg per capita per year7 established by the Ministry of Health of the Russian Federation.
Compared with other countries (see Figure 6), the growth potential for meat consumption in the Russian Federation is significant. The growing urban population in the Russian Federation’s cities provided a big boost to the development of the retail market in the country; the growth of meat sales was one of the results of this change. Consumer preferences have also revealed the following main trends:
7 Order No. 593-n of 2 August 2010. “On approval of recommendations on rational norms of food products consumption corresponding to existing requirements of health nutrition.”

34
• consumers look for value-added cuts rather than whole birds;
• consumers tend to prefer chilled meat rather than frozen;
• beef is no longer a meat for everyday consumption, unlike in Soviet times;
• chicken meat has taken the place of beef in everyday diets;
• as the poultry meat market becomes saturated, pork consumption grows (including pork that is further processed into sausages, smoked meat, meat delicacies, etc. with a longer shelf-life);
• consumers’ increasing awareness of food safety issues (see Box 5 on food safety).
Seasonality of consumption
Each type of meat has its own seasonality of consumption, and the demand for meat derives from the final meat products consumption. Table 12 provides a summary of the main seasonal consumption patterns in the Russian Federation.
Table 12: Seasonal meat consumption patterns
Type of meat Product Season
Poultry Whole chickens Year-round + holidays
Poultry Chicken cuts Year-round + summer
Poultry Turkey Year-round, New Year’s Eve
Pork Bone-in Autumn-winter-spring (except during Lent)
Pork Half-carcass Year-round
Pork Boneless Year-round + holidays
Pork Neck (collar) Summer
Beef Year-round (less in summer)
Further processed Sausages, franks, hams Year-round
Further processed Delicacies Weekends and holidays
Source: Piter Consult, ROMIR and GFK research companies.
The seasonality of consumption also affects imports. The peak of meat demand falls in October, November and December. It coincides with the slaughter season for cattle and pigs in rural households and the upcoming New Year and Christmas festivities. Purchasing volumes consequently decline in January. The lowest consumption levels for all types of meat is registered during Great Lent, which

Russian Federation - Meat sector review
35
usually takes place in late February – early April, and late summer – early autumn (August and September) when the domestic market is abundant with less expensive fruits and vegetables.
Household disposable income and consumption patterns
The share of expenses on meat and meat products in the overall purchase basket decreased from 10.7 percent in 2006 to 9.6 percent in 2010 according to official statistics. However, compared to overall food consumption, which saw a decrease in expenditures from 43 percent in 2006 to 38 percent in 2010, meat share in consumer expenditures declined at a slower pace (see Table 13).
Table 13: Consumer expenditures in the Russian Federation, 2006-2010, percent (current prices)
Name of groups 2006 2007 2008 2009 2010
All goods and services 100.00 100.00 100.00 100.00 100.00
Food products 42.71 40.21 39.11 37.70 37.97
- incl. meat products 10.71 10.28 9.81 9.59 9.64
Non-food products 33.74 35.13 35.99 37.37 36.25
Services 23.55 24.66 24.90 24.93 25.78
Source: FSSS of Russian Federation.
On average, Russians spend about 8.1 percent of their total income on meat and meat products (see Table 14).
Table 14: Share of expenses on meat and meat products in household incomes, 2010
Index Units Allhouseholds
Incl. in urban areas
Incl. in rural
areas
Aggregate income per member of the household
RUR/month 12 688 14 357 10 129
Expenses for meat and meat products
RUR/month 1 034 1 094 869
Share of expenses for meat and meat products in aggregate income
percent 8.1 7.6 8.6
Source: Author/LMC International, based on calculations and estimates.

36
A significant share of food products consumed by households (vegetables, fruits, preserved and canned products, meat, dairy, eggs, etc.) often comes from their own production, especially in the case of households located in rural areas.
According to the official strategy of meat sector development, the consumption of meat and meat products is expected to reach 71.2 kg per capita by 2015 and 75.28 kg by 2020. Poultry is expected to lead the market with 38 percent on volumes, followed by pork (36 percent) and beef (23 percent), while other meat types will hold a marginal 3 percent. It should be noted, that this official forecast is based on recent domestic consumption trends, anticipated production growth and import substitution goals set by the Russian Federation. Its ultimate goal is to reach the “rational meat consumption norm” of 72 kg of meat per person per year. It is natural that these official forecasts exceed the mid-term forecasts presented earlier in this report as the latter also consider global macroeconomic development indicators that affect production, consumption and prices in the major producing and consuming countries.
Geography of poultry and livestock inventories
Meat production in the Russian Federation is mostly concentrated in the southwest and, to a certain extent, central parts of the country. Readers interested in more information on production structure, processing, investment and issues of the meat value chain in this important meat-producing region may also refer to the chapter on the meat food chain in southern Russian Federation in the FAO-EBRD Analysis of the Agribusiness Sector in southern Russian Federation9.
The highest concentrations of poultry inventories are in Central (29 percent), Volga (20.2 percent) and Southern (13.1 percent) Federal Districts (see Figure 20). The specific regions with the highest poultry stocks are Belgorod (10.1 percent), Rostov (5.4 percent) and Leningrad (5.1 percent).
8 78.6 kg according to the Russian Meat Union.9 http://www.fao.org/investment/tci-publications/publications-detail/en/c/165747/.

Russian Federation - Meat sector review
37
Figure 20: Share of Federal Districts in poultry inventories
Source: FSSS of Russian Federation.
Siberian
Ural
Volga
N. Caucasian Southern
N. Western
Central
Far Eastern
2%
29%
9%
13% 6%
20%
9%
21%
As pork production is mostly dependent on the availability of feed grains and protein meals, raising pigs is popular in the southwestern part of the Russian Federation (see Figure 21).
Figure 21: Geographical distribution of pig inventories in the Russian Federation, 2011
thd Heads0-440.1-90
90.1-160160.1-300
300.1-500over-500.1
Source: FSSS of Russian Federation.
The highest concentrations of pork inventories are in the Central (34.6 percent), Volga (21.4 percent) and Siberian (17.6 percent)

38
Federal Districts (see Figure 22). The regions with the highest pork stocks are Belgorod, Krasnodar and Tatarstan.
Figure 22: Share of Federal Districts in pig inventories
Central
Far Eastern
Siberian
Ural
Volga
N. Caucasian
Southern
N. Western
2 %
35 %
4 %
11 % 2 %
21 %
7 %
18 %
Source: FSSS of Russian Federation.
For many years, Belgorod Region has been the Russian Federation’s leader in development of industrial pork and poultry production. This is mostly owing to a favourable investment climate established in the region, which has attracted big projects and large agricultural holdings, in addition to the fertile soil and favourable climate.
Livestock farming is mostly concentrated in the southwestern part of the country. The largest cattle inventories are in the Volga (30 percent), Siberian (21 percent) and Central (14 percent) Federal Districts. Cattle farming is less popular in the Far Eastern (2 percent), Northwestern (4 percent) and Ural (6 percent) Federal Districts (see Figure 23 and Figure 24).

Russian Federation - Meat sector review
39
Figure 23: Geographical distribution of cattle inventories, 2011
thd heads0-100100.1-200
200.1-300300.1-500
500.1-900over 900
Source: FSSS of Russian Federation.
Figure 24: Share of Federal Districts in cattle inventories
Volga
N. WesternCentral
Siberian
Ural N. Caucasian
Far Eastern
Southern
14%
2%
11%
12%
30%
6%
21%
4%
Source: FSSS of Russian Federation.
Within the Russian federal districts, the leading regions in terms of cattle numbers are Bashkortostan (6.3 percent), Tatarstan (5.4 percent), Dagestan (4.5 percent) and Altai Territory (4.5 percent). Bashkortostan and Tatarstan primarily raise dairy cattle, while Dagestan raises cattle for beef. The majority of Dagestan’s cattle is concentrated in rural households; only 11.6 percent of cattle in

40
the region is in agricultural enterprises. The majority of cattle in specialized beef farms is concentrated in the Southern (42 percent), Siberian (18 percent) and Ural Federal Districts (12 percent)10.
Detailed information on poultry, swine and cattle inventories by each region and type of farm is provided in Annex 1.
Primary production efficiency
Poultry production performance indicators considerably increased in 2005-2010 thanks to improved feeding and technical modernization. In 2000, the average daily gain of broilers was 32 g. In 2010, it increased to 47 g. The feed conversion also improved from 2.70 kg to 1.85 kg of feed to produce 1 kilogram of broiler. The leading companies can achieve a feed conversation ratio of 1.78-1.76 kg, and the best farms manage to decrease it to 1.68 kg.
Despite certain improvements in live production performance, Russian poultry production is still far from being competitive with the major poultry producers, such as the USA, Brazil, Argentina and Thailand, without import measures (see Table 15).
Table 15: Broiler feed, live costs and processing wages compared to other countries
Broiler feedUSD/tonne
Cost live broiler
USD/kg
Processing wage (cost of
labour)USD/kg
USA 240 0.77 2 500
Brazil 260 0.71 400
Argentina 240 0.69 440
EU 390 0.92 3 000
Russian Federation 380 0.91 440
China 410 0.96 220
Thailand 340 0.86 250
India 300 0.85 100
Source: Rabobank, 2009.
10 Report of Ministry of Agriculture “On implementation of the program of meat cattle breeding,” 2010 data.
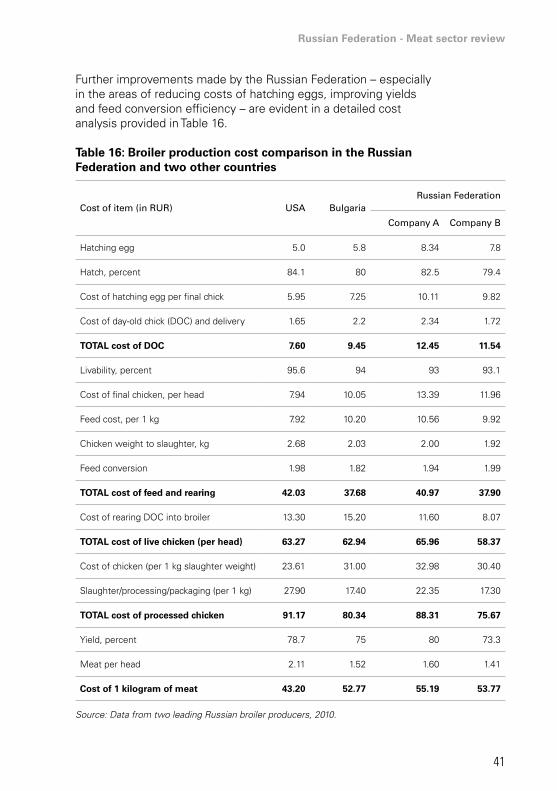
Russian Federation - Meat sector review
41
Further improvements made by the Russian Federation – especially in the areas of reducing costs of hatching eggs, improving yields and feed conversion efficiency – are evident in a detailed cost analysis provided in Table 16.
Table 16: Broiler production cost comparison in the Russian Federation and two other countries
Cost of item (in RUR) USA BulgariaRussian Federation
Company A Company B
Hatching egg 5.0 5.8 8.34 7.8
Hatch, percent 84.1 80 82.5 79.4
Cost of hatching egg per final chick 5.95 7.25 10.11 9.82
Cost of day-old chick (DOC) and delivery 1.65 2.2 2.34 1.72
TOTAL cost of DOC 7.60 9.45 12.45 11.54
Livability, percent 95.6 94 93 93.1
Cost of final chicken, per head 7.94 10.05 13.39 11.96
Feed cost, per 1 kg 7.92 10.20 10.56 9.92
Chicken weight to slaughter, kg 2.68 2.03 2.00 1.92
Feed conversion 1.98 1.82 1.94 1.99
TOTAL cost of feed and rearing 42.03 37.68 40.97 37.90
Cost of rearing DOC into broiler 13.30 15.20 11.60 8.07
TOTAL cost of live chicken (per head) 63.27 62.94 65.96 58.37
Cost of chicken (per 1 kg slaughter weight) 23.61 31.00 32.98 30.40
Slaughter/processing/packaging (per 1 kg) 27.90 17.40 22.35 17.30
TOTAL cost of processed chicken 91.17 80.34 88.31 75.67
Yield, percent 78.7 75 80 73.3
Meat per head 2.11 1.52 1.60 1.41
Cost of 1 kilogram of meat 43.20 52.77 55.19 53.77
Source: Data from two leading Russian broiler producers, 2010.

42
The performance indicators of the Russian poultry industry leaders are close to the national industry average because they have a considerable share of big industrial broiler producers in overall poultry production. The share of inefficient farms is low and does not have much influence on the average (see Table 17).
Table 17: Key broiler production performance indicators in the Russian poultry industry, 2010
Indicator Company 1 Company 2 Russian Federation average
Cycles (turnovers), per year 7.4 7.8 7.2
Chicks hatch, percent 75.9 81.5 80.2
Livability, percent 92.8 93.4 93.1
Average grow-out period, days 37.5 39.5 41
Meat yield, percent of live weight
74.4 80.7 73.3
Feed conversion adjustedto 2 000 g of live weight
1.85 1.86 1.87
Average daily gain, g 53.3 54.2 47
Source: Confidential data from two companies and state programme “Development of poultry farming in the Russian Federation for 2010-2012 and till 2018-2020”.
It is anticipated by Russian industry players that by 2020 a broiler will gain more than 56 grams per day, feed conversion will stabilize at 1.82 kg and mortality will decrease to no more than 5 percent of chicks entering production. The grow-out period will greatly depend on the specific marketing strategies of individual companies.
Along with genetics, there is significant potential for improvement in feeding and nutrition. Almost all Russian chicken farms lack expertise, but those who understand the value of a properly balanced feed diet have outsourced this service to the specialized experts/consultants.
It is also expected that the Russian poultry industry will continue to consolidate and experience a series of mergers and acquisitions

Russian Federation - Meat sector review
43
that will increase its vertical integration and improve its capacity to acquire modern cost-saving production technologies through new investment and management. Please refer to a separate section in this report on industry concentration issues (Chapter 5) and comparisons with other countries.
In 2005-2010 the growth of key pork performance indicators of agricultural enterprises was considerable (see Table 18). Inefficient producers went bankrupt or were acquired by more successful competitors. A recent massive investment in new pork production facilities has improved basic production indicators because of improved genetics, feeding, vaccination and herd management technologies.
Table 18: Key pork performance indicators of agricultural enterprises, 2005-2010
Indicator 2005 2006 2007 2008 2009 2010
Average live weight of pigs, kg per head 107 121 121 139 160 159
Average daily weight gain of pigs, g 310 328 335 385 414 439
Source: FSSS of Russian Federation.
Considering the geographical vastness of the Russian Federation and the various types of pig farms and their sizes, it is natural that performance indicators vary depending on the type of farm (see Table 19).
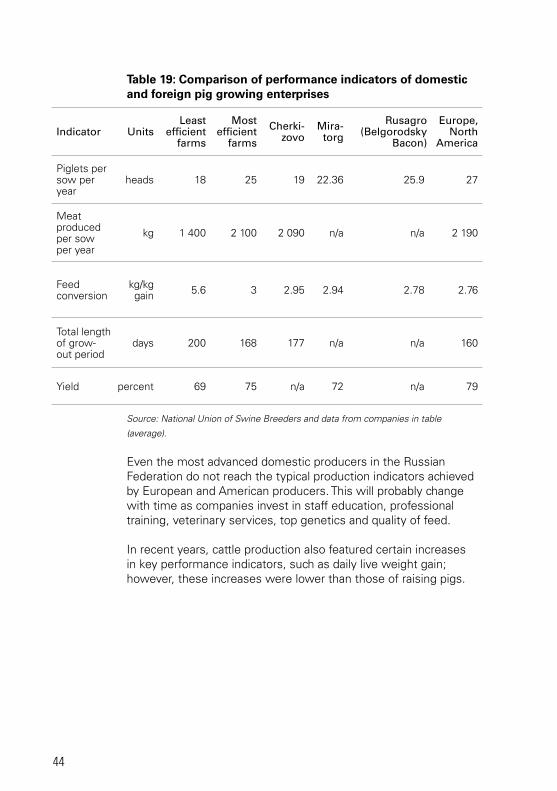
44
Table 19: Comparison of performance indicators of domestic and foreign pig growing enterprises
Indicator UnitsLeast
efficient farms
Most efficient
farms
Cherki-zovo
Mira-torg
Rusagro (Belgorodsky
Bacon)
Europe, North
America
Piglets per sow per year
heads 18 25 19 22.36 25.9 27
Meat produced per sow per year
kg 1 400 2 100 2 090 n/a n/a 2 190
Feed conversion
kg/kg gain 5.6 3 2.95 2.94 2.78 2.76
Total length of grow-out period
days 200 168 177 n/a n/a 160
Yield percent 69 75 n/a 72 n/a 79
Source: National Union of Swine Breeders and data from companies in table
(average).
Even the most advanced domestic producers in the Russian Federation do not reach the typical production indicators achieved by European and American producers. This will probably change with time as companies invest in staff education, professional training, veterinary services, top genetics and quality of feed.
In recent years, cattle production also featured certain increases in key performance indicators, such as daily live weight gain; however, these increases were lower than those of raising pigs.

Russian Federation - Meat sector review
45
Table 20: Key performance indicators of cattle meat production in agricultural enterprises, 2005-2010
Indicator 2005 2006 2007 2008 2009 2010
Meat production per one head of cattle, kg 93 100 102 109 114 112
Average daily gain on feed, g 414 437 445 478 503 501
Source: FSSS of Russian Federation.
Within agricultural enterprises, live weight of cattle at the time of slaughter grew by 20.4 percent, and the average daily gain on feed increased by 21 percent as well.
Indicators of weight gain may considerably vary from one region to another. However, considering that there are no leading beef producers, it was not possible to compare the leading and less efficient farms in the cattle sector. The significant regional differences in production efficiency indicators in raising cattle are listed in Table 21.
Table 21: Average, daily gain of calves of beef breeds in selected regions, grams
Region Under 8 months
Older than 8 months Total
Orenburg Region 555 327 419
Chelyabinsk Region 705 519 575
Republic of Kalmykia 611 207 375
Source: All-Russia Research Institute for Beef Cattle Breeding of the Russian Academy of Agricultural Sciences.
It is expected that with increased government support to the meat sector and the introduction of new genetics and production technologies, productivity indicators will improve. However, it is not certain to what extent the public support in this sector will improve its competitiveness with imports.

46
Profitability of meat production: costs and margins
Information on private companies’ profitability is usually difficult to obtain. However, some companies disclose their financial statements and economic performance data in corporate annual reports. Table 22 provides a summary of available information on profitability of meat production by leading Russian companies in 2010.
Table 22: Meat sector profitability
Company Broiler production Swine production Cattle production
EBITDA* margin in 2010, percent
Miratorg - 45.16 -
Cherkizovo Group 21.2 40.6 -
Rusagro 18** 42 -
Eurodon - - -
Average sector 15 25*** -17****
Source: Companies’ data and the Report of the Minister of Agriculture to the Presidium of the State Council on discussion and adoption of the Strategy of meat livestock till 2020, given on 13.07.2010.
* EBITDA is an indication of earnings before interest expense, taxes, depreciation and amortization. EBITDA margin is EBITDA divided by total revenue.
** Turkey operation.
*** According to the Russian Pork Producers Union, the average pig production profitability in 2011 was 17 percent with more effective producers receiving 25 percent returns.
**** Including state subsidies. The negative profitability would have been 23 percent per year without state support.
Profitability of meat production varies considerably depending on the region. According to the 2010 national report “On the progress and results of the implementation of the State programme of agricultural development and regulation of markets for agricultural products, raw materials and food for 2008-2012”, the profitability of poultry production exceeded 20 percent in the Republic of Komi, Tatarstan, Amur, Kurgan, Kursk, Lipetsk, Moscow, Omsk, Penza, Tver and Tomsk Regions.
Pork production was the most profitable (over 30 percent margin per year) in Belgorod, Volgograd, Irkutsk, Kaliningrad, Leningrad, Lipetsk, Orel, Omsk, Penza, Tambov, Tomsk and Chelyabinsk

Russian Federation - Meat sector review
47
Regions and the Republics of Mari El and Tuva. The only two regions with profitable cattle production were Kalmykia and Karachaevo-Cherkessia. Beef production in all the other regions of the Russian Federation was unprofitable. Annex 5 provides more information on meat production profitability in various regions of the Russian Federation.
The compound feed prices directly affect meat production profitability. Figures 25 to 30 compare average prices for meat products with the prices of animal feeds in poultry, pork and beef production.According to available data, the ratio of feed-to-poultry-meat price increased from 13 percent in 2005 to almost 18 percent in 2010 with a peak (21.7 percent) registered during price increases in 2008 (see Figure 25). These percentages indicate a decreasing operating profitability of poultry meat production with time.
Figure 25: Comparison of average poultry meat prices (live weight) with poultry feed prices, 2005-2010
45 07543 350
39 82240 813
54 230
52 966
12.9 14.216.1
21.717.1 17.7
0
10 000
20 000
30 000
40 000
50 000
60 000
2005 2006 2007 2008 2009 20100
5
10
15
20
25
30
35
40
45
50
RU
R/t
on
ne
(exc
l. V
AT
)
percen
t
5 276 5 639 6 9609 770 9 257 9 362
Poultry (left axis)
Combined feed for poultry (left axis)
Comparison of feed price to product price (right axis)
Source: FSSS of Russian Federation.
However, when comparing monthly averages of meat and feed prices (with January 2005 fixed at 100 percent), it becomes apparent that feed prices tend to be more volatile and outpace increases in poultry meat prices. Feed prices registered a nearly 200 percent increase from January 2005 to January 2011 while poultry meat prices increased by about 150 percent (see Figure 26).

48
Figure 26: Monthly indices of average prices for poultry (live weight) and feed for poultry, 2005-2010
50
75
100
125
150
175
200
225
250
Jan
200
5
per
cen
t
May
200
5
Sep
200
5
Jan
200
6
May
200
6
Sep
200
6
Jan
200
7
May
200
7
Sep
200
7
Jan
200
8
May
200
8
Sep
200
8
Jan
200
9
May
200
9
Sep
200
9
Jan
201
0
May
201
0
Sep
201
0
Poultry meat Combined feed for poultry
Source: FSSS of Russian Federation.
Note: January 2005 =100 percent.
Similarly to decreased poultry producers’ margins, the ratio of feed-to-pork price increased from 9 percent in 2005 to 14 percent in 2010 with a peak registered in 2008 (see Figure 27).
Figure 27: Comparison of average pork prices (live weight) with pig feed prices, 2005-2010
Source: FSSS of Russian Federation.
50 420 51 821 49 051
60 988
69 263 69 748
4 574 4 825 5 850 8 248 7 094 7 231
9.1 9.611.6
16.414.1 14.3
0
10 000
20 000
30 000
40 000
50 000
60 000
70 000
80 000
2005 2006 2007 2008 2009 20100
5
10
15
20
25
30
35
40
45
50
Pigs (left axis)
Combined feed for pigs (left axis)Comparison of feed price to product price (right axis)
RU
R/t
on
ne
(exc
l. V
AT
)
percen
t

Russian Federation - Meat sector review
49
Comparisons of the changes in monthly price indices (with January 2005 prices fixed at 100 percent) show trends very similar to the decreasing poultry margins: feed prices registered a nearly 200 percent increase from January 2005 to January 2011, while pork prices increased by about 150 percent (see Figure 28).
Figure 28: Monthly indices of average prices for pork (live weight) and feed for pigs, 2005-2010
RU
R/t
on
ne
(exc
l. V
AT
)
Pig meat Combined feed for pigs
50
75
100
125
150
175
200
225
250
Jan
200
5
May
200
5
Sep
200
5
Jan
200
6
May
200
6
Sep
200
6
Jan
200
7
May
200
7
Sep
200
7
Jan
200
8
May
200
8
Sep
200
8
Jan
200
9
May
200
9
Sep
200
9
Jan
201
0
May
201
0
Sep
201
0
Source: FSSS of Russian Federation.
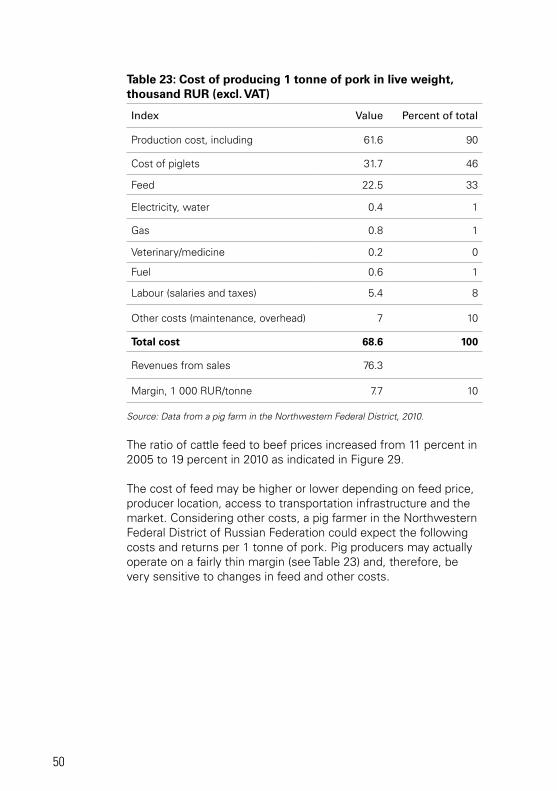
50
Table 23: Cost of producing 1 tonne of pork in live weight, thousand RUR (excl. VAT)
Index Value Percent of total
Production cost, including 61.6 90
Cost of piglets 31.7 46
Feed 22.5 33
Electricity, water 0.4 1
Gas 0.8 1
Veterinary/medicine 0.2 0
Fuel 0.6 1
Labour (salaries and taxes) 5.4 8
Other costs (maintenance, overhead) 7 10
Total cost 68.6 100
Revenues from sales 76.3
Margin, 1 000 RUR/tonne 7.7 10
Source: Data from a pig farm in the Northwestern Federal District, 2010.
The ratio of cattle feed to beef prices increased from 11 percent in 2005 to 19 percent in 2010 as indicated in Figure 29.
The cost of feed may be higher or lower depending on feed price, producer location, access to transportation infrastructure and the market. Considering other costs, a pig farmer in the Northwestern Federal District of Russian Federation could expect the following costs and returns per 1 tonne of pork. Pig producers may actually operate on a fairly thin margin (see Table 23) and, therefore, be very sensitive to changes in feed and other costs.

Russian Federation - Meat sector review
51
Figure 29: Comparison of average prices for beef (live weight) and cattle feed, 2005-2010
54 371
10.6 10.814.6
20.817.4 18.7
0
10 000
20 000
30 000
40 000
50 000
60 000
2005 2006 2007 2008 2009 20100
5
10
15
20
25
30
35
40
45
50
Cattle(left axis)
RU
R/t
on
ne
(exc
l. V
AT
)
percen
t
55 951
45 641
7 074 5 912 6 366
34 003
39 235
3 606 3 669 4 963
Comparison of feed priceto product price (right axis)
Combined feed for cattle(left axis)
41 762
Source: FSSS of Russian Federation.
Monthly indices of beef and feed prices (as compared with January 2005) indicate that the increase in beef price outpaced that of the feed price in January 2005-May 2007 and then again in December 2008-September 2010. However, this did not result in farmers rebuilding their cattle herd because of the overall low profitability of raising cattle.
Figure 30: Average beef price indices in live weight and feed for beef, 2005-2010
Beef Conbined feed for cattle
per
cen
t
50
75
100
125
150
175
200
225
250
Jan
200
5
May
200
5
Sep
200
5
Jan
200
6
May
200
6
Sep
200
6
Jan
200
7
May
200
7
Sep
200
7
Jan
200
8
May
200
8
Sep
200
8
Jan
200
9
May
200
9
Sep
200
9
Jan
201
0
May
201
0
Sep
201
0
Source: FSSS of Russian Federation.

52
Table 24 illustrates some production costs in beef cattle. It is difficult to assess overall profitability of beef cattle as there is not much evidence yet in the country. The table below does not reflect the significant costs in acquiring the start-up Hereford cattle and the long payback period on such an investment.
Table 24: Illustrative cost of producing one tonne of Hereford cattle in live weight, thousand RUR (excl. VAT)
Item Index Value
1 Production cost, including 56
1.1 Labour (salaries and taxes) 17.4
1.3 Compound feed 30.1
1.4 Hay 4.6
1.5 Haylage 1.91.6 Corn silage 1.2
Other costs (maintenance, fuel, etc.) 13.5
2 Total cost (excluding beef calves) 69.5
3 Revenues from sales 90.9
Source: Farm data from Ural Federal District, 2010.
Common production technologies
Russian meat producers have been able to improve their production efficiency and quality of products and reduce production costs in recent years. However, most of them still need substantial capital investment and skilled professional labour and management. Meat production in the Russian Federation is still largely based on the Soviet-style concept of production formerly known as kolkhoz (or a collective farm) and sovkhoz (or a state farm).
In many cases, especially in poultry and pork production, production facilities are concentrated in one company, with very little specialization between farms, which outsources feed production and services.
Dairy farms are the main producers of beef. A number of farms have small feedlots that are used both for dairy cattle feeding and combined meat-and-milk calf breeding.
A detailed description of most typical production technologies and their main considerations, such as housing or grazing technology,

Russian Federation - Meat sector review
53
feeding, manure utilization, slaughter, processing, chilling and other production technology aspects is available in Annex 3.
Feed availability and production
Because feed costs may reach 40-50 percent of the total livestock and poultry production costs, availability of a reliable and reasonably priced feed supply is an important business consideration. Barley, feed wheat, sunflower seed meal, maize and soybean meal are the main sources of plant proteins used in compound feed production for poultry and pigs. The role of fishmeal and bone meal is less important in Russian feed production.
Feed supply has largely depended on the weather and grain and oilseed production conditions in the main agricultural regions. According to feed consumption, estimated in Figure 31, there has been a clear upward trend in feed protein consumption.
Figure 31: Estimated consumption of feed protein from main cereals and oilseed meals, 2001-2012
2016
1 084
1078
272 290 306 442 524 663 718757 862
10031 088293 350 322 391 423 452 429
439464
481510
108 194 270252
279 315
405 288
252351
tho
usa
nd
to
nn
es
5 000
4 500
4 000
3 500
3 000
2 500
2 000
1 500
1000
500
0
Maize Meal, soybean
1 5601 500
1 507 1 287 1 199 1 298 1 1501 353 1 337
6051 177
1 800 1 632 1 788 1 6921 840 1 944 1 920 1 860
Barley Wheat Meal, sunflower seed
2002
/03
2003
/04
2004
/05
2005
/06
2006
/07
2007
/08
2008
/09
2009
/10
2010
/11
2011
/12
86
Source: Authors’ calculations based on USDA PSD online (www.fas.usda.gov/
psdonline/psdQuery.aspx).
Note: The following protein content was assumed for conversion purposes: 11 percent
for barley; 9 percent for maize; 12 percent for wheat 46 percent for soybean meal and
33 percent for sunflower seed meal.

54
There is also a clear upward trend in compound feeds production for livestock and poultry feeding. According to the First Independent Rating Agency (FIRA), the volume of Russian compound feed production in 2010 totaled 16 million tonnes, which is 64 percent more than in 2005. Starting in 2005, compound feed production has been increasing by about 10 percent p.a. on average (see Figure 32).
Figure 32: Production of compound feed in the Russian Federation, 2005-2010
Source: Information-analytical system FIRA PRO.
10 011
11 39012 464
31 75014 712
16 155
0
2 000
4 000
6 000
8 000
10 000
12 000
14 000
16 000
18 000
2005 2006 2007 2008 2009 2010
tho
usa
nd
to
nn
es
The Russian Federation’s Ministry of Agriculture believes that the actual feed production could have been higher if the feeds produced within the integrated meat production companies (e.g. compound feeds that are produced and consumed within one company) were taken into consideration. They accounted for 40 percent of total registered production. Therefore, total feed production in the Russian Federation was believed to actually total approximately 28 million tonnes in 2010.
The increase in the compound feed production was first of all driven by higher demand from the poultry and pork production sectors. Compound feed for poultry constituted the major share (57.7 percent) of total compound feed production in 2010. The feeds for pigs and cattle accounted for 25.8 percent and 13.3 percent respectively (see Figure 33).

Russian Federation - Meat sector review
55
Figure 33: Structure of compound feed production, 2010
Feed produced for poultry
Feed produced for cattle
Feed produced for other animals
Feed produced for pigs58%
26%
13%
3%
Source: FIRA PRO.
As shown in Figure 31, local compound feed is characterized by a large content of cereals. While the compound feed in Europe usually contains no more than 45 percent of grains, the grain content in the Russian Federation reaches 70 percent. This is mostly owing to a relatively low share of protein meals (soybean and sunflower seed meal) available in the Russian Federation. Though there was a slight increase in domestic soybean meal and cake output, current soybean meal production levels do not meet the increasing demand from feed manufacturers, leaving space for meal imports. Soybean meal is usually imported from Brazil or transported from the soybean processing facility Sodruzhestvo located in Kaliningrad.
The following major feed-related issues are faced by Russian livestock producers:
• purchased feeds usually cost 15-30 percent more than the feeds produced by the mills integrated into poultry production complexes;
• outsourced feeds have poor traceability;
• outsourced feed supplies are inconsistent and delivery schedules are not respected;
• independent feed mills do not provide consistent and reliable quality feed;
• they often use cheap and low quality soybean and fish meal;
• feed can often have mycotoxins.
Among the issues related to the production of cattle (both beef and dairy), certain issues exist with the forage (hay, silage, etc.)

56
production, including cattle grazing on low-productive natural pastures; cutting grass beyond the optimum stage negatively affecting nutritional value of hay and its digestibility); and inefficient conservation and storage (especially in the case of late silage and haylage preparation and storage losses).
Box 3: Feed quality issues
Feed quality is one of the main concerns for livestock and poultry producers as it directly affects animal and poultry productivity and health. Many independent feed producers, being concerned by feed costs and their margins, often fail to supply quality feeds to their buyers. Many compound feed producers do not have adequate technical capacities to assure a uniform quality mix of feed ingredients, premixes and additives.
As a result, lack of trust to external feed suppliers prevails amongst livestock and poultry producers. Many of them decide to invest in their own feed production facilities to assure reliable supplies. Many agroholdings have thus become leading feed producers in their respective regions.
The GOR has recently updated the old Soviet compound feed standards to facilitate industry development. In July 2011, the Soviet-time state standard GOST 12220-96 ("Toasted soybean meal for feeds"), which envisaged that only 45 percent crude protein soybean could be used in compound feed production, was replaced with a new GOST R 53799-2010. The new standard allows compound feed producers to utilize six different protein levels (from 42 percent to 54 percent crude protein) in production of compound feeds.
The list of specific compound feed standards effective in the Russian Federation is provided in Annex 4.
Animal health issues
In the Russian Federation, animal health falls under the responsibility of the Rosselkhoznadzor (Federal Service for Veterinary and Phytosanitary Surveillance), and Rospotrebnadzor (Federal Service on Customers’ Rights and Human Well-being) focuses on overall food safety issues for all food products.
Animal and poultry diseases represent a major threat to potential investors in the livestock and poultry production due to their devastating potential. Therefore, we decided to cover some of these issues as they affect sector development.
Recent outbreaks
In the last decade, the Russian Federation’s livestock production has been challenged by a series of animal disease outbreaks that have had a high level of production and financial impact, such as:

Russian Federation - Meat sector review
57
• cattle: foot-and-mouth disease (FMD);
• poultry: AI;
• pork: African swine fever (ASF).
Foot-and-mouth disease (FMD). FMD has been historically endemic in many regions of the Russian Federation, though in the last 20-30 years outbreaks were very sporadic and were controlled by quick responses from veterinary authorities. In 2010-2012, there were at least 15 outbreaks of FMD in Trans-Siberia, Primorsky Krai and Irkustk Oblast that affected thousands of cattle, pigs, goats and sheep. According to genetic analysis, these recent cases of FMD were related to the FMD outbreaks in China, Mongolia and Eastern Kazakhstan in 2010-2011. Elimination of border controls between Kazakhstan and the Russian Federation – both in the Customs Union – makes cross border veterinary inspection and control more difficult.
Avian influenza. This disease was registered in the Russian Federation in 1978. It occurred again in 2005-2006 and affected a few Russian regions as shown in Figures 34 and 35.
Figure 34: AI outbreaks in the Russian Federation, 2005
62 affected sites in 10 regions of Russia Died - 26844, destroyed 609250 birds One affected commercial layers farm in Kurgan region In Kalmykskaya Republic and Astrakhan region (colored in yellow) restriction measures were implemented in villages located close to migratory stations of waterfowl to prevent the spread of the virus to poultry
Source: All-Russia Scientific Research Institute of Animal Protection.

58
Figure 35: AI outbreaks in the Russian Federation, 2006
Total: 93 affected sites in16 territories of Russia Total losses inpoultry have notexceeded 1.400.000 birdsAs of 1 August1 site in Tomskayaoblast was stillunder quarantine
No new casessince 5 July
Source: All-Russia Scientific Research Institute of Animal Protection.
The Russian veterinary services, the federal government and local authorities took unprecedented measures to prevent further expansion of AI outbreaks, including:
• strict quarantine regime introduced in affected areas;
• backyard flocks were preventively culled;
• the state compensated financial losses to the population;
• several vaccines were developed and applied to selected flocks (over 150 million doses);
• a national monitoring programme for pathological material of wild birds was implemented.
There have been no outbreaks in commercial or backyard flocks in the Russian Federation since early 2007, and several positive cases of low-pathogenic AI antibodies were revealed as a result of monitoring migrating birds.
African swine fever. ASF started spreading throughout the Russian Federation in August 2008, from Krasnodar Region and North Ossetia; supposedly it came from Georgia. According to estimates of Rosselhoznadzor, ASF was registered in 24 regions of the Russian Federation. It affected 254 settlements and 37 production facilities.

Russian Federation - Meat sector review
59
About 440 000 pigs were slaughtered in order to control the outbreak. According to various estimates, pork farms lost about 10 percent of production because of this pandemic.
Figure 36: Map of AFS outbreaks in the Russian Federation
ASF OUTBREAKS(2 MARCH 2012)
Source: All-Russia Scientific Research Institute of Animal Protection (VNIIZZH).
The North Caucasus Federal District and South Federal District are considered to be an endemic (unfavourable) zone for ASF, and the disease can easily spread from a single infected animal outside the endemic zone.
In early 2012, the veterinary authorities reinforced controls (see Figure 36.). As of 1 March 2012, rural households in the Krasnodar Region were prohibited to raise more than three pigs for finishing. Implementation of the new rules is likely to be difficult; however, the local authorities continue to promise to assist pork farmers in developing alternative livestock production activities.
ASF is considered the main threat to the Russian Federation’s livestock sector as farmers and local authorities often do not declare outbreaks to veterinary authorities immediately, biosecurity on rural household farms and some industrial farms is not observed and animals enter into contact with wildlife and the geographical vastness complicates animal quarantine provisions.

60
Chapter 4 - meat processing
Recent trends in meat processing
There have been notable shifts in the structure of the Russian meat market, including shrinking beef consumption in favor of poultry meat; progressive exit of rural households from the market; and an increased supply of fresh and chilled meat replacing frozen products.
Formally registered meat and processed meat products in the Russian Federation doubled from 2005 to 2010, reaching 3.9 million tonnes of fresh meat and by-products (see Table 25). Though there was outstanding growth in the pork and poultry sector of 137 percent and 139 percent respectively in 2005-2010, beef production registered a 23 percent decrease.
Table 25: Industrial production of main meat products in the Russian Federation, 2005-2010, thousand tonnes
Product type 2005 2006 2007 2008 2009 2010Change2010 vs.
2005
Fresh meat and by-products: 1 857 2 185 2 561 2 899 3 441 3 888 109%
-Beef 327 303 284 278 252 251 -23%
-Pork 337 405 502 502 666 800 137%
-Poultry meat and by-products
1 141 1 424 1 721 2 067 2 426 2 729 139%
-Other types of meat 13 13 12 11 13 16 23%
-By-products 39 39 42 41 84 92 136%
Sausages and cooked meats 2 014 2 198 2 411 2 454 2 246 2 388 19%
Further processed meat products
987 1 093 1 254 1 451 1 503 1 614 64%
Standard cans, million* 549 523 521 580 690 651 19%
Source: FSSS of Russian Federation, Meat Union of Russia and Meatinfo.
* Net weight of one standard can is 350 g.
Russian Federation - Meat sector review
61
Production of precooked meat products increased by 64 percent during the period of 2005-2010 (see Table 25) to reflect an urbanizing population, higher incomes in the cities, new lifestyles and expansion of retail, hotel, restaurant and catering services (HORECA) that demand more value-added products in convenient packaging.
The appetite of Russian consumers for sausages has always been high and continues to grow (19 percent from 2010 to 2005). It is worth noting that sausages take the fourth place in consumers’ food basket after dairy, vegetables and fruits and bakery products.
The most popular sausage products according to the biggest Russian meat processing company, Cherkizovo, include:
• bologna sausages (Doktorskaya) – 38 percent;
• franks sausages (sosiski) – 27 percent;
• smoked sausages – 18 percent;
• other categories – 12 percent.
After overcoming the economic recession of 2008-2009, Russian consumers started buying more sausages and meat products, thus stimulating production. As Russian consumers switched to more expensive sausage products, the share of smoked sausage production increased, and the share of bolognas and franks declined. As a result, the whole sausage segment grew by 18 percent reaching 2.4 million tonnes in 2010. However, locally produced products in this segment have started losing ground to foreign competitors as the quality of Russian sausages has decreased. With weak technical regulations and enforcement (as compared with the European regulations that measure animal protein) and aggravated by the financial crisis, many meat processors started adding less meat to the recipes in order to cut down on raw material costs.
The meat-canning segment is traditionally important in the Russian Federation as the government maintains intervention stocks of beef and pork. Today the canned meat sector faces certain challenges as fresh, chilled (and frozen) meat become available as well as value-added meat products. We still note some growth in this segment featuring 18.6 percent increase from 549 million standard cans in 2005 to 651 million in 2010. However, in the pre-crisis years (2006- 2010) there was a slight decline in canned meat production.

62
Since the early 2000s, halal meat has been rapidly gaining importance in the Russian Federation. Today, there are over 2.3 million Muslims in the country. The International Centre under the Russia Muftis Council certifies about half of halal meat. Halal production is concentrated not only in Moscow but also in the south of the Russian Federation, in the North Caucasus and Volga Regions. This new category in the meat sector has grown considerably in recent years; by the end of 2010 there were 57 halal-certified meat-processing facilities across the country, and the share of halal products in the poultry subsector is about 6.5 percent.
Food safety issues
Meat consumption will be increasingly affected by consumer awareness of food safety and quality issues as competition increases in the domestic market. It is expected that this increasing awareness will lead towards increased food safety standards of the major retail chains and food service companies in the Russian Federation. An increase in standards will inevitably require livestock and poultry producers and meat processors to invest in both introduction of the traceability systems and modern food safety control programmes.
Box 4 illustrates some food safety issues by using the case of salmonella prevalence in the poultry meat sold in retail in the Russian Federation.

Russian Federation - Meat sector review
63
Box 4: Meat safety and quality: the need for continuous improvement
The Russian Federation introduced new standards (GOSTs or GOSTs-R) for chicken meat, turkey, pork and beef in 2007-2011 to update the standards that were developed in the 1970s-1980s to regulate both the quality and the food safety aspects of meat and meat products in the Soviet Union. The list of the new meat standards is provided in Annex 4: Applicable State Standards in the Russian Federation.
The major Russian meat producers started introducing modern quality and safety standards in the early 2000s. Some companies implemented the ISO 9001/02 systems, Good Manufacturing Practices, ISO 22000, ISO 14000 and the hazard analysis at critical control points (HACCP). In the Russian Federation, HACCP received the status of a National Standard in 2003, though the Russian version appears to be much shorter than the standards approved in the USA and the EU.
As of early 2012, about 30 percent of the Russian slaughterhouses and the prime and secondary meat processing facilities had HACCP systems in place that conformed with the Russian regulations, though only a handful of them were certified by an international HACCP certification body. This is mostly due to lack of understanding of the HACCP system, professional consultants, and financial resources required for HACCP implementation and consistent effort from management.
Currently, specific food safety indicators are regulated by the Sanitary Norms and Rules (SANPIN), developed and approved by the Ministry of Health of the Russian Federation. Adherence to SANPIN is controlled by the Federal Service for Surveillance in the Area of Consumer Rights Protection (RosPotrebNadzor) and Federal Service of Agricultural and Phytosanitary Surveillance (RisSelkhozNadzor). Russian sanitary regulations, especially requirements for antibiotics and feed additives, are often criticized by the country’s trading partners as not being based on scientific evidence and risk assessment.
Certain compliance issues exist domestically as not all meat producers meet national food safety regulations and norms. This is especially true for the bacteriologic and maximum residue levels. In 2011, research* on salmonella prevalence on chicken meat in the Russian Federation – conducted in three regions: Moscow Oblast, Leningrad Oblast and Krasnodar Krai (with a total of 698 samples) – indicated that salmonella prevalence was 31.5 percent on whole birds. This indicator typically ranges around 4-16 percent in the USA and the EU. The same research suggested that strategies, such as good agriculture and management practices, should be enhanced to improve food safety of chicken meat in the Russian Federation.
* Alali WQ, Gaydashov R, Petrova E, et al. Prevalence of Salmonella on retail chicken meat in Russian Federation. J Food Prot. 2012 Aug;75(8):1469-73.

64
Marketing channels
According to the Federal State Statistics Service (FSSS), most domestically produced meat is marketed to processing companies (63.3 percent) and wholesale traders (21.8 percent). About 6.8 percent of meat production is purchased by the State, 4.1 percent is sold through retail and another 3.3 percent is channeled through HORECA. Barter and supplies that pass via consumer cooperatives are negligible (see Table 26).
Table 26: Marketing channels of food products, 2010
Marketing channel Thousand tonnes Percent
Processors 3 613.7 63.3
Wholesalers 1 247.0 21.8
Organizations making purchases for state needs 390.1 6.8
Retail stores, branded stores, street kiosks 232.9 4.1
HORECA 190.1 3.3
Barter (exchange operations) 33.3 0.6
Consumer cooperatives 4.9 0.1
Total 5 712.1 100.0
Source: FSSS of Russian Federation.
Meat holds an anchor position in the retail food market. In 2010, about 68 percent of meat and meat products were sold through retail stores. In 2010, retail turnover of meat and meat products in the Russian Federation reached RUR 1 264 billion (about USD 39 billion), and this trend is expected to grow by 30-35 percent in the upcoming years thanks to new openings (see Table 27).

Russian Federation - Meat sector review
65
Table 27: Retail sales by sector, 2006-2010, million USD
Channel format 2006 2007 2008 2009 2010Change 2010/09
Change 2010/06
Store retail 195 285 250 341 308 116 248 457 292 575 17.8% 49.8%
Grocery retailers 106 825 139 808 176 415 155 811 188 760 21.1% 76.7%
Food/drink/tobacco specialized stores
3 555.9 4 422.4 5 052.7 4 355.8 5 162.9 18.5% 45.2%
Hypermarkets 6 509.9 10 559.9 15 709 14 315.4 18 066 26.2% 177.5%
Small grocery retailers: 37 562.8 47 955.6 59 211.2 52 987 62 969.5 18.8% 67.6%
- Convenience stores 3 051.1 4 694.1 6 260.5 6 136.3 7 331 19.5% 140.3%
- Forecourt retailers 319.3 374.9 420.8 331.4 400.3 20.8% 25.4%
- Small independent grocers
34 192.4 42 886.6 52 529.9 46 519.4 55 238.1 18.7% 61.6%
Supermarkets 38 275.8 50 954.8 64 886.3 57 269.6 71 703 25.2% 87.3%
Other grocery retailers 20 920.4 25 915.2 31 555.7 26 882.6 30 858.9 14.8% 47.5%
Source: FSSS of Russian Federation.
Large retail chains (like X5-Retail Group, Magnit, Seventh Continent, Dixie, Auchan and German Metro AG) have been shaping the meat market by setting rules for suppliers. Local producers are not always ready to address the requirements regarding quality standards, in particular traceability, packaging and high marketing budgets. Retail chain expansion has also entailed the fast development of a distribution infrastructure. If not economically efficient, small and medium retail stores leave the market. Markups in Auchan go from 0 to 17 percent, while street kiosks and small shops take up to 30-35 percent.
Besides the traditional retail stores (supermarkets, hypermarkets, grocery stores and convenience stores), frozen meat is also marketed through open markets (small wholesale), fresh meat through farmers’ markets and processed meat products (sausages, franks, hams, delicacies) through branded company stores.
Marketing channels differ significantly across the country: in the big cities the retail share is higher and the share of markets, non-chain stores, small stores and kiosks is lower than in smaller

66
towns and rural settlements. On average, modern retail trade sells 30 percent of all meat and meat products. In Moscow, this indicator is about 50 percent, and in Saint Petersburg it is about 80 percent.
Meat processing efficiency: costs and returns in the meat processing sector
As a rule, major meat processing factories not only provide full processing of raw materials (from slaughter to packaged meat products) but also have a clear tendency for increased production capacities. This is largely due to the tightening environmental regulations that require meat processing facilities to build efficient sewage treatment plants. According to VNIIMP (All-Russia Meat Processing Research Institute), the share of a wastewater treatment facility in total meat processing factory investment costs may be as follows:
• 7 percent for a new 100 tonne/shift meat processing facility;
• 10 percent for a 30 tonne/shift establishment;
• 30 percent for a small slaughterhouse with a daily production capacity of 2 tonnes/shift.
High-capacity meat processing facilities (over 100 tonnes/shift) provide higher meat yields and may increase processors’ margins by adding value to slaughter by-products, such as the production of meat and bone meal from animal carcasses after the meat is removed. Experts estimate the average payback period of the meat processing industry to be 4-7 years. The typical costs of a meat processing plant are provided in Table 28.

Russian Federation - Meat sector review
67
Table 28: Cost breakdown of producing one tonne of boneless meat products
Item Index RUR thousand (excl. VAT) Percent
1 Production costs, including 166.6 85
1.1 Raw meat 143.2 73
1.2 Other ingredients 15.4 8
1.3 Core production staff wages 6.2 3
1.4 Other 1.9 1
2 Overheads, maintenances, etc. 30.5 15
3 (1+2) Total cost 197.1 100
4 Revenues from sales 212.2 -
5 (4-3) Margin per tonne 15.1 8
Source: Data from a meat processing plant in Northwestern Federal District (capacity
of ten thousand tonnes of meat per year) as of 2011.
The profitability of meat production is also largely determined by the size of specific consumer groups and their products preferences. For example, the production of hard smoked sausages and delicacy meats can be much more profitable than the production of cooked sausages, frankfurters and wieners. However, the share of the former in total sales usually does not exceed 3-5 percent, depending on the region or city.

68
Chapter 5 - meat market concentration
The top five meat producers
Among the meat subsectors, poultry plays a leading role in terms of concentrated production. The top five companies control 36.6 percent of the Russian industrial poultry output (see Table 29 and Figure 37).
Table 29: Top five producers of poultry meat in the Russian Federation, 2010
Ranking Company
Poultry production,
slaughter weight,
thousand tonnes
Poultry production
share, percent
Meat market share,
percent
1 JSC Prioscoliye 355.2 14.1 10.1
2 Cherkizovo Group 194.1 7.7 5.5
3Agroholding
BEZRK-Belgrankorm
148.8 5.9 4.2
4 Prodo Group 146.4 5.8 4.2
5 JSC Belaya Ptitza 78.0 3.1 2.2
Total 922.5 36.6 26.2
Source: Russian Poultry Union.

Russian Federation - Meat sector review
69
Figure 37: Share of the top five producers in total commercial poultry meat production, 2010
37%
63%
Other producers
Top five producers
Source: Russian Poultry Union and companies’ data.
The biggest Russian turkey producers are Evrodon, Krasnobor, Sibirskaya Guberniya, M. Gaufuri and Egoriyevskaya Farms.
The detailed profiles of the leading producers of poultry meat can be found in Annex 7.
Raising pigs has a lower level of production concentration than poultry. In 2010, the top five producers generated an estimated 29 percent of the total pork output (see Table 30 and Figure 38).
Table 30: Top five producers of pork, 2010
Ranking Company
Pork production, slaughter
weight, thousand tonnes
Pork production
share, percent
Meat market share,
percent
1 APH Miratorg 137.6 8.4 4.6
2 GK Agro-Belogorie 100 6.1 3.4
3 Cherkizovo Group 87.6 5.4 2.9
4 PRODO Group 77.43 4.8 2.6
5 GK RUSAGRO 61.9 3.8 2.1
Total 464.53 28.5 15.6
Source: National Union of Pig Growers and companies’ data.

70
Figure 38: Share of the top five producers in total commercial pork production, 2010
Top five producers
Other producers
29%
71%
Source: National Union of Pig Growers and companies’ data.
Detailed profiles of the leading pork producers are given in Annex 7.
In contrast with poultry and pork, beef production has very low concentrations of production in the Russian Federation. The five leading producers supply only 3.3 percent of the total beef production volume (see Table 31 and Figure 39). This can be explained by the fact that beef production requires large areas of agricultural land for feed production that constrain the size of livestock farms.
Table 31: Top five producers of beef, 2010
Ranking CompanyCattle production, slaughter weight, thousand tonnes
Cattle production
share, percent
Meat market share, percent
1 AKGUP (Promyshlenny) 5 0.9 0.2
2 JSC (Agrocomplex) 4-5 0.8 0.2
3 OAO “KRASNY VOSTOK AGRO” 4 0.7 0.2
4 OAO (Agrofirma Mtsenskaya) 3 0.5 0.1
5 OAO “Belorechenskoe” 2-2.5 0.4 0.1
Total 18-19.5 3.3 0.8
Source: Companies’ data.

Russian Federation - Meat sector review
71
Figure 39: Share of the top five beef producers in commercial beef production, 2010
Other producers
97%
3%
Top five producers
Sources: Companies’ data and authors’ calculations.
The largest beef livestock farms (with over 3 million head) are Limited Liability Company (LLC) Warsaw in Chelyabinsk Region; Open Joint-Stock Company (OJSC), PKZ Zimovnikovsky in Rostov Region; SPK Ergeninsky in the Republic of Kalmykia; JSC, Plant Breeding named after Arashi Chapchaev in the Republic of Kalmykia; LLC, Center of Genetics, Angus, in Kaluga Region; SPK Fedoseevskiy in Rostov Region; and JSC PP, Progress in Rostov Region.
Sales of beef from meat cattle are currently very low. The biggest producer generating revenues in this segment is All Beef in the Lipetsk Region.
Leading meat brands
Branding is traditionally more developed in the processed meat product segment of the market: sausage products, delicacies and ready-to-cook and ready-to-eat processed products like meat dumplings, meat ravioli, meatballs, nuggets and patties. Chilled and frozen meats are also sold under trademarks; some are sold under the private labels of supermarkets. In the wholesale trade, especially when products are sold on a live weight basis or as half carcasses, the name of the slaughter enterprise is often referred to as a brand.

72
The leading brands of poultry meat (sales, in value) are:
• brands of GC Prioskolye: Prioskolye, Picnics Prioskolya, Al Safa and Coco Pulet11;
• brands of the Cherkizovo Group: Petelinka, Kurinoe tsarstvo, Mosselprom, Vasilevka and Domashnyaya kurochka;
• brands of BEZRK-Belgrankorm: Yasnye zori and Kurinyj korol12;
• brands of the Prodo Group: Troekurovo and RoKoKo.
Leading brands of pork (sales, in value) are:
• Miratorg13;
• Agro-Belogorie Group of Companies: Dal’nie Dali and Agro-Belogorie;
• Cherkizovo Group.
Leading brands of beef (sales, in value) are:
• Klin Meat Plant (owned by the Prodo Group);
• Meat and poultry plant Penzensky (belongs to Cherkizovo Group);
• Ulyanovsk meat farm (owned by Cherkizovo Group).
A list of the leading meat brands is available in Annex 6.
The top five meat processors
The Russian meat processing sector is characterized by rather low consolidation due to vast distances, consumers’ preferences for local and regional producers and trademarks, lack of processors’ capacity to market and manage federal brands and different conditions of production assets.
The leading meat processors are concentrated in the main pork and poultry producing regions, such as Belgorod Oblast, Moscow Oblast, Leningrad Oblast, Krasnodar Krai, Voronezh Oblast, Tatarstan and Lipetsk Oblast (see Figure 40).
11 This manufacturers meat processing sector also has brands like Fly de Lunch (food made of poultry meat: burgers, kebab, fillets, etc.), Slavnaya marka (sausages and cooked products), and chicken specialties.
12 Brand Rural Traditions was designed for the sausage segment.13 Included in the meat processing sector of this manufacturer is the brand Gur
Mama (nagetsy chicken, burgers, steaks, fillets and chicken pieces).

Russian Federation - Meat sector review
73
Figure 40: Number of meat processing plants*, 2009
70
60
50
40
30
20
10
0Volga
Center
South
Caucasus
North West
UralsNorth
Far East
per
cen
t
Source: FSSS of Russian Federation.
*Minimum plant capacity is 20 tonnes of finished product/day.
The following main trends of slaughterhouses and meat processing facilities have been observed:
• cattle and swine slaughterhouses and the main processing facilities are close to meat production areas;
• poultry slaughter and processing are concentrated around poultry farms throughout the Russian Federation;
• further meat and poultry processing and value-addition are concentrated around big cities.
The main meat processing facilities are located in Moscow (17.2 percent) and in the Moscow Oblast Region (8.5 percent). Regional concentration of meat processing facilities is low; 43 percent of all processing facilities in 2009 were concentrated in the regions that have less than 2 percent of the total distribution (see Table 32).

74
Table 32: Leading meat processing regions, 2009, percent
Russian Federation 100
Moscow 17.2
Moscow Oblast Region 8.5
Krasnodar Territory 4.1
Vladimir Region 3.8
Saratov Region 3.8
Pskov Region 2.8
Republic of Bashkortostan 2.7
Leningrad Region 2.5
Tyumen Region 2.4
Chelyabinsk Region 2.4
Novosibirsk Region 2.4
Sverdlovsk Region 2.2
Rostov Region 2.1
Others (regions that have less than 2%) 43.1
Source: FSSS of Russian Federation.
The Ostankisnky meat processing factory and Cherkozivo Group were the two largest meat processors in 2010. Only two more companies produced above 100 000 tonnes of meat products each in 2010 (see Table 33).
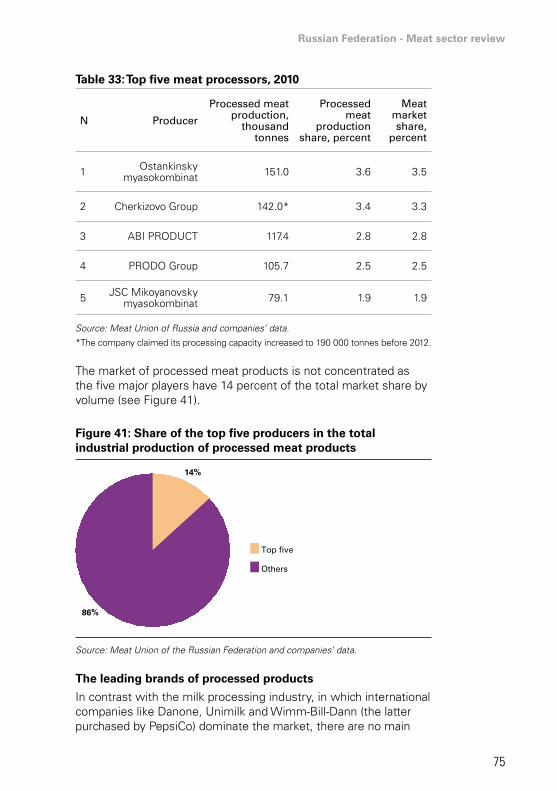
Russian Federation - Meat sector review
75
Table 33: Top five meat processors, 2010
N Producer
Processed meat production,
thousand tonnes
Processed meat
production share, percent
Meat market share,
percent
1 Ostankinsky myasokombinat 151.0 3.6 3.5
2 Cherkizovo Group 142.0* 3.4 3.3
3 ABI PRODUCT 117.4 2.8 2.8
4 PRODO Group 105.7 2.5 2.5
5 JSC Mikoyanovsky myasokombinat 79.1 1.9 1.9
Source: Meat Union of Russia and companies’ data.
*The company claimed its processing capacity increased to 190 000 tonnes before 2012.
The market of processed meat products is not concentrated as the five major players have 14 percent of the total market share by volume (see Figure 41).
Figure 41: Share of the top five producers in the total industrial production of processed meat products
Others
Top five
86%
14%
Source: Meat Union of the Russian Federation and companies’ data.
The leading brands of processed products
In contrast with the milk processing industry, in which international companies like Danone, Unimilk and Wimm-Bill-Dann (the latter purchased by PepsiCo) dominate the market, there are no main

76
foreign meat market players in the Russian Federation, with an exception of the Atria Group, which owns KampoMos and Pit-Product brands. The information on the top brands in the Russian meat market and their estimated value is provided in Table 34.
More information on specific meat brands and their short profiles can be found in Annex 6.
Table 34: Top three brands in the meat processing industry
N Sales volume (billion RUR)
Brand cost (million USD)
Share of consumer preference, percent
1OstaNkino (22.5),
Ostankinsky myasokombinat
Mikoyan (86), Mikoyanovsky
myasokombinat*
Mikoyan (24.1), Mikoyanovsky
myasokombinat
2 Cherkizovsky (12.9), Cherkizovo Group**
Cherkizovsky (77), Cherkizovo Group
Dymov (14.1), Dymov sausage
production***
3Tsaritsyno (10.5),
GK TsaritsynoOstaNkino (49),
OAO Ostankinsky myasokombinat
OstaNkino (12.6), Ostankinsky
myasokombinat
Source: Forbes, 2010, Rubrand 2011 and “Favorite brands of Russians” 2011.
* This producer has one more brand: Okhotniy ryad that produces fine-food where
food is handmade using long-standing technologies.
** Fine food has the labels Pyat zvezd and Imperiya vkusa. Economy-class sausage
production has the label Myasnaya guberniya.
*** Fine food labels are Vysokaya kukhnya, Piccolini and Dymov N°1, and the
economy class label is Shchedrino.
Sector consolidation trends
This sections covers the most significant mergers and acquisitions in the meat sector of the Russian Federation in 2010-2011. Please refer to a separate section in this report on recent investment trends in the meat industry by each subsector.

Russian Federation - Meat sector review
77
Meat production
In 2011, the Cherkizovo Group bought 100 percent of the assets of the Mosselprom agricultural holding. The Mosselprom business was valued at USD 252.9 million. Due to this deal, Cherkizovo hopes to increase its market share of domestic producers of poultry meat. The Cherkizovo Group also acquired the LLC poultry farm Zarechnaya, located in the Penza Region. The total value of the transaction amounted to USD 5.2 million.
The Agroholding Komos-Group (Udmurtia) purchased 100 percent of the shares of Mendeleyev Poultry Farm from the administration of Perm Region for RUR 76 million. JSC Mendeleev Poultry Farm produces and markets hatching eggs, DOCs and commercial eggs. In 2009, the poultry farm produced 130 million eggs.
In May 2010, the largest agro-industrial holding in the Tomsk Region, JSC Siberian Agricultural Group, bought the Tomsk Poultry Farm belonging to JSC Sibirskaya guberniya (included in the Krasnoyarsk agricultural holding ALPI) for RUR 1.5 billion. Production of broiler meat will increase 1.5 times, up to 30 000 tonnes per year.
In June 2011, JSC Agrocomplex bought the Tbiliskaya Poultry Farm for RUR 60.5 million. JSC Poultry Breeding Tbilisi is located in the village Lovlinskaya in the Tbilisi District (Krasnodar Territory). The company produces and sells eggs and produces meat and crops. It is also involved in egg incubation and the breeding and sale of day-old chicks.
In 2011, the JSC GAP Resource acquired JSC Stavropol Broiler for USD 120 million (estimated) from Interros Group. The production capacity of the complex is estimated at 45 000 tonnes of broiler meat per year.
Further growth in the poultry industry will be determined by local demand and the level of consolidation in the market. According to Rabobank, the potential for further consolidation in the Russian poultry industry is significant as compared with the industry’s potential for growth (see Figure 42). It is assumed that in countries where domestic market growth potential is low and industry concentration is high companies will start looking for export opportunities.

78
Figure 42: Poultry industry production growth and consolidation rates in selected countries, 2010-2020
China
Thailand
RussianFederation
Brazil
US
EU
60 50 40 30 20 10 0 10 20 30 40 50 60
percent
Consolidation rate Production growth
Source: Crossroads for Growth: the International Poultry Sector Towards 2020,
Rabobank, 201114.
In the fourth quarter of 2010, the Cherkizovo Group bought from the NAPCO Group 100 percent of the Penza Grain Company and the Lipetskmyaso company shares (pig-breeding farms located in Lipetsk and Penza Districts) for USD 100 million.
JSC Siberian Agricultural Group acquired from LLC Group Sinara a 75 percent stake in JSC Meat concern Kamensk-Ural (Micom). The same group acquired 100 percent of the pig complex Polevskoye shares for the purpose of building a vertically integrated agricultural holding company, LLC Pig Complex Ural in the Urals.
In January 2012, LLC Russian Dairy Company (RUSMOLKO) and the company Olam International signed an agreement on a strategic partnership. The main result of their joint efforts will be investing USD 800 million in the Russian Federation’s dairy industry over eight years. RUSMOLKO, which, having a sufficiently large population of cattle, may be one of the largest producers of beef in the future.
14 https://www.rabobankamerica.com/content/documents/Rabobank_Crossroads_for_Growth_September2011.pdf.

Russian Federation - Meat sector review
79
Meat processing
The Cherkizovo Group bought the meat processing plant Otechestvenny Product in the Kaliningrad Region for USD 4.1 million. The group also absorbed the debt of the acquired company (USD 1.7 million). The group plans to focus on delicacy products such as smoked meat, hams, salamis and cooked sausage products. The plant has high potential owing to its location in the free economic zone with certain customs preferences.
EGO-Holding gained control (51 percent of shares) of Kornshtadt meat processing plant (KMPP) for USD 15 million. The business plans to return KMPP to the first place in the market in the coming years.
JSC Siberian Agricultural Group acquired 75 percent of the stakes in JSC Meat concern Kamensk-Ural (Micom) from LLC Group Sinara in order to vertically integrate it into the agricultural holding LLC Pig Farm Ural.
The rise of agroholdings
The Russian meat sector is formed by a multitude of companies, the majority of which are vertically integrated holdings. These holdings are often parts of larger financial groups that also do business in other sectors of the economy. The major Russian agroholdings involved in meat production produce feed grains to make their own compound feed, raise livestock and poultry, have slaughter and meat processing facilities and engage in meat marketing.
In 2011, there were more than 250 agroholdings in the Russian Federation that farmed on 15.5 million hectares of arable land (there are 113 million hectares in the country). About 40 agroholdings farm on more than 100 000 hectares each15. The biggest agroholdings operating in the meat sector are Mirtorg Agroholding, Cherkizovo Group and BEZRK-Belgrankorm.
Miratorg Agroholding
The company began operating in the mid-1990s as a meat importer. By 2000, it had established a joint venture with Sandia, a Brazilian company, in meat processing in the Russian Federation.
15 D.Rylko, Director of IKAR “Russian New Agricultural Operators (Agroholdings): Emergence, Performance, and Impact on the Domestic and World Agriculture and Agribusiness (https://moel.uni-hohenheim.de/fileadmin/einrichtungen/moel/ Downloads/Rylko_Russian_Agroholdings_Oct_2011.pdf).
80
Following the introduction of the TRQs on meat imports in mid-2000, the company engaged in domestic pork production. The company farms about 150 000 hectares16 .
Along with its subsidiaries, the holding is engaged in the production of grain and compound feed for animals; pork production; livestock slaughtering and meat processing; production of ready-to-cook food; and transportation. The company’s products include cutlets, dumplings, chilled and frozen fish and seafood, frozen vegetables, lasagna, pizzas, poultry, salami and spring rolls. It also operates a network of cold storage facilities, as well as distributes food products to retail chains, processing plants and the food service sector. The company is based in Moscow with offices in Saint Petersburg, Kaliningrad, Belgorod, Yekaterinburg and Rostov-on-Don. Miratorg Agribusiness Holding operates as a subsidiary of Agromir Limited.
Cherkizovo Group
The Cherkizovo Group is a leading Russian, vertically integrated, agroholding company with operations spread across the full production cycle from feed production and breeding to meat processing and distribution. The holding company was formed in 2005 through a merger of the Cherkizovsky and the Michailovsky agro-industrial groups.
Cherkizovo Group is a publicly listed company quoted on the London Stock Exchange (LSE: CHE17 and RTS/MICEX). It is the largest meat manufacturer in the Russian Federation and one of the top three companies serving the Russian Federation’s poultry, pork and meat processing markets.
The company is also the country’s largest producer of fodder. The group includes:
16 Ibid.17 http://www.londonstockexchange.com/exchange/prices-and-markets/stocks/
summary/company-summary.html?fourWayKey=US68371H2094USUSDIOBE.

Russian Federation - Meat sector review
81
• seven full-cycle poultry production facilities, with a total capacity of 400 000 tonnes in live weight p.a.;
• 14 modern pork production facilities with a total capacity of 180 000 tonnes in live weight p.a.;
• six meat processing plants with a total capacity of 190 000 tonnes p.a.;
• six fodder plants with a total capacity of 1.4 million tonnes p.a.;
• grain storage facilities with a total storage capacity exceeding 500 000 tonnes;
• a land bank exceeding 100 000 hectares.
In 2012, Cherkizovo’s consolidated revenue exceeded USD 1.5 billion, and its net profit amounted to USD 225 million. Within the last five years alone, Cherkizovo has invested more than USD 1 billion into the development of the Russian Federation’s agriculture sector.
BEZRK-Belgrankorm
This agroholding is comprised of 18 production units of different specializations and integrated around feedstuff production since 1987. This integration lowers the production costs of poultry and pork. Since 1998, when its meat production business line was launched, BEZRK-Belgrankorm has been developing fast to become one of the biggest broiler meat producers in the Russian Federation, employing over 1 000 people. The company produces high quality compound granular and expanded fodder, as well as pork, broiler meat and eggs, milk, processed meat products and pre-prepared foods.
Short profiles of major meat producers in the Russian Federation are provided in Annex 7.
Key financial indicators of agroholdings and their benchmarks compared with world producers
Despite a relatively low level of industry consolidation and various issues faced by Russian meat producers, the key financial indicators largely compare favorably with those of the global meat producers and, to a certain extent, look even more favorable in the future (see Table 35).

82
Tab
le 3
5: K
ey f
inan
cial
ind
icat
ors
of
wo
rld
mea
t p
rod
uce
rs, 2
011-
2013
EP
SP
/E
EV
EB
ITD
AE
V/E
BIT
DA
Net
D
ebt
Net
Deb
t/LT
M E
BIT
DA
2011
2012
2013
2012
2013
2012
2013
2012
2013
Tyso
n Fo
ods,
USA
1.89
2.02
2.31
8.9
7.8
7 99
81
833
1 99
64.
44.
01
466
0.8
Pilg
rim’s
Prid
e2.
130.
650.
9110
.67.
53
198
453
539
7.1
5.9
1 43
2-8
.6
San
ders
on F
arm
s, U
SA-5
.47
2.96
4.91
17.3
10.4
1 43
217
023
58.
46.
127
4-3
.0
Bra
sil F
oods
, Bra
zil
1.
822.
142.
4815
.913
.718
970
1 92
32
272
9.9
8.4
2 80
81.
8
Mar
frig
, Bra
zil
-1.5
60.
290.
4038
.528
.06
827
1.00
31
164
6.8
5.9
4 61
84.
8
CP
Foo
ds, T
haila
nd2.
382.
753.
1613
.511
.710
868
1.04
51
210
10.4
9.0
1 46
22.
3
DaC
han
Food
, Chi
na0.
19N
/AN
/AN
/AN
/A23
1N
/AN
/AN
/AN
/A-1
39-0
.5
LDC
, Fra
nce
7.05
7.17
7.93
12.0
10.8
992
226
225
4.4
4.4
70.
0
Che
rkiz
ovo,
Rus
sia
3.44
2.95
3.12
4.4
4.2
1 49
931
935
14.
74.
371
83.
0
MH
P, U
krai
ne2.
282.
312.
695.
85.
02
302
426
491
5.4
4.7
802
2.0
Sou
rce:
Blo
ombe
rg, 2
012
as r
epor
ted
by R
abob
ank*
.
* R
abob
ank
Poul
try
Qua
rter
ly: O
utlo
ok fo
r G
loba
l and
Reg
iona
l Mar
kets
, Apr
il 20
12 h
ttp:
//ww
w.r
abob
ank.
de/u
ploa
ds/m
edia
/Rab
oban
k_Po
ultr
y201
2_01
.

Russian Federation - Meat sector review
83
Recent investments in the meat sector
The Russian meat sector has been recently experiencing an investment boom thanks to growing demand and state support programmes. According to our estimates, based on available information on the ongoing and planned investments in 2009-2014, it is clear that poultry production has been a leading subsector, attracting about 44 percent of all investments in the meat sector (see Table 36). Investments in the poultry sector were mainly focused on rehabilitation and construction of new plants and facilities.
Information on poultry investment projects, investors, regions, declared investment value, anticipated production capacity and starting year are provided in Annex 8.
Considering the ongoing boom in domestic broiler meat production, as well as the fact that poultry production facilities are usually located close to main consumption centers, we built an investment model to assess profitability of a potential start up broiler meat production in Far East Russia. Box 5 contains the main findings of our analysis, and Annex 9 contains information on the main variables and assumptions and describes their sensitivity to changes in key variables.

84
Box 5: Investment in broiler meat production in the Russian Federation: low profitability with high sensitivity to risks
The potential investment considered in this analysis was located in the Far East Russia. It envisaged construction of a large-scale broiler meat production with a capacity to produce up to 7.6 million broilers per year. The total investment needs for this project were assessed at RUR 1.1 billion.
The results of this model showed that with a nine year discounted payback period and a 10 percent p.a. discount rate in Russian roubles (RUR), this investment promises to be marginally profitable with the following main financial results: positive net present value (NPV) of RUR 0.5 billion; internal rate of return (IRR) of 15 percent (as compared with the discount rate of 10 percent used in the calculations).
Although these results show potential profitability, this investment was very sensitive to changes in the key variables. For instance, the feed costs, which are the major cost to poultry producers, can be highly volatile in recent years. In our investment model, a 10 percent increase in compound feeds prices from the levels anticipated in the model (RUR 12.48 per one kilogram of compound feed) changed investment profitability to be negative.
From this perspective, investment in broiler meat production can be a rather risky business in the Russian Federation, especially, considering long payback period and other risks, such as poultry diseases. However, the same is true for broiler meat producers in other countries as they also face the same constraints and tend to operate on low margins.
Improved feed conversion rates, on the other hand, would help increase returns on investment in broiler meat production in the Russian Federation. For instance, the feed conversion rate assumed in our model was 1.92 kilogram of compound feed per 1 kg of broiler weight. If the feed conversion rate would be reduced to 1.75 kilogram of feed – the result already achieved by some companies in Russian Federation – this start up investment would show the following profitability results: NPV of RUR 0.8 billion; IRR of 18 percent; discounted payback period of 8 years.
Pork and beef were the second and third subsectors, attracting USD 2.4 billion and USD 1.1 billion of investments respectively (33 percent and 15 percent of the total of meat sector investments) according to our estimates (see Table 36).
Construction of new livestock complexes has been a major objective for national and regional governments. More information on specific investment projects in this subsector can be found in Annex 10.According to the Ministry of Agriculture, in 2009-2010 beef cattle inventories increased by 409 100 heads as Russian farmers built and modernized 168 facilities for beef cattle production. These new production sites run over 60 000 heads of cattle. The leaders in this new subsector were the Republic of Kalmykia, Altay Kray,

Russian Federation - Meat sector review
85
Republic of Bashkortostan and Bryansk Region. Farmers invested in construction of new barns as well as purchase of beef cattle.
Annex 11 contains short descriptions of the recent investment projects in the beef sector.
It should be also noted that the recent global economic recession has forced some agricultural companies to review their ambitious business expansion plans and put some meat projects on hold. For instance, the Russian Farms Group postponed the construction of a RUR 3.5 billion dairy farm in Lipetsk Region; Miratorg suspended its cattle meat project in Bryanks Region; the Rubezh Group cancelled the planned expansion of the Myasnye delikatesy meat processing plant in Saint Petersburg; and Optifood Group postponed its poultry project in the Rostov Region.
Meat processing
The meat-processing sector was estimated to attract about USD 537 million in investments, based on the information provided in Table 37. It should be noted that the information on investments provided in this table was gathered through open information sources. Considering the low levels of concentration in the meat processing industry, it is likely that these estimates of investments are somewhat underestimated.

86
Table 37: Recent investments in meat processing facilities
Name and brief project description
Implementing company (holding)
Region Investment, million
USD
Starting year
Project at full
capacity
1Slaughter and processing
plant for beef cattle operation
Prodcontract Group
Republic of
Kalmykia
166.7 (total for vertically
integrated complex)
20103rd quarter
2012
2
New meat processing plant in Gorelovo with a
daily capacity of 90 tonnes of hot dogs, sausages and
cooked sausages under the brand Pit-product.
Atria GroupLeningrad
Region93.3 2010
3
Construction of a slaughterhouse for cattle
in Ramonsky District with a capacity of processing
and cutting 30 heads of cattle per hour (hph), expandable to 50 hph.
The project involves creation of the genetic
center of Aberdeen Angus and Hereford and feedlots for 20 thousand animals. The total project
cost is RUR 6 billion (USD 200 million).
ZarechnoeVoronezh
Region10 (estimate) 2011 2012
4
Slaughter and prime processing plant with a
capacity of 22.5 tonnes of chilled pork meat per day. The company targets the
retail market of Russia.
LLC GC Agro-Belogor’e
Belgorod Region
117 2009 2009
5
Commissioning of slaughter and primary
processing of pork with full capacity of 2 million
heads.
AIH MiratorgBelgorod
Region150-200
estimate2009
Source: Author/LMC International, based on calculations and estimates.

Russian Federation - Meat sector review
87
Chapter 6 - meat trade
Imports and exports of meat and meat products
Imports
Imports of meat and edible meat offal decreased from 3.3 million tonnes in 2007 to 2.4 million tonnes in 2012, or by 27 percent. This was largely because of a drastic 64 percent decrease in poultry meat imports. Prior to 2010, poultry meat was the main kind of meat imported into the Russian Federation. It is now third after pork and beef. Imports of edible meat offal for further processing have been quite stable at about 300 000 tonnes per year (see Figure 43).
The most notable increase was in chilled beef imports, which responded to growing consumer demand for quality beef cuts. Imports of chilled beef almost doubled from 21 000 tonnes in 2007 to 41 000 tonnes in 2012 (see Figure 43). Pork imports, despite a short drop in 2009-2011, increased again in 2012. In 2012, the Russian Federation imported 7 percent more pork than in 2007. This was largely due to increased imports in July-December 2012 due to lower import tariff protection following the Russian Federation’s accession to the WTO.

88
Figure 43: Imports of meat and meat products, 2007-2012
3 50021
20
20
36
12
41
307321
1 2871 218
247267
298
291273
256
266
280
292
289
713791
606 567624 585
948650
404 470
672 791 641 657636 720
3 000
2 500
2 000
1 500
1 000
500
02007 2008 2009 2010 2011 2012
0201 Beef
0206 Edible meat offal 0202 Beef (frozen)
0209 Pig/ Poultry fat
0207 Poultry (fresh and frozen)
0203 Pork (fresh and frozen)
tho
usa
nd
to
nn
es
Source: Russian Customs Committee as reported by the Global Trade Atlas.
In value terms, the Russian meat import bill increased from USD 5 billion in 2007 to 7 billion in 2012 (up 38 percent), largely due to increases in beef import volumes and prices. Beef is the most important meat in the structure of meat imports. The structure of meat imports into the Russian Federation in 2012 is provided in Figure 44.

Russian Federation - Meat sector review
89
Figure 44: Structure of the value and quantity of imported meat products, 2012
1 00
90
80
70
60
50
30
20
10
40
0
2 583
2 407
707
474460219396
737
2741273
289
470
585
Value,million USD
Quantity,thousand tonnes
Pig/poultry fat
Edible meat offal Pork (fresh and frozen)
Beef (frozen)
Beef (chilled)
Poultry (fresh and frozen) Other kinds of meat
per
cen
t
Source: Russian Customs Committee as reported by the Global Trade Atlas.
The declining trend in poultry imports is due not only to the reduced quota but also to the restrictions on chlorine content in meat, which the Russian Federation implemented following the EU on 1 January 2010. This regulation has effectively restricted imports from the USA.
There is a pronounced seasonality of meat imports due to the Russian Federation’s specific consumption patterns: high demand before the seasonal festivities and low demand during Lent. Import tariff-rate quota is another factor affecting distribution of imports throughout the year. Usually the government starts issuing import licenses for 25 percent of the annual quota volume in mid-January; therefore, the import shipments arrive in February-March. May and June see high sales because of summer picnics and barbeques. And the last months of the year register the biggest imports as importers rush to use their quotas and build the stocks for December-February sales.

90
Figure 45: Major importers of meat to the Russian Federation, 2010-2012, average
Others
Australia
United States of America
Uruguay
Paraguay
Brazil
16%
Beef
7%
7%
12%
14%
44%
Canada
Brazil
Germany
United States of America
Denmark
Others
23%17%
Pork
11%
10%
15%
24%
Argentina
United States of America
Brazil
Ukraine
France
5%
6% 2%
Poultry
32% 55%
Source: Russian Customs Committee as reported by the Global Trade Atlas.

Russian Federation - Meat sector review
91
Annex 12 contains detailed official Russian trade statistics for all main meat producers by value, quantity of imports and exports, average product values, main suppliers and monthly trade series. As can be seen from Figure 45, major exporters of meat to the Russian Federation are the USA (poultry, pork, beef), Brazil (poultry, pork, beef), the EU (live pigs, pork, mechanically separated poultry, beef), Canada (pork, by-products), Australia, Uruguay and Paraguay (all beef).
The bulk of imported poultry (over 85 percent) goes into retail and is mainly sold on open markets and in small stores in rural areas. About 10 percent is further processed, and the rest is marketed through retail as further processed products. Almost all imported beef and pork is frozen (beef at 98 percent, pork at 99.5 percent), and most of it (over 80 percent) goes for further processing. Importers enjoy steady demand for these products from processors thanks to a consistent quality and lower prices compared to similar domestic products.
Exports
The Russian Federation doesn’t export any meat except for poultry. These exports have grown, if on a small scale, in the category of chicken by-products (feet) that is largely requested by South-East Asia (mostly Hong Kong). The Russian Federation has also traditionally supplied its neighbors in the Commonwealth of Independent States (CIS); however, the quantities of meat exports to those countries are marginal (see Figure 46).
Figure 46: Meat exports from the Russian Federation, 2007-2012
5
0
10
15
20
25
2007 2008 2009 2010 2011 2012
tho
usa
nd
to
nn
es
Other meat products0207 Poultry meat 0210 Meat & Ed Offal Salted, Dried Etc. & Flour & Meal
Source: Russian Customs Committee as reported by the Global Trade Atlas.

92
Russian meat is higher priced than the meat from its competitors. Some minor shipments of meat for ship crews, military bases and offshore, state-owned production facilities also get recorded in the official exports statistics.
The National Livestock Development Strategy until 2020 sets the goal for exporting 400 000 tonnes of poultry and 200 000 tonnes of pork by 2020. However, it is doubtful these export targets will be met as domestic meat prices remain well above other suppliers. Since there is still some room for domestic beef and pork market growth, these should probably be the primary areas for addressing domestic competitiveness issues.
However, the Russian Federation still may increase exports of poultry meat to Central Asia, Caucasus (Armenia and Azerbaijan) and niche markets in Asia. But the Russian producers will need to tackle constraints for poultry exports, which include (i) high production costs, (ii) improved microbiological contamination indicators (see Box 4 on salmonella prevalence), (iii) absence of veterinary agreements with the majority of target countries, and (iv) development of a traceability system.
Exports and imports of processed meat products
The value of further processed meat products imported into the Russian Federation (salami, ham, sausage and other products falling under the codes 1601 and 1602 of the Harmonized System [HS]) increased as compared with 2010, while the Russian Federation’s exports of the same products to the traditional markets in the former Soviet Union decreased (see Table 38). The Russian Federation imports mostly pork-based sausages and different kinds of hams from the EU.

Russian Federation - Meat sector review
93
Table 38: Imports and exports of processed meat products, 2010-2012
Commodity (HS Code) and trade flow
Description Main
Million USD Percent change
2010 2011 2012 2012/2011
1602, ImportPrepared or
preserved meat, meat offal
Spain, Germany,
France, Hungary
119 197 172 44
1601, Import Sausages, similar product meat, etc.
Lithuania, Spain, Latvia,
U.S.27 54 69 157
1602, Export Prepared or preserved meat,
meat offal
Turkmenistan, Azerbaijan,
Georgia14 15 15 2
1601, Export Sausages, similar product meat, etc.
Azerbaijan, Armenia, Georgia
36 10 10 -73
Source: Customs Committee of Russia as reported by the Global Trade Atlas.
Impact of bilateral agreements: the Russian Federation and the Customs Union
Russian bilateral trade agreements with Ukraine and Russian customs union with Belarus and Kazakhstan have a great impact on the country’s meat market. The impact can be clearly seen from the increased imports of poultry meat from Ukraine under the free-trade agreement; these imports are not constrained by the Russian meat import TRQ or import duties, shown in Table 53 in Annex 12.
Trade with Belarus and Kazakhstan is rarely seen now in the official customs statistics. In 2010, pork and beef exports from Belarus to the Russian Federation increased by 37 and 28 percent respectively compared to 2005, according to the data reported by Belarus to UN Comtrade. Poultry trade from the Union partners boomed with some 38 000 tonnes sold, almost quadrupling in 2010, as a result of Belarus’s expansion towards the Russian market (see Figure 47).

94
Figure 47: Belarus’s export quantities and average free on board (FOB) prices of poultry meat to the Russian Federation, 1998-2010
0
5 000
10 000
15 000
20 000
25 000
30 000
35 000
40 000
45 000
1998 2000 2002 2004 2006 2008 2010
0.50
1.00
2.00
2.50
1.50
Avg priceExport quantity
US
D/kg t
on
nes
Source: UN Comtrade.
As can be seen from Figures 48 and 49, within the Customs Union, Belarus is the biggest supplier of meat to the Russian Federation, accounting for 94 percent of exports to the Russian Federation, which absorbs over 99 percent of Belarus’s total meat exports. Belarus ships mainly beef (64 percent of its meat exports to the Russian Federation in 2010, on volume), pork (19 percent) and poultry meat (another 19 percent). Belarus’s meat is price-competitive thanks to domestic price and trade control measures and because all exports are conducted through the state trading companies.
It is not clear to what extent Belarusian exports of meat will be influenced by the Russian Federation’s WTO accession and the improved market access for other suppliers. The Belarusian producers and exporters are generally believed to be supported by the state. As Belarus, the Russian Federation and Kazakhstan create the Single Economic Space, they will have to coordinate domestic support policies as well. This issue has already been brought up and is believed to be the main reason behind Belarus’s occasionally “voluntary” restrictions on exports to the Russian Federation.

Russian Federation - Meat sector review
95
Figure 48: Russian imports of pork from the Customs Union and Ukraine, 1995-2011
10
20
tho
usa
nd
to
nn
es
30
40
50
60
70
01995 1997 1999 2001 2003 2005 2007 2009
Kazakhstan Belarus Ukraine
2011
Source: UN Comtrade.
The availability of beef for suppliers to the Russian Federation from Ukraine and Kazakhstan is low. Therefore, Belarus will likely remain the only sizable beef supplier with which the Russian Federation has a free-trade agreement (see Figure 49).
Figure 49: Russian imports of beef from the Customs Union and Ukraine, 1995-2011
250
200
150
100
50
0
tho
usa
nd
to
nn
es
Kazakhstan Belarus Ukraine
1995 1997 1999 2001 2003 2005 2007 2009 2011
Source: UN Comtrade.

96
Chapter 7 - meat prices
Poultry, pork and cattle prices in 2005-2010 were on a rise in the Russian Federation. The average annual growth of prices for cattle and poultry18 in live weight was as follows (see also Figure 50):
• poultry: 30 percent;
• swine: 38 percent;
• cattle: 64.5 percent.
Prices for cattle grew much faster than prices for pigs, which is explained by the gradual reduction of livestock inventories for slaughter.
Figure 50: Annual average poultry, pork and cattle live weight prices, 2005-2010
39 235.4
45 074.8
54 229.5 52 966.3
55 950.5
39 821.940 813.4
50 420.4 49 050.6
60 988.3
69 263.4
54 371.4
41 762.2
30 000
60 000
65 000
70 000
75 000
55 000
50 000
45 000
40 000
35 000
2005 2006 2007 2008 2009 2010
RU
R/t
on
ne
(exc
l. V
AT
)
Poultry and other farming birds Swine Cattle
69 748.3
34 003.1
51 821.0
45 641.043349.7
Source: FSSS of Russian Federation.
18 For all fatness classes.

Russian Federation - Meat sector review
97
The prices for cattle in live weight and slaughter weight are closely correlated considering typical slaughter yields from the live weight basis (0.75 for poultry, 0.6 for pork and 0.45 for beef).
Prices for cattle differ greatly depending on the region and category of meat. For instance, the average price for first category hogs in live weight as of December 2010 in the Central Federal District was 72.1 RUR/kg (excl. VAT) as compared with 134.4 RUR/kg (excl. VAT) in the Far Eastern Federal District.
The average annual prices for meat and meat products also had a clear upward tendency, reflecting increasing incomes and producer and consumer prices in the Russian Federation19. In 2005-2010, annual meat prices increased as follows:
• 5.5 percent for poultry meat;
• 8 percent for pork;
• 13 percent for beef;
• 4.4 percent for edible subproducts (livers, etc);
• 14.5 percent for cooked sausage products;
• 13 percent for further processed meat products;
• 9 percent for canned meat products.
The trend of increasing prices of meat products is shown in Figure 51.
19 As per FSSS of Russian Federation, the average inflation level amounted to 10.5 percent for 2005-2006.

98
Figure 51: Prices for raw and processed meat products, annual average, 2005-2010
141 128.7
2 000
12 000
14 000
10 000
8 000
6 000
4 000
2005 20102009200820072006
81 896.5
51 283.0 55 683.6
82 345.1
77 008.9
58 371.7
27 081.5
RU
R/t
on
ne
(exc
l. V
AT
)
127 502.1
Poultry
Beef Meat cans (thousand pcs)
Sausage and cooked meat
115 673.7
84 363.5
71 333.1
38 662.4
Pork
70 865.3
Animal slaughter sub-products
Semi-prepared foods from meat pork
Source: FSSS of Russian Federation.
The increase of prices for sausage products is closely correlated with the trend of higher consumption of more expensive sausage products as a result of growing incomes. Canned meat has traditionally been a low-end segment as it is made of the less valuable parts of animal carcasses like the trimmings. Therefore, the price increase of canned meats is less pronounced compared with that of precooked meat and sausage products.
In general, the price dynamics are consistent with the inflation rate or they slightly exceed it, with the exception of poultry and edible by-products. The average annual price increase for such products remains below the average inflation rate due to a relatively higher supply.

Russian Federation - Meat sector review
99
Chapter 8 - Policy
Agricultural policy goals
The agricultural policy of the Russian Federation is an integral part of the state’s socio-economic policy 20. The policy is aimed at sustainable development of agriculture and rural areas. The main objectives of the agrarian policy are:
• increasing competitiveness of Russian agriculture and agricultural producers and improving quality of food products;
• ensuring the sustainable development of rural areas and employment and improving living standards in rural areas;
• preservation and reproduction of natural resources used in agricultural production;
• creation of a well-functioning market for agricultural products, raw materials and food and increasing profitability of agricultural producers;
• creation of a favourable investment climate and increasing investment in agriculture; and
• maintaining price parity between agricultural products and industrial inputs used in agriculture.
The agricultural support system in the Russian Federation has been driven by a progressive orientation of policies towards import substitution and achievements of self-sufficiency. In order to implement national agricultural policy goals, the government has developed sector and subsector development programmes, such as the State Programme for the Development of Agriculture and Markets of Agricultural Products, Raw Materials and Food for 2008-201221 or 2013-202022. The livestock and poultry sectors are integral parts of these agricultural development programmes.
The agricultural policy objectives have been pursued at relatively high costs to Russian taxpayers and consumers as the majority of support is provided through market price, variable input use and
20 The Federal Law on Agricultural Development: http://base.consultant.ru/cons/cgi/online.cgi?req=doc;base=LAW;n=126592 in Russian.
21 http://www.mcx.ru/documents/document/v7_show/1348.145.htm in Russian.22 http://www.mcx.ru/navigation/docfeeder/show/342.htm in Russian.

100
fixed capital formation in agriculture (investment subsidies and interest rates)23, which are amongst the most distorting measures.
According to the OECD data the PSE – which measures the annual monetary transfers from consumers and taxpayers to farmers arising from policy measures that support agriculture (regardless of their nature, objective and impact) – amounted to around half of a trillion RUR, on average 22 percent from RUR 2.1 trillion of the total value of agricultural production in the Russian Federation in 2008-2010. Within the PSE, transfers to producers of poultry and livestock totaled about RUR 227 billion per year on average (2008-2010), which comprises 44 percent of all transfers to all farmers measured by OECD24 through the PSE.
Livestock and poultry in the context of agricultural support polices and measures
The indicators of the MPS are key to assessing support levels enjoyed by producers. In 2008-2010, about 65 percent of all transfers to Russian farmers were because domestic agricultural prices were higher than comparable world reference prices at a farm-gate level.
The specific composition of the MPS for key agricultural commodities in 2008-2010 is illustrated in Figure 52. The negative price support of wheat, maize, sunflower seed and other grains indicates that producers of these commodities are “taxes” in the Russian Federation because of their low domestic prices. Because domestic prices for beef, pork and poultry meat are much higher as compared with international reference prices, poultry and livestock farmers receive significant transfers from consumers (who have to pay more for domestic products).
Beef and veal, pork and poultry meat account for 9 percent, 20 percent and 15 percent (44 percent in total) of all transfers measured by the PSE. Therefore, the meat sector is the most
23 Please refer to OECD Producer Support Estimate Manual (http://www.oecd.org/tad/agricultural-policies/psemanual.htm) for specific definitions and classifications of support programmes.
24 OECD PSE Database for the Russian Federation Producer and Consumer Support Estimates database http://www.oecd.org/agriculture/agricultural-policies/producerandconsumersupportestimatesdatabase.htm#country.

Russian Federation - Meat sector review
101
significant beneficiary of the state support policy in the Russian Federation’s agriculture sector.
Figure 52: Market price support of specific products in the Russian Federation, 2008-2010, average annual
Source: Authors’ presentation based on the OECD PSE Database.
-24
-11
-27
12
-16
98
44
102
75
80
67
-40
-20
0
20
40
60
80
100
120
Whea
t
Mai
ze
SugarSunflo
wer
Milk
Beef a
nd vea
l
Pigm
eat
Poultry
mea
t
Eggs
Potato
es
Other
com
moditi
es
RU
R b
illio
n
0
5
10
15
20
25
Share in total PSE all transfers (right axis)
Other
gra
ins
percen
t
MPS (left axis)
The government support policies have placed importance on stimulating growth of livestock production through border protection measures (both tariff and non-tariff) to support domestic prices and investments in fixed capital and new farms (via interest-rate subsidies and grants). Livestock producers also benefit from domestic grain prices that are lower than international ones.
Competitiveness with imports
The MPS indicators reflect the gap between domestic and international import parity prices; therefore, they act as indicators of domestic products’ competitiveness with imported products of comparable quality under the conditions of no import protection (like import duties, sanitary and phytosanitary measures [SPS], etc.).
The improvement of the domestic industry’s competitiveness is one of the major goals of the Russian Federation’s agricultural policy. In order to illustrate trends in competitiveness of domestic products, we calculated the MPS per 1 tonne of poultry, pork and beef using information provided by the OECD (see Figure 53).

102
Improving competitiveness between domestic products and imports means reducing the gap between domestic and import parity prices to zero (MPS =0). However, it is evident from Figure 53 that the gap between domestic and international prices only increased, from USD 470-900 per 1 tonne for various meats in 2001 to USD 900-1 200 in 2010. In fact, domestic beef was more competitive with imports than poultry and pork was, as beef had a lower MPS. It is clear that the protectionists’ policies have not improved competitiveness of the domestic industry so far.
Figure 53: Market price support for meat in the Russian Federation, 2001-2010
0
500
1 000
1 500
2 000
2 500
2001 201020092008200720062005200420032002
U
SD
/to
nn
e
Poultry Pork Beef and veal
Source: Author’s calculations based on the OECD PSE Database.
Specific budgetary support programmes
At the end of 2011, the Russian Federation implemented the following major federal programmes for the development of livestock production and meat processing:

Russian Federation - Meat sector review
103
• State Programme for the Development of Agriculture and Markets of Agricultural Products, Raw Materials and Food for 2008-2012;
• sector-targeted programme: Development of pork in the Russian Federation for 2010-2012;
• sector-targeted programme: Development of beef cattle in the Russian Federation 2009-2012;
• sector-targeted programme: Development of the poultry industry in the Russian Federation for 2010-2012 and the period up to 2018-2020;
• sector-targeted programme: Development of the primary processing of livestock in 2010-2012.
Government support measures contribute to the development of the livestock industry by subsidizing interest rates on short-term investment credits and supporting livestock breeding and various regional programmes. State subsidies for livestock production from the federal budget amounted to RUR 22.8 billion in 2011 and another RUR 27 billion for the dairy sector, which is closely linked to the beef market. More than 3 000 projects were already accomplished in the meat and dairy industries under these programmes.
Subsidized loans and interest rate subsidies
Following the State policy of reconstruction and development of the Russian Federation’s agricultural complex infrastructure, OJSC Russian Agricultural Bank and OJSC Sberbank of Russia began to provide long-term (up to ten years) loans for investments in agricultural projects, including livestock farming. Interest payments on loans may be deferred for up to 36 months.
In 2010, compensation of interest rates to agricultural producers was administered by the Resolution of the Russian Federation Government of 4 February 2009 N90. Agricultural producers were entitled to reimbursement of interest on investment loans and loans to replenish working capital; reimbursements were received in Russian banks in the form of subsidies from the budget. This resolution covered loans for construction, reconstruction and modernization of cattle-breeding complexes and farms, livestock and feed production facilities, slaughterhouses and cold stores.
In 2010, the Federal budget compensated RUR 62.8 billion in interest rates, of which RUR 45.1 billion were subsidies on investment loans and RUR 17.7 billion were short-term credits.

104
In 2010, the Government of the Russian Federation continued implementing the package of anticrisis measures in the agricultural sector:
• compensation from the federal budget on investments and short-term loans remained at 80 percent of the refinancing rate of the Russian Central Bank, and compensations from regional budgets remained at up to 20 percent;
• compensation of the 100 percent refinancing rate of the Central Bank was guaranteed to agricultural producers engaged in the production of cattle meat and milk and for short-term and investment loans aimed at construction, reconstruction and modernization of livestock complexes and farms, cattle receiving points and/or primary processing of farm animals and milk;
• subsidies on loans for refinancing previously made investments were kept in full.
The Interagency Commission for the coordination of crediting issues of the agro-industrial complex held 13 meetings and selected 748 subsidized investment projects with the total amount of credit of RUR 197.3 billion in 2010 (see Table 39), a 40 percent increase as compared with the RUR 112.7 billion that were approved in 2009.

Russian Federation - Meat sector review
105
Table 39: List of investment projects in agriculture selected for subsidies, 2010
Description Number of projects
Loans amount,
billion RUR
Subsidies from the
federal budget,
billion RUR
Construction, reconstruction and modernization of livestock facilities, including poultry farms (with breeder farms)
492 154.81 2.36
Construction, reconstruction and modernization of facilities for primary processing and grain storage
105 25.99 0.34
Construction, reconstruction and modernization of facilities for primary processing of meat and milk
43 7.75 0.18
Construction, reconstruction and modernization of sugar mills
29 4.52 0.13
Other 79 4.23 0.07
Total 748 197.3 3.08
Source: National report “On the progress and results of implementation in 2010 of the State programme of agricultural development and regulation of markets for agricultural products, raw materials and food in 2008-2012”.
The Ministry of Agriculture, together with the administrations of the Russian regions, selected 57 new investment projects in 2010 for beef cattle breeding with the total amount of requested loans valued at RUR 31.4 billion (USD 1.05 billion):

106
• VneshEconombank signed loan agreements for at least one investment project – Bryansk Meat Company – for RUR 20.4 billion (USD 680 million);
• OAO Rosselkhosbank signed loan agreements for 35 investment projects totaling RUR 4.53 billion (USD 151 million);
• Sberbank of Russia signed loan agreements for 14 investment projects totaling RUR 596 million (USD 20 million).
Along with the strict requirements of the value of the collateral and turnover, the borrowers are facing other difficulties such as bureaucratic barriers and the requirement of extensive documentation to obtain a loan.
Subsidized leasing
The government of the Russian Federation established the state company OJSC RosAgroLeasing in 2001 to provide domestic agricultural producers with modern agricultural technology, high-tech equipment and highly productive breeding cattle. The new national system of agrarian financial leasing started functioning in 2002. RosAgroLeasing offers its clients the following services:
• extended loan repayment period of up to 10-15 years vs. 7-8 years of maximum bank loans;
• opportunity to purchase modern equipment with minimal down payment (up to 7 percent vs. 20-30 percent for bank credit);
• flexible scheduling of lease payments considering seasonal fluctuations or other peculiarities of a lessee’s business activity.
Direct subsidies to support the production and breeding of livestock
Besides subsidizing interests rates, the government provides support from regional and federal budgets to agricultural producers by means of direct subsidies to develop pedigree livestock breeding (for purchased breeding stock, maintenance of breeding livestock, etc.). Table 40 provides an example of specific programmes in the Voronezh Region of the Russian Federation.
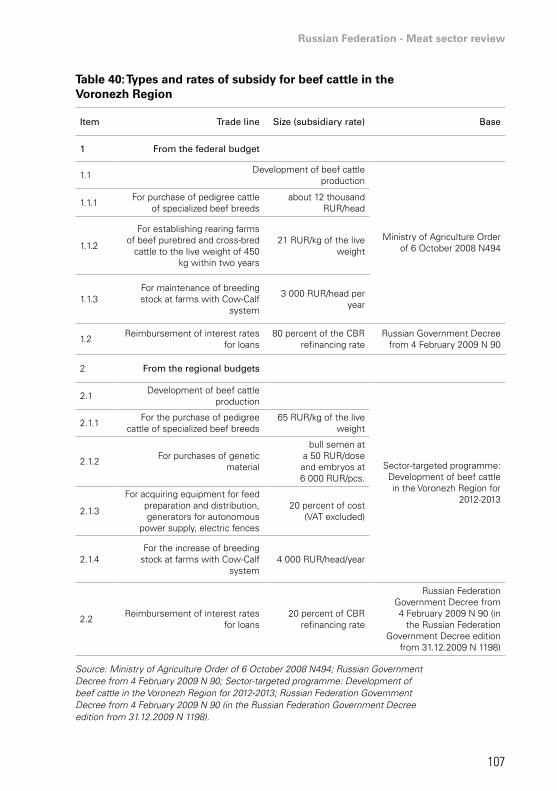
Russian Federation - Meat sector review
107
Table 40: Types and rates of subsidy for beef cattle in the Voronezh Region
Item Trade line Size (subsidiary rate) Base
1 From the federal budget
1.1Development of beef cattle
production
Ministry of Agriculture Order of 6 October 2008 N494
1.1.1For purchase of pedigree cattle
of specialized beef breedsabout 12 thousand
RUR/head
1.1.2
For establishing rearing farms of beef purebred and cross-bred
cattle to the live weight of 450 kg within two years
21 RUR/kg of the live weight
1.1.3For maintenance of breeding stock at farms with Cow-Calf
system
3 000 RUR/head per year
1.2Reimbursement of interest rates
for loans80 percent of the CBR
refinancing rateRussian Government Decree
from 4 February 2009 N 90
2 From the regional budgets
2.1Development of beef cattle
production
Sector-targeted programme: Development of beef cattle in the Voronezh Region for
2012-2013
2.1.1For the purchase of pedigree
cattle of specialized beef breeds65 RUR/kg of the live
weight
2.1.2For purchases of genetic
material
bull semen at a 50 RUR/dose and embryos at 6 000 RUR/pcs.
2.1.3
For acquiring equipment for feed preparation and distribution, generators for autonomous
power supply, electric fences
20 percent of cost (VAT excluded)
2.1.4For the increase of breeding
stock at farms with Cow-Calf system
4 000 RUR/head/year
2.2Reimbursement of interest rates
for loans20 percent of CBR
refinancing rate
Russian Federation Government Decree from 4 February 2009 N 90 (in
the Russian Federation Government Decree edition
from 31.12.2009 N 1198)
Source: Ministry of Agriculture Order of 6 October 2008 N494; Russian Government Decree from 4 February 2009 N 90; Sector-targeted programme: Development of beef cattle in the Voronezh Region for 2012-2013; Russian Federation Government Decree from 4 February 2009 N 90 (in the Russian Federation Government Decree edition from 31.12.2009 N 1198).

108
Under the programme Development of Beef Cattle in Russia 2009-2012, the State co-financed 22 regional programmes in 2009-2010 and allocated RUR 6.67 billion (USD 222 million), including RUR 4.59 billion (USD 153 million) from the federal budget and RUR 2.1 billion (USD 7 million) from the regional budgets. Most of the federal budget has been allocated to regions with traditional beef cattle breeding: Republic of Kalmykia (RUR 910 million), Krasnodar Kray (RUR 427 million), Republic of Bashkortostan(RUR 426 million) and Saratov Oblast (RUR 374 million.
Subsidized feed
Some domestic poultry producers find it difficult to maintain profitable operations at the times of high grain and feed prices. They indicate that higher grain prices translate into an increase in production costs of about RUR 10 per kilogram of meat. In December 2010, Russian poultry producers appealed to the Russian Government (GOR) requesting subsidies for domestic poultry producers to be included in the 2011 budget. The funds were to be used to reimburse the poultry industry for feed costs in the first half of the year at the amount of about RUR 5 per kilogram of poultry meat (in live weight). The industry claimed that without direct subsidies the prices of poultry meat would increase, customers would decrease poultry consumption, poultry farms would reduce production and some of them might go bankrupt by the summer of 2011.
To address the issue of higher feed prices, the GOR sold grain from the state intervention fund. Interventions started in February 2011 and resulted in a price decrease from the initial level of RUR 8 800 per tonne of barley to approximately RUR 6 150 per tonne. As an additional measure of support, the GOR also lowered the freight rates for the transportation of grain and soybeans.
In 2011, the GOR also responded to the requests of the National Union of Swine Breeders and the Russian Poultry Union to provide RUR 9 billion to the pork and poultry industries in order to offset the losses caused by high feed prices as a result of the drought in 2010.
Trade measures
Tariff-rate quota
In 2003, the Russian Federation introduced a restrictive quota to control imports of beef, pork and poultry. The annual quota for poultry was set at 1.05 million tonnes, and the TRQs for beef

Russian Federation - Meat sector review
109
and pork at around 0.45 million tonnes. The restrictive quota on poultry was then converted in 2006 to a TRQ. In January 2009, the TRQs for pork and poultry were lowered further, and the out-of-quota tariffs were raised, from 60 to 75 percent and from 80 to 95 percent, respectively.
Figure 54: Volume of tariff quotas for meat commodity groups, 2004-2010
Source: Meatinfo.
780
560502.2
473.5473.9
493.5484.8
468.3462.78
476.1467.4
457.5447.5
450
0
200
400
600
800
1 000
1 200
1 400
2004 20102009200820072005 2006
t
ho
usa
nd
to
nn
es
Cattle meat, fresh, chilled or frozen (commodity item 0201-0202 of the Russian FEACN)
Pork meat, fresh, chilled or frozen
Poultry meat and giblets, fresh, chilled or frozen (commodity item 0105)
1 050 1 0501 130.8 1 171.2 1 211.6 1 252
The introduction of the quota system was a protective measure to limit imports and allow for production growth of the domestic meat industry. Import limitations have helped local producers gain domestic market shares and increase their margins. A good example of this is that the biggest importers of meat turned into major investors in the Russian meat sector: Miratorg, Agroimport, Optifood, White Frigate, Rubezh and Global Trading, among others.
However, the introduction of quotas seems to have had some negative effects on the domestic meat market and its production:
• market distortion and a negative impact on competitiveness;
• lack of competition with higher quality imported meat products did not stimulate quality enhancement programmes;
• limited supply caused higher prices and reduced affordability of meat products for Russian consumers with low incomes.

110
Table 41 describes the volume of tariff-rate quotas for 2012 established by the Decree of the Government of the Russian Federation of 29 December 2011, number 1194, On distribution of tariff quotas for beef, pork and poultry meat in 2012.
Table 41: Volume of tariff-rate quotas, 2012
Product name
Quota volume,
thousand tonnes
In quota tariff
Above quota tariff
1 Fresh or frozen bovine meat (CU HS code 0201) - total 30
15%but not less
than 0.2 EUR per kilo
50%but not less
than 1.0 EUR per kilo
Including:
European Union 29
Other countries 1
2 Frozen bovine meat (CU HS code 0202) – total 530
15%but not less
than 0.2 EUR per kilo
50%but not less
than 0.2 EUR per kilo
Including:
European Union 60
United States 60
Costa Rica 3
Other countries 407
3 Fresh, chilled or frozen pork (CU HS code 0203) – all countries 15%
but not less than 0.25
EUR per kilo
75%but not less
than 1.5 EUR per kilo4 Pork trimming (CU HS codes 0203 29 550
2 and 0203 29 900 2)* – all countries 400
5Frozen bone-in chicken halves or quarters, (CU HS code 0207 14 200 1) frozen bone-
in chicken legs and their cuts (CU HS code 0207 14 600 1) – all countries
250
25%but not less
than 0.2 EUR per kilo
80%but not less
than 0.7 EUR per kilo
6 Frozen boneless chicken meat (CU HS code 0207 14 100 1) – total, including: 70
European Union 56Other countries 14
7 Frozen boneless turkey meat (CU HS code 0207 27 100 1) – all countries 10
Source: Custom Union Commission, 2011.
* Pork trimming can be imported using both pork trimming quotas and frozen pork meat quotas.

Russian Federation - Meat sector review
111
Comparison of protection of poultry, pork and beef producers between the Russian Federation and other countries
The levels of domestic market protection (through a variety of policy measures, including SPS measures) can be described by the Producer Nominal Protection Coefficient (NPC). As measured by the OECD, protection of poultry, pork and beef farmers in the Russian Federation from import competition in 1995-2010 was often higher than in other meat producing countries (see Figure 55, Figure 56, Figure 57). This was largely a result of the protectionist import-substitution policies.
The level of protection of Russian poultry producers in recent years was comparable to that in the EU and Ukraine; however, it was far above protection of poultry producers in the USA, Brazil and China (see Figure 55).
Figure 55: Poultry: NPC in selected countries, 1995-2010
2.5
2
1.5
1
0.5
01995 1996 1997 1998 1999 2000 2001 2002 2003 2004 2005 2006 2007 2008 2009 2010
Russian Federation
Ukraine China USABrazil EU
Source: OECD.
Pork producers have enjoyed the highest levels of protection among all types of meat. In 2010, Russian pork producers received pork prices at the farm-gate level that were two times higher than the international import parity prices excluding import tariffs. Among the countries shown in Figure 56 only Ukraine had a slightly higher level of protection of domestic producers than that of the Russian Federation.

112
Figure 56: Pork NPC in selected countries,1995-2010
Source: OECD.
2.50
2.00
1.50
1.00
0.50
0.00
Russian Federation
Ukraine China USABrazil EU
1995 1996 1997 1998 1999 2000 2001 2002 2003 2004 2005 2006 2007 2008 2009 2010
As for beef, it is clearly seen in Figure 57 that while the EU-27 has progressively lowered import protection of its beef producers since 2001, the level of protection has remained fairly unchanged in the Russian Federation in 2005-2010. By 2010, the level of protection of beef producers in the Russian Federation exceeded that in the EU, USA, Brazil, China and Ukraine.
Figure 57: Beef NPC in selected countries,1995-2010
Source: OECD.
2.50
2.00
1.50
1.00
0.50
0.00
RussianFederation
UkraineChina USABrazil EU
1995 1996 1997 1998 1999 2000 2001 2002 2003 2004 2005 2006 2007 2008 2009 2010
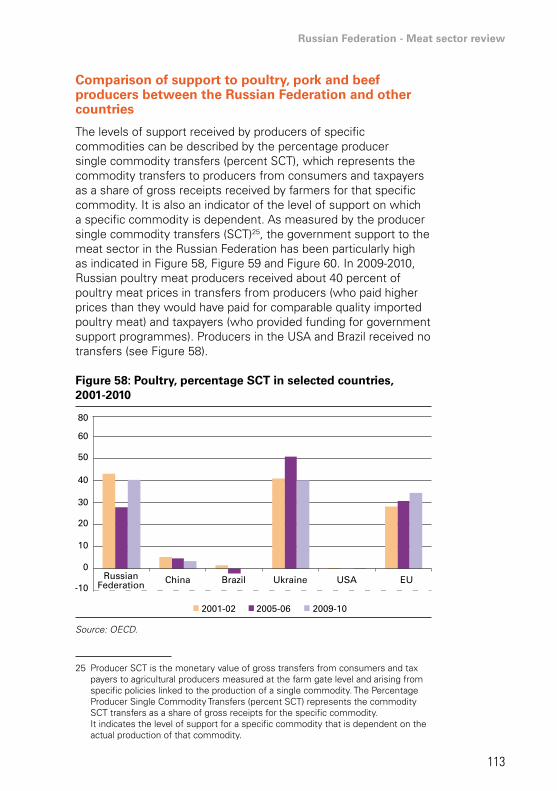
Russian Federation - Meat sector review
113
Comparison of support to poultry, pork and beef producers between the Russian Federation and other countries
The levels of support received by producers of specific commodities can be described by the percentage producer single commodity transfers (percent SCT), which represents the commodity transfers to producers from consumers and taxpayers as a share of gross receipts received by farmers for that specific commodity. It is also an indicator of the level of support on which a specific commodity is dependent. As measured by the producer single commodity transfers (SCT)25, the government support to the meat sector in the Russian Federation has been particularly high as indicated in Figure 58, Figure 59 and Figure 60. In 2009-2010, Russian poultry meat producers received about 40 percent of poultry meat prices in transfers from producers (who paid higher prices than they would have paid for comparable quality imported poultry meat) and taxpayers (who provided funding for government support programmes). Producers in the USA and Brazil received no transfers (see Figure 58).
Figure 58: Poultry, percentage SCT in selected countries, 2001-2010
Source: OECD.
-10
0
10
20
30
40
50
60
RussianFederation Brazil Ukraine USA EUChina
80
2001-02 2005-06 2009-10
25 Producer SCT is the monetary value of gross transfers from consumers and tax payers to agricultural producers measured at the farm gate level and arising from specific policies linked to the production of a single commodity. The Percentage Producer Single Commodity Transfers (percent SCT) represents the commodity SCT transfers as a share of gross receipts for the specific commodity. It indicates the level of support for a specific commodity that is dependent on the actual production of that commodity.

114
A similar situation is observed with the transfers to pork producers in the Russian Federation as compared with other countries. In 2009-2010, only Ukraine provided a higher level of support from its consumers and taxpayers than the Russian Federation. Since 2001, the EU-27 gradually reduced its support to pork producers to the levels that only slightly exceed the SCT to pork producers in the USA (see Figure 59).
Figure 59: Pork, percentage SCT in selected countries, 2001-2010
2001-02 2005-06 2009-10
-10
0
10
20
30
40
50
60
80
RussianFederation Brazil Ukraine USA EUChina
Source: OECD.
Beef producers in the Russian Federation received about 30 percent of the beef price in transfers from consumers and taxpayers in 2009-2010. Only the EU provided similar levels of support to its beef farmers in 2009-2010; however, since 2001 there has been a clear tendency for reduced support to beef farmers in the EU (see Figure 60).

Russian Federation - Meat sector review
115
Figure 60: Beef, percentage SCT in selected countries, 2001-2010
Source: OECD.
-10
0
10
20
30
40
50
60
70
80
2001-02 2005-06 2009-10
RussianFederation Brazil Ukraine USA EUChina
Impact of policies on industry development and risks
Russian Federation’s WTO accession
On 16 December 2011, after 17 years of negotiations, the Russian Federation signed a WTO accession protocol. On 22 August 2012, the WTO welcomed the Russian Federation as its 156th member.
As a part of the accession package, the Russian Federation fixed the level of its Aggregate Measurement of Support to USD 9 billion in 2012 and 2013, which was believed to be two times higher than the level of agricultural support immediately prior to the accession, USD 4.5 billion per year. However, the Russian Federation will have to decline to Final Bound Total AMS (Aggregate Measurement of Support) of USD 4.4 billion by 2018.
Market access
The Russian Federation agreed to reduce the average rate of import duties on agricultural products from 15.1 percent to 11.2 percent. Its WTO commitments regarding agricultural trade resulted mainly from bilateral negotiations with the USA, the EU and members of the Cairns Group of agriculture exporters.

116
According to the WTO26, the Russian Federation agreed to reduce and bind its tariffs on:
• dairy products: to 14.9 percent from 19.8 percent;
• cereals: to 10.0 percent from 15.1 percent;
• oilseeds, fats, and oils: to 7.1 percent from 9.0 percent.
See Table 42 for imports within tariff-rate quotas of beef, pork (until 2020) and poultry.
Table 42: Comparison of the import duties rates, currently existing in the WTO
Commodity
Current tariff rate for in-quota imports percent (no less than .xx Euro
per kg)
Tariff rate for in-quota imports after WTO
accession (no less than .xx Euro per kg / flat tariff
option)
Cattle 15 (.50)44 15 (.55-27.5)
Pork 15 (.75) 0 (.65-25)
Poultry 25 (.95) 25 (.80-37.5)
Live pigs 40 5
Source: Agroinvestor according to the Ministry of Economic Development and the Report of the working group on Russian Federation’s accession to the WTO.
Following WTO accession, the Russian Federation started to implement its commitments, particularly those regarding meat import TRQs. For instance, the volumes for 2013’s TRQs were adjusted to meet the Russian Federation’s WTO commitments as follows:
• provided additional in-quota market access for fresh and chilled beef (from 33 330 tonnes in 2012 to 40 000 tonnes in 2013);
• provided additional in-quota market access for poultry (from 341 330 tonnes in 2012 to 364 000 tonnes in 2013).
Country-specific TRQ allocations were made for Russian frozen beef imports (the EU [60 000 tonnes], the USA [60 000 tonnes],
26 http://www.wto.org/english/thewto_e/minist_e/min11_e/brief_russia_e.htm.
Russian Federation - Meat sector review
117
Costa Rica [3 000 tonnes] and other WTO member states [407 000 tonnes]), Russian fresh and chilled beef imports (i.e. the EU [29 000 tonnes] and other WTO member states [11 000 tonnes]) and Russian frozen de-boned chicken imports (i.e. the EU [80 000 tonnes] and other WTO member states [20 000 tonnes]).
Sanitary measures
Russian restrictions on imports of agricultural products, particularly meats, have been a sensitive issue in trade relations with the USA, the EU, Brazil, and other agriculture-exporting countries. As a WTO member, the Russian Federation will be obligated to adhere to the provisions of the WTO Sanitary and Phytosanitary Measures (SPS) Agreement when imposing measures to protect human, animal, or plant life or health.
The Russian Federation has a practice of using rigid SPS requirements for imported animal and plant products. The country has required that imported meats be shipped only from facilities that are on a Russian government-approved list for meeting Russian safety requirements. For many exporters, these requirements have adversely affected exports of meats, especially poultry, pork, dairy products, grains and oilseeds. Many agriculture-exporting countries have argued that the Russian Federation’s SPS requirements do not conform to international standards and are not based on accepted science as required under the WTO SPS Agreement.
As a result of bilateral accession negotiations with the USA, the EU and members of the Cairns Group, as well as with the WTO Working Party, the Russian Federation has committed to:
• developing and applying international standards to SPS through membership in the Codex Alimentarius, the World Organisation for Animal Health (OIE) and the International Plant Protection Convention;
• negotiating veterinary export certificates that include requirements different from those of the Customs Union if an

118
exporting country makes a substantiated request to negotiate such a certificate prior to 1 January 2013;
• refraining from suspending imports from establishments based on results of onsite inspections before giving the exporting country the opportunity to propose corrective measures27.
Implications for agriculture
According to the Ministry of Agriculture, the negotiated terms for agriculture are among the best compared with other countries, and their main task is to increase competitiveness of Russian agriculture using the following negotiated favourable terms:
• The level of state support is allowed to increase to USD nine billion (for two years); that is a more than 50 percent increase from the planned RUR 170 billion (USD 5.6 billion) in 2012.
• The state support shall be better structured by a shifting between “boxes”. While USD nine billion is the limit for measures in the “amber” box, there are no limits for state support within the “green” box, such as house construction, roads, infrastructure, subsidies for science, education, training, irrigation and land reclamation.
• Support of pork processing will be allocated RUR 6 billion in subsidies annually within three years as an adjustment to lower import protection.
• The State Programme 2013-2020 drafted by the Ministry envisages all measures of support allowed by WTO: infrastructure development programmes, social development of rural territories, irrigation and land reclamation.
Moreover, together with associations and industries’ unions, the Ministry of Agriculture is developing a number of mitigation measures necessary for adapting Russian Federation agriculture to WTO requirements. In particular:
27 World Trade Organization: Working Party Seals the Deal on Russia’s Membership Negotiations, 10 November 2011, http://www.wto.org/english/news_e/news11_e/acc_rus_10nov11_e.htm.

Russian Federation - Meat sector review
119
• proposals for the extension of tax concessions for agricultural producers (tax on profit);
• extensions to release agricultural producers from paying VAT on imported breeding animals, embryos and semen until 2020;
• measures to strengthen the functions and powers of the Ministry and the Federal Veterinary and Phytosanitary Surveillance Service (VPSS);
• additional authority for the Ministry of Agriculture and VPSS to increase their staff as a result of the need to adapt to the conditions of the WTO;
• changes to the federal law “On Agriculture”, suggested by the Ministry, to determine the criteria of regions with unfavourable conditions for agriculture. Support of these regions will be treated as a “green box” measure, which means that support to farmers in these regions will not be subject to restrictions.
Possible sector-specific implications
The WTO accession will not significantly affect the Russian poultry meat producers due to the TRQ and the already significant, current share of domestic producers of the total poultry meat supply. Selected poultry products will be subject to 25 percent within the TRQ and (a fairly high) 80 percent outside the TRQ. Therefore, in the next decade the Russian poultry market will likely see more competition between domestic producers, rather than between imports and Russian products.
For pork, the Russian Federation has agreed to a global TRQ of 400 000 tonnes for fresh, chilled and frozen pork and a separate TRQ of 30 000 tonnes for pork trimmings. Both TRQs will have zero in-quota rates. Beginning 1 January 2020, the Russian Federation will adopt a tariff-only regime for pork with a bound duty of 25 percent, and it will apply this duty to all imports, including from countries exporting under its tariff preference programme. Therefore, pork producers will most likely face the most serious challenges after WTO accession.
It is not clear if the beef sector will be effectively protected from import competition by the 530 000 tonnes TRQ with 15 percent within TRQ tariff and 55 percent outside the TRQ tariff. Future developments will depend on the domestic demand for within-quota fresh and chilled beef.

120
Annex 1 - distribution of poultry, swine and cattle inventories by region and type of farm in 2010
Poultry
Table 43: Number and structure of poultry inventories by region, 2010
All types of farms Ag enterprise Household
farmsIndividual
farms
Russian Federation 471 013.7 369 709.6 5 522.5 95 781.6
Central Federal District 136 541.6 115 366.1 373.8 20 801.6
Belgorod Region 47 646.4 45 294.7 18.9 2 332.8
Bryansk Region 6 609.0 5 142.0 6.9 1 460.1
Vladimir Region 3 622.0 3 290.0 25.4 306.5
Voronezh Region 14 019.1 8 608.2 36.2 5 374.7
Ivanovo Region 2 963.2 2 733.1 2.5 227.5
Kaluga Region 3 238.6 2 790.9 5.3 442.4
Kostroma Region 3 691.8 3 521.9 7.1 162.8
Kursk Region 2 900.0 1 018.5 8.8 1 872.6
Lipetsk Region 9 745.0 8 250.0 8.4 1 486.5
Moscow Region 11 455.7 10 954.2 7.5 494.0
Oryol Region 3 589.9 978.2 7.3 2 604.4
Ryazan Region 5 101.3 4 362.3 4.8 734.2
Smolensk Region 1 566.4 803.8 4.8 757.8

Russian Federation - Meat sector review
121
All types of farms Ag enterprise Household
farmsIndividual
farms
Tambov Region 5 236.1 3 711.7 22.4 1 502.0
Tver Region 3 137.1 2 767.2 20.8 349.0
Tula Region 3 927.7 3 369.6 16.2 541.9
Yaroslavl Region 8 092.3 7 769.7 170.3 152.2
Northwestern Federal District 44 113.7 42 987.4 116.1 1 010.2
Republic of Karelia 407.4 378.8 1.8 26.8
Komi Republic 1 855.3 1 832.3 8.3 14.7
Arkhangelsk Region 2 823.8 2 789.8 0.2 33.9
Including Nenets Autonomous Area 0.1 0.0 0.0 0.1
Arkhangelsk Region (excl. Nenets Autonomous Area)
2 823.7 2 789.8 0.2 33.8
Vologda Region 4 332.6 4 191.2 33.8 107.6
Kaliningrad Region 1 595.7 1 284.0 15.7 296.0
Leningrad Region 25 493.4 25 325.2 7.3 160.9
Murmansk Region 721.5 679.4 40.0 2.1
Novgorod Region 5 463.4 5 295.9 4.5 163.0
Pskov Region 1 420.6 1 210.8 4.5 205.3
Southern Federal District 61 633.2 34 167.7 734.3 26 731.3
Republic of Adygea 3 342.1 2 567.2 96.8 678.0
Republic of Kalmykia 230.5 0.5 21.1 208.9
Krasnodar Territory 22 831.8 12 680.3 340.5 9 811.0

122
All types of farms Ag enterprise Household
farmsIndividual
farms
Astrakhan Region 1 551.9 1 314.6 27.1 210.1
Volgograd Region 9 518.8 4 150.8 39.1 5 328.9
Rostov Region 24 158.2 13 454.2 209.6 10 494.4
North Caucasian Federal District 27 719.9 13 892.6 1 764.2 12 063.1
Republic of Dagestan 3 012.0 505.2 410.2 2 096.7
Republic of Ingushetia 254.7 0.0 67.6 187.1
Kabardino-Balkar Republic 3 639.7 925.6 831.7 1 882.4
Karachaevo-Cherkessia Republic 2 616.6 1 096.7 16.1 1 503.8
Republic of North Ossetia-Alania 1 692.7 758.3 44.1 890.3
Chechen Republic 1 008.1 138.3 7.3 862.4
Stavropol Territory 15 496.0 10 468.4 387.2 4 640.4
Volga Federal District 94 966.6 73 632.9 1 858.3 19 475.5
Republic of Bashkortostan 10 370.2 6 649.1 328.7 3 392.4
Republic of Mari El 4 388.0 3 991.8 38.6 357.6
Republic of Mordovia 8 981.0 7 881.7 35.4 1 064.0
Republic of Tatarstan 14 094.6 11 178.5 879.9 2 036.3
Udmurt Republic 6 447.3 5 177.6 11.9 1 257.9
Chuvash Republic 2 992.0 2 284.3 60.4 647.3
Perm Territory 6 757.0 6 370.9 47.8 338.4
Kirov Region 2 174.1 1 875.6 4.5 293.9

Russian Federation - Meat sector review
123
All types of farms Ag enterprise Household
farmsIndividual
farms
Nizhny Novgorod Region 9 039.6 7 840.2 8.3 1 191.1
Orenburg Region 8 064.9 5 436.4 42.6 2 586.0
Penza Region 7 698.0 6 242.6 28.9 1 426.5
Samara Region 3 496.7 2 026.9 13.8 1 456.0
Saratov Region 6 581.7 3 530.2 229.5 2 822.1
Ulyanovsk Region 3 881.5 3 147.2 128.2 606.1
Ural Federal District 40 284.0 37 096.7 191.2 2 996.1
Kurgan Region 1 667.9 741.9 26.0 900.0
Sverdlovsk Region 12 139.7 11 732.2 96.9 310.6
Tyumen Region 8 293.2 7 697.8 46.5 549.0
Including Khanty-Mansy Autonomous Area-Yugra
173.3 99.8 40.9 32.6
Yamalo-Nenets Autonomous Area 3.1 0.6 1.7 0.8
Tyumen Region (excl. Khanty-Mansy Autonomous Area-
8 116.8 7 597.4 3.9 515.6
Chelyabinsk Region 18 183.2 16 924.8 21.8 1 236.5
Siberian Federal District 55 054.9 43 651.1 274.5 11 129.2
Republic of Altai 83.0 0.0 2.5 80.5
Republic of Buryatia 416.9 239.3 13.0 164.6
Republic of Tyva 23.0 8.3 0.2 14.5
Republic of Khakassia 1 355.6 1 137.0 3.1 215.5
Altai Territory 11 199.3 7 159.2 3.1 3 990.0

124
All types of farms Ag enterprise Household
farmsIndividual
farms
Transbaikal Territory 643.6 134.8 50.1 488.5
Krasnoyarsk Region 8 256.2 6 849.4 20.3 1 357.8
Irkutsk Region 7 228.3 6 357.8 49.0 863.7
Kemerovo Region 5 850.0 5 034.0 6.8 752.0
Novosibirsk Region 9 206.2 8 150.2 64.0 1 026.4
Omsk Region 7 233.6 5 165.0 29.6 2 052.1
Tomsk Region 3 559.2 3 416.2 16.5 123.4
Far Eastern Federal District 10 699.8 8 915.1 19.6 1 574.6
Republic of Sakha (Yakutia) 777.3 719.1 210.2 51.9
Kamchatka Territory 247.6 200.5 6.3 44.4
Primorsk Territory 4 289.5 3 640.6 2.7 638.7
Khabarovsk Territory 1 844.2 1 686.3 1.8 156.2
Amur Region 2 701.8 2 128.4 112.7 460.7
Magadan Region 96.1 74.9 10.2 11.0
Sakhalin Region 587.5 452.9 6.4 128.2
Jewish Autonomous Region
143.3 0.5 59.8 83.0
Chukot Autonomous Area 12.4 11.9 0.0 0.4
Source: FSSS of Russian Federation.

Russian Federation - Meat sector review
125
Swine
Table 44: Number and structure of swine inventories by region, 2010
All types of farms
Ag enterprise Household farms
Individual farms
Russian Federation 17 332.8 11 408.8 656.6 5 267.4
Central Federal District 5 993.8 5 163.4 87.8 742.6
Belgorod Region 2 704.0 2 641.9 2.2 59.9
Bryansk Region 187.5 115.7 5.0 66.8
Vladimir Region 141.1 122.0 11.6 7.5
Voronezh Region 484.9 291.3 17.3 176.3
Ivanovo Region 15.5 6.5 1.3 7.7
Kaluga Region 64.5 37.5 8.1 18.9
Kostroma Region 46.7 36.6 1.1 9.0
Kursk Region 382.0 320.8 4.0 57.2
Lipetsk Region 411.3 353.8 4.3 53.1
Moscow Region 298.2 280.1 3.7 14.4
Oryol Region 337.3 256.3 3.9 77.0
Ryazan Region 153.5 127.8 1.9 23.9
Smolensk Region 88.5 67.8 1.9 18.8
Tambov Region 289.6 167.8 9.7 112.1
Tver Region 211.0 189.6 4.2 17.2
Tula Region 119.1 94.1 6.0 19.0
Yaroslavl Region 59.0 53.8 1.4 3.7
Northwestern Federal District 737.4 639.7 18.8 78.9
Republic of Karelia 15.3 9.5 2.1 3.7
Komi Republic 23.7 15.9 3.5 4.2
Arkhangelsk Region 20.1 10.8 1.2 8.1

126
All types of farms
Ag enterprise Household farms
Individual farms
Including Nenets Autonomous Area 0.0 0.0 0.0 0.0
Arkhangelsk Region (excl. Nenets Autonomous Area)
20.1 10.8 1.2 8.1
Vologda Region 97.8 78.9 1.6 17.3
Kaliningrad Region 136.3 124.2 1.9 10.2
Leningrad Region 194.3 181.1 3.3 9.9
Murmansk Region 45.3 42.0 1.9 1.4
Novgorod Region 125.5 111.0 2.1 12.4
Pskov Region 79.0 66.2 1.2 11.7
Southern Federal District 1 946.7 972.8 74.9 898.9
Republic of Adygea 53.9 39.5 1.6 12.8
Republic of Kalmykia 17.4 0.2 3.3 13.9
Krasnodar Territory 864.0 614.8 34.8 214.4
Astrakhan Region 7.2 2.4 1.6 3.2
Volgograd Region 495.2 127.8 9.8 357.6
Rostov Region 509.0 188.0 23.9 297.0
North Caucasian Federal District 418.3 204.8 8.3 205.2
Republic of Dagestan 1.1 0.2 0.3 0.7
Republic of Ingushetia - - - -
Kabardino-Balkar Republic 56.5 47.1 0.3 9.1
Karachaevo-Cherkessia Republic 18.7 13.5 2.6 2.6
Republic of North Ossetia-Alania 28.4 7.8 0.5 20.0
Chechen Republic - - - -
Stavropol Territory 313.7 136.3 4.6 172.8

Russian Federation - Meat sector review
127
All types of farms
Ag enterprise Household farms
Individual farms
Volga Federal District 3 714.9 2 166.5 189.1 1 359.3
Republic of Bashkortostan 309.5 160.3 25.1 124.0
Republic of Mari El 179.9 167.8 1.2 10.9
Republic of Mordovia 311.0 161.8 5.5 143.7
Republic of Tatarstan 622.9 496.7 30.5 95.7
Udmurt Republic 295.8 252.1 3.8 39.9
Chuvash Republic 211.4 122.9 9.4 79.1
Perm Territory 206.3 157.4 7.4 41.4
Kirov Region 181.7 157.7 1.7 22.3
Nizhny Novgorod Region 143.2 72.8 5.4 65.0
Orenburg Region 260.8 112.1 27.3 121.4
Penza Region 290.9 94.3 22.2 174.4
Samara Region 209.5 111.9 11.5 86.1
Saratov Region 346.6 30.9 33.7 282.0
Ulyanovsk Region 145.3 67.7 4.3 73.4
Ural Federal District 1 162.2 730.4 69.8 361.9
Kurgan Region 130.5 28.3 16.2 86.0
Sverdlovsk Region 270.8 237.8 8.8 24.2
Tyumen Region 374.4 175.6 34.3 164.6
Including Khanty-Mansy Autonomous Area-Yugra
40.5 7.2 29.9 3.3
Yamalo-Nenets Autonomous Area 2.3 1.3 0.9 0.1
Tyumen Region (excl. Khanty-Mansy Autonomous Area-
331.7 167.0 3.5 161.1
Chelyabinsk Region 386.4 288.7 10.6 87.1

128
All types of farms
Ag enterprise Household farms
Individual farms
Siberian Federal District 3 050.6 1 386.6 151.8 1 512.2
Republic of Altai 11.3 0.1 0.9 10.3
Republic of Buryatia 74.7 35.0 7.1 32.6
Republic of Tyva 26.2 1.5 1.2 23.6
Republic of Khakassia 60.7 2.1 9.3 49.4
Altai Territory 569.6 96.8 13.7 459.1
Transbaikal Territory 121.0 12.0 14.0 95.0
Krasnoyarsk Region 447.7 177.3 15.4 255.0
Irkutsk Region 221.6 106.7 29.2 85.7
Kemerovo Region 417.6 284.1 16.2 117.4
Novosibirsk Region 373.7 178.3 17.3 178.1
Omsk Region 522.0 327.1 23.1 171.8
Tomsk Region 204.6 165.8 4.5 34.3
Far Eastern Federal District 309.1 144.6 56.1 108.4
Republic of Sakha (Yakutia) 27.4 10.2 9.5 7.7
Kamchatka Territory 13.3 8.1 1.5 3.6
Primorsk Territory 91.6 51.4 12.4 27.8
Khabarovsk Territory 62.7 42.2 8.1 12.4
Amur Region 74.0 18.6 11.8 43.5
Magadan Region 2.5 0.7 1.0 0.8
Sakhalin Region 17.4 11.3 1.3 4.8
Jewish Autonomous Region 19.9 1.8 10.5 7.6
Chukot Autonomous Area 0.3 0.3 0.0 0.0
Source: FSSS of Russian Federation.

Russian Federation - Meat sector review
129
Cattle
Table 45: Number and structure of cattle inventories by region, 2010
All types of farms
Ag enterprise Household farms
Individual farms
Russian Federation 20 069.4 9 155.2 1 656.6 9 257.6
Central Federal District 2 843.9 2 023.3 116.6 703.9
Belgorod Region 235.3 157.6 13.8 63.9
Bryansk Region 212.7 162.7 15.2 34.8
Vladimir Region 145.2 133.6 2.3 9.3
Voronezh Region 386.2 223.0 15.3 148.0
Ivanovo Region 76.1 57.6 3.5 15.0
Kaluga Region 131.3 114.8 4.3 12.2
Kostroma Region 66.8 51.5 2.2 13.0
Kursk Region 199.5 111.6 9.8 78.0
Lipetsk Region 143.1 88.3 5.8 49.0
Moscow Region 260.2 243.0 3.5 13.7
Oryol Region 135.3 92.8 4.7 37.9
Ryazan Region 177.3 151.1 2.2 24.0
Smolensk Region 141.2 106.1 9.1 26.1
Tambov Region 143.9 29.3 12.2 102.4
Tver Region 157.5 117.3 7.5 32.8
Tula Region 100.9 73.1 3.1 24.7
Yaroslavl Region 131.2 109.9 2.0 19.2
Northwestern Federal District 697.1 556.5 29.6 111.0
Republic of Karelia 25.7 19.4 1.1 5.1
Komi Republic 37.8 20.3 4.9 12.6
Arkhangelsk Region 54.3 36.3 6.7 11.3

130
All types of farms
Ag enterprise Household farms
Individual farms
Including Nenets Autonomous Area 1.6 1.5 0.0 0.1
Arkhangelsk Region (excl. Nenets Autonomous Area)
52.7 34.8 6.7 11.2
Vologda Region 185.7 161.9 7.6 16.2
Kaliningrad Region 61.5 31.9 2.5 27.0
Leningrad Region 179.1 166.1 2.3 10.7
Murmansk Region 7.8 7.1 0.5 0.2
Novgorod Region 43.0 29.3 2.4 11.3
Pskov Region 102.3 84.1 1.7 16.5
Southern Federal District 2 447.2 736.0 456.1 1 255.1
Republic of Adygea 49.2 5.5 3.5 40.2
Republic of Kalmykia 565.0 102.2 240.6 222.2
Krasnodar Territory 633.1 431.5 34.4 167.2
Astrakhan Region 262.8 15.6 79.5 167.6
Volgograd Region 339.3 51.0 38.8 249.5
Rostov Region 597.9 130.1 59.4 408.4
North Caucasian Federal District 2 205.6 328.4 225.3 1 651.9
Republic of Dagestan 909.7 105.8 77.2 726.6
Republic of Ingushetia 55.8 1.4 11.1 43.2
Kabardino-Balkar Republic 265.1 41.5 39.6 184.0
Karachaevo-Cherkessia Republic 235.8 36.4 40.0 159.3
Republic of North Ossetia-Alania 138.9 20.1 8.7 110.1
Chechen Republic 221.4 7.8 22.6 190.9
Stavropol Territory 379.0 115.3 26.0 237.6

Russian Federation - Meat sector review
131
All types of farms
Ag enterprise Household farms
Individual farms
Volga Federal District 6 048.7 3 116.0 375.1 2 557.6
Republic of Bashkortostan 1 268.6 484.2 77.6 706.8
Republic of Mari El 100.1 50.6 1.5 48.0
Republic of Mordovia 298.9 196.7 15.0 87.3
Republic of Tatarstan 1 092.4 722.6 78.9 290.9
Udmurt Republic 363.4 289.0 13.9 60.4
Chuvash Republic 224.6 67.2 6.9 150.4
Perm Territory 263.1 175.1 7.7 80.4
Kirov Region 259.9 222.3 4.0 33.5
Nizhny Novgorod Region 315.5 234.1 18.6 62.8
Orenburg Region 655.4 318.1 39.6 297.7
Penza Region 287.7 106.9 14.0 166.8
Samara Region 212.8 89.0 21.8 102.0
Saratov Region 551.3 101.3 63.1 387.0
Ulyanovsk Region 155.0 58.9 12.7 83.5
Ural Federal District 1 084.5 540.6 54.7 489.3
Kurgan Region 199.6 54.9 7.7 137.0
Sverdlovsk Region 255.6 183.3 16.5 55.8
Tyumen Region 268.5 139.4 16.3 112.8
Including Khanty-Mansy Autonomous Area-Yugra
11.8 3.3 5.0 3.5
Yamalo-Nenets Autonomous Area 1.0 0.9 0.0 0.1
Tyumen Region (excl. Khanty-Mansy Autonomous Area-
255.6 135.2 11.3 109.2
Chelyabinsk Region 360.8 163.0 14.2 183.7

132
All types of farms
Ag enterprise Household farms
Individual farms
Siberian Federal District 4 281.5 1 724.2 311.4 2 245.9
Republic of Altai 204.0 29.4 56.2 118.3
Republic of Buryatia 399.7 57.4 48.9 293.3
Republic of Tyva 140.5 16.6 9.9 114.0
Republic of Khakassia 168.5 37.8 30.0 100.8
Altai Territory 902.1 462.8 34.9 404.4
Transbaikal Territory 456.2 58.5 45.6 352.0
Krasnoyarsk Region 438.0 238.7 4.0 195.3
Irkutsk Region 279.5 67.8 24.3 187.3
Kemerovo Region 207.4 91.6 14.7 101.1
Novosibirsk Region 548.0 385.7 11.2 151.1
Omsk Region 438.1 227.1 21.8 189.2
Tomsk Region 99.5 50.8 9.8 38.9
Far Eastern Federal District 461.0 130.3 87.7 242.9
Republic of Sakha (Yakutia) 233.6 50.2 63.5 120.0
Kamchatka Territory 9.5 5.2 0.9 3.3
Primorsk Territory 59.5 18.3 7.1 34.1
Khabarovsk Territory 27.0 16.4 1.0 9.6
Amur Region 95.1 27.8 6.3 61.0
Magadan Region 3.8 1.2 2.0 0.6
Sakhalin Region 17.9 9.5 2.3 6.1
Jewish Autonomous Region 14.5 1.8 4.5 8.2
Chukot Autonomous Area 0.0 0.0 0.0 0.0
Source: FSSS of Russian Federation.

Russian Federation - Meat sector review
133
Annex 2 - main breeds and crosses
Broilers
Russian poultry production largely uses cross-breed birds. According to the Russian Poultry Union, the following are the leading crosses in the Russian Federation’s broiler production:
• Ross 308 (40 percent)• Hubbard (39 percent)• Smena 8 (13 percent)
• Others (8 percent)
The genetic potential and performance of these Russian and foreign broiler meat crosses is similar. One of the major reasons for this similarity is that domestic crosses are selected based on imported genetics, which have common breeding lines with western suppliers.
The most popular broiler crosses in the Russian Federation are as follows:
Figure 61: The most popular broiler breeds
Source: Russian Poultry Union.
Ross 308
Hubbaurd
Smena 8
Others
40%
8%
13%
39%
Pigs
Owing to the absence of a nation-wide animal identification system in the Russian Federation, pigs and cattle are only registered and bonitated (tagged) by large commercial growers

134
and feedlot operations. About 15-20 percent of pig stocks in commercial farms are registered. The same is true for dairy cattle.
In 2010, the Russian pig-breeding sector had 91.100 pigs of 16 breeds and types that were raised in 66 genetic centers and 131 breeding farms. These pigs make at least 6 percent of the total population of sows in all categories of farms and meet the basic industry needs.
The numbers of bonitated sows of meat breeds in breeding farms by breed are 11 690 heads of Landrace, 4 409 heads of Duroc, 5 724 heads of Yorkshire and -7 651 heads of Large White breed (with imported genetics).
The leading role among pig breeds in the Russian Federation is traditionally occupied by the large, white breed animals (70.27 percent), followed by Landrace (9.8 percent), Yorkshire (4.32 percent), Duroc (3.36 percent), large white (with imported genetics) (6.46 percent), middle white (MW-1) (2.87 percent) and the remaining species hold 2.92 percent. The lowest shares of breed structure belongs to Livny (0.28 percent), large black (0.43 percent), Urzhum (0.3 percent) and Breit (0.19 percent).The most popular pig breeds can be seen in Figure 62.
Figure 62: The most popular pig breeds
Source: Agricultural Consulting Center and SibAgro.
Large white
Land race
Yorkshire
Others
70.3%
4.3%
9.8%15.6%
In recent years, key performance indicators of sows, including first-litter sows, of all breeds and types of farms were as follows:
• litter: 10.8 heads;• preweaning number of piglets in 30 days: 9.9 heads;• preweaning litter weight in 30 days: 76.8 kg;• one pig weight in 30 days: 7.8 kg, which is comparable with the
international Grade A level.
Russian Federation - Meat sector review
135
The reproductive capacity of sows in breeder farms is:
• litter: 11.2-11.1 heads; • preweaning number of piglets in 30 days: 10.1-10.0 heads; • preweaning litter weight in 30 days: 81-80, 4 kg;
• one pig weight in 30 days: 8.0-7.8 kg.
In terms of reproductive qualities, the main domestic “parent” pig breed – large white – is almost as good as the world’s best breeds (Landrace, Yorkshire). However, when looking at fattening and meat quality, the large white breed of domestic breeding has lower performance than foreign analogues. In addition, the genetic features of domestic and imported pig breeds are not fully realized mainly because of organizational, technological, feeding and price factors, not because of the breed itself.
Cattle
In 2010, about 3.5 million heads of dairy, dairy-meat and meat cattle were bonitated in the Russian Federation. Cattle herds consist of 19 species and 24 types; the black-and-white breed occupies the dominant position (over 2 million heads or 57.92 percent) and is mostly used for dairy. The second place is taken by Simmental (332.3 thousand heads or 9.58 percent), and the third place belongs to the Kholmogory breed (303.8 thousand heads or 8.76 percent).
A total of 319 thousand heads of meat cattle, including 148.1 thousand cows of 14 breeds and types were bonitated in 50 Russian Federation regions.
The three breeds of cattle listed above represent about 85 percent of the farmed beef cattle in the Russian Federation. Galloway, Grey Ukrainian, Charolais and Salers breeds are not very popular, giving a higher place to Hereford and Kazakh white breeds. The population of Kalmyk breed cows is also declining (see Table 46 and 47).
Figure 63 and 64 illustrate the breed structure of dairy and beef cattle in the Russian Federation.
A significant increase in European breeds was registered in 2008-2010:
• Limousine: up 56.0 percent • Aberdeen-Angus: up 26.3 percent
• Simmental: up 37.4 percent

136
Figure 63: The most popular cattle breeds for dairy and meat
Source: Molochnoe i myasnoe skotovodstvo (Meat and Dairy Cattle Breeding Magazine).
Black and white
Simmental
Kholmogory
Others
57.9%
23,7%
9.6%
8.8%
Figure 64: The most popular cattle breeds for meat
Source: VNIIMS RASHN.
Kalmyk
Hereford
Kazakh white
Others
44,4%
22,8%
17.8%
15%
At present, 49 genetic centers and 199 breeding farms carry out the improvement of breeding and productive qualities of beef cattle. Large international genetic companies, such as International Genetics Ltd, or Genesus Genetic, have representatives in the Russian Federation.
Progress has been made recently in beef cattle breeding. Many years of work have resulted in a reproductive cross-breed of Kalmyk and Aberdeen-Angus breeds (this project was carried out by the All-Russia Scientific Research Institute Of Meat Cattle Breeding, in the Volgograd Region). This new beef cattle breed is called Russian hornless. It has higher productivity and is well adapted to the steppe zone (a feature common in Kalmyk cattle), and it has the excellent beef qualities inherent to the Aberdeen Angus breed (filamentary, marbled meat). The breed was officially registered in 2007.

Russian Federation - Meat sector review
137
Table 46: Relative number of heads of cattle, dairy and dairy/meat breeds, percent, 2009-2010
BreedTotal Incl. cow
2009 2010 2010/09 2009 2010 2010/09
Total in Russian Federation
100 100 0 100 100 0
Black-and-white types: 56.93 57.92 0.99 56.74 57.27 0.53
Irmensky 0.09 0.09 0 0.1 0.11 0.01
Leningradsky 0.16 0.14 -0.02 0.18 0.17 -0.01
Moscovsky - 0.08 - - 0.07 -
Uralsky 0.06 0.09 0.03 0.06 0.09 0.04
Barybinsky 0.16 0.15 -0.01 0.16 0.15 -0.01
Samarsky 0.04 0.03 -0.02 0.05 0.03 -0.02
Krasniyarsky 0.14 0.14 0 0.15 0.15 0
Petrovsky 0.04 0.05 0 0.05 0.05 0
Vologodsky 0.27 0.25 -0.02 0.22 0.22 0
Priobsky 0.24 0.27 0.03 0.23 0.27 0
Netsepinsky 0.06 0.06 0 0.05 0.05 0.04
Simmental 9.78 9.58 --0.2 9.41 9.36 0
Nikolaevsky - 0.09 - - 0.09 -0.05
Kholmogory 9 8.76 0.24 9.04 8.65 -
Tatarstansky 4.29 4.53 0.24 4.09 4.05 -0.39
Pechyosky 0.16 0.18 0.02 0.19 0.21 -0.04
Krasno-Pyeostraya 5.25 5.51 0.26 5.13 5.42 0.02
Voronezhsky 0.27 0.26 -0.01 0.24 0.24 0.29
Yeniseysky 0.42 0.42 0 0.46 0.48 0.01
Karskaya Stepnaya 4.77 4.54 -0.23 4.93 4.74 0.02

138
BreedTotal Incl. cow
2009 2010 2010/09 2009 2010 2010/09
Kubansky 0.05 0.04 0 0.04 0.04 0
Kuliundinsky 0.63 0.69 0.06 0.64 0.69 0.05
Sibirsky 0.33 0.36 0.03 0.34 0.34 0
Holstin Black and White 4.26 4.64 0.38 4.5 5.2 0.7
Aishirsky 2.92 2.8 -0.12 3.23 3.1 -0.13
Novopadozhsky 0.05 0.05 0 0.05 0.05 0
Smena - 0.03 -0.12 - 0.03 -
Yaroslavsky 2.45 2.33 - 2.4 2.29 -0.11
Mikhailovsky 0.05 0.04 -0.01 0.04 0.04 0
Buraya Shvitskaya 1.71 1.59 -0.12 1.77 1.68 -0.09
Smolenskay 0.09 0.11 0.02 0.08 0.11 0.03
Bestuzhevskaya 1.01 0.96 -0.05 0.88 0.86 -0.02
Sychevskaya 0.65 0.58 -0.07 0.67 0.6 -0.07
Vazuzsky - 0.02 - - 0.03 -
Kostromskaya 0.51 0.47 -0.04 0.52 0.48 -0.04
Holstin Red and White 0.43 0.01 -0.42 0.42 0 -0.42
Red Estonskaya 0.1 0.08 -0.02 0.1 0.07 -0.03
Red Gorbatovskaya 0.06 0.06 0 0.07 0.07 0
Istrobenskaya 0.02 0.02 0 0.03 0.02 -0.01
Suksunskaya 0.06 0.06 0 0.08 0.07 -0.01
Jerseyskaya 0.05 0.04 -0.01 0.05 0.04 -0.01
Tagilskaya 0.003 0.003 0 0.005 0.005 0
Source: Molochnoe i myasnoe skotovodstvo (Meat and Dairy Cattle
Breeding Magazine).

Russian Federation - Meat sector review
139
Table 47: Number of heads of bonitated meat cattle, 2008-2010
Breed
2008 2009 2010
Number of heads
Share, percent
Number of heads
Share, percent
Number of heads
Share, percent
All breeds 260 932 100 304 588 100 319 012 100
Kalmyk 121 670 46.63 138 607 45.51 141 570 44.38
Hereford 61 564 23.59 67 630 22.2 72 709 22.79
Incl. Hereford Ural type - - - - 4 750 1.49
Kazakh white 5 057 17. 90 55 990 18.38 56 743 17.79
Aberdeen-Angus 5 657 4.55 18 257 5.99 19 941 6.25
Charolais 2 193 1.94 6 401 2.1 6 812 2.14
Simmental beef total 2 834 2.17 6 771 2.22 8 751 2.74
Incl. Bredin type 2 218 0.84 4 113 1.35 6 339 1.99
Limousine 1 172 1.09 4 645 1.53 5 433 1.7
Aubrac 1 093 0.85 2 555 0.84 2 963 0.93
Galloway 987 0.45 1 577 0.52 1 698 0.53
Salers 92 0.42 1 207 0.4 1 392 0.44
Russian hornless - 0.38 849 0.28 925 0.29
Ukraine grey - 0.04 99 0.03 75 0.02
Source: VNIIMS RASHN.

140
Annex 3 - meat production technologies
Table 48: Production technologies used for poultry meat production
Item Technology Description
1Production processes organization
Large modern operations
(>50 000 tonnes/y)
• Vertically integrated operations, which include own feed production, hatching, breeding and grow-out operations, processing, rendering and marketing;
• use modern technologies and equipment;• high degree of automation;• implement food safety measures; • use local and foreign consultants;• have support from local and federal
governments;• comprise operations in various regions; • integrated with pig production in many cases;• assure quality control.
Large modern operations
(>50 000 tonnes/y)Medium and small farms of new type
(30 000-50 000 tonnes/y)
• Vertically integrated in most case; • use modern technologies and equipment;• observe biosecurity measures; • use local and foreign consultants;• very often have a high degree of automation;• assure quality control.
Small and medium farms of old type
Annual capacity less than 30 000 tonnes
• Use old equipment and technologies;• have weak food safety control;• do not invest in staff and its training; • have problems with financing;• usually have state shares in equity;• produce too many different products;• cannot handle costs due to lack of
knowledge.

Russian Federation - Meat sector review
141
Item Technology Description
2Broiler housing technology
Floor housing: birds are raised on the
floor covered with wood shavings or
straw
• Strong food safety control;• higher quality due to less damage to birds;• better welfare;• easier to handle and manage flocks;• low maintenance equipment;• better ventilation and lighting;• additional cost of shavings or straw to collect
litter.
Cage housing: birds are raised in cages
built on several levels
• Higher yields per square meter;• higher food safety risks; • intensive labour and technology; • high maintenance of climate control; • higher rates of damaged birds.
3Grow-out (rearing) technology planning
All-in all-out: houses are built by zones for complete zone
cleaning
• Best for disease prevention;• allow better flock management and
performance;• provide savings on livability and yield;• require additional investment in housing.
Continuous cycle: no free time between houses cleaning in
zones
• No need for additional capital construction; • prevent full cleaning of production areas;• cause disease retransmission; • affect flock performance.
4Feed type / feed plant
Old technology:Feed mash – crushed
grains
• Low cost of equipment and of production process;
• high losses of feed;• low feed conversion.
New technology: pelleted heat-treated
combined feeds
• Capacity to produce several feed recipes; • good feed conversion;• minimal waste of feed throughout production
chain;• consistently ensured quality, higher food
safety.
5 Genetics
Local genetics(both Russian and Western breeds)
• Good local availability; • high maintenance;• inconsistent performance;• tainted with various diseases.
Foreign genetics (supplied from
abroad)
• Most productive breeds from best genetic centers;
• have good service from breed suppliers;• risk of non-delivery for various reasons;• higher hatchability and fertility; • require complicated vaccination programmes.

142
Item Technology Description
6 Processing
Prime processing (slaughter and
evisceration)
• High cost savings on labour, packaging, energy, equipment, infrastructure and marketing;
• no added value.
Full processing (including cut-up,
further processing and packaging)
• Added value on basic product;• higher yield; • wide product range;• better marketing prospects;• additional expenses on equipment and staff;• higher technological risks.
7 Chilling
Water chilling: birds are immersed in huge tanks filled
with ice water
• Higher yields because of retained water; • better product appearance;• shorter chill time;• retained water leaks in packaging;• higher risk of cross contamination;• excessive waste of water.
Air/combined: birds are passed through
a chilling hall with com-pressed cold air
• No leaks in packaging;• no cross contamination;• higher energy consumption;• longer chill time; • risk of improper anti-microbial treatment.
8 Litter utilization
Composting outside the farm and further
use as a fertilizer
• Minimal cost involved; • potential benefits from fertilizer sales or use;• require big lots of land; • high ecological risk.
Processing for biofuels, burning,
etc.
• Capital consuming (expensive);• resolve ecological issues;• guaranteed long-term sustainability.
Source: Authors’ compilation based on various sources.
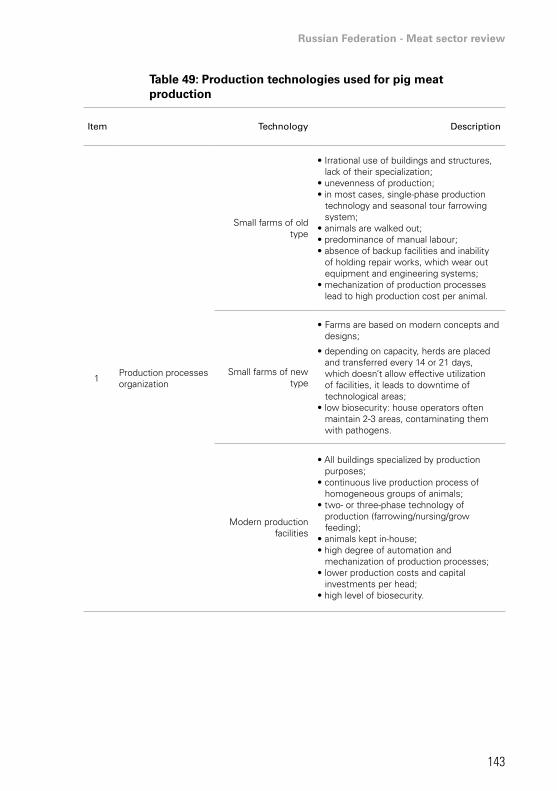
Russian Federation - Meat sector review
143
Table 49: Production technologies used for pig meat production
Item Technology Description
1Production processes organization
Small farms of old type
• Irrational use of buildings and structures, lack of their specialization;
• unevenness of production; • in most cases, single-phase production
technology and seasonal tour farrowing system;
• animals are walked out; • predominance of manual labour; • absence of backup facilities and inability
of holding repair works, which wear out equipment and engineering systems;
• mechanization of production processes lead to high production cost per animal.
Small farms of new type
• Farms are based on modern concepts and designs;
• depending on capacity, herds are placed and transferred every 14 or 21 days, which doesn’t allow effective utilization of facilities, it leads to downtime of technological areas;
• low biosecurity: house operators often maintain 2-3 areas, contaminating them with pathogens.
Modern production facilities
• All buildings specialized by production purposes;
• continuous live production process of homogeneous groups of animals;
• two- or three-phase technology of production (farrowing/nursing/grow feeding);
• animals kept in-house; • high degree of automation and
mechanization of production processes; • lower production costs and capital
investments per head;• high level of biosecurity.

144
Item Technology Description
2Technology of keeping pigs
“Nesting”technology
• Floor in pig house is covered with straw or wood shavings (litter) to absorb manure;
• need for large amounts of litter, but this gives good compost;
• high costs of labour; • no resource-saving equipment.
“Nesting”technology
Slotted floor technology
• Reduces cost of cleaning by 10-15 times; • stringent requirements for the
microclimate (temperature, humidity, air velocity, etc.);
• need to build dump yards based on 12-month exposure of manure in each of the lagoons;
• high level of process automation, energy use and conservation equipment.
3Technology of manure removal from houses with slotted floor
Old technology• Use of water wash for dung removal,
which leads to the formation of a large amount of manure runoff.
Modern technology
• General use of waterless methods of manure removal to ensure the reduction of water consumption for technological purposes by 1.5-2 times*.
4Feeding technology and diets
Old technology
• Feeding waste food product, vegetables, potatoes;
• high degree of manual labour; • loss of feed due to souring;• impossibility of accurately delivering feed
to animals; • requires feeding center, steaming plant
and additional equipment and staff.
Modern technology
• Pigs at various ages fed with specialized pelleted feeds;
• reduces the chance of poisoning with mycotoxins;
• reduces waste of feed; • saves labour; • significantly increases the weight gain due
to higher conversion, nutrition value and optimal balance of diets.
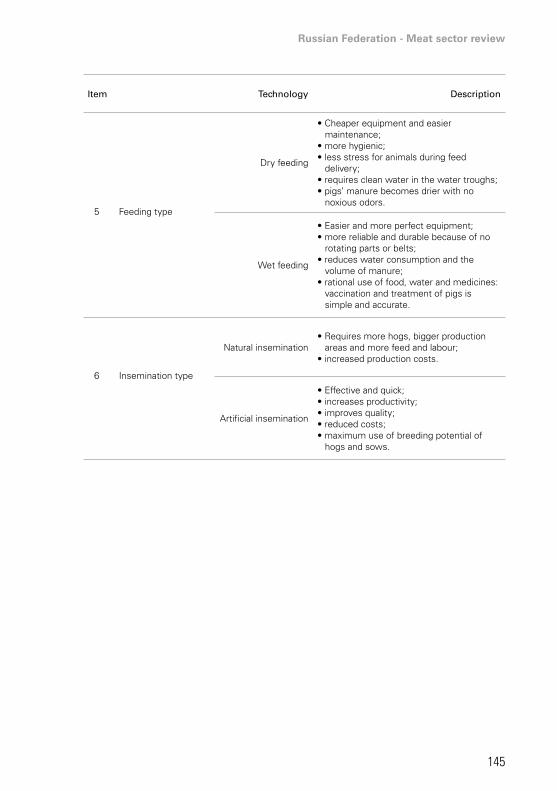
Russian Federation - Meat sector review
145
Item Technology Description
5 Feeding type
Dry feeding
• Cheaper equipment and easier maintenance;
• more hygienic; • less stress for animals during feed
delivery; • requires clean water in the water troughs; • pigs’ manure becomes drier with no
noxious odors.
Wet feeding
• Easier and more perfect equipment; • more reliable and durable because of no
rotating parts or belts;• reduces water consumption and the
volume of manure; • rational use of food, water and medicines:
vaccination and treatment of pigs is simple and accurate.
6 Insemination type
Natural insemination• Requires more hogs, bigger production
areas and more feed and labour; • increased production costs.
Artificial insemination
• Effective and quick; • increases productivity; • improves quality; • reduced costs; • maximum use of breeding potential of
hogs and sows.

146
Item Technology Description
7 Genetics
Russian genetics
• Russian genetics, evaluation methods and selection of animals are completely outdated;
• meat quality does not meet the processors requirements because of high fat percentage;
• costly and ineffective because many Russian breeders are forced to have their own herd of pedigree pigs for internal hybridization.
Modern high productive foreign
genetics (Denmark, Great Britain, Canada, USA,
Germany)
• Reduces (i) the volume of capital investments, particularly in construction and equipment, (ii) operating costs, (iii) energy and water consumption, (iv) feed costs, (v) use of veterinary preparations and (vi) cost of manure disposal;
• provide higher quality of end products; • reduce environmental impact; • increase overall economic efficiency of live
production operations.
Source: Authors’ compilation based on various sources.
* Now the water flushing technology is being improved: manure effluents are
separated, the liquid part is disinfected down to “processed water” and reused.
However, the problem of high humidity remains unresolved, together with
ventilation difficulty (especially in winter) and high-energy costs. Mechanical
harvesting adds increased labour costs.

Russian Federation - Meat sector review
147
Table 50: General technologies of cattle meat production
Item Technology Description
1General principles
Cattle meat by culling dairy cattle
Meat is obtained from culled dairy cows and calves. It is much more costly to grow bull calves than to
dispose of them at early ages.
Specialized beef farming
The animals of meat breeds gain weight faster than dairy cattle. Beef from meat cattle breeds is tastier
and has higher yield. Such animals require much less energy than dairy cattle. Disadvantages: mono-
productivity and relatively low return on investments.
2Housing system
Stall-barn system
Year-round stall-barn housing extensively uses silage, hay and straw in winter-time, and green chop of green
forage chain with concentrates in summer time. It is recommended for farms with minimum grazing areas; therefore, it is more expensive because it requires lots
of prepared fodder.
Pen system
Stall-barn system in winter, pens in summer (feeding green chop of green forage chain and silage). This
system is used when grazing is not far from land with plentiful grass (e.g. wet meadows along rivers) and if
grazing areas are not sufficient or remote.
Grazing-stall systemIn the stall period animals are kept in barns and in the
pasture period, in artificial or natural pastures.
Grazing system
Preferable for farms that have large areas of natural and improved pastures. Keeping cattle in the wild pastures
for 24 hours a day is the most efficient way to avoid animal stress.
3Housing method
Traditional farm-animal method
This is a traditional method for dairy cattle rearing. Its advantage compared with free-stall housing is that individual maintenance of cows provides milk and
extends the productive life of the animals. It is used for finishing growing in dairy farms, and there is a high
cost of manual labour.
Free-stall method
Compared with traditional housing, this method can significantly reduce labour costs and efficiently use
production equipment. This technology is used by some dairy farms, and takes the leading place in
meat production. It requires a lot of bedding or big investments in slotted floors.

148
Item Technology Description
4Grazing technology
Natural grazingThe main advantage of natural grazing is the low cost
of feed.
Artificial grazing
Artificial grazing is the use of annual and perennial grasses, clover, etc. These pastures provide forage in early spring, grow rapidly and are more resistant
to trampling. Artificial grazing has a positive effect on weight gain, but it is more expensive.
5 Feeding
Animal feed useWinter diet of beef cattle generally includes “slightly
dried,” low-moisture silage with combined feed.
Change of animal feed for flattened
grains and grain forage
Conditioning is the most efficient way of processing wet grain to feed, which provides high-quality forage. The technology is effective because it allows cheaper
feed grain forage by eliminating the cost of drying food and better digestibility.
6 Insemination
Artificial insemination
This method is modern and inexpensive (no need for bulls or additional labour), has a higher guaranteed
result when compared with mating and means that calving occurs uniformly throughout the year. Embryo
implantation is even more productive as it allows control of the proportion of bulls and cows.
Natural inseminationNatural insemination is less effective and controllable.
It requires keeping breeding bulls, additional space, feed, labour and other expenses.
7 Genetics
Dairy cattleAyshirsky, Holstein, Yaroslavl, Taghil and other low
meat quality breeds.
Meat and dairy cattle
Simmental, Bestuzhev, Kostroma, Shvitsky and other breeds. Meat quality is satisfactory.
Special meat cattle breeds
Aberdeen-Angus, Hereford, Limousine, Charolais, Kazakh Whitehead and other breeds. Meat quality
is high.
Source: Authors’ compilation based on various sources.

Russian Federation - Meat sector review
149
Annex 4 - Applicable state standards in the russian Federation
Feed
Table 51: Applicable state standards for feed
Designation Title
GOST R 54954-2012 Feeds. Feeds and fodder additives for domestic animals. Terms and definitions.
GOST R 52254-2004 Mixed feeds for fodder cattle. Index nomenclature.
GOST R 52255-2004 Mixed feeds for pigs. Index nomenclature.
GOST R 51899-2002 Granulated mixed feeds. General specifications.
GOST R 51851-2001 Mixed feeds for poultry. Index nomenclature.
GOST 18691-88 Artificially dried grass feeds. Specifications.
GOST 23513-79 Feeds in cakes pellets. Specifications.
GOST 18221-99 Mixed full-ration feeds for poultry. Specifications.
GOST R 51550-2000 Mixed feeds-concentrates for pigs. General specifications.
GOST 9268-90 Mixed feeds-concentrates for fodder cattle. Specifications.
GOST R 51166-98 Mixed feeds for fur-bearing animals, rabbits and nutrias. Specifications.

150
Meat
Table 52: Applicable state standards for meat
Designation Title
GOST R 50848-96Cattle. The criteria for raising and feeding young livestock for
the production of meat foodstuffs for children. Requirements. Standard technological process.
GOST R 52702-2006 Chicken meat (carcasses of chickens, broiler chickens and their parts). Specifications.
GOST R 52703-2006 Chicken meat. Trade descriptions.
GOST R 54366-2011 Chilled meat by-products blocks. Specifications.
GOST 31639-2012 Cooked sausage items of poultry meat. General specifications.
GOST R 53516-2009 Cooked sausage items of poultry meat. General specifications.
GOST 4025-95 Domestic meat mincers. Specifications.
GOST R 54357-2011 Duck meat (carcasses and their parts). Trade descriptions.
GOST R 54376-2011 Duck meat (carcasses and their parts). Specifications.
GOST 12.2.135-95 Equipment for processing meat and poultry farming products. Safety requirements: precautions, sanitation and ecology.
GOST R 53476-2009 Food processing machinery. Cutting machines for meat. Specifications.
GOST R 53848-2010 Frozen cooked mussel meat. Specifications.
GOST R 52674-2006 Frozen in blocks meat and meat by-products for production of babies’ nutritional foods. Specifications.
GOST R 54704-2011 Frozen meat blocks. General specifications.
GOST 4814-57 Frozen meat in blocks. Specifications.
GOST R 54675-2011 Geese meat (carcasses and their parts). Specifications.
GOST 23126-78 Horses for meat for export. Specifications.
GOST 30146-95 Machines and equipment for the production of sausage products and meat semi-finished products. General specifications.
GOST 28107-89 Machines for mixing minced meat. Main parameters, technical requirements and test methods.
GOST 31799-2012 Meat and meat by-products, frozen in blocks, for production of children’s nutritional foods. Technical specifications.
GOST R 52704-2006 Meat and vegetable preserves from poultry meat for babies’nutrition. Specifications.
GOST R 52479-2005 Meat cooked sausage products for children’s food. General specifications.
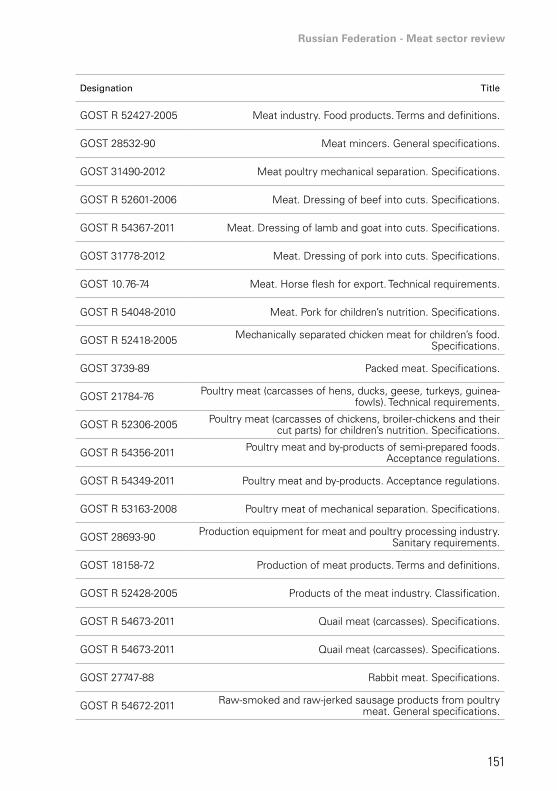
Russian Federation - Meat sector review
151
Designation Title
GOST R 52427-2005 Meat industry. Food products. Terms and definitions.
GOST 28532-90 Meat mincers. General specifications.
GOST 31490-2012 Meat poultry mechanical separation. Specifications.
GOST R 52601-2006 Meat. Dressing of beef into cuts. Specifications.
GOST R 54367-2011 Meat. Dressing of lamb and goat into cuts. Specifications.
GOST 31778-2012 Meat. Dressing of pork into cuts. Specifications.
GOST 10.76-74 Meat. Horse flesh for export. Technical requirements.
GOST R 54048-2010 Meat. Pork for children’s nutrition. Specifications.
GOST R 52418-2005 Mechanically separated chicken meat for children’s food. Specifications.
GOST 3739-89 Packed meat. Specifications.
GOST 21784-76 Poultry meat (carcasses of hens, ducks, geese, turkeys, guinea-fowls). Technical requirements.
GOST R 52306-2005 Poultry meat (carcasses of chickens, broiler-chickens and their cut parts) for children’s nutrition. Specifications.
GOST R 54356-2011 Poultry meat and by-products of semi-prepared foods. Acceptance regulations.
GOST R 54349-2011 Poultry meat and by-products. Acceptance regulations.
GOST R 53163-2008 Poultry meat of mechanical separation. Specifications.
GOST 28693-90 Production equipment for meat and poultry processing industry. Sanitary requirements.
GOST 18158-72 Production of meat products. Terms and definitions.
GOST R 52428-2005 Products of the meat industry. Classification.
GOST R 54673-2011 Quail meat (carcasses). Specifications.
GOST R 54673-2011 Quail meat (carcasses). Specifications.
GOST 27747-88 Rabbit meat. Specifications.
GOST R 54672-2011 Raw-smoked and raw-jerked sausage products from poultry meat. General specifications.

152
Designation Title
GOST R 52818-2007 Sausage cooked goods from poultry meat for children’s nutrition. General specifications.
GOST R 52986-2008 Meat. Dressing of pork into cuts. Specification.
GOST R 54520-2011 Meat. Dressing of veal into cuts. Specifications.
GOST 27095-86 Meat. Horse meat and young horse meat in half-carcasses and quarters. Specifications.
GOST 9792-73Sausage products and products of pork, mutton, beef and meat
of other kinds of slaughter animals and poultry. Acceptance rules and sampling method.
GOST R 54754-2011 Semi-prepared boneless meat products in pieces for children’s nutrition. Specifications.
GOST R 51187-98 Semi-prepared ground meat products, stuffed dumplings, comminuted meat for children’s nutrition. General specifications.
GOST R 52675-2006 Semi-prepared meat and meat-contained products. General specification.
GOST 31465-2012 Semi-prepared poultry meat for children’s nutrition. General specifications.
GOST R 53517-2009 Semi-prepared poultry meat for children’s nutrition. General specifications.
GOST R 53008-2008 Semi-prepared poultry meat and poultry offal. General specifications.
GOST R 53588-2009 Semi-smoked meat sausages. Specifications.
GOST R 53852-2010 Semi-smoked sausages of poultry meat. General specifications.
GOST 29123-91 Symbols of controls of equipment for meat and bird processing industries. Designations.
GOST 28534-90 Tracks for meat industry. Main parameters, dimensions and specifications.
GOST 31472-2012 Turkey meat (carcasses and parts). Trade description.
GOST R 53670-2009 Turkey meat (carcasses and their parts). General specifications.
GOST 31472-2012 Turkey meat (carcasses and their parts). General specifications.
GOST R 53670-2009 Turkey meat for children’s nutrition. Specifications.
GOST R 53458-2009 Turkey meat (carcasses and their parts). General specifications.
GOST R 52820-2007 Turkey meat for children’s nutrition. Specifications.

Russian Federation - Meat sector review
153
Annex 5 - Profitability of poultry, pork, and beef production in various administrative subjects of the russian Federation
Tables 53, 54 and 55 show the profitability of poultry, pork and beef production, including processing, in agricultural organizations in the administrative subjects of the Russian Federation (without state subsidies) in 2010.
Poultry
Table 53: Profitability of poultry in the administrative subjects of the Russian Federation, 2010
Profitability (loss), percent
Number of subjects
Administrative unit
Profitability 55
Up to 10 27
Bashkotostan, Udmurtskaja, Kabardino-Balkanskaja, Kabardevo-Cherkesskaja, Karelija, Marij El,
Mordovia,Hakasija, Chuvashkaja, Zabajkalsky, Krasnodarsky, Krasnoyarsky, Stavropolsky,
Habarovsky, Belhorodskaya, Volgogradskaya, Belgorod, Volgograd, Kemerovo, Murmansk, Novgorod, Novgorod, Orenburg, Orel, Samara,
Sverdlovsk, Tula, Ulyanovsk, Chelyabinsk
10-1-20 17Adygea, Altai, Perm, Primorsky, Bryansk, Vladimir, Vologda, Voronezh, Irkutsk, Kaliningrad, Kaluga, Leningrad, Novosibirsk, Rostov, Ryazan,
Tyumen, Yaroslavl
Over 20 11Komi, Tatarstan,Amur, Kurgan, Kursk, Lipetsk, Moscow, Omsk, Penza,
Tver, Tomsk
Loss 21 -
Up to 10 8Dagestan, Sakha (Yakutia), the Chechen
Arkhangelsk, Kostroma, Pskov, Saratov, Tambov
10.1-20 5Kamchatka
Astrakhan, Kirov
Over 40 5Buryatia,Smolensk,Khanty-Mansiysk, Chukotka
Saint Petersburg

154
Pork
Table 54: Profitability of pork in the administrative subjects of the Russian Federation, 2010
Profitability (loss), percent
Number of
subjectsThe subjects
Profitability 51 -
Up to 10 14
Buryatia, Kabardino-Balkaria, Karachay-Cherkessia, Chuvash Kraj: Perm, Primorsky, Khabarovsk
Astrakhan, Voronezh, Ivanovo, Kostroma, Kurgan, Murmansk, Ryazan
10.1-20 11Adygea, Bashkortostan, Mordovia, UdmurtiaAltai, Kamchatka, Krasnoyarsk and Stavropol
Vologda, Kemerovo, Kursk
20.1-30 12Bryansk, Kaluga, Kirov, Moscow, Novgorod, Novosibirsk,
Pskov, Sverdlovsk, Tverskaya. Tula, TyumenEvrejskaja
Over 30 14Mari El, Tuva
Belgorod, Volgograd, Irkutsk, Kaliningrad, Leningrad, Lipetsk, Orel, Omsk, Penza, Tambov, Tomsk, Chelyabinsk
Loss 26 -
Up to 20 16
Karelia, Komi, North Ossetia, Tatarstan, KhakassiaTransbaikalia, Krasnodar
Amur, Arkhangelsk, Vladimir, Nizhny Novgorod, Orenburg, Rostov, Sakhalin, Ulyanovsk, Yaroslavl
20.1-40 3Samara, Smolensk
Khanty-Mansiysk
Over 40 7Altai, Dagestan, Kalmykia,Saratov
Chukotka, Yamal-NenetsSaint Petersburg
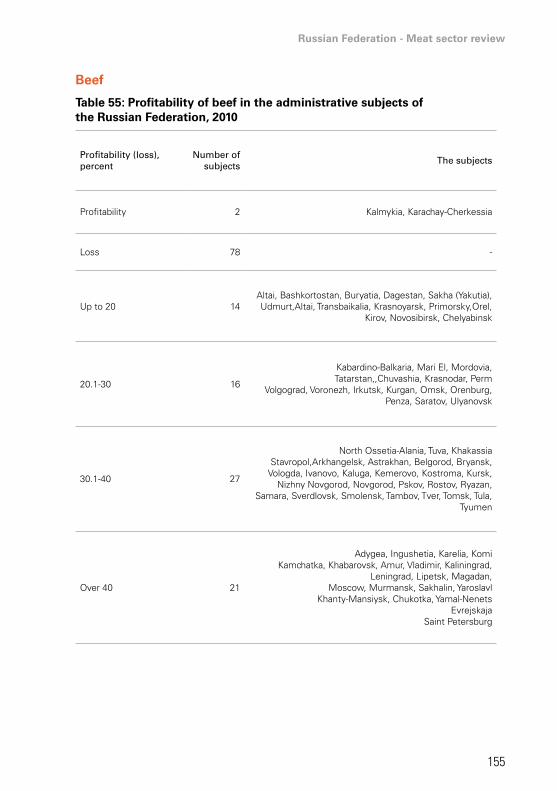
Russian Federation - Meat sector review
155
Beef
Table 55: Profitability of beef in the administrative subjects of the Russian Federation, 2010
Profitability (loss), percent
Number of subjects
The subjects
Profitability 2 Kalmykia, Karachay-Cherkessia
Loss 78 -
Up to 20 14Altai, Bashkortostan, Buryatia, Dagestan, Sakha (Yakutia), Udmurt,Altai, Transbaikalia, Krasnoyarsk, Primorsky,Orel,
Kirov, Novosibirsk, Chelyabinsk
20.1-30 16
Kabardino-Balkaria, Mari El, Mordovia, Tatarstan,,Chuvashia, Krasnodar, Perm
Volgograd, Voronezh, Irkutsk, Kurgan, Omsk, Orenburg, Penza, Saratov, Ulyanovsk
30.1-40 27
North Ossetia-Alania, Tuva, KhakassiaStavropol,Arkhangelsk, Astrakhan, Belgorod, Bryansk,
Vologda, Ivanovo, Kaluga, Kemerovo, Kostroma, Kursk, Nizhny Novgorod, Novgorod, Pskov, Rostov, Ryazan,
Samara, Sverdlovsk, Smolensk, Tambov, Tver, Tomsk, Tula, Tyumen
Over 40 21
Adygea, Ingushetia, Karelia, KomiKamchatka, Khabarovsk, Amur, Vladimir, Kaliningrad,
Leningrad, Lipetsk, Magadan, Moscow, Murmansk, Sakhalin, Yaroslavl
Khanty-Mansiysk, Chukotka, Yamal-NenetsEvrejskaja
Saint Petersburg

156
Annex 6 - Leading meat brands
Company: JSC Prioskolye
Name: PrioskolyeProducts: chicken carcass, semi-finished products of broiler meat, offal and frozen products from poultry
Name: Picnic with PrioskolyeProducts: semi-finished products of broiler chickens in marinades and spices and sausages for frying
Name: Al SafaProducts: certified halal products permanently monitored by representatives of the Council of Muftis of the Russian Federation
Name: Odnazhdy v derevneProducts: top quality chicken
Name: Odnazhdy v derevneProducts: high-quality, ecologically clean chicken meat and products
Company: GROUP CHERKIZOVO
Name: PetelinkaProducts: chilled poultry carcasses and cuts; pork, beef and barbecue in marinade
Name: Kurinoje TzarstvoProducts: chilled and frozen poultry meat, pork and beef
Name: MosselpromProducts: ecologically clean chilled and frozen poultry meat and convenience food
Name: VasiljevkaProducts: chilled poultry in the mid-price segment
Name: Domashnaja KurochkaProducts: eco-products in the premium segment of chilled poultry
Company: BEZRK-Belgrankorm
Name: Yasnyje ZoriProducts: leg with the bone and boneless, quarter, hip, thigh, breast, wings, breast and sub-products
Name: Kurinnyj KorolProducts: original, new recipes of broiler meat

Russian Federation - Meat sector review
157
Company: Miratorg
Name: MiratorgProducts: chilled pork meat and semi-finished products
Company: GC Agro-Belogorye
Name: Daljnyje DaliProducts: fresh and semi-finished meat products
Name: Agro-BelogoryeProducts: cuts chilled and frozen, vacuum packed
Company: OJSC OMPK
Name: OstankinoSub-brands: Slivochnyje, SOSISKA.RUProducts: cooked, smoked and semi-smoked sausages, ham, cutlets, chilled meat, frozen meat and others
Company: Cherkizovsky
Name: CherkizovskyProducts: cooked, smoked and semi-smoked sausages, ham, cutlets, chilled meat, frozen meat and others
Company: Zarizino
Name: ZarizinoProducts: cooked, smoked and semi-smoked sausages, ham, cutlets, chilled meat, frozen meat and others
Company: Mikoyan
Name: MikoyanProducts: cooked, smoked and semi-smoked sausages, ham, cutlets, chilled meat, frozen meat, half-finished beef meat products and ground-meat
Company: Dimov
Name: DimovProducts: cooked, smoked and semi-smoked sausages, ham, cutlets, chilled meat, frozen meat and others

158
Annex 7 - major agroholdings and meat producers in the russian Federation
Miratorg Agroholding
www.miratorg.ru
Agricultural and industrial holding Miratorg was founded in 1995 in the Russian Federation as a trading company. In 2005 it became the largest importer of meat. Since 2003, with the introduction of quotas on meat imports, the company developed a new strategy called “from field to fork.” Currently, Miratorg is the largest producer of pork in the country.
With over 16 000 clients, Miratorg is present in 15 regions and provides employment to more than 7 000 people. Vertical integration allows Miratorg to leverage costs and risks on various commodity markets, maintain stable margins, minimize raw materials’ price fluctuations and ensure timely supplies and quality control at all production stages.
In 2012, the company opened a new processing plant in Kaliningrad, Concordia, which would process poultry and other meats for McDonald’s and its own brands. Since 2009, Miratorg also ran the brand of frozen vegetables named Four Seasons. In 2010, the company started the construction of green-field broiler complex in Bryansk Region with an annual capacity of 100 000 tonnes.
As a result of restructuring in 2008-2010 into an agricultural and industrial holding, Miratorg consolidated 100 percent shares of its subsidiaries. At the end of 2012, the holding company planned to consolidate LLC Concordia, LLC Prokhorovsky Feed Mill, LLC Novoyakovlevsky and LLC Pristensky.
Miratorg is actively developing its own production of fodder and grain to be able to fully meet the needs of its current and future operations. Starting in May 2011, the combined capacity of two feed plants reached 630 000 tonnes a year. In 2012, a third feed mill with an annual capacity of 360 000 tonnes began to operate. This mill is equipped with machinery from Brock (USA, elevator) and Ottevanger (Netherlands, mill).

Russian Federation - Meat sector review
159
Production of pork is the core business of Miratorg. Today the agroholding owns 12 automated pig farms working on Big Dutchman (Germany) and Roxell (Belgium) equipment. Genetic material is supplied by PIC (United Kingdom), Hermitage (Ireland) and Dan Bred (Denmark). In terms of effectiveness, the holding’s pig farms are producing close to the world’s leading manufacturers and are far ahead of the Russian average.
A slaughterhouse and a primary pork processing plant in Korocha (Belgorod Region) were launched in 2008. It is the biggest and most modern enterprise in the Russian Federation in this sector. The list of equipment suppliers includes Banss and Multivac (Germany), York (Denmark), Cryovac (the USA), Mondini (Italy) and Marel (Iceland). In 2011, this complex was approved for exports to the EU.
Food distribution is the final link in the business model of the holding. In 2010 through its own retail chain, Miratorg sold 338 tonnes of meat, 64 percent of which was its own production. Thanks to its distribution network, Miratorg markets 600-1 000 tonnes of meat products daily.
In the first half of 2011, sales of Miratorg increased by 18.5 percent when compared with the sales during the same period of the previous year. Such growth is backed up by the active development of the distribution network and an aggressive marketing policy.
Cherkizovo Group
www.cherkizovo-group.ru
Cherkizovo Group is a vertically integrated agribusiness company with a full production cycle, from feed production to processing meat products and distribution. The company was established in 2005 as the result of merger between Agro-Industrial Holding Cherkizovsky (involved in meat production and processing) and Agro-Industrial Holding Mikhaylovsky (poultry production).

160
The company’s activities comprise:
• seven full-cycle poultry production facilities, with a total capacity of 400 000 tonnes live weight p.a.;
• fourteen modern pork production facilities with a total capacity of 180 000 tonnes live weight p.a.;
• six meat processing plants with a total capacity of 190 000 tonnes p.a.;
• six fodder plants with a total capacity of 1.4 million tonnes p.a.;
• grain storage facilities with a total storage capacity exceeding 500 000 tonnes; and
• a land bank exceeding 100 000 hectares.
In 2011, Cherkizovo:
• acquired 100 percent of Mosselprom, whose operations include poultry, pork, feed production and grain businesses;
• started construction of the Elets agro-industrial complex in the Lipetsk Region, with an annual meat capacity of 400 000 tonnes (poultry and pork) due in 2014;
• renovated the Otechestvenniy Product meat processing plant, which increased its capacity to 400 tonnes per month;
• opened a poultry breeding facility, Komarovka, at its Penza cluster. The facility consists of 34 birdhouses, which have a combined capacity of almost 1.1 million broilers. And a second line at the poultry breeding facility at its Bryansk cluster consists of 26 birdhouses, which have a combined capacity of almost 880 000 broilers;
• launched the largest hatchery in the Russian Federation at its Penza cluster, capable of 105 million eggs per year;
• launched a large hatchery at its Bryansk cluster capable of producing 43 million eggs per year. After a second line is

Russian Federation - Meat sector review
161
launched, the total annual capacity of the hatchery will be 66 million eggs;
• started production at its greenfield pork farms in Tambov, Voronezh and Lipetsk by launching three breeding facilities;
• opened a new poultry slaughter plant with an hourly capacity of 8 000 heads at its Penza cluster.
BEZRK - Belgrankorm
www.jasnzori.ru
Agroholding BEZRK-Belgrankorm was established in 1998 as a feed mill factory. Over the past decade, the company has expanded and diversified, and now has a strong focus on modern equipment and innovative technologies.
Belgrankorm’s integrated poultry operations comprise four hatcheries, 11 broiler-growing farms and three slaughterhouses – all overseen by a specialized poultry management department. A closed production cycle delivers its products to the domestic market, through the Yasnye Zori and Selskie traditsii brands.
Its main assets are concentrated in the Belgorod Region. For nine months in 2010 BEZRK-Belgrankorm produced 132.9 thousand tonnes of poultry meat, 18.3 thousand tonnes of pork, 16.7 thousand tonnes of milk and 369 tonnes of feed.
The company sales reached RUR 14.7 billion in first three quarters of 2010.
The main shareholder is Alexander Orlov. Since spring 2008, 13.23 percent of BEZRK-Belgrankorm is owned by the International Finance Corporation.
Belaya Ptica CJSC
www.belaya-ptica.ru
CJSC Belaya Ptica is an active participant of the national project “Development of agriculture” in which the company has already invested RUR 4 429 million. The holding’s enterprises operate along the full production chain. A closed-loop system and quality control at every stage of production, from food processing to distribution, ensures a consistently high quality product.

162
The holding operates in Belgorod Region. In 2010, it consisted of 16 companies: a grain production company; a feed production plant with a capacity of up to 240 000 tonnes per year; three eggs reproducers with a capacity of about 59 million eggs per year; a hatchery, which supplies 69 million chicks per year; eight poultry farms for raising broiler chickens, with a total production of 100 thousand tonnes per year of live poultry; and integrated slaughtering and processing systems of poultry with a capacity of 10.5 thousand heads per hour.
The company’s turnover in 2010 amounted to RUR 5.6 billion, which is about 8 percent higher than the previous year. In 2010, the production of animal feed increased to 210 thousand tonnes per year, hatching eggs to 57 million units per year, day-old chick to 51 million units a year, live poultry to 104 thousand tonnes per year and meat products to 82 thousand tonnes per year. Investments in production in 2009 amounted to RUR 4 429 million. In 2010 no investments were made.
In 2011, the production of animal feed increased to 224 thousand tonnes a year, hatching eggs to 59 million units a year, day-old chick to 53 million animals a year, live poultry to 108 thousand tonnes per year and meat products to 88 thousand tonnes per year.
SC Agro-Belogorye LLC
www.agrobel.ru
LLC SC Agro-Belogorye was established in July 2007. The group is composed of 30 companies that include nine pig farms, which have a capacity of 70 thousand tonnes of pigs for slaughter in live weight per year; six grain production companies; two animal feed plants; an enterprise for the production of milk; some supporting companies such as trading houses; and transport enterprises.
The holding operates in the Belgorod Region. In 2010 it had revenues of RUR 20.1 billion (according to Forbes). The group employs about 5 000 people. In 2010, it produced about 100 000 tonnes of live weight meat. In 2011, the group sold 105.6 thousand tonnes of pigs for slaughter. Totals in 2011 were 5.5 percent higher than 2010. The total capacity of the group’s feed mills is of 282 000 tonnes of feed per year.

Russian Federation - Meat sector review
163
Rusagro Group of Companies
www.rusagrogroup.ru
The Rusagro Group of Companies is an agricultural holding working in two main areas: sugar and agriculture. The company is positioned among the top three leaders of the Russian sugar market. Rusagro’s first company was created in 1995. After 2000, the company began developing new markets: grain, oilseed and others. In November 2004, Rusagro decided to expand the business and create large pig farms in the southeastern part of the Belgorod Region.
Today Rusagro owns seven sugar plants in the Tambov and Belgorod Regions; a fat plant in Yekaterinburg; a pig farm called OAO Belgorod Bacon; grain elevators; eight regional sales subsidiaries; and the management company. The company mainly operates in the Moscow Region.
Production efficiency is achieved through the use of their own feed supply. In 2010 income from pig meat sales was RUR 4.57 billion. In 2009, the companies belonging to the group produced 900 thousand tonnes of sugar, 33 thousand tonnes of margarine, 53 thousand tonnes of mayonnaise and more than 35 thousand tonnes of meat. The agroholding produces 13 percent of the sugar in the Russian Federation (as per end of 2009).
Prioskolye CJSC
www.prioskol.ru
The company was founded in 2003. CJSC Prioskolye includes poultry farms, processing and feed production plants and trading houses. The revenues of the holding in 2009 amounted to RUR 15.5 billion. In 2010 they were RUR 18.9 billion (according to Forbes).
CJSC Prioskolye has 16 poultry farms with an overall capacity of 300 thousand tonnes of poultry meat in live weight per year and eight poultry farms with a capacity of 12 thousand tonnes of poultry per year that are being introduced. At the end of 2010 Prioskolye had 25-27 percent of the chicken market in the Siberian and Far Eastern Federal Districts. In the Novooskolsky area, the company has a plant for the production of animal protein feed with a capacity of 16 thousand tonnes per year; it is the only one in the Russian Federation capable of working in a continuous cycle. The company also owns an industrial waste processing plant.

164
PRODO Group
www.prodo.ru
PRODO Group was founded in 2004. PRODO Management Ltd is the management company of all the holding’s enterprises. Another company was created, PRODO commerce LLC, to interact with suppliers, local distributors and retailers.
PRODO Group unites more than 20 manufacturing facilities located throughout 11 regions of the Russian Federation. It employs over 22 000 people. The portfolio of PRODO Group includes the brands Troyekurova, BonBekon, Daria, Rococo and Dobryj Produkt. In 2010, the group produced 146.4 thousand tonnes of poultry meat in carcass weight, 77.4 thousand tonnes of pork and 116.3 thousand tonnes of processed meat.
AKGUP Promyshlennyj
The company was founded in November 1993 in Altayskij Kray and is among the country’s largest commercial cattle producers. In 2008, the company received the status of a breeding farm; it reproduces Simmental breeds. In January 2010, the number of cattle on the farm was more than 10 thousand heads. In 2010, AKGUP Promyshlennyj sold 5 228 tonnes of meat, and the average weight per head was 483 kg. Ninety-seven percent of its cattle were sold as luxury quality. In 2010, the number of employees was 476 people.
Agrocomplex JSC
This company was founded in 1993. Today the company has more than 30 structures, including ten farms, ten poultry farms, feed mills, milling plant, shops, two oil-mills, two dairies and two meat-processing plants. Powerful auxiliary structures include railway craft, service station, biological laboratories and two elevators. Associates of the company are located in Vyselkovsky, Pavlovsk, Korenovskii, Ust-Labinsk, Slavic and Starominsky areas of Krasnodar Krai, Krasnodar.
Today, Agricultural Complex is one of the most famous and successful agricultural enterprises in southern Russia. The company is involved in agriculture, animal husbandry and processing of agricultural products. The company annually produces about 4.5 thousand tonnes of meat in live weight of cattle. In 2012, the net income of the company amounted to RUR 1 685 178 thousand.

Russian Federation - Meat sector review
165
AgroHolding Krasnyj Vostok
www.krvostok.ru
Agricultural holding Krasnyj Vostok was established in 2003 on the basis of 68 agricultural enterprises in six districts of the Republic of Tatarstan. The company is involved in the industrial production of high-quality milk, breeding of highly productive cattle, crop production and the processing and storage of grain.
During the last seven years the company invested RUR 25 billion in its agricultural activity. The revenues in 2010 amounted to RUR 2 203 325 thousand, and its net income was RUR 2 624 thousand. The company, according to the rating of the Russian Academy of Agricultural Sciences, is recognized as a leader of milk production in the Russian Federation. Today the total population of breeding stock of the company is 88 000 animals, including 28 000 milk cows. Every day, the company produces 350 tonnes of milk. Each year, the company produces about 280 000 tonnes of grains with an average yield of 43 centners per ha. At the end of 2010, the company employed 1 105 people.
OJSC Agrofirma Mtsensk
www.agrofm.narod.ru
OJSC Agrofirma Mtsensk was created in December 1998. Mtsensk owns cattle-breeding complexes with 3 600 cattle places. The company’s two main business directions are the production of crops and livestock. The company also has machine, technological and grain processing stations with a trading network.
At the beginning of 2011, the company had 4 919 heads of cattle, including 455 dairy cows. In 2010, the sales of beef (in live weight) amounted to 2 878 tonnes. The average daily gain of cattle was 1 079 g. In 2011, the total number of livestock increased to 5 147 heads. The meat produced in live weight was 2.4 thousand tonnes. Production of grains and legumes in 2010 was 40 097 tonnes with an average yield of 3.9 tonnes/ha.
Agricultural Company Belorechenskie
www.belor.ru
Belorechenskoe was founded in 1967. It was a small poultry farm with an average annual population of 64 thousand hens and

166
4 910 thousand eggs. The company has 139 employees. Since 1967, the enterprise has undergone many structural and institutional reforms. In February 1993, the company converted to the agricultural joint stock company Belorechenskoe. Now it produces eggs, egg powder and pasteurized eggs. The company has breeding farms and hatcheries and is actively involved in crop production (corn, potatoes, onions, carrots, beets, cabbages, mushrooms, berries, forage crops, seedlings), livestock products manufacturing (milk, cattle meat), dairy production and marketing of sausages and meat products. Also, the company manages waste with Californian worms, effectively uses environmentally friendly fertilizers or vermicompost, and practices experimental engineering.
Belorechenskoe has 2.4 million birds and produces 545.4 million chicken eggs and 12 million quail eggs yearly. The company’s cattle herd has 11 300 heads, including 5 150 dairy cows that produce 28 000 tonnes of milk and milk products. The company produces 3 000 tonnes of meat products and sausages and 3.500 tonnes of chicken and beef meat. In addition, the company produces 25 000 tonnes of vegetables and potatoes.
OJSC Ostankino Meat Processing Plant (OMPK)
www.ompk.ru
OJSC OMPK is the leading manufacturer of processed meat and convenience foods in central Russia. The company was founded in 1954. It owns 17 trading houses, 26 stores in Moscow and one of the most modern pig farms in the country. OJSC OMPK operates in Moscow and Regions of Central Russia (Lipetsk, Voronezh, Ryazan, Belgorod, Yaroslavl, Nizhny Novgorod, Smolensk, Tver, Ivanovo, Bryansk, Kursk). The company’s processing facilities can process 500 tonnes of products per day of more than 100 varieties of processed meat. All production facilities are equipped with the latest German and Austrian equipment.
At the end of 2011, Ostankino Meat Processing Plant had maintained its leading position among the manufacturers of sausage and meat products. Sales in 2011 amounted to 156 000 tonnes. In 2010 the company produced slightly less, 151 000 tonnes. The number of employees is 3 310 people. In 2012 the company registered a net profit of RUR 485 036 thousand.

Russian Federation - Meat sector review
167
ABI PRODUCT
www.abigroup.ru
The company was founded in 1995. ABI PRODUCT produces about 280 kinds of sausages, deli meats, frozen foods and ready meals. The company’s portfolio includes the brands Starodvorskie kolbasy, Zarechenskie kolbasy, Medvezhje Ushko, Blagolepnyje and Tsaredvore. Products are manufactured in the following meat processing plants (among some others): Starodvorskie has a designed capacity of 175 tonnes per day; Pokom has a designed capacity of 190 tonnes per day; and Mjasnaja galereja has a designed capacity of 150 tonnes per day.
ABI PRODUCT sells its products through independent distributors and retailers in 43 regions of Russian Federation. The company also provides direct distribution of its products through its regional logistics centers in Vladimir, Moscow, Kaliningrad, Krasnodar, Ivanovo, Kostroma and Yaroslavl. ABI PRODUCT employs over 4 000 people. In 2010, the company registered a net income of RUR 138 898 thousand.
JSC Mikoyan Meat Processing Plant
www.mikoyan.ru
Mikoyan Meat is the oldest meat processing enterprise in the country. The company was mentioned for the first time in 1798. In 1998, Mikoyan became part of the agricultural holding Exima. The product range includes more than 700 names. The company operates in Moscow and the Moscow Region, Saint Petersburg, Rostov, Samara, Perm, Chelyabinsk and Novosibirsk. In 2010, the share of the Mikoyan Meat Processing Plant in Moscow and the Moscow Region was about 15 percent in real terms. In 2010, JSC Mikoyan Meat Processing Plant produced around 79 000 tonnes of meat production and registered a net profit of RUR 147 518 thousand.

168
Annex 8 - recent investments in the poultry sector
Name and brief project description
Implementing company (holding)
RegionInvestment,
millionUSD
Starting year
Project at full
capacity
1
Industrial turkey complex for 240 000 tonnes of live weight per year (stage 1: 90 thousand tonnes). Stage 1includes hatchery and processing facilities, feed mill with grain storage and manure disposal system.
LLC Evrodon
Rostov Region
800 2010 2012-13
2
Livestock production systems for poultry meat (poultry slaughter and processing plant, hatchery, feed, 128 breeders, 336 chicken houses, rendering plant, residential housing). Project capacity: 230 thousand tonnes/year. Complex start-up is planned for 2013.
Cherkizovo Group
Lipetsk Region
600 2011 2019
3
Broiler complex in Tatischevsk District of Saratov Region (broiler houses, hatchery, feed mill, slaughter and processing plant, cold store). Capacity: 31.5 thousand tonnes/year.
RE-EM-FORM s.r.o. (Czech
Republic)
Saratov Region
357 2010 -
4
Broiler complex with annual capacity of 100 000 tonnes. The complex was built on the premises of Inzhavinskaya Poultry Farm and will comprise broiler houses in six rearing zones, processing plant, grain elevator, rendering plant, cold stores.
CJSC Izhavinskaya Poultry Farm (as a part of
Prioskol’e)
Tambov Region
283 2010 2012

Russian Federation - Meat sector review
169
Name and brief project description
Implementing company (holding)
RegionInvestment,
millionUSD
Starting year
Project at full
capacity
5
Additional poultry farms with capacity of 50 000 tonnes of poultry per year.
Uralbroiler Group of
Companies
Chelyab-insk
Region
190 -
-Modernization of poultry farms in the Argayashsky Area to increase the volume of poultry meat production by 21 tonnes/year.
46.7 2010
6
Additional broiler housing in Novgorod Region with a total capacity of 22.500 tonnes/year.
BelgrankormNovgoro-d
Region166 2010 -
7
Breeder operation of ten houses brought the total company’s broiler meat output to 80 000 tonnes in 2012.
LLC LISKoBroiler
Voronezh Region
150 2009 2015
8
Vertically integrated turkey complex with an annual capacity of 15 000 tonnes/year, including hatchery, breeders, rearing, processing plant, packaging, feed mill and grain storage. The project is expandable to 60 000 tonnes of turkey meat/year.
LLC Russian Dairy
Company (Rusmoloko)
Penza Region
150 2011 2012
9Broiler complex for 50 000 tonnes of poultry/year.
Sitno Company
Chelyab-insk
Region140 2010 2011
10
Renovation and construction of new poultry farms in the Yetkulsk Area: infrastructure, broiler houses, feed mill.
LLC BektyshChelyab-
insk Region
116.7 - -

170
Name and brief project description
Implementing company (holding)
RegionInvestment,
millionUSD
Starting year
Project at full
capacity
11
Construction of a new poultry processing plants in Blagodarny was scheduled for August 2010. Plant capacity is 80 000 tonnes per year.
CJSC Stavropolsky
broiler – in 2011 acquired
by GAP Resource
Stavropol Region
60 2009 2010
12
Reconstruction of the Vertunovsky breeder operation of the Vassilievskya poultry farm with the production capacity of 60 million hatching eggs/year.
Cherkizovo Group
Penza Region
53 2009 2010
13
Renovation and installation of new equipment for breeder farms Pskov and Borovichi (Novgorod Region) and broiler houses Pervomayskaya, Novgorod and Valdai farms. The total capacity will increase by 36 tonnes of broiler meat/year.
Rubezh Group of Companies
Novgorod and Pskov
Regions
First stage 123.3
2009 2012
Source: Authors’ presentation based on information obtained from market operators, companies’ announcements, development programmes, etc.

Russian Federation - Meat sector review
171
Annex 9 - Broiler meat production (Far East russian Federation): investment model assumptions, results and sensitivity
Table 56: Investment cost to set up a large- scale broiler production farm, in 2012 prices
Fixed assets Investment cost, in RUR million Percent
Poultry house 699 64
Equipment for broilers 91 8
Slaughter (building) 33 3
Slaughtering equipment 75 7
Incubator building 11 1
Incubator equipment 43 4
Other 145 13
Total 1 098 100
Source: Authors’ calculations based on available business plans.

172
The following main assumptions about input prices and productivity were used to calculate investment efficiency in a large-scale broiler production farm:
• one hatching egg costs RUR 13.23 (expected to increase by 6 percent annually);
• one incubation egg costs RUR 4.11 (expected to increase by 6 percent annually);
• egg hatchability for the first four years of the project was assumed to be 75 percent and 80 percent in the following years;
• livability (rate of survival) of broilers was set at 93 percent;
• target weight of the broiler in the first ten years of the project is two kilograms and 2.2 kilograms in the following years;
• average cost of feed is RUR 12.48 per kg (expected to increase by 17.5 percent yearly);
• feed conversion rate is 2.1 kg of feed per 1 kg of weight in the first year, 2.0 kg in the second year and 1.9 in the following years;
• operational costs such as gas, electricity, work force and others account for RUR 44-49 per kg.
Considering those assumptions, the production cost of poultry meat should reach RUR 78 per kg. This cost increases by RUR 7.11 per kg including the delivery cost.
The following are assumptions about outputs and prices:
• output of meat is expected to reach 78 percent per head, approximately 1.56-1.73 kg of meat per broiler;
• average poultry meat sales price of RUR 123 per one kg provides the company with a gross income of RUR 45 per one kg of broiler meat. The sales price is expected to grow by 12 percent per year;
• total quantity of meat farms will be able to supply will gradually increase until it reaches 12 500 tonnes of meat per year in the eighth project year.

Russian Federation - Meat sector review
173
Table 57: Sensitivity analysis of investments in broiler meat productionNPV sensitivity
(billion RUR)
Feed cost fluctuations, RUR/kg
Average meat price, RUR/kg
9.984 11.232 12.48 13.728 15
87 -1.10 -1.35 -1.61 -1.86 -2.32
111 0.30 0.05 -0.20 -0.46 -0.92
123 1.03 0.78 0.53 0.27 -0.19
135 1.76 1.51 1.26 1.00 0.54
148 2.49 2.24 1.99 1.73 1.27
Input cost (feed) inflation
Output prices inflation
14 % 16 % 18 % 20 % 22 %
8% -0.15 -0.31 -0.44 -0.68 -0.89
10% 0.32 0.16 0.02 -0.21 -0.42
12% 0.82 0.66 0.53 0.29 0.08
14% 1.36 1.20 1.07 0.83 0.62
16% 1.94 1.78 1.65 1.41 1.20
Average feed conversion rate, kg of feed per kg of meat
Average meat price, RUR/kg
2.02 1.92 1.82 1.75 1.62
87 -1.74 -1.61 -1.47 -1.34 -1.21
111 -0.33 -0.20 -0.07 0.06 0.19
123 0.39 0.53 0.66 0.79 0.92
135 1.12 1.26 1.39 1.52 1.65
148 1.85 1.99 2.12 2.25 2.38
IRR sensitivity (Percentage)
Average feed conversion rate, kg of feed per kg of meat
Average meat price, RUR/kg
2.02 1.92 1.82 1.75 1.62
87 Negative Negative Negative Negative 0
111 6 8 9 10 12
123 14 15 17 18 19
135 21 22 23 24 25
148 26 27 28 29 30
Payback period sensitivity (Years)
Average feed conversion rate, kg of feed per kg of meat
Average meat price, RUR/kg
2.02 1.92 1.82 1.75 1.62
87 - - - - -
111 11 10 10 9 9
123 8 8 8 8 7
135 7 7 7 7 7
148 6 6 6 6 6
Source: Authors’ calculations.

174
Annex 10 - recent investments in the pork sector
Name and brief project description
Implementing company (holding)
RegionInvestment,
millionUSD
Starting year
Project at full
capacity
1
Construction of a swine complex for one million pigs (90 000 tonnes of pig meat/year).
GK RusagroBelgorod
Region433.3 2009 2016
2
Construction of a swine complex in Zherdevsky and Sampursky Districts for one million pigs/year, including breeder farms.
LLC Tambov bacon
Tambov Region
320 2010 2014
3
Construction of a slaughter and processing plant with a capacity of 100 tonnes per day (consisting of three pig farms and three rearing farms for 330 000 pigs).
LLC Altay-myasoprom
Altay Region 233.3 2011 2013
4
Construction of a pig-breeding complex with capacity of 50 000 tonnes of pig meat per year in five districts of the region.
LLC ResursTambov Region
230.5 2011 2012
5
Commissioning in Pristensk Area for the first phase of a rearing farm for 20 000 pigs: 50 000 tonnes of pork/year.
Agroindustrial holding Miratorg
Kursk Region
210 2010 2018

Russian Federation - Meat sector review
175
Name and brief project description
Implementing company (holding)
RegionInvestment,
millionUSD
Starting year
Project at full
capacity
6
Construction in Vygonich Area of two pig farms of 300 000 heads, or 33-35 000 tonnes/year. The complex will include four commercial farms with 2.5 000 pigs each, a breeding farm for 1.8 000 pigs, a feed mill with a production capacity of 30 tonnes/hour and a selection-hybrid center.
JSC Bryansk Meat Processing
Factory
Bryansk Region
116.7 2010 -
7
Construction of pig farm in the Fatezhsk Area for 112 000 heads/year with a complete production cycle, including slaughter, prime processing and a feed mill. Target capacity: 50 000 tonnes of pork.
Investor - LLC UniversStroyl-
uxe
Kursk Region
116.7 2010 2011
8
Construction of swine complex for 250 000 pigs in Yetkulsky, Chebarkulsky and Nyazeptrovsk Districts. Payback period is expected not to exceed five years.
Romkor Corporation
Chelyabinsk Region
> 100 2010 2015
9
Construction of the pig farm Glebovsky for 52 000 pigs. The complex will also include a feed mill and other manufacturing.
Dmitrova gora(Agropro-
mkomplektatsiya)Tver Region 100 2010 2013
10
Construction of the pig farm East-Siberian, for 12.900 tonnes of meat in live weight/year. Project payback period is estimated to be eight years.
CJSC Siberian agrogroup
Buryat Republic
100 2011 2013

176
Name and brief project description
Implementing company (holding)
RegionInvestment,
millionUSD
Starting year
Project at full
capacity
11
Construction of a pig farm for 70 000 heads in Zaigraivsk District. Production capacity is 13 000 tonnes of pork meat in live weight/year; the payback period is eight years.
CJSC Siberian agrogroup
Buryat Republic
86.6 2011 -
12
Increasing the capacity of pig farm in order to reach the level of 27 000 heads/year, or 37.5 000 tonnes of meat in live weight.
Uralsky (affiliate of CJSC Siberian
agrogroup)
Sverdlovsk Region
50-66.7 2011 2012
13
Opening of a new pig complex for 5250 pigs in Budanovka Village in Zolotukhinsky Area with a capacity of 14 500 tonnes/year.
OJSC Global EcoKursk
Region64 2011 2012
14
Finalizing the fifth pig farm Troparevo that has a capacity 55 000 pigs/year.
JSC Ostankino Meat Processing
Moscow Region
15 - 2009
15
Construction of pig complex in Bogdanovich and Kamyshlovo Areas: two independent farms, each of which includes a reproducer, rearing and feed grow. Construction started in 2007. Capacity: 25 000 tonnes of meat/year.
CJSC Pig farm Uralsky (affiliate
of CJSC Siberian agrogroup)
Sverdlovsk Region
143.3 2007 2009

Russian Federation - Meat sector review
177
Name and brief project description
Implementing company (holding)
RegionInvestment,
millionUSD
Starting year
Project at full
capacity
16
Construction of two pig complexes in Karachai District.The complexes can hold 63 000 pigs and 2 530 sows and the slaughterhouse has a capacity of 20 tonnes/shift.
LLC Bryansk Meat Processing Complex» (Tsar-
Myaso Group)
Bryansk Region
- 2007 2012
17
Completion of the pig farm Zhuravskii, and 1 200 gilts were delivered to reproducer.
Agroindustrial holding Miratorg
Belgorod Region
56.7 - 2009
18
Completion of the last, fourth area of the pig complex in Millerovo District, which has a capacity of 11 000 tonnes of pork/year.
GC Russian Agroindustrial
Trust
Rostov Region
53.3 2008 2011
Source: Authors’ presentation based on information obtained from market operators, companies’ announcements, development programmes, etc.

178
Annex 11 - recent investments in the beef sector
Name and brief project description
Implementing company (holding)
RegionInvestment,
millionUSD
Starting year
Project at full
capacity
1
Phase one of beef production and processing project completed in 2010. Payback period is 15 years. In December 2011, four new farms in Trubchevsk and Pochep Areas were populated with 14 000 Aberdeen-Angus breeding cattle. The total volume of six cattle farms accounts to 20 000 heads. By 2014, the project will comprise 37 farms with 274 000 animals, 112 000 of which will be the breeders. Feedlots will allow breeding up to 37 000 animals. Production capacity of the project is 48 000 tonnes of meat/year. Slaughter and primary processing facilities will be built in 2013-2014. The project requires 150 000 hectares of land.
Agro-industrial holding Miratorg
Bryansk Region
800 2009 2014
2
Construction of the first of a set of five rearing complexes for 5 860 heads of beef cattle.
Agro-holding Marble Meat of
Kalmykia
Republic of
Kalmykia133 2011
3
Construction of a farm for beef production for 4 000 cows or 2 000 tonnes of beef.
JSC Maximovsky
Meat Processing
Complex
Tambov Region
66.1 2010 2013

Russian Federation - Meat sector review
179
Name and brief project description
Implementing company (holding)
RegionInvestment,
millionUSD
Starting year
Project at full
capacity
4
Construction of a dairy and meat complex for 600 heads of cattle in Goreloe. In 2012 there was an annual production of 4 000 tonnes of milk and 180 tonnes of meat.
CJSC Agro-complex
TAmbovsky
Tambov Region
33.3 2011 2013
5
A beef cattle breeding farm, started in 2007 in the Kaluga on 3 000 hectares, produced 1.1 thousand heads in 2012 and 2 500 heads in 2013. The total population is projected to reach 2 – 25 000 bulls in 2016. The project uses Hereford and Simmental breeds, mainly from Germany and Russian Federation.
LLC NesterovkaKaluga Region
EUR 4 million 2007 2013
6Expansion of marbled beef project in Hlevensky District.
LLC AllbeefLipetsk Region
No data 2010 2011
7Establishment of new beef cattle farms in Pytalovo Area.
LLC Gereford-center
Pskov Region
Around 20 2011 2013
8
1.4 000 heads of Aberdeen Angus and Hereford breeders from the United States were delivered at the end of 2010 to the farm Stevenson Sputnik. 1.8 thousand head were delivered to LLC Breeding Farm Angus-Shestakovo in fall 2011.
LLC Stevenson-Sputnik and LLC
Angus
Voronezh Region
38 2010 2012
Source: Authors’ presentation based on information obtained from market operators,
companies’ announcements, development programmes, etc.
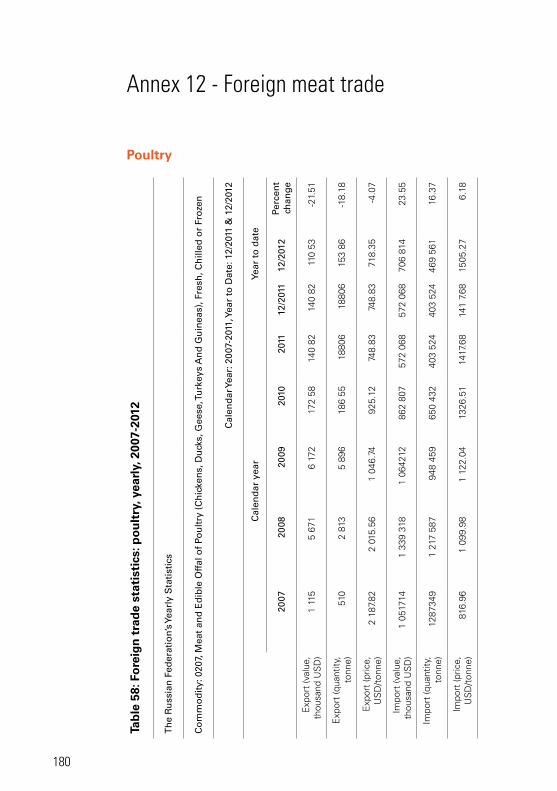
180
Annex 12 - Foreign meat trade
Poultry
Tab
le 5
8: F
ore
ign
tra
de
stat
isti
cs: p
ou
ltry
, yea
rly,
200
7-20
12
Th
e R
uss
ian
Fed
erat
ion’
s Yea
rly
Sta
tist
ics
Co
mm
od
ity:
020
7, M
eat
and
Ed
ible
Off
al o
f Po
ult
ry (
Ch
icke
ns,
Du
cks,
Gee
se, T
urk
eys
An
d G
uin
eas)
, Fre
sh, C
hill
ed o
r Fr
oze
n
Cal
end
ar Y
ear:
200
7-20
11, Y
ear
to D
ate:
12/
2011
& 1
2/20
12
Cal
end
ar y
ear
Year
to
dat
e
2007
2008
20
09
2010
20
11
12/2
011
12/2
012
Perc
ent
chan
ge
Exp
ort
(val
ue,
thou
sand
US
D)
1 11
55
671
6 17
217
2 58
140
82 1
40 8
211
0 53
-21.
51
Exp
ort
(qua
ntity
, to
nne)
510
2 81
35
896
186
5518
806
1880
615
3 86
-18.
18
Exp
ort
(pric
e,
US
D/t
onne
)2
187.
822
015.
561
046.
7492
5.12
748.
8374
8.83
718.
35-4
.07
Impo
rt (v
alue
, th
ousa
nd U
SD
)1
0517
141
339
318
1 06
4212
862
807
572
068
572
068
706
814
23.5
5
Impo
rt (q
uant
ity,
tonn
e)12
8734
91
217
587
948
459
650
432
403
524
403
524
469
561
16.3
7
Impo
rt (p
rice,
U
SD
/ton
ne)
816.
961
099.
981
122.
0413
26.5
114
17.6
814
1 7.
6815
05.2
76.
18

Russian Federation - Meat sector review
181
Imp
ort
Valu
e in
th
ou
san
d U
SD
Part
ner
co
un
try
Cal
end
ar y
ear
Year
to
dat
e
2007
2008
20
09
2010
20
11
12/2
011
12/2
012
Perc
ent
chan
ge
Wor
ld1
051
714
1 33
9 31
81
064
212
862
807
572
068
572
068
706
814
23.5
5
Uni
ted
Sta
tes
634
887
835
895
733
133
331
208
307
044
307
044
338
312
10.1
8
Bra
zil
245
694
294
935
131
719
257
693
150
010
150
010
156
008
4
Ger
man
y71
621
95 6
8897
486
123
868
32 4
4232
442
10 3
34-6
8.15
Fran
ce49
694
58 1
7959
967
40 3
2931
736
31 7
3635
466
11.7
5
Ukr
aine
00
016
511
417
11 4
1768
937
503.
8
Hun
gary
2 16
13
630
5 48
214
907
7 14
37
143
10 5
8048
.12
Arg
entin
a3
123
6 32
16
744
9 81
16
824
6 82
419
477
185.
41
Bel
gium
22 4
6315
018
6 19
211
890
5 11
65
116
9 05
777
.04
Den
mar
k1
261
3 74
97
423
25 6
974
723
4 72
397
9-7
9.26
Finl
and
3 75
13
390
1 07
55
145
3 92
23
922
7 3
9288
.49

182
Exp
ort
Valu
e in
th
ou
san
d U
SD
Part
ner
co
un
try
Cal
end
ar y
ear
Year
to
dat
e
2007
2008
20
09
2010
20
11
12/2
011
12/2
012
Perc
ent
chan
ge
Wor
ld1
115
5 67
16
172
17 2
5814
082
14 0
8211
053
-21.
51
Hon
g Ko
ng0
067
96
083
6 88
66
886
5 49
1-2
0.25
Viet
Nam
2412
01
428
4 81
44
661
4 66
11
540
-66.
97
Abk
hazi
a0
650
2 48
61
823
1 94
81
948
3 22
465
.49
Chi
na0
00
4525
725
70
-100
Tajik
ista
n0
619
926
420
420
43
-98.
39
Aze
rbai
jan
013
00
8787
0-1
00
Sval
bard
& J
an
May
en0
00
038
380
-100
Pana
ma
00
00
11
0-1
00
Nor
way
00
00
00
0-1
00
Bel
ize
00
00
00
0-1
00
Sou
rce:
Cus
tom
s C
omm
ittee
of
the
Rus
sian
Fed
erat
ion
and
GTI
S.

Russian Federation - Meat sector review
183
Figure 65: Foreign trade statistics: poultry imports, monthly, 2009-2012
0
300 000
250 000
200 000
150 000
100 000
50 000
Import value,thousand USD (left axis)
Import quantity, tonnes (left axis)
Import price,USD/ tonne (right axis)
1 600
1 800
1 200
1 400
1 000
800
400
600
200
0
01/2
009
02/2
009
03/2
009
04/2
009
05/2
009
06/2
009
07/2
009
08/2
009
09/2
009
10/2
009
11/2
009
12/2
009
01/2
010
02/2
010
03/2
010
04/2
010
05/2
010
06/2
010
07/2
010
08/2
010
09/2
010
10/2
010
11/2
010
12/2
010
01/2
011
02/2
011
03/2
011
04/2
011
05/2
011
06/2
011
07/2
011
08/2
011
09/2
011
10/2
011
11/2
011
12/2
011
01/2
012
02/2
012
03/2
012
04/2
012
05/2
012
06/2
012
07/2
012
08/2
012
09/2
012
10/2
012
11/2
012
12/2
012
Source: Customs Committee of the Russian Federation and GTIS.
Figure 66: Foreign trade statistics: poultry export, monthly, 2008-2012
Export value,thousand USD (left axis)
Export quantity, tonnes (left axis)
Export price,USD/ tonne (right axis)
3 500
3 000
2 500
2 000
1 500
1 000
500
2 500
2 000
1 500
1 000
500
00
01/2
009
02/2
009
03/2
009
04/2
009
05/2
009
06/2
009
07/2
009
08/2
009
09/2
009
10/2
009
11/2
009
12/2
009
01/2
010
02/2
010
03/2
010
04/2
010
05/2
010
06/2
010
07/2
010
08/2
010
09/2
010
10/2
010
11/2
010
12/2
010
01/2
011
02/2
011
03/2
011
04/2
011
05/2
011
06/2
011
07/2
011
08/2
011
09/2
011
10/2
011
11/2
011
12/2
011
01/2
012
02/2
012
03/2
012
04/2
012
05/2
012
06/2
012
07/2
012
08/2
012
09/2
012
10/2
012
11/2
012
12/2
012
Source: Customs Committee of the Russian Federation and GTIS.

184
PorkTa
ble
59:
Fo
reig
n t
rad
e st
atis
tics
: po
rk m
eat,
yea
rly,
200
7-20
12
Th
e R
uss
ian
Fed
erat
ion’
s Yea
rly
Sta
tist
ics
Co
mm
od
ity:
020
3, M
eat
of
Sw
ine
(Po
rk),
Fre
sh, C
hill
ed o
r Fr
oze
n
Cal
end
ar Y
ear:
200
7-20
11, Y
ear
to D
ate:
12/
2011
& 1
2/20
12
Cal
end
ar y
ear
Year
to
dat
e
2007
2008
20
09
2010
20
11
12/2
011
12/2
012
Perc
ent
chan
ge
Exp
ort
(val
ue,
thou
sand
US
D)
194
194
505
320
287
287
151
-47.
3
Exp
ort
(qua
ntity
, to
nne)
9060
162
120
4646
33-2
9.62
Exp
ort
(pric
e, U
SD
/to
nne)
2 14
83
232
3 12
32
677
6 17
06
170
4 61
9-2
5.13
Impo
rt (v
alue
, th
ousa
nd U
SD
)1
636
651
2 20
0 46
41
860
679
1 92
3 03
42
108
704
2 10
8 70
42
406
649
14.1
3
Impo
rt (q
uant
ity,
tonn
e)67
1 73
979
0 95
563
5 67
064
0 62
665
6 59
065
6 59
072
0 24
19.
69
Impo
rt (p
rice,
US
D/
tonn
e)2
436
2 78
22
927
3 00
13
211
3 21
13
341
4.04
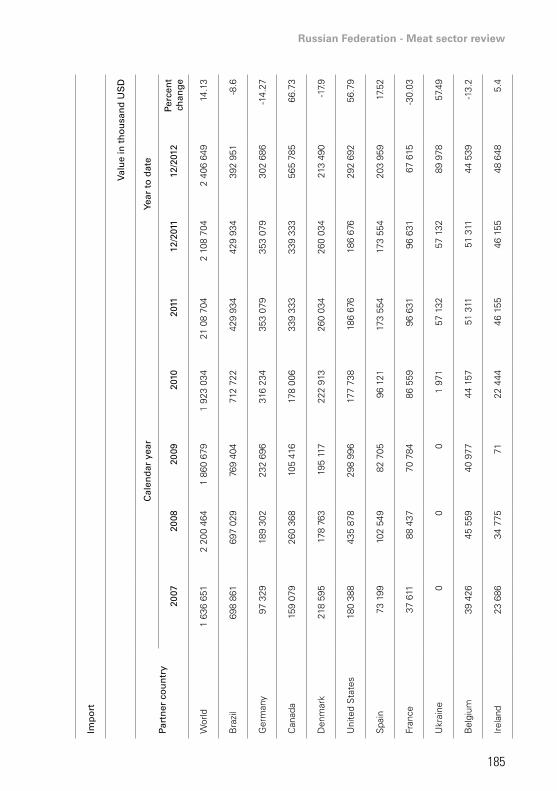
Russian Federation - Meat sector review
185
Imp
ort
Valu
e in
th
ou
san
d U
SD
Part
ner
co
un
try
Cal
end
ar y
ear
Year
to
dat
e
2007
2008
20
09
2010
20
11
12/2
011
12/2
012
Perc
ent
chan
ge
Wor
ld1
636
651
2 20
0 46
41
860
679
1 92
3 03
421
08
704
2 10
8 70
42
406
649
14.1
3
Bra
zil
698
861
697
029
769
404
712
722
429
934
429
934
392
951
-8.6
Ger
man
y97
329
189
302
232
696
316
234
353
079
353
079
302
686
-14.
27
Can
ada
159
079
260
368
105
416
178
006
339
333
339
333
565
785
66.7
3
Den
mar
k21
8 59
517
8 76
319
5 11
722
2 91
326
0 03
426
0 03
421
3 49
0-1
7.9
Uni
ted
Sta
tes
180
388
435
878
298
996
177
738
186
676
186
676
292
692
56.7
9
Spa
in73
199
102
549
82 7
0596
121
173
554
173
554
203
959
17.5
2
Fran
ce37
611
88 4
3770
784
86 5
5996
631
96 6
3167
615
-30.
03
Ukr
aine
00
01
971
57 1
3257
132
89 9
7857
.49
Bel
gium
39 4
2645
559
40 9
7744
157
51 3
1151
311
44 5
39-1
3.2
Irel
and
23 6
8634
775
7122
444
46 1
5546
155
48 6
485.
4

186
Exp
ort
Valu
e in
th
ou
san
d U
SD
Part
ner
co
un
try
Cal
end
ar y
ear
Year
to
dat
e
2007
2008
20
09
2010
20
11
12/2
011
12/2
012
Perc
ent
chan
ge
Wor
ld0
0.08
630
.885
30.2
740
03.
569
n/a
Abk
hazi
a0
00
4.28
90
03.
569
n/a
Kaz
akhs
tan
00.
086
30.8
8525
.985
00
0n/
a
Sou
rce:
Cus
tom
s C
omm
ittee
of
the
Rus
sian
Fed
erat
ion
and
GTI
S.

Russian Federation - Meat sector review
187
Figure 67: Foreign trade statistics: pork meat imports, monthly, 2009-2012
4 000
3 500
2 500
2 000
1 500
1 000
500
0
3 000
Import valuethousand USD (left axis)
Import quantity tonne (left axis)
Import price USD/tonne (right axis)
300 000
250 000
200 000
150 000
100 000
50 000
0
01/2
009
02/2
009
03/2
009
04/2
009
05/2
009
06/2
009
07/2
009
08/2
009
09/2
009
10/2
009
11/2
009
12/2
009
01/2
010
02/2
010
03/2
010
04/2
010
05/2
010
06/2
010
07/2
010
08/2
010
09/2
010
10/2
010
11/2
010
12/2
010
01/2
011
02/2
011
03/2
011
04/2
011
05/2
011
06/2
011
07/2
011
08/2
011
09/2
011
10/2
011
11/2
011
12/2
011
01/2
012
02/2
012
03/2
012
04/2
012
05/2
012
06/2
012
07/2
012
08/2
012
09/2
012
10/2
012
11/2
012
12/2
012
Source: Customs Committee of the Russian Federation and GTIS.
Figure 68: Foreign trade statistics: pork meat exports, monthly, 2009-2012
Export valuethousand USD (left axis)
Export quantity tonnes (left axis)
Export price USD/tonne (right axis)
0
200180160140
12010080
608020
10 000
12 000
6 000
8 000
4 000
2 000
0
01/2
009
02/2
009
03/2
009
04/2
009
05/2
009
06/2
009
07/2
009
08/2
009
09/2
009
10/2
009
11/2
009
12/2
009
01/2
010
02/2
010
03/2
010
04/2
010
05/2
010
06/2
010
07/2
010
08/2
010
09/2
010
10/2
010
11/2
010
12/2
010
01/2
011
02/2
011
03/2
011
04/2
011
05/2
011
06/2
011
07/2
011
08/2
011
09/2
011
10/2
011
11/2
011
12/2
011
01/2
012
02/2
012
03/2
012
04/2
012
05/2
012
06/2
012
07/2
012
08/2
012
09/2
012
10/2
012
11/2
012
12/2
012
Source: Customs Committee of the Russian Federation and GTIS.

188
BeefTa
ble
60:
Fo
reig
n t
rad
e st
atis
tics
: bov
ine
mea
t fr
oze
n, y
earl
y, 2
007-
2012
Th
e R
uss
ian
Fed
erat
ion’
s Yea
rly
Sta
tist
ics
Co
mm
od
ity:
020
2, M
eat
of
Bov
ine
An
imal
s, F
roze
n
Cal
end
ar Y
ear:
200
7-20
11, Y
ear
to D
ate:
12/
2011
& 1
2/20
12
Cal
end
ar y
ear
Year
to
dat
e
2007
2008
20
09
2010
20
11
12/2
011
12/2
012
Perc
ent
chan
ge
Exp
ort
(va
lue,
th
ou
san
d U
SD
)31
.471
224.
0837
1.65
94.
366
147.
426
147,
426
115.
022
-21.
98
Exp
ort
(q
uan
tity
, to
nn
e)11
9086
228
2816
-44.
65
Exp
ort
(p
rice
, U
SD
/to
nn
e)2
836.
52
495.
574
335.
232
617.
515
185.
275
185.
277
308.
7140
.95
Imp
ort
(va
lue,
th
ou
san
d (
US
D)
1 69
8 70
5.94
42
572
922.
413
2 19
5 17
8.43
52
072
237.
098
2 21
7 04
8.92
32
217
048,
922
583
316.
1816
.52
Imp
ort
(q
uan
tity
, to
nn
e)71
2 81
279
1 15
962
407
760
6 08
356
6 54
556
6 54
558
4 61
53.
19
Imp
ort
(p
rice
, U
SD
/to
nn
e)2
383.
13
252.
093
517.
483
419.
073
913.
283
913.
284
418.
8312
.92

Russian Federation - Meat sector review
189
Imp
ort
Valu
e in
th
ou
san
d U
SD
Part
ner
co
un
try
Cal
end
ar y
ear
Year
to
dat
e
2007
2008
20
09
2010
20
11
12/2
011
12/2
012
Perc
ent
chan
ge
Wor
ld1
698
705.
944
2 57
2 92
2.41
32
195
178.
435
2 07
2 23
7.09
82
217
048.
923
2 21
7 04
8.92
2 58
3 31
6.18
16.5
2
Bra
zil
1 07
4 88
1.15
51
344
138.
619
1 17
3 07
4.81
997
2 39
3.66
792
0 21
7.66
192
0 21
7.66
110
9 64
87.5
19.1
6
Uru
guay
50 2
90.6
826
2 85
9.41
622
6 23
9.52
726
2 13
9.18
288
561.
237
288
561.
237
277
565.
953
-3.8
1
Aus
tral
ia8
219.
121
227
217.
011
59 7
86.5
3414
8 38
4.44
523
9 47
1.50
423
9 47
1.50
412
2 93
7.28
2-4
8.66
Para
guay
157
187.
371
269
676.
366
16 1
321.
8421
0 74
0.80
718
2 91
0.78
218
2 91
0.78
254
6 99
0.86
219
9.05
Uni
ted
Sta
tes
071
853
.878
1 16
22.9
2587
875
.951
163
669.
743
163
669.
743
220
022.
267
34.4
3
Mex
ico
00
010
541
.157
88 2
42.6
3188
242
.631
118
188.
193
33.9
4
Arg
entin
a25
9 40
1.48
321
2 17
6.37
547
0 03
1.22
511
3 48
9.25
256
549
.995
56 5
49.9
9536
822
.137
-34,
89
Ger
man
y14
427
.712
23 8
82.8
946
332.
394
55 3
70.6
6741
463
.002
41 4
63.0
0215
436
.093
-62.
77
Ital
y7
608.
095
27 0
91.8
093
096.
221
42 7
75.1
1339
466
.235
39 4
66.2
3522
836
.044
-42,
14
Ukr
aine
92 9
26.3
6162
108
.311
59 1
11.2
2743
208
.884
34 9
33.6
0934
933.
609
2495
2.12
6-2
8.57

190
Exp
ort
Valu
e in
th
ou
san
d U
SD
Part
ner
co
un
try
Cal
end
ar y
ear
Year
to
dat
e
2007
2008
20
09
2010
20
11
12/2
011
12/2
012
Perc
ent
chan
ge
Wor
ld31
.471
224.
0837
1.65
94
366
147.
426
147.
426
115.
022
-21.
98
Sou
th O
sset
ia0
00
014
6.64
314
6.64
355
.685
-62.
03
Pana
ma
00
00
0.58
90.
589
0-1
00
Bel
ize
00
00
0.19
40.
194
0-1
00
Den
mar
k0
2 39
70
00
00
n/a
Geo
rgia
00
139.
680
00
0n/
a
Ger
man
y0
00
00
014
.708
n/a
Kaz
akhs
tan
31.4
7118
.414
105
317
4 36
60
00
n/a
Kore
a, S
outh
00.
233
00
00
0n/
a
Net
herla
nds
070
.816
00
00
0n/
a
Pola
nd0
72.2
9862
.051
00
00
n/a
Sou
rce:
Cus
tom
s C
omm
ittee
of
the
Rus
sian
Fed
erat
ion
and
GTI
S.

Russian Federation - Meat sector review
191
Figure 69: Foreign trade statistics: bovine meat frozen imports, monthly, 2009-2012
0
350 000
200 000
300 000
250 000
150 000
100 000
50 000
5 000
4 500
3 500
3 000
2 000
1 000
1 500
500
0
4 000
Import valuethousand USD (right axis)
Import quantity tonnes (right axis)
Import price USD/tonne (left axis)
01/2
009
02/2
009
03/2
009
04/2
009
05/2
009
06/2
009
07/2
009
08/2
009
09/2
009
10/2
009
11/2
009
12/2
009
01/2
010
02/2
010
03/2
010
04/2
010
05/2
010
06/2
010
07/2
010
08/2
010
09/2
010
10/2
010
11/2
010
12/2
010
01/2
011
02/2
011
03/2
011
04/2
011
05/2
011
06/2
011
07/2
011
08/2
011
09/2
011
10/2
011
11/2
011
12/2
011
01/2
012
02/2
012
03/2
012
04/2
012
05/2
012
06/2
012
07/2
012
08/2
012
09/2
012
10/2
012
11/2
012
12/2
012
Source: Customs Committee of the Russian Federation and GTIS.
Figure 70: Foreign trade statistics: bovine meat frozen exports, monthly, 2009-2012
0
160
100
80
140120
60
40
20
10 0009 0008 0007 0006 0005 0004 0003 0002 0001 0000
Export valuethousand USD (left axis)
Export price USD/tonne (right axis)
Export quantity tonnes (left axis)
01/2
009
02/2
009
03/2
009
04/2
009
05/2
009
06/2
009
07/2
009
08/2
009
09/2
009
10/2
009
11/2
009
12/2
009
01/2
010
02/2
010
03/2
010
04/2
010
05/2
010
06/2
010
07/2
010
08/2
010
09/2
010
10/2
010
11/2
010
12/2
010
01/2
011
02/2
011
03/2
011
04/2
011
05/2
011
06/2
011
07/2
011
08/2
011
09/2
011
10/2
011
11/2
011
12/2
011
01/2
012
02/2
012
03/2
012
04/2
012
05/2
012
06/2
012
07/2
012
08/2
012
09/2
012
10/2
012
11/2
012
12/2
012
Source: Customs Committee of the Russian Federation and GTIS.

192
Tab
le 6
1: F
ore
ign
tra
de
stat
isti
cs: b
ovin
e m
eat
fres
h o
r ch
illed
, yea
rly,
200
7-20
12
Th
e R
uss
ian
Fed
erat
ion’
s Yea
rly
Sta
tist
ics
Co
mm
od
ity:
020
1, M
eat
of
Bov
ine
An
imal
s, F
resh
or
Ch
illed
Cal
end
ar Y
ear:
200
7-20
11, Y
ear
to D
ate:
12/
2011
& 1
2/20
12
Cal
end
ar y
ear
Year
to
dat
e
2007
2008
20
09
2010
20
11
12/2
011
12/2
012
Perc
ent
chan
ge
Exp
ort
(val
ue, t
hous
and
US
D)
00.
086
30.8
8530
.274
00
3.56
9n/
a
Exp
ort
(qua
ntity
, ton
ne)
00
44
00
1n/
a
Exp
ort
(pric
e, U
SD
ton
ne)
01
954.
556
881.
686
806.
20
04
406.
57n/
a
Impo
rt (v
alue
, th
ousa
nd U
SD
)70
858
.488
196
.63
58 2
50.5
398
128
.18
199
983.
4719
9 98
3.47
218
550.
39.
28
Impo
rt
(qua
ntity
,ton
ne)
21 1
3319
571
11 7
6519
748
35 7
3235
732
41 1
6515
.2
Impo
rt (p
rice,
US
D/
tonn
e)3
352.
94
506.
544
951.
234
969.
15
596.
85
596.
85
309.
16-5
.14

Russian Federation - Meat sector review
193
Imp
ort
Valu
e in
th
ou
san
d U
SD
Part
ner
co
un
try
Cal
end
ar y
ear
Year
to
dat
e
2007
2008
20
09
2010
20
11
12/2
011
12/2
012
Perc
ent
chan
ge
Wor
ld70
858
.488
196
.63
58 2
50.5
398
128
.18
199
983.
4719
9 98
3.47
218
550.
39.
28
Lith
uani
a38
661
.11
45 9
58.1
531
433
.39
42 1
16.1
980
600
.207
80 6
00.2
0768
361
.823
-15.
18
Ger
man
y24
225
.95
27 4
22.1
315
103
.15
25 2
13.0
836
224
.399
36 2
24.3
9914
058
.928
-61.
19
Ukr
aine
24 2
25.9
50
150.
488
663.
748
22 9
87.6
5222
987
.652
40 5
42.4
0376
.37
Aus
tral
ia3
811.
043
8 84
9.54
29
531.
085
14 3
89.1
813
615
.255
13 6
15.2
5518
257
.393
34.1
Uni
ted
Sta
tes
02
889.
336
1 50
4.43
463
83.
922
13 1
01.3
5113
101
.351
16 9
35.4
6629
.27
Pola
nd0
1 02
6.11
581
.797
6 30
0.07
12 9
02.9
1412
902
.914
2 31
64.7
279
.53
Mol
dova
00
43.7
571
274.
492
8 47
3.47
88
473.
478
8 23
0.08
-2.8
7
Den
mar
k0
1 42
8.41
40
04
202.
246
4 20
2.24
67
289.
031
73.4
6
Aus
tria
30.3
465.
046
10.2
637
7.36
92
287.
889
2 28
7.88
977
0.68
5-6
6.31
Bra
zil
33.7
8429
2.38
379
.511
304.
917
2 18
8.18
12
188.
181
13 8
05.4
9953
0.91

194
Exp
ort
Valu
e in
th
ou
san
d U
SD
Part
ner
co
un
try
Cal
end
ar y
ear
Year
to
dat
e
2007
2008
20
09
2010
20
11
12/2
011
12/2
012
Perc
ent
chan
ge
Wor
ld19
419
450
532
028
728
715
1-4
7.3
Abk
hazi
a0
061
4827
627
673
-73.
64
Sval
bard
& J
an
May
en0
00
07
70
-100
Pana
ma
00
00
33
0-1
00
Bel
ize
00
00
11
0-1
00
Nor
way
00
03
00
0-1
00
Aze
rbai
jan
00
00
00
0n/
a
Bel
gium
00
580
00
0n/
a
Den
mar
k0
091
00
00
n/a
Geo
rgia
00
170
00
0n/
a
Ger
man
y64
840
147
00
0n/
a
Sou
rce:
Cus
tom
s C
omm
ittee
of
the
Rus
sian
Fed
erat
ion
and
GTI
S.

Russian Federation - Meat sector review
195
Figure 71: Foreign trade statistics: bovine meat fresh or chilled imports, monthly, 2009-2012
7 000
6 000
5 000
4 000
3 000
2 000
1 000
0
Import valuethousand USD (left axis)
Import priceUSD/tonnes (right axis)
Import quantitytonnes (left axis)
25 000
20 000
15 000
10 000
5 000
0
01/2
009
02/2
009
03/2
009
04/2
009
05/2
009
06/2
009
07/2
009
08/2
009
09/2
009
10/2
009
11/2
009
12/2
009
01/2
010
02/2
010
03/2
010
04/2
010
05/2
010
06/2
010
07/2
010
08/2
010
09/2
010
10/2
010
11/2
010
12/2
010
01/2
011
02/2
011
03/2
011
04/2
011
05/2
011
06/2
011
07/2
011
08/2
011
09/2
011
10/2
011
11/2
011
12/2
011
01/2
012
02/2
012
03/2
012
04/2
012
05/2
012
06/2
012
07/2
012
08/2
012
09/2
012
10/2
012
11/2
012
12/2
012
Source: Customs Committee of the Russian Federation and GTIS.
Figure 72: Foreign trade statistics: bovine meat fresh or chilled exports, monthly, 2009-2012
Export value thousand USD (left axis)
Export quantity tonnes (left axis)
Export price USD/tonne (right axis)
30
25
20
15
10
5
0
8 000
7 000
6 000
5 000
4 0003 000
1 0000
2 000
01/2
009
02/2
009
03/2
009
04/2
009
05/2
009
06/2
009
07/2
009
08/2
009
09/2
009
10/2
009
11/2
009
12/2
009
01/2
010
02/2
010
03/2
010
04/2
010
05/2
010
06/2
010
07/2
010
08/2
010
09/2
010
10/2
010
11/2
010
12/2
010
01/2
011
02/2
011
03/2
011
04/2
011
05/2
011
06/2
011
07/2
011
08/2
011
09/2
011
10/2
011
11/2
011
12/2
011
01/2
012
02/2
012
03/2
012
04/2
012
05/2
012
06/2
012
07/2
012
08/2
012
09/2
012
10/2
012
11/2
012
12/2
012
Source: Customs Committee of the Russian Federation and GTIS.

196
Offal
Tab
le 6
2: F
ore
ign
tra
de
stat
isti
cs: e
dib
le o
ffal
, yea
rly,
200
7-20
12
Th
e R
uss
ian
Fed
erat
ion’
s Yea
rly
Sta
tist
ics
Co
mm
od
ity:
020
6, E
dib
le O
ffal
of
Bov
ine
An
imal
s, S
win
e, S
hee
p, G
oat
s, H
ors
es, e
tc. F
resh
, Ch
illed
or
Fro
zen
Cal
end
ar Y
ear:
200
7-20
11, Y
ear
to D
ate:
12/
2011
& 1
2/20
12
Cal
end
ar y
ear
Year
to
dat
e
2007
2008
20
09
2010
20
11
12/2
011
12/2
012
Perc
ent
chan
ge
Exp
ort
(val
ue,
thou
sand
US
D)
74.4
4620
6.51
830
9.48
515
1.16
61
211.
449
1 21
1.44
92
954.
048
143.
84
Exp
ort
(qua
ntity
, to
nne)
6215
622
714
887
487
41
944
122.
43
Exp
ort
(pric
e,
US
D/t
onne
)1
208.
261
325.
391
362.
681
019.
851
385.
811
385.
811
519.
269.
63
Impo
rt (v
alue
, th
ousa
nd U
SD
)33
0 23
2.58
142
1 59
2.64
240
4 60
0.36
840
5 56
5.23
444
0 60
3.14
644
0 60
3.14
645
9 72
6.87
24.
34
Impo
rt
(qua
ntity
, to
nne)
307
163
321
352
297
762
291
833
291
005
291
005
273
458
-6.0
3
Impo
rt (p
rice,
U
SD
/ton
ne)
1 07
5.1
1 31
1.93
1 35
8.8
1 38
9.72
1 51
4.07
1 51
4.07
1 68
1.16
11.0
4

Russian Federation - Meat sector review
197
Imp
ort
Valu
e in
th
ou
san
d U
SD
Part
ner
co
un
try
Cal
end
ar y
ear
Year
to
dat
e
2007
2008
20
09
2010
20
11
12/2
011
12/2
012
Perc
ent
chan
ge
Wor
ld33
0 23
2.58
142
1 59
2.64
240
4 60
0.36
840
5 56
5.23
444
0 60
3.14
644
0 60
3.14
645
9 72
6.87
24.
34
Ger
man
y47
961
.085
85 0
31.8
1394
082
.841
85 4
70.8
5475
125
.375
1 25
.360
241
.875
-19.
81
Arg
entin
a40
940
.604
44 4
47.5
9268
155
.057
51 4
69.8
9654
485
.621
54 4
85.6
2172
836
.826
33.6
8
Uni
ted
Sta
tes
28 9
39.8
7774
406
.175
70 2
62.5
8961
495
.913
49 2
88.3
9449
288
.394
62 3
17.5
8826
.43
Den
mar
k31
776
.832
17 7
11.1
9916
124
.033
17 0
92.5
4534
825
.021
34 8
25.0
2129
146
.671
-16.
31
Spa
in21
311
.185
34 1
53.4
7720
078
.982
25 9
24.6
1831
626
.347
31 6
26.3
4747
307
.158
49.5
8
Aus
tral
ia22
207
.306
28 4
88.9
2317
959
.482
20 5
64.9
6524
045
.793
24 0
45.7
9323
350
.687
-2.8
9
Can
ada
13 3
23.3
8915
031
.173
17 3
14.5
3419
005
.38
18 8
92.1
0818
892
.108
23 3
61.8
1823
.66
Fran
ce21
697
.424
25 6
31.8
0720
775
.056
17 1
80.5
818
204
.489
18 2
04.4
8916
848
.929
-7.4
5
Ital
y8
602.
611
14 5
39.7
319
158.
255
11 4
70.6
2517
027
.217
17 0
27.2
1718
570
.169
9.06
Aus
tria
3 50
7.37
26
787.
624
7 37
1.11
410
621
.983
16 2
27.3
2116
227
.321
14 7
39.1
09-9
.17

198
Exp
ort
Valu
e in
th
ou
san
d U
SD
Part
ner
co
un
try
Cal
end
ar y
ear
Year
to
dat
e
2007
2008
20
09
2010
20
11
12/2
011
12/2
012
Perc
ent
chan
ge
Wor
ld74
.446
206.
518
309.
485
151.
166
1 21
1.44
91
211.
449
2 95
4.04
814
3.84
Hon
g Ko
ng0
00
01
181.
531
181.
532
927.
272
147.
75
Viet
nam
00
030
.291
27.0
2627
.026
0-1
00
Sval
bard
& J
an M
ayen
00
00
2.89
32.
893
0-1
00
Thai
land
00
00
00
20.2
54n/
a
Uni
dent
ified
Cou
ntry
00
1.42
60
00
5.59
8n/
a
Uni
ted
Sta
tes
00
71.0
80
00
0n/
a
Ital
y32
.998
042
.689
00
00
n/a
Lith
uani
a0
00
7.61
40
00
n/a
Net
herla
nds
29.7
940
00
00
0n/
a
Pola
nd0
014
.274
00
00
n/a
Sou
rce:
Cus
tom
s C
omm
ittee
of
the
Rus
sian
Fed
erat
ion
and
GTI
S.

Russian Federation - Meat sector review
199
Figure 73: Foreign trade statistics: edible offal imports, monthly, 2009-2012
0
10 000
60 000
50 000
40 000
30 000
20 000
0
200
800
600
400
1 000
2 000
1 800
1 600
1 400
1 200
Import valuethousand USD (left axis)
Import priceUSD/tonnes (right axis)
Import quantitytonnes(left axis)
01/2
009
02/2
009
03/2
009
04/2
009
05/2
009
06/2
009
07/2
009
08/2
009
09/2
009
10/2
009
11/2
009
12/2
009
01/2
010
02/2
010
03/2
010
04/2
010
05/2
010
06/2
010
07/2
010
08/2
010
09/2
010
10/2
010
11/2
010
12/2
010
01/2
011
02/2
011
03/2
011
04/2
011
05/2
011
06/2
011
07/2
011
08/2
011
09/2
011
10/2
011
11/2
011
12/2
011
01/2
012
02/2
012
03/2
012
04/2
012
05/2
012
06/2
012
07/2
012
08/2
012
09/2
012
10/2
012
11/2
012
12/2
012
Source: Customs Committee of the Russian Federation and GTIS.
Figure 74: Foreign trade statistics: edible offal exports, monthly, 2009-2012
0
100
600
500
400
300
200
0
500
1 000
3 000
4 500
4 000
3 500
2 500
2 000
1 500
Export value thousand USD (left axis)
Export quantity tonnes (left axis)
Export price USD/tonne (right axis)
01/2
009
02/2
009
03/2
009
04/2
009
05/2
009
06/2
009
07/2
009
08/2
009
09/2
009
10/2
009
11/2
009
12/2
009
01/2
010
02/2
010
03/2
010
04/2
010
05/2
010
06/2
010
07/2
010
08/2
010
09/2
010
10/2
010
11/2
010
12/2
010
01/2
011
02/2
011
03/2
011
04/2
011
05/2
011
06/2
011
07/2
011
08/2
011
09/2
011
10/2
011
11/2
011
12/2
011
01/2
012
02/2
012
03/2
012
04/2
012
05/2
012
06/2
012
07/2
012
08/2
012
09/2
012
10/2
012
11/2
012
12/2
012
Source: Customs Committee of the Russian Federation and GTIS.

Please address questions and comments to:Investment Centre DivisionFood and Agriculture Organization of the United Nations (FAO)Viale delle Terme di Caracalla – 00153 Rome, Italy [email protected]://www.fao.org/investment/en
Russian Federation: Meat sector reviewReport No. 15 - July 2014 I353
3E/1
/11.
13
FAO Investment CentreCOUNTRy HIGHLIGHTS
Russian FederationMeat sector review
Ru
ssian Fed
eration
– Meat secto
r reviewR
epo
rt No
. 15