fao - nutrition country laos · fao - nutrition country laos nutrition country profiles – laos...
TRANSCRIPT
FOOD AND AGRICULTURE ORGANIZATION OF THE UNITED NATIONS
FAO - NUTRITION COUNTRY
LAOS
Nutrition Country Profiles – LAOS July, 2003 FAO, Rome, Italy
Nutrition Country Profiles – LAOS
1
Note for the reader
The objective of the Nutrition Country Profiles (NCP) is to provide concise analytical summaries describing the food and nutrition situation in individual countries with background statistics on food-related factors. The profiles present consistent and comparable statistics in a standard format. This pre-defined format combines a set of graphics, tables and maps each supported by a short explanatory text. Information regarding the agricultural production demography and socio-economic level of the country are also presented. In general data presented in the NCP are derived from national sources as well as from international databases (FAO WHO...). Technical notes giving detailed information on the definition and use of the indicators provided in the profile can be obtained from ESNA upon request. An information note describing the objectives of the NCP is also available. Useful suggestions or observations to improve the quality of this product are welcome. For more information, please contact:
E-mail: [email protected]
Nutrition Country Profile of Laos
by Ms. Silvia Kaufmann for the Food and Agriculture Organization of the United Nations in collaboration with Rosanne Marchesich and Marie Claude Dop (ESNA-FAO).
The designations employed and the presentation of material in this publication do not imply the expression of any opinion whatsoever on the part of the Food and Agriculture Organization of the United Nations concerning the legal status of any country territory city or area or of its authorities or concerning the delimitation of its frontiers .
FAO 2003

Nutrition Country Profiles – LAOS
2
Table of contents
SUMMARY----------------------------------------------------------------------------------------------- 3
TABLE 1: GENERAL STATISTICS OF LAOS -------------------------------------------------- 5
I. OVERVIEW ------------------------------------------------------------------------------------------- 6
1. Geography ..........................................................................................................6 2. Population ...........................................................................................................6 3. Level of development: poverty education and health .........................................7 4. Agricultural production land use and food security.............................................8 5. Economy .............................................................................................................8
II. THE FOOD AND NUTRITION SITUATION -------------------------------------------------- 9
1. Trends in energy requirements and energy supplies ..........................................9 2. Trends in food supplies .....................................................................................10 3. Food consumption.............................................................................................12 4. Infant feeding practices .....................................................................................14 5. Anthropometric data..........................................................................................16 6. Micronutrient deficiencies..................................................................................21 7. National strategies and activities for improving nutrition ....................................26
REFERENCES-----------------------------------------------------------------------------------------28
MAPS are presented after the <REFERENCES>
General map of Laos Map 1: Population density by province. Map 2a: Prevalence of stunting in children under 5 years of age by macro-region in 2000 Map 2b: Prevalence of wasting in children under 5 years of age by macro-region in 2000 Map 3: Prevalence of BMI < 18.5 kg/m 2 in adults over 18 years of age by macro-region in 2000. Map 4a: Prevalence of total goitre rate among children 6 to 12 years by macro-region in 2000. Map 4b: Prevalence of anaemia in all age groups by macro-region in 1998 Graphs tables and maps can be visualised by clicking on the words in bold and underline only in the “Full profile” pdf file.
Nutrition Country Profiles – LAOS
3
SUMMARY With an estimated per capita income of US$400 in 1997 the Lao People’s Democratic
Republic (Lao PDR) is one of the poorest and least developed countries in the East Asian region. Social indicators are among the worst in the region. Forty six percent of the population lives below the national poverty line (World Bank, 1999). The coverage of medical facilities and immunisation is low, and infant (96 per 1000) and maternal mortality rates (65 per 10 000) are still high.
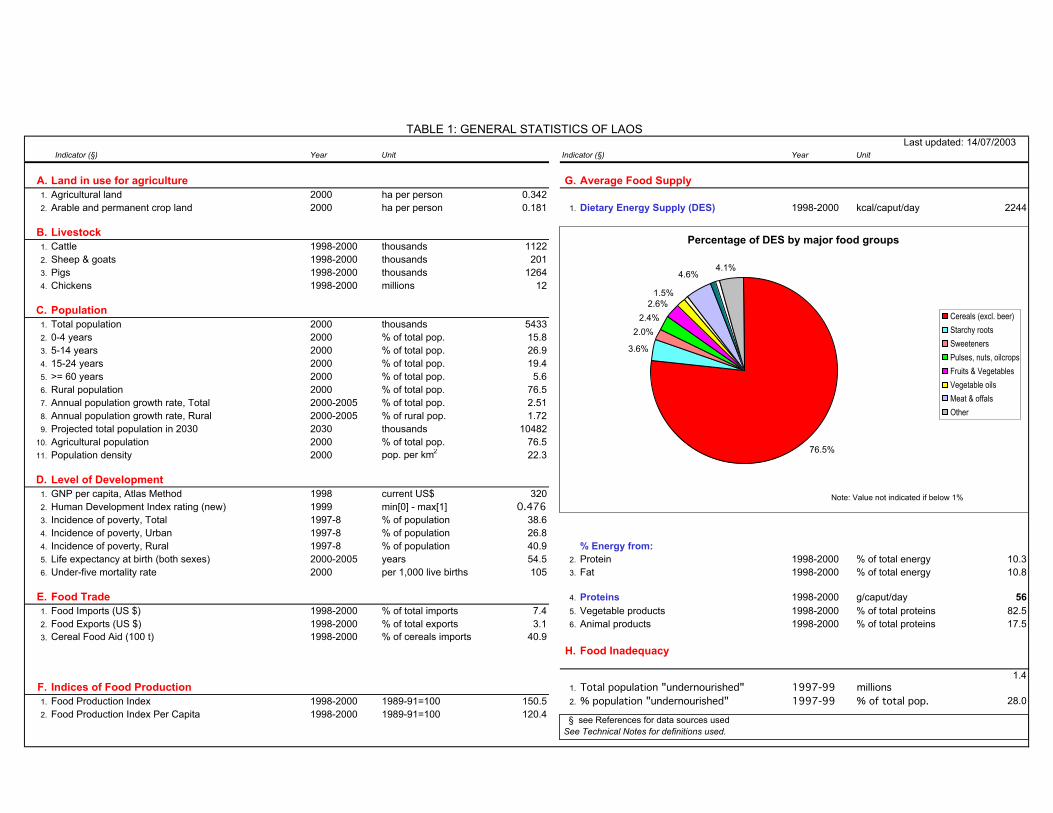
Glutinous rice represents the main food in the Lao diet. The daily dietary energy supply per caput increased from 2030 kcal in 1968 to 2400 kcal in 1995. In 1999, rice provided 69% of the energy supply and 64% of the protein supply. Generally three meals are consumed per day, light meals or snacks are seldom consumed. A typical meal consists of rice complemented with small portions of vegetables, mainly green leafy vegetables and fish. Other common food items are roots, eggs, meat, poultry and various kinds of fruit. Food consumption patterns vary geographically and ethnically.
Almost all mothers breast-feed their children and almost half of the mothers continue breast-feeding for 20 to 23 months. However complementary food is introduced much too early: one fifth of the infants receive food, mainly rice, during the first month of life. The early introduction of rice may provoke intestinal disorders and contrasts with the late introduction of other nutritive foods: 70% of children aged 10 to 11 months receive only breast-milk and water. Only a small number of children receive complementary foods at the recommended age. Breast-feeding and weaning practices differ geographically and ethnically. Feeding pre-chewed or steamed rice to new-borns is a common feature among the Lao Loum and Khamu ethnic groups while the H'mong ethnic group shows more appropriate breast-feeding and weaning practices.
The National Health Survey in 2000 has found high prevalence rates of malnutrition among children: 40% of the children under 5 years of age were underweight, 41% were stunted and 15% wasted. Compared to surveys conducted earlier, the prevalence of underweight remained the same while the prevalence of stunting decreased and in contrast the prevalence of wasting increased (Table 5a-2) (Map2a & Map 2b).
In 2000, the prevalence of chronic energy deficiency (CED) among adults was alarmingly high (19%), even higher than reported during a previous survey in 1995 (14%) (Table 5b Map 3).
Malnutrition among children as well as among adults is more prevalent in the Southern region compared to the Northern and Central ones (Table 5a-2 and 5b).
The National Health Survey included data on micro-nutrient deficiencies. The total goitre rate (TGR) among school aged children was 9% (Table 6a). Clinical signs of Vitamin A deficiency were also prevalent. A study conducted in Vientiane Province found anaemia in 56% of females aged 15 to 45 years (Table 6b).
The increase in the prevalence of wasting among pre-school children and of CED among adults is alarming and requires immediate and well designed multi-sectoral interventions integrated into health, agriculture, education and overall socio-economic development.
Last updated: 14/07/2003 Indicator (§) Year Unit Indicator (§) Year Unit
A. Land in use for agriculture G. Average Food Supply1. Agricultural land 2000 ha per person 0.3422. Arable and permanent crop land 2000 ha per person 0.181 1. Dietary Energy Supply (DES) 1998-2000 kcal/caput/day 2244
B. Livestock1. Cattle 1998-2000 thousands 11222. Sheep & goats 1998-2000 thousands 2013. Pigs 1998-2000 thousands 12644. Chickens 1998-2000 millions 12
C. Population1. Total population 2000 thousands 54332. 0-4 years 2000 % of total pop. 15.83. 5-14 years 2000 % of total pop. 26.94. 15-24 years 2000 % of total pop. 19.45. >= 60 years 2000 % of total pop. 5.66. Rural population 2000 % of total pop. 76.57. Annual population growth rate, Total 2000-2005 % of total pop. 2.518. Annual population growth rate, Rural 2000-2005 % of rural pop. 1.729. Projected total population in 2030 2030 thousands 10482
10. Agricultural population 2000 % of total pop. 76.511. Population density 2000 pop. per km2 22.3
D. Level of Development1. GNP per capita, Atlas Method 1998 current US$ 3202. Human Development Index rating (new) 1999 min[0] - max[1] 0.4763. Incidence of poverty, Total 1997-8 % of population 38.64. Incidence of poverty, Urban 1997-8 % of population 26.84. Incidence of poverty, Rural 1997-8 % of population 40.9 % Energy from:5. Life expectancy at birth (both sexes) 2000-2005 years 54.5 2. Protein 1998-2000 % of total energy 10.36. Under-five mortality rate 2000 per 1,000 live births 105 3. Fat 1998-2000 % of total energy 10.8
E. Food Trade 4. Proteins 1998-2000 g/caput/day 561. Food Imports (US $) 1998-2000 % of total imports 7.4 5. Vegetable products 1998-2000 % of total proteins 82.52. Food Exports (US $) 1998-2000 % of total exports 3.1 6. Animal products 1998-2000 % of total proteins 17.53. Cereal Food Aid (100 t) 1998-2000 % of cereals imports 40.9
H. Food Inadequacy
F. Indices of Food Production 1. Total population "undernourished" 1997-99 millions1.4
1. Food Production Index 1998-2000 1989-91=100 150.5 2. % population "undernourished" 1997-99 % of total pop. 28.02. Food Production Index Per Capita 1998-2000 1989-91=100 120.4
TABLE 1: GENERAL STATISTICS OF LAOS
§ see References for data sources used See Technical Notes for definitions used.
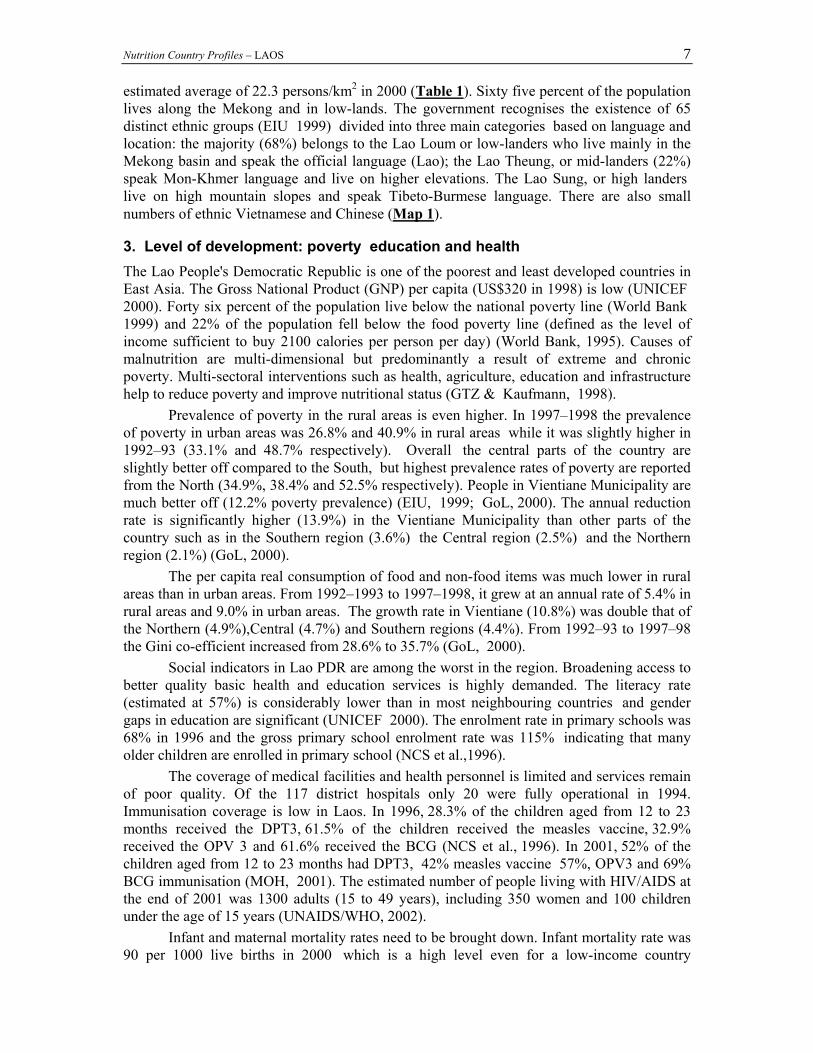
Percentage of DES by major food groups
76.5%
3.6%
2.0%2.4%
2.6%
4.1%4.6%
1.5%
Cereals (excl. beer)Starchy rootsSweetenersPulses, nuts, oilcropsFruits & VegetablesVegetable oilsMeat & offalsOther
Note: Value not indicated if below 1%
Nutrition Country Profiles – LAOS 6
LAOS
I. OVERVIEW
1. Geography
Bordered by Thailand, Cambodia, Vietnam, China and Myanmar, landlocked Lao People’s Democratic Republic (PDR) covers 236 800 km2 (General map of Laos). Laos is a mountainous country. Southern Laos is less hilly but still rugged (EIU 1999). The majority of people live in the valley of the Mekong where the majority of the infrastructure and agriculture is placed. The country’s most valuable natural resources are its forests, covering 56% of the surface, and rivers; the latter have considerable potential for generating hydroelectric power. Lao’s main river, the Mekong, forms a big part of the border between Laos and Thailand. The country has a tropical (monsoon) climate with strong rainfalls from May till September/October followed by a dry period lasting from November till May/April cumulating in a very hot period. These conditions allow only for one annual harvest.
2. Population
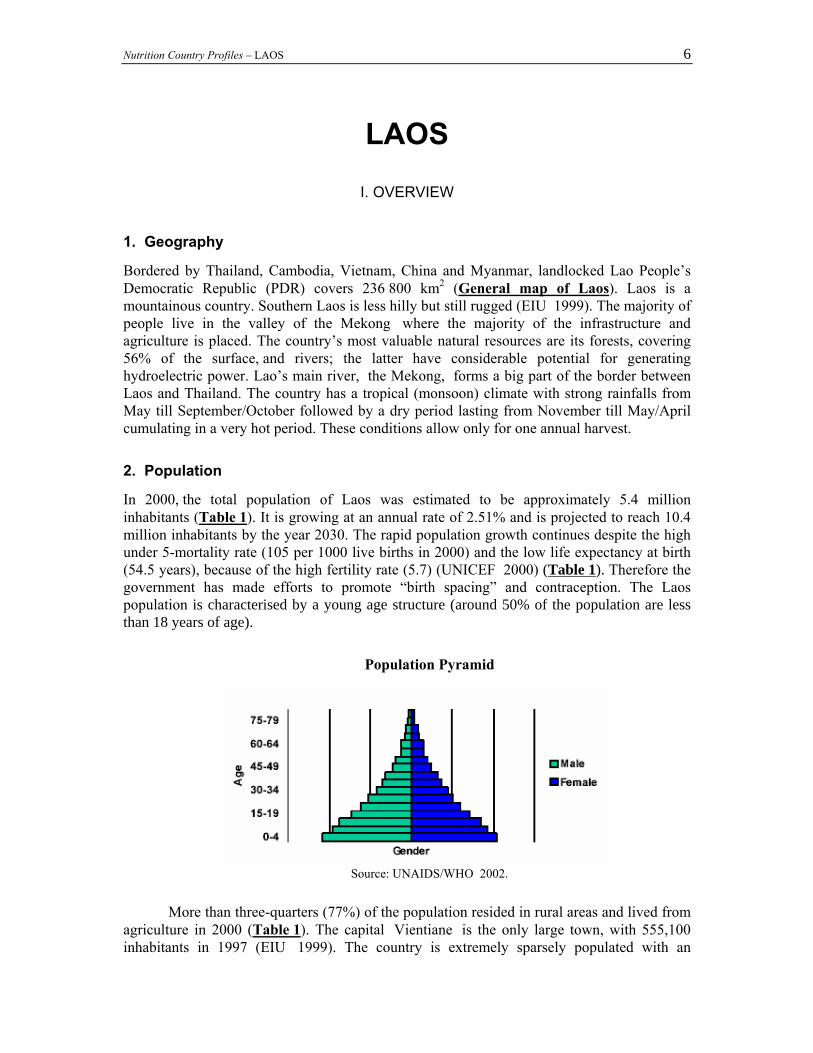
In 2000, the total population of Laos was estimated to be approximately 5.4 million inhabitants (Table 1). It is growing at an annual rate of 2.51% and is projected to reach 10.4 million inhabitants by the year 2030. The rapid population growth continues despite the high under 5-mortality rate (105 per 1000 live births in 2000) and the low life expectancy at birth (54.5 years), because of the high fertility rate (5.7) (UNICEF 2000) (Table 1). Therefore the government has made efforts to promote “birth spacing” and contraception. The Laos population is characterised by a young age structure (around 50% of the population are less than 18 years of age).
Population Pyramid
Source: UNAIDS/WHO 2002.
More than three-quarters (77%) of the population resided in rural areas and lived from agriculture in 2000 (Table 1). The capital Vientiane is the only large town, with 555,100 inhabitants in 1997 (EIU 1999). The country is extremely sparsely populated with an
Nutrition Country Profiles – LAOS 7
estimated average of 22.3 persons/km2 in 2000 (Table 1). Sixty five percent of the population lives along the Mekong and in low-lands. The government recognises the existence of 65 distinct ethnic groups (EIU 1999) divided into three main categories based on language and location: the majority (68%) belongs to the Lao Loum or low-landers who live mainly in the Mekong basin and speak the official language (Lao); the Lao Theung, or mid-landers (22%) speak Mon-Khmer language and live on higher elevations. The Lao Sung, or high landers live on high mountain slopes and speak Tibeto-Burmese language. There are also small numbers of ethnic Vietnamese and Chinese (Map 1).
3. Level of development: poverty education and health The Lao People's Democratic Republic is one of the poorest and least developed countries in East Asia. The Gross National Product (GNP) per capita (US$320 in 1998) is low (UNICEF 2000). Forty six percent of the population live below the national poverty line (World Bank 1999) and 22% of the population fell below the food poverty line (defined as the level of income sufficient to buy 2100 calories per person per day) (World Bank, 1995). Causes of malnutrition are multi-dimensional but predominantly a result of extreme and chronic poverty. Multi-sectoral interventions such as health, agriculture, education and infrastructure help to reduce poverty and improve nutritional status (GTZ & Kaufmann, 1998).
Prevalence of poverty in the rural areas is even higher. In 1997–1998 the prevalence of poverty in urban areas was 26.8% and 40.9% in rural areas while it was slightly higher in 1992–93 (33.1% and 48.7% respectively). Overall the central parts of the country are slightly better off compared to the South, but highest prevalence rates of poverty are reported from the North (34.9%, 38.4% and 52.5% respectively). People in Vientiane Municipality are much better off (12.2% poverty prevalence) (EIU, 1999; GoL, 2000). The annual reduction rate is significantly higher (13.9%) in the Vientiane Municipality than other parts of the country such as in the Southern region (3.6%) the Central region (2.5%) and the Northern region (2.1%) (GoL, 2000).
The per capita real consumption of food and non-food items was much lower in rural areas than in urban areas. From 1992–1993 to 1997–1998, it grew at an annual rate of 5.4% in rural areas and 9.0% in urban areas. The growth rate in Vientiane (10.8%) was double that of the Northern (4.9%),Central (4.7%) and Southern regions (4.4%). From 1992–93 to 1997–98 the Gini co-efficient increased from 28.6% to 35.7% (GoL, 2000).
Social indicators in Lao PDR are among the worst in the region. Broadening access to better quality basic health and education services is highly demanded. The literacy rate (estimated at 57%) is considerably lower than in most neighbouring countries and gender gaps in education are significant (UNICEF 2000). The enrolment rate in primary schools was 68% in 1996 and the gross primary school enrolment rate was 115% indicating that many older children are enrolled in primary school (NCS et al.,1996).
The coverage of medical facilities and health personnel is limited and services remain of poor quality. Of the 117 district hospitals only 20 were fully operational in 1994. Immunisation coverage is low in Laos. In 1996, 28.3% of the children aged from 12 to 23 months received the DPT3, 61.5% of the children received the measles vaccine, 32.9% received the OPV 3 and 61.6% received the BCG (NCS et al., 1996). In 2001, 52% of the children aged from 12 to 23 months had DPT3, 42% measles vaccine 57%, OPV3 and 69% BCG immunisation (MOH, 2001). The estimated number of people living with HIV/AIDS at the end of 2001 was 1300 adults (15 to 49 years), including 350 women and 100 children under the age of 15 years (UNAIDS/WHO, 2002).
Infant and maternal mortality rates need to be brought down. Infant mortality rate was 90 per 1000 live births in 2000 which is a high level even for a low-income country
Nutrition Country Profiles – LAOS 8
(UNICEF, 2002). More than half (56%) of the population lacks access to safe drinkable water supply (UNICEF, 2002) especially in rural communities. Most of the people rely on surface sources or unprotected springs which can easily become contaminated and cause serious health consequences.
4. Agricultural production land use and food security
Agriculture remains the major sector of the economy providing 52% of the Gross Domestic Product (GDP) and employing over 80% of the labour force (EIU, 1999; World Bank, 1999). Most agricultural land is used for rice which is still the largest single crop. In 1995, 84% of the 667 000 ha of land under cultivation was devoted to rice production (EIU, 1999).
Subsistence farming plays an important role in Laos PDR. Permanent agriculture is practised in areas adjacent to the Mekong River. The rain fed rice crop accounts for over 75% of the total crop as irrigation is limited. However irrigation has attracted a lot of attention and fiscal resources in the past three years, in the context of pursuing self-sufficiency in rice production. In recent years rice output has fluctuated sharply and Laos has often required emergency rice aid (EIU, 1999). Tobacco and coffee are the most important non-rice crops (EIU, 1999). Other important crops include maize, peanuts and soybeans. The forestry sector contributed around 4.5% to GDP in the early 1990s and is still a leading export earner (EIU, 1999).
It is estimated that between 1998–2000 there were 1 122 000 cattle heads, 201 000 sheep and goats, 1 264 000 pigs, and 12 million chickens (FAOSTAT 2002).
It is estimated that the daily energy supply did not cover the requirements of 28% of the population in 1997–99 (FAO, 2001) which is down by 5% from 1995–1997 values (FAO/WFS, 1996). The population in the North is susceptible to seasonal food shortages and more exposed to cyclic food insecurity due to floods.
5. Economy With an estimated per capita income of US$320 in 1998 the Lao People's Democratic Republic is one of the poorest and least developed countries in the East Asia region (UNICEF, 2000). Since the introduction of reforms under the New Economic Mechanism (NEM) in 1986, the Government has been transforming the economy from a centrally planned to a market-oriented system. GDP growth was estimated to be 7% between 1992 and 1997 (EIU, 1999). Since 1997 however, the reform effort has slowed significantly and the macroeconomic environment has worsened considerably. By January 1999, inflation had increased to over 150% on an annualised basis. GDP growth was 6.2% in 1999–2000 compared to 2.9% in 1996–1998 (EIU 2002).
Agriculture, including forestry and fishing, is the most important economic sector accounting for 52% of GDP. Timber and wood products have historically been Lao’s most important sources of export earnings although their importance has been reduced due to restrictions on logging imposed in 1993 and the emergence of new products (EIU, 1999). Industry and services account for a growing share of GDP. Industry (manufacturing, mining utilities and construction) contributed 21% of constant-price GDP in 1998 (World Bank, 1999) compared with 17% in 1993. Leading growth sectors are garment manufacturing, food processing and low-technology assembling. Services accounted for 24% of constant-price GDP in 1998 (World Bank 2001).

Nutrition Country Profiles – LAOS 9
II. THE FOOD AND NUTRITION SITUATION
1. Trends in energy requirements and energy supplies
From 1965 to 2000, per caput energy requirements increased from 2075 kcal/day to 2225 kcal/day and are expected to decrease by 115 kcal/day until 2030 (Table 2). In the year 2000, energy requirements were 2063 kcal/day in rural areas and 1973 kcal/day in urban areas. Trends in energy requirements reflect the changes in population structure and in particular the urban-rural distribution. While in 1965, only 8.3% of the population lived in urban areas, in 2000 this proportion increased to 23.5% and is expected to reach 42.6% by 2030 (Table 2). The total population increased from 2.4 million in 1965 to 5.4 million in 2000 and is expected to reach 10.4 million in 2030. In 1965, the dietary energy supply (DES) did not cover energy requirements but data for the year 2000 shows that DES slightly exceeds energy requirements (FAOSTAT, 2002). Table 2: Total population, urbanisation, energy requirements and dietary energy supplies (DES) per person and per day in 1965, 2000 and 2030
* Three-year average calculated for 1964 –1966 and 1998– 2000 (Source: FAOSTAT 2002)
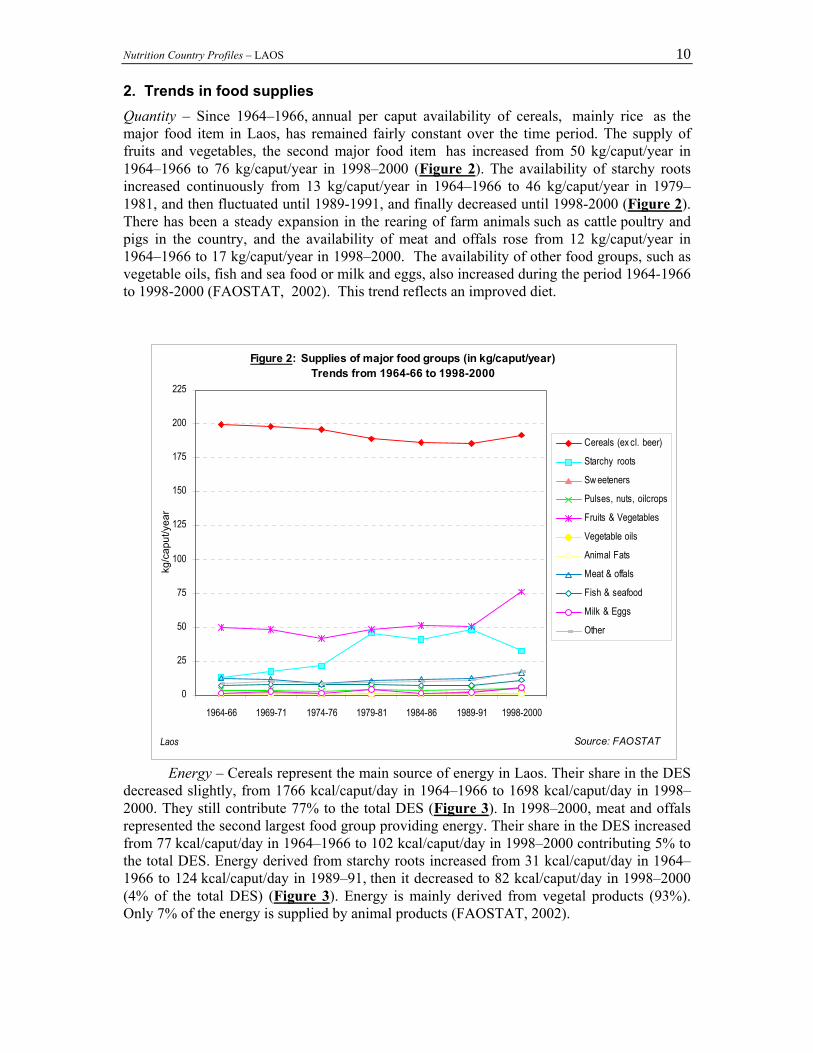
The share of fat in total DES has increased from 9% to 11% over the period from 1964
to 2000 while the share of carbohydrates and protein remained fairly constant throughout the period (Figure 1) (FAOSTAT, 2002).
Figure 1: Share of protein, fat and carbohydrate in Dietary Energy Supply Trends from 1964-66 to 1998-2000
80.9 81.0 82.1 80.9 80.9 80.8 79.0
10.39.910.010.110.110.310.4
10.89.39.29.17.98.78.7
0
500
1000
1500
2000
2500
1964-66 1969-71 1974-76 1979-81 1984-86 1989-91 1998-2000
DES
kca
l/cap
ut/d
ay
Carbohydrates Protein Fat Source: FAOSTATLaos
Year 1965 2000 2030
Total population (thousands) 2432 5433 10482
Percentage urban (%) 8.3 23.5 42.6
Per caput energy requirements (kcal/day) 2075 2225 2110
Per caput DES (kcal/day) * 2066 2244 __
Nutrition Country Profiles – LAOS 10
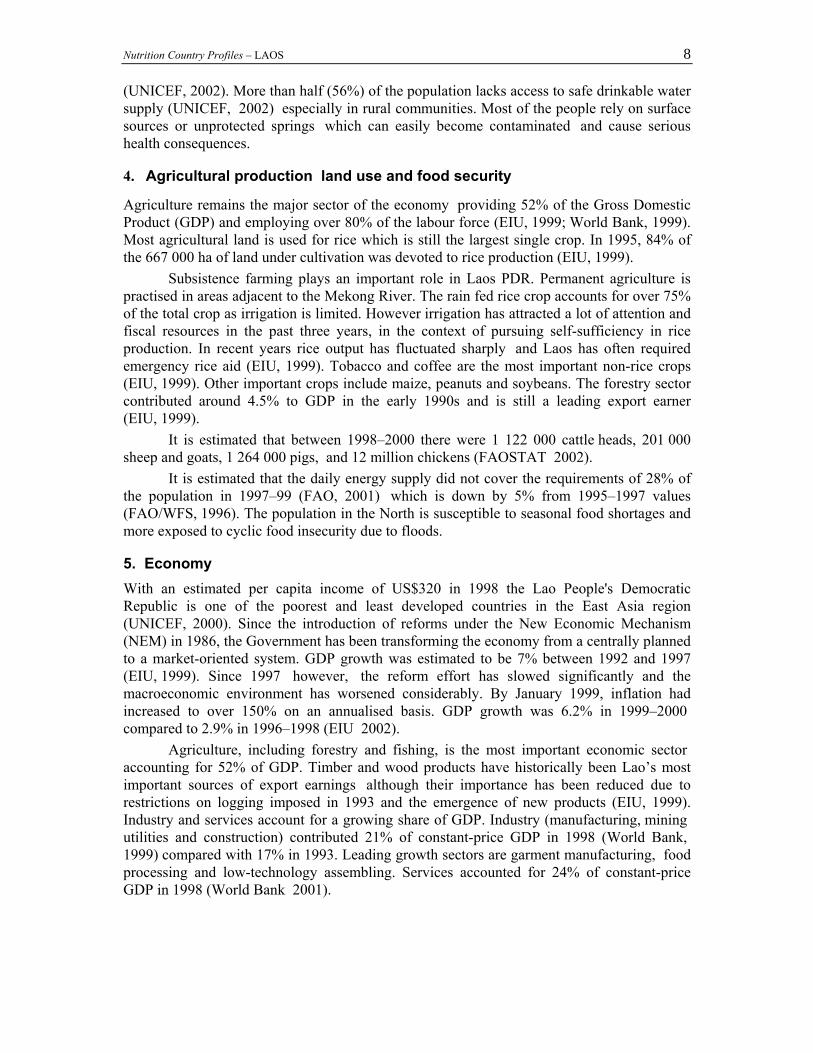
2. Trends in food supplies Quantity – Since 1964–1966, annual per caput availability of cereals, mainly rice as the major food item in Laos, has remained fairly constant over the time period. The supply of fruits and vegetables, the second major food item has increased from 50 kg/caput/year in 1964–1966 to 76 kg/caput/year in 1998–2000 (Figure 2). The availability of starchy roots increased continuously from 13 kg/caput/year in 1964–1966 to 46 kg/caput/year in 1979–1981, and then fluctuated until 1989-1991, and finally decreased until 1998-2000 (Figure 2). There has been a steady expansion in the rearing of farm animals such as cattle poultry and pigs in the country, and the availability of meat and offals rose from 12 kg/caput/year in 1964–1966 to 17 kg/caput/year in 1998–2000. The availability of other food groups, such as vegetable oils, fish and sea food or milk and eggs, also increased during the period 1964-1966 to 1998-2000 (FAOSTAT, 2002). This trend reflects an improved diet.
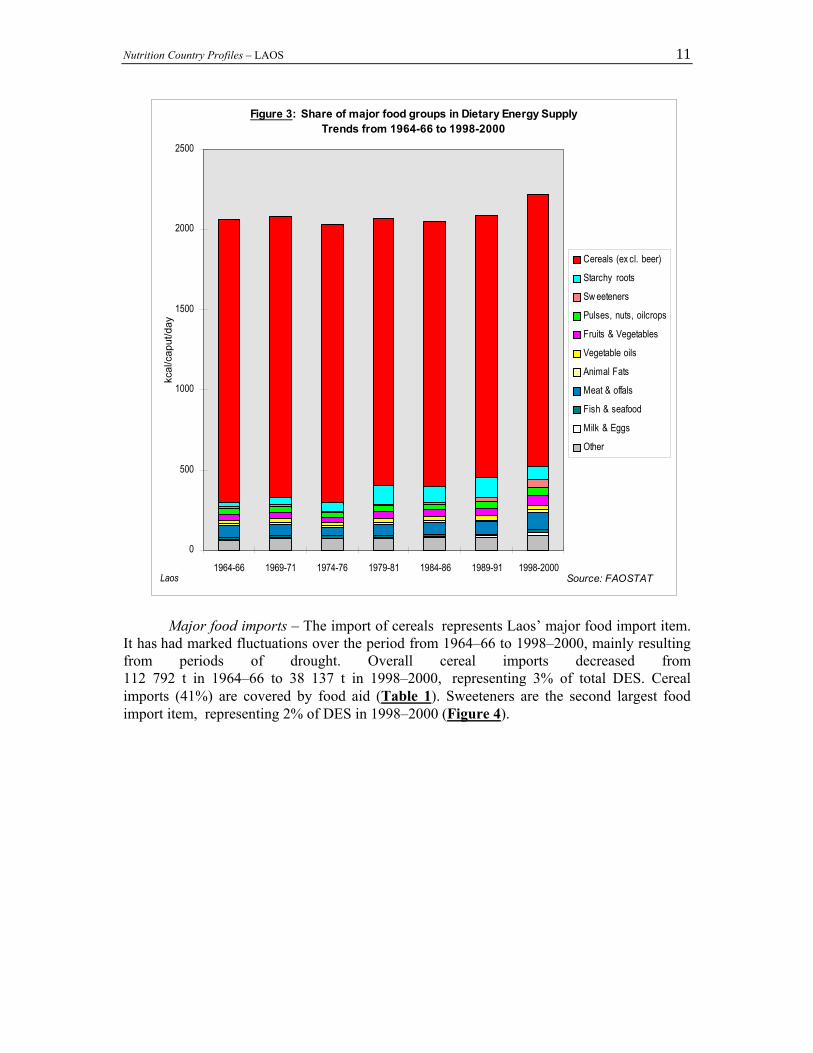
Energy – Cereals represent the main source of energy in Laos. Their share in the DES decreased slightly, from 1766 kcal/caput/day in 1964–1966 to 1698 kcal/caput/day in 1998–2000. They still contribute 77% to the total DES (Figure 3). In 1998–2000, meat and offals represented the second largest food group providing energy. Their share in the DES increased from 77 kcal/caput/day in 1964–1966 to 102 kcal/caput/day in 1998–2000 contributing 5% to the total DES. Energy derived from starchy roots increased from 31 kcal/caput/day in 1964–1966 to 124 kcal/caput/day in 1989–91, then it decreased to 82 kcal/caput/day in 1998–2000 (4% of the total DES) (Figure 3). Energy is mainly derived from vegetal products (93%). Only 7% of the energy is supplied by animal products (FAOSTAT, 2002).
Figure 2: Supplies of major food groups (in kg/caput/year)Trends from 1964-66 to 1998-2000
0
25
50
75
100
125
150
175
200
225
1964-66 1969-71 1974-76 1979-81 1984-86 1989-91 1998-2000
kg/c
aput
/yea
r
Cereals (ex cl. beer)
Starchy roots
Sw eeteners
Pulses, nuts, oilcrops
Fruits & Vegetables
Vegetable oils
Animal Fats
Meat & offals
Fish & seafood
Milk & Eggs
Other
Laos Source: FAOSTAT
Nutrition Country Profiles – LAOS 11
Major food imports – The import of cereals represents Laos’ major food import item.
It has had marked fluctuations over the period from 1964–66 to 1998–2000, mainly resulting from periods of drought. Overall cereal imports decreased from 112 792 t in 1964–66 to 38 137 t in 1998–2000, representing 3% of total DES. Cereal imports (41%) are covered by food aid (Table 1). Sweeteners are the second largest food import item, representing 2% of DES in 1998–2000 (Figure 4).
Figure 3: Share of major food groups in Dietary Energy SupplyTrends from 1964-66 to 1998-2000
0
500
1000
1500
2000
2500
1964-66 1969-71 1974-76 1979-81 1984-86 1989-91 1998-2000
kcal
/cap
ut/d
ay
Cereals (ex cl. beer)
Starchy roots
Sw eeteners
Pulses, nuts, oilcrops
Fruits & Vegetables
Vegetable oils
Animal Fats
Meat & offals
Fish & seafood
Milk & Eggs
Other
Laos Source: FAOSTAT

Nutrition Country Profiles – LAOS 12
Major food exports – Coffee is Laos’ major food export. In 1998-2000, the country exported 15 950 t/year (FAOSTAT, 2002).
3. Food consumption The basic Lao meal consists of rice, particularly glutinous rice, complemented by small portions of vegetables, mainly dark green leafy vegetables and fish. Other common food items are root crops, eggs, meat and poultry, and fruits. Generally three main meals are consumed per day; light meals or snacks are seldom consumed (Table 3).
Table 3: Food consumption survey Source/ Location Sample Average food intake
Yearof survey
Number Sex AgeYears
Nutrient Intake (person/day)
Energy(kcal)
%Protein
%Fat
Protein(g)
%Animal
products
Fat(g)
%Animal
products
Hankin, 1972 National 20 847 M/F All 2 030 _ _ 53.0 _ 18.0 _1968-1969
urban 625 " " 1 985 _ _ 56.0 _ 28.0 _rural 1 440 " " 1 879 _ _ 52.0 _ 20.0 _tribal 782 " " 2 270 _ _ 52.0 _ 20.0 _
Note: - Not determined
The contribution of rice to the total energy intake was 71.1% from 1993–95 (FAO, 1999). No actual national data are available quantifying nutrient intake. The National Health Survey conducted in 2000 included some data on food consumption: 99.3% of the population consumed rice as their daily staple food, 62% added leafy vegetables and 56% fish (MOH, 2001). A nutrition and health survey conducted in 1266 households in 26 target villages in Bolikhamsay Province recorded a number of 9 staple foods, 40 different kinds of vegetables and 40 kinds of fruits listed by the respondents (Schmid, 1997).
Figure 4: Major food imports as a percentage of Dietary Energy SupplyTrends from 1964-66 to 1998-2000
0
5
10
15
20
25
1964-66 1969-71 1974-76 1979-81 1984-86 1989-91 1998-2000
% o
f DES Cereals (ex cl. beer)
Sw eeteners
Laos Source: FAOSTAT
Nutrition Country Profiles – LAOS 13
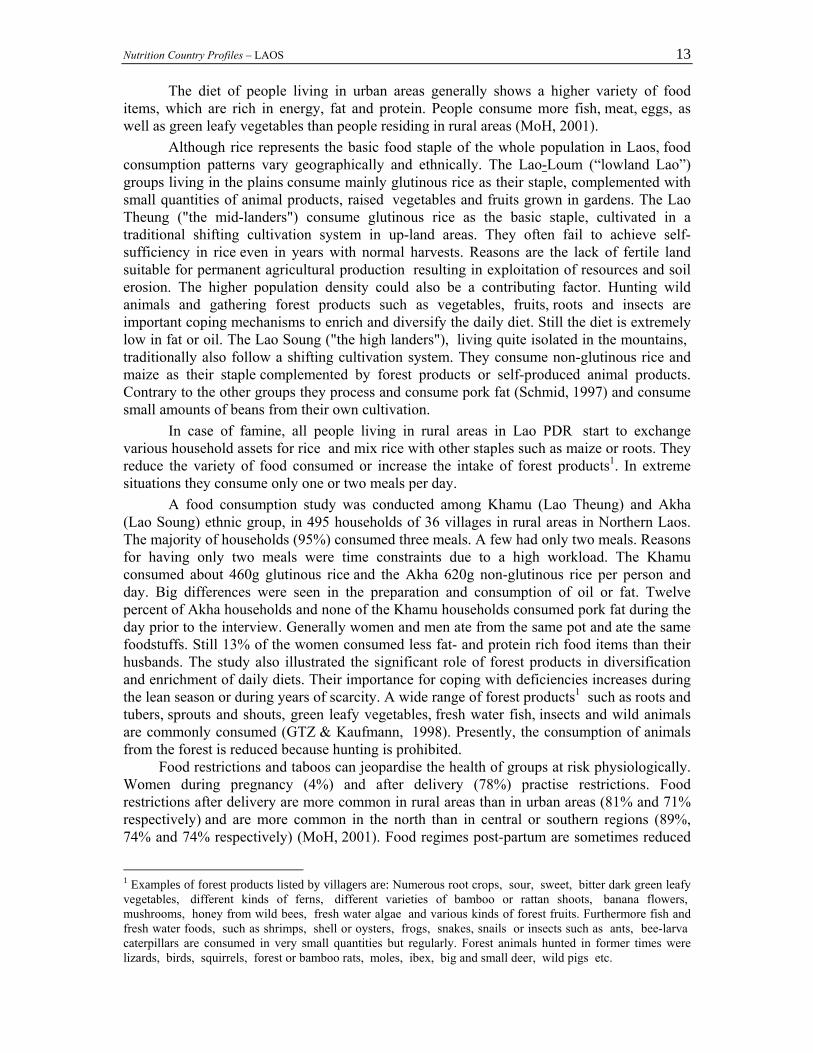
The diet of people living in urban areas generally shows a higher variety of food items, which are rich in energy, fat and protein. People consume more fish, meat, eggs, as well as green leafy vegetables than people residing in rural areas (MoH, 2001).
Although rice represents the basic food staple of the whole population in Laos, food consumption patterns vary geographically and ethnically. The Lao-Loum (“lowland Lao”) groups living in the plains consume mainly glutinous rice as their staple, complemented with small quantities of animal products, raised vegetables and fruits grown in gardens. The Lao Theung ("the mid-landers") consume glutinous rice as the basic staple, cultivated in a traditional shifting cultivation system in up-land areas. They often fail to achieve self-sufficiency in rice even in years with normal harvests. Reasons are the lack of fertile land suitable for permanent agricultural production resulting in exploitation of resources and soil erosion. The higher population density could also be a contributing factor. Hunting wild animals and gathering forest products such as vegetables, fruits, roots and insects are important coping mechanisms to enrich and diversify the daily diet. Still the diet is extremely low in fat or oil. The Lao Soung ("the high landers"), living quite isolated in the mountains, traditionally also follow a shifting cultivation system. They consume non-glutinous rice and maize as their staple complemented by forest products or self-produced animal products. Contrary to the other groups they process and consume pork fat (Schmid, 1997) and consume small amounts of beans from their own cultivation.
In case of famine, all people living in rural areas in Lao PDR start to exchange various household assets for rice and mix rice with other staples such as maize or roots. They reduce the variety of food consumed or increase the intake of forest products1. In extreme situations they consume only one or two meals per day.
A food consumption study was conducted among Khamu (Lao Theung) and Akha (Lao Soung) ethnic group, in 495 households of 36 villages in rural areas in Northern Laos. The majority of households (95%) consumed three meals. A few had only two meals. Reasons for having only two meals were time constraints due to a high workload. The Khamu consumed about 460g glutinous rice and the Akha 620g non-glutinous rice per person and day. Big differences were seen in the preparation and consumption of oil or fat. Twelve percent of Akha households and none of the Khamu households consumed pork fat during the day prior to the interview. Generally women and men ate from the same pot and ate the same foodstuffs. Still 13% of the women consumed less fat- and protein rich food items than their husbands. The study also illustrated the significant role of forest products in diversification and enrichment of daily diets. Their importance for coping with deficiencies increases during the lean season or during years of scarcity. A wide range of forest products1 such as roots and tubers, sprouts and shouts, green leafy vegetables, fresh water fish, insects and wild animals are commonly consumed (GTZ & Kaufmann, 1998). Presently, the consumption of animals from the forest is reduced because hunting is prohibited.
Food restrictions and taboos can jeopardise the health of groups at risk physiologically. Women during pregnancy (4%) and after delivery (78%) practise restrictions. Food restrictions after delivery are more common in rural areas than in urban areas (81% and 71% respectively) and are more common in the north than in central or southern regions (89%, 74% and 74% respectively) (MoH, 2001). Food regimes post-partum are sometimes reduced
1 Examples of forest products listed by villagers are: Numerous root crops, sour, sweet, bitter dark green leafy vegetables, different kinds of ferns, different varieties of bamboo or rattan shoots, banana flowers, mushrooms, honey from wild bees, fresh water algae and various kinds of forest fruits. Furthermore fish and fresh water foods, such as shrimps, shell or oysters, frogs, snakes, snails or insects such as ants, bee-larva caterpillars are consumed in very small quantities but regularly. Forest animals hunted in former times were lizards, birds, squirrels, forest or bamboo rats, moles, ibex, big and small deer, wild pigs etc.
Nutrition Country Profiles – LAOS 14
to only rice with salted soup during several days including medicinal traditional herbal teas. The return to a complete varied diet does not start before more than one month in three-quarters of the women observed. Restrictions concern mainly animal products. Consumption of vegetables, fruits and starchy foods are less affected (EED, 1995). In Bolikhamsay Province 85% of the women reported dietary changes during breastfeeding, and 31% followed restrictions considered to harm the healthy development of the child (Klingner & Schmid, 2001). In Viengthong District women avoided protein and iron rich foods, such as pork, beef, chicken and fish (Schmid, 1997). Food restrictions during illness are practised by 16% of the population, showing a similar distribution in rural and urban areas but are practised more frequently in southern regions than in northern regions (26% and 9% respectively) (MoH, 2001).
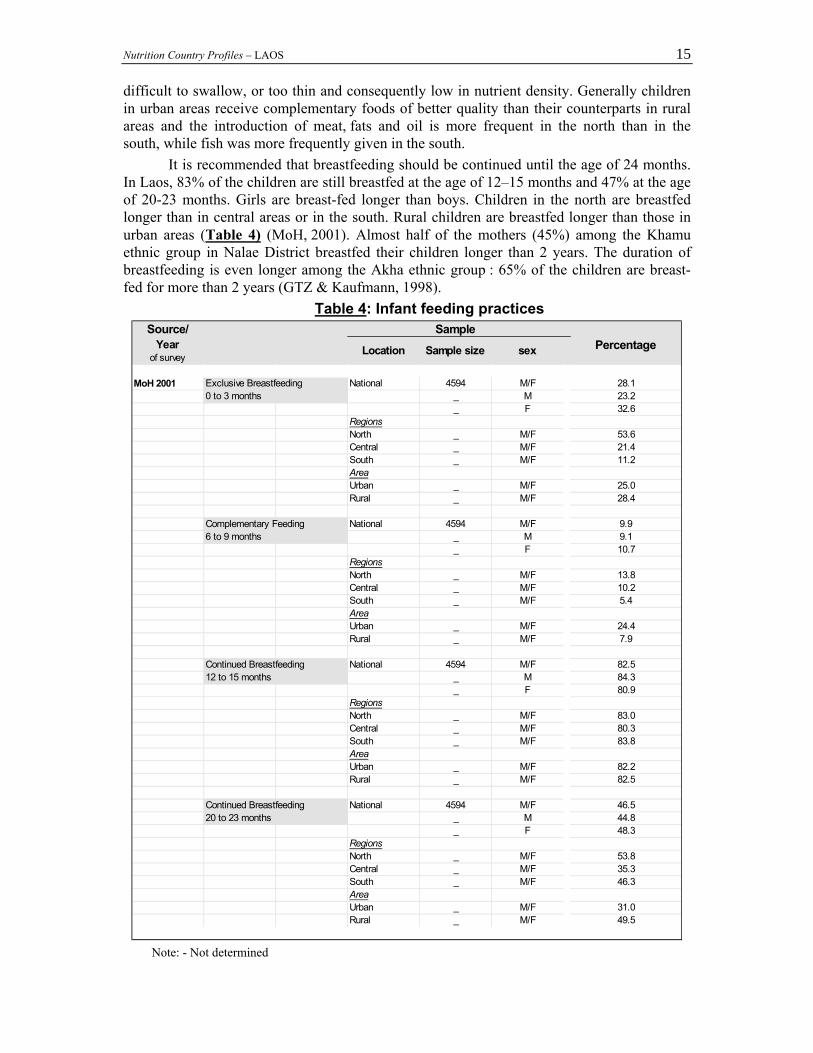
4. Infant feeding practices Nationwide 95% of the mothers in Lao PDR breastfeed their new-born; the proportions are higher in rural areas than in urban areas (96% and 91% respectively) (MoH, 2001). Nevertheless inadequate breastfeeding and weaning practices contribute to high rates of malnutrition as well as infant and child mortality. Colostrum is given to 70% of infants; proportions of neonates receiving colostrum are higher in the urban sector (82%) and in the north (74%) (MoH, 2001). It is recommended that complementary food should be introduced at the age of six months. The Lao Social Indicator Survey reports that 40% of infants start to receive rice along with breast-milk before one month of age (MPH, 1993). According to the results of the recent National Health Survey conducted in 2000 the percentage has decreased, but 20% of the infants still receive complementary food before one month of age. Only 28% of children were breastfed exclusively for their first four months of life (MoH, 2001). The percentage is higher for girls than boys (33% and 23% respectively), and is slightly higher in rural areas than in urban areas (28% and 25% respectively) and significantly higher in northern regions compared to the central and southern regions (54%, 21% and 11% respectively) (MOH, 2001) (Table 4).
Practices vary by ethnicity: feeding rice to new-borns is a main feature among the Lao Loum and Khamu ethnic groups (UNICEF, 1994). A study conducted in Khamu villages in Northern Laos in 1997 showed that 64% of the infants received chewed glutinous rice as the very first food item immediately after birth; 56% received breast-milk on the first day of life and almost all (96%) received complementary food before the age of 4 months. Four years later, after comprehensive nutrition interventions took place, 76% of the children received colostrum and 90% of the children were breastfeed on the first day of life (Kaufmann et al, 2001). Practices are different among the Akha ethnic group: 99% of the infants receive breast-milk on the first day and the habit of feeding rice immediately after birth is uncommon (GTZ & Kaufmann, 1998). The H'mong ethnic group (Lao Soung or "highlanders") shows most appropriate breast-feeding and weaning practices: the children are breast-fed immediately after birth and complementary food is introduced only at the age of 6 months (UNICEF, 1994).
The early introduction of rice may provoke intestinal disorders and contrasts with the late introduction of the nutritive weaning foods. The main weaning food is plain rice, chewed or steamed, introduced too early while other nutritive foods are introduced too late. Only 10% of infants receive complementary food between 6 and 9 months of age. The percentage was slightly higher for girls than for boys (11% and 9% respectively) and much higher in northern regions compared to central and southern regions (14% 10% and 5% respectively) and significantly higher in urban areas compared to rural areas (24% and 8% respectively) (Table 4) (MoH, 2001). Often the texture of complementary foods is too bulky and they are therefore
Nutrition Country Profiles – LAOS 15
difficult to swallow, or too thin and consequently low in nutrient density. Generally children in urban areas receive complementary foods of better quality than their counterparts in rural areas and the introduction of meat, fats and oil is more frequent in the north than in the south, while fish was more frequently given in the south.
It is recommended that breastfeeding should be continued until the age of 24 months. In Laos, 83% of the children are still breastfed at the age of 12–15 months and 47% at the age of 20-23 months. Girls are breast-fed longer than boys. Children in the north are breastfed longer than in central areas or in the south. Rural children are breastfed longer than those in urban areas (Table 4) (MoH, 2001). Almost half of the mothers (45%) among the Khamu ethnic group in Nalae District breastfed their children longer than 2 years. The duration of breastfeeding is even longer among the Akha ethnic group : 65% of the children are breast-fed for more than 2 years (GTZ & Kaufmann, 1998).
Table 4: Infant feeding practices Source/ Sample
Yearof survey Location Sample size sex Percentage
MoH 2001 Exclusive Breastfeeding National 4594 M/F 28.10 to 3 months _ M 23.2
_ F 32.6RegionsNorth _ M/F 53.6Central _ M/F 21.4South _ M/F 11.2AreaUrban _ M/F 25.0Rural _ M/F 28.4
Complementary Feeding National 4594 M/F 9.96 to 9 months _ M 9.1
_ F 10.7RegionsNorth _ M/F 13.8Central _ M/F 10.2South _ M/F 5.4AreaUrban _ M/F 24.4Rural _ M/F 7.9
Continued Breastfeeding National 4594 M/F 82.512 to 15 months _ M 84.3
_ F 80.9RegionsNorth _ M/F 83.0Central _ M/F 80.3South _ M/F 83.8AreaUrban _ M/F 82.2Rural _ M/F 82.5
Continued Breastfeeding National 4594 M/F 46.520 to 23 months _ M 44.8
_ F 48.3RegionsNorth _ M/F 53.8Central _ M/F 35.3South _ M/F 46.3AreaUrban _ M/F 31.0Rural _ M/F 49.5
Note: - Not determined

Nutrition Country Profiles – LAOS 16
5. Anthropometric data One of the first nutrition surveys was conducted in 1984 among Lao Loum populations in the plains. A total of 6055 children were surveyed from ‘’crèches’’ which are nurseries and day care centres. The survey was conducted in the plains (Lao Loum) comprising state-run urban Vientiane "crèches" and mainly rural areas from the 5 provinces. The survey sample is based on children below 5 years of age, from 2 districts in each of the 5 selected provinces, the primary sampling unit being the village. Both males and females under 5 years old showed a prevalence of 11.7% of wasting (weight for height <-2SD), 36.7% of underweight (weight for age <-2SD), while 40.1% were stunted (height for age <-2SD). The prevalence of stunting was lowest among children from urban Vientiane (31% <-2SD) (Kripps, 1984). There were also inter-provincial differences among the 5 Provinces surveyed: the highest rate of stunting was found in Khammouane Province (56%) and the lowest in Luang Prabang Province (38%). Another regional survey carried out in 1986 found an average prevalence of stunting of 47.8% ranging from 38.5% in Phongsaly Province to 64% in Attapeua Province (Vijayaraghavan, 1986) (Table 5a-1).
The first nationally representative survey of the nutritional status of children in the Lao PDR conducted in 1993 reported a prevalence of stunting in children under five years of age of 48.0% which is classified by WHO as a 'very high' prevalence, greater than the average of all developing countries and even within South-East Asia (WHO, 1995a) (Ministry of Public Health, 1993) (Table 5a-1). According to the WHO both the prevalence of underweight and wasting represent a serious public health problem (WHO, 1995a). The prevalence of wasting was 10.0% also 'high' and slightly greater than the average of South-East Asian children. Significant differences were observed in the nutritional status of urban and rural children. Rural children had nearly twice the risk of being stunted (52.0%) and underweight (49.0%) compared to urban children (33.0% and 27.0% respectively). The prevalence of wasting in rural areas (11.0%) was more than double that among those in cities (5.0%). Girls were less malnourished than boys. Furthermore children in the Midlands were at a greater risk of stunting and underweight than their counterparts in Lowland and Highland Lao. This can be explained by the higher degree of food insecurity, especially regarding rice availability, as well as inappropriate breastfeeding and weaning patterns observed among the Midlanders.
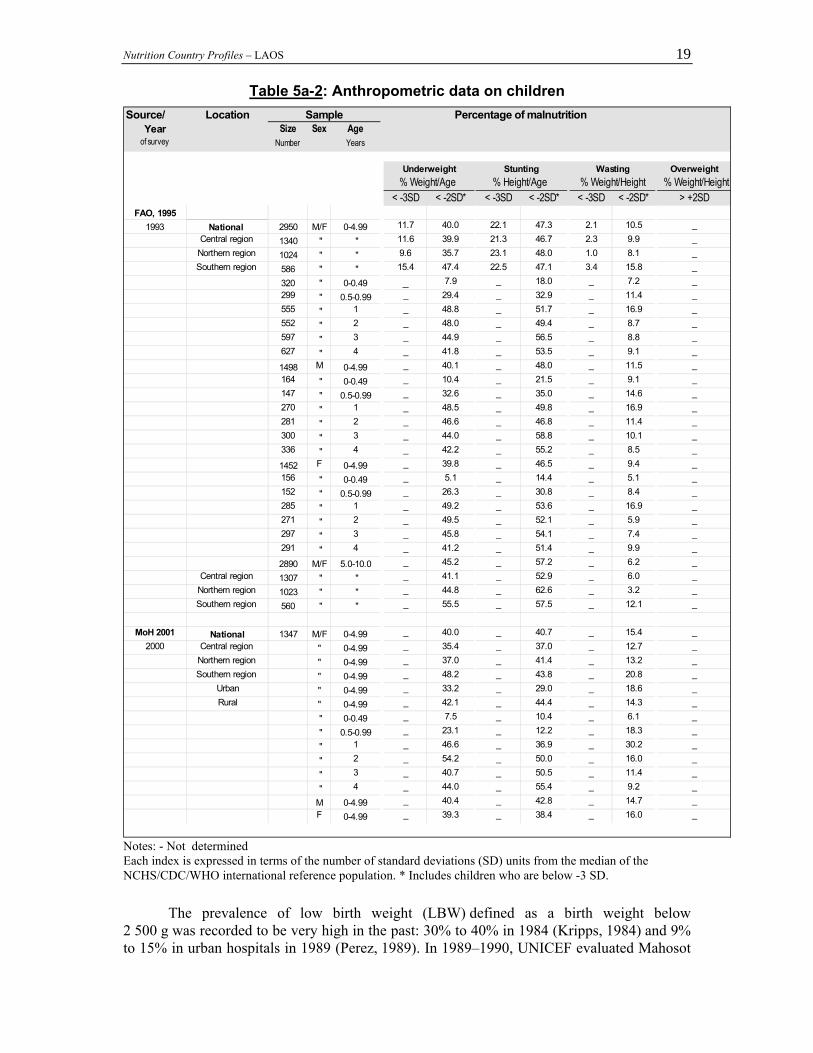
The 1993 FAO Survey showed similar results to the national survey for children less than five years (FAO, 1995; Ministry of Public Health, 1993) (Table 5a-1). Forty percent of 2950 rural children under 5 years old were found to be underweight and 47.3% and 10.5% to be stunted and wasted respectively. Children in the southern region were more likely to be underweight and wasted than children in the Northern and Central region. Underweight and wasting appeared to be most prevalent in infants at the age of one year (48.8% and 16.9% respectively) while the risk for stunting was highest in the third year of age (56.5%) (Table 5a-2). In the age group from 5 to 10 years, the prevalence of stunting was 57.2%, that of wasting was 6.2% and 45.2% of the children were underweight.
A National Health Survey was carried out in 2000. It includes anthropometric data on 1347 pre-school children. Compared to the 1993 FAO survey, the rate of stunting decreased from 47.3% to 40.7%. Regarding stunting, in 2000, girls were better off than boys (38.4% compared to 42.8%) and children in urban areas were significantly better off than in rural areas (29.0% and 44.4%). Children in the southern regions were more affected than their counterparts in central and northern regions (43.8% 37.0% and 41.4% respectively) (Map 2a). Compared to the two 1993 surveys, the prevalence of wasting increased from 10% to 15%, showing the highest prevalence between 12 and 24 months. Contrary to the prevalence of stunting, the prevalence of wasting was slightly higher for girls than for boys (16.0% and
Nutrition Country Profiles – LAOS 17
14.7% respectively) and significantly higher for urban than for rural dwellers (18.6% and 14.3% respectively) (MoH, 2001) (Table 5a-2 and Map 2b).
A comparative study to identify direct factors related to stunting was conducted in Bolikhamsay. In total 43.5% of the children less than 5 years old were stunted. Identified underlying factors were a lower dietary intake, a lower intake of fat and feeding habits in early childhood, where the crucial point was the late introduction of nutritive complementary food (Klingner and Schmid, 2001).
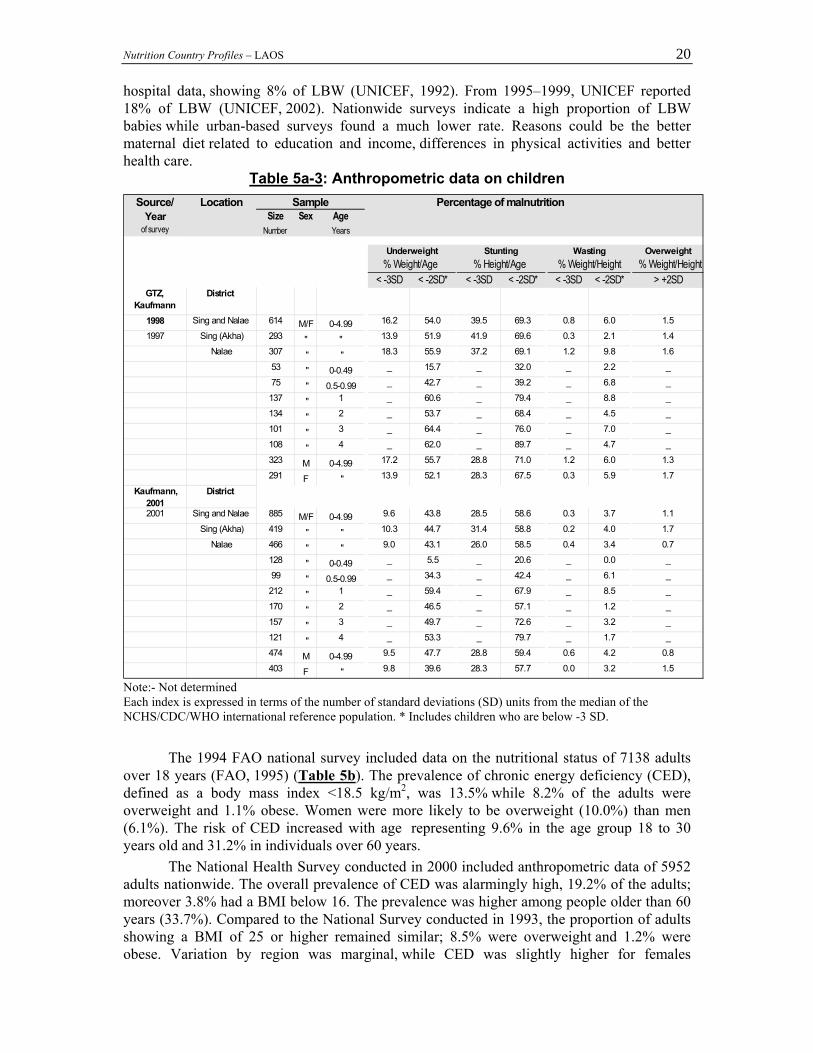
A survey of two districts among the Akha and Khamu ethnic groups reported even a higher prevalence of underweight (<-2SD) (54.0%) and stunting (<-2SD) (69.3%) in pre-school children in 1997 (GTZ and Kaufmann, 1998) (Table 5a-3). The three year old children seemed to be most affected by underweight (64.4%) while 89.7% of children in their forth year were stunted. Direct causes of malnutrition identified were inappropriate infant feeding practices as well as a high prevalence of infectious diseases. Statistically significant underlying causes were insufficient food production, a poor economic situation, a lack of health services, an unhygienic environment, unsafe drinking water and a low educational status of parents. However 4 years after intensive nutrition interventions in both districts, the prevalence of underweight decreased to 43.8% and the prevalence of stunting to 58.6% (Kaufmann et al., 2001). All surveys analysed and presented here showed higher prevalence rates of stunting in rural areas and lower rates in urban areas, while the situation for wasting was worse in urban areas and better in rural areas. Reasons are not yet studied sufficiently and are therefore only assumed. Population in urban areas show a better educational status (literacy rate 85.9% in urban and 60.0% in rural areas) (MOH, 2001) and have better access to health services while their households may have higher capacities for proper caring. These may result in less food restrictions after birth better breast-feeding and weaning patterns (timely weaning: 24.4% in urban and 7.9% in rural areas) (MOH, 2001) and better health seeking behaviour. Better access to food, presence of food markets and availability of cash (because of better employment possibilities) may allow a balanced diet by increasing the variety of food items rich in protein, fat and micro-nutrients such as meat, fish, eggs, fruits or various vegetables (MOH, 2001). The better quality of the diet and less frequent diseases may lead to a relatively better growth rate among urban children compared to rural children, while a low quantity of food could result in slightly higher wasting rates.
On the contrary populations in rural areas show a lower educational status. They have less access to preventive as well as curative health care. They are also more exposed to infections due to unclean environment and lack of sanitation facilities, and unsafe drinking water. These factors in combination with a lack of access to proper treatment result in chronic diseases with a vicious cycle of malnutrition and infections. Their daily diet is more likely rice-based lacking protein and fat. Breastfeeding patterns are more often inappropriate and weaning foods are very much rice-based. All these determinants may lead to the higher rate of stunting among rural children compared to their counterpart in urban areas.
Seasonality of malnutrition was not yet studied intensively in Lao PDR. However malnutrition rates are expected to be much higher in the rainy season when food stores get scarce. At this time villagers have a higher workload, mainly cultivating rice fields during this period, and do not have enough time for food collection and preparation. The lower caring capacity in general also causes interruptions in breast-feeding while mothers work in the fields during the whole day and small babies are left with grandparents or neighbours. Additionally there is a higher pressure of infectious diseases such as diarrhoeal diseases and malaria (GTZ and Kaufmann, 1998).

Nutrition Country Profiles – LAOS 18
Table 5a-1: Anthropometric data on children
Source/ Location Sample Percentage of malnutrition Year
of surveySize
NumberSex Age
YearsUnderweight Stunting Wasting Overweight
% Weight/Age % Height/Age % Weight/Height % Weight/Height< -3SD < -2SD* < -3SD < -2SD* < -3SD < -2SD* > +2SD
Kripps R. Regional 1984 Lao Loum 6055 M/F 0-4.99 _ 36.7 _ 40.1 _ 11.2 _
Vientiane creches (40%) 2456 " " _ 30.0 _ 31.0 _ 13.0 _5 Provinces (60%):
Campassak p. 1111 " " _ 46.0 _ 47.0 _ 11.0 _Khammouane p. 541 " " _ 50.0 _ 56.0 _ 8.0 _Luang Prabang p. 626 " " _ 31.0 _ 38.0 _ 7.0 _Savannakhet p. 493 " " _ 40.0 _ 51.0 _ 6.0 _
Vientiane p. 828 " " _ 30.0 _ 43.0 _ 16.0 _426 " 0-0.49 _ 5.0 _ 14.0 _ 6.0 _555 " 0.5-0.99 _ 24.0 _ 25.0 _ 12.0 _1042 " 1 _ 49.0 _ 43.0 _ 20.0 _975 " 2 _ 43.0 _ 42.0 _ 12.0 _1212 " 3 _ 42.0 _ 46.0 _ 9.0 _1845 " 4 _ 34.0 _ 44.0 _ 8.0 _
Vijayaraghavan K Regional 1986 11 provinces pooled 6967 M/F 0-4.99 _ _ _ 47.8 _ _ _
Attapeua p. 495 " " _ _ _ 64.0 _ _ _Bokeo p. 584 " " _ _ _ 61.8 _ _ _
Borikhamsay p. 935 " " _ _ _ 48.2 _ _ _Houaphanh p. 450 " " _ _ _ 59.0 _ _ _
Louangnamtha p. 612 " " _ _ _ 55.4 _ _ _Oudamsay p. 758 " " _ _ _ 53.7 _ _ _Phongsaly p. 784 " " _ _ _ 38.5 _ _ _Saravanh p. 706 " " _ _ _ 54.7 _ _ _Sayaboury p. 740 " " _ _ _ 58.4 _ _ _
Sekong p. 634 " " _ _ _ 58.3 _ _ _Xienkhouang p. 269 " " _ _ _ 60.6 _ _ _
Ministry of Public National Health 1365 M/F 0-4.99 14.0 44.0 23.0 48.0 1.0 10.0 _1993 Highland Lao 65 " " 11.0 39.0 35.0 54.0 2.0 5.0 _
Lowland Lao 1033 " " 12.0 42.0 21.0 44.0 1.0 11.0 _Midland Lao 267 " " 20.0 53.0 29.0 61.0 1.0 10.0 _
URBAN 147 " " 5.0 27.0 10.0 33.0 1.0 5.0 _RURAL 1031 " " 16.0 49.0 26.0 52.0 1.0 11.0 _
670 M " _ 45.0 _ 51.0 _ 12.0 _695 F " _ 43.0 _ 46.0 _ 9.0 _
Notes: - Not determined Each index is expressed in terms of the number of standard deviations (SD) units from the median of the NCHS/CDC/WHO international reference population. * Includes children who are below -3 SD.
Nutrition Country Profiles – LAOS 19
Table 5a-2: Anthropometric data on children Source/ Location Sample Percentage of malnutrition
Yearof survey
SizeNumber
Sex AgeYears
Underweight Stunting Wasting Overweight% Weight/Age % Height/Age % Weight/Height % Weight/Height
< -3SD < -2SD* < -3SD < -2SD* < -3SD < -2SD* > +2SDFAO, 1995
1993 National 2950 M/F 0-4.99 11.7 40.0 22.1 47.3 2.1 10.5 _Central region 1340 " " 11.6 39.9 21.3 46.7 2.3 9.9 _
Northern region 1024 " " 9.6 35.7 23.1 48.0 1.0 8.1 _Southern region 586 " " 15.4 47.4 22.5 47.1 3.4 15.8 _
320 " 0-0.49 _ 7.9 _ 18.0 _ 7.2 _299 " 0.5-0.99 _ 29.4 _ 32.9 _ 11.4 _555 " 1 _ 48.8 _ 51.7 _ 16.9 _552 " 2 _ 48.0 _ 49.4 _ 8.7 _597 " 3 _ 44.9 _ 56.5 _ 8.8 _627 " 4 _ 41.8 _ 53.5 _ 9.1 _
1498 M 0-4.99 _ 40.1 _ 48.0 _ 11.5 _164 " 0-0.49 _ 10.4 _ 21.5 _ 9.1 _147 " 0.5-0.99 _ 32.6 _ 35.0 _ 14.6 _270 " 1 _ 48.5 _ 49.8 _ 16.9 _281 " 2 _ 46.6 _ 46.8 _ 11.4 _300 " 3 _ 44.0 _ 58.8 _ 10.1 _336 " 4 _ 42.2 _ 55.2 _ 8.5 _
1452 F 0-4.99 _ 39.8 _ 46.5 _ 9.4 _156 " 0-0.49 _ 5.1 _ 14.4 _ 5.1 _152 " 0.5-0.99 _ 26.3 _ 30.8 _ 8.4 _285 " 1 _ 49.2 _ 53.6 _ 16.9 _271 " 2 _ 49.5 _ 52.1 _ 5.9 _297 " 3 _ 45.8 _ 54.1 _ 7.4 _291 " 4 _ 41.2 _ 51.4 _ 9.9 _
2890 M/F 5.0-10.0 _ 45.2 _ 57.2 _ 6.2 _Central region 1307 " " _ 41.1 _ 52.9 _ 6.0 _
Northern region 1023 " " _ 44.8 _ 62.6 _ 3.2 _Southern region 560 " " _ 55.5 _ 57.5 _ 12.1 _
MoH 2001 National 1347 M/F 0-4.99 _ 40.0 _ 40.7 _ 15.4 _2000 Central region " 0-4.99 _ 35.4 _ 37.0 _ 12.7 _
Northern region " 0-4.99 _ 37.0 _ 41.4 _ 13.2 _Southern region " 0-4.99 _ 48.2 _ 43.8 _ 20.8 _
Urban " 0-4.99 _ 33.2 _ 29.0 _ 18.6 _Rural " 0-4.99 _ 42.1 _ 44.4 _ 14.3 _
" 0-0.49 _ 7.5 _ 10.4 _ 6.1 _
" 0.5-0.99 _ 23.1 _ 12.2 _ 18.3 _
" 1 _ 46.6 _ 36.9 _ 30.2 _
" 2 _ 54.2 _ 50.0 _ 16.0 _
" 3 _ 40.7 _ 50.5 _ 11.4 _
" 4 _ 44.0 _ 55.4 _ 9.2 _
M 0-4.99 _ 40.4 _ 42.8 _ 14.7 _F 0-4.99 _ 39.3 _ 38.4 _ 16.0 _
Notes: - Not determined Each index is expressed in terms of the number of standard deviations (SD) units from the median of the NCHS/CDC/WHO international reference population. * Includes children who are below -3 SD.
The prevalence of low birth weight (LBW) defined as a birth weight below
2 500 g was recorded to be very high in the past: 30% to 40% in 1984 (Kripps, 1984) and 9% to 15% in urban hospitals in 1989 (Perez, 1989). In 1989–1990, UNICEF evaluated Mahosot
Nutrition Country Profiles – LAOS 20
hospital data, showing 8% of LBW (UNICEF, 1992). From 1995–1999, UNICEF reported 18% of LBW (UNICEF, 2002). Nationwide surveys indicate a high proportion of LBW babies while urban-based surveys found a much lower rate. Reasons could be the better maternal diet related to education and income, differences in physical activities and better health care.
Table 5a-3: Anthropometric data on children Source/ Location Sample Percentage of malnutrition
Yearof survey
SizeNumber
Sex AgeYears
Underweight Stunting Wasting Overweight% Weight/Age % Height/Age % Weight/Height % Weight/Height
< -3SD < -2SD* < -3SD < -2SD* < -3SD < -2SD* > +2SDGTZ,
KaufmannDistrict
1998 Sing and Nalae 614 M/F 0-4.99 16.2 54.0 39.5 69.3 0.8 6.0 1.51997 Sing (Akha) 293 " " 13.9 51.9 41.9 69.6 0.3 2.1 1.4
Nalae 307 " " 18.3 55.9 37.2 69.1 1.2 9.8 1.653 " 0-0.49 _ 15.7 _ 32.0 _ 2.2 _75 " 0.5-0.99 _ 42.7 _ 39.2 _ 6.8 _
137 " 1 _ 60.6 _ 79.4 _ 8.8 _134 " 2 _ 53.7 _ 68.4 _ 4.5 _101 " 3 _ 64.4 _ 76.0 _ 7.0 _108 " 4 _ 62.0 _ 89.7 _ 4.7 _323 M 0-4.99 17.2 55.7 28.8 71.0 1.2 6.0 1.3291 F " 13.9 52.1 28.3 67.5 0.3 5.9 1.7
Kaufmann, 2001
District
2001 Sing and Nalae 885 M/F 0-4.99 9.6 43.8 28.5 58.6 0.3 3.7 1.1Sing (Akha) 419 " " 10.3 44.7 31.4 58.8 0.2 4.0 1.7
Nalae 466 " " 9.0 43.1 26.0 58.5 0.4 3.4 0.7128 " 0-0.49 _ 5.5 _ 20.6 _ 0.0 _99 " 0.5-0.99 _ 34.3 _ 42.4 _ 6.1 _
212 " 1 _ 59.4 _ 67.9 _ 8.5 _170 " 2 _ 46.5 _ 57.1 _ 1.2 _157 " 3 _ 49.7 _ 72.6 _ 3.2 _121 " 4 _ 53.3 _ 79.7 _ 1.7 _474 M 0-4.99 9.5 47.7 28.8 59.4 0.6 4.2 0.8403 F " 9.8 39.6 28.3 57.7 0.0 3.2 1.5
Note:- Not determined Each index is expressed in terms of the number of standard deviations (SD) units from the median of the NCHS/CDC/WHO international reference population. * Includes children who are below -3 SD.
The 1994 FAO national survey included data on the nutritional status of 7138 adults
over 18 years (FAO, 1995) (Table 5b). The prevalence of chronic energy deficiency (CED), defined as a body mass index <18.5 kg/m2, was 13.5% while 8.2% of the adults were overweight and 1.1% obese. Women were more likely to be overweight (10.0%) than men (6.1%). The risk of CED increased with age representing 9.6% in the age group 18 to 30 years old and 31.2% in individuals over 60 years.
The National Health Survey conducted in 2000 included anthropometric data of 5952 adults nationwide. The overall prevalence of CED was alarmingly high, 19.2% of the adults; moreover 3.8% had a BMI below 16. The prevalence was higher among people older than 60 years (33.7%). Compared to the National Survey conducted in 1993, the proportion of adults showing a BMI of 25 or higher remained similar; 8.5% were overweight and 1.2% were obese. Variation by region was marginal, while CED was slightly higher for females

Nutrition Country Profiles – LAOS 21
(Table 5b) (Map 3). The most obvious difference is seen among the urban and rural population with a prevalence of overweight of 11.1% and 5.1% respectively.
Two surveys were conducted in two northern Districts in 1997 and 2001 including anthropometric data of non-pregnant women. The prevalence of CED was 13.9% in 1997. Four years later, after village based multi-sectoral interventions were implemented in the field of primary health care, nutrition, agriculture, education and food for work, the prevalence had decreased to 5.2% (Kaufmann et al., 2001).
Table 5b: Anthropometric data on adults
Note: - Not determined
Source/ Location SampleYear
of surveySize
NumberSex Age
Years
Body Mass Index(kg/m2)
Chronic Energy Deficiency% BMI
Overweight% BMI
Obesity% BMI
mean SD median <16.0 16.0-16.9 17.0-<18.5 25.0 - 29.9 >30.0
FAO, 1995 National 7138 M/F > 18 2.1 2.2 9.2 8.2 1.11994 3317 M " 1.4 1.8 8.9 6.1 0.7
3821 F " 2.6 2.6 9.6 10.0 1.42336 M/F 18.0-29.9 1.1 1.3 7.2 4.9 0.5975 M " 1.1 1.0 7.4 2.9 0.51361 F " 1.1 1.5 7.2 4.9 0.53885 M/F 30.0-59.9 1.4 1.7 8.6 10.4 1.41874 M " 0.8 1.3 8.0 7.8 0.72011 F " 2.0 2.0 9.1 12.7 2.0917 M/F > 60 7.3 6.7 17.2 7.6 1.1468 M " 4.7 5.1 15.6 6.0 0.6449 F " 10.0 8.2 18.9 9.4 1.6
Northern region 2450 M/F > 18 1.6 2.4 9.1 6.7 1.1801 " 18.0-29.9 0.4 0.6 5.4 4.9 0.51337 " 30.0-59.9 1.4 1.5 8.9 8.2 1.3312 " > 60 5.1 10.6 19.9 5.4 1.6
Central region 3243 M/F > 18 1.7 1.4 8.1 10.3 1.21056 " 18.0-29.9 0.9 1.3 7.5 5.6 0.71772 " 30.0-59.9 1.4 1.0 7.0 13.2 1.6415 " > 60 5.1 3.6 14.5 10.1 1.0
Southern region 1445 M/F > 18 3.9 3.7 12.0 6.0 0.8479 " 18.0-29.9 2.9 2.5 9.6 3.3 0.0776 " 30.0-59.9 1.7 3.6 11.7 7.7 1.3190 " > 60 15.8 6.8 18.9 5.8 0.5
MoH 2001 National 5952 M/F > 15 3.8 3.5 11.9 7.3 1.22000 M " 2.9 3.4 12.1 5.2 0.7
F " 3.2 3.3 11.7 9.2 1.6M/F 15.0-29.9 2.3 3.3 11.0 4.2 0.6M/F 30.0-59.9 2.3 2.5 11.4 10.1 1.8M/F > 60 9.0 7.0 17.7 7.1 1.0
Northern region M/F > 15 3.5 4.0 11.8 5.4 0.6Central region M/F " 2.1 1.7 10.8 9.9 2.0
Southern region M/F " 3.8 4.6 13.3 6.1 0.7Urban M/F " 2.8 2.8 10.2 11.1 2.0Rural M/F " 3.3 3.8 12.9 5.1 0.7
GTZ, Kaufmann S, District 19971997 Muan Sing and Nalae 424 F >=16 20.8 2.2 20.8 0.9 2.6 10.4 2.1 0.2
Muan Sing (Akha) 216 F >=16 20.9 2.1 21.0 0.9 2.8 8.3 1.9 0.0Nalae 208 F >=16 20.7 2.2 20.5 1.0 2.4 12.5 2.4 0.5
172 F 16-29.9 21.0 1.9 20.9 0.0 2.3 7.6 2.9 0.0250 F 30-59.9 20.7 2.3 20.6 1.6 2.8 12.4 1.6 0.4
District 20012001 Muan Sing and Nalae 525 F >=16 21.7 2.0 21.6 0.0 0.8 4.4 5.9 0.0
Muan Sing (Akha) 307 F >=16 21.9 2.0 22.0 0.0 0.7 3.9 7.2 0.0Nalae 218 F >=16 21.3 1.9 21.2 0.0 0.9 5.0 4.1 0.0
245 F 16-29.9 21.6 1.9 21.6 0.0 0.4 4.5 4.1 0.0280 F 30-59.9 21.7 2.1 21.5 0.0 1.1 4.3 7.5 0.0
and Percentage of malnutritionAnthropometric status
Nutrition Country Profiles – LAOS 22
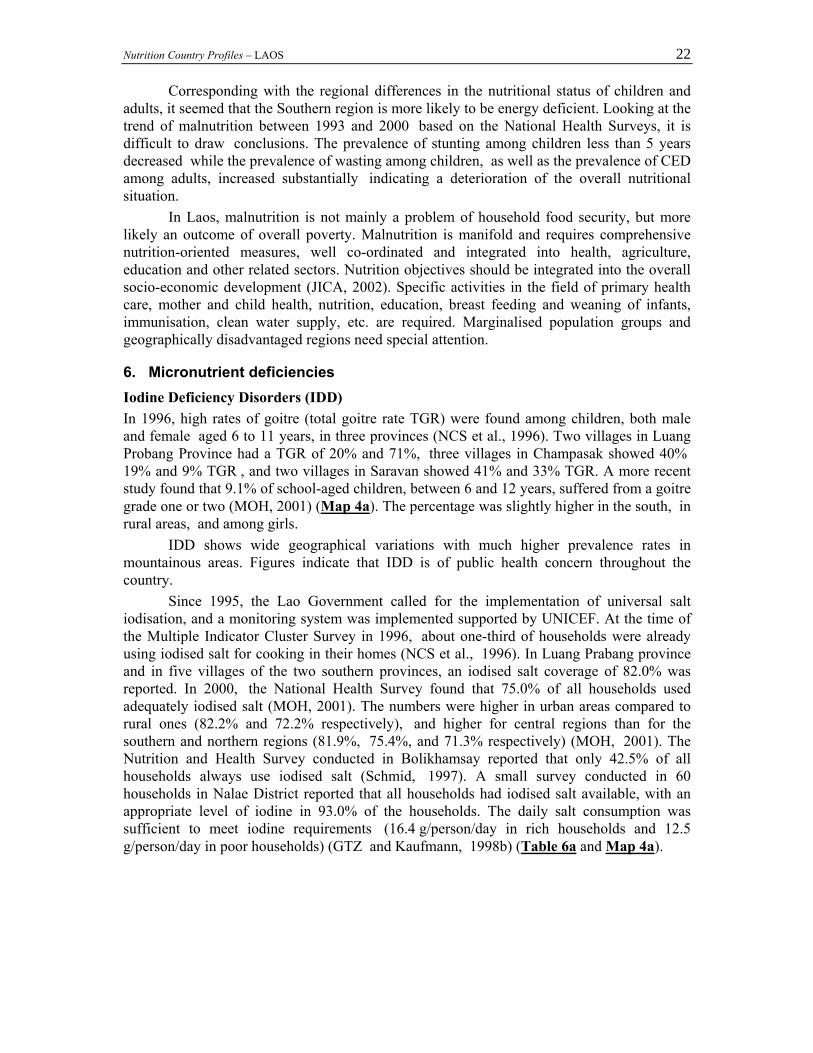
Corresponding with the regional differences in the nutritional status of children and adults, it seemed that the Southern region is more likely to be energy deficient. Looking at the trend of malnutrition between 1993 and 2000 based on the National Health Surveys, it is difficult to draw conclusions. The prevalence of stunting among children less than 5 years decreased while the prevalence of wasting among children, as well as the prevalence of CED among adults, increased substantially indicating a deterioration of the overall nutritional situation.
In Laos, malnutrition is not mainly a problem of household food security, but more likely an outcome of overall poverty. Malnutrition is manifold and requires comprehensive nutrition-oriented measures, well co-ordinated and integrated into health, agriculture, education and other related sectors. Nutrition objectives should be integrated into the overall socio-economic development (JICA, 2002). Specific activities in the field of primary health care, mother and child health, nutrition, education, breast feeding and weaning of infants, immunisation, clean water supply, etc. are required. Marginalised population groups and geographically disadvantaged regions need special attention.
6. Micronutrient deficiencies Iodine Deficiency Disorders (IDD) In 1996, high rates of goitre (total goitre rate TGR) were found among children, both male and female aged 6 to 11 years, in three provinces (NCS et al., 1996). Two villages in Luang Probang Province had a TGR of 20% and 71%, three villages in Champasak showed 40% 19% and 9% TGR , and two villages in Saravan showed 41% and 33% TGR. A more recent study found that 9.1% of school-aged children, between 6 and 12 years, suffered from a goitre grade one or two (MOH, 2001) (Map 4a). The percentage was slightly higher in the south, in rural areas, and among girls.
IDD shows wide geographical variations with much higher prevalence rates in mountainous areas. Figures indicate that IDD is of public health concern throughout the country.
Since 1995, the Lao Government called for the implementation of universal salt iodisation, and a monitoring system was implemented supported by UNICEF. At the time of the Multiple Indicator Cluster Survey in 1996, about one-third of households were already using iodised salt for cooking in their homes (NCS et al., 1996). In Luang Prabang province and in five villages of the two southern provinces, an iodised salt coverage of 82.0% was reported. In 2000, the National Health Survey found that 75.0% of all households used adequately iodised salt (MOH, 2001). The numbers were higher in urban areas compared to rural ones (82.2% and 72.2% respectively), and higher for central regions than for the southern and northern regions (81.9%, 75.4%, and 71.3% respectively) (MOH, 2001). The Nutrition and Health Survey conducted in Bolikhamsay reported that only 42.5% of all households always use iodised salt (Schmid, 1997). A small survey conducted in 60 households in Nalae District reported that all households had iodised salt available, with an appropriate level of iodine in 93.0% of the households. The daily salt consumption was sufficient to meet iodine requirements (16.4 g/person/day in rich households and 12.5 g/person/day in poor households) (GTZ and Kaufmann, 1998b) (Table 6a and Map 4a).
Nutrition Country Profiles – LAOS 23
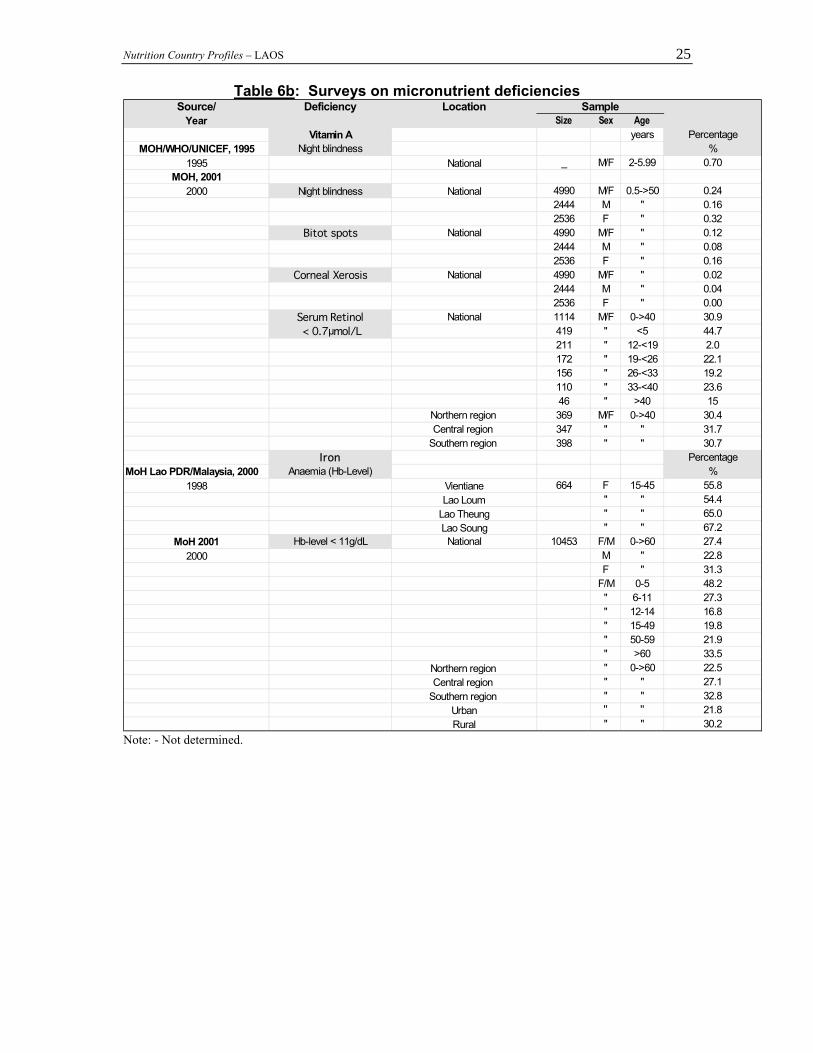
Vitamin A Deficiency During the National Health Survey in 2000, 3.1% of 6 to 59 month-old children were reported to suffer from night blindness. Eye examinations were performed on 4990 individuals of all ages. Night blindness was diagnosed in 0.24%, Bitot spots in 0.12% and corneal xerosis in 0.02% of all individuals (MOH, 2001). Measurements of serum retinol levels were taken for 1114 individuals: 44.7% of the children under five years and 30.9% of individuals under 40 years of age had a serum retinol level lower than 0.7 µmol/L which indicates a severe public health problem (Table 6b) change number of map (MOH, 2001).
Very low intake of fats and oil combined with an inadequate intake of dark green vegetables is the main reason for the prevalence of vitamin A deficiency in Laos.
The vitamin A programme for 12 to 59 month-old children in the Lao PDR was initiated as part of the February 1996 National Immunisation Days (NID). Fifty six point five percent of the children from the age of 13 to 24 months received a vitamin A capsule (NCS et al. 1996). During the first NID about 700 000 children received Vitamin A capsules (UNICEF, 1996). According to the Health Survey in 2000, 28.8% of the 4199 children between 6 and 59 months surveyed had received vitamin A supplementation within the last six months, and 11.7% had received supplementation prior to the last six months. The numbers were slightly higher for urban areas than for rural (30.8% and 28.4% respectively). They were slightly better for the southern regions than for the northern regions (31.2% and 29.6% respectively) but they were worse in central regions (26.2%). The distribution was equal for boys and girls (MOH, 2001).
Anaemia/Iron Deficiency (IDA) A study conducted in 1995 in Luang Prabang among 357 women showed 4.9% with haemoglobin level below 10 g/dL (severe anaemia), 29.5% with levels between 10 g/dL and 12 g/dL (moderate anaemia) and 65.5% with levels over 12 g/dL. Ninety percent of these women were infected by hookworm (WHO, 2002 – unpublished paper).
In 1997, a survey was conducted among 608 pregnant women between 15–49 years in 116 villages in 9 districts of Vientiane Municipality. The prevalence of anaemia was only 27.6% (mean haemoglobin level =11.8 g/dL). There was an association between anaemia and parity and gestational age, as well as with being illiterate, having short inter-pregnancy spacing, being pregnant below 20 years and over 34 years, or under-utilizing family planning, and belonging to the minority ethnic group (Lao Soung). There was no association between anaemia and dietary practices and traditions (WHO, 2002 – unpublished paper).
A 1998 study in Bolikhamxay province showed that all children under one month old had anaemia. Twenty nine percent of the children under six months old, 66% of the under 4 years old and 76% of the under 15 years old had anaemia. The probability of having anaemia was more than doubled in case of intestinal parasitic infections. Nevertheless no statistical difference was seen in the rate of stunting between children infected or non-infected by hookworm (WHO, 2002; Klingner and Schmid, 2001).
A study, conducted among 664 women of child-bearing age in Vientiane, found a prevalence of anaemia of 55.8%; the degree of severity was moderate with a mean hemoglobin level of 11.6 g/dL. The prevalence of anaemia was highest among the Lao Soung ethnic group and lowest among the Lao Loum. The prevalence of intestinal helminthiasis was 70.9%. There was a statistically significant association between anaemia and belonging to the Lao Sung ethnic group, as well as with intestinal parasite infestation (MOH Lao PDR/Malaysia, 2000).

Nutrition Country Profiles – LAOS 24
To identify anaemia the National Health Survey measured the haemoglobin level of 10 453 people under 60 years of age. Twenty seven point four percent had a haemoglobin level lower than 11g/dL. Anaemia was more common in the south (32.8%), among the female (31.3% compared to male at 22.8%), in rural areas (30.2%), among children under five years old, (48.2%) and adults over 60 years old (33.5%) (MOH, 2001). Parasitic infections remain prevalent among children (77% to 83%) and were the main cause of anaemia (WHO, 2002) (Table 6b Map 4b). A study conducted in Bolikhamxay province in 2000 showed that the daily dietary intake of iron for children under five years was only 27% of the FAO/WHO recommendation (Klingner and Schmid, 2001).
The Lao government supplies iron tablets to pregnant women; 13.6% of them actually take iron tablets. Yet figures vary with the geographical location: 34.5% of women in urban areas, compared to only 8.1% in rural areas, take iron tablets. In the northern, central and southern regions respectively, 10.8%, 19.6% and 9.8% of women take iron tablets (MOH, 2001). The situation in Vientiane and in other urban areas is much better than in other parts of Lao PDR. All over the country, more than 65% of women do not receive antenatal care and 86% of children are born at home.
Table 6a: Surveys on micronutrient deficiencies Source/ Deficiency Location Sample
Yearof survey
SizeNumber
Sex AgeYears
Iodine deficiency disorders Percentage
NCS et al., 1996 TGR Regional %Luang Prabang Prov. (North)
Ban Kiou Mak _ M/F 6 to 11 71.0Ban Tha Pen _ " " 20.0
Champasak Prov.(South)Champasak _ " " 40.0Nong Phane _ " " 19.0Don Thalat _ " " 9.0
Saravan Prov.(South)Saravan Town _ " " 41.0
Ba Chieng _ " " 33.0MoH, 2001 TGR %
2000 National 1776 M/F 6-12 9.1943 M " 8.1833 F " 10.0
Urban 673 M/F " 7.6Rural 1102 " " 10.0North 582 " " 9.1
Central 603 " " 6.6South 591 " " 11.5
Note: - Not determined
Nutrition Country Profiles – LAOS 25
Table 6b: Surveys on micronutrient deficiencies Source/ Deficiency Location Sample
Year Size Sex AgeVitamin A years Percentage
MOH/WHO/UNICEF, 1995 Night blindness %1995 National _ M/F 2-5.99 0.70
MOH, 20012000 Night blindness National 4990 M/F 0.5->50 0.24
2444 M " 0.162536 F " 0.32
Bitot spots National 4990 M/F " 0.122444 M " 0.082536 F " 0.16
Corneal Xerosis National 4990 M/F " 0.022444 M " 0.042536 F " 0.00
Serum Retinol National 1114 M/F 0->40 30.9 < 0.7µmol/L 419 " <5 44.7
211 " 12-<19 2.0172 " 19-<26 22.1156 " 26-<33 19.2110 " 33-<40 23.646 " >40 15
Northern region 369 M/F 0->40 30.4Central region 347 " " 31.7
Southern region 398 " " 30.7Iron Percentage
MoH Lao PDR/Malaysia, 2000 Anaemia (Hb-Level) %1998 Vientiane 664 F 15-45 55.8
Lao Loum " " 54.4Lao Theung " " 65.0Lao Soung " " 67.2
MoH 2001 Hb-level < 11g/dL National 10453 F/M 0->60 27.42000 M " 22.8
F " 31.3F/M 0-5 48.2" 6-11 27.3" 12-14 16.8" 15-49 19.8" 50-59 21.9" >60 33.5
Northern region " 0->60 22.5Central region " " 27.1
Southern region " " 32.8Urban " " 21.8Rural " " 30.2
Note: - Not determined.

Nutrition Country Profiles – LAOS 26
7. National strategies and activities for improving nutrition Based on the Declaration of the International Conference on Nutrition held in Rome in 1992, the Lao PDR elaborated in 1995 a Draft National Plan of Action for Nutrition (NPAN) for the period 1995 to 2000 (GOL, 1995); in 1996 the plan was adopted. The NPAN aimed to improve the nutritional situation by reducing the prevalence of underweight by one fifth, to reduce micro-nutrient deficiencies and child mortality. Various targets were set in the area of health, agriculture and education, including social aspects so as to strengthen the role of women in society. The NPAN concentrated efforts on groups most vulnerable to malnutrition: pregnant and lactating mothers, infants and young children, people living in poor sanitary conditions in remote rural areas, the illiterate and the poor. Incorporation of nutrition objectives into socio-economic development was a high priority. Inter-sectoral co-ordination was seen as a pre-condition for the achievement of the target. Specific nutrition objectives and activities by the Ministry of Health were planned in 1997 (MOH, 1997): - Elimination of iodine deficiency as a public health problem through iodised salt. - Prevention of vitamin A deficiency and night blindness in women and children through
the distribution of vitamin A capsules during the National Immunisation Days as a short-term measure. Nutrition education and the promotion of vitamin A rich food products were advocated as a medium term measure.
- Reduction of iron deficiency anaemia among women of child-bearing age through iron-folate supplementation combined with nutrition education.
- Promotion of breast feeding and appropriate weaning practices and reducing malnutrition in infants and young children through the development of nutrition education material, and training of health staff and village volunteers.
- Strengthening nutrition components within primary health care, controlling infectious diseases such as malaria, respiratory infections and diarrhoeal diseases; reducing under 5 mortality, improving professional capacity and nutrition knowledge of health staff through the development of educational material and training of health staff.
- Improving food quality and safety through training of technicians and inspectors, the preparation and dissemination of information and improvement of food laws.
A sectoral plan was elaborated for the main subjects. Implementation was supported by UNICEF, WHO, FAO and various governmental and non-governmental organisations (MOH, 1997).
When looking at the results of the National Health Survey, improvements were seen in the health sector, as shown by the reduction in infant, child and maternal mortality rates as well as in the increased coverage of vaccination and micro-nutrient supplementation for mothers and children in urban as well as rural areas. However, improvements in child malnutrition were insignificant (MOH, 2001). In 2001, WHO reviewed national nutrition activities with particular emphasis on the years 1998–2000 (WHO, 2002). Main programmes implemented were the vitamin A and iron supplementation, iodisation of salt and promotion of breast-feeding. The achievements of the vitamin A supplementation programme were low : only 28.8% of the children under five years received vitamin A. Iron supplementation was not satisfactory due to the lack of iron folate tablets. The consumption of iodised salt was high (94%) but in about one quarter of the households (24.2%) the iodised salt used had an iodine level below standard. Breast-feeding was practised by almost all mothers but only about one quarter (28.1%) of the children were breastfed exclusively for their first four months of life. The Baby Friendly Hospital Initiative promoted breastfeeding in 9 out of 18 provincial
Nutrition Country Profiles – LAOS 27
hospitals, and in 3 out of 142 district hospitals. Furthermore the Ministry of Agriculture implemented a programme on household food security and poverty alleviation focusing on food production and a programme providing credit for food related activities in rural areas which was implemented by the Ministry of Labour and Welfare (WHO, 2002).
Based on the results of the review, a draft National Plan of Action for Nutrition (NPAN) was elaborated for the period 2001 to 2005. The draft plan upholds and intensifies the original goals, contains quantitative targets and specific strategies and activities. Further steps suggested were the elaboration of a work plan, the setting of mechanisms for co-ordinated implementation and monitoring, and a closer collaboration between concerned ministries and international organisations. The central role of the Ministry of Health interdepartmental Nutrition Committee was stressed and the creation of an inter-ministerial Nutrition Committee was suggested (WHO, 2002).
The National Health Strategy up to the year 2020, as part of the overall policy dialogue, set the objective to improve growth development, health and survival within an inter-sectoral framework, by improving the nutritional status of women and children. Here the important role of sufficient and balanced nutrition as a central element to the overall development is highlighted (JICA, 2002).
The Government of Lao PDR demonstrates great efforts in eradicating poverty, in which food security, preserving natural resources and the development of human resources is of highest concern. Eight National Socio-Economic Programmes have been devised to channel the development efforts: food production, commodity production, stabilisation of shifting cultivation, rural and infrastructure development, expansion of external economic relations and co-operation, human resource development and the development of services. The priority goal of the Lao Government is to graduate from the Groups of Least Developed Countries by the year 2020 through sustained growth and equity (GOL, 2000).
Nutrition Country Profiles – LAOS 28
REFERENCES EED (Enfants et Développement). 1995. Health and Nutritional Survey Luang Namtha
Primary Health Care Project Final Report February 1995. EIU (European Intelligence Unit). 2002. Country Profile. EIU (European Intelligence Unit). 1999. Country Profile. FAO. 1999. Assistance to Review and Analyse existing Food Consumption Practices. Mission
Report by English R. Field Document SPP-RAP52/10/98 FAO Vientiane 1999. FAO. 1995. Diagnostic de la situation nutritionnel et consommation alimentaire au Laos.
Rapport complet de l´étude sur l´état nutritionnel de la population Laotienne. ESNA: TCP/LAO/2354. FAO Rome 1994.
FAOSTAT. 2002. FAO Web page. Statistics database . FAO Rome FAO/WFS (World Food Summit). 2002. Mapping Undernutrition – 5 years later. Poster for
the World Food Summit 10–13 June 2002. FAO Rome. FAO/WFS (World Food Summit). 1996. Mapping Undernutrition – an ongoing process.
Poster for the World Food Summit 13–17 November 1996. FAO Rome. GOL (Government of Lao PDR) 2000. Fighting Poverty through Human Resource
Development Rural Development and People's Participation. Government Report to the Seventh Round Table Meeting Vientiane 21–23. Nov. 2000
GOL (Government of Lao PDR) 1995. "Draft National Plan of Action for Nutrition 1995–
2000. Presented to the National Seminar "National Plan of Action for Nutrition" Vientiane; arch 1995. Committee for Planning and Co-operation supported by FAO and WHO Vientiane April 1995.
GTZ & Kaufmann S. 1998. IFSP Nutrition Survey Muang Sing and Nalae Luang Namtha
Province 1997. Project-Report of GTZ Integrated Food-Security Programme Muang Sing. Luang Namtha Laos P.D.R. 1998.
GTZ & Kaufmann S. 1998b. Project-Report on Iodine Situation in Muang Nalae GTZ
Integrated Food-Security Programme Muang Sing and Nalae. Luang Namtha Laos P.D.R. 1998.
JICA (Japanese International Cooperation Agency). 2002 Lao Health Master Planning
Study Draft Final Report Volume 2 Chapter 15 Vientiane May 2002. Kaufmann S. Phanlavong A. Kohl K. Krawinkel M. Nutrition and Poverty in Northern
Laos: Achievements after 4 years of intensive Interventions. Lao-German Integrated Food Security Programme Muang Sing and Nalae (GTZ). Poster for the International Seminar on Child Growth and Development Antwerpen Nov. 2001.
Nutrition Country Profiles – LAOS 29
Klingner J. Schmid U. 2001. Identification of factors influencing the stunting problem of
children under the age of 5 years in Bolikhamxai Lao PDR. Bolikhamxai Health Services and the Lao German Family Health Project October 2000 to April 2001.
Kripps R. 1984. Nutrition services in the Lao People’s Democratic Republic. Assignment
Report. (WP) NUT/LAO/NUT/001. WHO Geneva 1984. Ministry of Health (MOH) 2001. Health Status of the People in Lao P.D.R. Report on the
National Health Survey. Vientiane 2001. Done with the State Planning Committee (SPC).
Ministry of Health Lao PDR/Ministry of Health Malaysia. 2000. Prevalence and Causes
of Anaemia amongst Women of Child-Bearing Age in Vientiane Province Lao PDR. Report on a collaborative Project of the Council of Medical Sciences Lao PDR and the Institute for Medical Research Malaysia November 1998.
Ministry of Health (MOH). 1997. Work Plan for Nutrition Activities 1998–2000. Presented
at the National Workshop on Nutrition Vientiane November 1997. MOH/WHO/UNICEF. 1995. National Vitamin A Survey – Lao PDR 1995. Final Report.
Vientiane Ministry of Health/World Health Organisation/UNICEF. Ministry of Public Health. 1993. Women and children in the Lao People’s Democratic
Republic. Results from the Laos Social Indicator Survey (LSIS). Vientiane 1993. NSC/MOH/MOE/UNICEF. 1996. Multi Indicator Cluster Survey (MICS) of Laos 1996. Perez D. 1989. Assessment of MCH services in four provinces in the Lao PDR UNICEF
Vientiane. Schmid U. 1997. Report on socio-economic conditions and health behaviour in three
Districts of Bolikhamxai Lao PDR. Bolikhamxai Health Services and the Lao German Family Health Project January to July 1997.
UN. 2000. World Urbanisation Prospects. 1999 Revision. United Nations Population
Division. New York. UNAIDS/WHO 2002. Lao People’s Democratic Republic. Epidemiological Facts Sheets on
HIV/AIDS and Sexually Transmitted Infections. 2002 Update. UNAIDS/WHO Working Group on Global HIV/AIDS Geneva Switzerland.
UNICEF. 2002. The State of the World’s Children 2002. United Nations Children’s Fund.
Oxford University Press. New York. UNICEF. 2000. The State of the World’s Children 2000. United Nations Children’s Fund.
Oxford University Press. New York.
Nutrition Country Profiles – LAOS 30
UNICEF. 1996. Situation Analysis of Children and their Families in the Lao PDR Draft 2 Vientiane July 1996.
UNICEF. 1994. Traditional child rearing practices among different ethnic groups in
Houaphan Province. Lao PDR Vientiane 1994. UNICEF. 1992. Children and Women in the Lao PDR UNICEF Vientiane April 1992. WHO. 2002. Nutrition Focus: Healthy settings Mission Report ICP/HSE/006 MR
2001/0855 from 23.11.–17.12. 2001 in Lao PDR WHO Regional Office for Western Pacific May 2002.
WHO. 2002. The dimension of anaemia problem in Lao PDR for WRA and young children
Vientiane 2002 (unpublished paper). WHO. 1995. Physical Status: The Use and Interpretation of anthropometry. Technical
Report Series 854. WHO Geneva. World Bank. 1995. Lao People’s Democratic Republic: Social Development Assessment and
strategy. 1995. World Bank. 1999. Country Statistics. World Bank. 2001. The World Development Indicators 2001 CD-ROM. Win*STARS System
Version 5.0. World Bank Washington D.C. References of data presented in Table 1 unless otherwise stated: Source: Indicator:
FAOSTAT. 2002 A.1-2 B C.10-11 E.1-3 F G
UN. 1999/2000 rev. C.1-9 D.5
World Bank. 2001. D.1
UNDP. 1999. D.2
GoL. 2000. D.3-4
UNICEF. 2002. D.6
FAO/WFS. 2002. H

Nutrition Country Profiles – LAOS 31
NCP of LAOS
MAPS
General map of Laos
Map 1: Population density by province.
Map 2a: Prevalence of stunting in children under 5 years of age by macro-region in 2000
Map 2b: Prevalence of wasting in children under 5 years of age by macro-region in 2000
Map 3: Prevalence of BMI < 18.5 kg/m 2 in adults over 18 years of age by macro-region in 2000
Map 4a: Prevalence of total goitre rate among children 6 to 12 years old by macro-region in 2000
Map 4b: Prevalence of anaemia in all age groups by macro-region in 1998