far east consortium international limited 遠東發展有限 …
TRANSCRIPT

– 1 –
* For identification purposes only
Hong Kong Exchanges and Clearing Limited and The Stock Exchange of Hong Kong Limited take no responsibility for the contents of this announcement, make no representation as to its accuracy or completeness and expressly disclaim any liability whatsoever for any loss howsoever arising from or in reliance upon the whole or any part of the contents of this announcement.
FAR EAST CONSORTIUM INTERNATIONAL LIMITED遠東發展有限公司 *
(Incorporated in the Cayman Islands with limited liability)Website: http://www.fecil.com.hk
(Stock Code: 35)
ANNOUNCEMENT OF RESULTS FORTHE SIX MONTHS ENDED 30 SEPTEMBER 2016
INTERIM RESULTS HIGHLIGHTS
• Revenue and net profit attributable to shareholders of the Company for 1H FY2017 increased by 59.0% and 158.9% respectively to approximately HK$3.0 billion and HK$681 million respectively, compared with that in 1H FY2016, primarily due to strong sales performance in residential developments in Shanghai and Melbourne. Performance of hotel division was largely stable whilst car park division recorded moderate growth.
• Presale of residential properties remained robust with cumulative presales value of properties under development amounting to approximately HK$9.8 billion (HK$7.5 billion as at 31 March 2016) following the successful launch of West Side Place Towers 1 and 2 in Melbourne.
• Bank and cash balances and investment securities of the Group increased to approximately HK$5.4 billion as at 30 September 2016 (HK$3.8 billion as at 31 March 2016).
• Net gearing ratio(i) was at 31.6% as at 30 September 2016 (37.7% as at 31 March 2016).
• Interim dividend for 1H FY2017 increased to HK3.5 cents per share (1H FY2016: HK3 cents per share).
• Net assets attributable to shareholders as at 30 September 2016 amounted to approximately HK$9.86 per share, adjusted for hotel revaluation surplus(ii).
• For the 1H FY2017, the Group was honoured with several international awards in relation to company management, investor relations, corporate governance and corporate social responsibility including the prestigious “Best Managed Company in Asia in the Real Estate Category” award from Euromoney.

– 2 –
Notes:
(i) Net gearing ratio represents total bank loans, notes and bonds less investment securities, bank and cash
balances divided by carrying amount of total equity and hotel revaluation surplus.
(ii) Revaluation surplus on hotel assets of approximately HK$10,732 million was based on independent
valuation carried out as at 31 March 2016 and was not recognized in the Company’s consolidated financial
statements, but was adjusted for the calculations of net asset value per share and the net gearing ratio.
INTERIM RESULTS
The board of directors (the “Board”) of Far East Consortium International Limited (the “Company”) is pleased to announce the unaudited consolidated results of the Company and its subsidiaries (collectively, the “Group”) for the six months ended 30 September 2016 (“1H FY2017”). These unaudited consolidated financial statements have been reviewed by the Company’s audit committee (the “Audit Committee”) prior to recommending them to the Board for approval.
INTERIM DIVIDEND
The Board has declared the payment of an interim dividend for the six months ended 30 September 2016 of HK3.5 cents (30 September 2015: HK3 cents) per ordinary share (the “Interim Dividend”). The Interim Dividend will be paid to the shareholders of the Company (the “Shareholders”) whose names appear on the Company’s Register of Members on 29 December 2016. The Interim Dividend will be paid in the form of a scrip dividend with Shareholders being given an option to elect to receive cash in lieu of all or part of their scrip dividend entitlements (the “Scrip Dividend Scheme”).
The Scrip Dividend Scheme will be subject to The Stock Exchange of Hong Kong Limited (the “Stock Exchange”) granting listing of, and permission to deal in the new shares to be allotted and issued thereunder. For the purpose of determining the number of new shares to be allotted, the market value of new shares will be calculated as the average of the closing prices of the existing shares of the Company on the Stock Exchange for the 5 trading days prior to and including 29 December 2016. Full details of the Scrip Dividend Scheme will be set out in a circular which is expected to be sent to Shareholders together with a form of election (if applicable) on or around 10 January 2017. Dividend warrants and/or new share certificates will be posted on or around 13 February 2017.
CLOSURE OF REGISTER OF MEMBERS
The Register of Members of the Company will be closed from Wednesday, 21 December 2016 to Thursday, 29 December 2016, both days inclusive, during which period no transfer of shares of the Company will be registered. In order to qualify for entitlement to the Interim Dividend, unregistered holders of shares of the Company should ensure that all share transfer documents accompanied by the relevant share certificates must be lodged with the Company’s share registrar in Hong Kong, Tricor Standard Limited, at Level 22, Hopewell Centre, 183 Queen’s Road East, Hong Kong, for registration not later than 4:30 p.m. on Tuesday, 20 December 2016.

– 3 –
CONDENSED CONSOLIDATED STATEMENT OF PROFIT OR LOSSFOR THE SIX MONTHS ENDED 30 SEPTEMBER 2016
Six months ended30.9.2016 30.9.2015
NOTES HK$’000 HK$’000(unaudited) (unaudited)
Revenue 2,952,607 1,857,064Cost of sales and services (1,696,600) (1,078,018)Depreciation and amortisation of hotel and car
park assets (147,442) (150,478)
Gross profit 1,108,565 628,568Other income 6,590 12,051Other gains and losses 5 235,019 130,889Administrative expenses
– Hotel operations and management (174,983) (171,646)– Others (132,309) (118,583)
Pre-opening expenses– Hotel operations and management (2,592) –
Selling and marketing expenses (16,113) (54,218)Share of results of associates 3,935 7,532Share of results of joint ventures (1,452) 2,904Finance costs 6 (105,483) (114,798)
Profit before tax 921,177 322,699Income tax expense 7 (233,000) (48,325)
Profit for the period 8 688,177 274,374
Attributable to:Shareholders of the Company 681,427 263,242Non-controlling interests 6,750 11,132
688,177 274,374
Earnings per share 9– Basic (HK cents) 32.0 13.7
– Diluted (HK cents) 32.0 13.7

– 4 –
CONDENSED CONSOLIDATED STATEMENT OF PROFIT OR LOSS AND OTHER COMPREHENSIVE INCOMEFOR THE SIX MONTHS ENDED 30 SEPTEMBER 2016
Six months ended30.9.2016 30.9.2015HK$’000 HK$’000
(unaudited) (unaudited)
Profit for the period 688,177 274,374
Other comprehensive expense for the periodItems that may be subsequently reclassified
to profit or loss:Exchange differences arising on translation of foreign
operations (231,632) (323,973)Fair value adjustment on cross currency swap
contracts designated as cash flows hedge (16,059) (21,417)
(247,691) (345,390)
Total comprehensive income (expense) for the period 440,486 (71,016)
Total comprehensive income (expense) attributable to: Shareholders of the Company 426,950 (46,895)Non-controlling interests 13,536 (24,121)
440,486 (71,016)

– 5 –
CONDENSED CONSOLIDATED STATEMENT OF FINANCIAL POSITIONAT 30 SEPTEMBER 2016
30.9.2016 31.3.2016NOTE HK$’000 HK$’000
(unaudited) (audited)
Non-current AssetsInvestment properties 2,834,946 3,304,213Property, plant and equipment 7,657,587 7,720,482Prepaid lease payments 504,743 522,412Goodwill 68,400 68,400Interests in associates 349,835 342,407Interests in joint ventures 39,601 41,052Investment securities 692 692Deposits for acquisition of property,
plant and equipment 120,666 124,756Amounts due from associates 70,724 70,734Amount due from a joint venture 25,841 26,467Amount due from an investee company 119,995 119,995Other receivables 83,302 80,426Pledged deposits 2,417 2,494Deferred tax assets 33,847 35,512
11,912,596 12,460,042
Current AssetsProperties for sale
Completed properties 677,869 583,706Properties for/under development 7,865,839 8,056,484
Other inventories 9,213 9,414Prepaid lease payments 14,809 15,181Debtors, deposits and prepayments 11 501,759 527,404Deposits receivable from stakeholders 251,130 586,880Other receivables 12,020 12,605Amounts due from joint ventures 49,823 50,018Amount due from an associate 28,879 22,328Tax recoverable 68,230 62,611Investment securities 1,086,145 1,218,063Pledged deposits 25,663 24,607Restricted bank deposits 388,450 161,621Deposit in a financial institution 11,331 11,331Bank balances and cash 3,935,299 2,358,326
14,926,459 13,700,579Assets classified as held for sale 53,870 –
14,980,329 13,700,579

– 6 –
30.9.2016 31.3.2016NOTE HK$’000 HK$’000
(unaudited) (audited)
Current LiabilitiesCreditors and accruals 12 703,758 828,763Customers’ deposits received 2,282,086 2,460,113Obligations under finance leases 3,452 3,468Amounts due to a related company 17,261 17,856Amounts due to associates 8,627 8,836Amounts due to shareholders
of non-wholly owned subsidiaries 27,394 27,799Derivative financial instruments 13,113 8,904Dividend payable 277,122 –Tax payable 294,096 182,621Bank borrowings 1,979,885 2,932,693
5,606,794 6,471,053
Net Current Assets 9,373,535 7,229,526
Total Assets less Current Liabilities 21,286,131 19,689,568
Non-current LiabilitiesBank borrowings 6,950,937 7,863,277Obligations under finance leases 4,835 4,845Amount due to a shareholder
of a non-wholly owned subsidiary 266,902 246,778Notes and bonds 3,161,738 868,283Derivative financial instruments 92,739 76,680Deferred tax liabilities 380,035 362,450
10,857,186 9,422,313
Net Assets 10,428,945 10,267,255
Capital and ReservesShare capital 213,171 213,171Share premium 3,730,625 3,730,625Reserves 6,346,902 6,196,336
Equity attributable to shareholders of the Company 10,290,698 10,140,132
Non-controlling interests 138,247 127,123
Total Equity 10,428,945 10,267,255

– 7 –
NOTES TO THE CONDENSED CONSOLIDATED FINANCIAL STATEMENTSFOR THE SIX MONTHS ENDED 30 SEPTEMBER 2016
1. GENERAL
The Company was incorporated as an exempted company with limited liability in the Cayman Islands. The
shares of the Company have been listed on the Main Board of The Stock Exchange of Hong Kong Limited
(the “Stock Exchange”).
2. BASIS OF PREPARATION
The condensed consolidated financial statements have been prepared in accordance with Hong Kong
Accounting Standard (“HKAS”) 34 “Interim Financial Reporting” issued by the Hong Kong Institute of
Certified Public Accountants (the “HKICPA”) as well as with the applicable disclosure requirements of
Appendix 16 to the Rules Governing the Listing of Securities on the Stock Exchange.
3. PRINCIPAL ACCOUNTING POLICIES
The condensed consolidated financial statements have been prepared on the historical cost basis except for
investment properties and certain financial instruments which are measured at fair values, as appropriate.
Except as described below, the accounting policies and method of computation used in the condensed
consolidated financial statements for the six months ended 30 September 2016 are the same as those
followed in the preparation of the Group’s annual financial statements for the year ended 31 March 2016.
Non-current assets held for sale
Non-current assets are classified as held for sale if their carrying amount will be recovered principally
through a disposal transaction rather than through continuing use. This condition is regarded as met
only when the disposal is highly probable and the asset is available for immediate disposal in its present
condition. For the disposal to be highly probable, management must be committed to the sale, which
should be expected to qualify for recognition as a completed sale within one year from the date of
classification.
Non-current assets classified as held for sale are measured at the lower of the assets’ previous carrying
amount and fair value less costs to sell.
Application of amendments to Hong Kong Financial Reporting Standards (“HKFRSs”)
The Group has applied for the first time in the current interim period, the following amendments
to HKFRSs issued by the HKICPA that are relevant for the preparation of the Group’s condensed
consolidated financial statements.
Amendments to HKFRSs Annual Improvements to HKFRSs 2012–2014 Cycle
Amendments to HKFRS 10,
HKFRS 12 and HKAS 28
Investment Entities: Applying the Consolidation Exception
Amendments to HKFRS 11 Accounting for Acquisitions of Interests in Joint Operations
Amendments to HKAS 1 Disclosure Initiative
Amendments to HKAS 16 and
HKAS 38
Clarification of Acceptable Methods of Depreciation and
Amortisation
Amendments to HKAS 16 and
HKAS 41
Agriculture: Bearer Plants
Amendments to HKAS 27 Equity Method in Separate Financial Statements
The application of the above amendments to HKFRSs in the current interim period has had no material
effect on the amounts reported in these condensed consolidated financial statements and/or disclosures set
out in these condensed consolidated financial statements.

– 8 –
4. SEGMENT INFORMATION
Segment revenue and profit
The Group determines its operating segments based on internal reporting about components that are
regularly reviewed by the chief operating decision makers. Information reported to the Group’s chief
operating decision makers, who are the executive directors of the Company, for the purposes of resource
allocation and assessment of performance is mainly focused on the property development, property
investment, operations of Dorsett Hospitality International Limited (“Dorsett”) and its subsidiaries
(including hotel operations and management, property investment, securities and financial product
investments), and car park operations and facilities management in each of the geographical locations as
stated below, securities and financial product investments and other operations, which mainly include
provision of engineering services and second mortgage loans.
The following is an analysis of the Group’s revenue and results by reportable and operating segment.
Segment profit (loss) represents the pre-tax profit (loss) earned (incurred) by each segment without
allocation of central administrative costs, directors’ salaries and finance costs.
Segment revenue Segment profit (loss)Six months
endedSix months
endedSix months
endedSix months
ended30.9.2016 30.9.2015 30.9.2016 30.9.2015HK$’000 HK$’000 HK$’000 HK$’000
(unaudited) (unaudited) (unaudited) (unaudited)
Property development– Australia 1,484,741 683,924 463,601 184,886– Hong Kong (“HK”) – 33,677 (8,595) (29,650)– Malaysia – – 2,224 (246)– Other regions in the People’s
Republic of China excluding HK (“PRC”) 475,498 170,849 300,677 101,453
– Singapore – – (4,096) –– United Kingdom (“UK”) – 753 (678) (4,667)
1,960,239 889,203 753,133 251,776
Property investment– HK 17,775 18,222 158,553 56,765– PRC 5,816 7,074 (12,198) (15,755)– Singapore – 445 – (2,768)
23,591 25,741 146,355 38,242
Operations of Dorsett and its subsidiaries– HK 286,987 312,360 57,343 5,289– Malaysia 108,071 102,184 11,147 7,920– PRC 108,099 102,516 (10,005) 11,474– Singapore 48,883 48,413 9,859 11,498– UK 64,368 68,585 7,567 8,574
616,408 634,058 75,911 44,755

– 9 –
Segment revenue Segment profit (loss)Six months
endedSix months
endedSix months
endedSix months
ended30.9.2016 30.9.2015 30.9.2016 30.9.2015HK$’000 HK$’000 HK$’000 HK$’000
(unaudited) (unaudited) (unaudited) (unaudited)
Car park operations and facilities management– Australia 303,823 292,491 24,421 24,059– Malaysia 5,671 6,527 2,425 3,173
309,494 299,018 26,846 27,232
Securities and financial product investments 42,326 8,496 63,730 (16,728)
Other operations 549 548 2,617 35,939
Segment revenue/segment profit 2,952,607 1,857,064 1,068,592 381,216
Unallocated corporate expenses (41,932) (32,964)Finance costs (105,483) (25,553)
Profit before tax 921,177 322,699Income tax expense (233,000) (48,325)
Profit for the period 688,177 274,374
None of the segments derived any revenue from transactions with other segments.

– 10 –
Segment assets
The following is an analysis of the Group’s assets by reportable segment as at the end of the reporting
period. Segment assets represent assets held by each segment without allocation of corporate assets which
are mainly bank balances and cash and deposit in a financial institution.
As at 30.9.2016
As at
31.3.2016
HK$’000 HK$’000(unaudited) (audited)
Property development
– Australia 2,124,987 2,567,468
– HK 2,225,272 2,161,886
– Malaysia 488,339 490,424
– PRC 2,944,992 2,788,467
– Singapore 2,520,771 2,390,450
– UK 328,938 348,355
10,633,299 10,747,050
Property investment
– HK 2,029,074 2,525,293
– PRC 2,728 4,222
2,031,802 2,529,515
Operations of Dorsett and its subsidiaries
– HK 3,619,139 3,574,530
– Malaysia 863,676 885,849
– PRC 1,979,259 2,078,333
– Singapore 624,054 675,385
– UK 1,003,973 999,932
8,090,101 8,214,029
Car park operations and facilities management
– Australia 737,105 699,048
– Malaysia 140,323 140,759
877,428 839,807
Securities and financial product investments 1,071,407 1,207,220
Other operations 242,258 253,343
Segment assets 22,946,295 23,790,964
Unallocated corporate assets 3,946,630 2,369,657
Total assets 26,892,925 26,160,621
Information about segment liabilities are not regularly reviewed by the chief operating decision makers.
Accordingly, segment liability information is not presented.

– 11 –
5. OTHER GAINS AND LOSSES
Six months ended30.9.2016 30.9.2015
HK$’000 HK$’000(unaudited) (unaudited)
Change in fair value of investment properties 211,630 127,122
Change in fair value of financial assets at fair value
through profit or loss 10,324 (51,705)
Change in fair value of derivative financial instruments 2,495 2,391
Impairment loss recognised in respect of interest in an associate (25,000) –
Net foreign exchange gains 37,614 56,337
Allowances for doubtful debts (2,044) (3,256)
235,019 130,889
6. FINANCE COSTS
Six months ended30.9.2016 30.9.2015
HK$’000 HK$’000(unaudited) (unaudited)
Interest on:
Bank borrowings 150,905 125,854
Finance leases 5 5
Interest on notes and bonds 45,757 66,023
Less: net interest income from cross currency swap contracts (12,739) (10,626)
Amortisation of front-end fee 5,042 2,766
Others 1,630 1,045
Total interest costs 190,600 185,067
Less: amounts capitalised to properties under development:
– investment properties under development – (1,684)
– properties for owners’ occupation (11,838) (8,640)
– properties for sale (73,279) (59,945)
105,483 114,798
Borrowing costs capitalised during the period which arose on the general borrowing pool of the Group
were calculated by applying a capitalisation rate ranging from 1.83% to 4.97% (six months ended
30.9.2015: 4.65% to 4.97%) per annum to expenditure on the qualifying assets.
– 12 –
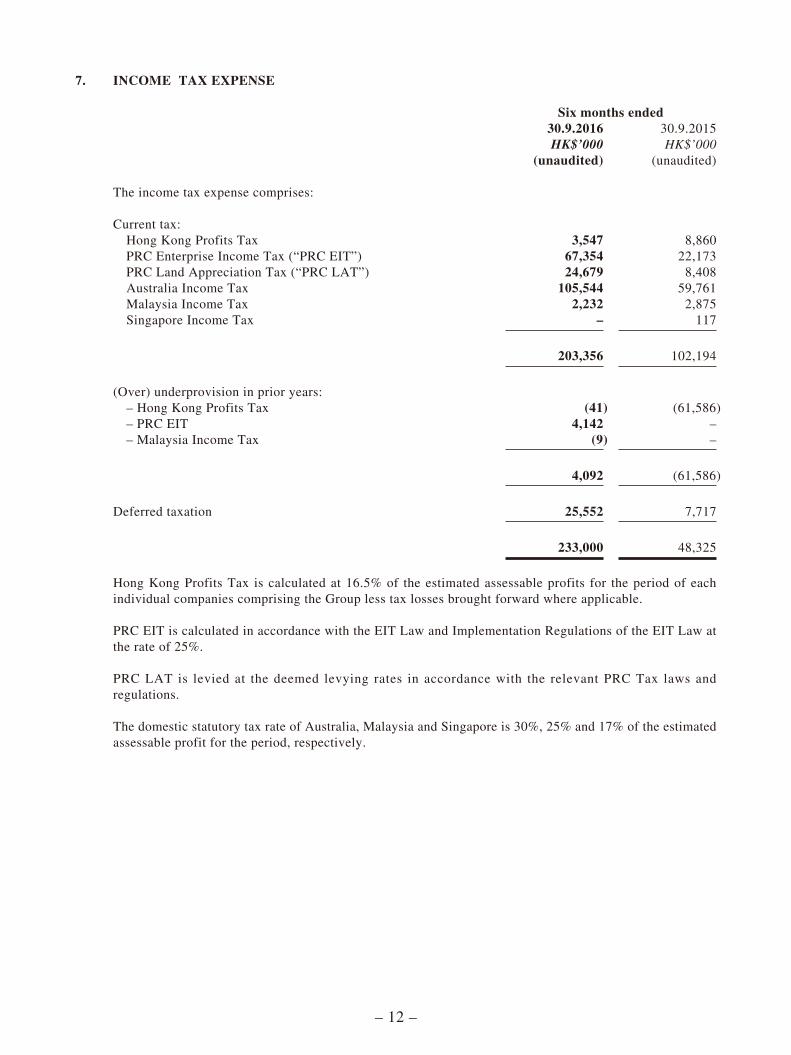
7. INCOME TAX EXPENSE
Six months ended30.9.2016 30.9.2015
HK$’000 HK$’000(unaudited) (unaudited)
The income tax expense comprises:
Current tax:
Hong Kong Profits Tax 3,547 8,860
PRC Enterprise Income Tax (“PRC EIT”) 67,354 22,173
PRC Land Appreciation Tax (“PRC LAT”) 24,679 8,408
Australia Income Tax 105,544 59,761
Malaysia Income Tax 2,232 2,875
Singapore Income Tax – 117
203,356 102,194
(Over) underprovision in prior years:
– Hong Kong Profits Tax (41) (61,586)
– PRC EIT 4,142 –
– Malaysia Income Tax (9) –
4,092 (61,586)
Deferred taxation 25,552 7,717
233,000 48,325
Hong Kong Profits Tax is calculated at 16.5% of the estimated assessable profits for the period of each
individual companies comprising the Group less tax losses brought forward where applicable.
PRC EIT is calculated in accordance with the EIT Law and Implementation Regulations of the EIT Law at
the rate of 25%.
PRC LAT is levied at the deemed levying rates in accordance with the relevant PRC Tax laws and
regulations.
The domestic statutory tax rate of Australia, Malaysia and Singapore is 30%, 25% and 17% of the estimated
assessable profit for the period, respectively.

– 13 –
8. PROFIT FOR THE PERIOD
Six months ended30.9.2016 30.9.2015
HK$’000 HK$’000(unaudited) (unaudited)
Profit for the period has been arrived at after charging:
Amortisation of prepaid lease payments 5,387 5,528
Depreciation of property, plant and equipment 147,572 158,393
Share of taxation of associates (included in share
of results of associates) 777 786
and after crediting:
Bank interest income 2,879 3,326
9. EARNINGS PER SHARE
The calculation of the basic and diluted earnings per share attributable to the shareholders of the Company
is based on the consolidated profit for the period attributable to the shareholders of the Company of
HK$681,427,000 (six months ended 30.9.2015: HK$263,242,000) and the number of shares calculated as
follows:
Six months ended30.9.2016 30.9.2015
’000 ’000(unaudited) (unaudited)
Weighted average number of ordinary shares for
the purpose of basic earnings per share 2,131,709 1,915,651
Effect of dilutive potential ordinary shares
– Company’s share options 444 5,079
Weighted average number of ordinary shares for
the purpose of diluted earnings per share 2,132,153 1,920,730
The computations for the six months ended 30 September 2015 did not assume the exercise of its indirect
subsidiary Dorsett’s share options as the exercise prices of those options are higher than the average
market prices of the Dorsett’s shares.
– 14 –
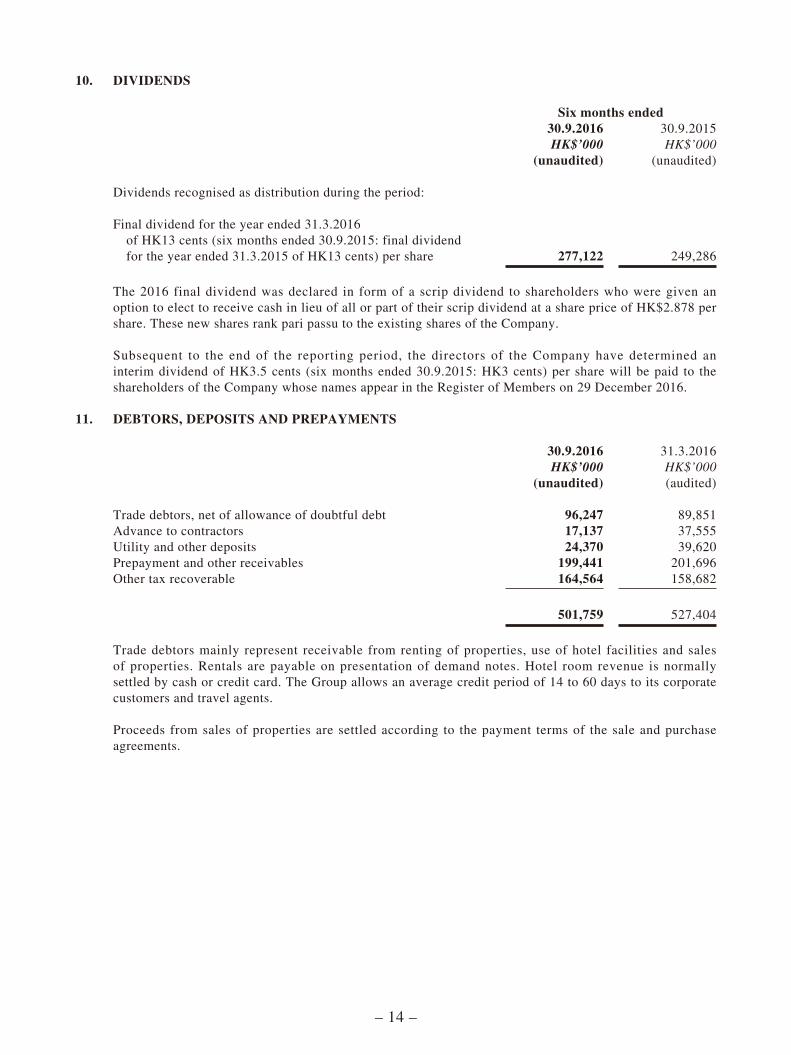
10. DIVIDENDS
Six months ended30.9.2016 30.9.2015
HK$’000 HK$’000(unaudited) (unaudited)
Dividends recognised as distribution during the period:
Final dividend for the year ended 31.3.2016
of HK13 cents (six months ended 30.9.2015: final dividend
for the year ended 31.3.2015 of HK13 cents) per share 277,122 249,286
The 2016 final dividend was declared in form of a scrip dividend to shareholders who were given an
option to elect to receive cash in lieu of all or part of their scrip dividend at a share price of HK$2.878 per
share. These new shares rank pari passu to the existing shares of the Company.
Subsequent to the end of the reporting period, the directors of the Company have determined an
interim dividend of HK3.5 cents (six months ended 30.9.2015: HK3 cents) per share will be paid to the
shareholders of the Company whose names appear in the Register of Members on 29 December 2016.
11. DEBTORS, DEPOSITS AND PREPAYMENTS
30.9.2016 31.3.2016
HK$’000 HK$’000(unaudited) (audited)
Trade debtors, net of allowance of doubtful debt 96,247 89,851
Advance to contractors 17,137 37,555
Utility and other deposits 24,370 39,620
Prepayment and other receivables 199,441 201,696
Other tax recoverable 164,564 158,682
501,759 527,404
Trade debtors mainly represent receivable from renting of properties, use of hotel facilities and sales
of properties. Rentals are payable on presentation of demand notes. Hotel room revenue is normally
settled by cash or credit card. The Group allows an average credit period of 14 to 60 days to its corporate
customers and travel agents.
Proceeds from sales of properties are settled according to the payment terms of the sale and purchase
agreements.

– 15 –
The following is an aged analysis of trade debtors, net of allowance of doubtful debt, based on the invoice
dates at the end of the reporting period, which approximated the respective revenue recognition date:
30.9.2016 31.3.2016
HK$’000 HK$’000(unaudited) (audited)
0-60 days 84,855 70,545
61-90 days 3,037 6,924
Over 90 days 8,355 12,382
96,247 89,851
12. CREDITORS AND ACCRUALS
30.9.2016 31.3.2016
HK$’000 HK$’000(unaudited) (audited)
Trade creditors
– Construction cost and retention payable 230,938 295,708
– Others 64,005 74,591
294,943 370,299
Construction cost and retention payable for capital assets 72,063 113,511
Rental and reservation deposits and receipts in advance 55,337 45,879
Other payable and accrued charges 281,415 299,074
703,758 828,763
The following is an aged analysis of the trade creditors, based on the invoice date:
30.9.2016 31.3.2016
HK$’000 HK$’000(unaudited) (audited)
0-60 days 278,519 347,097
61-90 days 1,984 2,851
Over 90 days 14,440 20,351
294,943 370,299

– 16 –
MANAGEMENT DISCUSSION AND ANALYSIS
Financial and Business Reviews
Financial review
1. Revenue analysis
The Company’s consolidated revenue for 1H FY2017 was approximately HK$3.0 billion, an increase of 59.0% as compared with the six months ended 30 September 2015 (“1H FY2016”). A breakdown of revenue is shown below:
1H FY2017 1H FY2016Major business HK$ million HK$ million Change
Sales of properties 1,960 889 120.5%Hotel operations and management 616 622 -1.0%Car park operations and facilities
management 309 299 3.3%Leasing of properties 24 26Others 44 21
Total revenue 2,953 1,857 59.0%
Revenue from sales of properties amounted to approximately HK$1,960 million in 1H FY2017, a robust increase of 120.5% as compared with 1H FY2016. During 1H FY2017, two projects were completed, namely Manhattan at Upper West Side (Stage 4) in Melbourne and King’s Manor (apartments) in Shanghai.
Revenue from hotel operations and management amounted to approximately HK$616 million in 1H FY2017, a slight decrease of 1.0% as compared to 1H FY2016.
Revenue from car park operations and facilities management amounted to approximately HK$309 million in 1H FY2017, an increase of 3.3% as compared to 1H FY2016. During 1H FY2017, approximately 5,200 car park bays were added to the Group’s car park management portfolio.
Revenue relating to leasing of properties maintained at approximately HK$24 million for 1H FY2017, a similar level as for 1H FY2016.

– 17 –
In general, contributions from the Group’s non-Hong Kong operations were affected by the movement of foreign currencies against Hong Kong dollar, but the impact of such currency movement to the Group’s results for 1H FY2017 was less than that for 1H FY2016. The table below sets forth the exchange rates of Hong Kong dollar against the local currency of countries where the Group has significant operations:
Rate as at 30 September 31 March2016 2016 Change
HK$/AUD 5.90 5.93 (0.51%)HK$/RMB 1.16 1.20 (3.33%)HK$/MYR 1.87 1.97 (5.08%)HK$/GBP 10.02 11.12 (9.89%)HK$/SGD 5.67 5.74 (1.22%)
Average rates for 1H FY2017 1H FY2016 Change
HK$/AUD 5.92 5.67 4.41%HK$/RMB 1.18 1.24 (4.84%)HK$/MYR 1.92 1.92 –HK$/GBP 10.57 11.59 (8.80%)HK$/SGD 5.71 5.53 3.25%

– 18 –
2. Gross profit analysis
Property development
Hotel operations
and management
Car park operations
and facilities management Others Total
HK$’000 HK$’000 HK$’000 HK$’000 HK$’000
For 1H FY2017Revenue 1,960,239 616,408 309,494 66,466 2,952,607
Gross profit 765,537 232,771 56,943 53,314 1,108,565Depreciation and
amortization – 137,359 10,083 – 147,442
Adjusted gross profit 765,537 370,130 67,026 53,314 1,256,007
Adjusted gross profit margin 39.1% 60.0% 21.7% 80.2% 42.5%
For 1H FY2016Revenue 889,203 622,079 299,018 46,764 1,857,064
Gross profit 298,625 239,949 57,222 32,772 628,568Depreciation and
amortization – 141,387 9,091 – 150,478
Adjusted gross profit 298,625 381,336 66,313 32,772 779,046
Adjusted gross profit margin 33.6% 61.3% 22.2% 70.1% 42.0%

– 19 –
3. Liquidity, financial resources and net gearing
The following table sets out the Group’s bank and cash balances, investment securities (which are considered as cash equivalent items due to its easily-monetizable nature), bank loans and borrowings and equity as at 30 September 2016.
As at30.9.2016 31.3.2016
HK$ million HK$ million
Bank loans, notes and bondsDue within 1 year 1,258 1,864Due 1 – 2 years 1,708 1,691Due 2 – 5 years 8,780 7,198Due more than 5 years 355 920
Total bank loans, notes and bonds 12,101 11,673
Investment securities 1,087 1,219Bank and cash balances 4,335 2,531
Liquidity position 5,422 3,750
Net debts(i) 6,679 7,923
Carrying amount of the total equity 10,429 10,267Add: hotel revaluation surplus 10,732 10,732
Total adjusted equity 21,161 20,999
Net gearing ratio (net debts to total adjusted equity) 31.6% 37.7%
Note:
(i) Net debts represent total bank loans, notes and bonds less investment securities, bank and cash
balances.
To better manage the Group’s liquidity position, the Group allocated a portion of its cash position in marketable investment securities. Investment securities shown on the consolidated statement of financial position represent primarily fixed income securities and investments in fixed income funds.

– 20 –
The liquidity position of the Group as at 30 September 2016 was approximately HK$5.4 billion, representing an increase of 44.6% from the balance as at 31 March 2016, primarily due to the collection of sales proceeds upon completion of the Group’s two residential developments during 1H FY2017 namely Manhattan at Upper West Side (Stage 4) in Melbourne and King’s Manor in Shanghai, stable cash inflow from the Group’s recurring income business, recognition of sales of approximately HK$620 million which was booked as disposal of investment properties as well as proceeds from the issuance of the below-mentioned medium term notes, and offset by repayment of bank borrowings and certain capital expenditure.
In August 2016, the Company successfully established a US$1,000 million medium term note programme (the “Medium Term Note Programme”) which is listed on the Stock Exchange, under which the Company has the flexibility to issue multi-currency notes in the international capital market as and when funding is needed. In September 2016, the Company issued US$300 million 3.75 percent 5-year notes (the “Issue”) due on 8 September 2021 under the Medium Term Note Programme. The Issue represented a highly successful fundraising by the Group in the international capital markets, and helped to extend the debt maturity profile of the Group. The proceeds from the Issue will be used for the Group’s business development and general corporate purposes.
During 1H FY2017, the Group’s net debts reduced by approximately HK$1.2 billion to HK$6.7 billion, notwithstanding the Issue. The Group will continue to settle development construction loans when the relevant projects are completed and to repay loans with shorter maturity and higher cost of funding, with an aim of locking in longer dated funding and lowering the Group’s overall cost of borrowing. The Group’s average cost of borrowing was approximately 3.07% for 1H FY2017 (3.41% for 1H FY2016).
The table below shows the Group’s debts profile.
As at30.9.2016 31.3.2016
HK$ million HK$ million
The Company’s notes 2,322 –Dorsett bonds 840 868Unsecured bank loans 1,742 1,741Secured bank loans
– Property development and investment 2,715 3,907– Hotel operations and management 4,125 4,821– Car park operations and facilities management 349 327– Others 8 9
Total bank loans, notes and bonds 12,101 11,673

– 21 –
The carrying amounts of the total bank loans, notes and bonds in the Company’s consolidated statement of financial position include an amount of approximately HK$725 million (as at 31 March 2016: HK$1,073 million) which is reflected as current liabilities even though such sum is not repayable within one year, as the relevant banks and/or financial institutions have discretionary rights to demand immediate repayment.
As at 30 September 2016, the Group’s undrawn banking facilities were approximately HK$5.0 billion which were all committed banking facilities, of which approximately HK$2.2 billion was in relation to construction development while the balance of approximately HK$2.8 billion was for the Group’s general corporate use. The banking facilities together with sale proceeds to be generated from the Group’s upcoming property development projects place the Group in a solid financial position to fund not only its existing business and operations but also to further expand its business.
In addition, a total of 8 hotel assets within the Group were unencumbered as at 30 September 2016, the capital value of which amounted to HK$3.0 billion based on independent valuation assessed as at 31 March 2016. These assets can be used as collateral for further bank borrowings which can provide further liquidity for the Group, should this be necessary.
Adjusting for the unrecognized hotel revaluation surplus of approximately HK$10,732 million, based on independent valuation assessed as at 31 March 2016 (HK$10,976 million as at 31 March 2015), the Group’s total consolidated equity as at 30 September 2016 was approximately HK$21,161 million. The net gearing ratio of the Group was at 31.6%, which was maintained at a similar healthy level as of 31 March 2016.
4. Net asset value per share
As at30.9.2016 31.3.2016
HK$ million HK$ million
Equity attributable to shareholders of the Company 10,291 10,140Add: Hotel revaluation surplus 10,732 10,732
Total net asset value 21,023 20,872
Number of shares issued (million) 2,132 2,132
Net asset value per share HK$9.86 HK$9.79
Adjusting for revaluation surplus on hotel assets of approximately HK$10,732 million, based on independent valuation assessed as at 31 March 2016 (HK$10,976 million as at 31 March 2015), total net asset value of the Group reached approximately HK$21,023 million. Net asset value per share for the Company as at 30 September 2016 was approximately HK$9.86.

– 22 –
5. Capital expenditure
The Group’s capital expenditure consists of expenditure for acquisition, development and refurbishment of hotel properties, plant and equipment.
During 1H FY2017, the Group’s capital expenditure amounted to approximately HK$240 million primarily attributable to construction works on the Group’s hotel properties to be opened, namely Dorsett City in London and Silka Tsuen Wan in Hong Kong, and the renovation works on Dorsett Wanchai (formerly known as Cosmopolitan Hotel) in Hong Kong. The capital expenditure was funded through a combination of borrowings and internal resources.
6. Capital commitments
As at30.9.2016 31.3.2016
HK$ million HK$ million
Capital expenditure contracted but not providedin the condensed consolidated financialstatements in respect of:Acquisition, development and refurbishment
of hotel properties 240,085 318,805Others 18,176 33,745
258,261 352,550
7. Post balance sheet events
Casino licence granted to Destination Brisbane Consortium
In October 2016, the Queensland Government, Australia granted a new casino licence to the Destination Brisbane Consortium (the “Consortium”), a joint venture between the Group, The Star Entertainment Group Limited (“The Star”) and Chow Tai Fook Enterprises Limited (“CTF”), for its Queen’s Wharf Brisbane project.

– 23 –
The casino licence was issued to the Consortium under which casino operations are
permitted to commence upon completion of the integrated resort component of the
development, which is expected to take place in 2022. The Group and CTF each has 25%
interest in the integrated resort component (excluding residential component) and The
Star has the remaining 50% interest. This casino licence will deliver the key operating
terms for successful delivery of the integrated resort, which include casino licence
term and integrated resort precinct lease term of 99 years, a 25-year casino exclusivity
period within 60 kilometres from the Brisbane CBD from commencement of operations
of the integrated resort, maximum approved electronic gaming machines of 2,500, and
unlimited gaming tables (including electronic derivations).
Redevelopment of Hornsey Town Hall, London
In November 2016, the Group was announced as the preferred bidder of the Hornsey
Town Hall redevelopment project in London, the United Kingdom. The site will be
converted into a mixed-used development featuring residential component, a hotel and a
town hall with communal areas.
Business review
1. Property division
The Group’s property division includes property investment and property development.
Property investment comprises investments in retail and office buildings located in
Shanghai, Hong Kong, Singapore and Melbourne. For 1H FY2017, a fair value gain of
investment properties of approximately HK$212 million was recognized. The increase
in valuation of investment properties was mainly due to an increase in fair value of the
investment properties in Shanghai, Hong Kong and Melbourne (following completion of
Upper West Side). As at 30 September 2016, valuation of investment properties reached
approximately HK$2.8 billion (31 March 2016: HK$3.3 billion), a decrease of HK$0.5
billion after recognising the disposal of Eivissa Crest.
Eivissa Crest is a residential project with 106 residential apartments totalling
approximately 36,000 square feet (“sq. ft.”). in saleable floor area. The site was
previously acquired for the purpose of generating recurring income. However, having
considered the market conditions, the Group subsequently decided to change the site to
residential property development for sale, and accordingly, the site was treated as an
investment property according to HKAS 40 “Investment Properties”. Upon the delivery
of these residential units during 1H FY2017, the difference between the net disposal
proceeds and the carrying amount of these units, the delivery of units was recognized as
gain on disposal of investment properties held for sale.

– 24 –
The Group has a diversified portfolio in residential property development in Australia, Mainland China, Hong Kong, the United Kingdom and Malaysia. To carry out property development in the various markets, the Group has established strong local teams in each of these markets, which, coupled with the regionalisation approach, allow the Group to take advantage of the different property cycles in different markets. This strategy has resulted in a relatively low land cost base for the Group’s development projects. The Group’s property developments are largely focused on mass residential market where the Group can benefit from the growing affluence of the middle class.
Total cumulative presales value of the Group’s residential properties under development amounted to approximately HK$9.8 billion as at 30 September 2016. As revenue will only be recognized when the sales of the property developments are completed, proceeds of the presales were not reflected in the Group’s consolidated income statement. The Group expects a significant cash inflow when the projects are completed.
The following shows a breakdown of the Group’s total cumulative presales value of residential properties under development as at 30 September 2016.
Developments Location HK$ million
Expectedfinancial yearof completion
Aspen Crest Hong Kong 989 FY2019Manhattan at Upper West Side Melbourne 364(i) FY2017The FIFTH Melbourne 1,218 FY2018West Side Place (Towers 1 and 2) Melbourne 3,378 FY2021The Towers at Elizabeth Quay Perth 1,626 FY2019King’s Manor Shanghai 841 FY2017The Royal Crest II Shanghai 806 FY2018Royal Riverside (Towers 1, 2 and 4) Guangzhou 240 FY2018Dorsett Bukit Bintang Kuala Lumpur 305 FY2017/18
Cumulative contracted presales value 9,767
Note:
(i) Represents remaining units awaiting settlement.
During 1H FY2017, the Group launched presales of four of its residential development projects, namely (i) West Side Place Towers 1 and 2; (ii) town houses at King’s Manor; (iii) The Royal Crest II; and (iv) Tower 1 at Royal Riverside. Total expected gross development value (“GDV”) and saleable floor area of these four development projects are approximately HK$7.7 billion and 1.5 million sq. ft. respectively.
Currently the Group has 21 active residential property development projects with expected attributable saleable floor area of approximately 6.6 million sq. ft. under various stages of development across the regions. Details of the Group’s pipeline as at 30 September 2016 are shown below.

– 25 –
Developments
Attributable saleable
floor area(i)
Expectedattributable
GDV(ii)
Status/Expected
launch
Expectedfinancial yearof completion
Sq. ft. HK$ million
MelbourneWest Side Place
– Towers 1 and 2 1,072,000 5,573 Launched FY2021– Tower 3 400,000 2,093 FY2018 Planning– Tower 4 576,000 3,013 Planning Planning
The FIFTH 284,000 1,218 Launched FY2018Manhattan at Upper
West Side 85,000 364 CompletedCompleted in
FY2017
Perth Perth City Link 188,000 986 Planning PlanningThe Towers at Elizabeth Quay 320,000 2,719 Launched FY2019
Brisbane Queen’s Wharf Brisbane(iii) 706,000 4,094 Planning Planning
ShanghaiKing’s Manor 284,000 1,249 Launched FY2017The Royal Crest II 259,000 1,404 Launched FY2018
GuangzhouRoyal Riverside 683,000 2,065 Launching FY2018
Hong KongAspen Crest 64,000 1,069 Launched FY2019Tan Kwai Tsuen 51,000 581 FY2017/18 FY2018Sha Tau Kok 99,000 994 Planning FY2019Sham Shui Po 28,000 400 Planning FY2019/20Tai Wai 33,000 440 Planning FY2019/20Shatin Heights 70,000 1,200 Planning Planning
Kuala LumpurDorsett Bukit Bintang 215,000 790 Launched FY2017/18
LondonAlpha Square 388,000 3,887 FY2018/19 Planning
ManchesterAngel Meadow at NOMA 425,000 1,490 FY2018/19 Planning
SingaporeAlexandra View(iv) 290,000 2,805 FY2018 Planning
Total 6,520,000 38,434

– 26 –
Notes:
(i) The figures represent approximate saleable residential floor area which may vary subject to
finalization of development plans.
(ii) The amounts shown represent expected gross development value attributable to the Group, which
may change subject to market conditions.
(iii) This residential development consists of a total floor area of approximately 1,400,000 sq. ft.. The
Group has 50% interest in the development.
(iv) Total saleable floor area of this development is approximately 410,000 sq. ft.. The Group has 70%
interest in the development.
In addition to the above, the Group has entered into a memorandum of understanding with the partners of Destination Brisbane Consortium to develop The Star’s casino sites in Gold Coast and Sydney. These projects are expected to contribute to the residential pipeline of the Group.
Australia
Melbourne
West Side Place is a mixed-use residential development located in CBD of Melbourne. This development is expected to have a residential saleable floor area of approximately 2 million sq. ft. from 4 towers with approximately 3,000 apartments. A hotel which will be operated by Ritz Carlton with approximately 260 hotel rooms will be located at the top of Tower 1. Presales of Towers 1 and 2 were launched in June 2016 with a very promising result on which a strong momentum has been built. Total expected GDV of these 2 towers is HK$5.6 billion, of which HK$3.4 billion was presold as at 30 September 2016, representing over 60% of the GDV. They are expected to be completed in FY2021. Presale of Tower 3 is expected to start in the financial year ending 31 March 2018. Total GDV of West Side Place is expected to be more than HK$10 billion. This development is expected to strengthen the Group’s cashflow and earnings in the coming few years.
The FIFTH is located next to West Side Place and provides 402 apartments. This development with a total GDV of approximately HK$1.2 billion has been completely presold. It is expected to be completed in the financial year ending 31 March 2018.
Manhattan at Upper West Side (Stage 4) was completed in late July 2016. Total GDV of this development was approximately HK$1,734 million. Approximately 79% of the development was delivered in August and September 2016, with the balance of approximately HK$364 million expected to be settled and recognized as revenue in the six months ending 31 March 2017.

– 27 –
Perth
The Towers at Elizabeth Quay is a mixed-use development comprising residential apartments of approximately 320,000 sq. ft. in saleable floor area, a luxury Ritz-Carlton hotel with more than 200 rooms, approximately 20,000 sq. ft. of commercial or retail area as well as other ancillary facilities. As at 30 September 2016, its presales value reached approximately HK$1.6 billion, representing 59.8% of the expected GDV. This development is expected to be completed in the financial year ending 31 March 2019.
In late August 2016, the Group signed a contract to purchase Perth City Link project, which is a mixed-use development located adjacent to the Perth Arena. This project will deliver more than 350 residential apartments and approximately 250 hotel rooms to be managed by Dorsett on two prime lots. It is a major project undertaken by the Western Australian Government to reconnect the Perth CBD and the entertainment district (Northbridge). The project is currently under planning stage.
Brisbane
The Consortium, a joint venture between the Group, The Star and CTF, entered into Development Agreements with the Queensland State for the delivery of the Queen’s Wharf Project in Brisbane (the “Project”). The Project comprises:
(1) an integrated resort component in which the Group’s ownership is 25% (CTF: 25% and The Star: 50%) with an equity investment amount of approximately AUD193 million. Payments will be made progressively commencing from signing of the Project documents up to completion of the Project.
(2) The residential component owned in the proportion of 50% by the Group and 50% by CTF.
Together with the Group’s portion of land premium for this residential component, the total capital commitment of the Group is expected to be approximately AUD226 million which the Group intends to fund from its internal resources. The Project encompasses a total area of approximately 9.4 hectares at Queen’s Wharf, Brisbane, and envisages three residential towers, five world-class hotels, high-end food and commercial outlets and a casino in Brisbane’s prime waterfront district. The total core development gross floor area (“GFA”) of the Project is expected to be 544,600 square meters (“sq. m.”) of which approximately 167,000 sq. m. relates to the residential component.
The land is expected to be handed over to the Consortium in 2017 with construction anticipated to commence shortly thereafter. The integrated resort component is expected to open by end of 2022. The Project brings together the Group’s experience in international hospitality operation and mixed-use development, CTF’s extensive VIP customer base in Mainland China and Asian markets, as well as The Star’s operational experience in integrated resorts. The Project is expected to contribute significantly to the Group’s recurring cash flow stream as well as add to its residential development pipeline.

– 28 –
Mainland China
The Group has been developing California Garden, a premier township development in Shanghai over a number of years. The development comprises a diversified portfolio of residences including low-rise apartments, high-rise apartments and town houses. Currently, 2 residential phases, namely King’s Manor and The Royal Crest II, are under various stages of construction.
King’s Manor consists of 479 apartments and 90 town houses, out of which 255 apartments and 54 town houses have been delivered up to 30 September 2016. Out of the remaining portion which includes 224 apartments and 36 town houses with an expected GDV of HK$1,249 million, units worth HK$841 million have been presold, representing 67.3% of the expected GDV, as at 30 September 2016. It is expected that a significant portion of the presold units will be delivered and recognised as revenue in the six months ending 31 March 2017.
The Royal Crest II consists of 180 apartments and 42 town houses. The expected GDV is approximately HK$1,404 million. The presale launch of the 180 apartments took place in April 2016, with its presales value reaching HK$777 million as at 30 September 2016, representing 97.7% of the total GDV of the apartments totaling HK$795 million. Presale for town houses commenced in September 2016, driving the total presales value for the project to reach HK$806 million. The Royal Crest II is expected to be completed in the financial year ending 31 March 2018.
In Guangzhou, Royal Riverside is a 5-tower residential development producing 607 apartments with a total saleable floor area of approximately 683,000 sq. ft. and a total expected GDV of HK$2 billion. Towers 1, 2 and 4 have been launched for presale with the cumulative presales value reaching HK$240 million as at 30 September 2016. The development is expected to be completed in the financial year ending 31 March 2018.
Hong Kong
The Group has been actively building its development pipeline in Hong Kong. The Group continues to increase its land bank through acquisition of redevelopment sites, by participating in government tender and bidding for projects with Urban Renewal Authority (“URA”).
Currently the Group has 6 residential projects in the pipeline in Hong Kong.
Aspen Crest is a redevelopment project and consists of 234 apartments with approximately 64,000 sq. ft. in saleable floor area and approximately 16,000 sq. ft. of commercial component. As at 30 September 2016, its presales value reached approximately HK$989 million, representing 92.5% of the total expected GDV. Its completion is expected to take place in the financial year ending 31 March 2019.
A residential development site at Tan Kwai Tsuen consisting of 24 town houses with approximately 51,000 sq. ft. in saleable floor area is expected to be launched for presale in the second quarter of 2017. Completion is expected to be in the financial year ending 31 March 2018.

– 29 –
The Group’s residential development site at Sha Tau Kok was acquired through a government tender. This development comprises 263 low-rise apartments with approximately 99,000 sq. ft. in saleable floor area. Its presale launch is planned to commence in the second quarter of 2017 with completion expected in the financial year ending 31 March 2019.
A residential development site at Hai Tan Street, Sham Shui Po was acquired through URA. This residential development will comprise 72 apartments (mainly 1-bedroom apartment) with approximately 28,000 sq. ft. in saleable floor area. Completion is expected to be in the financial year ending 31 March 2019/2020.
A development site at Mei Tin Road, Tai Wai, comprising a residential component of approximately 33,000 sq. ft. in saleable floor area and a commercial component of approximately 5,800 sq. ft. in gross floor area, was acquired by the Group through government tender. Completion is expected to be in the financial year ending 31 March 2019/2020.
The Group also acquired through government tender a residential development site at Tai Po Road, Shatin Heights. This development will comprise more than 60 apartments and 4 houses. The project has a GFA of approximately 88,000 sq. ft. and is currently under planning stage.
Malaysia
Dorsett Bukit Bintang is a residential development adjacent to Dorsett Regency Kuala Lumpur. This development consists of 252 high-rise apartments with approximately 215,000 sq. ft. in saleable floor area. As at 30 September 2016, presales value reached approximately HK$305 million, representing 38.6% of the total expected GDV. Completion is expected to take place in the financial years ending 31 March 2017 and 2018.
United Kingdom
Alpha Square is a residential development site in Marsh Wall, Canary Wharf, London. During 1H FY2017, the Group obtained planning approval of this development which will feature a mixed-use complex including residences of approximately 388,000 sq. ft. in saleable floor area, a hotel of approximately 230 rooms and commercial facilities. This development is currently under master planning stage.
In August 2016, the Group was appointed by Manchester Place and The Co-operative Group as a developer for the Angel Meadow site at NOMA, one of the major residential growth areas for Manchester, the United Kingdom. Subject to planning approval, it is expected to build more than 600 apartments with approximately 425,000 sq. ft. of saleable floor area. Currently, this development is under planning stage.
Singapore
Alexandra View is a residential project located next to the Redhill MRT station in Singapore. The development is expected to consist of approximately 410,000 sq. ft. in saleable floor area, and is owned by a joint venture in which the Group has a 70% interest. The Group plans to launch its presale in April 2017.

– 30 –
2. Hotel operations and management
The performance of Dorsett’s owned hotel operations for 1H FY2017 is summarised as follows:
For the 6 months ended 30.9.2016 30.9.2015
Hong KongOccupancy rate 87.2% 85.7%Average room rate (HK$) 632 679RevPAR (HK$) 551 582Revenue (HK$ million) 287 300
MalaysiaOccupancy rate 68.3% 66.2%Average room rate (HK$) 360 364RevPAR (HK$) 246 241Revenue (HK$ million) 108 102
Mainland ChinaOccupancy rate 59.7% 51.1%Average room rate (HK$) 489 528RevPAR (HK$) 292 270Revenue (HK$ million) 108 103
SingaporeOccupancy rate 79.5% 80.9%Average room rate (HK$) 1,070 1,057RevPAR (HK$) 851 855Revenue (HK$ million) 49 48
United KingdomOccupancy rate 89.4% 90.0%Average room rate (HK$) 1,075 1,136RevPAR (HK$) 962 1,022Revenue (HK$ million) 64 69
TotalOccupancy rate 76.2% 73.2%Average room rate (HK$) 599 641RevPAR (HK$) 456 469Revenue (HK$ million) 616 622
The Group’s hotel operations for 1H FY2017 recorded a total revenue of approximately HK$616 million which was at a similar level as compared with that in 1H FY2016. Overall occupancy rate (“OCC”) increased by 3 percentage points year-on-year while the room revenue per available room (“RevPAR”) decreased by 2.8% year-on-year to HK$456 in part due to adverse currency movements.

– 31 –
Hong Kong remains the main contributor to the Group’s hotel operations and management revenue, representing 46.6% (HK$287 million) of the Group’s total revenue in that segment. The OCC increased by 1.5 percentage points year-on-year and average room rate (“ARR”) decreased by approximately 6.9% year-on-year to HK$632, resulting in an approximately 5.3% year-on-year decrease in RevPAR to HK$551. As the challenging hotel business environment in Hong Kong showed signs of a turnaround, the Group has adjusted its distribution strategy and launched a number of sales and marketing campaigns to minimize such adverse impact. The increased OCC is expected to enhance upcoming RevPAR and a moderate growth of hotel performance in Hong Kong is anticipated in the near medium term.
In Malaysia, revenue from hotel operations and management for 1H FY2017 increased by 5.9% year-on-year to approximately HK$108 million. OCC increased by 2.1 percentage points year-on-year, with ARR decreased by 1.1% year-on-year and RevPAR increased by 2.1% year-on-year. Compared with 1H FY2016, hotel performance in Malaysia was stable and the impact from currency exchange was relatively mild.
In Singapore, Dorsett Singapore recorded a revenue of approximately HK$49 million for 1H FY2017, maintaining at a similar level as for 1H FY2016. OCC was 79.5% and a slight increase to HK$1,070 was noted in ARR, resulting in a RevPAR of HK$851.
In Mainland China, OCC in 1H FY2017 increased by 8.6 percentage points year-on-year while ARR decreased by 7.4% year-on-year to HK$489. RevPAR increased by 8.1% year-on-year to HK$292 and revenue increased by 4.9% year-on-year to approximately HK$108 million. Assuming constant exchange rate, RevPAR increased by 12.8% and revenue increased by 10.1% year-on-year, primarily due to significant improvement in the performance of Dorsett Grand Chengdu and Dorsett Shanghai. OCC of Dorsett Grand Chengdu improved significantly by 23.3 percentage points year-on-year to 56.6% which significantly enhanced its RevPAR by 49.6% year-on-year to RMB189. Dorsett Shanghai’s improvement in results continued with a more diversified customer mix, with its OCC and ARR improving by 5.2 percentage points and 8.3% year-on-year respectively. Its RevPAR recorded a year-on-year increase of 15.2%.
In the United Kingdom, Dorsett Shepherds Bush recorded a revenue of approximately HK$64 million for 1H FY2017, a decrease of 7.2% as compared with 1H FY2016, mainly as a result of unfavorable currency movement. Assuming constant exchange rate, revenue increased by 2.9% year-on-year, with ARR and RevPAR also increasing by 3.5% and by 3.1% year-on-year respectively. Post Brexit, depreciation of Sterling Pound improved UK’s tourism business including hotel performance in London, with the Group’s OCC improved 5.8 percentage points and RevPAR increased 5.7% in the United Kingdom after the event.
In the next 6 months, it is anticipated that two new hotels will be opened, namely Dorsett City in London and Silka Tsuen Wan in Hong Kong. These two new hotels will add approximately 700 rooms to the Group’s current operating portfolio.

– 32 –
As at 30 September 2016, the Group operated 20 owned hotels (9 in Hong Kong, 5 in Malaysia, 4 in Mainland China, 1 in Singapore and 1 in London) with approximately 6,000 rooms. The Group has 13 hotels in the development pipeline, of which two are Ritz Carlton hotels, one each in Melbourne and Perth, and four world-class hotels in the integrated resort of Queen’s Wharf, Brisbane in which the Group has a 25% interest, with the remaining expected to be operated by Dorsett. When all the hotels in the pipeline become operational, the Group will have 33 owned hotels operating more than 9,300 rooms.
The Group, together with The Star and Chow Tai Fook, is also in the process of acquiring the entire interests in Sheraton Mirage, Gold Coast. This beach front hotel with 295 rooms and suites is intended to complement the Queens Wharf Brisbane project as a satellite hotel.
3. Car park operations and facilities management
The Group’s car park and facilities management business includes car park operations and property management services.
The car park business extends to both third party owned car parks and self-owned car parks and generates a stable recurring income for the Group. This business sector has been achieving steady growth over the years, with the Group’s portfolio under management growing into 399 car parks with approximately 76,200 car parking bays as at 30 September 2016, having added approximately 5,200 car parking bays during 1H FY2017. Of the Group’s 399 car parks, 25 were self-owned car parks (20 in Australia, 3 in New Zealand and 2 in Kuala Lumpur) comprising approximately 7,000 car parking bays, with the remaining 69,200 car parking bays in Australia, New Zealand and Malaysia under management contracts entered into with third party car park owners, which include local governments, shopping malls, retailers, universities, airports, hotels, hospitals, government departments and commercial and office buildings.
During 1H FY2017, the Group’s car park business completed a program to upgrade its central monitoring system, enabling the management team of this business to have a better control on the day-to-day operations of the business and providing a strong foundation for growth. The Group’s car park division is currently actively evaluating a number of acquisition opportunities.
With this division further expanding its operation to include property management services in Australia (mainly in Brisbane, Melbourne and Adelaide) and Johor Bahru, Malaysia, where the Group had 58 contracts in relation to facilities management services as at 30 September 2016, it is expected that the car park operations and facilities management business will continue its steady growth.

– 33 –
OUTLOOK
The Group continues to be well positioned to deliver sustainable and long-term growth with its regional diversification strategy. Presales value as at 30 September 2016 achieved a record high at HK$9.8 billion and a development pipeline of HK$38 billion provides clear visibility of the Group’s future profitability. The Group will continue to add to the development pipelines by increasing investment in the regions where the Group has an existing presence. Dorsett is now wholly owned by the Group which undoubtedly benefits the Group. The stable growth in car park operations and facilities management provides the Group with healthy revenue and cashflow.
The Group is actively evaluating acquisition opportunities overseas to take advantage of the strength in Hong Kong dollars.
The Group has a favorable liquidity position at approximately HK$5.4 billion. Together with the available undrawn credit facility of HK$5.0 billion, there is a significant war chest to support the growth of the Group. The net gearing ratio of 31.6% reflects the strength of the Group’s balance sheet.
In conclusion, the Group’s foundation for growth is solid and the Group will continue to bring to its Shareholders confidence in its stability and long-term growth.
EMPLOYEES AND REMUNERATION POLICIES
As at 30 September 2016, the Group had approximately 3,500 employees. The Group provides its employees with comprehensive benefit packages and career development opportunities, including medical benefits, both internal and external trainings appropriate for various level of staff roles and functions.
COMPLIANCE WITH CORPORATE GOVERNANCE CODE
Throughout the six months ended 30 September 2016, the Company has complied with the code provisions (the “Code Provisions”) set out in the Corporate Governance Code (the “CG Code”) contained in Appendix 14 to the Rules Governing the Listing of Securities on the Stock Exchange, except for the deviations from Code Provisions A.2.1 and E.1.2 described below.
Pursuant to Code Provision A.2.1 of the CG Code, the roles of Chairman and Chief Executive Officer should be separate and should not be performed by the same individual. Currently Tan Sri Dato’ David CHIU assumes the roles of both the Chairman and Chief Executive Officer of the Company. The Board believes that this structure provides the Group with strong and consistent leadership and allows for more effective and efficient business planning and decisions as well as execution of long-term business strategies. As such, it is beneficial to the business prospects of the Group.

– 34 –
Pursuant to Code Provision E.1.2 of the CG Code, the Chairman should attend the annual general meeting of the Company. Due to unavoidable business engagement, the Chairman was unable to attend the annual general meeting of the Company held on 26 August 2016. The Chairman had arranged for other directors and management, who are well-versed in the Company’s business and affairs, to attend the meeting and communicate with Shareholders.
PURCHASE, SALE OR REDEMPTION OF LISTED SECURITIES
During the six months ended 30 September 2016, neither the Company nor any of its subsidiaries has purchased, sold or redeemed any of the Company’s listed securities.
AUDIT COMMITTEE
The Audit Committee, comprising all of the Company’s three independent non-executive directors, namely Mr. Kwok Wai CHAN, Mr. Peter Man Kong WONG and Mr. Kwong Siu LAM has reviewed the accounting principles, standard and practices adopted by the Company, and discussed matters relating to auditing, risk management and internal control and financial reporting, including the review of the unaudited consolidated interim results of the Group for the six months ended 30 September 2016.
PUBLICATION OF THE INTERIM RESULTS AND INTERIM REPORT
This resul ts announcement is published on the websi te of the Stock Exchange at http://www.hkex.com.hk and on the website of the Company at http://www.fecil.com.hk. The Interim Report of the Company for the six months ended 30 September 2016 will be despatched to the Shareholders and published on the websites of the Stock Exchange and the Company in due course.
By order of the Board ofFar East Consortium International Limited
Tak Shing CHOICompany Secretary
Hong Kong, 23 November 2016
As at the date of this announcement, the Board comprises four executive directors, namely Tan Sri Dato’ David CHIU, Mr. Cheong Thard HOONG, Mr. Dennis CHIU and Mr. Craig Grenfell WILLIAMS; one non-executive director, Mr. Chi Hing CHAN; and three independent non-executive directors, namely Mr. Kwok Wai CHAN, Mr. Peter Man Kong WONG and Mr. Kwong Siu LAM.