far-field tsunami hazard from mega-thrust …. j. int. (2008) 172, 995–1015 doi:...
TRANSCRIPT

Geophys. J. Int. (2008) 172, 995–1015 doi: 10.1111/j.1365-246X.2007.03674.x
GJI
Sei
smol
ogy
Far-field tsunami hazard from mega-thrust earthquakesin the Indian Ocean
Emile A. Okal1 and Costas E. Synolakis2,3
1Department of Earth and Planetary Sciences, Northwestern University, Evanston, IL 60208, USA. E-mail: [email protected] of Civil Engineering, University of Southern California, Los Angeles, CA 90089, USA3Technical University of Crete, GR-73100 Chanea, Greece
Accepted 2007 October 31. Received 2007 October 6; in original form 2007 March 26
S U M M A R YWe evaluate far-field tsunami hazard in the Indian Ocean Basin based on hydrodynamic simula-tions of ten case studies of possible mega earthquakes at the major seismic zones surroundingthe basin. They represent worst-case scenarios of seismic rupture along the full extent ofseismogenic faults having supported large earthquakes in the historical record. In a series ofnumerical experiments in which the source parameters of the 2004 Sumatra tsunami are allowedto vary one by one, while keeping the seismic moment and the fault orientation unchanged, wedocument that the main patterns of far-field tsunami amplitudes are remarkably robust withrespect to nominal variations in such parameters as hypocentral depth, exact centroid location,and slip distribution on the fault plane. These results validate the concept of modelling casescenarios of potential future earthquakes whose source is by definition imprecise.
We consider seismic sources located at the extremities of the 2004 Sumatra–Andamanrupture, namely along the southern coast of Sumatra and in the Andaman–Myanmar province;along the Makran coast of Pakistan and Iran; and also along the southern coast of Java, wherethe possibility of a large interplate thrust earthquake cannot be entirely dismissed. The resultsof our hydrodynamic simulations indicate that the distribution of maximum amplitudes inthe Indian Ocean Basin is primarily controlled by the classical effect of source directivity,and additionally by refraction and focusing along bathymetric features. As a result, manyprovinces in the basin could be threatened by higher tsunami amplitudes than in 2004. Thispattern is particularly important along the coast of East Africa, from Somalia to and includingSouth Africa, in Madagascar and the Mascarene Islands, especially under a South Sumatrascenario involving an earthquake comparable to, or even possibly larger than, the 1833 event,whose epicentral area is widely believed to be under enhanced seismic risk as a result of stresstransfer from the 2004 and 2005 ruptures to the northwest, possibly even in the wake of the2007 Bengkulu earthquakes.
Key words: Numerical approximations and analysis; Tsunamis; Indian Ocean.
1 I N T RO D U C T I O N
The great Sumatra–Andaman tsunami of 2004 has awakened the at-
tention of the scientific community to tsunami hazard in the Indian
Ocean Basin. While regional tsunamis had been documented, for ex-
ample, in Java in 1994 (Tsuji et al. 1995) and along the Makran coast
of Pakistan ∗ in 1945 (Byrne et al. 1992), the devastation wrought
by the 2004 tsunami in the far field (e.g. in India, Sri Lanka, the
Maldives and Somalia) was without equivalent in the historical
record, and as such unexpected. Indeed, the only verifiable re-
ports of damage from transoceanic tsunamis generated by pre-2004
∗All names and spelling of geographical locations will reflect present-day
political boundaries.
earthquakes in the Indian Ocean involved the impact of the 1977
Sumbawa tsunami on the Australian coastline (Solov’ev et al. 1986),
which at a distance of 1000 km qualifies only marginally as ‘far-
field’, and a lone report of wave damage in the Seychelles following
the 1833 tsunami in South Sumatra (Jackson et al. 2005). Nott &
Bryant (2003) have further speculated that large boulders on the
northwestern coast of Australia may have been deposited during
prehistoric tsunamis, whose origin cannot be constrained. In con-
trast, the Car-Nicobar earthquake of 1881 December 31 generated a
tsunami which was recorded in India with a maximum amplitude of
only 90 cm at Nagapattinam, with apparently no mention of tsunami
damage (Ortız & Bilham 2003). These authors were also unable to
verify Murty & Rafiq’s (1991) claim of 5000 tsunami deaths in India
following the earthquake of 1941 June 26 in the Andaman Islands.
C© 2008 The Authors 995Journal compilation C© 2008 RAS

996 E. A. Okal and C. E. Synolakis
In this context, it is important to develop scenarios for future
Indian Ocean mega-earthquakes which would generate transoceanic
tsunamis capable of inflicting catastrophic levels of death and de-
struction in the far field. This paper presents hydrodynamic simula-
tions for a number of such sources located at the subduction zones
surrounding the basin.
2 M E T H O D O L O G Y
2.1 Estimation of earthquakes
Far-field tsunami hazard in an ocean basin is a direct function of the
seismic potential for the extremely large events required to gener-
ate tsunamis capable of exporting death and destruction to distant
shores. Our experience over the past 70 yr indicates that a seismic
moment in excess of 7 ×1028 dyn × cm is required in this respect
(Okal 2007a). Accordingly, we will first examine if and where the
plate boundaries of the Indian Ocean basin can support such mega-
earthquakes.
The 2004 Sumatra–Andaman earthquake has led scientists to a
humble reassessment of the concept of a maximum expectable earth-
quake at a given subduction zone based on simple plate tectonics
arguments. In a landmark paper, Ruff & Kanamori (1980) had pro-
posed that the combination of the age of the subducting lithospheric
plate and of the kinematic rate of convergence at the trench could
be used to predict the maximum size of the relevant subduction
earthquake. Under this paradigm, truly gigantic earthquakes (with a
seismic moment exceeding 1029 dyn × cm) could occur only where
young oceanic material is subducting fast into the mantle, as is the
case in Chile, where the largest event ever recorded took place in
1960. By contrast, the slow subduction of a very old plate, such as
at the Mariana trench, would be essentially aseismic. Based on the
then available data set of plate ages and motions, Ruff and Kanamori
claimed an 80 per cent correlation between maximum earthquake
size and the combined physical parameters of the plate.
With a seismic moment of about 1.1 × 1030 dyn × cm (Stein
& Okal 2005; Tsai et al. 2005), the 2004 Sumatra earthquake was
the second or third largest event recorded, surpassed only by the
1960 Chilean earthquake, and perhaps by the 1964 Alaskan one.
Yet, it involved lithosphere on the average 55 Myr old, subduct-
ing at no more than 5 cm yr−1, which under Ruff & Kanamori’s
(1980) model should support only earthquakes of moment 2 ×1028 dyn × cm, capable of producing substantial tsunami damage in
the near field, but insufficient to unleash a transoceanic tsunami. In
the wake of the 2004 disaster, Stein & Okal (2007) recompiled both
earthquake sources (including reassessed moments from historical
events) and improved plate parameters (mostly convergence rates),
and concluded that the resulting updated data set produced only a
30 per cent correlation between maximum size and the combined
age and convergence rate of the plate, thus suggesting that a sim-
ple estimate of a ‘maximum expectable earthquake’ could not be
reliably obtained under Ruff & Kanamori’s (1980) model. Rather,
we prefer to regard the length over which a fault system extends
continuously along a convergent plate boundary as a prima facieindicator of the potential for a mega-earthquake capable of gen-
erating a tsunami destructive in the far field (Okal 2007a). Under
seismic scaling laws (Geller 1976), the seismic threshold of 7 ×1028 dyn × cm translates into a minimum rupture length of 300 km,
although destructive transoceanic tsunamis have occasionally been
generated by shorter ruptures following earthquakes in violation of
scaling laws (Lopez & Okal 2006).
In turn, this concept brings up the delicate question of what
constitutes a continuous fault zone, or conversely what can be re-
garded as a barrier for the propagation of rupture during a large
earthquake. While it was generally accepted that major tectonic
features borne by the subducting plate (e.g. a large fracture zone
or a so-called ‘aseismic ridge’) could act as barriers, a recent re-
assessment of historical earthquakes in Central and Southern Peru
using numerical simulations of their tsunamis in the near field
(Okal et al. 2006a) has shown that the great 1868 Arica earth-
quake most probably ruptured (northwards) through the Nazca
Ridge, as did the 1687 Central Peru earthquake and, at least
partially, the smaller event on 2007 August 15 (both rupturing
southwards).
In this context, one should also keep in mind the strong vari-
ability and unpredictability of the fragmentation of rupture during
major events along a given subduction zone. In a classic study of
the historical earthquakes of the Nankai trough, Ando (1975) iden-
tified four possible areas or blocks (A, B, C and D) supporting the
rupture, but documented that major earthquakes occurred in an es-
sentially random way, with the rupture involving anywhere from a
single block (e.g. ‘A’) to two (e.g. ‘C–D’), and up to all four (‘A-
B-C-D’), with a corresponding growth in the seismic moment and
tsunami damage, the latter well documented in Japanese archives.
Any incomplete, undersampled database of historical events could
conceivably miss the occasional four-block earthquake and thus un-
derestimate the maximum expectable event in the subduction zone.
Ando’s (1975) concept has recently been upheld in other subduction
provinces, notably in Southern Chile, where it was concluded that
the 1960 event had a significantly longer rupture zone than several of
its ‘predecessors’ (Cisternas et al. 2005), along the Southern Kuril
arc (Nanayama et al. 2005) and in the Pacific northwest (Kelsey
et al. 2005).
In this general context, we identify three subduction zones, shown
on Fig. 1, whose historical seismicity suggests that they bear the po-
tential for mega-thrust events capable of generating tsunamis dam-
aging in the far field: South Sumatra, North Andaman–Myanmar,
and the Makran. We also discuss the case of South Java, where no
catastrophic subduction earthquake is known in the historical record,
but which could conceivably entertain one.
We wish to stress that the case studies described herein are by
definition worst-case scenarios; in particular, they do not necessarily
represent the next large earthquake in each of the relevant subduction
zones. The latter could be smaller than envisioned in this paper,
involving only one or two segments (say ‘A-B’) as opposed to the
full fledged rupture (‘A-B-C-D’) in the formalism of Ando (1975).
Nevertheless, we see our simulations as providing some measure of
the worst possible effect of teleseismic tsunamis near distant shores;
the 1960 Chilean or 2004 Sumatran earthquakes have served proof
that worst-case scenarios do indeed occur.
2.2 Numerical simulations
Simulations were performed using the MOST code (Titov &
Synolakis 1998), a finite-difference algorithm which solves the non-
linear shallow-water equations of hydrodynamics by the method of
splitting integration steps. Full details are given in Synolakis (2002).
We use a 0.1◦ grid (11.12 km in latitude) covering from 70◦S to 28◦N
and from 40◦E to 120◦E, occasionally extended as far west as 30◦W.
The bathymetric grid was built from the ETOPO 2-min database of
the National Geophysical Data Center, occasionally combined with
individual marine charts.
C© 2008 The Authors, GJI, 172, 995–1015
Journal compilation C© 2008 RAS

Far-field tsunami hazard in the Indian Ocean 997
45˚
45˚
60˚
60˚
75˚
75˚
90˚
90˚
105˚
105˚
120˚
120˚
-15˚ -15˚
0˚ 0˚
15˚ 15˚
Sumatra-Andaman
2004
Nias 2005
3
1
7
5
Makran
Myanmar-Andaman
So. Sumatra
Java
2
8
6
4
Figure 1. Map of the scenarios considered in this study. In each region, the thick traces represent the fault segments rupturing under each scenario, colour-keyed
and numbered. In those regions with overlapping scenarios, the shorter fault has been offset oceanwards to enhance clarity. See text for details.
Once earthquake source parameters are selected, the static defor-
mation resulting from the earthquake is computed using the algo-
rithm of Mansinha & Smylie (1971), and its vertical component is
then used as an initial condition of the amplitude η of the wavefield,
together with a height-averaged horizontal velocity field initially set
to zero. This obviously represents an approximation to the actual
evolution of the seismic source, justified by the long periods of the
tsunami wave, as compared to the duration of the source rupture.
The computation proceeds with a time step δt = 15 s, sufficiently
short to ensure stability under the Courant–Friedrichs–Lewy con-
ditions (Courant et al. 1928), even at the highest latitudes involved,
where the longitudinal grid step is significantly reduced. The prod-
ucts of the simulations are two-fold: First, a map of the deformation
of the ocean surface η is saved every 15 min (or 60 steps). In addition,
a map is built of the maximum absolute amplitude reached at each
grid point for the whole duration of the computation (4000 steps or
16 hr 40 mn). Note that our simulations do not include the effect
of shoaling in the immediate vicinity of shorelines and of run-up
on the beaches, which must be computed using site-specific high-
resolution models of bathymetry and topography. Rather, they could
be used as initial conditions for such local modelling at individual
sites.
3 VA L I DAT I O N A N D RO B U S T N E S S
Before modelling possible future tsunami scenarios in the Indian
Ocean basin, we validate the computational algorithm and examine
its robustness relative to variations in poorly constrained earthquake
parameters. For this purpose, we first consider a simplified model of
the 2004 Sumatra–Andaman event, featuring a total moment M 0 =1. 1 × 1030 dyn × cm corresponding to a seismic slip �u = 15 m
along a fault extending north–south for L = 1100 km with a fault
width W = 150 km. The focal mechanism (φ = 359◦; δ = 8◦; λ =
110◦) is taken from the initial CMT solution, but the centroid of
rupture is positioned at (7◦N; 94◦E), as suggested by the distribu-
tion of same-day aftershocks and the splitting pattern of the Earth’s
gravest mode, 0S2 (Stein & Okal 2007). The top of the rupture on
the fault plane is placed at a depth h = 10 km.
Fig. 2(e) shows the maximum amplitude simulated across the
Indian Ocean Basin. We note that despite the simplified nature of
the source used, the principal characteristics of the tsunami in the
far field are well predicted, in particular the strong directivity of the
wave towards southeastern India, Sri Lanka, the Maldives and most
remarkably Somalia, where the tsunami resulted in more than 300
deaths and run-up reaching 9 m (Fritz & Borrero 2006), in contrast to
the more benign effects reported at similar distances in neighbouring
Kenya and Oman (Weiss & Bahlburg 2006; Okal et al. 2006b).
As first derived by Ben-Menahem & Rosenman (1972), directivity
expresses the positive interference, in the direction perpendicular
to rupture, between elements of a seismic source whose rupture
remains in all cases hypersonic with respect to the propagation of
the tsunami.
In order to validate quantitatively the simulation, we compare it
to the only available measurements of the 2004 tsunami on the high
seas, namely satellite altimetry data, which featured a zero-to-peak
amplitude of 70 cm on the JASON trace (Scharroo et al. 2005) in
the vicinity of (2◦N; 88◦E), where we predict a maximum value of
85 cm, in good agreement with the observation. Note that a direct
comparison is however impossible, since the satellite data set was
neither a time nor a space series, but rather a combination obtained
from a satellite cutting through the wavefield at very high speed,
and as such underestimates the maximum wave amplitude at most
overflown locations. In particular, the higher values (up to 1.7 m)
predicted by our simulations farther north in the Bay of Bengal
cannot be compared to the JASON trace, which sampled this area
significantly later than the passage of the wave front carrying the
maximum deformations of the sea surface.
C© 2008 The Authors, GJI, 172, 995–1015
Journal compilation C© 2008 RAS

998 E. A. Okal and C. E. Synolakis
Figure 2. Robustness of simulations of the 2004 Sumatra–Andaman tsunami with respect to displacement of the parent earthquake. Each frame maps the
maximum amplitude on the high seas as simulated using MOST. The central frame (e, with scale bar) refers to the unperturbed source, whose centroid coincides
with that of the earthquake (see text for details). Frames b, d, f , h, correspond to sources displaced 1 degree in the appropriate direction (north, west, east,
south, respectively). Frames displaced clockwise from each of the latter ones (c, a, i, g, respectively) correspond to a 2◦ displacement in the same direction.
Note that with few exceptions (detailed in text), the general pattern of maximum amplitudes is conserved in all cases.
While this validation of a simulation on the high seas could be per-
formed only against a single datum—the JASON trace, we note that
similar simulations using the MOST code (Titov et al. 2005) have
successfully predicted the recording of long-wavelength tsunami
waves by coastal seismic stations, once the latter are deconvolved
to represent long-wavelength tsunami amplitudes on the high seas
(Okal 2007). We conclude that our simulation provides an acceptable
order of magnitude of the maximum sea surface elevation, which
remains poorly documented in the instrumental record.
We address the question of the robustness of the simulations by
varying, one at a time, several parameters in our source model, and
comparing the fields of maximum amplitude of the resulting simu-
lations to the original one on Fig. 2(e). Such variations are taken as
representative of the unavoidable uncertainties which accompany
the investigation of scenarios of future earthquakes. In all cases,
when one parameter of the source is varied, all other are kept un-
changed.
(1) We first vary the location of the source by moving the cen-
troid 1◦ (on the average 110 km) in all four directions. Frames b,
d, f , h of Fig. 2 show that the far-field amplitude of the tsunami is
practically unaltered, the only discernable effect being a slight de-
crease in amplitude due west of the event (Maldives, Somalia) when
the source is moved eastwards (Fig. 2f). This is easily understood,
as this displacement places most of the rupture over and beyond
the Nicobar-Andaman arc into the Andaman Sea. When the trans-
lation is increased to 2◦, westward and southward displacements
(Figs 2a and g) have very little effect on the tsunami field, while a
northward one traps more of the wavefield against India in the Bay
of Bengal (Fig. 2c), allowing less illumination of the northwestern
Indian Ocean Basin, in turn resulting in lower amplitudes in the
Maldives and Somalia; by contrast, in the near field, the southern
Coast of Myanmar is the site of enhanced amplitudes. An eastward
translation of 2◦ further concentrates the tsunami in the Andaman
Sea, from which it is funnelled into the straits of Malacca (Fig. 2i).
C© 2008 The Authors, GJI, 172, 995–1015
Journal compilation C© 2008 RAS

Far-field tsunami hazard in the Indian Ocean 999
Figure 3. Robustness of simulations of the 2004 Sumatra–Andaman tsunami with respect to variations in source properties of the parent earthquake. Each
frame maps the maximum amplitude on the high seas as simulated using MOST. The simulation for the unperturbed source is shown on Fig. 2(e). (a) Deeper
source, stopping at a depth of 20 km. (b) Effect of change in rake. (c) Effect of change in fault dip; in this single case, the moment is adjusted to keep M 0 sinδ
constant. (d) Effect of an irregular distribution of slip on the fault plane. (e) Effect of larger seismic slip �u on a smaller fault plane. (f) Effect of artificially
reduced bathymetry in the source region; note that this is the only case for which the far field is strongly affected. See text for discussion.
The bottom line of this experiment is that, with the exception of ge-
ometrical effects due to the shape of major land structures, the exact
position of a large source has only a limited effect on the large-scale
properties of the tsunami in the far field.
(2) In the next experiment, we increase the source depth at the
top of the earthquake rupture zone from 10 to 20 km. As shown on
Fig. 3(a), the amplitude of the tsunami in the far field features only
a slight increase, most notable along the Maldives-Somalia path.
While this result may seem paradoxical, it is easily understood in
the context of the representation of the tsunami as a branch of normal
modes of the Earth (Ward 1980). The combination of the shallow
dip and nearly pure thrust mechanism of the source approaches the
geometry of a horizontal decollement which features a classical sin-
gularity of excitation at the Earth’s surface (Aki & Richards 1980);
sinking the source moves it away from the singularity, and thus in-creases the excitation of all seismic waves, including of the tsunami.
We emphasize, however, that this effect remains minor and that the
general pattern of the far field remains unaltered.
(3) We then turn to the geometry of the source, by varying the
dip δand rake λ of the focal mechanism. We choose not to vary the
fault strike ϕ, which is controlled by the plate geometry. In Fig. 3(b),
we suppress the strike-slip component of the mechanism, using λ =90◦; except for minor variations in its sidelobes, the far-field pattern
of the tsunami is unchanged. In Fig. 3(c), we increase the dip to δ =12◦, while at the same time reducing the seismic moment, so as to
keep constant the product M 0 × sinδ, which controls the excitation
of normal modes by shallow sources. Once again, we fail to observe
any significant change in the far-field tsunami.
(4) In Fig. 3(d), we consider the case of a heterogeneous slip on
the fault. While keeping the total seismic moment constant, we con-
sider three subfaults located at the sites of the patches of maximum
seismic release suggested by various studies in source tomography
(e.g. Ishii et al. 2005; Banerjee et al. 2007): a first one at (3.4◦N;
94.2◦E) with �u = 18 m and a moment M 0 = 3.7 × 1029 dyn ×cm, a second one at (7◦N; 94◦E) with �u = 15 m and M 0 = 5. 1 ×1029 dyn × cm, and a third one at (10.6◦N; 94.1◦E) with �u = 12 m
and M 0 = 2.5 × 1029 dyn × cm. We find, once again, that while the
introduction of such heterogeneity in the rupture may affect run-up
on local beaches (Geist & Dmowska 1999), it has essentially no
effect on the far-field tsunami.
(5) Next, we consider a deviation from scaling laws governing the
relationship between moment M 0 and seismic slip, �u. Specifically,
we increase �u to 20 m, while reducing the fault length L to 825 km,
which leaves M 0 unchanged, but artificially increases the stress
release by a factor 1.8. In the framework of Okal & Synolakis
(2004), this enhances the run-up in the near field, and narrows its
C© 2008 The Authors, GJI, 172, 995–1015
Journal compilation C© 2008 RAS

1000 E. A. Okal and C. E. Synolakis
distribution along a nearby beach; however, Fig. 3(e) shows that the
far-field tsunami remains largely unaffected.
At this point, we can conclude that the characteristics of the
tsunami in the far field appear remarkably robust with respect to
perturbations in the properties of the parent earthquake, as long as
the seismic moment M 0 (or in the case of a change of dip, the product
M 0 × sinδ) remains constant. This is easily understood by realizing
that the far-field tsunami wave consists of an integral of the contri-
bution of the various elements of the source, which, because of the
largely linear character of the problem in the far field, is controlled
primarily by the integral of the source, namely the seismic moment
M 0. This situation is similar to that of seismic waves, which, in
the far-field, and at long enough periods, are well described by the
robust concept of a ‘mantle magnitude’, where measurements ignor-
ing secondary details such as focal mechanism and depth still give
rise to robust estimates of the seismic moment (Okal & Talandier
1989). This similarity is of course rooted in the representation of the
tsunami as a branch of normal modes of the Earth (Ward 1980; Okal
1988), whose excitation by double couples obeys the same princi-
ples as that of seismic waves (Okal 2008). This is also reminiscent
of Saint-Venant’s principle in linear elasticity, which states that the
detailed distribution of stress in the far field does not depend on the
details of the source, but only on its total load (Knowles 1966).
The only exception to the above pattern is illustrated in our last
experiment, in which we reduce substantially the thickness H of the
water column over the source area. In the region extending from
90◦E to 96◦E and from 2◦S to 15◦N, we artificially divide H by
4, thus reducing the low-frequency velocity of the tsunami by a
factor of 2. The area is linked to the unperturbed ocean floor by a
tapered slope extending 2◦ on all sides. The source of the tsunami
is otherwise left unchanged.
Indeed, Fig. 3(f) shows that contrary to the previous experiments,
the wavefield of the tsunami is profoundly affected. The tsunami is
now essentially confined to the zone of shallow bathymetry, and as
such hardly exits the Bay of Bengal. The origin of this effect re-
sides in the decrease of tsunami amplitude at the bathymetric slope
between the shallow source region and the deep oceanic basin. As
shown by Kajiura (1981) and confirmed under normal mode theory
by Okal (2003), the total energy of an earthquake-generated tsunami
does not depend on the water depth H . Nor does the initial amplitude
of the ocean surface deformation η under the approximation con-
sidered in the present simulations, namely that the deformation of
the ocean bottom is fully transferred to the surface. At the transition
to unperturbed water depth, the wave height on the high seas will be
reduced according to the classical proportionality to H−1/4, which
expresses the conservation of energy flux at the slope, and known
as Green’s law (Green 1837; Synolakis 1991).
This model will be valid as long as the transition takes place
close enough to the source that the amplitude of the tsunami has
not been dispersed by propagation. Also, we have assumed that
the transition to deeper water is linear, that is, that energy flux is
conserved, which will be valid only if it takes place over a distance
larger than the wavelength; this may not necessarily be the case given
the bathymetric taper selected, which is, however, representative of
the transition slopes encountered around oceanic plateaux.
Despite these limitations, this model shows that an exceptionally
shallow bathymetry in the epicentral area reduces the amplitude of
the tsunami in the far field. In this respect, it confirms the experi-
ment of Synolakis and Arcas (quoted by Kerr 2005) following the
2005 Nias earthquake. This mega-thrust earthquake (M 0 = 1.05 ×1029 dyn × cm) resulted in a damaging local tsunami (McAdoo
et al. 2006), which failed to propagate in the far field. Synolakis and
Arcas were able to simulate a much stronger tsunami in the far field
by suppressing a number of shallow bathymetric features from the
epicentral area, and replacing them with deep water. Note in particu-
lar that the rupture area of the Nias earthquake included the ultimate
shallow bathymetry, namely the large islands of Simeulue and Nias,
where the earthquake dislocation displaces rock rather than water,
obviously lessening the amplitude of the resulting tsunami.
In conclusion, our experiments demonstrate the robustness of our
simulations with respect to variations in source parameters which
are expected to be typical of the uncertainties associated with con-
structing scenarios of future earthquakes.
4 I N D I V I D UA L C A S E S C E N A R I O S
4.1 South Sumatra
This subduction segment is located immediately to the southeast
of the 2005 rupture, and extends approximately 1000 km to the
Sunda Straits. It constitutes a zone of particular concern, since it is
widely perceived as presently undergoing enhanced stress resulting
from Coulomb stress transfer from the 2004 Sumatra–Andaman
earthquake. We recall that under this model, the rupture of a segment
of fault during a major earthquake results in an alteration of the
regional field of stress, in particular along neighbouring segments
of the fault, which may thus reach a sufficiently enhanced stress
regime to themselves be triggered into rupture. When applied to
the subsequent segments of a major fault system, this concept may
result in a temporal propagation of seismic activity along a plate
boundary, one of the most spectacular examples being the westward
migration of seismicity along the North Anatolian fault since 1939
(Stein et al. 1997; Parsons et al. 2000). Immediately following the
2004 Sumatra event, McCloskey et al. (2005) identified a zone of
enhanced stress at the southeast extremity of its rupture, precisely
where the 2005 Nias earthquake occurred a few days later. In turn,
the stress released during the Nias shock has been transferred to
the southeast, in the general area of the 1833 earthquake, which
then became widely perceived as a likely candidate for a major
event (Nalbant et al. 2005; Borrero et al. 2006a). As detailed in the
Appendix, the Bengkulu earthquake of 2007 September 12 fits the
model of stress transfer, although it probably failed to release all
stress accumulated in the area since 1833.
In this study, we first consider as a probable scenario a simple
repeat of the great earthquake of 1833 November 24 (‘Scenario 1’).
According to the compilation by Wichmann (1918), the 1833 event
was clearly catastrophic along the southwest coast of Sumatra from
Pariaman to Bengkulu, with the tsunami inflicting heavy destruction
and moving boats inland. In the far field, the lone report consists of
significant damage in the Seychelles (Jackson et al. 2005); however,
given the sparse settlement at the time, and the lack of surviving
archives in many of the areas concerned, the impact of the tsunami
could have been strong along many of the western shores of the
Indian Ocean.
In a landmark study, Zachariasen et al. (1999) have dated emerged
coral microatolls on the islands facing the southwestern coast of
Sumatra to map the coseismic uplift during the 1833 earthquake,
and in turn inverted this data set into the focal geometry of the
event. Their solution features a slip �u = 13 m on a rupture zone
measuring L = 550 km by W = 175 km, which translates into a
moment M 0 = 6.3 × 1029 dyn × cm, with the focal geometry φ =322◦, δ = 12◦, λ = 90◦. This mechanism correctly predicts an initial
C© 2008 The Authors, GJI, 172, 995–1015
Journal compilation C© 2008 RAS

Far-field tsunami hazard in the Indian Ocean 1001
Figure 4. Simulations for Scenarios 1 (left-hand panel) and 2 (right-hand panel). The top frames show the static displacements of the parent earthquakes,
which are used as initial conditions of the MOST simulations. The bottom frames map the fields of maximum amplitude of the simulations. The grid has been
extended westwards to 30◦W, in order to illustrate the impact of the tsunami under these scenarios on South Africa.
recess of the sea along the Sumatran coast (Tadepalli & Synolakis
1996), as described by Wichmann (1918) at Pariaman.
Simulation results for a repeat of the 1833 event under Scenario 1
are shown on Fig. 4. As expected, the difference in fault strike with
the 2004 earthquake results in a directivity lobe rotated counter-
clockwise, and focused on the southwestern Indian Ocean, with es-
pecially high amplitudes on Madagascar and the Mascarene Islands
(Reunion, Mauritius, Rodrigues and Seychelles). In particular, we
find amplitudes off the eastern coast of Madagascar about four times
larger than for the 2004 model. Recalling that our computations are
C© 2008 The Authors, GJI, 172, 995–1015
Journal compilation C© 2008 RAS

1002 E. A. Okal and C. E. Synolakis
stopped at the gridpoint nearest the shoreline (on the average 5 km
away), and that the 2004 run-up in Madagascar ranged from 0.5
to 5 m (Okal et al. 2006c), we can only surmise that a repeat of
the 1833 event could bring dekametric waves to the island, and
hence very significant destruction to infrastructure, as well as heavy
casualties.
While the tsunami is significantly less severe than the 2004 one in
Sri Lanka and the Maldives, the latter act as a refracting lens focus-
ing some energy back towards Oman, Socotra Island and Somalia,
where the wave height patterns are remarkably similar to those of
2004. This should be of particular concern, given the exceptional
devastation incurred by the northeastern coast of Somalia in 2004
(Fritz & Borrero 2006). The simulated tsunami seems to penetrate
efficiently into the Gulf of Aden, and there is a hint that it could even
reach the Red Sea. Farther south, we note that the directivity lobe
of the tsunami links up with the shallow southwest Indian Ocean
Ridge, itself acting as a focusing lens (Woods & Okal 1987), which
results in a large beam of energy flowing into the South Atlantic,
whose sidelobes bring amplitudes about 3 to 4 times greater than
in the 2004 model to the southern shores of South Africa. Given
reports of 2-m run-up and two drownings in South Africa during
the 2004 tsunami (Synolakis & Kong 2006), any repeat of the 1833
event would be expected to pose significant hazard to that country
as well.
In further assessing tsunami hazard from southern Sumatra, we
note that the southeastern extremity of the 1833 rupture, as inverted
by Zachariasen et al. (1999), is still about 350 km from the southern
tip of the island at the Sunda Straits. The corresponding area bears
seismicity, as evidenced by the recent interplate thrust earthquake of
2000 June 04 (4.73◦S; 101.94◦E; M 0 =7. 5×1027 dyn× cm), whose
aftershocks extend 170 km to the southeast, and the large event of
1914 June 25, described more in detail in the Appendix. Farther to
the southeast, we note an earthquake on 1950 March 27 (M PAS =7) and a steady level of scattered seismic activity. In the framework
of Ando’s (1975) observations along the Nankai trough, it may be
legitimate to consider that such earthquakes represent failure on
a further segment of a continuous fault zone, which may become
engulfed into a future mega-thrust earthquake rupturing over and
beyond the 1833 segment. In this model, the 1833 earthquake would
not be the maximum one off the coast of southern Sumatra.
We therefore, consider as ‘Scenario 2’ an event with the same
focal geometry as Scenario 1, but extending 350 km farther to the
southeast, for a total length L = 900 km. We keep W = 175 km,
and increase �u to 15 m, for a total moment M 0 = 1.13 × 1030 dyn
× cm, essentially equivalent to that of the 2004 Sumatra–Andaman
earthquake. This event would be definitely larger than any one doc-
umented in the region, but so was the 2004 earthquake when it
occurred. Although improbable, we have no reason to label Sce-
nario 2 as impossible, and it must, therefore, be considered in the
examination of worst-case scenarios.
Results from the simulation of Scenario 2 are shown in Fig. 4
(right-hand panel). While this study does not perform small scale
modelling of inundation at individual sites, and thus no quantitative
values of run-up can be quoted from our results, it is clear that off-
shore amplitudes are significantly increased over those of Scenario
1 and that the eventual impact on coastlines would be catastrophic
at many distant locations. Among them the Maldives, Madagascar
and the Mascarene Islands are particularly affected, with offshore
amplitudes as high as seven times those of 2004 along the east coast
of Madagascar. Similarly, our results suggest offshore amplitudes of
25 cm off South Africa, equivalent to those which attacked Somalia
in 2004.
In addition, even though Australia sits well out of the lobe of
directivity of the tsunami, its northwestern coast becomes signifi-
cantly exposed because of the proximity of the rupture, which now
extends to the vicinity of the Sunda Straits, a mere 1400 km away.
Finally, and for the same reason, the tsunami penetrates the Sunda
Straits.
4.2 North of Andaman, Myanmar
Just as the 2004 mega-event transferred stress to the southeast, in
the general location of the 1833 earthquake, it must also have loaded
the extension of its fault zone to the north. The problem in determin-
ing the geometry of any earthquake potentially resulting from this
stress transfer lies in the complexity of the local tectonic regime. As
summarized in Stein & Okal (2007), the 2004 Sumatra–Andaman
earthquake expressed motion between the subducting Indian plate
(and possibly a part of the independently moving Australian plate,
and of the diffuse boundary between the two), and a platelet known
as the Burma sliver, bordered on the east by the active spreading
centre in the Andaman Sea (Fig. 5). It is not clear, however, how
far north one can continuously extend a rigid Burma sliver: Curray
et al. (1979) prolong it all the way to 28◦N, including all of con-
tinental Myanmar west of the Sagaing fault, a model disputed by
Bird (2003), who prefers to regard the portion north of 16◦N as a
zone of diffuse deformation (shown with question marks on Fig. 5),
as suggested by background seismicity and by the incompatibility
between GPS-derived motion along the Sagaing fault (Vigny et al.2003) and the pole of rotation (13.9◦N; 103.7◦E) derived by Bird
(2003) from magnetic data and seafloor morphology at the Andaman
spreading Centre, near 11◦N, 95◦E.
In this context, and in order to define a credible scenario for a
major earthquake in that province, we rely on the historical record
and note Oldham’s (1893) report, based on an 1841 survey by
Captain Halsted, of a large event on 02 April 1762 along the coast
of Bangladesh and Myanmar, from Chittagong in the north to Foul
Island in the south, with uplifts of up to 4 m. Recent palaeoseismo-
logical work has confirmed the presence of emerged coral structures
(Satake et al. 2006), of an age compatible with the 1762 earthquake
(Sieh & Wang, personal communication 2006). We thus consider
in Scenario 3 a model inspired by a repeat of the 1762 shock. The
focal mechanism considered (φ = 324◦; δ = 20◦; λ = 124◦) ac-
counts for the probable obliquity of the motion of India relative to
the orientation of the Myanmar coast. On the basis of Oldham’s
(1883) account, we use a fault length L = 470 km, a width W = 100
km, and a slip �u = 6.5 m, corresponding to a total moment M 0 =1.5 × 1029 dyn × cm.
On the other hand, no large earthquakes are documented, even
in the historical record, along the northern extension of the 2004
rupture, between Great Coco Island and the southwestern tip of
Myanmar, forming the western end of the mouths of the Irrawady.
Stein & Okal (2007) have derived a pole of rotation of India with re-
spect to the Burma sliver at 17◦N; 95◦E, with a rate of 2.17◦ Myr–1.
The proximity of this pole to the presumed plate boundary (distant
no more than 200 km) suggests little strain accumulation, and may
indeed be the primary factor having controlled the termination of
the 2004 rupture. Note that these conclusions could be altered if, as
is most probable, the Burma sliver is non-rigid. In this context, we
include as a somewhat far-fetched but nevertheless feasible ‘Sce-
nario 4’, a source featuring a slip �u = 7 m along a fault measuring
L = 470 km by W = 175 km, corresponding to a moment M 0 =2.8 × 1029 dyn × cm, the geometry of faulting being φ = 20◦;
C© 2008 The Authors, GJI, 172, 995–1015
Journal compilation C© 2008 RAS

Far-field tsunami hazard in the Indian Ocean 1003
Figure 5. Seismotectonic context of the eastern shore of the Bay of Bengal. Plate boundaries are shown in green, using the model of Bird (2003), in which
the Burma Sliver is limited at 16◦N, the west Burmese block (shown as ???) being a zone of diffuse deformation. The red dots show the aftershocks and
triggered seismicity following the 2004 Sumatra–Andaman earthquake, whose activity ceases at 14.5◦N. The upwards triangles are loci of uplift during the
1762 earthquake, as compiled by Oldham (1893); the inverted ones are sites of anomalous wave activity in harbours and rivers, attributable to its tsunami.
δ = 15◦; λ = 90◦. Note that this event is large, but its size
should be considered in the context of the 2004 event, of
which it could be considered as a ‘left-over’. Note in particu-
lar that the seismic slip is much smaller than in Scenarios 1
or 2.
Results from simulations of Scenarios 3 and 4 are shown on Fig. 6.
Both tsunamis penetrate the Indian Ocean Basin only marginally
outside the Bay of Bengal. Because of the generally shallower source
bathymetry for Scenario 3, the amplitude falters quicker inside the
Bay than under Scenario 4, and its maximum impact, on South-
ern India and Sri Lanka, is less powerful than under Scenario 4
in West Bengal and Orissa. However, in both instances, substan-
tial damage would occur along the coasts of Eastern India. Also, in
both cases, and especially under Scenario 4, significant energy is
funnelled into the straits of Malacca, where despite the very shal-
low bathymetry, it keeps decimetric amplitudes in the open sea, all
the way to, and possibly beyond, Singapore, warranting a detailed
inundation study to assess the impact of the tsunami on coastal
infrastructure.
4.3 Makran
The Makran Coast of Baluchistan constitutes a subduction zone
along which the Arabian plate sinks under the Eurasian one (Fig. 7).
It was the site of a major earthquake on 1945 November 27, which
was accompanied by a significant regional tsunami, with run-up in
the 5–10 m range (Ambraseys & Melville 1982). Its source was
studied by Byrne et al. (1992), who modelled it as a pure shallow-
dipping underthrusting mechanism (φ = 236◦; δ = 7◦; λ = 90◦;
M 0 = 1. 8 × 1028 dyn × cm). The event caused considerable dam-
age and more than 300 deaths along the very sparsely populated
Makran coast, but the relative effects of the earthquake and of the
tsunami remain unclear. In the far field, the tsunami was recorded
(but apparently did no damage) in the Seychelles (Beer & Stagg
1946). The complexity of the reports regarding the 1945 tsunami,
in particular the occurrence of several waves separated by 2 hr, as
well as the rupturing of the Mumbai–London telegraphic cable sug-
gest that the earthquake may have triggered a delayed underwater
landslide (Ambraseys & Melville 1982).
C© 2008 The Authors, GJI, 172, 995–1015
Journal compilation C© 2008 RAS

1004 E. A. Okal and C. E. Synolakis
Figure 6. Same as Fig. 4 for Scenarios 3 (left-hand panel) and 4 (right-hand panel). Note that the tsunamis are largely contained to the Bay of Bengal, but are
efficiently channelled into the Straits of Malacca, threatening Singapore.
A number of presumably large historical earthquakes have been
documented along the Makran coast. As shown on Fig. 7, Quittmeyer
& Jacob (1979) list four possibly major earthquakes, from west to
east on 1483 February 18, 1851 April 19, 1864 July [August?] 25,
and [about] 1765 (note that these authors regroup the 1851 and 1864
events into a single rupture in their Fig. 6). The data regarding the lo-
cation and size of these shocks are extremely scant. The 1851 event
is not mentioned in Ambraseys & Melville’s (1982) authoritative
C© 2008 The Authors, GJI, 172, 995–1015
Journal compilation C© 2008 RAS

Far-field tsunami hazard in the Indian Ocean 1005
Figure 7. Map of the Makran coast of Pakistan and Iran, after Byrne et al. (1992). The three blocks labelled ‘A’, ‘B’ and ‘C’ sketch the probable rupture areas
of the earthquakes of 1851 (1864), 1945 and 1765. Scenario 5 (see Fig. 8) envisions the simultaneous rupture of the three blocks, while Scenario 6 includes a
western segment which could have ruptured in 1483. To the east, the stars show the epicentres of the intraplate events of 2001 and 1819, which did not generate
tsunamis in the ocean.
compilation of Iranian earthquakes, even though it is located farther
west, and thus closer to Iran, than the 1945 and 1765 events listed
by these authors; the 1864 event is mentioned only as a note to the
entry for the 1945 shock. Oldham (1893) mentions both events, his
terse descriptions suggesting that the 1864 one may have been the
larger. The earthquake of ca. 1765 precipitated a hill into the sea
(Ambraseys & Melville 1982). Note finally that these events may
have extremely long recurrence times, as only one earthquake of
comparable size (or a doublet in the case of 1851–1864) is docu-
mented along its relevant segment of coast in the various catalogues.
As for the earthquake of 1483, it is described as inflicting major
damage to the region of the straits of Hormuz, with reports of a
destructive earthquake in Oman at about the same period, hinting at
an epicentre in or near the Gulf of Oman (Ambraseys & Melville
1982).
The picture emerging from this general framework and from a
study of background seismicity (Byrne et al. 1992) is that of a seis-
mogenic subduction zone in East Makran, corresponding roughly
to the present shoreline of Pakistan, from about 61◦E to the Indian–
Arabian–Eurasian triple junction, at 67◦E. To the west of 61◦E
(mostly along the Iranian coast), seismicity moves largely onshore,
even though a deep oceanic basin is present up to 57.5◦E. West
of the straits of Hormuz, the convergence regime changes from
oceanic subduction to continental collision, expressed by intense
orogeny and seismicity in the Zagros mountains of Iran. The ab-
sence of seismicity off the coast of west Makran (57◦E to 61◦E)
was confirmed at the microearthquake level during a short OBS de-
ployment by Niazi et al. (1980). The active sediment deformation in
this area was compared by White & Klitgord (1976) to that off the
Oregon–Washington coast (Silver 1972), an area then regarded as
featuring aseismic subduction, but where recent investigations have
identified repeated, if rare, megathrust events in the palaeoseismic
record (Satake et al. 1996; Kelsey et al. 2005). Thus, it is not impos-
sible that the 1483 earthquake may have represented a rare episode
of oceanic subduction in the western Makran.
In this context, we consider two scenarios for simulation. The
first one, Scenario 5, inspired by Ando’s (1975) paradigm, consid-
ers the simultaneous rupture of the 1851–1864 (‘A’), 1945 (‘B’)
and 1765 (‘C’) fault zones, as shown on Fig. 5, itself inspired by
Fig. 6 of Byrne et al. (1992). The second and more speculative one,
Scenario 6, adds another 450 km of rupture to include the probable
1483 fault zone. As in the case of Scenario 2 for the 1833 South
Sumatra province, this second geometry is clearly an extreme worst-
case scenario which, however, cannot be totally eliminated given the
available evidence.
Simulation results for Scenarios 5 and 6 are presented on Fig. 8.
Interestingly, the two fields of maximum amplitude are not signif-
icantly different, which expresses the trapping, inside the Gulf of
Oman, of the wave generated by the additional fault segment in
Scenario 6. At certain locations (e.g. the Gulf of Aden and the Red
Sea), Scenario 6 delivers a smaller wavefield than Scenario 5, pre-
sumably reflecting a more complex form of destructive interference
at the source. In addition to the obvious regional risk posed to the
shores of Oman and western India, the far-field tsunami impacts the
Maldives and the Seychelles. Because of unfavourable directivity
patterns, it leaves relatively unaffected the shorelines of eastern and
South Africa, and Madagascar. Under Scenario 6, decimetric waves
could reach the continental shelf of western Australia.
4.4 The case of Java
Finally, we turn our attention to the Java subduction zone, extending
from the Sunda Straits at 106◦E to the island of Sumba at 120◦E,
beyond which no oceanic lithosphere is present (Fig. 9). This sub-
duction zone is characterized by an absence of great interplate thrust
earthquakes. In the instrumental period (since ca. 1900), the NEIC
catalogue lists only six earthquakes with at least one magnitude ≥7,
in 1903, 1921, 1937, 1977, 1994 and 2006. Prior to this, Newcomb
& McCann (1987) document two large earthquakes in Java in 1867
and 1875, respectively. Based on an assessment of intensity maps
and on the absence of tsunami reports (Wichmann 1918; Solov’ev
C© 2008 The Authors, GJI, 172, 995–1015
Journal compilation C© 2008 RAS

1006 E. A. Okal and C. E. Synolakis
Figure 8. Same as Fig. 4 for Scenarios 5 (left-hand panel) and 6 (right-hand panel) along the Makran Coast. For the latter, the source has a composite mechanism
illustrating the change of azimuth of the probable subduction zone at 61◦E.
C© 2008 The Authors, GJI, 172, 995–1015
Journal compilation C© 2008 RAS
Far-field tsunami hazard in the Indian Ocean 1007
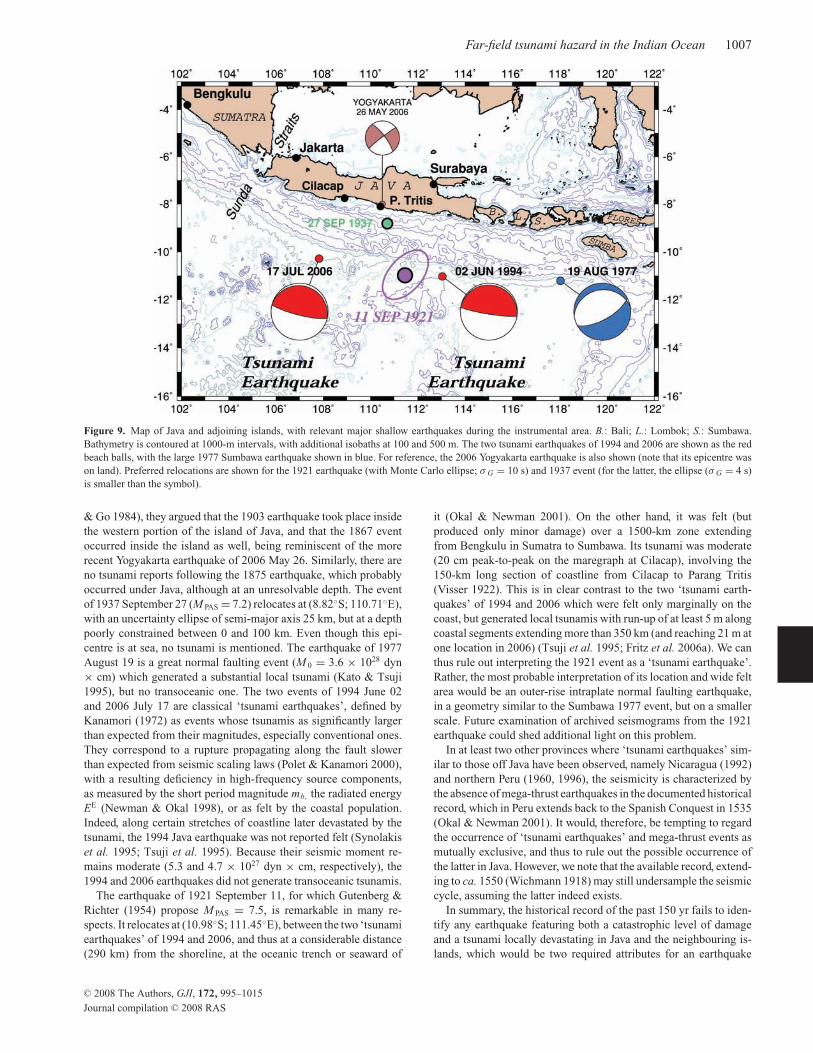
Figure 9. Map of Java and adjoining islands, with relevant major shallow earthquakes during the instrumental area. B.: Bali; L.: Lombok; S.: Sumbawa.
Bathymetry is contoured at 1000-m intervals, with additional isobaths at 100 and 500 m. The two tsunami earthquakes of 1994 and 2006 are shown as the red
beach balls, with the large 1977 Sumbawa earthquake shown in blue. For reference, the 2006 Yogyakarta earthquake is also shown (note that its epicentre was
on land). Preferred relocations are shown for the 1921 earthquake (with Monte Carlo ellipse; σ G = 10 s) and 1937 event (for the latter, the ellipse (σ G = 4 s)
is smaller than the symbol).
& Go 1984), they argued that the 1903 earthquake took place inside
the western portion of the island of Java, and that the 1867 event
occurred inside the island as well, being reminiscent of the more
recent Yogyakarta earthquake of 2006 May 26. Similarly, there are
no tsunami reports following the 1875 earthquake, which probably
occurred under Java, although at an unresolvable depth. The event
of 1937 September 27 (M PAS = 7.2) relocates at (8.82◦S; 110.71◦E),
with an uncertainty ellipse of semi-major axis 25 km, but at a depth
poorly constrained between 0 and 100 km. Even though this epi-
centre is at sea, no tsunami is mentioned. The earthquake of 1977
August 19 is a great normal faulting event (M 0 = 3.6 × 1028 dyn
× cm) which generated a substantial local tsunami (Kato & Tsuji
1995), but no transoceanic one. The two events of 1994 June 02
and 2006 July 17 are classical ‘tsunami earthquakes’, defined by
Kanamori (1972) as events whose tsunamis as significantly larger
than expected from their magnitudes, especially conventional ones.
They correspond to a rupture propagating along the fault slower
than expected from seismic scaling laws (Polet & Kanamori 2000),
with a resulting deficiency in high-frequency source components,
as measured by the short period magnitude mb, the radiated energy
EE (Newman & Okal 1998), or as felt by the coastal population.
Indeed, along certain stretches of coastline later devastated by the
tsunami, the 1994 Java earthquake was not reported felt (Synolakis
et al. 1995; Tsuji et al. 1995). Because their seismic moment re-
mains moderate (5.3 and 4.7 × 1027 dyn × cm, respectively), the
1994 and 2006 earthquakes did not generate transoceanic tsunamis.
The earthquake of 1921 September 11, for which Gutenberg &
Richter (1954) propose M PAS = 7.5, is remarkable in many re-
spects. It relocates at (10.98◦S; 111.45◦E), between the two ‘tsunami
earthquakes’ of 1994 and 2006, and thus at a considerable distance
(290 km) from the shoreline, at the oceanic trench or seaward of
it (Okal & Newman 2001). On the other hand, it was felt (but
produced only minor damage) over a 1500-km zone extending
from Bengkulu in Sumatra to Sumbawa. Its tsunami was moderate
(20 cm peak-to-peak on the maregraph at Cilacap), involving the
150-km long section of coastline from Cilacap to Parang Tritis
(Visser 1922). This is in clear contrast to the two ‘tsunami earth-
quakes’ of 1994 and 2006 which were felt only marginally on the
coast, but generated local tsunamis with run-up of at least 5 m along
coastal segments extending more than 350 km (and reaching 21 m at
one location in 2006) (Tsuji et al. 1995; Fritz et al. 2006a). We can
thus rule out interpreting the 1921 event as a ‘tsunami earthquake’.
Rather, the most probable interpretation of its location and wide felt
area would be an outer-rise intraplate normal faulting earthquake,
in a geometry similar to the Sumbawa 1977 event, but on a smaller
scale. Future examination of archived seismograms from the 1921
earthquake could shed additional light on this problem.
In at least two other provinces where ‘tsunami earthquakes’ sim-
ilar to those off Java have been observed, namely Nicaragua (1992)
and northern Peru (1960, 1996), the seismicity is characterized by
the absence of mega-thrust earthquakes in the documented historical
record, which in Peru extends back to the Spanish Conquest in 1535
(Okal & Newman 2001). It would, therefore, be tempting to regard
the occurrence of ‘tsunami earthquakes’ and mega-thrust events as
mutually exclusive, and thus to rule out the possible occurrence of
the latter in Java. However, we note that the available record, extend-
ing to ca. 1550 (Wichmann 1918) may still undersample the seismic
cycle, assuming the latter indeed exists.
In summary, the historical record of the past 150 yr fails to iden-
tify any earthquake featuring both a catastrophic level of damage
and a tsunami locally devastating in Java and the neighbouring is-
lands, which would be two required attributes for an earthquake
C© 2008 The Authors, GJI, 172, 995–1015
Journal compilation C© 2008 RAS

1008 E. A. Okal and C. E. Synolakis
capable of generating a transoceanic tsunami damaging in the far
field. Given the detailed nature of available catalogues (Wichmann
1918; Solov’ev & Go 1984), it is almost certain that no such event
took place since 1550 A.D. However, given the possibility of very
long seismic cycles, we cannot formally rule out the future occur-
rence of an ocean-wide tsunami generated by a mega-thrust earth-
quake off the coast of Java. We thus consider further two such scenar-
ios, using the geometry of the 2006 tsunami earthquake (φ = 290◦;
δ = 10◦; λ = 102◦). Scenario 7 involves a slip �u = 6 m on a
fault measuring L = 200 km by W = 100 km for a total moment of
M 0 = 5. 7 × 1028 dyn × cm; Scenario 8 envisions the full rupture
of the Java segment of the subduction zone, with L = 500 km; W =150 km; �u = 10 m and M 0 = 3.6 × 1029 dyn × cm.
Simulation results for Scenarios 7 and 8 are given in Fig. 10. Sce-
nario 7 generates deep-water amplitudes reaching 1 meter on the
coast of northwest Australia (only about 1200 km from the extrem-
ity of the fault), where significant damage to infrastructure could
be expected, and 25 cm at some locations along the coast of Mada-
gascar; elsewhere in the Indian Ocean Basin, its far-field effects
should be benign. By contrast, Scenario 8 would put all the coasts
of northern and western Australia under deep-water amplitudes of
1–2 m, suggesting locally dekametric run-up and catastrophic inun-
dation; an edge wave also skirts the coast of Sumatra, resulting in
similar amplitudes in its southern part, and the tsunami penetrates
efficiently into the Java Sea, through the straits of Sunda and Lom-
bok. It attacks Madagascar with greater amplitudes than the 2004
Sumatra–Andaman tsunami, and also threatens the coast of South
Africa.
4.5 Other sources in the Indian Ocean?
For completeness, we explore the possibility of other sources of
transoceanic tsunamis in the Indian Ocean. The Southwest Indian
Ocean Ridge (SWIOR) features a number of very long transform
faults, including the Andrew Bain Fracture Zone (50◦S; 30◦E),
which supported on 1942 November 10 the largest earthquake ever
recorded on an oceanic transform fault (M 0 = 1.3 × 1028 dyn × cm)
(Okal & Stein 1987). In principle, the Bain Fracture Zone extending
continuously for 440 km, could support an even larger strike-slip
earthquake, but because its vertical extent is thermally limited to at
most 25 km, the moment of the resulting event would not exceed
5 × 1028 dyn × cm, and we have verified that its tsunami would be
negligible in the far field.
The only other geological feature continuous on a sufficiently long
scale to conceptually support gigantic earthquakes is the Ninety-
east Ridge, generally interpreted as a hotspot trace overprinting the
large transform fault of a fossil spreading centre (Sclater & Fisher
1974; Pierce 1978). Even though this region, described as the diffuse
boundary between the Indian and Australian plates (Wiens et al.1986), has supported significant seismicity, the relevant moments
remain below 1028 dyn × cm, and the earthquake mechanisms do
not correspond to a precise reactivation of the Ninetyeast Ridge in
its original geometry (Stein & Okal 1978). In particular, they do not
use the Ridge as their fault plane, and so this seismicity does not
lend itself to an extrapolation of size to tsunamigenic levels under
Ando’s (1975) paradigm.
Murty & Rafiq (1991) have listed as potentially tsunamigenic
continental earthquakes occurring close to sea shores in the Indian
subcontinent. Among such events, the largest in recent history took
place in 1819 in the Rann of Kachchh (Fig. 5), and was studied exten-
sively by Bilham (1999). The Rann, a desertic sea level depression
which was navigable in medieval and earlier times, underwent co-
seismic flooding in 1819, described by Bilham as a tsunami, but
there are no such reports in the far field, as would be expected from
an earthquake with considerable seismic slip (reaching 11 m), but
relatively contained dimensions (at most 150 km × 25 km), and
whose moment does not exceed 5 × 1027 dyn × cm. Neither did
the even smaller event in 2001 generate an oceanic tsunami, despite
its catastrophic nature on land. We conclude that none of these non-
subduction sources would be capable of generating a transoceanic
tsunami.
5 D I S C U S S I O N A N D C O N C L U S I O N
We have investigated the far-field amplitude of tsunamis in the In-
dian Ocean for a number of scenarios of mega-thrust earthquakes,
ranging from probable to possible. Of those, Scenarios 1 and 3, in-
volving the repeat of known events, are most probable, although
the recent 2007 Bengkulu earthquake may have decreased both the
likelihood and the size of an event under Scenario 1. Scenario 4
involves a large rupture in a zone loaded by stress transfer and oth-
erwise known for background seismic activity. Scenarios 2, 5 and
6 represent extrapolations of the fault ruptures of known events
or combinations with neighbouring segments under Ando’s (1975)
model. Scenarios 7 and 8 are the most speculative in that no major
earthquakes are known off Java.
The most important lesson from the scenarios investigated in this
study is that the patterns of far-field maximum amplitudes predicted
by our simulations will not be a repeat of those observed in 2004.
This specificity is the direct consequence of the directivity patterns
creating a positive interference in the direction perpendicular to
faulting, as derived by Ben-Menahem & Rosenman (1972), Okal &
Talandier (1991) having further demonstrated that the width of di-
rectivity lobes decreases sharply with increasing earthquake size. To
a lesser extent, irregular bathymetry also contributes to controlling
far-field amplitudes through focusing effects (Woods & Okal 1987),
as exemplified along the SWIOR, a situation already described in
2004 (Titov et al. 2005).
We now present a geographic description of the risk posed by
distant mega-earthquakes to various coastlines of the Indian Ocean
Basin.
5.1 India and Sri Lanka
To a large extent, Sri Lanka and the eastern coast of India, which
had taken the onslaught of the 2004 tsunami, would suffer lesser
amplitudes under the scenarios considered here. Only Scenario 4
would lead to comparable damage in the northern portion of the
coast of India (principally in the state of Orissa), while Scenario 3
would affect the entire coast, but at a lower level. Scenarios 1 and 2
would probably result in significant, but not catastrophic, impact.
The western coast of India would be directly exposed in Scenar-
ios 5 and 6 (the Makran earthquakes), with an impact obviously
increasing with latitude. Historical reports of significant destruc-
tion in Mumbai in 1945 warrant immediate warning and response
along the entire western coast of the country upon occurrence of
any comparable or larger earthquake in the Makran.
5.2 Maldives
In the envisioned scenarios, the Maldives would be less im-
pacted than in 2004, due primarily to different patterns of far-field
directivity in the geometries involved. Thanks to the structure of the
C© 2008 The Authors, GJI, 172, 995–1015
Journal compilation C© 2008 RAS

Far-field tsunami hazard in the Indian Ocean 1009
Figure 10. Same as Fig. 4 for Scenarios 7 (left-hand panel) and 8 (right-hand panel) along the coast of Java. Note the significant threat from the latter to
Madagascar and South Africa.
islands (steep coral atolls with relatively narrow transverse dimen-
sions), the tsunamis run up much less efficiently than on a typ-
ical shallow-dipping structure. Consequently, flow depths in the
Maldives in 2004 were less than half the run-up values in
Somalia, at half the distance from the source (Fritz et al. 2006b).
On the other hand, the low-lying structure of the islands makes it
obviously more difficult for the population to seek refuge at higher
ground.
C© 2008 The Authors, GJI, 172, 995–1015
Journal compilation C© 2008 RAS

1010 E. A. Okal and C. E. Synolakis
5.3 Madagascar and the Mascarenes
Because the 2004 directivity lobe was oriented at a more northerly
azimuth, these islands suffered only marginally in 2004 with only
one death confirmed at the southern tip of Madagascar (Okal et al.2006c). By contrast, the islands would be severely attacked under
Scenarios 1, 2, 7 and 8. A repeat of the 1833 event under Scenario
1 would strongly impact the Mascarenes (Seychelles, Mauritius,
Rodrigues and Reunion), as expected from the historical record
of damage in 1833 in the Seychelles (Jackson et al. 2005). The
eastern coast of Madagascar, which experienced only contained
flooding without significant damage in 2004, could expect destruc-
tion of coastal infrastructure with corresponding casualties under
Scenario 1.
5.4 Africa
With more than 300 deaths in Somalia, 10 in Tanzania, and two in
South Africa, the 2004 Sumatra–Andaman earthquake provided a
rude awakening to the reality of tsunami hazard along the eastern
coast of the African continent (Fritz et al. 2006a; Weiss & Bahlburg
2006). The principal danger for the coasts of Kenya, Tanzania and
South Africa would be a repeat of the 1833 earthquake under Sce-
nario 1, with expected impact more severe than in 2004, principally
due to the more southerly azimuth of the directivity pattern. The
Comoro Islands, located between Tanzania and Madagascar, would
also be affected more severely than in 2004, when run-up reached
6 m on Grande Comore and 4.8 m in Mayotte (Borrero et al. 2006b).
Significantly, and despite a less favourable directivity pattern,
Somalia would remain at high risk, due to a focusing effect at the
Maldives ridge.
5.5 Australia
The western coasts of Australia are at greatest risk under Scenarios
7 and 8, which could generate catastrophic levels of destruction,
despite the generally sparse level of development along its coast-
line. It would also be threatened by a repeat of the 1833 earthquake,
and especially so under Scenario 2, featuring a rupture extending to
within 1400 km of the northwestern corner of the Australian conti-
nent. Significantly, the Makran Scenarios 5 and 6 can also generate
tsunamis with deep-water heights comparable to those observed in
2004.
5.6 Malaysia, Singapore and northern Java
An interesting aspect of our research concerns the ability of the sce-
nario tsunamis to penetrate straits and shallow seas, especially in
the Southeast Asian area. In general, it results from a subtle trade-
off between the classic amplification of the wave upon shoaling in
shallow water and its inefficient propagation in extremely shallow
seas. In practical terms, we find that the Straits of Malacca are shel-
tered by the island of Sumatra from the South Sumatra tsunamis
(Scenarios 1 and 2), but directly exposed to the Myanmar events
(Scenarios 3 and especially 4), which could lead to significantly
more damage than in 2004 for their coastal communities, includ-
ing Singapore. The northern coast of Java, with the metropoleis of
Jakarta and Surabaya could be affected by diffraction of the tsunami
at the Sunda Straits under Scenarios 2 or 8, and at the Bali-Lombok
Straits under Scenarios 7 and 8.
5.7 Kerguelen
Finally, we consider the case of the Kerguelen Islands (49.5◦S;
69.5◦E), part of the Terres Australes et Antarctiques Francaises,
which were emplaced in the Eocene and Oligocene on top of the
Kerguelen Plateau, one of the major Large Igneous Provinces, itself
formed as a flood basalt unit in the Lower Cretaceous (Frey et al.2000). The presence of the plateau (prolonged as the Broken Ridge
on the Australian plate) strongly affects the propagation of tsunami
waves. As a result, most of our scenarios feature a substantial am-
plification at and near the islands, with offshore tsunami amplitudes
reaching 20 cm under Scenarios 5 and 6, 40 cm under Scenario 7,
and up to 1 meter under Scenarios 1, 2 and 8, as opposed to only
10 cm in 2004. Despite the extreme isolation of the islands, they
host a scientific base with a population varying between 60 and 100;
there are only scant reports of the effects of the 2004 tsunami on
Kerguelen, where apparently it did not cause damage; however the
much larger offshore amplitudes under our scenarios would clearly
put the islands at risk. Future tsunamis may also have an ecologi-
cal impact, as penguin rookeries were destroyed at Crozet Islands
(46.4◦S; 51.9◦E) during the 2004 tsunami (Viera et al. 2006), despite
offshore amplitudes not exceeding 10 cm.
A C K N O W L E D G M E N T S
We thank Kerry Sieh and Yu Wang for communicating their palaeo-
seismic results in Myanmar prior to publication, and Seth Stein for
discussion of plate kinematics. Jose Borrero shared his most recent
field and modelling results regarding the Bengkulu event. Suzan
van der Lee kindly helped translate original Dutch publications.
This research was supported by the National Science Foundation,
under grants CMS-03-01054 to EAO and CMS-03-01081 to CES,
and by a ‘TRANSFER’ grant of the European Union to the Institute
of Applied and Computational Mathematics of the Foundation of
Research and Technology of Hellas (FORTH). Figures were drafted
using the GMT software (Wessel & Smith 1991).
R E F E R E N C E S
Aki, K. & Richards, P.G., 1980. Quantitative Seismology, W.H. Freeman,
San Francisco, 932 pp.
Ambraseys, N.N. & Melville, C.P., 1982. A History of Persian Earthquakes,
Cambridge University Press, Cambridge, 219 pp.
Ando, M., 1975. Source mechanism and tectonic significance of historical
earthquakes along the Nankai trough, Japan, Tectonophysics, 27, 119–140.
Banerjee, P., Pollitz, F., Nagarajan, B. & Burgmann, R., 2007. Coseismic slip
distributions of the 26 December 2004 Sumatra-Andaman and 28 March
2005 Nias earthquakes from GPS static offsets, Bull. seism. Soc. Amer.,97, S86–S102.
Beer, A. & Stagg, J.M., 1946. Seismic sea-wave of November 27, 1945,
Nature, 158, 63–64.
Ben-Menahem, A. & Rosenman, M., 1972. Amplitude patterns of tsunami
waves from submarine earthquakes, J. geophys. Res., 77, 3097–3128.
Bilham, R., 1999. Slip parameters for the Rann of Kachchh, India, 16 June
1819 earthquake, quantified from contemporary accounts, in Coastal Tec-tonics, pp. 295–318, eds Stewart, I.S. & Vita-Finzi, C., Geol. Soc. London
Spec. Pub., 146.
Bird, G.P., 2003. An updated digital model of plate boundaries, Geochem.Geophys. Geosyst., 4(3), Paper GC000252.
Borrero, J.C., Sieh, K., Chlieh, M. & Synolakis, C.E., 2006a. Tsunami inun-
dation modeling for Western Sumatra, Proc. Natl. Acad. Sci. USA, 103,
19 673–19 677.
Borrero, J.C., Fritz, H.M., Synolakis, C.E. & Okal, E.A., 2006b. Basin-wide
runup measurements of the 26 December 2004 Indian Ocean tsunami,
Eos, Trans. Amer.Geophys. Un., 87(52), U53C-03, [Abstract].
C© 2008 The Authors, GJI, 172, 995–1015
Journal compilation C© 2008 RAS

Far-field tsunami hazard in the Indian Ocean 1011
Borrero, J.C., Hidayat, R., Suranto, Bosserelle, C. & Okal, E.A., 2007.
Field survey and preliminary modeling of the near-field tsunami from the
Bengkulu earthquake of 12 September 2007, Eos, Trans. Amer. Geophys.Un., 88(52), U54A-04, 2007 [Abstract].
Byrne, D.E., Sykes, L.R. & Davis, D.M., 1992. Great thrust earthquakes and
aseismic slip along the plate boundary of the Makran subduction zone, J.geophys. Res., 97, 449–478.
Chamot-Rooke, N. & Le Pichon, X., 1999. GPS-determined Eastward Sun-
daland motion with respect to Eurasia confirmed by earthquake slip vec-
tors at Sundaland Philippine trenches, Earth planet. Sci. Letts., 173, 439–
455.
Chlieh, M. et al., 2007. Coseismic slip and after slip of the great Mw = 9.
15 Sumatra-Andaman earthquake of 2004, Bull. seism. Soc. Amer., 97,
S152–S173.
Cisternas, M. et al., 2005. Predecessors of the giant 1960 Chile earthquake,
Nature, 437, 404–407.
Courant, R., Friedrichs, K. & Lewy, H., 1928. Uber die partiellen Differen-
zengleichungen der mathematischen Physik, Mathematische Annalen,
100, 32–74.
Curray, J.R., Moore, D.G., Lawver, L.A., Emmel, F.J., Wait, R.W.,
Henry, M. & Kieckhefer, R., 1979. Tectonics of the Andaman Sea
in Burma, in Geological and Geophysical Investigations of Conti-nental Margins, Vol. 29, pp. 189–198, Amer.Assoc. Petrol. Geol.,
Tulsa.
Dorbath, L., Cisternas, A. & Dorbath, C., 1990. Assessment of the size of
large and great historical earthquakes in Peru, Bull. seism. Soc. Amer., 80,
551–576.
Frey, F.A. et al., 2000. Origin and evolution of a submarine large igneous
province: the Kerguelen Plateau and Broken Ridge, Southern Indian
Ocean, Earth planet. Sci. Letts., 176, 73–89.
Fritz, H.M. & Borrero, J.C., 2006. Somalia field survey after the December
2004 Indian Ocean tsunami, Earthq. Spectra, 22, S219–S233.
Fritz, H.M. et al., 2006a. Survey of the July 17, 2006 Central Java tsunami
reveals 21 m runup heights, Eos, Trans. Amer. Geophys. Un., 87(52),
S14A-06 [Abstract].
Fritz, H.M., Synolakis, C.E. & McAdoo, B.G., 2006b. Maldives field sur-
vey after the December 2004 Indian Ocean tsunami, Earthq. Spectra, 22,
S137–S154.
Geist, E.L.L. & Dmowska, R., 1999. Local tsunamis and distributed slip at
the source, Pure Appl. Geophys., 154, 485–512.
Geller, R.J., 1976. Scaling relations for earthquake source parameters and
magnitudes, Bull. seism. Soc. Amer., 66, 1501–1523.
Green, G., 1837. On the motion of waves in a variable canal of small depth,
Cambridge Phil. Trans., 6, 457–462.
Gutenberg, B. & Richter, C.F., 1954. Seismicity of the Earth and AssociatedPhenomena, Princeton University Press, Princeton, NJ.
Ishii, M., Shearer, P.M., Houston, H. & Vidale, J.E., 2005. Extent, duration
and speed of the 2004 Sumatra-Andaman earthquake imaged by the Hi-net
array, Nature, 435, 933–936.
Jackson, L.E., Barrie, J.V., Forbes, D.L., Shaw, J., Mawson, G.K. & Schmidt,
M., 2005. Effects of the 26 December 2004 Indian Ocean tsunami in the
Republic of Seychelles, Eos. Trans. Amer. Geophys. Un., 86(52), F6–F7
[Abstract].
Kajiura, K., 1981. Tsunami energy in relation to parameters of the earthquake
fault model, Bull. Earthq. Res. Inst. Tokyo Univ., 56, 415–440.
Kanamori, H., 1972. Mechanism of tsunami earthquakes, Phys. Earthplanet. Inter., 6, 346–359.
Kato, K. & Tsuji, Y., 1995. Tsunami of the Sumbawa earthquake of August
19, 1977, J. Nat. Disaster Sci., 17, 87–100.
Kelsey, H.M., Nelson, A.R., Witter, R.C. & Hemphill-Haley, E., 2005.
Tsunami history of an Oregon coastal lake reveals a 4,600-year record
of great earthquakes on the Cascadia subduction zone, Geol. Soc. Amer.Bull., 117, 1009–1032.
Kerr, R.A., 2005. Model shows islands muted tsunami after latest Indonesian
quake, Science, 308, 341.
Knowles, J.K., 1966. On St. Venant’s principle in the two-dimensional linear
theory of elasticity, Arch. Rat. Mech. Anal., 21, 1–22.
Lopez, A.M. & Okal, E.A., 2006. A seismological reassessment of the source
of the 1946 Aleutian “tsunami” earthquake, Geophys. J. Int., 165, 835–
849.
Mansinha, L. & Smylie, D.E., 1971. The displacement fields of inclined
faults, Bull. seism. Soc. Amer., 61, 1433–1440.
McAdoo, B.G., Dengler, L., Prasetya, G. & Titov, V.V., 2006. Smong: How
an oral history saved thousands on Indonesia’s Simeulue Island during the
December 2004 and March 2005 tsunamis, Earthq. Spectra, 22, S661–
S669.
McCloskey, J., Nalbant, S.S. & Steacey, S., 2005. Earthquake risk from
co-seismic stress, Nature, 434, 291.
Murty, T.S. & Rafiq, M., 1991. A tentative list of tsunamis in the marginal
seas of the North Indian Ocean, Nat. Haz., 4, 81–83.
Nalbant, S.S., Steacey, S., Sieh, K., Natawidjaja, D. & McCloskey, J., 2005.
Updated earthquake hazard in Sumatra, Nature, 435, 756–757.
Nanayama, F., Satake, K., Furukawa, R., Shimokawa, K., Atwater, B.F.,
Shigeno, K. & Yamaki, S., 2005. Unusually large earthquakes inferred
from tsunami deposits along the Kuril trench, Nature, 434, 660–663.
Newcomb, K.R. & McCann, W.R., 1987. Seismic history and seismotecton-
ics of the Sunda Arc, J. geophys. Res., 92, 421–439.
Newman, A.V. & Okal, E.A., 1998. Teleseismic estimates of radiated seismic
energy: the E/M 0 discriminant for tsunami earthquakes, J. geophys. Res.,103, 26 885–26 898.
Niazi, M., Shimamura, H. & Matsu’ura, M., 1980. Micro-earthquakes and
crustal structure off the Makran coast of Iran, Geophys. Res. Letts., 7,
297–300.
Nott, J. & Bryant, E., 2003. Extreme marine inundations (tsunamis?) of
coastal Western Australia, J. Geology, 111, 691–706.
Okal, E.A., 1988. Seismic parameters controlling far-field tsunami ampli-
tudes: a review, Nat. Haz., 1, 67–96.
Okal, E.A., 2003. Normal modes energetics for far-field tsunamis generated
by dislocations and landslides, Pure Appl. Geophys., 160, 2189–2221.
Okal, E.A., 2007. Seismic records of the 2004 Sumatra and other tsunamis:
a quantitative study, Pure Appl. Geophys., 164, 325–353.
Okal, E.A., 2008. The excitation of tsunamis by earthquakes, in The Sea:Ideas and Observations on Progress in the Study of the Seas, Vol. 15, eds.
Bernard, E.N. & Robinson, A.R., in press.
Okal, E.A. & Newman, A.V., 2001. Tsunami earthquakes: the quest for a
regional signal, Phys. Earth planet. Inter., 124, 45–70.
Okal, E.A. & Stein, S., 1987. The 1942 Southwest Indian Ocean Ridge
Earthquake: largest ever recorded on an oceanic transform, Geophys. Res.Letts., 14, 147–150.
Okal, E.A. & Synolakis, C.E., 2004. Source discriminants for near-field
tsunamis, Geophys. J. Int., 158, 899–912.
Okal, E.A. & Talandier, J., 1989. Mm: a variable period mantle magnitude,
J. geophys. Res., 94, 4169–4193.
Okal, E.A., Borrero, J.C. & Synolakis, C.E., 2006a. Evaluation of tsunami
risk from regional earthquakes at Pisco, Peru, Bull. seism. Soc. Amer., 96,
1634–1648.
Okal, E.A., Fritz, H.M., Raad, P.E., Synolakis, C.E., Al-Shijbi, Y. & Al-Saifi,
M., 2006b. Oman field survey after the December 2004 Indian Ocean
tsunami, Earthq. Spectra, 22, S203–S218.
Okal, E.A., Fritz, H.M., Raveloson, R., Joelson, G., Pancoskova, P. & Ram-
bolamanana, G., 2006c. Madagascar field survey after the December 2004
Indian Ocean tsunami, Earthq. Spectra, 22, S263–S283.
Oldham, R.D., 1893. A manual of the geology of India: stratigraphical andstructural geology, Off. Superint. Gov. Printer, Calcutta, 543pp.
Okal, E.A. & Talandier, J., 1991. Single-station estimates of the seismic
moment of the 1960 Chilean and 1964 Alaskan earthquakes, using the
mantle magnitude Mm, Pure Appl. Geophys., 136, 103–126.
Ortız, M. & Bilham, R., 2003. Source area and rupture parameters of the
31 December 1881 Mw = 7.9 Car Nicobar earthquake estimated from
tsunamis recorded in the Bay of Bengal, J. geophys. Res., 108(B4),
ESE 11, 16pp.
Parsons, T., Toda, S., Stein, R.S., Barka, A. & Dieterich, J.H., 2000. Height-
ened odds of large earthquakes near Istanbul: an interaction-based prob-
ability calculation, Science, 288, 661–665.
Peirce, J.W., 1978. The northward motion of India since the Late Cretaceous,
Geophys. J. Roy. Astr. Soc., 52, 277–312.
C© 2008 The Authors, GJI, 172, 995–1015
Journal compilation C© 2008 RAS

1012 E. A. Okal and C. E. Synolakis
Polet, J. & Kanamori, H., 2000. Shallow subduction zone earthquakes and
their tsunamigenic potential, Geophys. J. Int., 142, 684–702.
Quittmeyer, R.C. & Jacob, K.H., 1979. Historical and modern seismicity
of Pakistan, Afghanistan, northwestern India, and southeastern Iran, Bull.seism. Soc. Am., 69, 773–823.
Ruff, L.J. & Kanamori, H., 1980. Seismicity and the subduction process,
Phys. Earth planet. Int., 23, 240–252.
Satake, S., Shimazaki, K., Tsuji, Y. & Ueda, K., 1996. Time and size of a
giant earthquake in Cascadia inferred from Japanese tsunami records of
January, 1700, Nature, 379, 246–249.
Satake, K. et al., 2006. Search for evidence of past earthquakes similar to the
2004 event: Paleoseismological Surveys in Andaman Islands and Rakhine
Coast of Myanmar, Eos, Trans. Amer. Geophys. Un., 87(52), U52A-06
[Abstract].
Scharroo, R., Smith, W.H.F., Titov, V.V. & Arcas, D., 2005. Observing the
Indian Ocean tsunami with satellite altimetry, Geophys. Abstr., 7, 230
[Abstract].
Sclater, J.G. & Fisher, R.L., 1974. The evolution of the Eastcentral Indian
Ocean, with emphasis of the tectonic setting of the Ninetyeast Ridge,
Geol. Soc. Amer. Bull., 85, 683–702.
Silver, E.A., 1972. Pleistocene tectonic accretion of the continental slope off
Washington, Mar. Geol., 13, 239–249.
Socquet, A., Vigny, C., Chamot-Rooke, N., Simons, W., Rangin, C. & Am-
brosius, B., 2006. India and Sunda plates motion and deformation along
their boundary in Myanmar determined by GPS, J. geophys. Res., 111(5),
B05406, 11pp.
Solov’ev, S.L. & Go, Ch.N., 1984. Catalogue of tsunamis on the West-
ern Shore of the Pacific Ocean, Can. Transl. Fish. Aquat. Sci., 6077,
437pp.
Solov’ev, S.L., Go, Ch.N. & Kim, Kh.S., 1986. Katalog tsunami v tikhomokeane, 1969–1982 gg., Akad. Nauk SSSR, Moskva, 164 pp.
Stein, S. & Okal, E.A., 1978. Seismicity and tectonics of the Ninetyeast
Ridge area: evidence for internal deformation of the Indian plate, J. geo-phys. Res., 83, 2233–2245.
Stein, S. & Okal, E.A., 2005. Size and speed of the Sumatra earthquake,
Nature, 434, 581–582.
Stein, S. & Okal, E.A., 2007. Ultra-long period seismic study of the Decem-
ber 2004 Indian Ocean earthquake and implications for regional tectonics
and the subduction process, Bull. seism. Soc. Amer., 97, S279–S295.
Stein, R.S., Barka, A.A. & Dieterich, J.H., 1997. Progressive failure on the
North Anatolian fault since 1939 by earthquake stress triggering, Geophys.J. Int., 128, 594–604.
Synolakis, C.E., 1991. Green’s law and the evolution of solitary waves, Phys.Fluids A, 3, 490–491.
Synolakis, C.E., 2002. Tsunami and seiche, in Earthquake EngineeringHandbook, pp. 9 1–9 90, eds Chen, W.-F. & Scawthron, C., CRC Press,
Boca Raton.
Synolakis, C.E. & Kong, L., 2006. Runup measurements of the December
2004 Indian Ocean tsunami, Earthq. Spectra, 22, S67–S92.
Synolakis, C., Imamura, F., Tsuji, Y., Matsutomi, H., Tinti, S., Cook, B.,
Chandra, Y.P. & Usman, M., 1995. Damage, conditions of East Java
tsunami of 1994 analyzed, Eos. Trans. Amer. Geophys. Un., 76, 257, 261–
262.
Tadepalli, S. & Synolakis, C.E., 1996. Model for the leading waves of
tsunamis, Phys. Rev. Letts., 77, 2141–2145.
Titov, V.V. & Synolakis, C.E., 1998. Numerical modeling of tidal wave runup,
J. Waterw. Port, Coastal Ocean Eng., 124, 157–171.
Titov, V.V., Rabinovich, A.B., Mofjeld, H.O., Thomson, R.E. & Gonzalez,
F.I., 2005. The global reach of the 26 December 2004 Sumatra tsunami,
Science, 309, 2045–2048.
Tsai, V.C., Nettles, M., Ekstrom, G. & Dziewonski, A.M., 2005. Multiple
CMT source analysis of the 2004 Sumatra earthquake, Geophys. Res.Letts., 32(17), L17304, 4pp.
Tsuji, Y. et al., 1995. Field survey of the East Java earthquake and tsunami
of June 3, 1994, Pure Appl. Geophys., 144, 839–854.
Viera, V.M., Le Bohec, C., Cote, S.D. & Groscolas, R., 2006. Massive breed-
ing failures following a tsunami in a colonial seabird, Polar Biol., 29,
713–716.
Vigny, C. et al., 2003. Present-day crustal deformation around the Sagaing
fault, Myanmar, J. geophys. Res., 108(B11), ETG 6, 2533, 10pp.
Visser, S.W., 1922. Vulkanische verschijnselen en aardbevingen in den Oost-
Indischen archipel waargenomen gedurende het jaar 1921, NatuurkundingTijdschrift voor Nederlandisch Indie, 82, 222–269.
Ward, S.N., 1980. Relationship of tsunami generation and an earthquake
source, J. Phys. Earth, 28, 441–474.
Weiss, R. & Bahlburg, H., 2006. The coast of Kenya field survey after
the December 2004 Indian Ocean tsunami, Earthq. Spectra, 22, S235–
S240.
Wessel, P.W. & Smith, H.F., 1991. Free software helps map and display data,
Eos. Trans. Amer. Geophys. Un., 72, 441 and 445–446.
White, R.S. & Klitgord, K., 1976. Sediment deformation and plate tectonics
in the Gulf of Oman, Earth planet. Sci. Letts., 32, 199–209.
Wichmann, A., 1918. Die Erdbeben des Indischen Archipels bis zum Jahre
1857, Verhandelingen K. Akad. Wetensch. te Amsterdam, Tweede Sectie,
20(4), 193pp.
Wiens, D.A., Stein, S., DeMets, D.C., Gordon, R.G. & Stein, C.A., 1986.
Plate tectonics models for Indian Ocean ‘intraplate’ deformation, Tectono-physics, 132, 37–48.
Woods, M.T. & Okal, E.A., 1987. Effect of variable bathymetry on the am-
plitude of teleseismic tsunamis: a ray-tracing experiment, Geophys. Res.Letts., 14, 765–768.
Wysession, M.E., Okal, E.A. & Miller, K.L., 1991. Intraplate seismicity of
the Pacific Basin, 1913–1988, Pure Appl. Geophys., 135, 261–359.
Zachariasen, J., Sieh, K., Taylor, F.W., Edwards, R.L. & Hantoro, W.S.,
1999. Submergence and uplift associated with the giant 1833 Sumatran
subduction earthquake: evidence from coral microatolls, J. geophys. Res.,104, 895–919.
A P P E N D I X A : T H E 2 0 0 7 B E N G K U L U
E A RT H Q UA K E S
As this paper was going to press, the occurrence of a major earth-
quake offshore of Bengkulu, southern Sumatra on 2007 September
12 changes significantly the framework of seismicity in the area of
the 1833 rupture, and warrants an updated discussion.
The epicentre of the Bengkulu earthquake was located by the
National Earthquake Information Center at (4.52◦S; 101.37◦E), and
thus inside the 1833 fault area, as defined by Zachariasen et al.(1999) (Event I on Fig. A1). In this respect this earthquake fits
the concept of triggering by Coulomb stress transfer. However, its
moment of 5.1 × 1028 dyn × cm makes it much smaller than the 1833
event, of which it clearly cannot be a simple repeat. The earthquake
generated a moderate tsunami, with a maximum local run-up of
4 m at Lais, 40 km NW of Bengkulu (Borrero et al. 2007), and no
damaging effects in the far field. The main shock (Event I, at 11:10
UTC) was followed by a large aftershock (M 0 = 7. 8 × 1027 dyn ×cm) at the bottom of its rupture zone (Event II, at 23:49) and by a
still smaller event under the island of Sipura, probably outside the
zone of rupture of the main shock (Event III at 03:35, September
13); this last shock occurred at the location of a cluster of activity
during the last quarter of 2005, whose total seismic moment release
remained moderate (2. 4 × 1026 dyn × cm).
The distribution of aftershocks of the 2007 main shock is compat-
ible with a rupture area of 200 km × 100 km, which would translate
into a slip of 5 m. This model agrees with the distribution of af-
tershocks, with the results of preliminary source tomography (C.
Ji, personal communication 2007), and successfully predicts run-up
heights surveyed along the coast (Borrero et al. 2007).
The plate kinematics models of Chamot-Rooke & Le Pichon
(1999) and Socquet et al. (2006) predict a convergence rate of
51 mm yr–1 between the Sunda and Australian blocks, amounting
to an accumulation of 8.9 m since 1833, which the 2007 earthquake
C© 2008 The Authors, GJI, 172, 995–1015
Journal compilation C© 2008 RAS

Far-field tsunami hazard in the Indian Ocean 1013
Figure A1. Map of the epicentral area of the 2007 Bengkulu series. The grey rectangle is the fault zone of the 1833 event, as inferred by Zachariasen et al.(1999). The three large stars are the epicentres of the 2007 September 12 main shock (11:10 UTC; I), of its main after shock at 23:49 UTC (II), and of the third
large event at 03:35 on September 13. The purple dots show the PDE locations of their aftershocks, up to 2007 September 29. Global CMT solutions posterior
to the 2004 Sumatra–Andaman earthquake are shown as light green dots. Relocated historical earthquakes are shown as solid red dots with associated Monte
Carlo ellipses. The triangle identifies the 2000 earthquake.
has, therefore, not fully released. We also note (Fig. A1) that the
aftershock zone of the Bengkulu earthquake fails to cover the en-
tire 1833 rupture area, even taking into account Event III, whose
low moment (M 0 = 4.4 × 1026 dyn × cm) makes it a negligible
contributor to the plate convergence budget. As for the earthquake
of 04 June 2000 (4.73◦S; 101.94◦E; M 0 = 7.5 × 1027 dyn × cm),
its aftershocks extend 170 km to the southeast, suggesting that it
did not affect the 1833 rupture area. Finally, we note that Newcomb
& McCann (1987) list an earthquake on 1914 June 25, assigned
M = 7.6 by Gutenberg & Richter (1954), but not listed in the NEIC
database. Its isoseismals would suggest a location at sea, although
no records of a tsunami are mentioned in Solov’ev & Go’s (1984)
authoritative catalogue. We relocated this earthquake, using the
technique of Wysession et al. (1991), to (4.19◦S; 102.03◦E), with
the Bengkulu epicentre only 82 km away and inside its Monte Carlo
ellipse (computed with σ G = 10 s, appropriate for 1914). The true
size of the 1914 event and its possible contribution to tectonic strain
release can only be speculated, pending a quantitative assessment
of its source, based on historical seismograms.
To the north of the 1833 earthquake, a large event occurred on
1935 December 28 with a magnitude M = 8.1 assigned at Pasadena
by Gutenberg & Richter (1954). Its epicentre is remarkably well
constrained, relocating at (0.01◦S; 98.19◦E), with its Monte Carlo
ellipse remaining outside the 1833 fault area (Fig. A1).
The preliminary picture emerging from the occurrence of the
2007 event(s) is that there remains strain accumulated since the
1833 event along its fault area. Note the seismic gap between ∼0.5◦S
and 2◦S; furthermore, the seismic slip released in 2005–2007 be-
tween 2◦S and 5◦S does not account for the accumulated conver-
gence, especially in the area of the 2005 cluster and Event III. In
the area of rupture of Event I, this deficiency is less flagrant, and
could even be absent, if the 1914 event turned out to be comparable
in rupture area and size to Event I, a scenario improbable on ac-
count of the absence of tsunami reports, but which cannot be totally
dismissed.
In the framework of basin-wide tsunami risk, the major question
remains at present the possibility, in the next few years to decades,
of either a repeat of the 1833 event under Scenario 1, or the rup-
ture of a fault extending to the south under Scenario 2. While ei-
ther scenario would entice rupturing through the fault area of the
2007 Bengkulu earthquake, we have argued above for remanence
of strain accumulated since 1833, and we further note that a similar
process took place during the 2004 Sumatra–Andaman earthquake,
whose rupture extended over and beyond the fault area of the 1881
Car-Nicobar earthquake (Ortız & Bilham 2003). At M 0 = 7 × 1027
dyn × cm, the latter was smaller than the 2007 Bengkulu event,
but it also occurred in a zone featuring a lesser convergence rate.
Most source tomography models of the 2004 event identify the 1881
fault zone (from 8.5◦N to 9.7◦N) as an area of reduced, but not van-
ishing, slip and moment release (Ishii et al. 2005; Banerjee et al.2007; Chlieh et al. 2007); it certainly did not play the role of a
barrier, since the 2004 rupture effectively ‘jumped’ it and extended
all the way to 14.5◦N. Several similar examples are documented
in the Central and South Peru subduction zones, which also host
C© 2008 The Authors, GJI, 172, 995–1015
Journal compilation C© 2008 RAS

1014 E. A. Okal and C. E. Synolakis
Figure A2. Same as Fig. 4 for the modified Scenarios 1a (left-hand panel) and 2a (right-hand panel).
mega-earthquakes (Dorbath et al. 1990); for example, the catas-
trophic 1687 rupture off Pisco overrode the fault zone of the smaller
1664 event, the latter large enough to have generated a destructive
local tsunami (Okal et al. 2006a).
It is of course impossible to predict exactly where, and especially
how big, will be the next episode of major strain release along the
southern Sumatra subduction zone. The occurrence of the Bengkulu
earthquake has probably lessened the likelihood of Scenarios 1 or 2,
but they remain feasible models for mega earthquakes in the area. In
particular, Scenario 1 is known to have occurred in 1833, and thus
will recur at some point in time.
We complement these case studies by new simulations shown
on Fig. A2: Scenario 1a is adapted from Scenario 1 by reducing
the size of the source (L = 350 km; W = 175 km; �u = 6 m;
C© 2008 The Authors, GJI, 172, 995–1015
Journal compilation C© 2008 RAS

Far-field tsunami hazard in the Indian Ocean 1015
M 0 = 1. 7 × 1029 dyn × cm) and keeping it within the fault area of
the 1833 earthquake; it represents a major event possibly releasing
the remainder, after 2007, of the strain accumulated there since
1833. Scenario 2a is a long fault inspired from Scenario 2, but with
an average slip reduced to 8 m (M 0 = 6 × 1029 dyn × cm), to take
into account the partial strain release in its northern segment during
the 2007 Bengkulu event.
Fig. A2 shows that, as expected, the amplitudes of the resulting
far-field tsunamis are reduced; Scenario 1a yields deep-water am-
plitudes in the western Indian Ocean generally comparable to those
of 2004, plotted on Fig. 2(e) (with the exception of Somalia), and,
therefore, poses significant hazard. As for Scenario 2a, it gives re-
sults remarkably similar to those of the original Scenario 1, which
further illustrates the primordial role of seismic moment (shared
by the two events) in controlling far-field tsunami amplitudes, as
discussed in Section 3.
In conclusion, far field tsunami hazard from South
Sumatra subsists in the Indian Ocean Basin despite the oc-
currence of the Bengkulu earthquake. However, we re-emphasize
that Scenarios 1, 2, 1a, 2a represent plausible future tsunamis, but
not necessarily the next one[s] to originate at the South Sumatra
coastline.
C© 2008 The Authors, GJI, 172, 995–1015
Journal compilation C© 2008 RAS