farm and food tourism: exploring opportunities
TRANSCRIPT

Farm and Food Tourism: Exploring Opportunities

Regional Program Overview
• Lead: Utah State University Extension– Kynda Curtis, Karin Allen, Paul Hill– Susan Slocum (GMU)
• Partners– University of Nevada, Reno – Carol Bishop– University of Idaho – Wilson Gray
• Funding: Western SARE (Sustainable Agriculture and Research Education)

AgendaTime Session Name Speaker Affiliation9:00 to 9:15 Introductions and Workshop Overview All
9:15 to 10:30 Introduction to Farm and Food Tourism Susan Slocum and Kynda Curtis
George Mason University and Utah State University
10:30 to 11:45 Farm and Food Tourism Options Susan Slocum and Kynda Curtis
George Mason University and Utah State University
11:45 to 12:15 Lunch Provided
12:15 to 1:30 Accessing and Serving the Tourism Market
Kynda Curtis and Susan Slocum
George Mason University and Utah State University
1:30 to 3:00 Producing and Marketing Value Added Foods
Karin Allen Utah State University
3:00 to 4:00 Assessing the Economic Feasibility of New Enterprises and Products
Kynda Curtis Utah State University
4:00 to 4:15 Wrap‐Up and Evaluations All

Materials
• Workbook– Agenda– PowerPoints– Worksheets– Resources
• Workshop Evaluation
Introductions
• Name and location• Operation type and current products,
or• Agency/employer and work with
producers• What do you hope to take away from
the workshop?

Workshop Evaluations
• Please complete before leaving today…– Assist in planning future workshops– Assist in applying for grant funding– Assist in documenting program impacts

Thank you!

Module 1: Why Farm and Food Tourism?

Overview
• Understand the growing market for farm and food tourism
• Understand the specific enterprise and product opportunities within farm and food tourism
• Evaluate the role foods play in creating a tourism destination image
• Recognize farm/food tourism impacts to rural communities
• Understand the potential benefits of implementing farm/food tourism operations and products

Food Tourism & Economic Development• Agricultural producers face numerous
challenges and look to diversify product offerings, access new markets, and expand market periods and pricing
• Tourism providers struggle to find the regional distinctiveness necessary to differentiate themselves from other tourism destinations
• As a result of the growing local foods movement, farm and food tourism may provide a solution

Food Tourism & Economic Development• Food tourism has been shown to……..
– Enhance a destination’s tourism offering– Generate additional economic opportunities
for local growers and processors, especially in close proximity to prime tourism destinations
– Provide a venue to promote and distribute local agricultural goods and value-added products
– Provide tourists with the cultural experiences they seek
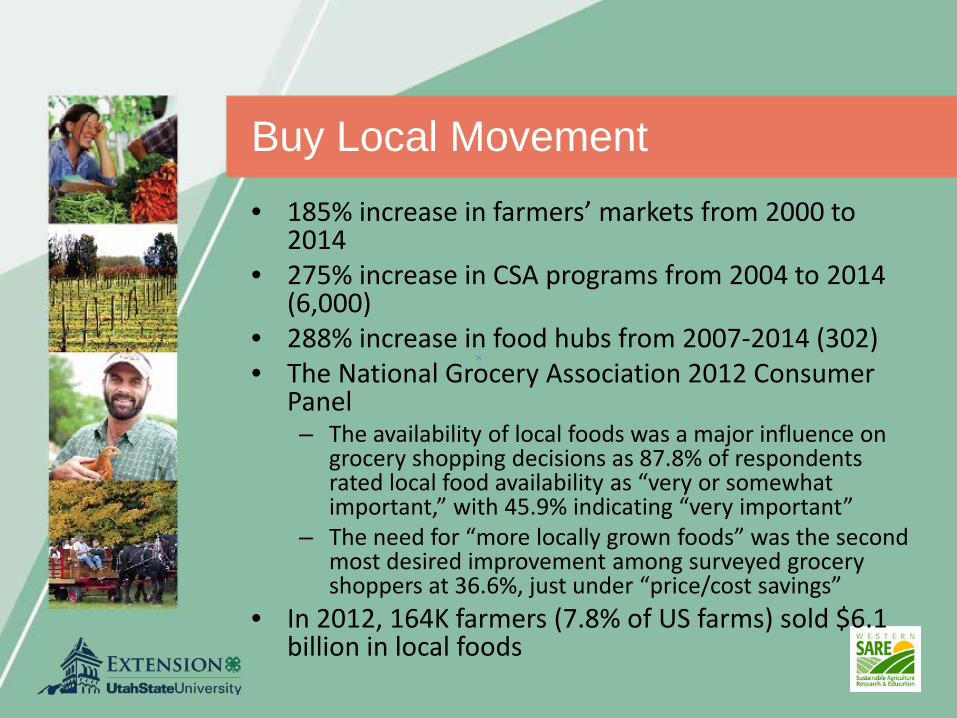
Buy Local Movement• 185% increase in farmers’ markets from 2000 to
2014• 275% increase in CSA programs from 2004 to 2014
(6,000)• 288% increase in food hubs from 2007-2014 (302)• The National Grocery Association 2012 Consumer
Panel – The availability of local foods was a major influence on
grocery shopping decisions as 87.8% of respondents rated local food availability as “very or somewhat important,” with 45.9% indicating “very important”
– The need for “more locally grown foods” was the second most desired improvement among surveyed grocery shoppers at 36.6%, just under “price/cost savings”
• In 2012, 164K farmers (7.8% of US farms) sold $6.1 billion in local foods

Farmers’ Markets in US

Local Food While Traveling
• The National Restaurant Association's 2013 Restaurant Industry Forecast reported that 7 of 10 consumers were more likely to visit a restaurant offering locally sourced items
• The National Restaurant Association’s 2014 “Top Ten Trends across the Nation,” included locally sourced meats/seafood and locally grown produce as the top 2 trends
• The US travel Association reports that 27 million travelers, or 17% of American leisure travelers, engaged in culinary or wine-related activities while traveling within the past three years

International Trend
• Local food demand not just a US phenomenon• Denmark, Switzerland, and Austria report the
highest per capita consumption of farmers’ market produce
• The European Union has required origin labeling for all fresh food since 2011
• The UNWTO reports that 88.2% of member countries consider gastronomy a crucial element in the brand and image of their destination and 68% of the countries consulted carry out marketing activities or promotion based on food tourism (US included)

Brand USA
• Destination marking organization for the United States, established in 2011

What is Food Tourism?
• The desire to experience a particular type of food or the products of a specific region…– A form of regional development that helps
strengthen local food and beverage production through backward linkages in tourism supply-chain partnerships
– Provides new opportunities to promote and distribute local products while providing an enhanced visitor experience through the expression of community identity and cultural distinctiveness

What is Food Tourism?
• An expression of culture• A form of regional heritage• Supports the enhancement of the tourist
experience• Creates backward linkages in the food
supply chain• Supports socio-economic growth in rural
regions

What is Agritourism/Farm Tourism?
• Agritourism is a subsector of food tourism that specializes in the incorporation of visits to farms for the purposes of on-site retail purchases, enjoyment, and education– Pick your own– Farm-stays– Corn mazes– Farm tours – Farm shops

Farm Tourism Examples
• Farm/ranch vacations • Garden/nursery tours • Fee fishing • Fee hunting • Horseback riding • Petting zoo • Camping/picnicking • Wagon rides • Bed and breakfast• Agricultural exhibits • Skeet shooting • Exotic farm animals
• School tours • U-pick operations• Game preserve • Christmas tree farms• Wagon rides • Pony rides• Pumpkin patch • Farm shops/stands• Bird watching• Corn maze

What is Culinary Tourism?
• The practice of exploratory eating, especially those instances in which eating unfamiliar food or participating in new food customs as a way of encountering, learning, or understanding other places and cultures– Food/wine trails– Cooking schools – Farm shop visits– Restaurant experiences

Culinary Tourism
• Occurs when visitors seek to experience cuisine and culture together
• Focus on authentic and unique experiences that take advantage of the unique heritage, charm, hospitality, and sense of place that already exists in the community– Wine tourism in California– Cheese sampling in Wisconsin– Maple syrup tasting in Vermont– Cajun food experiences in Louisiana

Food-Based Attractions
• Include special events surrounding food and drink– Food festivals– Farmers’ markets– Wine festivals– Beer festivals

Food Tourism & Rural Communities
Enhancing the economic opportunities, environment, and social fabric of a region

Food Tourism
• Economic Impacts– Increases employment in rural areas– Decreases rural-to-urban migration– Reduces economic leakages– Promotes fair trade
Food Tourism
• Environmental Impacts– Preservation of open-space/agricultural
areas – Respects the carrying capacities of natural
ecosystems– Reduction in waste, which is often recycled
into the farm’s production process– Supports alternative or specialized
production systems (free-range or pasture-grazing, organic, eco-friendly, etc.)
Food Tourism
• Social Impacts– Food is an expression of culture– Flavors develop throughout history based on
the local environment, historic trade routes, and settlement
– Food is an important component of local religious practices and celebrations
Where Food Tourism Originates
• Government policy – top down• Tour operators – demand driven• Individuals – innovative business ideas• Individuals – passionate people

The Players
• The agriculture sector– Agricultural producers seek to diversify their
offerings and distribution networks in an attempt to secure a viable future
• The tourism sector– Tourism is facing increased competition and
struggles to find the regional distinctiveness necessary to differentiate themselves against the sheer number of tourism destinations, both locally and internationally

Connecting Local Producers &Tourism Sector • Many local producers are micro-businesses
that do not want to grow and/or farmers are reluctant to diversify
• Producers often do not see the value-added in entering the tourism sector
• Producers lack knowledge and/or available knowledge is confusing about tourists and the tourism industry
• It is difficult to reach producers as they are widely spread geographically
• There are differing needs between small and large producers

Common Challenges in Food Tourism
• Encouraging wider use and better promotion of locally produced food
• Identifying and accessing tourism markets • Gaining knowledge about tourism markets as
tourism data is fragmented and not well maintained
• Building a destination brand based on local food production or food service establishments
• Collaboration and creating a better network between regions and groups (food producers and hospitality businesses)
• Accessing best-practice knowledge from around the country

Food Tourism Development
• The tourism industry has led the charge in innovation due to its elevated importance in rural growth policies
• Emphasis has shifted away from sectorally-based towards territorial-based development
• The unification of food and tourism requires the cooperation of distinctly different industries with varying needs and challenges

Why Consider Food Tourism?
• Food is one of the major tourism activities– One-third of tourism expenditures are on
food/drink– Tourists tend to be less sensitive to food
prices– Food is considered a “vital” component in
the quality of a tourism experience– The product is the basis of food tourism

Tourism Market in the West• Western US a popular tourism destination, prime
area for tourism development– 20+ national and state parks
• Idaho 2013 tourism indicators– 30.2 million total visitors– Total travel spending: $1.4 billion
• Nevada 2013 tourism indicators – 52.2 million total visitors– 24.6 million state/national park visits– Total travel spending: $58.1 billion
• Utah’s 2013 tourism indicators– 23.5 million total visitors– 4.2 million skier visits – 10.4 million state/national park visits– Total travel spending: $7.5 billion

Why Consider Food Tourism
• Additional market for current products• Diversification into new
enterprises/products• Reduced transportation/marketing costs• Year-round sales (additional sales)• Outlet for value-added products• Income/employment for family members• Cottage food production now option in
Nevada/Utah/Wyoming/Colorado

Why Consider Food Tourism?
• On-farm activities, the visitor comes to you– Eliminates the need for transportation– Ability to work in a familiar environment– More flexibility in scheduling activities– Display “show off” products– Educate others about local foods– Interact with people from around the globe

Activity
• Worksheet 1.1: The Role of Food in Tourism– Think about a recent trip/vacation…..
• What role did food play in your travels?• Did you have a memorable food experience?• Did you try any local/ethnic foods?• Did you visit any food attractions?• Did you purchase any food souvenirs?• Did you notice restaurants sourcing local food? If
so, how was it promoted?• What type of food experience would have
enhanced your trip?

Activity
• Worksheet 1.2: Enterprise/Product Description– What unique products/services can your
operation offer tourists?– What partners do you have that can assist?
• How, specifically, can they help?

Thank you!

Module 2: Farm and Food Tourism Considerations

Overview
• Evaluate the type of farm and food tourism enterprises best suited to the existing business
• Understand the management and resource requirements of farm and food tourism enterprises
• Examine the requirements and challenges of sourcing locally to restaurants, hotels, and conference centers
• Understand the benefits of building community partnerships

Getting Started• Determine what you will offer
– Identify some activities that seem doable• Fit with your goals and your resources• List all the tasks or steps required to start
• Make sure your ideas are good ones– Call the extension or tourism office for input, or enlist
the help of a business counselor or event planner • What may sound good to you may not sound good to others
• Know you customers– Knowing where your customers are from and what their
preferences and lifestyle choices are will help you tailor your offerings, pricing, and promotional activities
– Collecting email information may allow you to maintain regular contact with customers through e-marketing campaigns or social media

Getting Started
• Start small– Develop a launch date for the activity– List the resources needed – List all tasks to be completed
• Protect yourself and your customers– Make sure you understand the regulatory and
legal aspects of your new enterprise– Develop a risk assessment plan
• Get the word out– Make sure publicity is integral in your plans
• It takes a lot of promotion to get the attention you will need for launching a new enterprise
– Word of mouth is key to building business

Getting Started
• The soft opening– Start with a small activity targeted at a select
group to test your ideas• Understanding how you are perceived by visitors is
essential to improving your “first impression”– Good first impressions involve trained staff who
interact well with customers to ensure a safe and high quality experience
• Take it slow– Take time to get feedback from customers about
what else they might like to see, do, learn or buy– Each year, add in another attraction or product

Considerations by Enterprise
• Farm-based activities• Food-based attractions• Sourcing locally
– Restaurants– Hotels/conference centers– Conferences/meetings

Farm-Based Activities
• Assess your personality– Do you enjoy people? – Are you good with children?– Are you a good communicator? – Are you patient? – Are you organized? – Do you enjoy learning new things?– Can you adapt to change?
• If the answer to the majority of these questions was yes, then you are a good candidate for farm tourism

Create a “Destination”
• Offering an experience that customers are willing to pay for without sacrificing the uniqueness of the place
• May require coordinating with neighboring businesses or communities to develop more weekend itineraries that encourage overnight stays
• Work together with local lodging, food service, and agricultural enterprises to create a network of services for guests
• What are visitors going to do while they’re here?

Land & Equipment Resources
• Do you have sufficient property resources for the venture and parking?
• Is your venture located near the market you hope to attract?
• Are directions to your location easy to give? • What will you have to change about your
property to accommodate your new venture?
• Is it possible to start the business without making any major changes or investments?

Financial & Labor Resources
• Assess your financial capabilities– Will you have the cash you need to begin
your venture or will you need to get a loan? – Are you willing to borrow the money?
• Estimate your time and labor needs –– The time and energy needed to run an
operation will require work and support from the whole family
• Lots of multi-tasking and learning of new skills will be necessary

Legal & Liability Options
• Seek legal assistance - As the owner it is your responsibility to see that your visitors are safe and protected, but accidents happen– Consider becoming a limited liability
company (LLC)
• Explore insurance options• Develop a business and marketing plan

Health, Zoning, & Environmental Regulations• Food tourism requires sufficient capacity
(staff and infrastructure) to provide basic services– Parking, transportation, signage, customer
assistance, and restrooms – Property and facilities should be well
maintained and in compliance regulations
• Keep up with food safety regulations and follow a food safety plan

Safety Issues• Are you ready for visitors ? • Is your facility handicapped accessible? • Are there plenty of restrooms?• Are ponds or other dangerous areas fenced off? • If your mode of on farm transportation is
wagons, what safety features do they have? Do they have high rails to keep children in?
• Are there safety barriers to prevent accidents? • Are people in place to assist visitors who might
have difficulty? • Is there a plan in place to care for someone who
has an accident?

Food-Based Attractions
• Vending at existing fairs/festivals/events– Convince the organizers that you should vend
food at their event– Pick your food carefully
• Aim for a large target audience• Organizers want something that will stand out from
the rest– Know what paperwork/licensing you will need.
• You may need to get a license from a local authority which may include a fee
– Find out about insurance requirements– Find references that articulate your ability to
provide large-scale food production in an outdoor setting
Food-Based Attractions – Food/Drink Festivals• Establish a theme that enhances your destination
image• If a similar program already exists, avoid duplication• Gain buy-in where you want to hold the event• Vary the programming for a general audience event• Make sure the space can accommodate the crowds• Make sure vendors can handle attendee volumes• Create a budget and get bids from reputable
companies• If this is your first time planning the event, hire an
outside festival vendor• Market through traditional tourism channels,
partnering with area businesses and tourist destinations

What is Sourcing Locally?
• The promotion of local sources of food through enhanced local menu items
• The inclusion of locally grown food items in the hospitality (restaurants, hotels, conference centers, etc.) supply chain– Local produce and livestock – Local foods– Local recipes– New/exotic foods
Local Food Demand
• The National Restaurant Association's 2013 “Restaurant Industry Forecast” reported that 7 of 10 consumers were more likely to visit a restaurant offering locally produced items
• The National Restaurant Association’s 2014 “Top Ten Trends across the Nation,” included locally sourced meats and seafood and locally grown produce as the top 2 trends

Sourcing Locally
• Involves sourcing restaurants, hotels, conference centers, and meetings
• Check with major distributors, such as Cisco or Avendara, as they have programs for the provision of local food– These may be expensive or bureaucratic
• Consistency and reliability are the most important feature to food service establishments– Are there central drop-off locations (food hubs)
to reduce time and travel requirements?
Sourcing Local - Restaurants
• High-end or fine dining category - $100 couple• Locally-produced, in-season, and specialty
products in demand– Perceived higher quality and freshness– Restaurant customers request local products– Chefs seek innovative or unique items
• Why Restaurants?– Pricing higher than wholesale– Reliable customer base– Opportunity to build relationship with customer/local
business– Opportunity to grow special or new products and
varieties

Sourcing Restaurants
• Challenges– Delivery, availability, and variety requirements – Limited seasonal availability– Low volume frequent sales– High turnover – chefs move, restaurant’s close– Product packaging, labeling, processing to
meet food safety regulations

Sourcing Restaurants• Contact the chef or person in charge of purchasing – never
contact during meal service• Research the menu, clientele, food philosophy• Understand the key personnel – chefs, owners, managers• Find out how they wish to be contacted and when (day/time)• Invite the chef or buyer to your farm• Bring samples of produce to share with the chef/buyer• Schedule a winter visit for product planning/seed selection• Prepare a “story” for your farm• Provide overview of your products, volume, packaging,
availability (season)• Update chefs on availability regularly• Grow unique items, select the best product for chefs• Make weekly contact at agreed time, provide deliveries on time• Immediately notify chef of potential shortages and/or change in
delivery

Sourcing Local - Hotels/Conference Centers• Hotels need the largest supply during peak
summer seasons when farmers are busiest• Conference centers need the largest supply
in the winter (off season)– Consider season extension or value-added foods
• Supply chains are a complex issue for global hotel companies as suppliers extend across numerous countries in which they purchase food and beverage, heavy equipment, linens and pillows, personal soap and shampoo

Sourcing Hotels/Conference Centers
• The menu choices made by hotels/conference organizers are driven largely by cost-consciousness and risk aversion
• Sourcing options for most hotels/conference centers are constrained by national sourcing contracts with major distributors
• Farmers may have difficulty competing with large-scale producers with large-scale marketing

Sourcing Hotels• Hotel food service establishments operate similarly
to restaurants, but have some differences– The Food and Beverage Manager should be your first
contact– Invite the F&B Manager to your farm– Hotels usually need staple items (fresh meat, vegetables,
fruits) rather than specialty/unique items (They do not offer “daily specials”)
– Hotels usually need the same items in the same amounts each week (unless it is a conference center as well)
– Bring samples of produce to share with the chef/buyer– Provide deliveries on time– Immediately notify F&B manager of potential shortages
and/or change in delivery– Provide references

Sourcing Local -Conferences/Meetings• Often meeting planners are the best
contact• Find meeting planners that specialize in
“green meetings”• Meeting planners may only need
products occasionally, but in large quantities
• Know where planners source their food (in-house food and beverage, caterers, self bought, etc.)

Sourcing Conferences/Meetings
• Partner with other local farms to ensure quantity
• Think of the “whole” package – coffee, pastries, snacks, meat, vegetables, dairy, juice, bread
• Snack foods provide an option for value-added products

Sourcing Conferences/Meetings
• Have an accurate list of produce in season each month
• Promote your strengths– Fresh, healthy food allows participants to sit
longer and concentrate (no sugar high/crash)– Tell your region’s story (promote cultural and
environmental sustainability)– Provide printed fliers to promote your
involvement

More Considerations
• Work in partnership– Coordinating to serve a common market is
mutually beneficial– Agricultural, tourism, marketing associations,
community food system organizations, chambers of commerce, or business districts will help develop the destination image
– Coordinate with other tourism attractions nearby
– Actively participate in regional food and drink events

Tips for Building Community PartnershipsGoals Actions
Talk about your proposed project and share your ideas at clubs and meetings
Listen to their concerns and feedback. Address any potential problems early in the project’s development.
Develop a comfortable style of public presentation
Create a clear picture of your mission and expected outcomes. Join the local chamber of commerce. Offer to write a regular column for your local newspaper if you have time and the ability.
See any shortcomings as potential for future partnerships
Inventory your community, seeking out those who have what you need in order to accomplish your goals. Develop mutually supportive relationships.
Identify those with whom you share potential customers
Develop joint promotions and possibly joint marketing opportunities to track the source of your leads. Be innovative.
Engage adversaries Most people simply want to be heard or are afraid of unknown impacts. Sit down with them, listen, and address their concerns.
Make your business and marketing plans available
Engage community members to work with you. Use your plans to support your actions and efforts.
Manage the physical expansion of your operation
Ensure a satisfactory quality of life for everyone affected.
Work with other businesses Encourage support for locally owned businesses in general.
Build on resource-based assets Maintain and enhance historic structures in your locality.Source: Jolly (2006)

Tourism Contacts/ResourcesState Organization ContactIdaho Idaho Wine Commission http://www.idahowines.org/default.aspx
Visit Idaho Events http://www.visitidaho.org/events/
University of Idaho Cooperative Extension
http://www.uidaho.edu/extension
Idaho Department of Agriculture http://www.agri.idaho.gov/
Idaho State Agritourism Statutes http://nationalaglawcenter.org/wp-content/uploads/assets/agritourism/idaho.pdf
Montana Conserve Montana – Agritourism http://www.conservemontana.org/content/aeros-abundant-montana-directory-to-highlight-agritourism/cnm2D018228EE07BBF8A
Montana Department of Tourism –Agriculture Tours
http://visitmt.com/experiences/food_and_beverage/farmers_markets/
Montana State University Cooperative Extension
http://www.msuextension.org/
Montana Department of Agriculture
http://agr.mt.gov/

Tourism Contacts/ResourcesState Organization ContactNevada Local Sourcing Restaurant List http://buynevada.org/businesses/restaurants/
Local Sourcing Distributors List http://buynevada.org/businesses/distributors/
University of Nevada Cooperative Extension http://www.unce.unr.edu/publications/
Nevada Department of Agriculture http://agri.nv.gov/Utah Devour Utah http://www.cityweekly.net/utah/devour-
utah/Section?oid=2539715Visit Utah Events http://www.visitutah.com/things-to-
do/events/festivals/Utah State University Extension http://extension.usu.edu/
Utah State Agritourism Statutes http://nationalaglawcenter.org/wp-content/uploads/assets/agritourism/utah.pdf
National Advertised prices nationwide and by region http://www.marketnews.usda.gov/portal/fv
Chefs Collaborative network http://www.chefscollaborative.orgLookup prices (PLUs) list http://www.plucodes.com
ATTRA Publications http://www.attra.ncat.orgDude Ranchers Association of America http://www.duderanch,org
US Farm Stay Association http://www.farmstayus.com/
Activity
• Worksheet 2.1: Resource Needs– List resource needs for a food tourism
enterprise or product– What resources do you have already?– How will you acquire those you don’t have?

Thank you!

Module 3: Understanding the Tourism Market

Overview
• Understand tourist motivations and preferences
• Understand the role food plays in the tourist experience
• Compare food tourist types by food interests and activity levels
• Evaluate food and farm tourism promotional options

Tourists
• Tourists seek experiences based on local identity and culture
• Studies show that tourists travel to those destinations that have established a reputation as a place to experiment with quality local products
• The Mediterranean diet was included in UNESCO’s list of Intangible Cultural Heritage of Humanity

Tourist Preferences
• Tourist food preferences can vary based on…– Destination– Seasonality– Tourist type– Visitor nationality
• Food tourists are considered cultural tourists– Educated consumerism– Open to new experiences– Desire for lifelong learning– Independent travel– High expectations

Tourist Preferences
• Some tourists treat food consumption as part of the travel experience
• Some tourists use food as a basis for their activities
• Some tourists use food to select the destination itself
• Food choices can be motivated by…– Cultural experience– Interpersonal relations– Excitement– Sensory appeal– Health concerns

Food Consumer Types
• Neophile– More likely to try something new on the
menu, something that may not be available at home
• Neophobe– Less likely to be as adventurous in their diet

Foodies & Food Tourism
• A foodie is a person with “a long-standing passion for eating and learning about food, but are not food professionals”
• May choose to travel specifically to experience new foods
• Well educated on food, but often just an interest and enthusiasm for learning about food
• Often have high standards for food quality, but may not require expensive or gourmet foods
• Frequent food related festivals and events– Motivation to visit, stay at accommodations, and
eat at local restaurants

Barr & Levy’s Foodie TypesFoodie Type DescriptionWhole-Foodier Than Thou
Uses only organic methods growing their own produce and flowers, slaughters their own meat, uses simple ingredients in their cooking.
Squalor Scholar Cook Does their research and knows the history of their favorite foods and recipes, sticks to traditional recipes, has the academic and historical knowledge of food to set them apart from others.
Made in Paris Starts off learning basic cooking techniques in small restaurants and manages to move themselves up the ranks through their connections to make a living cooking in Paris, a foodie mecca.
Paris C’est un Dump Ultimate upscale foodie that spends much of their time in expensive restaurants, subscribes to important food magazines, and is extremely picky.
Gorgeous East in Me Drawn to ethnic and foreign foods, constantly wants to try new things and experience new cultures through food.
Foodies on Ice Regards food as artistic material, aims to impress by creating ice sculptures, elaborately decorated cakes, or butter statues.
All-American Small-town foodie that searches out local food and ingredients that deserve attention, constantly attempts to improve their crops and create new dishes.

Understanding Food Tourists• Attendees of a Texas Style Wine, Art, and Food
Festival (Chang and Yuan, 2014) – Older respondents sought entertainment and escape
from their daily routine– Younger respondents with bachelor degrees thought
attending the festival was an important way to escape from stress
– Female respondents rated food as a more important factor
– Respondents with annual income over $40,000 perceived the escape/event novelty factor as being more important
– Respondents with incomes of less than $20,000 rated external socialization as import
– In general, the lower income group had a greater desire to meet new people, build new relationships and enjoy the arts

Understanding Food Tourists
• Tourist motivations for attending a Corn Festival in South Carolina (Uysal, Gahan, and Martin, 1993) – Escape– Excitement and thrills– Event novelty– Socialization– Family togetherness
Understanding Food Tourists
• Visitors to Charlotte, North Carolina (Green and Kline, 2013) – 61.7% considered themselves foodies (7-10
on the scale) – 28.2% considered themselves moderate
foodies (4-6 on the scale)– 10% did not consider themselves foodies (0-
3 on the scale).

Understanding Food Tourists• A study in South Carolina revealed the presence
of three tourist clusters (Shenoy, 2005) – Culinary tourist, experiential tourist, and general
tourist– Culinary tourists purchased local food, consumed
local beverages, dined at high-class restaurants, and rarely ate at franchisee restaurants.
– Culinary tourists are more educated, earned higher incomes, and are characterized by variety-seeking
• A general tourist survey in Charleston, South Carolina, (MacLaurin, Blose, and Mack, 2007)– A large percentage of tourists comprised a potentially
sizeable food-based market– Many consumers with a large amount of interest
across a wide variety of food tourism activities

Western Food Tourism
• Colorado Agritourism Study– 895 survey responses 2005-2006– Age - 46 years on average– Income - 37% earned incomes over $75,000 per
year– Marital status - 73% of travelers were married– Family composition -
• 28% were young couples, no children• 42% were families with children
– 90% identified themselves as White• Grouped respondents into five “tourist
types”

Colorado Agritourism Study
• Group 1: The Loyal Colorado Enthusiasts - 13% of travelers
– Parents of older children and couples who return often based on their previous agritourism experiences
– Largest share of participants in outdoor recreation on farms and ranches during the summer
– Likely to camp and stay within a few hundred miles of home– Participate in a diverse set of agritourism activities
• Group 2: Family Ag Adventurers - 17% of travelers– Most promising agritourism visitors– Plans their travels around specific agritourism outings and
participates in unplanned activities several times per year– Middle-income, often traveling with children in bigger parties– Willing to visit local enterprises and travel long distances to reach a
variety of agritourism destinations– Travel primarily in summer and fall

Colorado Agritourism Study• Group 3: In-State Explorers - 30% of travelers
– Coloradans who explore the state by car on short jaunts– Don’t travel with agritourism activities in mind, but participate in
unplanned activities – Travel frequently and are from upper-middle income households– Many planned to travel in the subsequent year and participate in some
agritourism– The culinary events in which they currently participate may be the best
means to extend their visitation and spending into other agritourismexperiences
• Group 4: The Out-of-State Activity Seekers - 4% of travelers– No plans to visits the following year – More likely to spend longer trips in hotels, resorts, second-homes or bed
and breakfast accommodations – Primarily mid- to upper-middle class individuals, traveling in smaller
parties (even though they are parents)– More likely to engage in agritourism as a secondary or unplanned activity– Enjoy participating in numerous outdoor activities, and report some of the
highest interest across all agritourism activity groups– Travel is spread more evenly across all four seasons, relative to others
Colorado Agritourism Study
• Group 5: The Accidental Tourists - 36% of travelers– Coming for non-recreational business,
educational, or convention activities– Not seeking agritourism activities

Colorado Study Results• Larger groups participating in agritourism are more
likely to plan their trip itinerary (and include agritourism activities) prior to travel)
• Groups used local and business websites (not national websites) to plan their holiday
• Tourists attracted to an area by its natural amenities tend to participate in agritourism activities in these areas
• Need to link marketing for agritourism enterprises to natural parks, forests and recreation areas, such as representing them in park brochures and at visitor centers
• Private enterprises should describe the natural aspects of their operations in their marketing materials
Western Food Tourism• Utah Tourism Study
– In-person survey of tourists in Utah (coming from/going to ID, NV, CO, MT), Summer 2013/Winter 2014
– Random sampling technique, 700 surveys completed – 12 sites at gateways, national parks, airports, ski areas,
convention and visitor centers• Create a profile of tourist types
– What types of people visit (demographics, attitudes, interests, etc.)
– What is the reason for their visit and who travels with them?
– What types of experiences and activities do they seek?• How important are food related experiences?
– How do they research and plan their travel?– How long do they stay and where do they stay?

Sample Demographics
• 68% married• 52% male• College degree 31%, graduate degree 40%• 49% full time employed, 29% retired• 84% White, 5% Asian, 4% Hispanic• Average income in 2012 $103,000• Average age 50 years• Length of stay average of 10.6 days• Average party size of 2.9 adults and 1.6
children

Travel Specifics
• Travel reason– Business 1%– Visiting family/friends 5%– Visiting national parks 9%– Outdoor activities 43%– Visiting cultural/heritage
sites 24%– Special events/festivals
2%– Agritourism activities 9%– Passing through 6%
• Research/booking resource– Internet/website 41%– Brochure/booklet 10%– Recommendation from
family/friend 3%– Tradition 32%– Other 14%

Food Interests
• Organization membership (18%)– Slow Food = 10%– Dining Club = 11%– Coop Grocer = 22%– Wine/Beer Club = 27%– Cooking Club = 8%– CSA = 15%– Other = 7%
• Dietary restrictions– Yes 15%

Activities At Home & While Traveling
Buy locally sourced food:Shop at farmer's markets:Participate in a CSA:Buy organic certified produce:Visit local farms:Cook at home:Try new food items or recipes:Buy food you don't recognize:Eat ethnic foods:Attend beer/wine festivals:Food canning:Beer/wine making:Home gardening:Composting:Recycling:Other:
3.52(1.16)3.08(1.14)1.73(1.11)2.79(1.19)2.05(1.14)4.29(0.80)3.86(0.91)2.93(1.19)3.57(1.05)2.39(1.27)1.80(1.11)1.35(0.88)2.62(1.50)2.14(1.49)4.35(1.07)3.75(1.89)
Buy locally sourced food:Shop at farmer's markets:Visit local farms:Spend the night at local farms:Participate in agritourism:Cook at accommodations:Try new food items or recipes:Try local recipes:Buy food items as souvenirs or gifts:Seek out local sourcingrestaurants:Attend beer/wine festivals:
2.80(1.19)2.46(1.16)1.77(0.95)1.28(0.65)1.60(0.88)2.82(1.31)3.48(1.06)3.12(1.19)2.72(1.13)2.97(1.23)2.22(1.28)3.67(1.33)2.38(1.77)
At Home While Traveling
Rating scale of 1-5 (Never to Always)

Activities/InterestsBehavior At Home Behavior While TravelingLocal Foods Food Tourism
Shop at farmers' markets Try new foodsBuy organic produce Try local recipesVisit farms Buy food-related gifts
Food Experiences AgritourismTry new foods/recipes Spend a night at a farmEat ethnic foods Agritourism activitiesTry new/unknown produce Visit farms
Do it Yourself Local FoodsGardening Buy local foodsCanning/Preserving Cook at accommodationsComposting Shop at farmers' markets
Food ConnectionsRecyclingCook at homeBuy local foods

Primary Tourist Groups
• Family Vacation - 50% of sample– Younger (mid 40s), less educated (in comparison)
adults, with children, less likely married. Spend fewer days on vacation and are primarily involved in outdoor recreation on an annual trip. Use multiple sources for trip information and tend to do more cooking, but seek local foods and spend a lot on food.
• Utah Pilgrimage - 8% of sample– Older (mid 50s), married individuals traveling with
older child, staying for a month and spending little on food, but seeking some food experiences and involved in food clubs. Visiting heritage sites and family primarily. Information from internet and past experience used in trip planning.

Primary Tourist Groups• Couples Vacation - 11% of sample
– Married, highly educated, middle-aged couples (upper 40s), seeking food and drink experiences with high food spending. Traditional annual two week trip, use internet for secondary information, visiting heritage sites and outdoor recreation. More heavily involved in food related activities while traveling and at home.
• Random Vacation - 25% of sample– Older (mid 50s), married, more likely male on a 7 day
vacation. Traveling with older child in various activities (outdoor recreation, heritage sites, agritourism). Primarily use the internet for trip information. Food spending lower and not all that involved in food related activities while traveling. They just need to eat!

Utah Study Results• Overall highly educated, married, seeking outdoor
recreation, cultural/heritage sites, and agritourism activities
• Good potential (20% of sample)– Couples Vacation (Foodies with funds)– Utah Pilgrimage (Cultural/local foods) – Family Vacation – should not be overlooked
• Internet-based promotional programs most useful• Quality experience essential – repeat visits• Link marketing for food tourism to outdoor recreation
destinations– Promote in park and resort brochures, visitor centers, etc.– Describe “proximity” to primary destinations in all materials– Heritage trail and food tourism linkages needed

Tourism Promotion Options
• Brochures, flyers, etc.– Leave with hotels, visitor centers, parks, resorts
• Business website• Memberships
– Chambers of commerce, visitor/convention bureaus, local food organizations, etc.
• Other publications– Websites
• State/regional tourism, local food, trip/vacation booking – Tourism publications
• Local, national, international– Heritage/scenic trail maps– Attraction publications
• Parks, resorts, etc.

Tourist Information Centers (TIC)
• Tourist Information Centers (TIC) can help you to reach customers– Know how tourists arrive (major hubs/airports)
and what activities they seek• Las Vegas Visitor Information Center• Greater Las Vegas Visitor Center (Laughlin)• Nevada Welcome Centers (Boulder City,
Mesquite, Wendover)• Utah Welcome Centers (Brigham City, Echo,
Salt Lake City, Jensen, Thompson Springs, St. George)

Promotional ResourcesState Organization Type Contact
Idaho Idaho Preferred Local food idahopreferred.com
Visit Idaho Tourism www.visitidaho.org
Idaho Travel Guide Tourism www.idahobeautiful.com
Nevada Nevada Grown Local food nevadagrown.com
Grow your Own Local food growyourownnevada.com
Nevada Tourism Department Tourism www.travelnevada.com
Utah Utah’s Own Local food utahsown.com
Local First Utah Local food localfirst.org
Utah Tourism Department Tourism www.utah.com
National Slow Food Local food slowfoodutah.com
Agritourism World Local food www.agritourismworld.com
Brand USA Tourism www.thebrandusa.com
Discover America Tourism http://www.discoveramerica.com
Tourism Research & Statistics
• Idaho Commerce, Tourism Research– http://commerce.idaho.gov/tourism-
resources/tourism-industry-development/research
• Utah Tourism Industry Association, Research and Information– http://utahtourism.org/?page_id=9
• Travel Nevada, Visitor Statistics– http://travelnevada.com/industry/visitor-
statistics

Activity
• Worksheet 3.1: Customer Segmentation– For each food tourism enterprise or product
define the target consumer (tourist)– List what needs and preferences they have
regarding your activities/products

Activity
• Worksheet 3.3: Promotion Plan– For each food tourism enterprise or product
define a tourism focused promotional strategy

Thank you!

Module 4: Producing and Selling Value-Added Products

Overview
• Determine whether or not their food products are considered “processed”
• Increase their understanding of the laws and regulations that apply to food product processing at both the state and federal level
• Practice proper food safety and sanitation procedures during the processing of food products
• Create FDA-compliant food labels for their products

Value-Added Foods
• Local, organic, vine-ripened, or specialty crops
• “Gourmet” foods– Jams, jellies, preserves– Pickled vegetables– Hot sauces, salsas, tapenades– Herbed oils and vinegars
• Must consider regulatory, safety and labeling issues

Unprocessed Produce
• Regulations vary by State• Idaho – State Department of Agriculture
and Department of Health and Welfare• Nevada – State Department of
Agriculture• Utah – State Department of Agriculture

Must Register to Sell Processed Produce

Processed Foods Include:Peeled, Cut, or Washed Produce

Processed Foods Include:Cut Leafy Greens

Processed Foods Include:Dried or Dehydrated Produce

Processed Foods Include: Packaged Fresh Herbs

Processing Options: Cottage Kitchen• Home kitchen, certified by state agency• Program regulations and availability vary
by state• Pro: Less expensive than renting or
building commercial kitchen space• Con: Limited types of food can be
prepared

Cottage Production: Western U.S.
Green – Formal Cottage Food laws; Yellow – Formal legislation pending; Red – No formal Cottage Food law

• Certified food production facilities– Will package your product in their down-
time
• Each co-packer has different requirements, capabilities & minimum runs
• You must license your business, but do not need to register with the FDA
Processing Options:Contract Packaging – “Co-Packers”

• Commercial facility, certified by local health department– Incubator kitchens, restaurant kitchens
• Potentially Hazardous Foods can be produced, but must be approved
• On-Farm certified kitchens may be exempt from some FSMA record keeping requirements
Processing Options: Certified Food Establishments

• “Standards for the Growing, Harvesting, Packing, and Holding of Produce for Human Consumption”
• New FDA definition of “Farm”• Harvesting
– Includes trimming, sifting, shelling, and washing
• Drying/Dehydrating• Packaging and Labeling RACs
FSMA Exemptions: Certain On-Farm processing
• Local, organic, vine-ripened, or specialty crops
• “Gourmet” foods– Jams, jellies, preserves– Pickled vegetables– Hot sauces, salsas, tapenades– Herbed oils and vinegars
• Must consider regulatory, safety and labeling issues
Value-Added Foods

• How will you clean & sanitize?• How will you prepare or cook your
product to minimize safety risks?• How will you package/protect your
product?• How will you store & display your
product?
Safety Issues to Consider

• Clean: Free of visible dirt or debris– Applies to whole, unprocessed foods
• Sanitary: Free of pathogenic bacteria– Applies to processed foods & food contact
surfaces
• Sterile: Free of all viable bacteria– Commercial sterility – 99.99% sterile
Important Definitions

• Sanitize at start of production– 1 tbsp unscented bleach maximum per 1
gallon water (200 ppm)– Check sanitizer with test strips
Safety IssuesKitchen Sanitation

Common Sanitizer Test Strips

• Sanitize at start of production– 1 tbsp unscented bleach maximum per 1
gallon water (200 ppm)– Check sanitizer with test strips
• Wipe up spills, sanitize during production– Check / refresh sanitizer every hour
• Clean and sanitize at end of production
Safety Issues Kitchen Sanitation

Chemical Contaminants
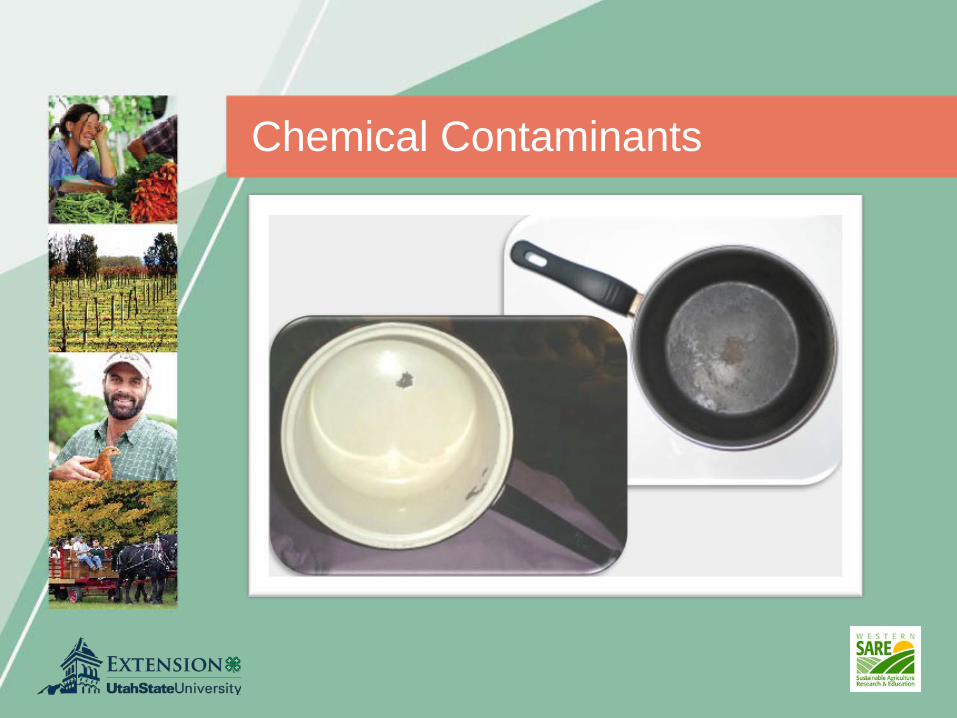
Chemical Contaminants

Physical Contaminants
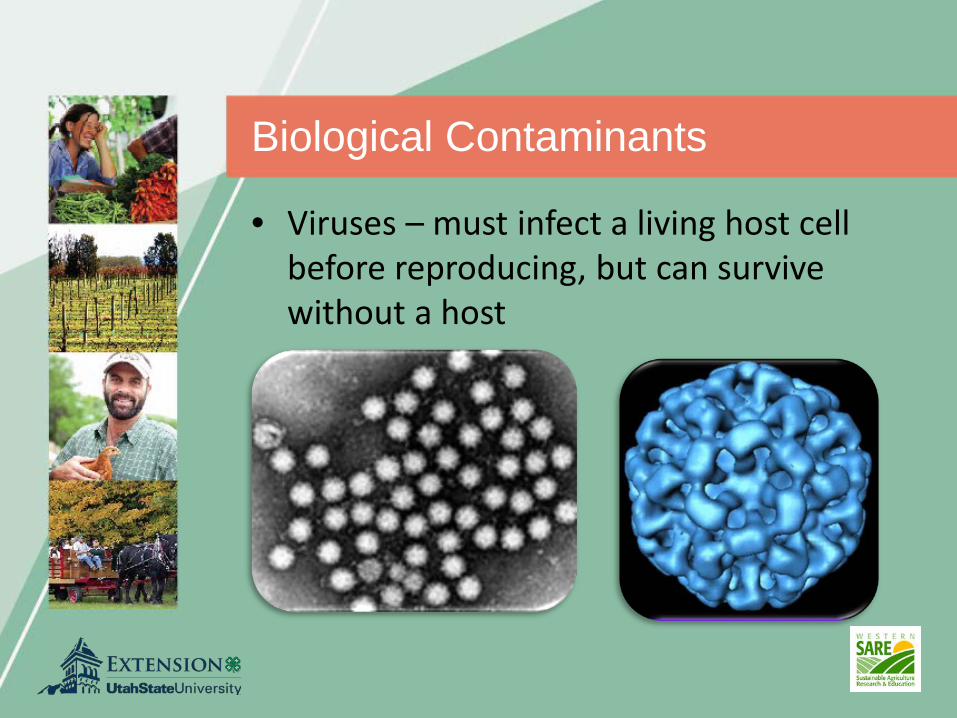
Biological Contaminants
• Viruses – must infect a living host cell before reproducing, but can survive without a host

Biological Contaminants
• Fungi – multiply and grow without a host

Biological Contaminants
• Bacteria – multiply and grow without a host

Bacterial Growth & Survival
FoodAcid
TemperatureTime
OxygenMoisture

• Bacteria must have water available• Aw is a measure of how much water is
available, not how much is present• Add sugar or salt to lower Aw• Remove water to lower Aw
Survival: Moisture (Aw)

Water Activity (Aw) Examples of foods in this range
1.00 – 0.95 Fresh produce & meat; canned produce & meat; milk; juice; bread
0.95 – 0.91Cured meats (ham); semisoft & somehard cheeses (Swiss, young cheddar, provolone); moist cakes
0.91 – 0.87 Hard or aged cheese; sponge cakes; margarine; most fermented sausage
0.87 – 0.80 Syrup; flour; fruit juice concentrate; high-sugar cakes
0.80 – 0.75 Jam & marmalade; marshmallows; beef jerky
0.75 – 0.65 Soy sauce; molasses; jelly; nuts; oats; peanut butter;
0.65 – 0.60 Honey; caramels; dried fruit; toffee
0.50 or below Spices; crackers; cookies; pasta; powdered milk
• Bacteria have specific nutritional requirements
• Food must provided that is a ready source of nutrients
• We can limit growth of pathogenic or spoilage bacteria by adding a “Good” bacteria
Survival: Food

• Aerobic = require oxygen• Anaerobic = oxygen is toxic• Facultative = anaerobes that can tolerate
some oxygen• Places where no oxygen is present?
Survival: Atmosphere

• Acid slows the growth of some bacteria• Acid prevents germination of bacterial
spores• Vinegar, citrus juices, tomatoes
Growth: Acidity

← 7.0 6.0 5.0 4.0 3.0 →
Most foods are between 7.0 (neutral) and 3.0 (acidic)

• Each bacteria prefers a different temperature range
• The temperature danger zone: 40 – 140F• Heat can destroy, cold only preserves
Growth: Temperature

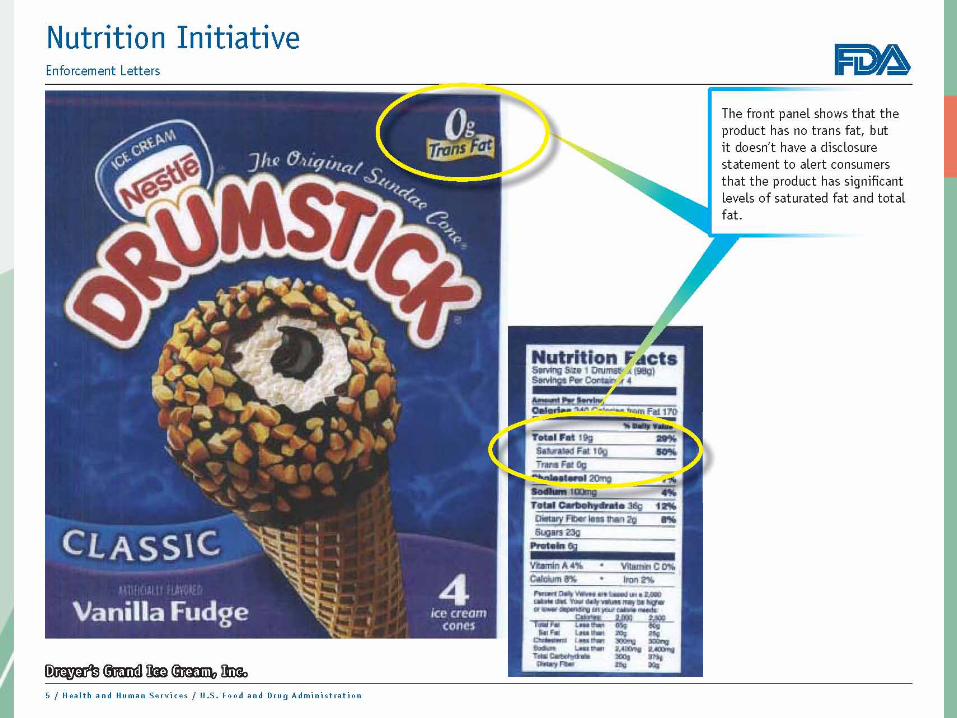
FDA – “Exempt” Products
• Refrigerated, frozen, or Aw < 0.85• Labeling: 21CFR §101• Processing: 21CFR §110• Standards of Identity: 21CFR §135 to 169 • FDA Food Processor registration required

Examples of “Exempt” Products
• Candies and syrups• Dry mixes, spices/herbs, and flavorings• Roasted nuts• Dehydrated fruits and vegetables• Dried pasta and noodles• Full-sugar jams and jellies• Some BBQ sauces

FDA – Acid Food Regulations
• Canned or bottled foods with a natural pH < 4.6– Should not contain more than 10% low acid
ingredients
• Labeling: 21CFR §101• Processing: 21CFR §110• Standards of Identity: 21CFR §135 to 169 • FDA Food Processor registration required

Examples of Acid Foods
• Canned tomatoes and tomato products• Canned fruits• Flavored vinegars• Vinegar and oil dressings• Low-sugar fruit preserves• Fermented foods (no other acid added)

FDA – Acidified Food Regulations
• Natural pH > 4.6, but added acid drops pH– Require Process Authority letter & regular
filings• Labeling: 21CFR §101• Processing: 21CFR §114• Standards of Identity: 21CFR §135 to 169 • FDA Food Processor registration required• FDA Acidified Food Processer registration
required

Examples of Acidified Foods
• Salsa and spaghetti sauces• Most hot sauces and BBQ sauces• Worcestershire sauce• Pickled vegetables• Mayonnaise and salad dressing• Some vegetable juice blends, Clamato
juice

FDA – Acidified Foods Guidance
• Draft Guidance for Industry: Acidified Foods (September 2010)– Definitions, decision trees, and example
calculations
• Form FDA 2541 – Food Canning Establishment Registration
• Form FDA 2541a – Process Filing for Acidified Foods

FDA – Low Acid Food Regulations
• Natural pH > 4.6, no acid added– Require Process Authority letter & regular
filings
• Labeling: 21CFR §101• Processing: 21CFR §113• Standards of Identity: 21CFR §135 to 169 • FDA Food Processor registration required• FDA Low Acid Food Processer
registration required

Examples of Low Acid Foods
• Canned vegetables• Canned beans and legumes• Canned or bottled olives• Vegetable juices• Canned vegetarian soups and broth• Evaporated milk• Canned tuna, clams, and shrimp
• Local, organic, vine-ripened, or specialty crops
• “Gourmet” foods– Jams, jellies, preserves– Pickled vegetables– Hot sauces, salsas, tapenades– Herbed oils and vinegars
• Must consider safety, regulatory and labeling issues
Value-Added Foods

Required Label Components
Primary Display Panel
Statement of Identity
Net weight statement

• Many foods have a legally established name that must be used [CFR21 §101.3]
Statement of Identity

§ 131 Milk & cream§ 133 Cheese§ 135 Frozen desserts§ 136 Bakery products§ 137 Cereal flours§ 139 Macaroni & noodles§ 145 Canned fruit§ 146 Canned fruit juice§ 150 Jellies & preserves§ 152 Fruit Pies§ 155 Canned vegetables
§ 156 Vegetable juices§ 158 Frozen vegetables§ 160 Eggs & egg products§ 161 Fish & shellfish§ 163 Cacao products§ 164 Tree nuts & peanuts§ 165 Beverages§ 166 Margarine§ 168 Sweeteners & syrups§ 169 Dressings & flavorings
Standards of Identity exist for:

• Many foods have a legally established name that must be used [CFR21 §101.3]
• All others must use “common or usual name”
• Other requirements include:– Form of food (e.g. sliced, cubed, crushed)– “Imitation” if lower protein, vitamins,
minerals– “___% Juice” for any drink showing fruit or
vegetables on the label
Statement of Identity

Required Label Components
Information Panel
Nutrition Facts panel
Ingredient statement
Producer name & address

• Ingredients must be listed in order by weight
• Must list function of any preservatives– “Ascorbic Acid to promote color retention”
• “Spices”, “Natural Flavor” or “Artificial Flavor” can be grouped to save space – Except: onion/garlic/celery items, salt, and
MSG• Certified colors must be specified
– “Red 40” or “FD&C Red 40”
Ingredient Statement

Allergen Statement
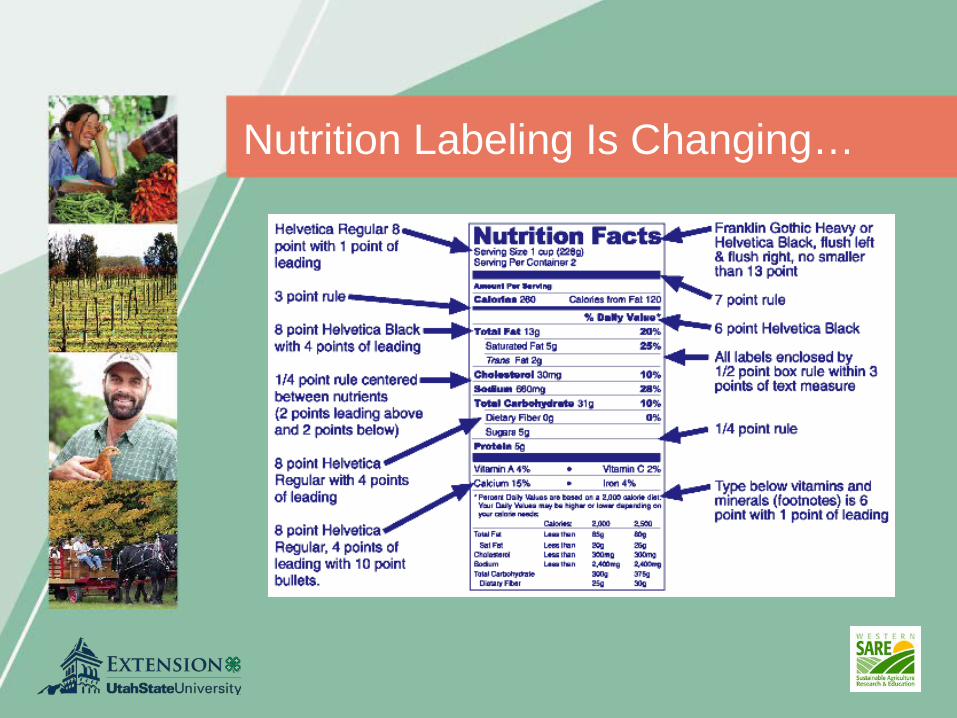
Nutrition Labeling Is Changing…

• Reference Amounts Customarily Consumed
Continues on for 6 pages…
Nutrition Labeling
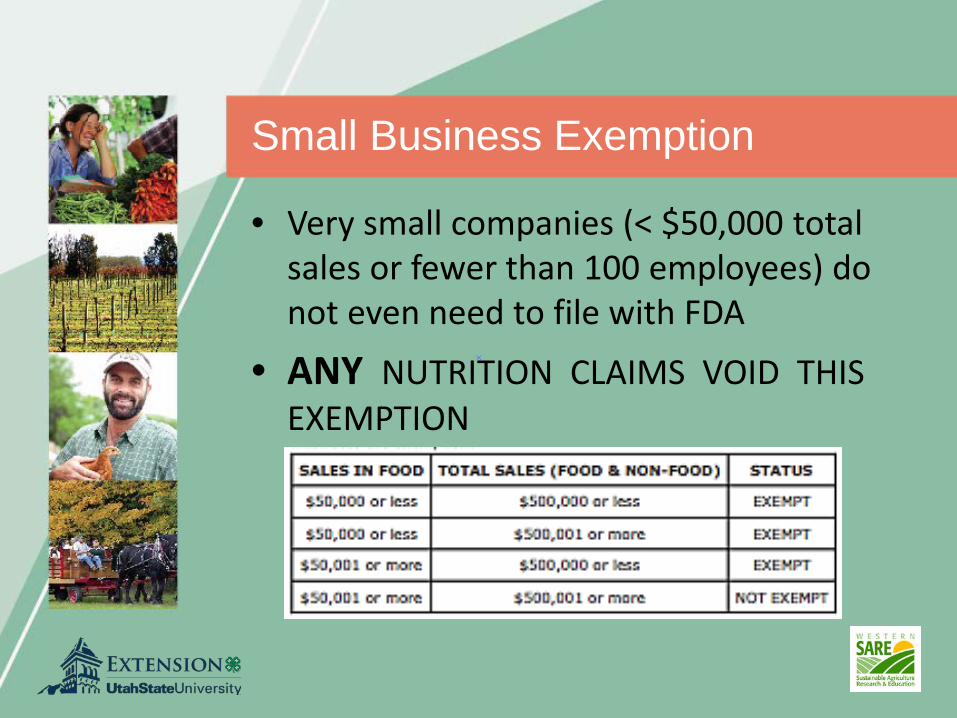
• Very small companies (< $50,000 total sales or fewer than 100 employees) do not even need to file with FDA
• ANY NUTRITION CLAIMS VOID THIS EXEMPTION
Small Business Exemption

• Nutrient content claims– Specific guidelines for different types of food
• Approved health claims– General scientific consensus has been
reached– Must put in context of whole diet
• Qualified health claims– No scientific consensus, but some evidence– Stricter wording requirements
Types of Health Claims

• Content Claims [21CFR§101.60-62]
– “Free”, “Low”, “Reduced/Less”
• Relative Claims [21CFR§101.13(j)]
– “Light”, “Reduced” or “Added”, “More” or “Less”
• Other Claims– “High”, “Rich In” or “Excellent Source of”– “Good Source”, “Contains” or “Provides”– “Lean” and “Extra Lean”– “Modified”– “Fiber” claims
Nutrient Content Claims


• Crop, livestock, or food product certification
• USDA does not require certification for organic sales <$5000 / year
• Specific requirements for how it is stated on the label
Organic Labeling

• Must contain only organic ingredients (not including water and salt)
• Must list certifying agency information• Can use USDA and/or certifying agency
seal
“100% Organic”

• Must contain 95% organic ingredients• Cannot contain sulfites • Must list certifying agency information• Can use USDA and/or certifying agency
seal
“Organic”

• Must contain 70% organic ingredients• Cannot contain sulfites (except wine)• Must list certifying agency information• Can use certifying agency seal, but not
USDA
“Contains Organic __________”

• No specific legal definition from FDA– USDA has stricter requirements
• Cannot contain artificial or synthetic ingredients– Colors– Flavors– Preservatives
Natural Labeling

Activity
• Worksheet 4.1: Potential Food Safety Risks– Choose a product you produce or plan to
produce– For each stage of the production process
identify potential food safety risks for each risk type
• Biological, chemical, and physical

Hazard/Risk Phase Biological Chemical PhysicalProduction Livestock, wild animals,
improperly composted manure, natural soil organisms, and contaminated irrigation water
Residues from previous use history or current pesticide and fertilizers
Stone and sticks or "trash" from previous crops, other debris in compost
Harvest Improper worker hygiene; dirty bins, containers and harvest equipment; domestic and wild animals present
Equipment leakages and cleanser residues present
Poorly maintained or damaged/worn-out equipment, workers' personal articles (pens, etc.)
Postharvest Contaminated wash/rinse or cooling water, including ice; improper worker hygiene; dirty bins, containers, and sorting equipment; staging areas next to cull or compost piles or livestock areas
Contaminated wash/rinse or cooling water, including ice; residues from pest control in and around packing shed/buildings; residues in bins and containers
See above
Processing Improper canning temperature or pH, flies or other vermin around drying racks, employee hygiene
Residues and water or other additives used in processing
Damaged containers and equipment, including jars and packaging materials; fragments from walls or ceilings; employees' personal items
Storage Vermin such as mice or insects; improper temperatures or humidity, dirty bins and other types of cross-contamination
Residues from cleansers and pesticides used to control vermin, residues or cross-contamination from other materials stored in the same facility
Damaged bins, fragments from walls or ceilings, vermin nesting materials
Transportation See above Residues from previous transport of chemical materials in vehicles
Damaged ballets, bins, and containers; fragments from vehicles
Marketing Employee and consumer handling, improper sampling hygiene, improper temperature control; poor worker hygiene, dirty equipment, cross-contamination, improper cooking time or temperature, poor kitchen sanitation
Sanitizing and cleaning residues on display and sampling equipment; residues on equipment food, and additives
Damaged display equipment; employees' or customers' personal items, including coins; wall or ceiling fragments, employee personal items
Consumer Inadequate or improper consumer education such as "refrigerate after opening" and "discard date" advisories
Inadequate or improper consumer education such as "wash before consuming advisories
Inadequate or improper consumer education such as "may contain pits or shell fragments" warnings
Example Risk Overview

Thank you!

• All products containing > 3% raw or > 2% cooked meat by weight
• Beef, Pork, Lamb, Goat• Labeling requirements: 9CFR §317• Processing requirements: 9CFR §318• Standards of Identity: 9CFR §319
USDA FSIS – Meat Regulations
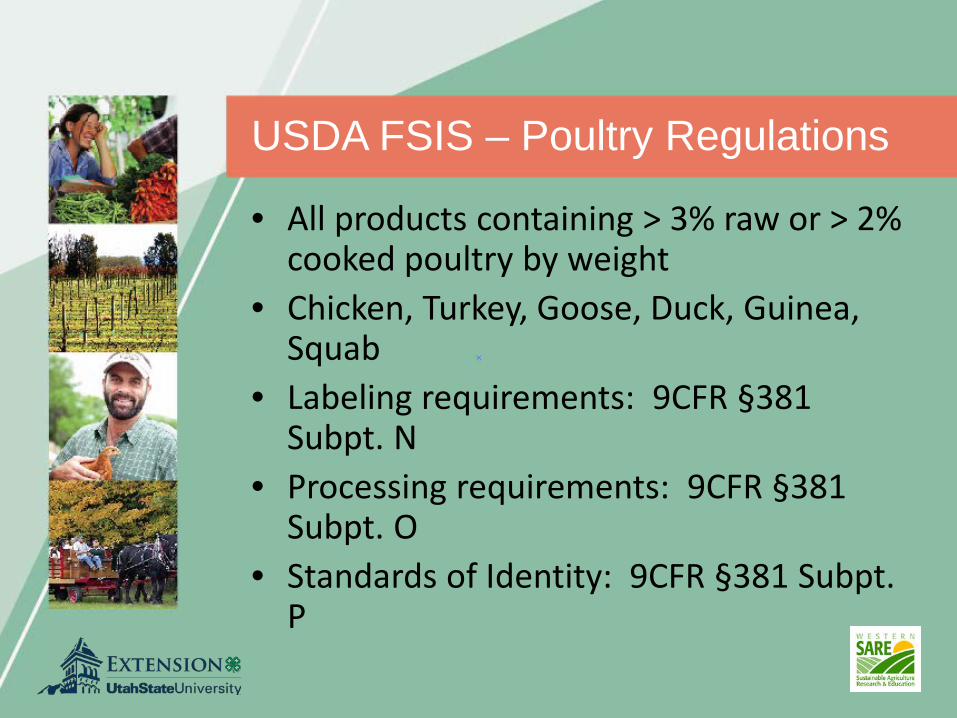
• All products containing > 3% raw or > 2% cooked poultry by weight
• Chicken, Turkey, Goose, Duck, Guinea, Squab
• Labeling requirements: 9CFR §381 Subpt. N
• Processing requirements: 9CFR §381 Subpt. O
• Standards of Identity: 9CFR §381 Subpt. P
USDA FSIS – Poultry Regulations

• USDA FSIS regulations– Processing and Grading: 9CFR §590
• FDA regulations– Labeling: 21CFR §101 – Storage and Transport: 21CFR §115 and 118– Standards of Identity: 21CFR §160
FSIS and FDA – Eggs & Egg Products

• Labeling: 21CFR §101• Processing: Pasteurized Milk Ordinance
and 21CFR §110• Standards of Identity: 21CFR §131 to
135• FDA Food Processor registration required
FDA – Dairy Regulations

• Labeling: 21CFR §101• Processing: 21CFR §110• Standards of Identity: 21CFR §129• FDA Food Processor registration required• UDAF Food Establishment registration
required
FDA – Bottled Water Regulations
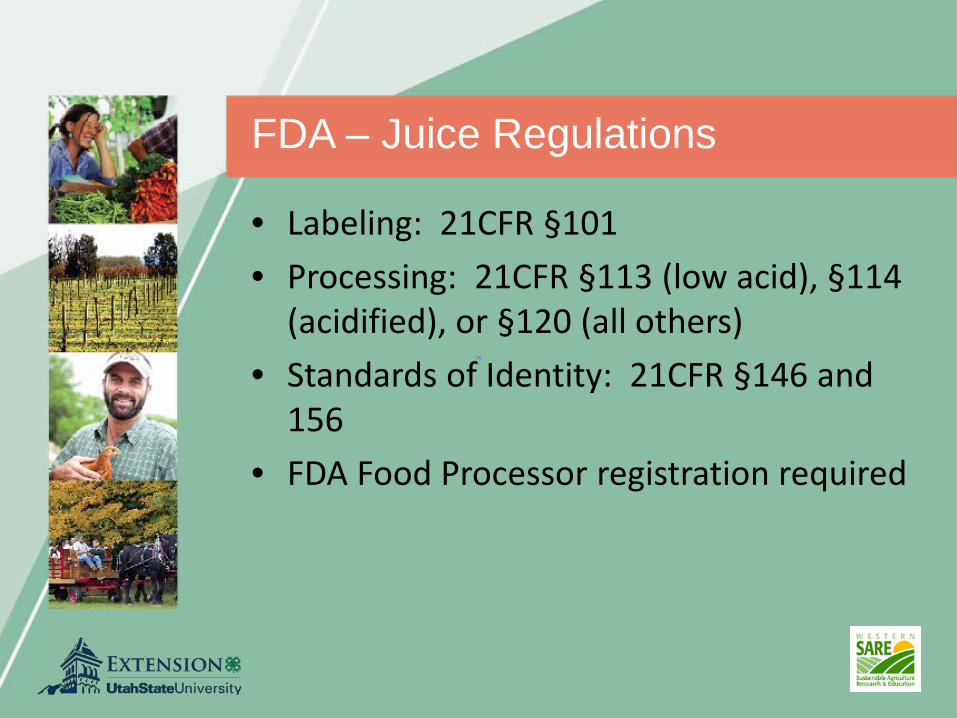
• Labeling: 21CFR §101• Processing: 21CFR §113 (low acid), §114
(acidified), or §120 (all others)• Standards of Identity: 21CFR §146 and
156• FDA Food Processor registration required
FDA – Juice Regulations

• Labeling: 21CFR §101• Processing: 21CFR §123• Standards of Identity: 21CFR §161• FDA Food Processor registration required
FDA – Fish and Fish Products

• Labeling: 21CFR §101• Processing: 21CFR §111• No Standards of Identity for supplements• FDA Food Processor registration required
FDA – Dietary Supplements

Module 5: Assessing Enterprise Feasibility

Overview
• Understand the elements of economic feasibility analysis
• Evaluate market size and estimate volume• Calculate cost of production or service• Use break-even analysis to identify
minimum required pricing and volumes• Compare pricing approaches and select
appropriate pricing

Steps in Economic Feasibility Analysis
• Assess potential demand (volume and pricing)
• Estimate cost of production • Examine break-even volume and pricing• Choose a pricing approach

Assess Potential Demand• Target consumers who have a need for the
product/service• Conduct market research
– Estimate available customer base and purchase amount
– Estimate feasible range of prices (cover production costs)
– Assess consumer sensitivity to pricing• Market research methods
– Survey existing customers– Conduct product/pricing trials – Ask fellow providers – competitors– Use secondary data resources
• USDA, marketing firms, Extension

Estimating Market Size - Farm Tourism Examples• Local Farm Tourism
– Local customers traveling for a day or weekend outing, such as in-state or less than 100 miles away
– U-pick strawberry operation example
• Destination Tourists– Visitors on a long vacation to specific
destinations• National and state parks, heritage sites, etc.
– Farm tourism venture example

Local Tourists
• If selling items directly from farm/ranch– Consider how far you can expect customers to
travel• The USDA Forest Service's National Survey
on Recreation found the average distance traveled to visit a farm in 2000 was 80 miles
• Western operators find their consumers travel over 75 miles to participate in U-picks, farm festivals, and related farm activities– No other alternatives exist in their metro area

Local Tourists• Potential number of customers
– Demographics and population size in the area is an important part of estimating demand
• Demographics from the most recent U.S. Census can be searched online by state and by zip code -http://factfinder.census.gov/faces/nav/jsf/pages/index.xhtml
– Ages, household and family size, income, ethnicity, etc.– All of which can provide information as to the characteristics of
potential customers in the surrounding area
• Potential purchase size– Examining current and historical consumption patterns
can be helpful• Average annual consumption levels for hundreds of foods in
the US can be found on USDA’s Economic Research Service (USDA-ERS) website - http://www.ers.usda.gov/data-products/food-availability-(per-capita)-data-system/.aspx
• ERS data is for standard, conventional products only

U-Pick Example• A strawberry producer is considering turning one
acre of the operation into a U-pick• Estimates that each acre will yield 10,000 pounds• The average annual consumption of strawberries
per person is 8 pounds (ERS, 2014)• Use the following equation to determine the
appropriate market size
• The producer will need a market size of 64,935 consumers/visits annually to sell all output
(Acres in operation)*(Output per acre) Market size required(Average consumption per person/year)/(52 weeks/year)
=
10,000 10,000 64,9358 / 52 .154
= = =

U-Pick Example
• For the U-pick strawberry operation, the producer may be interested in targeting families– Would be helpful to know if nearby communities
have enough families to make up a portion of the 65,000 consumers needed to make the U-pick operation feasible
• Bend/Redmond, OR – 26,073 families, average of 3.5 persons (2010
Census)– 91,255 potential customers

U-Pick Example
• What percentage might visit the u-pick?– If 40%, then 36,502 customers
• Almost 30% of the US population visited farms one or more times (2000)
– But, agritourism has been growing at a rate of 6% annually
• If customers purchase 16 pounds/pp for freezing/canning– Only need 32,467 customers/visits annually

Destination Tourists
• Many rural areas in the West are located between a major urban center and national/state parks, ski resorts, etc. – Vacation destinations for many foreign and
out-of-state visitors
• Estimating the potential size of these markets requires information on– Where visitors are coming from– Where visitors are returning to

Grand Canyon National Park Example• Consider Grand Canyon National Park (GCNP)
– Attracts around 4.4 million visitors annually• GCNP Statistics at
http://www.nps.gov/grca/learn/management/statistics.htm
• Seasonal visitation is another important item to consider– Annual visits to the GCNP by season
• Winter: 11% of total visits• Spring: 27% of total visits • Summer: 39% of total visits• Fall: 23% of total visits
– Visitation by month at https://irma.nps.gov/Stats/Reports/Park/GRCA

Grand Canyon National Park Example• Where visitors to Grand Canyon National
Park stayed before and after visiting the park
Destination Before After Destination Before AfterFlagstaff, AZ 17.5% 10.6% St. George, UT 1.5% 1.4%Williams, AZ 12.6% 7.3% Scottsdale, AZ 1.4% 1.5%Las Vegas, NV 9.4% 12.7% Zion National Park, UT 1.4% 1.7%Sedona, AZ 6.0% 6.7% Jacob Lake, AZ 1.4% <1%Phoenix, AZ 5.3% 8.0% Kingman, AZ 1.3% 2.1%Tusayan, AZ 4.3% 2.4% Tucson, AZ 1.2% <1%Page, AZ 3.4% 4.0% Holbrook, AZ 1.1% 1.1%Kanab, UT 1.9% 1.4% Albuquerque, NM 1.0% 1.2%Bryce Canyon National Park, UT 1.7% 2.1% Cameron, AZ 1.0% <1%

Grand Canyon National Park Example• Consider a business located between Page, AZ and GCNP
– 3.4% of visitors stayed in Page prior to visiting GCNP– 4.0% of visitors stayed in Page after visiting GCNP
• The average number of visitors who would pass by this business location can be found with the following equation:
• The number of GCNP visitors that would pass by the business location each month averages 13,567– With a low of around 5,970 visitors during the winter months
(11% of total)– And a high of 21,164 visitors during the summer months (39%
of total)
(Total annual visitors)*(Average percentage of visitors) Average monthly visits12
=
(4.4 million visitors)((.034 .040) / 2) 13,567 visitors12
+=

Grand Canyon National Park Example• The Page, AZ business is a farm tourism
venture (hay rides, farm stays, etc.)– Assume venture needs to earn an average of
$10,000 in sales monthly to be viable– Expects average purchase of $25/person
• Calculate the percentage of total visitors to GCNP the venture needs to attract
Monthly sales needed Expected sales per visitor =Percentage of total visitors neededEstimated monthly visitors
$10,000 $25 =2.9%13,567
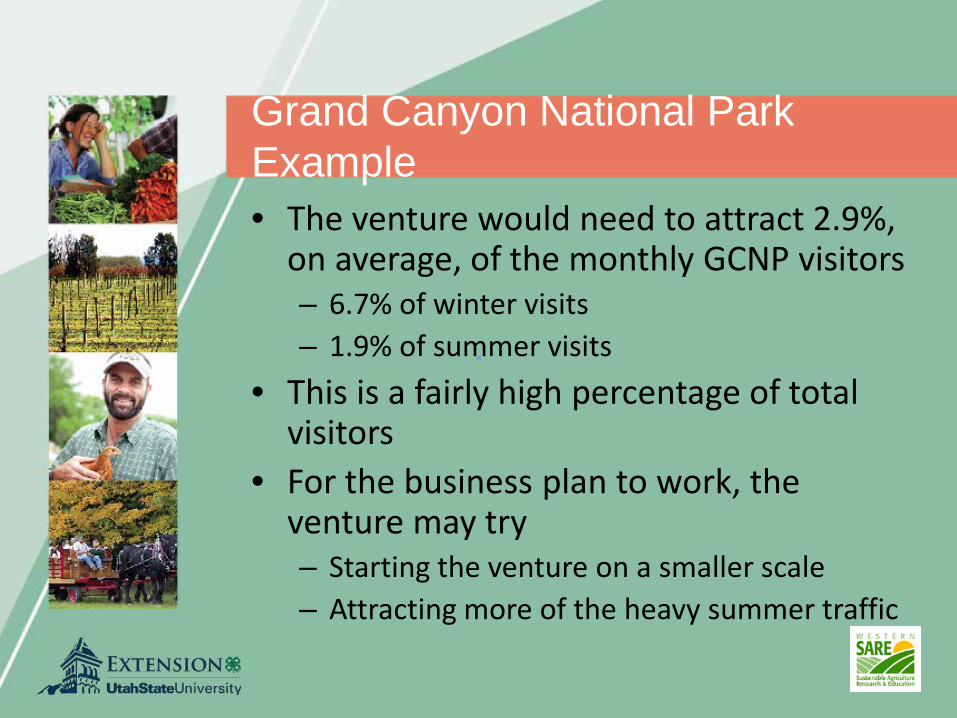
Grand Canyon National Park Example• The venture would need to attract 2.9%,
on average, of the monthly GCNP visitors– 6.7% of winter visits– 1.9% of summer visits
• This is a fairly high percentage of total visitors
• For the business plan to work, the venture may try – Starting the venture on a smaller scale– Attracting more of the heavy summer traffic

Estimate Cost of Production
• Create enterprise budget, by service/product or product groups
• Estimate operating costs– Costs that vary with quantity produced
• Seed, fertilizer, packaging, etc.
• Estimate fixed costs– Costs incurred regardless of production
• Land payments, equipment, etc.
• Calculate break-even cost per unit– Provides lower limit for pricing

Production Costs
5-acres of vegetable production
OPERATING COSTS Land Rental 5 Acres 500.00$ 2,500.00$ 500.00$ Irrigation Water 1 Annual 2,000.00$ 2,000.00$ 400.00$ Utilities 1 Annual 4,700.00$ 4,700.00$ 940.00$ Farm Labor 3800 Hours 10.00$ 38,000.00$ 7,600.00$ Packaging 1 Annual 300.00$ 300.00$ 60.00$ Food Safety/Testing 1 Annual 1,042.00$ 1,042.00$ 208.40$ Marketing 1 Annual 3,100.00$ 3,100.00$ 620.00$ Herbicide 5 Acres 125.00$ 625.00$ 125.00$ Fertilizer 5 Acres 500.00$ 2,500.00$ 500.00$ Seeds 1 Annual 1,800.00$ 1,800.00$ 360.00$ Plants 1 Annual 400.00$ 400.00$ 80.00$ Insecticide 5 Acres 100.00$ 500.00$ 100.00$ Drip Tape 5 Acres 1,000.00$ 5,000.00$ 1,000.00$ Fuel & Lube 1 Annual 2,024.00$ 2,024.00$ 404.80$ Maintenance 1 Annual 1,975.00$ 1,975.00$ 395.00$ Miscellaneous 5 Acres 50.00$ 250.00$ 50.00$
TOTAL OPERATING COSTS 66,716.00$ 13,343.20$
OWNERSHIP COSTSCASH OVERHEAD COSTSLiability/Crop Insurance 800.00$ 160.00$ Accounting & Legal 500.00$ 100.00$ Office & Travel 800.00$ 160.00$ Annual Investment Insurance 236.43$ 47.29$
NONCASH OVERHEAD COSTS (Capital Recovery)Buildings, Improvements, & Equipment 1,689.29$ 337.86$ Machinery & Vehicles 4,680.00$ 936.00$
TOTAL OWNERSHIP COSTS 8,705.72$ 1,741.14$
TOTAL COSTS 75,421.72$ 15,084.34$

Investment Summary
Description Purchase
Price Percentage
Use Purchase
Price Useful Life
(Yrs) Salvage Value
Annual Capital
Recovery Annual
Insurance Annual Repairs
Annual Fuel & Lube
Buildings, Improvements, and Equipment
Hand Tools 500.00$ 100% 500.00$ 5.00 50.00$ 90.00$ 1.83$ 5.50$ -$
Implements 2,500.00$ 100% 2,500.00$ 10.00 250.00$ 225.00$ 9.16$ 27.50$ -$
Packing Shed (8X10) 3,000.00$ 100% 3,000.00$ 15.00 300.00$ 180.00$ 10.99$ 33.00$ -$
Cooler (6X8) 8,000.00$ 100% 8,000.00$ 15.00 800.00$ 480.00$ 29.30$ 88.00$ -$
Drip Irrigation System (5 acres) 5,000.00$ 100% 5,000.00$ 7.00 -$ 714.29$ 16.65$ 50.00$ -$
Sub Total 19,000.00$ 19,000.00$ NA 1,400.00$ 1,689.29$ 67.93$ 204.00$ -$
Machinery and Vehicles
1-26 HP Tractor (used) 10,000.00$ 100% 10,000.00$ 10.00 1,000.00$ 900.00$ 36.63$ 385.00$ 440.00$
1-1/2 Ton Truck 30,000.00$ 100% 30,000.00$ 10.00 3,000.00$ 2,700.00$ 109.89$ 1,155.00$ 1,320.00$
1-4-Wheeler 6,000.00$ 100% 6,000.00$ 5.00 600.00$ 1,080.00$ 21.98$ 231.00$ 264.00$
Sub Total 46,000.00$ 46,000.00$ NA 4,600.00$ 4,680.00$ 168.50$ 1,771.00$ 2,024.00$
Total 65,000.00$ 65,000.00$ NA 6,000.00$ 6,369.29$ 236.43$ 1,975.00$ 2,024.00$
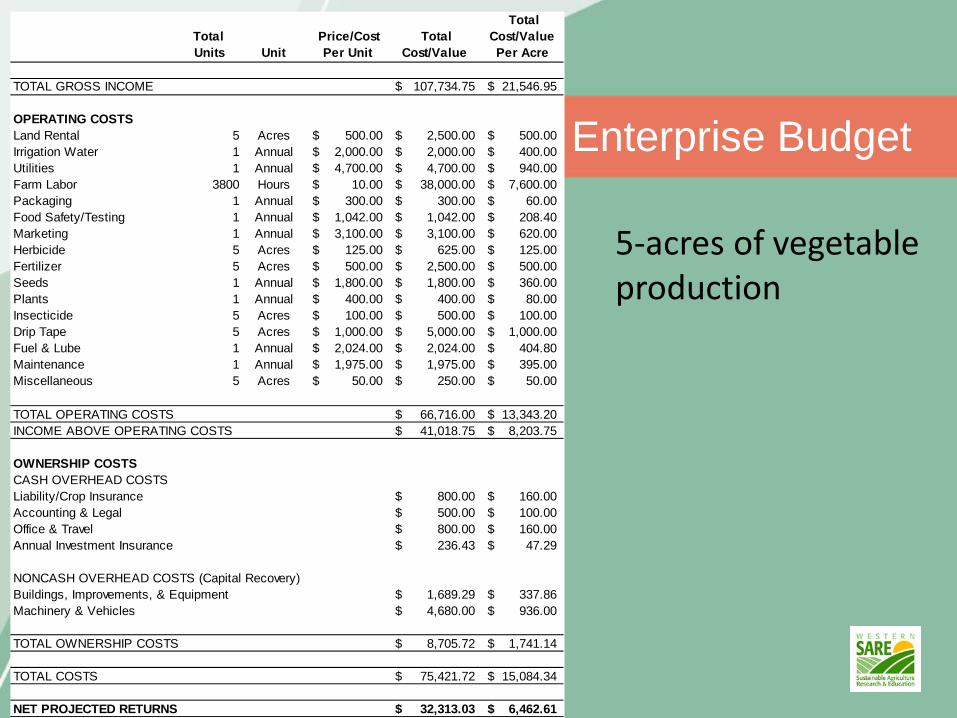
Enterprise Budget
5-acres of vegetable production
Total Units Unit
Price/Cost Per Unit
Total Cost/Value
Total Cost/Value Per Acre
TOTAL GROSS INCOME 107,734.75$ 21,546.95$
OPERATING COSTS Land Rental 5 Acres 500.00$ 2,500.00$ 500.00$ Irrigation Water 1 Annual 2,000.00$ 2,000.00$ 400.00$ Utilities 1 Annual 4,700.00$ 4,700.00$ 940.00$ Farm Labor 3800 Hours 10.00$ 38,000.00$ 7,600.00$ Packaging 1 Annual 300.00$ 300.00$ 60.00$ Food Safety/Testing 1 Annual 1,042.00$ 1,042.00$ 208.40$ Marketing 1 Annual 3,100.00$ 3,100.00$ 620.00$ Herbicide 5 Acres 125.00$ 625.00$ 125.00$ Fertilizer 5 Acres 500.00$ 2,500.00$ 500.00$ Seeds 1 Annual 1,800.00$ 1,800.00$ 360.00$ Plants 1 Annual 400.00$ 400.00$ 80.00$ Insecticide 5 Acres 100.00$ 500.00$ 100.00$ Drip Tape 5 Acres 1,000.00$ 5,000.00$ 1,000.00$ Fuel & Lube 1 Annual 2,024.00$ 2,024.00$ 404.80$ Maintenance 1 Annual 1,975.00$ 1,975.00$ 395.00$ Miscellaneous 5 Acres 50.00$ 250.00$ 50.00$
TOTAL OPERATING COSTS 66,716.00$ 13,343.20$ INCOME ABOVE OPERATING COSTS 41,018.75$ 8,203.75$
OWNERSHIP COSTSCASH OVERHEAD COSTSLiability/Crop Insurance 800.00$ 160.00$ Accounting & Legal 500.00$ 100.00$ Office & Travel 800.00$ 160.00$ Annual Investment Insurance 236.43$ 47.29$
NONCASH OVERHEAD COSTS (Capital Recovery)Buildings, Improvements, & Equipment 1,689.29$ 337.86$ Machinery & Vehicles 4,680.00$ 936.00$
TOTAL OWNERSHIP COSTS 8,705.72$ 1,741.14$
TOTAL COSTS 75,421.72$ 15,084.34$
NET PROJECTED RETURNS 32,313.03$ 6,462.61$

Break-Even Analysis
• Break-even analysis answers the questions – How much needs to be sold to break even?”
• If this quantity fits within potential demand, it may be feasible
• Calculate break-even quantity/volume across a range of prices
– Or– What would the price need to be to break even?
• If the price that would need to be charged is unrealistic, then the idea is not feasible
• Calculate break-even prices across a range of possible volumes

Break-Even Example
• Initial quantity of 20,000 lbs at a price of $.24/lb, or $4,800 in revenue
• Profit is $1,635• Break-even price is
total expenses/number of units (20,000) or $.16/lb
• Break-even quantity is total expenses/price ($.24/lb) or 13,187 lbs
Cost/IncomeRevenue $ 4,800 $ 0.24
ExpensesInputs $ 1,400 $ 0.07Labor $ 1,200 $ 0.06Overhead $ 565Total Expenses $ 3,165
Net Income before taxes $ 1,635Income taxes $ 605Net Income $ 1,030
TotalPer unit (pound)

Estimating Product Price
• Major pricing approaches– Cost-based– Demand-oriented– Competition-oriented
– Not normally used independently

Cost-Based Pricing
• Cost-plus pricing– Price equals total costs divided by number of units– Shortcomings
• Not tied to consumer demand• No incentive to reduce costs• Adjustments for rising costs poor
• Mark-up pricing– Add a percentage to the cost of product (mark-up)– Very popular for retailers and wholesales
• Easy, too many products to estimate demand– Shortcomings
• Not tied to demand• Profit biased by pricing

Retail Distribution Example• Plan to sell product retail (local tourist shop)• Set pricing at retail level and then evaluate
demand– Ask wholesales and retailers what margin they
require• Example
– $5.00 cost of production• Multiply by 1.25 for wholesale price (Average 20-30%)
– $6.25 wholesale• Multiply by 1.40 for retail price (Average 30-50%)
– $8.75 retail • Will consumers pay $8.75?• Need to use this price at all outlets

Demand-Oriented Pricing
• Price at customer value (willingness to pay)• Price skimming
– Charge high price at first to pick up consumers willing to pay more
– Gradually reduce price to pick up consumers who are more price sensitive
• Penetration pricing– Initial low price to capture market share– Discourages competition– Price is increased later when consumers are
hooked– Common in new food products

Determinants of Consumer Price Sensitivity• Perceived substitute effect
– How many substitutes exist?– If many, then consumers more price sensitive
• Unique value effect– Increase market share through differentiation– Consumers less price sensitive if “unique”
product/service • Switching cost effect
– Cost of changing from one product to another– People are reluctant to change and seek out new
information– Consumers less price sensitive if large switching
costs

Determinants of Price Sensitivity
• Difficult comparison effect– Hard to compare products/services, then
consumers less price sensitive• Price-quality effect
– Often associate a higher price with higher quality
• Expenditure effect– Consumers more sensitive to price changes
on large, expensive products than small, inexpensive ones
• Price changes on meat compared to salt

Determinants of Price Sensitivity
• Fairness effect– Impacted by what they consider fair - (sense
of value-added)• Inventory effect
– Seasonality affects price sensitivity• Higher demand for steak in summer due to
outside grilling
• End-benefit effect– May be willing to pay more for products that
protect the environment, preserve open space, support family farms, etc.

Competition-Oriented Pricing
• Simple form of pricing• Ideal when similar products exist• Penetration pricing
– Lower than competition pricing – Stimulate demand
• Parity pricing– Equals competition pricing
• Premium pricing– Higher than competition pricing– Signal quality

Competitive Analysis
• How many competitors operate in the market?
• Are competitors large or small? Near or far?
• What types and numbers of products do they sell?
• What pricing methods do they use?

Consider External Factors
• Distribution – Wholesale and retail margins– Transportation and packaging costs
• Environmental factors– Taxes, weather events, fad diets, energy
policy
• Legal/regulatory factors– Labeling, certification, permits, safety

Pomegranate Juice Pricing Example• Produce and sell juice at specialty/health stores• Cost of production is $.80 per 8 oz. juice
– $.80 cost of production (multiply by 1.20)– $.96 cost with profit (multiply by 1.25)– $1.20 wholesale price (multiply by 1.40)– $1.68 minimum retail price required
• $1.47 per 8 oz. retail price (ERS, 2013)– Pricing data is US average, specialty retail price may
be much higher – Target market may be willing to pay more (health
benefits, families with children, seniors, etc.)– What packaging, labeling, etc. may differentiate the
product?

U-Pick Pricing Example
• Strawberry u-pick operation– 10,000 pounds per acre– $23,600 in revenue per acre
• $2.36 per pound retail price (ERS, US Average 2013)
– $18.88 in revenue per person • Average consumption is 8 pounds/year (ERS,
2014)
• Need to know the cost of production (including visitor services, permits, etc.)

U-Pick Pricing Example
• Considerations– Visitors may purchase much more than 8 pounds
(processing, events, etc.) – Visitors may be willing to pay more or less than
retail depending on…• Experience
– Family outings, may pay much more per pound for the farm experience
• Amount purchased– Bulk purchases for canning, freezing, etc., may pay
less per pound• Specialty item
– For organic, and other specialty labels or designations may pay more per pound
– $3.48 organic wholesale price per pound (ERS, San Fran 2013)
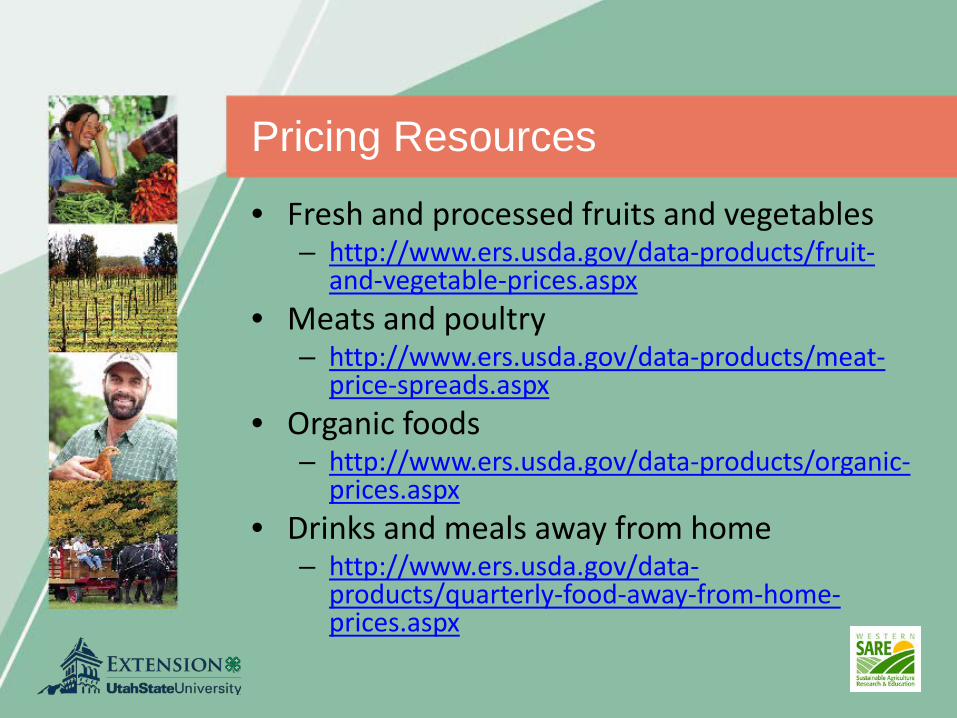
Pricing Resources
• Fresh and processed fruits and vegetables – http://www.ers.usda.gov/data-products/fruit-
and-vegetable-prices.aspx• Meats and poultry
– http://www.ers.usda.gov/data-products/meat-price-spreads.aspx
• Organic foods– http://www.ers.usda.gov/data-products/organic-
prices.aspx• Drinks and meals away from home
– http://www.ers.usda.gov/data-products/quarterly-food-away-from-home-prices.aspx

Activity
• Worksheet 5.1: Potential Volume– Identify 1-2 target consumer groups– Where are they coming from? – Where are they headed?– How many do you estimate?– What quantities will they use/buy?

Thank you!