farm operator perceptions of barriers to the use of
TRANSCRIPT
Farm Operator Perceptions of Barriers to the Use of Irrigation in Alabama— 1 —
INTRODUCTION AND OBJECTIVES Though Alabama generally receives abundant rainfall, precipitation is often inconsistent during the summer months when plants are most in need of water (Ayars et al. 2006). Without irrigation, the productivity of tree crops, cereals, and vegetables diminishes, as does the livelihood of farmers that grow them (Bai 2008). Irrigation can provide water when plants need it most, reducing stress and enhancing yield quantity and quality (ACES 2011a). Un-derstanding the barriers to the adoption of irrigation techniques is vital for increasing the use of such methods (Bjornlund, Nicol, and Klein 2009). Much of the literature on irrigation adoption and management is based on conditions in arid regions that receive less than 6 inches (150 millime-ters) of annual rainfall. Thus, frequent irrigation is necessary to maximize yields. Irrigation plays a different role in Alabama farming systems than it does in arid regions of the world, and it faces a different set of environmental constraints and advantages, in particular the abundance and reliable annual renewal of ground and surface water resources. Annual rainfall in Alabama averages more than 48 inches (1200 millimeters). But even in areas with abundant rainfall, drought stress can begin in as little as three days after a 25 millimeter rain or irrigation in such crops as tomatoes in soils like those in the Piedmont of Alabama (ACES 2011b). This study profi les Alabama farm operators’ irrigation practices, equip-ment, and water sources. Specifi cally, the study aims to identify the barriers to
Alabama Agricultural Experiment StationWilliam Batchelor, Director
Auburn University, Auburn, Alabama
Farm Operator Perceptions of Barriersto the Use of Irrigation in AlabamaJ. J. Molnar, E. Sydnor, D. Rodekohr, M. Runge, and S. Fowler
Molnar is a professor, Sydnor a graduate student, Runge an Extension program associate, and Fowler an associate professor in the Department of Agricultural Economics and Rural Sociology. Rodekohr is an advisor in the Department of Agronomy and Soils. All are at Auburn University.
Bulletin 674April 2011
A
A B
C
irrigation adoption and to provide information to policy-makers, farmers, and others to provide a greater understanding of how irrigation adoption affects the prosperity of small and medium-size farms (Whittenbury and Davidson. 2009). This report addresses farm operators’ views on the needs and condi-tions shaping expanded use of irrigation among small, medium-size, and large farms. Objectives of the study were as follows: ▪ Profi le the perceptions of irrigation technology as a risk reduction and productivity enhancement tool in Alabama agriculture; ▪ Measure attitudes, beliefs, and concerns about the barriers and im-pacts to the adoption of irrigation technology by Alabama producers; and ▪ Assess the willingness of Alabama farm operators to adopt irrigation technology.
BACKGROUND In general, the sociological literature on agricultural innovation views the adoption of innovations as a decision-making process that is infl uenced by a variety of factors, including (1) characteristics of the farm; (2) charac-teristics of the decision maker, usually represented by the owner or manager; (3) characteristics of the technology or innovation itself; and (4) the social, institutional, and political context (Ajzen 1985; Branch and Poremba 1990). Irrigation is used in many ways depending on the cropping system and size of operation. In general, irrigation is considered a lumpy input, which is a change in a farming system that cannot be adjusted in small quantities (Green et al. 1996). Typically, the capital investment required for larger applications cannot be recovered in a single season although a simple sprinkler system for a small vegetable farm might. While the irrigation technology used in Alabama is similar to that used in arid regions, Alabama irrigators use that technology in quite different ways. Irrigation is a supplement to natural rainfall for most of the growing season in the State; irrigation provides a critical insurance that suffi cient soil moisture will be available when needed during periods of drought or inconsistent rain-fall. Farmers seek to install irrigation systems when expected returns justify the investment through yield stability, enhanced product quality, and reduced risk of crop loss (Sydnor 2010; Molnar, Bitto, and Brant 2001).

Farm Operator Perceptions of Barriers to the Use of Irrigation in Alabama— 2 —
From an economic constraint perspective, adoption is limited by bank monetary and loan policies, farm assets and liabilities, and the cost-returns on the irrigation investment. Government policies that cost-share, subsidize, or lim-it irrigation use also affect operators’ decisions (Dinar, Campbell, and Zilberman 1992). Bjornlund et al. (2008) argue that the major drivers of irrigation adoption are securing water availability to plants during drought, increasing quantity and quality of crops, and saving costs. In an Australian study, the motivation for growers of tree crops to change orchard irrigation management practices was not that they needed to save water or to increase water-use effi ciency. Instead, grow-ers were changing practices in order to save time irrigating, to improve the scope for managerial fl exibility in the orchard, or when redeveloping their orchard for a closer planting design (Boland, Bewsell, and Kaine 2005). These fi ndings sug-gest that producers are more likely to respond to an extension program coupled with a broader program of farm changes. Drainage policies and water scarcity are generally not limiting factors for the advancement of irrigation practice in Alabama as they are in the arid west. However, diverse and fragmented farm landscapes, uncertain market conditions, and operator perspectives on new technologies often shape the advance of agri-cultural technologies in the State (Negri and Brooks 1990).
METHODSample and Data Collection This study uses survey data from a statewide sample of Alabama farm operators to explore barriers to the adoption of irrigation. Survey data were col-lected by mail using a self-administered survey instrument adapted from the 2003 USDA Census of Agriculture Farm and Ranch Irrigation Survey. It also addressed issues specifi c to Alabama, such as producer knowledge of State water requirements. The questionnaire was a 12-page document, following the Dillman meth-od (Dillman, Smyth, and Christian 2009). Along with a cover page, an informa-tional letter was incorporated into the questionnaire. The questionnaire included 32 questions of primarily Likert-type form. An additional page was provided for any open-ended producer comments. The survey was distributed by the United States Department of Agriculture National Agricultural Statistics Service (USDA
NASS) in Montgomery, Alabama, through its regional print mail center in Jack-son, Mississippi. The target population consisted of producers who farm 100 or more acres of land in fi eld crops or produce, as well as those with 15 or more fruit, nut, or vegetable acres. The sampling frame for this study was the USDA NASS list of agricultural row crop, vegetable, and fruit-tree crop farmers in Alabama. This list is continually updated by obtaining current information from a variety of local and state sources. A random sample of farmers was surveyed about the extent of their irrigation practices and the problems they experienced in the irrigation process. Analysis The tables presented in this report tabulate the survey data in terms of whether or not the farm was irrigated in the previous year and the size of the operation. Farm size was represented in three categories of total farm acres that divided the sample into relatively equal groups: small, less than 200 acres (N = 266); medium, 201 to 800 acres (N = 264); and large, more than 800 acres (N = 264). This study did not consider type of commodity produced per se, as there were small numbers of respondents in the sample, across many different veg-etable, fi eld, and tree crops. The column heading “all” refers to percentages for all respondents across farm size category and irrigator status. The percentages refer to the proportion of that column that responded “yes” to the particular survey item or ticked the indicated response, e.g., “some” or “agree.” We annotated statistically signifi cant differences by size and irrigation status according to chi-square (X2) tests on cell frequencies but focused mainly on patterns of percentage response to the survey items. The sample is largely representative of the population of Alabama farm operators from which it was drawn. The narrative reviews the pattern of responses across farm size among irrigating and nonirrigating farms. We note the overall distribution of responses and identify trends or contrasts in response that contribute to understanding the objectives of the study.

Farm Operator Perceptions of Barriers to the Use of Irrigation in Alabama— 3 —
RESULTSReasons for Not Irrigating Table 1 tabulates a series of reasons for not using irrigation by whether or not the operator used irrigation and the size of the operation. The reasons are listed in ranked order according to the proportion of the overall sample that cited each reason. Suffi cient soil moisture was the most frequently cited reason for not ir-rigating for all the producers and the responses did not vary across categories of the tabulation variable. Rain saves energy costs as well as wear and tear on equipment. About two-thirds of the operators without irrigation said that not be-ing able to afford the investment required was the main reason that they did not use irrigation. Among those with some form of irrigation already in use on their farms, about a third cited the investment required as a reason for not irrigating. The asterisk in the table notes that this difference and others were statistically signifi cant across categories of farm size and irrigation status. Small profi t margins were mentioned as a barrier by about half of those without irrigation, but only a quarter of those with irrigation. The largest per-centage among the irrigators, 31 percent of the large farm operators, said that profi t margins were a reason for not irrigating. High energy costs were indicated as a reason for not irrigating by about half of those presently without irrigation. Energy costs were cited by 11 per-cent of the small operations, but 28 percent of the large operations noted en-ergy costs as a reason for not irrigating. A shortage of surface water was a reason given by nearly half the nonir-rigating farmers. Among those with irrigation, 34 percent of the large opera-tors cited water supply limits as a reason for not irrigating, compared to 11 percent of small operators. A shortage of ground water was a problem for a third of the respondents. It was a reason for not irrigating for nearly 40 percent of those without irriga-tion and was more of a problem for large farms than small farms. Not irrigating because one does not own the land was a reason given by 29 percent of all operators. Large farm operators (both irrigating and nonirrigat-ing) were more likely to cite this reason for not irrigating. Investing in land one rents may not make sense without a long-term lease, cost-sharing arrangements with the land owner, or compensation provisions in the event the lease is not re-
newed. Larger systems require larger investments and longer payback periods. Not irrigating because the operator planned to quit farming was cited by 23 percent of the small farm operators without irrigation. Seven percent or less of the operators with irrigation noted this reason. About 16 percent of those sampled said that a lack of reliable informa-tion on irrigation methods was a reason for not irrigating. Equipment failure was more a problem for large farm operators, 9 percent. Water pollution was a reason cited by 4 percent of the sample, mainly for those without irrigation systems already in place. Neighbors’ objections were again more of a problem for those without irrigation and larger operations, 3 percent overall.
Table 1. Reasons for Not Irrigating, Alabama Farm Operators, 2009 —————Acreage size——————— —Nonirrigating— ——Irrigating—— AllReasons for not irrigating Small1 Med. Large Small Med. Large ————————percent—————————Suffi cient soil moisture 74 71 76 68 75 77 74
Could not afford the investment** 61 76 73 27 34 34 61
Profi t margins are too small 52 63 61 24 27 31 51 to invest in irrigation equipment**Irrigation is uneconomical due to 42 55 55 11 20 28 43 high energy costs*Did not irrigate due to a shortage 32 47 46 11 14 34 37 of surface water*Did not irrigate due to a shortage 27 44 42 13 7 24 33 of ground water*Do not own the land that could be 22 32 44 8 14 31 29 irrigated*Plan to quit farming ** 23 19 16 5 7 5 16
Hard to get reliable information 17 19 20 6 9 5 16 on different irrigation methodsIrrigation equipment failure** 6 7 11 7 7 17 9
Pollution of water source 4 4 6 3 0 0 4
Neighbors object to irrigation operation 2 4 6 2 0 2 3
Number 204 220 178 62 44 86 7941Chi-square test: *p < .05; **p < .001

Farm Operator Perceptions of Barriers to the Use of Irrigation in Alabama— 4 —
Barriers to Implementation Table 2 presents a series of potential barriers to installing or improving irrigation systems tabulated by farm size and use of irrigation. The items are ordered in terms of proportion of the sample. The percentages summarize the proportion citing each items as “some” or a “great” barrier. Installation costs were the most frequently cited barrier to implementa-tion or improvement, 64 percent overall. More of those with presently installed systems cited this reason, perhaps because they were more directly familiar with actual costs. This was true for each size category, but operators of large farms cited this barrier the most, 78 percent. High energy costs were mentioned by 62 percent of the respondents. Small operators were less sensitive to this barrier. Financing the improvements was a barrier for 57 percent of the sample although fewer small operators cited this barrier. About half the sample indi-cated that the returns from irrigation would not cover installation costs. Opera-tors of large farms were more likely to feel this way. They also tended to feel that irrigation system operating costs were too risky. About half the sample indicated this as “some” or a “great” barrier. Lack of a reliable source of water was a barrier for 44 percent of all re-spondents. More medium-size and large operations indicated this as a barrier. About 38 percent said that getting good advice on how to make irriga-tion pay was a problem. More medium-size farm operators indicated this. About a third felt that water conservation improvements had no eco-nomic benefi ts. A similar proportion, mainly nonirrigators, felt that irrigation takes too much time to organize and manage. A third, particularly the nonir-rigators, felt that irrigation was not worth the trouble to keep it going. About a quarter of the respondents felt that not having other farmers around them using irrigation was a problem. Somewhat less felt that diffi culty in obtaining replacement parts was a barrier to implementing or improving ir-rigation.
Table 2. Barriers to Implementing or Improving Irrigation, Alabama Farm Opera-tors, 2009 —————Acreage size———————Barriers to installing or —Nonirrigating— ——Irrigating—— Allimproving irrigation Small1 Med. Large Small Med. Large ————————percent——————————Installation cost* 51 69 69 55 71 78 64
Energy costs are too high** 49 70 66 55 61 69 62
Cannot fi nance the improvements, 49 64 58 47 61 59 57 even if they reduce costs**Improvement(s) will reduce costs, 42 52 55 40 61 69 51 but not enough to cover installationIrrigation system operating costs 44 58 60 34 36 42 50 are too risky**No reliable source of water 32 53 52 27 27 51 44 on my place**Cannot get good advice on how 35 45 42 27 41 25 38 to make irrigation pay**Do not need irrigation 36 47 33 26 23 24 36 for the way I farm**Improvements that conserve water 28 34 38 36 34 37 34 have no economic benefi t Takes too much time to organize 32 42 37 31 18 19 34 and manage**Not worth the trouble to keep it going** 31 33 35 31 16 22 33
Landlord(s) will not share in cost 17 38 47 16 18 47 33 of improvements**No other farmers around here irrigate** 26 38 30 21 16 8 27
Hard to get replacement parts 17 26 22 15 16 21 21 when I need them**Number 204 220 178 62 44 86 7941Chi-square test: *p < .05; **p < .001

Farm Operator Perceptions of Barriers to the Use of Irrigation in Alabama— 5 —
Helpfulness of Irrigation Information Sources Table 3 represents how helpful various outlets of information were in im-plementing or improving irrigation. Respondents described each as “somewhat helpful,” “very helpful,” or “not helpful.” The percentages shown are the pro-portion rating each information source as “not helpful.” The items are ordered based upon the proportion rating the information source as “not helpful.” Media reports and information from the press was the most “not help-ful” information source of those listed, with 59 percent rating them as “not helpful.” This may be due to the generality and lack of practical insight avail-able from these sources. Private irrigation specialists or consultants (45 percent) and the Ala-bama Offi ce of Water Resources (44 percent) were ranked next as “not help-ful” sources of information about implementing or improving irrigation. Op-erators of medium-size farms with irrigation particularly found the Alabama Offi ce of Water Resources to be “not helpful,” 79 percent. More than a third (37 percent) of respondents found Internet websites to be “not helpful” as well. While the Internet may be an easily accessible form of information, it may not offer the specifi city desired for a complex farm situation. Less than a third rated USDA-NRCS specialists as “not helpful”; how-ever, small farm operators with irrigation were particularly critical, 54 percent. Small farm operators (both with and without irrigation) gave more “not helpful” ratings to irrigation equipment dealers than did medium-size or large farm operators. Extension specialists and Auburn University researchers re-ceived “not helpful ratings” from less than 30 percent of the sample. Respondents found other farmers with irrigation to be the least “not helpful” and informative about irrigation; less than a quarter of farmers (23 percent) found their peers to be “not helpful” information sources.
Table 3. Irrigation Information Sources Rated as Not Helpful, Alabama Farm Operators, 2009 —————Acreage size——————— —Nonirrigating— ——Irrigating—— AllInformation sources Small1 Med. Large Small Med. Large —————————percent——————————Media reports or information 59 54 47 69 75 74 59 from the press*Private irrigation specialists 56 41 30 62 49 53 45 or consultants*Alabama Offi ce of Water Resources** 39 37 30 68 79 57 44
Internet websites* 41 35 27 50 38 47 37
Specialists from the USDA- 36 27 21 54 47 31 31 Natural Resources Conservation Service*Irrigation equipment dealers** 47 36 21 42 22 13 31
County or regional extension agents* 33 26 19 36 31 38 29
Auburn University specialists 31 24 13 38 40 19 25 or researchers*Other farmers with irrigation * 34 24 12 32 16 17 23
Number 101 140 116 39 35 73 5041Chi-square test: *p < .05; **p < .001
Information sources about irrigation include Extension agents and Internet websites.Source: www.aces.edu/anr/irrigation

Farm Operator Perceptions of Barriers to the Use of Irrigation in Alabama— 6 —
Type of Irrigation Systems Table 4 shows the type of irrigation systems employed by respondents. Due to the questionnaire format, many respondents skipped this set of ques-tions. Thus, the level of those not reporting is high. Center pivots were the most commonly used irrigation system, particu-larly among medium-size and large farm operators. Low pressure pivots were most common among small operators, as were sprinkler systems. About 70 percent of the respondents said they used another system or did not report.
Table 4. Type of Systems, Alabama Farm Operators, 2009 ———Acreage size——— ——Irrigating—— AllType of systems Small Medium Large ——————percent—————Center pivot high pressure (60+ PSI)* 5 18 16 13
Linear and wheel move systems 8 2 4 5
Center pivot medium pressure (30 to 59 PSI) 0 7 5 4
Drip, low fl ow, or trickle 2 5 2 3
Center pivot low pressure (< 30 PSI) 3 2 2 3
Sprinkler irrigation* 7 0 0 2
Hand move method 0 0 0 0
Other system or not reporting 76 66 71 71
Number 62 44 86 1921Chi-square test: *p < .05; **p < .001
Types of irrigation systems used by Alabama farm operators include center pivot (above, top), sprinkler (above), and drip (right).

Farm Operator Perceptions of Barriers to the Use of Irrigation in Alabama— 7 —
Table 5. Reasons for Discontinuing Irrigation, Alabama Farm Operators, 2009 ——Acreage size—— ——Irrigating—— All Reasons for discontinuing irrigation Small Medium Large —————percent————Discontinued irrigation in 2008 long enough 17 23 34 26 to affect crop yields
Shortage of surface water* 3 14 19 12
Irrigation equipment failure 7 7 15 10
Pumping cost 3 7 7 6
Shortage of ground water 3 2 8 5
Irrigation cost of water 7 7 1 4
Poor water quality 2 2 2 2
Problems with hired labor 2 0 2 1
Loss of water rights 0 2 1 1
Number 62 44 86 1921Chi-square test: *p < .05; **p < .001
Reasons to Discontinue Irrigation For those farmers who had to discontinue irrigation in 2008 long enough to affect crop yields, Table 5 tabulates a series of possible reasons for doing so. The reasons are listed in ranked order according to the proportion of respon-dents out of the overall sample who discontinued due to that reason. Respon-dents cited each as “somewhat of a reason” or “a major reason” for discontinu-ing irrigation. The percentages shown are the sum of the two ratings. About a quarter of respondents, 26 percent, reported discontinuing ir-rigation in 2008 long enough to affect crop yields. The most commonly cited reason for doing so was a shortage of surface water, 12 percent. Another 5 percent discontinued irrigation due to a shortage of ground water. Ten percent stopped irrigation due to irrigation equipment failure, which may cost money to repair or refl ect delays in getting service. Also, water pump-ing costs were a cause of irrigation cessation for 6 percent of respondents. The cost of water was another reason for discontinuing irrigation in 2008, as re-ported by 4 percent of the total sample. However, poor water quality, problems with hired labor, and loss of water rights accounted for only 4 percent of irrigation discontinuation. Thus, fi nancial considerations seem to play a central role in irrigation discontinua-tion, whether money is spent for the repair of irrigation equipment, for water from off-farm sources due to water shortages, or for pumping costs.

Farm Operator Perceptions of Barriers to the Use of Irrigation in Alabama— 8 —
Table 6. Sources of Irrigation Water, Alabama Farm Operators, 2009 ——Acreage size—— ——Irrigating—— All Sources of irrigation water Response Small Med. Large ————percent———Did you have to pay for water for irrigation?** Yes 36 14 2 17
Ground water from a well or wells located on this farm or another farm** Some 11 31 30 24 Main Source 47 16 22 28
On-farm fl owing surface supply (stream, spring, or river)* Some 7 21 34 20 Main Source 13 27 33 24
On-farm standing water body surface supply (lake, pond or reservoir)** Some 7 19 31 19 Main Source 18 27 21 22
Off-farm water suppliers (commercial company or community water system)** Some 7 5 0 4 Main Source 18 7 0 8
Number 62 44 86 7941Chi-square test: *p < .05; **p < .001
Sources of Irrigation Water Table 6 shows which sources respondents used most frequently for ir-rigation water. The respondents’ usage of the listed sources is ranked in order according to the proportion of the overall sample. Respondents ranked the sources as either “some” of their water source or the “main source” of irriga-tion water for their system. Most respondents reported using water that was on their farm or nearby for irrigation. Fifty-two percent reported using ground water from a well(s) located on their own farm or another farm (some, 24 percent; main source, 28 percent). The highest percentage, 47 percent, was among operators of small farms. Overall 44 percent used an on-farm fl owing surface supply, such as a stream, spring, or river. Most of these producers were on large farms; 67 per-cent of large farms used such sources to some extent as irrigation water and 33 percent used on-farm fl owing water as their main source. Forty-one percent of producers reported using an on-farm standing wa-ter body surface supply, such as a lake, pond, or reservoir, as a source of irriga-tion water; 19 percent used a standing water body for some, and 22 percent as their main source of irrigation water. Seventeen percent of respondents reported paying for irrigation water. More than a third of the small operators paid for water, while only 2 percent of the large operators did so. Twelve percent of the respondents reported get-ting some or most of their irrigation water from off-farm water suppliers, such as a commercial company or municipal or community water system (some, 4 percent; main source, 8 percent). Most of these respondents were from small farms, with 18 percent using off-farm water suppliers as their main source and 7 percent for some of their water sources. No large farm operators reported using off-farm suppliers.
A reservoir is one type of on-farm standing water body used for irrigation by Alabama farmers.

Farm Operator Perceptions of Barriers to the Use of Irrigation in Alabama— 9 —
Table 7. Energy Sources for Pumping Water, Alabama Farm Operators, 2009 ——Acreage size—— ——Irrigating—— All Sources of energy Small Medium Large —————percent————Diesel** 21 50 83 51
Electricity (regular farm rates) 57 52 44 51
Water pressure from water system** 19 7 0 9
Gasoline 8 11 2 7
Electricity (special farm rates) 3 2 8 5
Wind or another natural source 5 0 1 2
Number 62 44 86 1921Chi-square test: *p < .05; **p < .001
Energy Source for Pumping Water Table 7 shows which energy sources respondents used most frequently for pumping irrigation water. The items are ordered in terms of proportion of the entire sample. Respondents checked all that applied to their irrigation op-eration. Diesel and electricity were the most highly reported sources of energy for pumping irrigation water, 51 percent each. Diesel was the main source of energy for 83 percent of the large farms and 50 percent of medium-size farms, but only 21 percent of small farms. Electricity with regular farm rates was also reported to be used by 51 percent of respondents; it was used most frequently by small farm operators (57 percent), 52 percent of medium-size farm operators, and 44 percent of large farm operators for pumping. Electricity with special farm rates was used by only 5 percent, mostly by large farm operators (8 percent). Only 9 percent reported using water pressure from a water system as an energy source for pumping water. Of these operators, 19 percent were from small and 7 percent were from medium-size farms, while no large farmer op-erators reported using water pressure for pumping. Gasoline was used by 7 percent, mostly by operators of medium-size farms (11 percent). Wind or other natural sources were the least-used energy source reported, used by only 2 percent. Five percent of small farm operators used wind or another natural source, no operators of medium farms did, and only 1 percent of operators of large farms used natural energy sources.

Farm Operator Perceptions of Barriers to the Use of Irrigation in Alabama— 10 —
Table 8. Purpose for Using Irrigation, Alabama Farm Operators, 2009 ——Acreage size—— ——Irrigating—— All Purposes for irrigation use Response Small Med. Large ——————percent—————Row crops such as corn, cotton, soybeans, etc.** Some 15 32 30 26 Most 5 18 22 15
Fruit, vegetables, horticulture, or specialty crops** Some 45 18 14 26 Most 36 30 5 23
Pasture or hay land** Some 7 16 14 12 Most 3 2 1 2
Number 62 44 86 1921Chi-square test: *p < .05; **p < .001
Purpose for Using Irrigation Table 8 shows the extent to which respondents irrigated three categories of crops. The items are ordered in terms of proportion of the entire sample. Respondents indicated whether they irrigated row crops, fruit or vegetables, or pasture or hay land to “some” extent or if those crops were irrigated the “most.” Overall, 41 percent of all respondents irrigated some or most of their row crops. Row crops such as corn, cotton, and soybeans were irrigated to some extent by 26 percent and were irrigated the most by 15 percent. Op-erators of medium-size and large farms each irrigated row crops 52 percent. Only 20 percent of small farm operators, however, irrigated row crops to any extent. Forty-nine percent of respondents irrigated their fruit, vegetable, horti-culture, or specialty crops in 2008 (some, 26 percent; most, 23 percent). The greatest percentage of operators irrigating these types of crops operated small farms; 45 percent of small farm respondents irrigated them to some extent and 36 percent for the most part. Large farm operators irrigated these types of crops the least, 19 percent. Only 14 percent of respondents reported irrigating pasture or hay land at all (some,12 percent; most, 2 percent). Operators of medium-size farms report-ing irrigating pasture or hay land more than small or large farm operators, 18 percent.
Drip irrigation is used for tomato production by some Alabama farm operators.
Farm Operator Perceptions of Barriers to the Use of Irrigation in Alabama— 11 —
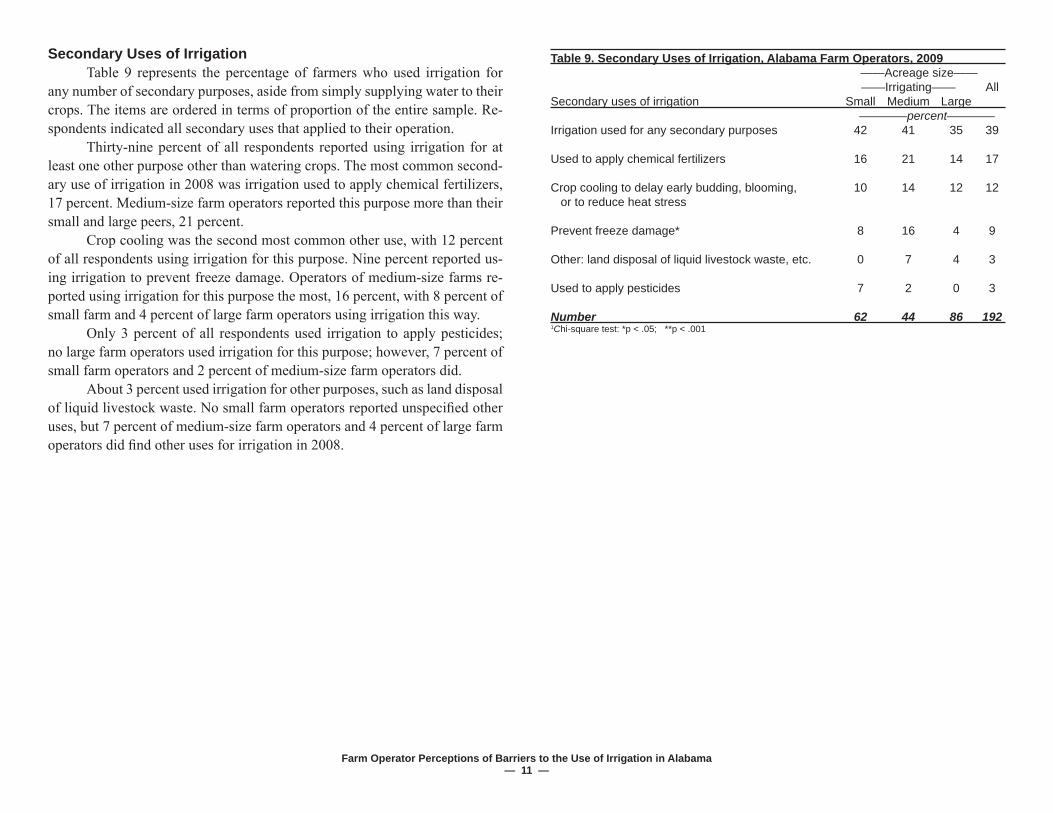
Table 9. Secondary Uses of Irrigation, Alabama Farm Operators, 2009 ——Acreage size—— ——Irrigating—— AllSecondary uses of irrigation Small Medium Large ————percent————Irrigation used for any secondary purposes 42 41 35 39
Used to apply chemical fertilizers 16 21 14 17
Crop cooling to delay early budding, blooming, 10 14 12 12 or to reduce heat stress
Prevent freeze damage* 8 16 4 9
Other: land disposal of liquid livestock waste, etc. 0 7 4 3
Used to apply pesticides 7 2 0 3
Number 62 44 86 1921Chi-square test: *p < .05; **p < .001
Secondary Uses of Irrigation Table 9 represents the percentage of farmers who used irrigation for any number of secondary purposes, aside from simply supplying water to their crops. The items are ordered in terms of proportion of the entire sample. Re-spondents indicated all secondary uses that applied to their operation. Thirty-nine percent of all respondents reported using irrigation for at least one other purpose other than watering crops. The most common second-ary use of irrigation in 2008 was irrigation used to apply chemical fertilizers, 17 percent. Medium-size farm operators reported this purpose more than their small and large peers, 21 percent. Crop cooling was the second most common other use, with 12 percent of all respondents using irrigation for this purpose. Nine percent reported us-ing irrigation to prevent freeze damage. Operators of medium-size farms re-ported using irrigation for this purpose the most, 16 percent, with 8 percent of small farm and 4 percent of large farm operators using irrigation this way. Only 3 percent of all respondents used irrigation to apply pesticides; no large farm operators used irrigation for this purpose; however, 7 percent of small farm operators and 2 percent of medium-size farm operators did. About 3 percent used irrigation for other purposes, such as land disposal of liquid livestock waste. No small farm operators reported unspecifi ed other uses, but 7 percent of medium-size farm operators and 4 percent of large farm operators did fi nd other uses for irrigation in 2008.

Farm Operator Perceptions of Barriers to the Use of Irrigation in Alabama— 12 —
Table 10. Basis for Deciding When to Apply Water, Alabama Farm Operators, 2009 ——Acreage size—— ——Irrigating—— AllBasis for deciding when to use irrigation Small Medium Large ————percent————Observation of crop condition** 63 86 93 81
Feel of soil 36 43 41 40
Applied water based on other methods 16 11 14 14
Use of soil moisture sensing devices 7 11 8 9
Decided when to apply water by computer simulation 2 5 7 4 models
Media reports on crop-water needs 8 0 5 4
Use of commercial scheduling service 2 2 1 2
Number 62 44 86 1921Chi-square test: *p < .05; **p < .001
How Farmers Decided When to Irrigate Table 10 tabulates a series of methods farmers used for deciding when to use irrigation by the size of the operation. The reasons given are listed in ranked order according to the proportion of the overall sample that cited each reason. Farmers indicated all methods that they used in 2008. Technology was not widely used to make decisions on water applica-tion by Alabama operators. The majority of respondents, 81 percent, decided whether to apply water to their crops by observation of crop condition. An overwhelming 93 percent of large farm operators used crop observation, along with 86 percent of medium-size farm operators and 63 percent of small farm operators. Forty percent of all respondents used the feel of the soil as the basis for deciding when to apply water to their crops. Only 9 percent used soil moisture sensing devices, and only 4 percent based their decision to irrigate based on media reports on crop-water needs. Another 4 percent decided when to apply water by computer simulation models, and only 2 percent used a commercial scheduling service. Fourteen percent of the total population, however, applied water based on some other unspecifi ed method. Respondents, then, typically did not use more technically based meth-ods to decide when to apply water. Instead, they relied on their own knowledge of crop and soil conditions to decide for themselves when to irrigate.
Information from soil moisture sensing devices (Watermark soil mois-ture sensor, left, and electronic meter, right) is used by some Ala-bama farm operators as a basis for deciding when to use irrigation. Source: Moisture Sensor Agricultural Irrigation Design Manualwww.irrometer.com/pdf/supportmaterial/ADG2006.pdf

Farm Operator Perceptions of Barriers to the Use of Irrigation in Alabama— 13 —
Table 11. Irrigation Improvements Implemented, Alabama Farm Operators, 2009 ——Acreage size—— ——Irrigating—— AllIrrigation improvements implemented in 2008 Small Medium Large ————percent————Expanded acres covered by irrigation* 24 27 40 32
Retrofi tted sprinkler system for low pressure operation** 8 18 34 22
Made irrigation changes that reduced water requirements 18 18 22 20
Made irrigation changes that decreased energy costs** 7 16 30 19
Made irrigation changes that improved crop yield 18 23 13 17 or quality
Adopted irrigation scheduling as a management practice* 13 16 7 11
Changed energy source for pumping 3 9 15 10
Added moisture instrumentation 3 0 5 3
Number 62 44 86 1921Chi-square test: *p < .05; **p < .001
Irrigation Improvements Implemented in 2008 Table 11 tabulates a number of irrigation improvements farmers may have made in 2008 by the size of the operation. The improvements made are listed in ranked order according to the proportion of the overall sample. Farm-ers were asked to indicate all improvements that they made in 2008 from a list provided in the survey. Thirty-two percent of all farmers expanded acres covered by irrigation in 2008, and producers with large farms expanded irrigation the most, 40 per-cent. Twenty-two percent of all farmers retrofi tted a sprinkler system for a low pressure operation, again with larger farms in the lead, 34 percent. Twenty percent of all farmers made irrigation changes that reduced wa-ter requirements and 19 percent made changes that decreased energy costs; more large farm operators made these two types of changes than medium-size and small farm operators, with 22 percent of all large farm operators trying to reduce water requirements and 30 percent decreasing energy costs. Another 17 percent of the total sample made irrigation changes that im-proved crop yield or quality. But this time, more medium-size farm operators made these types of changes the most, 23 percent, as compared to 18 percent of small farm operators and 13 percent of large farm operators. Medium-size farm operators also adopted irrigation scheduling as a management practice the most, 16 percent, compared to 13 percent of small farm operators, only 7 percent of large farm operators, and 11 percent of all respondents. Ten percent of all respondents changed their energy source for pump-ing, and three percent of all respondents added moisture instrumentation.

Farm Operator Perceptions of Barriers to the Use of Irrigation in Alabama— 14 —
Table 12. Expenditures Made in 2008 for Irrigation Equipment, Alabama Farm Operators, 2009 ——Acreage size—— ——Irrigating—— All Expenditures for irrigation equipment, 2008 Response Small Med. Large ————percent———Purchase of new or replacement irrigation equipment and machinery* Some 37 32 44 39 Major outlay 5 16 13 11
Building or improving permanent storage and distribution system Some 16 14 15 15 Major outlay 3 7 1 4
Land clearing and leveling for irrigation purposes Some 8 9 14 11 Major outlay 2 2 2 2
New well construction or deepening of existing wells Some 5 5 7 6 Major outlay 2 2 5 3
Number 62 44 86 1921Chi-square test: *p < .05; **p < .001
Expenditures Made in 2008 for Irrigation Equipment Table 12 tabulates the expenditures farmers may have made in 2008 for irrigation equipment by the size of the operation. The possible expendi-tures made are listed in ranked order of the percent selecting “major outlay” spent on for each irrigation improvement, according to the proportion of the overall sample. Farmers indicated all expenditures that they made in 2008 and whether they spent “some” money or the “major outlay” of their expenditures on any particular irrigation equipment. As shown in Table 12, the most common expenditure irrigating produc-ers reported making in 2008 was the purchase or replacement of irrigation equipment and machinery, with 50 percent of all respondents spending money on this. Thirty-nine percent of all respondents spent some money on new or re-placement equipment, and 11 percent spent the major outlay of their irrigation expenditures on such items. Purchasing or replacing irrigation equipment or machinery was the most common expenditure for all sizes of farms—small (42 percent overall), medium (48 percent overall), and large (50 percent overall). The second most highly reported expenditure for irrigation in 2008 was building or improving permanent storage and distribution systems, with a total of 19 percent of respondents spending money on this particular type of im-provement. Fifteen percent spent some money on building storage and distri-bution systems, and 4 percent spent what they considered a major outlay. Thirteen percent of respondents cleared and leveled land for irrigation purposes, but only 2 percent spent a major outlay on this type of irrigation project. Nine percent of the total sample (some, 5 percent; major outlay, 3 percent) made expenditures for new well construction or the deepening of ex-isting wells.
Farm Operator Perceptions of Barriers to the Use of Irrigation in Alabama— 15 —
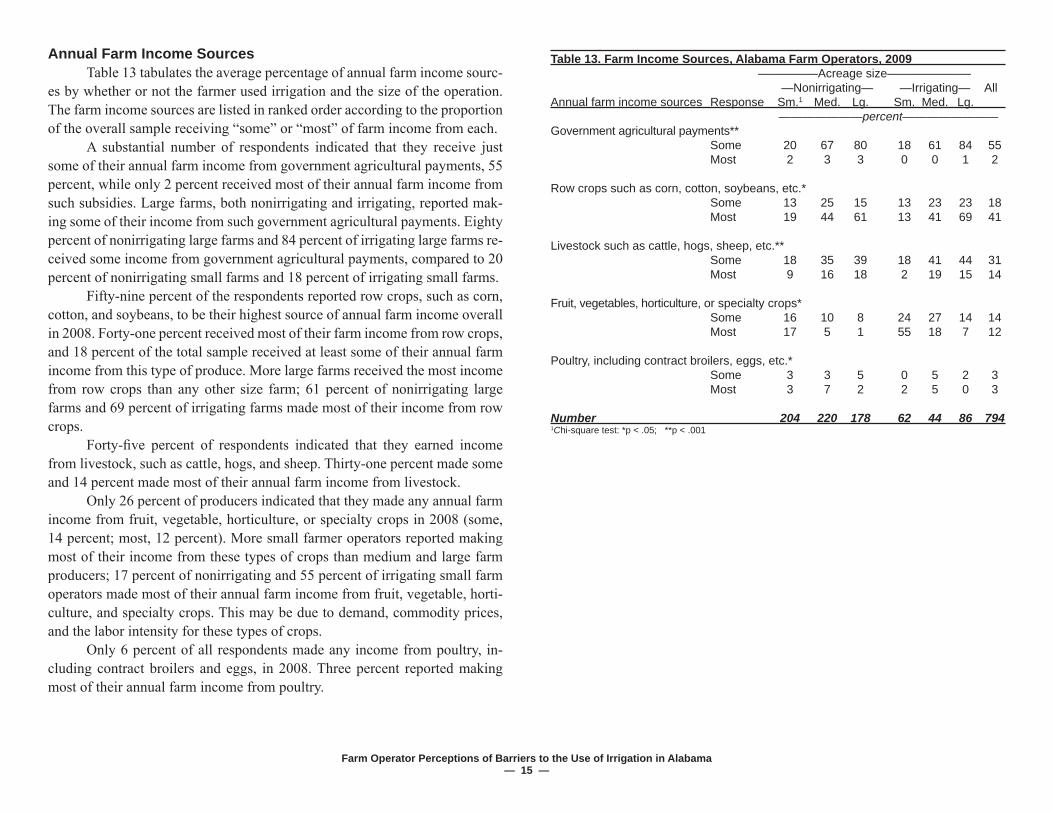
Table 13. Farm Income Sources, Alabama Farm Operators, 2009 —————Acreage size——————— —Nonirrigating— —Irrigating— AllAnnual farm income sources Response Sm.1 Med. Lg. Sm. Med. Lg. ———————percent————————Government agricultural payments** Some 20 67 80 18 61 84 55 Most 2 3 3 0 0 1 2
Row crops such as corn, cotton, soybeans, etc.* Some 13 25 15 13 23 23 18 Most 19 44 61 13 41 69 41
Livestock such as cattle, hogs, sheep, etc.** Some 18 35 39 18 41 44 31 Most 9 16 18 2 19 15 14
Fruit, vegetables, horticulture, or specialty crops* Some 16 10 8 24 27 14 14 Most 17 5 1 55 18 7 12
Poultry, including contract broilers, eggs, etc.* Some 3 3 5 0 5 2 3 Most 3 7 2 2 5 0 3
Number 204 220 178 62 44 86 7941Chi-square test: *p < .05; **p < .001
Annual Farm Income Sources Table 13 tabulates the average percentage of annual farm income sourc-es by whether or not the farmer used irrigation and the size of the operation. The farm income sources are listed in ranked order according to the proportion of the overall sample receiving “some” or “most” of farm income from each. A substantial number of respondents indicated that they receive just some of their annual farm income from government agricultural payments, 55 percent, while only 2 percent received most of their annual farm income from such subsidies. Large farms, both nonirrigating and irrigating, reported mak-ing some of their income from such government agricultural payments. Eighty percent of nonirrigating large farms and 84 percent of irrigating large farms re-ceived some income from government agricultural payments, compared to 20 percent of nonirrigating small farms and 18 percent of irrigating small farms. Fifty-nine percent of the respondents reported row crops, such as corn, cotton, and soybeans, to be their highest source of annual farm income overall in 2008. Forty-one percent received most of their farm income from row crops, and 18 percent of the total sample received at least some of their annual farm income from this type of produce. More large farms received the most income from row crops than any other size farm; 61 percent of nonirrigating large farms and 69 percent of irrigating farms made most of their income from row crops. Forty-fi ve percent of respondents indicated that they earned income from livestock, such as cattle, hogs, and sheep. Thirty-one percent made some and 14 percent made most of their annual farm income from livestock. Only 26 percent of producers indicated that they made any annual farm income from fruit, vegetable, horticulture, or specialty crops in 2008 (some, 14 percent; most, 12 percent). More small farmer operators reported making most of their income from these types of crops than medium and large farm producers; 17 percent of nonirrigating and 55 percent of irrigating small farm operators made most of their annual farm income from fruit, vegetable, horti-culture, and specialty crops. This may be due to demand, commodity prices, and the labor intensity for these types of crops. Only 6 percent of all respondents made any income from poultry, in-cluding contract broilers and eggs, in 2008. Three percent reported making most of their annual farm income from poultry.

Farm Operator Perceptions of Barriers to the Use of Irrigation in Alabama— 16 —
Table 14. Debt Level in 2008, Alabama Farm Operators, 2009 —————Acreage size——————— —Nonirrigating— ——Irrigating—— AllDebt level in 2008** Small1 Med. Large Small Med. Large ————————percent—————————No debt 44 28 25 39 21 17 30
Very little 25 30 28 25 26 21 27
Moderate 23 33 39 29 42 42 34
Heavy 8 9 8 7 12 20 10
Number 168 214 173 59 43 84 7411Chi-square test: *p < .05; **p < .001
Household Debt Level in 2008 Table 14 tabulates household debt levels by whether or not the farmer used irrigation and the size of the operation. Large farm operators with irriga-tion reported the highest debt levels. Thirty percent of all respondents reported having no debt in 2008. More small farm operators (nonirrigators, 44 percent; irrigators, 39 percent) reported having no debt than did medium-size and large farm operators. Twenty-seven percent of all respondents reported having very little debt, 34 percent had mod-erate debt, and only 10 percent had heavy debt in 2008. Those who reported a greater debt level also tended to report having irrigated in 2008. The percentage of irrigators with moderate and heavy debt was higher than the percentage of nonirrigators with moderate and heavy debt, regardless of farm size. Twenty-three percent of nonirrigating small farm op-erators reported a moderate debt level, as compared to 29 percent of irrigating small farm operators. Thirty-three percent of nonirrigating medium-size farm operators and 42 percent of irrigating medium-size farm operators reported a moderate debt level; 39 percent of nonirrigating large farm operators and 42 percent of irrigating large farm operators faced a moderate debt level. This pat-tern is similar for the heavy debt category. Installing irrigation on one’s farm is a long-term fi nancial decision. Irrigation requires a capital investment for those producers who choose to irrigate and is refl ected in their reported debt levels.
Farm Operator Perceptions of Barriers to the Use of Irrigation in Alabama— 17 —
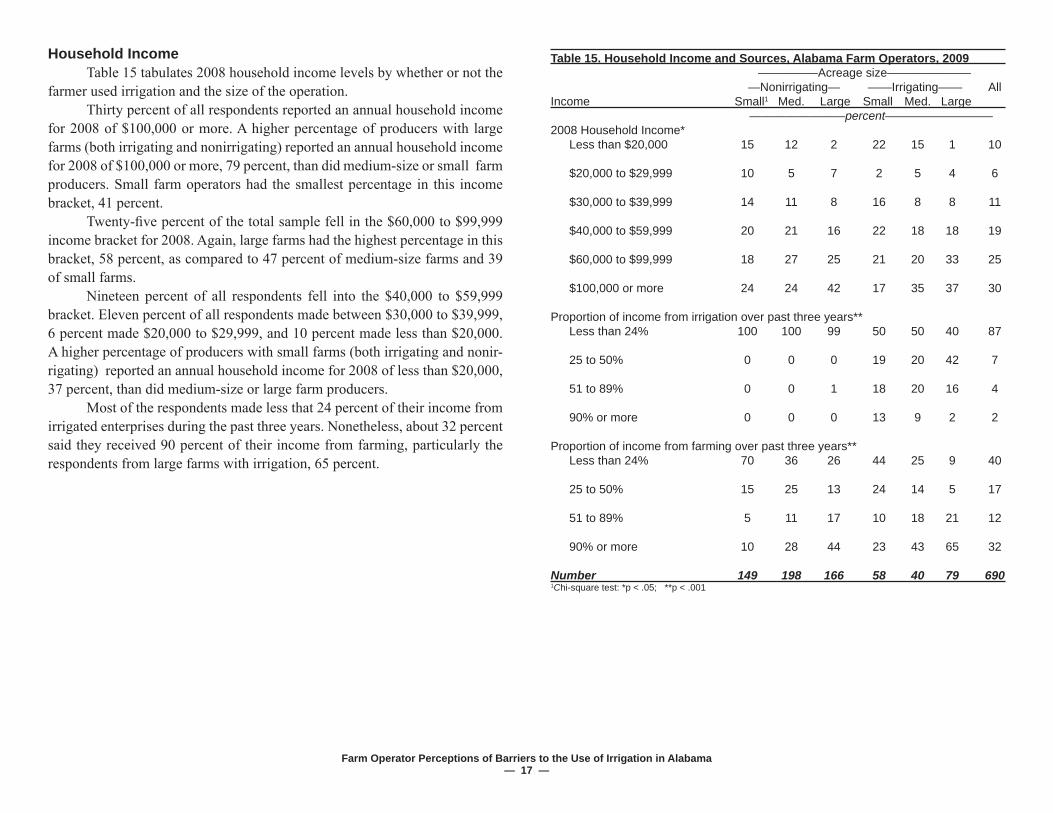
Table 15. Household Income and Sources, Alabama Farm Operators, 2009 —————Acreage size——————— —Nonirrigating— ——Irrigating—— AllIncome Small1 Med. Large Small Med. Large ————————percent—————————2008 Household Income* Less than $20,000 15 12 2 22 15 1 10
$20,000 to $29,999 10 5 7 2 5 4 6
$30,000 to $39,999 14 11 8 16 8 8 11
$40,000 to $59,999 20 21 16 22 18 18 19
$60,000 to $99,999 18 27 25 21 20 33 25
$100,000 or more 24 24 42 17 35 37 30
Proportion of income from irrigation over past three years** Less than 24% 100 100 99 50 50 40 87
25 to 50% 0 0 0 19 20 42 7
51 to 89% 0 0 1 18 20 16 4
90% or more 0 0 0 13 9 2 2
Proportion of income from farming over past three years** Less than 24% 70 36 26 44 25 9 40
25 to 50% 15 25 13 24 14 5 17
51 to 89% 5 11 17 10 18 21 12
90% or more 10 28 44 23 43 65 32
Number 149 198 166 58 40 79 6901Chi-square test: *p < .05; **p < .001
Household Income Table 15 tabulates 2008 household income levels by whether or not the farmer used irrigation and the size of the operation. Thirty percent of all respondents reported an annual household income for 2008 of $100,000 or more. A higher percentage of producers with large farms (both irrigating and nonirrigating) reported an annual household income for 2008 of $100,000 or more, 79 percent, than did medium-size or small farm producers. Small farm operators had the smallest percentage in this income bracket, 41 percent. Twenty-fi ve percent of the total sample fell in the $60,000 to $99,999 income bracket for 2008. Again, large farms had the highest percentage in this bracket, 58 percent, as compared to 47 percent of medium-size farms and 39 of small farms. Nineteen percent of all respondents fell into the $40,000 to $59,999 bracket. Eleven percent of all respondents made between $30,000 to $39,999, 6 percent made $20,000 to $29,999, and 10 percent made less than $20,000. A higher percentage of producers with small farms (both irrigating and nonir-rigating) reported an annual household income for 2008 of less than $20,000, 37 percent, than did medium-size or large farm producers. Most of the respondents made less that 24 percent of their income from irrigated enterprises during the past three years. Nonetheless, about 32 percent said they received 90 percent of their income from farming, particularly the respondents from large farms with irrigation, 65 percent.

Farm Operator Perceptions of Barriers to the Use of Irrigation in Alabama— 18 —
Table 16. Socioeconomic Characteristics, Alabama Farm Operators, 2009 —————Acreage size——————— —Nonirrigating— ——Irrigating—— AllSocioeconomic characteristics Small1 Med. Large Small Med. Large —–———————percent—————–————Gender* Male 93 97 99 97 98 100 97
Female 7 3 1 3 2 0 3
Education** Some high school or less 11 3 3 10 0 1 5
High school graduate 31 35 27 32 34 20 30
Some college/technical school 21 29 23 15 30 26 24
College graduate or more 37 32 47 44 36 52 40
Ethnicity* Black or African American 15 5 1 8 5 5 7
Other minority 1 3 3 11 0 0 2
White or Caucasian 84 93 97 81 96 95 91
Age* 50 or less 18 24 28 18 30 36 24
51 to 65 41 49 47 37 57 48 46
66 and older 42 28 25 45 14 17 30
Number 188 216 175 62 44 84 7691Chi-square test: *p < .05; **p < .001
Socioeconomic Characteristics Table 16 shows respondents’ gender and other attributes by whether or not the farmer used irrigation and the size of the operation. Ninety-seven percent of respondents were male and only 3 percent were female. There was some tendency for women to operate small farms and to ir-rigate less. The differences were not large. Table 16 also tabulates producers’ education level by whether or not the farmer used irrigation and the size of the operation. Five percent of re-spondents reported having some high school or less. The highest persentage of small farm operators reported having some high school or less, 21 percent (nonirrigators, 11 percent; irrigators, 10 percent). The highest percentage of respondents graduated from high school, 30 percent. Twenty-four percent of the sample had some college/technical school, and another 40 percent graduated from college. Operators of large farms re-ported graduating from college more often than did operators of small and medium-size farms (nonirrigators, 47 percent; irrigators, 52 percent). College graduates were slightly more likely to irrigate than those in parallel farm size categories; the differences were consistent. Table 16 tabulates respondents’ ethnicity by whether or not the farmer used irrigation and the size of the operation. Ninety-one percent of producers self-identifi ed themselves as “white or Caucasian.” Seven percent were “black or African-American.” One percent was American Indian or Alaskan native and 1 percent self-identifi ed as “other.” No respondents reported being Asian, Pacifi c, Spanish, Hispanic, or Latino origin. There was a slight tendency for smaller, nonwhite farm operators to irrigate less, but the differences were not great. Age is related to irrigation use. The highest proportions of young farm-ers (age 50 or less) were found among the medium-size and large farms with irrigation, 30 percent and 36 percent, respectively. The highest proportion of farmers over age 66 was among those operators of small farms with irrigation, 45 percent. The lowest proportion of older farmers was among operators of medium-size farms with irrigation, 14 percent.

Farm Operator Perceptions of Barriers to the Use of Irrigation in Alabama— 19 —
Table 17. Self-identifi ed Adopter Status and Type of Internet Access, Alabama Farm Operators, 2009 —————Acreage size——————— —Nonirrigating— ——Irrigating—— AllAccess Small1 Med. Large Small Med. Large ———–—————percent————–—————Internet access* None 46 34 23 36 18 9 31
Dial-up only 14 20 15 11 21 23 17
Cable or DSL 41 46 63 53 61 67 52
Adopter status* Innovator trying before 9 10 15 15 14 17 12 anyone else
Early adopter of new practices 12 18 24 28 34 30 21
Not fi rst, but part of early majority 29 34 37 22 30 43 33 of users Part of later majority of users 24 25 18 17 18 8 20 of new ideas Often one of the last 27 14 7 18 5 2 13 to try new things
Plan to change the amount of land irrigated** Decrease 20 12 2 3 2 4 8
Stay the same 71 77 81 53 56 64 70
Increase 9 11 17 44 42 33 22
Number 150 198 166 60 44 84 7021Chi-square test: *p < .05; **p < .001
Adopter Status and Internet Access Table 17 tabulates producers’ type of Internet access by whether or not the farmer used irrigation and the size of the operation. The majority of respondents had cable or DSL Internet access at the home. Large farms tended to have high-speed Internet (nonirrigators, 63 per-cent; irrigators, 67 percent) more often than their smaller counterparts. Seven-teen percent of producers had dial-up Internet only, and 31 percent of the total population had no Internet access at all. Those without Internet access were consistently less likely to irrigate across farm size categories. Table 17 also indicates how producers identifi ed themselves in terms of innovativeness. The items are ordered in terms of proportion of the entire sample. Respondents described themselves as an “innovator” who often tries new approaches before anyone else, an “early adopter” of new practices, not the fi rst but part of the “early majority” of users, part of the “later majority” of users of new ideas, or “often one of the last to try new things.” Thirty-three percent of the sample in this study reported being part of the “early majority.” Approximately two-thirds of all respondents reported be-ing either an “innovator” (12 percent), an “early adopter” (21 percent), or part of the “early majority” (33 percent), while one-third identifi ed themselves as part of the “late majority” (20 percent) or a “often one of the last to try new things” (13 percent). Only 8 percent of respondents plan to decrease the amount of land irri-gated in the coming year, while 70 percent do not plan to change the amount of land irrigated. More irrigating farmers plan to irrigate in the coming years. A third of the large operators planned to increase the amount of land irrigated. The nonirrigating operators who said they were going to decrease their acreage were likely referring to the overall acreage that they farmed. In partic-ular, 20 percent of the nonirrigating, small farm operators said they were going to decrease their acreage. About 44 percent percent of the small farm operators with irrigation said they planned the increase irrigated acreage, the highest rate in the sample, followed by 42 percent of the medium-size farm operators with irrigation.

Farm Operator Perceptions of Barriers to the Use of Irrigation in Alabama— 20 —
Table 18. Perceptions of Irrigation, Alabama Farm Operators, 2009 —————Acreage size——————— —Nonirrigating— ——Irrigating—— AllItem Small1 Med. Large Small Med. Large ——–——————percent————————–—Alabama farmers need a cost-share program to implement/improve irrigation systems.* Disagree 43 28 21 18 5 6 26
Undecided 20 19 14 16 30 17 18
Agree 30 57 87 77 82 72 61
Farmers need a subsidized loans to implement or improve irrigation.* Disagree 41 27 22 26 11 18 27
Undecided 28 23 21 13 30 16 22
Agree 31 56 67 74 82 67 56
Farmers need more training and technical assistance to implement or expand irriga-tion.* Disagree 57 46 43 39 39 37 46
Undecided 20 24 20 32 25 24 23
Agree 18 23 33 19 23 14 22
Am familiar with Alabama requirements that irrigation systems using greater than 100,000 gallons per year must register with the Offi ce of Water Resources.* Disagree 63 51 52 50 43 29 52
Undecided 24 30 30 27 34 21 28
Agree 7 7 10 3 9 33 10
Number 204 220 178 62 44 86 7941Chi-square test: *p < .05; **p < .001
Farmer Attitudes Table 18 tabulates producers’ attitudes regarding fi ve statements about irrigation by whether or not the farmer used irrigation and the size of the op-eration. Producers marked whether they “agreed,” “disagreed,” or were “unde-cided” about the statements. Sixty-one percent of respondents agreed that Alabama farmers need a cost-share program to implement or improve irrigation systems, while 26 per-cent disagreed and 18 percent were undecided. Nonirrigating farmers were consistently more likely to disagree with the statement. Fifty-six percent of re-spondents thought that they need subsidized loans to implement or improve ir-rigation, while 27 percent do not feel the need for subsidies and 22 percent were undecided. Twenty-two percent of the sample felt that they need more training and technical assistance to implement or expand irrigation, while 46 percent did not feel that they need more training. Twenty-three percent were undecided. Ten percent of all respondents felt that they were familiar with Alabama requirements that irrigation systems using greater than 100,000 gallons per year must register with the Offi ce of Water Resources. Fifty-two percent were not familiar with this requirement and 28 percent were “undecided.”

Farm Operator Perceptions of Barriers to the Use of Irrigation in Alabama— 21 —
Table 19. Nearest Alabama Agricultural Experiment Station, Alabama Farm Operators, 2009 —————Acreage size——————— —Nonirrigating— ——Irrigating—— AllNearest AAES station Small1 Med. Large Small Med. Large ————————percent—————————Wiregrass Research and Extension Center 19 26 15 18 34 37 23Tennessee Valley Research and Extension Center 12 18 27 7 5 20 17Gulf Coast Research and Extension Center 20 6 6 27 11 7 12Black Belt Research and Extension Center 16 6 11 5 9 6 10Sand Mountain Research and Extension Center 8 15 7 5 0 6 9Brewton Agricultural Research Unit 5 10 12 8 2 6 8E.V. Smith Research Center 6 4 12 5 11 7 7North Alabama Horticulture Research Center 7 7 2 15 7 1 6Chilton Research and Extension Center 4 6 3 11 14 4 5Prattville Agricultural Research Unit 3 4 6 0 7 7 4Number 204 220 178 62 44 86 7941Chi-square test: *p < .05; **p < .001
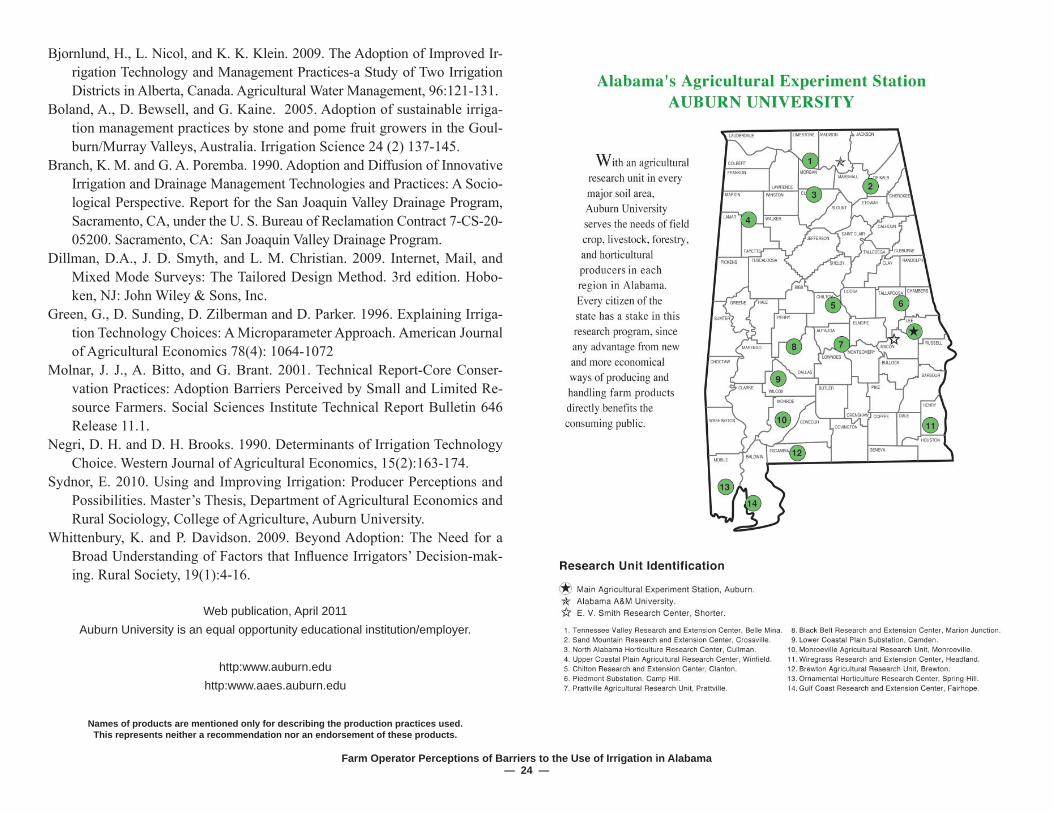
Closest AAES Research Station Table 19 tabulates the closest Alabama Agricultural Experiment Sta-tion (AAES) research station to producers’ location by whether or not the farmer used irrigation and the size of the operation. The highest percentage of producers, 23 percent, indicated that the closest Auburn research station to their farming operation is the Wiregrass Research and Extension Center. Seventeen percent of respondents are closest to the Tennessee Valley Research and Extension Center and 12 percent are located closest to the Gulf Coast Re-search and Extension Center. Another 10 percent of the sample is closest to the Black Belt Research and Extension Center. The Sand Mountain Research and Extension Center is closest to 9 percent of the sample and 8 percent are closest to the Brewton Agricultural Research Unit. Seven percent of respondents are located closest to the E.V. Smith Research Center, 6 percent nearest the North Alabama Horticulture Research Center, 5 percent nearest the Chilton Research and Extension Center. The Prattville Agricultural Research Unit is the closest AAES research station to 4 percent of the sample population.

Farm Operator Perceptions of Barriers to the Use of Irrigation in Alabama— 22 —
Table 20. Using Irrigation Regressed on Selected Perceptions and Characteris-tics, Alabama Farm Operators, 2009 Was any land on farm irrigated in 2008 at any time (2=yes) Standard beta coeffi cientsVarable (high score = category) (1) (2) (3)
Perceptions Irrigation system operating costs are too risky (3=great barrier) -.311** -.294**Irrigation improvements(s) will reduce costs, but not enough to cover installation costs (3=great barrier) .161** .153**No other farmers around here irrigate (3=great barrier) -.150** -.137*Number of “not helpful” information sources (9=highest) .143** .114Need more training and technical assistance to implement or expand irrigation (5=strongly agree) -.101* -.107Familiar with State requirements that large irrigators must register (5=very familiar) .063 .066Cannot get good advice on how to make irrigation pay (3=great barrier) -.052 -.048No reliable source of water on my place (3=great barrier) -.052 -.049
Characteristics In past three years, proportion of income from farming (4=100%) .260** .218**Education level (5=postgraduate) .131** .102**Annual farm sales from government agricultural payments (3= more than 50%) -.163** -.093*Total combined household income during 2008 (5= more than $250,000) -.051* -.049*Minority farm operator (1=yes) .055 .072Total farm acres rank (794=highest) .084 .040Gender (2=female) -.024 -.011Age (95=highest) -.005 -.032
R2 .199 .089 .254adjusted R2 .186 .076 .229F-ratio 15.1** 6.9** 10.8** (N=794) df 7 7 161Chi-square test: *p < .05; **p < .001
Regression Analysis Table 20 regresses the use of irrigation on selected perceptions and char-acteristics of farm operators. Three equations are shown, equation 1 regresses use–nonuse on the perception variables. The second regresses user–nonuser on personal characteristics. The third combines both sets of variables. Each equa-tion explains a modest, but statistically signifi cant proportion of the variation in irrigation use. The variables are shown in order of the absolute value of the standardized regression coeffi cients in each variable set. Although not shown in the table, other statistical tests indicated that the perceptions and characteristics explain a signifi cant and unique proportion of variation. Perception variables were the most potent means of differentiating irrigating and nonirrigating farm operators in the Alabama sample. Perceptions. The most important predictor of the use of irrigation was perception of risks associated with operating costs. Nonusers of irrigation were more likely to view operating cost risks as a great barrier. Users of irrigation were more likely to view irrigation improvements as reducing costs but not covering the installation outlays. Current irrigation users were perhaps more familiar with the actual prices and returns from irrigation. Nonusers of irrigation were more likely to assert that no other farmers around them used irrigation. Such perceptions may reinforce their own nonuse of irrigation. We asked operators to rate various information sources as “not helpful,” “somewhat helpful,” or “very helpful,” and a composite measure counts the number they rated as “not helpful.” Irrigation-practicing farmers rated more sources as “not helpful.” This may refl ect a lack of consistent technical direc-tion for irrigation development in Alabama. Nonusers of irrigation were more likely to agree that more training and technical assistance were needed. Nonetheless, there were no differences be-tween irrigating and nonirrigating farmers over the availability of guidance on how to make irrigation pay. Similarly, these were no differences in the percep-tion of the lack of reliable water supply as a barrier to irrigation. Water supply is not seen as a systematic barrier to the use of irrigation. Characteristics. Equation 2 in the table shows selected personal and farm characteristics that may differentiate irrigation users and nonusers. Op-erators who received a higher portion of their income from farming were more likely to irrigate; they had more education and also received less of their in-come from government payments.

Farm Operator Perceptions of Barriers to the Use of Irrigation in Alabama— 23 —
Minority farmers, who were were only fi ve percent of the sample, were not different in the likelihood that they practiced irrigation. Farm households with higher incomes were less likely to irrigate. There was no difference by total farm acreage in the use of irrigation, no difference by gender, and no dif-ference by age. Equation 3 combines the perceptions and characteristics in predicting irrigation use. In general, the relationships identifi ed in the fi rst two equations were sustained in the combined analysis. Together, the two variable sets ex-plained about a quarter of the variation in irrigation use. Perceptions explained about twice the variation than did characteristics, suggesting that information and technical support can be a signifi cant means for expanding irrigation de-velopment among Alabama farm operators.
CONCLUSION Alabama agriculture has new possibilities for growth and stabilization through the implementation of irrigation. The data suggest that farmers view water constraints and economics of irrigation as central barriers to implementing or expanding its use. We examined survey results among small, medium-size, and large farms using acreage operated as the means for tabulating the data. The regression analysis suggested that operator perceptions encompassed a central set of differences between those who irrigated and those who did not. Operators of large farms made larger outlays for equipment, wells, pumps, and energy costs. The data show they were more concerned about these items as limitations to adoption and expansion of irrigation. Payback periods are typically longer for large investments. The overall commitment to irrigation systems often requires a more comprehensive set of changes in the farming system. Large and medium-size farm operators were more concerned about water sources than operators of small farms. In a period of drought when irrigation is most needed, surface water sources are more readily depleted and confl icts with other users of surface sources are more readily manifested. Planning for drought periods may require deeper wells and larger storage ponds than might be expected. Medium-size and large farm operators who did not use irrigation were more likely to report water source issues as barriers to using irrigation. Operators of small farms were more likely to purchase water from mu-nicipal sources and were somewhat less concerned about capital and operating
costs. Small farm operators can more readily implement systems that can be managed and maintained on limited budgets. It is easier to try irrigation on a small operation and to extend sprinkler and other lower cost approaches to more acres. All operators faced information limitations that impeded the ready utili-zation of irrigation in their farming systems. The diversity of Alabama terrain, fi eld shapes, and hydrology frequently requires technical assessment that may be diffi cult to provide in an era when the number of qualifi ed providers may be declining. Public agencies can assist in siting wells and water storage ponds, but mating irrigation systems to farming situations often takes more compre-hensive determinations that are diffi cult to make in a single year. Thus, farmers often take a partial and incremental approach based on the water they have, or can get, and the investment they are willing to make. When commodity prices seem to be on the increase, irrigation may be-come more interesting to more farmers seeking stable and expanded yields from irrigated crops. Climate fl uctuations may motivate lenders to require ir-rigation as a condition for operating loans on certain crops. Research and ex-tension efforts may focus on identifying a portfolio of supplemental irrigation approaches that fi t the humid Southeast and the diversity of resources and needs of Alabama farms.
REFERENCESACES. 2011a. Managing an Irrigation System. Alabama Ag Irrigation Info
Network, Alabama Cooperative Extension System. Available at: http://www.aces.edu/anr/irrigation/farmsystems.php
ACES. 2011b. Basics of Vegetable Crop Irrigation. Alabama Ag Irrigation Info Network, Alabama Cooperative Extension System. Available at: http://www.aces.edu/pubs/docs/A/ANR-1169/
Ajzen, I. 1985. From Intentions to Actions: A Theory of Planned Behavior. In Action Control: From Cognition to Behavior, edited by J. Kuhl and J. Beckmann. New York, NY: Springer Verlag.
Ayars, J. E., E. W. Christen, R. W. Soppe, and W. S. Meyer. 2006. The Re-source Potential of In-situ Shallow Ground Water Use in Irrigated Agricul-ture: A Review. Irrigation Science, 24:147-160.
Bai, D. 2008. Irrigation, Income Distribution, and Industrialized Agriculture in the Southeast United States. Master’s Thesis, Department of Agricultural Eco-nomics and Rural Sociology, College of Agriculture, Auburn University.
Farm Operator Perceptions of Barriers to the Use of Irrigation in Alabama— 24 —
Web publication, April 2011Auburn University is an equal opportunity educational institution/employer.
http:www.auburn.eduhttp:www.aaes.auburn.edu
Names of products are mentioned only for describing the production practices used.This represents neither a recommendation nor an endorsement of these products.
Bjornlund, H., L. Nicol, and K. K. Klein. 2009. The Adoption of Improved Ir-rigation Technology and Management Practices-a Study of Two Irrigation Districts in Alberta, Canada. Agricultural Water Management, 96:121-131.
Boland, A., D. Bewsell, and G. Kaine. 2005. Adoption of sustainable irriga-tion management practices by stone and pome fruit growers in the Goul-burn/Murray Valleys, Australia. Irrigation Science 24 (2) 137-145.
Branch, K. M. and G. A. Poremba. 1990. Adoption and Diffusion of Innovative Irrigation and Drainage Management Technologies and Practices: A Socio-logical Perspective. Report for the San Joaquin Valley Drainage Program, Sacramento, CA, under the U. S. Bureau of Reclamation Contract 7-CS-20-05200. Sacramento, CA: San Joaquin Valley Drainage Program.
Dillman, D.A., J. D. Smyth, and L. M. Christian. 2009. Internet, Mail, and Mixed Mode Surveys: The Tailored Design Method. 3rd edition. Hobo-ken, NJ: John Wiley & Sons, Inc.
Green, G., D. Sunding, D. Zilberman and D. Parker. 1996. Explaining Irriga-tion Technology Choices: A Microparameter Approach. American Journal of Agricultural Economics 78(4): 1064-1072
Molnar, J. J., A. Bitto, and G. Brant. 2001. Technical Report-Core Conser-vation Practices: Adoption Barriers Perceived by Small and Limited Re-source Farmers. Social Sciences Institute Technical Report Bulletin 646 Release 11.1.
Negri, D. H. and D. H. Brooks. 1990. Determinants of Irrigation Technology Choice. Western Journal of Agricultural Economics, 15(2):163-174.
Sydnor, E. 2010. Using and Improving Irrigation: Producer Perceptions and Possibilities. Master’s Thesis, Department of Agricultural Economics and Rural Sociology, College of Agriculture, Auburn University.
Whittenbury, K. and P. Davidson. 2009. Beyond Adoption: The Need for a Broad Understanding of Factors that Infl uence Irrigators’ Decision-mak-ing. Rural Society, 19(1):4-16.