farmer register pilot study - nda.agric.zanda.agric.za/docs/statsinfo/farmregpilotstudy.pdf ·...
TRANSCRIPT


CONTENTS
Introduction ........................................................................................................................................... 1
Methods and explanatory notes ........................................................................................................... 1
Summary of fi ndings ............................................................................................................................. 4
Ownership of the farm ........................................................................................................................... 7
Summary in tables ................................................................................................................................. 8
2009
All rights reserved
Printed and published by the
Department of Agriculture, Forestry and Fisheries
PRETORIA
Obtainable from the
Department of Agriculture, Forestry and Fisheries
Directorate Agricultural Information Services
Private Bag X144
PRETORIA 0001
Farmer register pilot study– statistical report –
2009


1Department of Agriculture, Forestry and Fisheries
INTRODUCTION
This report contains the statistical results of the Farmer Register Pilot Project that has been undertaken in Limpopo Province, Capricorn District during 2008. The primary purpose of this pilot study was to test the logistics of a project of this nature and collect statistical information prior to a larger study using the Farmer Register Questionnaire, in order to improve the effi ciency of running such a project. A further aim was to establish whether farmers are able to provide the statistical information needed for the Farmer Register. This pilot project was focusing particularly on small-scale, communal and subsistence agriculture, although a number of commercial farmers also participated.
The main aim of the larger study, i.e. the Farmer Register, is to establish up-to-date statistics of all agricul-tural producers in South Africa. The register will enable the Department of Agriculture, Forestry and Fish-eries (DAFF) and other institutions to have accurate statistics of both existing commercial and emerging agricultural producers in the country.
The Farmer Register is expected to contribute to informed policy development and improved planning, decision making and service delivery by the DAFF and the entire agricultural sector.
The following benefi ts to the farmer are foreseen, to name but a few:
• Improved communication with farmers in specifi c areas—information on outbreaks of diseases, meas-ures that can be taken, existing opportunities etc.;
• Collection of statistics directly from producers so as to reduce uncertainty about accuracy in agricultural statistics;
• Improved planning of resources needed for agricultural support programmes and services for the devel-opment of farmers; and
• Delivery of the right services to the right people (government agricultural support services).
The statistics that can be found in the Farmer Register, amongst others, include:
• The location of the farm in terms of Global Positioning Systems (GPS) coordinates;
• Ownership information;
• Demographic information;
• Employment information;
• Information on the farming activities of each farm;
• Production quantities; and
• Information about farmers’ participation in agricultural support programmes.
This report results from a joint collaboration between the Limpopo Department of Agriculture, Capricorn District Municipalities and the DAFF. The DAFF wishes to express its appreciation to the people involved for their assistance and cooperation.
METHODS AND EXPLANATORY NOTES
Area surveyed/covered: Initially this Farmer Register Pilot Project intended to cover the entire Limpopo Province, however, because of time and budgetary constraints, only Capricorn District was eventually covered.
Scope: Information was obtained from a sample of 799 farmers who worked on their own and/or rented farms or who farmed on communal land.
Statistical unit: The statistical unit for the collection of information was a farming unit. The number of farming units does not represent the number of farmers, as a specifi c farmer can operate in more than one farming unit and more than one farmer can be involved with a specifi c farming unit.
Farming unit: A farming unit means any unit on which one or more of the following farming op-erations are carried out:
2 Farmer register pilot study—statistical report—2009
• The cultivation in the open air or under cover of fi eld crops, fruit, grapes, nuts, seed bulbs, vegetable plants or fl owers;
• Operation of a tea, coffee or sugar plantation;• The breeding of livestock, poultry, game or other animals, including fresh-
water fi sh, furred animals and trade in livestock; and/or• Production of milk, wool, fur, eggs or honey.
Farmer: An individual, partnership, close corporation, company or other enterprise that op-erates a farming unit for his/her own account or the manager, foreman or other person to whom the control of the farming unit was entrusted.
Commercial farmers: Farmers who produce agricultural products intended almost exclusively for the market. The commercial farmers earn ongoing and primary revenue from their farming businesses, which forms the major source of income for the family. They have access to the technical, fi nancial and managerial resources to reach the glo-bal market potential.
Subsistence farmers: These are mainly household farmers in remote rural areas, who produce mainly for household consumption and are producing very little if anything, for the market. They also form part of the category that government is mainly targeting in terms of policy on developing Black South African farmers (e.g. AgriBEE, LRAD, Mafi sa and CASP) into fully functioning farm businesses or commercial farmers.
Communal famer: A farmer who farms within his/her community or village, either as an individual or in a group, on land owned by the community and either has the potential to develop into commercial farming business or is already functioning as a business. He/she also uses his/her produce to sustain himself/herself and his/her family and is also within the targeted groups of government development programmes.
Business classifi cation: According to the National Small Business Amendment Bill 2003, an agricultural business is classifi ed in the following manner, based on the annual turnover of the enterprise:
• Medium —less than R5 million • Small—less than R3 million • Very small—less than R500 000 • Micro—less than R200 000
AgriBEE: A sectoral broad-based black economic empowerment framework aimed at a de-liberate and systematic support of Black South Africans to actively participate fully in the agricultural sector as owners, managers, professionals, skilled employees and/or consumers.
LRAD: Land Redistribution for Agricultural Development—provides grants to black South African citizens (Africans, Coloureds and Indians) to access land specifi cally for agricultural purposes, or to make better use of land already accessed (e.g. in com-munal areas).
Mafi sa: Micro-agricultural Financial Institutions of South Africa—provides access to fi -nance for farmers, especially benefi ciaries of the land restitution, redistribution and tenure reform programmes.
CASP: Comprehensive Agricultural Support Programme—provides post-settlement sup-port to the targeted benefi ciaries of land reform and to other producers who have acquired land through private means and are, for example, engaged in value-add-ing enterprises domestically or are involved in exports.
Age groups: 16 to 35 years, 36 to 59 years and 60+ years
Collection method: Information and data were collected by personal visits. Data collectors/enumera-tors were accompanied by extension offi cers to each farming unit.
3Department of Agriculture, Forestry and Fisheries
Collection period: The reference period is the period during which details relating to the farming units, farmers and employees involved in the farming activities were collected, i.e. be-tween 1 September 2008 and 20 March 2009.
Reference date: The statistics collected are as at 31 March 2008.
Confi dentiality: In terms of Section 17 of the Statistics Act, 1999 (Act No. 6 of 1999), the completed questionnaire remains confi dential to the DAFF and will not be disclosed to other parties or used for any other purpose.
Far
mer
reg
iste
r pi
lot d
ata
map
: G
eore
fere
nced
farm
s an
d ag
ricul
tura
l pro
ject
s w
ithin
the
Cap
ricor
n di
stric
t in
Lim
popo
Pro
vinc
e, S
outh
Afr
ica
Bo
tsw
ana
Lim
po
po
Vh
emb
e
Mo
pan
i
Gre
ater
S
ekh
ukh
un
eE
hla
nze
ni
Wat
erb
erg
Cap
rico
rn D
M
Mod
imol
le
Pol
okw
ane
Moo
kgop
ong
Aga
nang
Leph
alal
e
Mok
gala
kwen
a
Mak
hudu
tham
aga
Mak
adu
Mus
ina
Mut
ale
Thu
lam
ela
Blo
uber
g
Tha
ba C
hweu
Bus
hbuc
krid
ge
Mar
ulen
g
Ba-
Pha
labo
rwa
Lepe
lle-N
kum
pi
Fet
akgo
mo
Gre
ater
Let
aba
Gre
ater
Tza
neen
Gre
ater
Giy
ani
Gre
ater
Tub
atse
Kru
ger
Par
k
Kru
ger
Par
k
Leg
end
• Sur
vey
data
Po
vert
y in
dex
0–16
%
17–3
4 %
35–4
6 %
47–5
7 %
58–7
0 %
71–8
1 %
> 8
1 %
Mol
emol
e
Far
mer
Reg
iste
r pi
lot d
ata
map
: G
eore
fere
nced
farm
s an
d ag
ricul
tura
l pro
ject
s su
rvey
ed w
ithin
the
Cap
ricor
n D
istr
ict i
n Li
mpo
po P
rovi
nce,
Sou
th
A
fric
a

4 Farmer register pilot study—statistical report—2009
SUMMARY OF FINDINGS
Farming information
The municipality with the largest number of both commercial and subsistence farming units surveyed, was Polokwane with a total of 233 farming units, followed by Lepelle-Nkumpi with a total of 210 farming units, then by Blouberg with a total of 138 faming units (see Table 3, p. 10). In general, subsistence farming in Capricorn District had a share of 82 % as indicated in Fig. 1 below.
Employment
The number of permanent employees in the farming units, at the end of March 2008, stood at 1 943, while the number of casual employees stood at 1 892. The lowest income group (i.e. turnover of less than R100 000 per year) came out to be the largest contributor in terms of employment, creating 35,2 % perma-nent and 73,1 % casual jobs. The largest number of permanent employees in the agricultural sector worked in Molemole (42,9 % or 834 permanent employees), followed by Polokwane (23,3 % or 459 permanent employees) and Lepelle-Nkumpi (18,0 % or 351 permanent employees). Total employment (permanent and casual together with owners or respondents) was 4 634. It was found that 97 farming units out of 799 farmed for personal consumption only, while 35 farming units were inactive.
FIG. 1 Farming units in Capricorn District
Farming units surveyed per municipality (%)
Polokw ane30%
Molemole13%
Lepelle-Nkumpi26%
Aganang14%
Blouberg17%
Aganang Blouberg Lepelle-Nkumpi Molemole Polokw ane
Farming units surveyed per muniicipalityy (%)
Polokw ane30%
MMolemole13%
Lepelle-Nkkumpi26%
Aganangg14%
Bloubergg17%
Aganaang Blouberg Lepelle-Nkumpi MMolemolee Polokw anee
Commercial vs subsistence farming units surveyed (%)Capricorn District
82%
18%
Commercial Subsistence

5Department of Agriculture, Forestry and Fisheries
FIG 3 Commercial and sub - sistence farming units per age group, gender and municipality
FIG. 2 Number of employees on farming units sur- veyed per municipality
Subsistence farming units surveyed per gender group (%)Capricorn District
44% 56%
Male Female
Subsisteence farming units surveyed per ggender group (%)Capricorn District
44% 56%
Male Female
Commercial farming units surveyed per gender group (%)Capricorn District
34%
66%
Male Female
Commmercial farming units surveyed per geender ggroup (%)Capricorn District
334%
66%
Male Female
Farmers interviewed in age group 60+ per gender group, per municipality (%)
0% 20% 40% 60% 80% 100%
Aganang
Blouberg
Lepelle-Nkumpi
Molemole
Polokw ane
Male Female
Employees per municipality
665
459
834
351
123 17684
349
579
215
0
200
400
600
800
1 000
AganangBlouberg
Lepelle-NkumpiMolemole
Polokwane
Permanent employees Casual employees
Employees per municipality
66665
459
834
351
123 176884
349
579
2215
0
2200
4400
6600
8800
1 0000
AganangBlouberg
Lepelle-NkumpiMoleemole
Polokwane
Peermanent employees Casuaal employees

6 Farmer register pilot study—statistical report—2009
In terms of ownership, males enjoyed a share of 61 % of farming units enumerated in Capricorn District. Of these farming units, 50 % were owned by people in the age-group 36 to 59 years, while the age-group 60+ years had a share of 42 %.
Table 5 (p. 13) shows that about 74% or 590 of farming units visited, have reported to have a turnover of less than R100 000 per annum. A large number of these farming units, about 63 %, were involved in sub-sistence farming. Farming units with a turnover of less than R100 000 contributed about 54 % of employ-ment (permanent or casual and seasonal).
FIG 3 Commercial and subsistence farming units per age-group, gender and municipal- ity (continued)
Farmers in age group 36 to 59 interviewed per gender group, per municipality (%)
0% 20% 40% 60% 80% 100%
Aganang
Blouberg
Lepelle-Nkumpi
Molemole
Polokwane
Male Female
Division of farmers interviewed per age group and gender group (%)
0% 20% 40% 60% 80% 100%
60+ years
36 to 59 years
16 to 35 years
Male Female
Farmers in age group 16 to 35 interviewed per gender group, per municipality (%)
0% 20% 40% 60% 80% 100%
Aganang
Blouberg
Lepelle-Nkumpi
Molemole
Polokw ane
Male Female

7Department of Agriculture, Forestry and Fisheries
FIG 4 Percentage distribution of commercial and subsistence farming units per income group
FIG 5 Percentage distribution of farming units according to agricultural activity
Distribution of farming units surveyed per turnover group
Inactive4%
Personal consumption
12%
R5 million or more0%
< R5 million1%
< R3 million1%
< R200 00081%
< R500 0001%
< R200 000 < R500 000< R3 million < R5 millionR5 million or more Personal consumptionInactive
OWNERSHIP OF THE FARM
According to Table 2 (p. 9), about 36,4 % or 291 of the farms visited were owned by the community, while 18,2 % or 146 of the farms were owned by a family, farms owned by individuals had a share of 17,4 % or were 139 in number, then followed farms owned by Co-operative Society at 15,9 %, or 127 in number.
Land reform and agricultural fi nance programmes
Table 7 (p. 14) shows that only 5 % of farming units in Capricorn District indicated that they have partici-pated in land reform or agricultural fi nance programmes or have received fi nancial assistance from other institutions mentioned below the table.
About 18,9 % (151 of enumerated farming units) have indicated that they were involved in more than one farming division, hence the totals in Table 6 add up to more than 799 of enumerated farming units. Accord-ing to Table 6 (p. 13), farming units in Capricorn District were mostly involved in horticulture, with a 41 % share, followed by fi eld crops at 32 % and livestock at 27 %. Participation in aquaculture seemed to be minimal, almost zero.
Distribution of farming units surveyed per tuurnover group
Inaacctive44%%
Personnaal consumpption
12%
R5 millionn or more00%
< R5 million1%
< R3 million1%
< R2000 00081%%
< R500 0001%
< RR200 000 < R500 0000< RR3 million < R5 millionR5 million or more Personal coonsumptiionInacctive
Percentage distributiion of farming units per agricultural activity
Horticulture41%
Field crops32%
Livestock27%
Other0%
Field crops Horticulture Livestock Other
8 Farmer register pilot study—statistical report—2009
TA
BL
E 1
Nu
mb
er o
f co
mm
erci
al a
nd
su
bsi
stan
ce f
arm
op
erat
ors
per
gen
der
an
d p
op
ula
tio
n g
rou
p, p
er m
un
icip
alit
y
Com
mer
cial
fa
rmin
g
Mun
icip
ality
Bla
ckW
hite
Col
oure
dA
sian
Tot
al
Mal
eF
emal
eM
ale
Fem
ale
Mal
eF
emal
eM
ale
Fem
ale
Mal
eF
emal
e
Num
ber
Aga
nang
36
00
00
00
36
Blo
uber
g17
120
00
00
017
12
Lepe
lle-N
kum
pi27
100
00
00
027
10
Mol
emol
e13
75
30
00
018
10
Pol
okw
ane
2513
40
00
00
2913
To
tal
8548
93
00
00
9451
Sub
sist
ence
fa
rmin
g
Mun
icip
ality
Bla
ckW
hite
Col
oure
dA
sian
Tot
al
Mal
eF
emal
eM
ale
Fem
ale
Mal
eF
emal
eM
ale
Fem
ale
Mal
eF
emal
e
Num
ber
Aga
nang
6241
00
00
00
6241
Blo
uber
g59
500
00
00
059
50
Lepe
lle-N
kum
pi98
750
00
00
098
75
Mol
emol
e51
271
00
00
052
27
Pol
okw
ane
9496
00
00
00
9496
To
tal
364
289
10
00
00
365
289
Gra
nd
to
tal
449
337
103
00
00
459
340
SUMMARY IN TABLES
Farm information
9Department of Agriculture, Forestry and Fisheries
TA
BL
E 2
Nu
mb
er o
f co
mm
erci
al a
nd
su
bsi
stan
ce f
arm
ing
un
its
per
typ
e o
f o
wn
ersh
ip a
nd
mu
nic
ipal
ity
Com
mer
cial
fa
rmin
g
Mun
icip
ality
Indi
vidu
alF
amily
Par
tner
-sh
ipP
rivat
e co
mpa
nyP
ublic
co
mpa
nyP
ublic
cor
-po
ratio
nC
lose
cor
-po
ratio
nC
oope
ra-
tive
soci
ety
Gov
ern-
men
tT
rust
Com
mu-
nity
Num
ber
Aga
nang
05
00
00
11
00
2
Blo
uber
g5
110
00
15
40
03
Lepe
lle-N
kum
pi8
130
12
02
01
010
Mol
emol
e7
34
00
01
50
80
Pol
okw
ane
813
11
00
311
00
4
To
tal
2845
52
21
1221
18
19
Su
bsi
ste
nce
fa
rmin
g
Mun
icip
ality
Indi
vidu
alF
amily
Par
tner
-sh
ipP
rivat
e co
mpa
nyP
ublic
co
mpa
nyP
ublic
cor
-po
ratio
nC
lose
cor
-po
ratio
nC
oope
ra-
tive
soci
ety
Gov
ern-
men
tT
rust
Com
mu-
nity
Num
ber
Aga
nang
712
20
00
527
03
47
Blo
uber
g29
231
11
21
163
033
Lepe
lle-N
kum
pi44
382
01
01
50
082
Mol
emol
e12
31
02
10
160
2420
Pol
okw
ane
1923
00
07
642
22
89
To
tal
111
996
14
1013
106
529
271
Gra
nd
to
tal
139
144
113
611
2512
76
3729
0
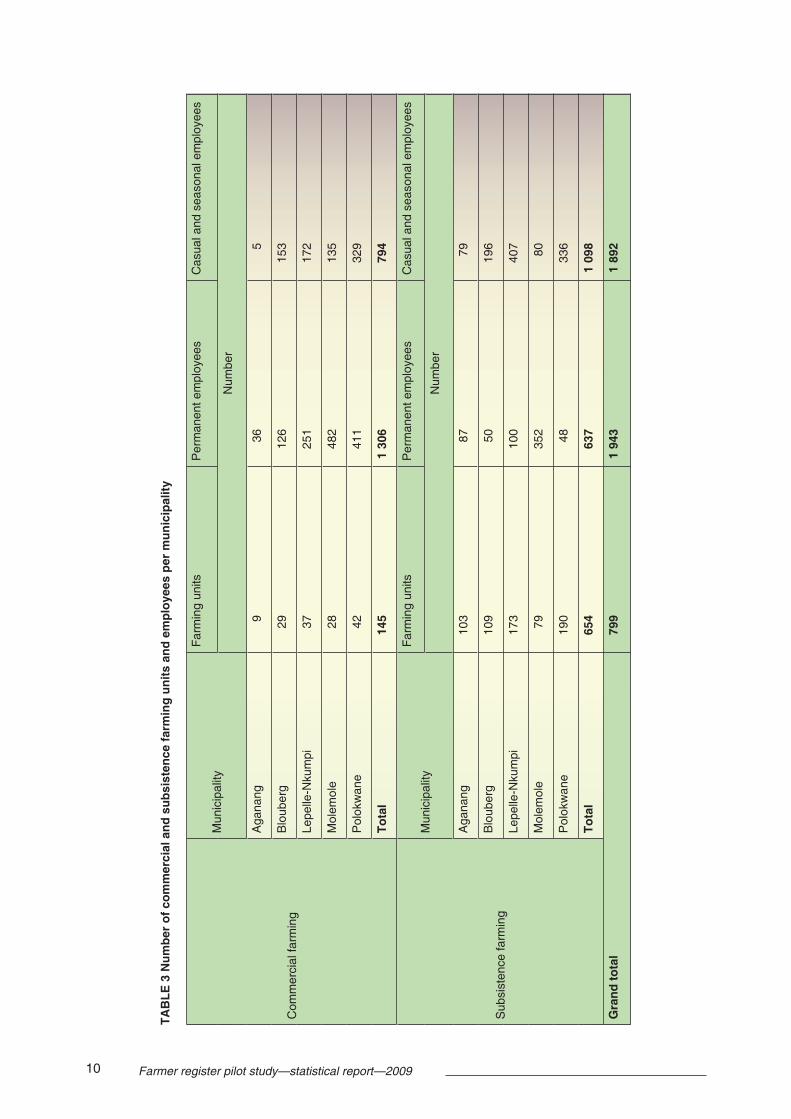
10 Farmer register pilot study—statistical report—2009
TA
BL
E 3
Nu
mb
er o
f co
mm
erci
al a
nd
su
bsi
sten
ce f
arm
ing
un
its
and
em
plo
yees
per
mu
nic
ipal
ity
Com
mer
cial
farm
ing
Mun
icip
ality
Far
min
g un
itsP
erm
anen
t em
ploy
ees
Cas
ual a
nd s
easo
nal e
mpl
oyee
s
Num
ber
Aga
nang
936
5
Blo
uber
g29
126
153
Lepe
lle-N
kum
pi37
251
172
Mol
emol
e28
482
135
Pol
okw
ane
4241
132
9
To
tal
145
1 30
679
4
Sub
sist
ence
farm
ing
Mun
icip
ality
Far
min
g un
itsP
erm
anen
t em
ploy
ees
Cas
ual a
nd s
easo
nal e
mpl
oyee
s
Num
ber
Aga
nang
103
8779
Blo
uber
g10
950
196
Lepe
lle-N
kum
pi17
310
040
7
Mol
emol
e79
352
80
Pol
okw
ane
190
4833
6
To
tal
654
637
1 09
8
Gra
nd
to
tal
799
1 94
31
892

11Department of Agriculture, Forestry and Fisheries
TA
BL
E 4
Nu
mb
er o
f fa
rm o
per
ato
rs p
er a
ge
gro
up
, gen
der
an
d r
ace,
per
mu
nic
ipal
ity
60+
yea
rs
Mun
icip
ality
Bla
ckW
hite
Col
oure
dA
sian
Tot
al
Mal
eF
emal
eM
ale
Fem
ale
Mal
eF
emal
eM
ale
Fem
ale
Mal
eF
emal
e
Num
ber
Aga
nang
4410
00
00
00
4410
Blo
uber
g42
100
00
00
042
10
Lepe
lle-N
kum
pi58
220
00
00
058
22
Mol
emol
e31
81
00
00
032
8
Pol
okw
ane
6637
10
00
00
6737
To
tal
241
872
00
00
024
387
36 to
59
year
s
Mun
icip
ality
Bla
ckW
hite
Col
oure
dA
sian
Tot
al
Mal
eF
emal
eM
ale
Fem
ale
Mal
eF
emal
eM
ale
Fem
ale
Mal
eF
emal
e
Num
ber
Aga
nang
1932
00
00
00
1932
Blo
uber
g27
440
00
00
027
44
Lepe
lle-N
kum
pi55
530
00
00
055
53
Mol
emol
e27
224
30
00
031
25
Pol
okw
ane
5068
30
00
00
5368
To
tal
178
219
73
00
00
185
222

12 Farmer register pilot study—statistical report—2009
TA
BL
E 4
Nu
mb
er o
f fa
rm o
per
ato
rs p
er a
ge
gro
up
, gen
der
an
d r
ace,
per
mu
nic
ipal
ity
(co
nti
nu
ed)
16 to
35
year
s
Mun
icip
ality
Bla
ckW
hite
Col
oure
dA
sian
Tot
al
Mal
eF
emal
eM
ale
Fem
ale
Mal
eF
emal
eM
ale
Fem
ale
Mal
eF
emal
e
Num
ber
Aga
nang
16
00
00
00
16
Blo
uber
g8
50
00
00
08
5
Lepe
lle-N
kum
pi12
100
00
00
012
10
Mol
emol
e6
41
00
00
06
5
Pol
okw
ane
45
00
00
00
45
To
tal
3130
10
00
00
3131
Gra
nd
to
tal
450
336
103
00
00
459
340

13Department of Agriculture, Forestry and Fisheries
TA
BL
E 6
Nu
mb
er o
f fa
rmin
g u
nit
s p
er a
gri
cult
ura
l act
ivit
y, p
er m
un
icip
alit
y
Mun
icip
ality
Live
stoc
kH
ortic
ultu
reF
ield
cro
pA
quac
ultu
reO
ther
Num
ber
Aga
nang
4329
530
0
Blo
uber
g32
9843
00
Lepe
lle-N
kum
pi59
138
431
0
Mol
emol
e53
4937
00
Pol
okw
ane
7171
128
10
To
tal
258
385
304
20
TA
BL
E 5
Nu
mb
er o
f fa
rmin
g u
nit
s an
d e
mp
loye
es p
er in
com
e g
rou
p
Cag
tego
ryN
umbe
r of
farm
ing
units
Em
ploy
men
t
Per
man
ent e
mpl
oyee
sC
asua
l and
sea
sona
l em
ploy
ees
Num
ber
R5
mill
ion
or m
ore
210
871
R3
mill
ion ≤
T<
R5
mill
ion
443
90
R50
0 00
0 ≤
T<
R3
mill
ion
814
624
R30
0 00
0 ≤
T<
R50
0 00
010
450
71
R20
0 00
0 ≤
T<
R30
0 00
01
750
R10
0 00
0 ≤
T<
R20
0 00
052
108
284
T<
R10
0 00
059
068
51
392
Per
sona
l Con
sum
ptio
n97
00
Inac
tive
350
0
Tot
al79
91
943
1 89
2
T =
turn
over

14 Farmer register pilot study—statistical report—2009
TA
BL
E 7
Nu
mb
er o
f fa
rmin
g u
nit
s b
enefi
tin
g f
rom
lan
d r
edis
trib
uti
on
an
d a
gri
cult
ura
l fi n
ance
pro
gra
mm
es p
er m
un
icip
alit
y
Com
mer
cial
fa
rmin
g
Mun
icip
ality
Land
red
istr
ibut
ion
prog
ram
mes
Agr
icul
tura
l fi n
ance
pro
gram
mes
SLA
GLR
AD
Oth
erM
afi s
aC
AS
PA
griB
EE
Oth
er1
Num
ber
Aga
nang
00
00
00
0
Blo
uber
g0
00
02
00
Lepe
lle-N
kum
pi0
00
00
00
Mol
emol
e0
00
00
00
Pol
okw
ane
20
00
10
0
To
tal
20
00
30
0
Sub
sist
ence
fa
rmin
g
Mun
icip
ality
Land
red
istr
ibut
ion
prog
ram
mes
Agr
icul
tura
l fi n
ance
pro
gram
mes
SLA
GLR
AD
Oth
erM
afi s
aC
AS
PA
griB
EE
Oth
er1
Num
ber
Aga
nang
00
00
00
2
Blo
uber
g1
00
01
08
Lepe
lle-N
kum
pi0
00
00
00
Mol
emol
e2
100
00
00
Pol
okw
ane
07
00
10
4
To
tal
317
00
20
14
Gra
nd
to
tal
517
00
50
14
1 Ref
ers
to th
e fo
llow
ing:
• Li
mpo
po B
usin
ess
Sup
port
Age
ncy
(LIB
SA
)•
Lim
popo
Agr
icul
tura
l Dev
elop
men
t Pro
gram
me
(LA
DE
P)
• M
AC
DE
V•
FIN
LAN
D•
Esk
om•
Dep
artm
ent o
f Hea
lth