farmland values as an indicator of regional economic
TRANSCRIPT

V 10 no 6 bull JulyAug 00
Farmland Values as an Indicator of Regional Economic Performance Steven C Blank
Real values per acre of farmland show that Californiarsquos agricultural sector has performed better economically than sectors in other leading agricultural states Nevertheless urban influences on farmland values are a national pheshynomena that make it difficult to evaluate local agricultural competitiveness
Also in this issue
Marketing a Mediterranean Diet Some Issues and Opportunities Hoy F Carman 5
Brand Loyalty and Gasoline Pricing in Sacramento Jennifer R Thompson 9
Traditional farmland valuation theoryrsquos presumption of a direct link between production income
and farmland values means that those values should serve as an indicator of economic performance for a geographic area Unfortunately one shortcoming of relying on the traditional theory is that it can lead analysts to overstate the competitiveness of agriculture in states or local areas For example it is easy to misinterpret recent increases in farm real estate values as evidence of strong profitability (which is an indicator of competitiveness) in the production agriculture sector because (according to the traditional theory) ldquoin rural areas agricultural land values are primarily determined by the income earning potential of the land as meashysured by expected returns from crops and livestockrdquo (USDA 2000) However as the following discussion illustrates a more detailed assessment of the facts related to farmland values across locashytions gives a much different outlook
The fact that average farmland values across the United States have risen for two decades masks the fact that long-run performance of farmland values tells a different story for specific locations Also recent changes in the markets for farm real estate and the implications of those changes are often overlooked when assessing local agricultural comshypetitiveness Therefore to provide a long-run perspective illustrating the need for a modified view of farmland
values as an indicator of competitiveshyness the next section presents farmland value data for the past three decades and a summary of the US Department of Agriculturersquos (USDArsquos) explanation for the recent increases Then a simple analysis shows what types of new factors need to be added to valuation theory to make farmland values a better economic indicator
The Data Nominal and Real To begin Table 1 presents farm real estate average values per acre in nomishynal and real dollars for the period of 1980 to 2006 as reported by the USDA Data are presented for the entire United States plus separate values for the three states with the highest levels of agricultural sales revenue California Texas and Iowa The farmland nomishynal value levels in the four columns on the left are quite different but in each case the effects of the ldquofarm crisisrdquo of the 1980s is apparent Values peak in some years during the earlymid-1980s fall for a few years and then begin a recovery Farm real estate values had increased rapidly in the decade prior to the ldquofarm crisisrdquo but the changes in lending practices that followed the crisis were supposed to have reestabshylished the fundamental link between land values and local commodity market performance across the United States Variation between the aggregate national values and the values in each of the states calls for a closer look
For the United States the nominal price peak of $823 per acre occurred in 1982 the bottom was in 1987 and the recovery was completed in 1995 when values rose above the level of the earlier peak The recovery was even slower if real values are considered instead of nominal values Using the Consumer Price Index to convert the average farmshyland values into real terms (in 2006 dollars) gives an early peak of $1603 per acre in 1981 and a low of $947 in 1987 Thus the real data show that the decline was steeper than indicated by
the nominal data there was a 41 pershycent drop in real values and a 23 pershycent drop in nominal values Also the US farmland market on average did not completely recover until 2005 when real values passed the early peak of $1603 In other words farmland values are now about the same as they were a generation ago So in real purchasing power terms farmersrsquo wealth has not increased over that period
For the three leading agricultural states very different pictures emerge from the data in Table 1 indicating that
Table 1 Farm Real Estate Average Values 1980ndash006 ($acre)
Year Nominal Value Real Value (base=2006)
United United CA Texas Iowa CA Texas Iowa
States States
1980 737 1424 436 1840 1578 3049 933 3939
1981 819 1732 468 1999 1603 3390 916 3912
1982 823 1900 539 1889 1518 3505 994 3484
1983 788 1918 544 1684 1398 3404 965 2989
1984 801 1981 612 1518 1370 3388 1047 2596
1985 713 1841 694 1091 1183 3056 1152 1811
1986 640 1730 594 873 1039 2809 965 1418
1987 599 1554 546 786 947 2457 863 1243
1988 632 1575 544 947 966 2408 832 1448
1989 668 1742 521 1095 984 2566 767 1613
1990 683 1884 507 1090 969 2672 719 1546
1991 703 2077 498 1139 963 2846 682 1561
1992 713 2157 488 1153 955 2889 654 1544
1993 736 2213 499 1212 964 2897 653 1587
1994 798 2210 515 1280 1023 2833 660 1641
1995 844 2220 525 1350 1060 2789 660 1696
1996 887 2400 540 1450 1094 2959 666 1788
1997 926 2500 554 1600 1123 3032 672 1940
1998 974 2610 593 1700 1168 3130 711 2039
1999 1030 2800 640 1760 1218 3310 757 2081
2000 1090 3000 680 1800 1261 3471 787 2083
2001 1150 3200 730 1850 1299 3616 825 2090
2002 1210 3400 775 1920 1344 3776 861 2132
2003 1270 3600 810 2010 1381 3915 881 2186
2004 1360 3800 855 2200 1438 4018 904 2326
2005 1650 5090 1030 2650 1693 5224 1057 2720
2006 1900 5390 1250 2930 1900 5390 1250 2930
Source ldquoLand Valuesrdquo spreadsheets on the Webpages of the Economic Research Service USDA
Midwestern agriculture has not comshypletely recovered from the farm crisis of the 1980s whereas California has done well In nominal dollars California farm real estate peaked later and recovshyered sooner (in 1984 and 1991 respecshytively) than did the national average values Texas farm real estate values peaked at $694 in 1985 and after their 1992 bottom finally rebounded by 2001 In Iowa nominal farm real estate values peaked at $1999 in 1981 hit bottom in 1987 and appeared to recover by 2003 However these values do not reflect the effects of inflation The real performance of farm real estate in the three states was worse and it shows the differences in demand for farmland in the three different regions Californiarsquos average values recovered to the ldquopre-crisisrdquo level by 2001 and in 2006 real values were about 54 percent above their earlier peak (reached in 1982) Texas farm real estate did not recover to its 1985 peak until 2006 when it was just nine percent above the previous high Iowa still has not recovshyered in real terms Iowarsquos average value in 2006 was only 74 percent of the real 1980 value Clearly the economic pershyformance of the three state agricultural industries has varied over the last three decades with California doing the best
Agricultural income generally has not been strong over the last three decades so what has been pushing up farmland values in recent years One answer was provided by the USDA
ldquoAlthough average agricultural land values nationally are determined primarily by the income earning potential of the land nonagriculshytural factors appear to be playing an important role in many local areas To some extent the buoying effect of these nonagricultural factors on agricultural land values could be partially offsetting the effect of lower returns from agricultural productionrdquo
Giannini Foundation of Agricultural Economics bull University of California
What the USDA report called ldquourban influencerdquo affects only about 17 percent of US farm acreage The USDA classishyfies only 515 counties in the United States as being both completely rural (containing no part of a city with at least 2500 residents) and not adjacent to a metro area In all remaining counshyties the USDA says there is some degree of urban influence on land values Urban influence has a significant impact on farmland values The USDA estishymated that during 1994ndash1996 the avershyage value of farmland that was not urban-influenced was $640 per acre compared to $1880 for urban-influshyenced farmland Thus USDA concluded that 66 percent of urban-influenced farmland market value was due to nonshyagricultural factors
ldquoThe market value for undeveloped farmland in these areas often begins to rise above its value based on agricultural returns alone reflecting anticipation of eventual nonagriculshytural usesrdquo
That explains why Rhode Island had the nationrsquos highest average farm real estate value during 2006 at $12500 per acre In densely populated areas along the East and West Coasts the amount of urban influence on farmland values can be extreme For example in 2001 a 35-acre parcel of farmland in Califorshyniarsquos Ventura County was valued at about $300000 per acre due almost entirely to its development potential Such examples can skew the distribushytion of farmland values within a state and quickly raise the average
The USDA study results offer two factors as partial explanations for the differences in farmland values observed for the three leading agricultural states First is the potential profitability of the crops that can be grown on a parcel of land which is the traditional theory Second is the potential for nonagriculshytural uses of a parcel which is one of the most significant sources of
ldquoadjustmentsrdquo that need to be made to values derived from the traditional theory For California the prospects for both factors are better than are the prospects for Texas and Iowa so farmshyland values are higher in the Golden State and have made a stronger recovery relative to values observed before the farm crisis of the 1980s
ldquoFarmland values are higher in the Golden State and have made a stronger recovery relative to values observed before the farm
crisis of the 1980srdquo
So in the cases of these three states farmland values generally do serve as an agricultural economic barometer although the traditional theory of prices is clearly incomplete because it cannot account for the confounding effects of the modern factors requiring ldquoadjustshymentsrdquo to traditional price estimates Part of the problem is that there has never been an exhaustive evaluation of the many factors that influence farmshyland values Such a task may be imposshysible because each location will have a unique list of factors but some general categories of factors are beginning to emerge in the literature
The Relative Importance of Pricing Factors In addition to the two factors discussed in the USDA report two othersmdashpolicy effects and amenity valuesmdashmay conshytribute to farmland values according to a growing new literature There is now little debate remaining about whether agricultural policies influence farmland values as even the government acknowledges that there is an influence (see for example USDA 2001) Howshyever many questions remain about the nature extent and direction of the influence It is easy to see that governshyment policies aimed at increasing
returns from farming activities would affect farmland values yet other polishycies such as land use restrictions are less obvious in their effects The effects of amenities on land values are parcel-specific and can be measured only with individual sales data thus much less empirical research was done on this subject until recently As sales data began to become available studies like that by Torell et al began to show that ldquolifestyle amenitiesrdquo (such as a desirshyable location and recreational opportushynities) explained much more of rural land value than did the productivity of the land in many areas The range of amenities and the scale of their effects on prices are often surprising
Thus the story will differ by locashytion but the message is the same there are four categories of influence on farmshyland values The first of these categoshyries agricultural productivity is the basis of the traditional theory of valuashytion The other three categories are types of ldquoadjustmentsrdquo to the traditional value
The discussion above implies that farmland valuation has become much more complicated in the last couple decades An increasing number of facshytors have been shown to influence farmshyland values thus adding to the list of necessary ldquoadjustmentsrdquo to the tradishytional model A recent study by Huang et al illustrates how involved price analysis has become They estimated a model of Illinois farmland values using county-level cross-section time-series data Explanatory variables included land productivity parcel size improveshyments distances to Chicago and other large cities an urban-rural index liveshystock production (using swine operashytion scale and farm density measures) population density income and inflashytion They concluded that farmland values per acre decline with parcel size ruralness distance to Chicago and large cities and swine farm density and increase with soil productivity
Giannini Foundation of Agricultural Economics bull University of California
Table Estimation Results for Farmland Value Equations by Region 1996ndash00
Variable Northeast Lake States Corn Belt Appalachia Southeast Delta
Southern Plains
Northern Plains Mountain Pacific
Revenue Per Acre 0155 -0020 0221 0012 0018 0152 ndash0057 0298 4139 0083
Govrsquot Payments ndash7184 3535 33272 4378 0714 ndash2455 ndash7007 1243 ndash3934 0473
Cost Capital ndash0156 ndash0001 ndash0027 ndash0004 ndash0028 ndash0008 0006 ndash0008 ndash0082 0054
Productivity 0037 0035 ndash0052 0030 0188 ndash0146 0067 -0230 -3997 -0058
Population Density 0007 0004 0005 0008 0009 0005 0004 0008 0032 0028
The value in each cell is the variablersquos regression coefficient denotes statistical significance at the 90 confidence level
population density and personal income Clearly valuation models are changing
With so many factors to be considshyered in modeling farmland values a natural question arises which one(s) is (are) the most important in todayrsquos market To answer that question a simple analysis was conducted Farm-level survey data from across the continental United States were used to estimate simple equations for farmland values over the 1996ndash2004 period To begin a single equation for the average farmland value was estimated for each of the ten geographic regions of the country The explanatory variables included were proxies for three of the four categories of influence on farmland values Productivity of the land was proxied by two variables revenue per acre and a productivity index Urban influence was proxied by a county popshyulation density measure Policy effects were proxied by the amount of governshyment payments received per acre Ameshynity effects are specific to individual parcels thus they cannot be estimated using aggregated data and were thereshyfore excluded from this analysis One additional explanatory variable was included the cost of capital was used to represent the financial factors in a market
The empirical results of the statistishycal analysis for each of the ten regions are presented in Table 2 The key result is that the proxy variable for the non-farm demand for farmlandmdashcounty
population density by yearmdashwas signifshyicant in all regions (meaning there was a 90 percent or better probability that the variablersquos effect was greater than zero) This is consistent with the growshying realization that non-farm demand for farmland is increasingly influencing farmland values even in areas such as the Corn Belt and Northern Plains where economies were dominated by production agriculture in the last censhytury The population density variable swamped the effects of the four other variables meaning that population was much more often significant across the ten regional equations This result is consistent with the USDArsquos results which showed a dramatic increase in farmland value when a parcel was in an urban- influenced area Thus the proxshyimity of a farmland parcel relative to nonagricultural development is a key factor in pricing This implies that no commodity can generate enough reveshynue to adequately compete with expanding urban development meanshying that land-use ordinances may be needed to preserve farmland in urbanizshying areas
In summary the traditional theory that farmland values are influenced prishymarily by the landrsquos ability to generate profits from agricultural production may still be true for some farms in some locations but for all regions urban influence is the dominant factor in the valuation process This change in American farmland markets has been caused by the evolution of the national
economy It signals that economic development is ongoing and more change is coming all making farmland values more of an indicator of general economic performance and less an indishycator of agricultural competitiveness
Steven C Blank is a Cooperative Extension Specialist in the Department of Agricultural and Resource Economics at UC Davis He can be contacted by e-mail at sblankprimalucdavis edu
For more information the author recommends the following
Huang H G Miller B Sherrick and M Gomez ldquoFactors Influencing Illinois Farmland Valuesrdquo American Journal of Agricultural Economics 88 2 (2006) 458ndash470
Torell A N Rimbey O Ramirez and D McCollum ldquoIncome Earning Potential versus Consumptive Amenities in Determining Ranchland Valuesrdquo Journal of Agricultural and Resource Economics 30 3 (2005) 537ndash560
US Department of Agriculture ldquoAccumulated Farm Real Estate Value Will Help Farmers and Their Lenders Through Period of Declining Cash Receiptsrdquo Agricultural Income and Finance Situation and Outlook Economic Research Service AIS-74 February 2000 pp 30ndash33
US Department of Agriculture ldquoLenders Benefit from the Farm Sectorrsquos Receipt of Government Paymentsrdquo Agricultural Income and Finance Situation and Outlook Economic Research Service AIS-76 February 2001 pp 5ndash6
Giannini Foundation of Agricultural Economics bull University of California
Marketing a Mediterranean Diet Some Issues and Opportunities Hoy F Carman
The popular Mediterranean diet features many products that are produced extensively in California Some California commodity groups are already emphasizing links to the diet through promotion and research efforts
Movement toward a Mediterranean diet has significant economic implications for California agriculture especially the fruit vegetable and nut sectors
Photo courtesy of UC Regents
The Mediterranean diet is a comshymonly used term denoting tasty cuisine healthful eating and a
healthy lifestyle The popular press in the United States has featured articles on the components of the Meditershyranean diet including the healthful effects of moderate consumption of wine especially red wine the health benefits of substituting plant-based oils especially olive oil for animal fats and increased fruit nut and vegetable consumption While conshysumers have responded to articles and news stories about the Meditershyranean diet most have only a vague idea of the overall diet framework
The existence of some confusion should not be surprising Many books about the Mediterranean diet have been written For example a quick search of the Amazoncom Website for books on the Mediterranean diet brought up a list of 1569 entries The titles included diet books cookbooks and books on wine omega-3 fats diet and disease (arthritis cancer diabetes heart disshyease hypertension allergies and asthma) diet and longevity weight loss and many other topics Organizashytions that include the Oldways Presershyvation and Exchange Trust the Founshydation for the Advancement of the Mediterranean Diet the Mayo Clinic and the Harvard University School of Public Health have published diet pyrashymids modeled after the US Departshyment of Agriculturersquos (USDArsquos) pyrashymids
A brief examination of a world map reveals some 21 countries bordering the Mediterranean Sea including those typically associated with a Mediterrashynean lifestyle such as Spain France Italy Greece and Turkey Northern African Middle Eastern and Balkan countries Major differences in culture ethnic backgrounds religion and clishymate guarantee significant dietary difshyferences both between and within countries As noted in the American Heart Association (AHA) Website there is no one ldquoMediterraneanrdquo diet The Mediterranean diet as typically presented appears to be inspired by traditional diets in Southern Italy Greece and Spain A pyramid illustratshying the Oldways Preservation and Exchange Trust version of the Meditershyranean diet is on the next page
The AHA outlines the common Mediterranean dietary pattern as having the following characteristics
uuml High consumption of fruits vegetashybles bread and other cereals potatoes beans nuts and seeds is a primary focus of the plan uuml Olive oil is an important monounshysaturated fat source uuml Dairy products fish and poultry are consumed in small to moderate amounts and little red meat is eaten uuml Eggs are consumed zero to four times a week uumlWine is consumed in small to modshyerate amounts
Diet Impacts Health problems related to food conshysumption are described as being in a ldquocrisis stagerdquo in the United States and many other countries Widespread obesity is obvious in our society Not so obvious are the health probshylems directly linked to obesity and diet including heart disease stroke diabetes various forms of cancer maladies associated with aging and numerous quality-of-life problems Health professionals government officials and others concerned with the enormous costs associated with current consumption patterns are promoting policies and programs to improve diets and health outcomes
Movement toward a Mediterranean diet and similar consumption patterns based on other dietary plans has signifishycant economic implications for Califorshynia agriculture especially the fruit vegetable and nut sectors Buzby Wells and Vocke estimated the potenshytial implications if Americans change their consumption patterns to meet the USDArsquos 2005 dietary guidelines for Americans They estimate that if Amershyicans were to fully meet 2005 guideshylines they would need to increase daily fruit consumption by 132 percent
Giannini Foundation of Agricultural Economics bull University of California
Figure 1 The Traditional Healthy Mediterranean Diet Pyramid
CHEESE amp YOGURT CHEESE amp YOGURTCHEESE amp YOGURT
FISH POULTRY
EGGS
SWEETS
MEAT
VEGETABLES BEANS LEGUMES amp NUTS
FRUITS
OLIVE OIL
BREAD PASTA RICE COUSCOUS POLENTA OTHER WHOLE GRAINS amp POTATOES
Daily Physical Activity
Weekly
Monthly
Daily
Daily Beverage Recommendations 6 Glasses of Water
Wine in Moderation
Source The Oldways Preservation and Exchange Trust
(from 09 cups to 20 cups per day) and vegetable consumption by 31 percent (from 19 to 25 cups per day) There would also be shifts within the vegetashyble category from starchy vegetables to legumes and dark green and orange vegetables These shifts would require that annual US harvested fruit acreage increase from 35 to 76 million acres and that annual US harvested vegetashyble acreage increase from 65 to 153 million acres
Rickard and Gonsalves examined the economic effects that compliance with seven different dietary plans would have for 50 of the highest value crop markets in California agriculture many of which are specialty crops Dietary plans offered as alternatives to the USDA food guidelines include the Harshyvard model the Mayo Clinic model the Mediterranean diet model the DASH model and the Atkins Diet model among others Rickard and Gonsalves found that six of the seven diets they examined would generate additional revenue for most of the specialty crops grown in California The lone exception was the Atkins Diet which resulted in decreased revenue for 41 of the 50
crops The Harvard model generated the most additional revenue for 38 of the 50 crops but the Mediterranean diet increased revenue nearly as much as the Harvard model It is interesting to note that estimated changes in gross revenue for each crop vary by diet plan For example estimated gross revenue for romaine lettuce increases 673 percent for the Harvard plan and 280 percent for the DASH model revenue for carshyrots increases 456 percent for the Harshyvard plan 308 percent for the Meditershyranean diet and 174 percent for the USDArsquos My Pyramid model
Individual Product Recommendations Consumers make individual product-purchase decisions with the overall diet composed of the sum of purshychase and preparation decisions The popularity of health claims placed on food products provides evidence that many consumers include health conshysiderations when making purchase decisions There is limited evidence however that the majority of consumshyers most in need of diet modification are following an overall diet plan such
as those presented by the popular diet pyramids One can hypothesize that consumers are interested in benefits derived from their food consumpshytion In addition they will choose to consume particular food products and commodities based on known benefits and choose to not consume particushylar food products and commodities based on known or supposed dangers Using this model guiding consumers toward consumption of a Mediterrashynean diet would be best accomplished by conducting nutrition and medical research on individual food products and commodities and emphasizing the consumption of individual diet components through use of a diet logo or similar device Some US producer organizations are already funding nutrition and medical research for their individual products with interestshying results and partnering with health organizations Following is a brief sumshymary of research and promotion proshygrams being conducted by four large California commodity organizations the California Walnut Commission the Almond Board of California the California Avocado Commission and the California Strawberry Commission
Commodity Nutrition and Health Research The California Walnut Commission (CWC) was one of the first US comshymodity groups to fund health and nutrition research when it decided to counter diet recommendations urging consumers to reduce or constrain consumption of nuts because of their high oil content In 1990 the CWC funded its first project with researchshyers at Loma Linda University on the protective effects of nut consumption on the risk of coronary heart disease The Almond Board of California (ABC) established a nutrition research program and nutrition subcommitshytee in 1995 to review the scientific validity of proposals and recommend
Giannini Foundation of Agricultural Economics bull University of California 6
studies for funding During 1997 the California Avocado Commission (CAC) made a strategic change to pro-actively communicate the nutritional benefits of avocados through national public relations and outreach efforts The California Strawberry Commisshysion (CSC) began funding nutrition research proposals in 2003 and now issues an annual request for proposshyals This research has already yielded results that are being used in the CSC advertising and promotion programs
The CWC which has the longest ongoing health and nutrition research program began with studies on the relationships between walnut consumpshytion and risk from coronary heart disshyease and cholesterol levels The examishynation of relationships between walnut consumption and heart health continshyued with a combination of epidemiologshyical and clinical studies conducted by leading universities in the United States France New Zealand Spain Norway and Japan that were published in medishycal nutrition and science journals These studies indicate that walnuts reduce LDL cholesterol and heart disshyease risk that the fatty acids in walnuts improve the function of arteries that consuming walnuts reduces cell adheshysion molecules and enhances the circushylatory system and that omega-3 fatty acids in walnuts reduce inflammation in arteries More recent studies indicate that melatonin in walnuts protects against cancer and heart disease and that omega-3s reduce blood pressure arterial inflammation and the stickiness of platelets Additional studies have shown that walnuts have antidepresshysant-like effects that they can help in weight management and that consumpshytion of walnuts is protective for people with Type 2 diabetes Also the form of vitamin E found in walnuts might halt the growth of prostate and lung-cancer cells Walnuts have high concentrations of antioxidants which help the body ward off life-threatening maladies such
as cancer heart disease and diabetes as well as debilitating ailments such as arthritis osteoporosis and Alzheimerrsquos disease Research funded by the other three commodity groups has resulted in reports on the health and nutritional benefits of consuming almonds avocashydos and strawberries
The CWC used its research results to secure a qualified health claim for walnuts from the US Food and Drug Administration (FDA) in 2003 The final wording for the claim issued in 2004 states
ldquoSupportive but not conclusive research shows that eating 15 ounces per day of walnuts as part of a diet low in saturated fat and choshylesterol may reduce the risk of heart disease See nutrition information for fat contentrdquo
The ABC also submitted research results for almonds as part of a nut-industry submission to the FDA In 2003 the FDA also approved a qualified health claim for almonds (and other nuts) that states
The California Walnut Commission which has the longest ongoing health and nutrition research program began with studies on the relationships between walnut consumption and the risk from coronary heart disease and cholesterol levels
Photo courtesy of the California Walnut Commission
ldquoScientific evidence suggests but does not prove that eating 15 ounces per day of almonds as part of a diet low in saturated fat and cholesterol may reduce the risk of heart diseaserdquo
The CSC has a stated goal of assemshybling the research support necessary to secure approval of a health claim for strawberries from the FDA and the CAC is in the process of determining inforshymation needed and the feasibility of submitting a qualified health claim for avocados and heart health
The nutrition and health research and promotion programs funded by the ABC the CAC the CSC and the CWC have other important similarities and differences Each commodity group has formed a nutrition or scientific-advisory committee that includes well-known and knowledgeable nutritionists and medical researchers to provide ideas and advice on research areas nutrition-based programs and outreach efforts Each commodity also maintains an Internet Website that provides detailed information on the nutrition and health
Giannini Foundation of Agricultural Economics bull University of California
benefits of consumption of the comshymodity While the research thrusts for the four groups are similar their advertising and promotion strategies differ The ABC first emphasized public relations for its health message and then shifted almost all advertising and proshymotion to a health message The CSC has focused all consumer communicashytions on a health message since initiashytion of its program in 2003 The CAC continues to use only public relations for its health message to consumers but targets health and nutritional professhysionals with promotional materials The CWC emphasizes public relations for dissemination of its health message but has also included an advertising health message in several export markets (Spain Italy and Germany) Overall consumer and media interest in diet and health issues appears to assure cost- effectiveness for public relations proshygrams For example the ABC increased public relations expenditures to $1 milshylion during 19981999 but estimated that the advertising value equivalency of exposures related to the health beneshyfits of consuming almonds increased to $7 million The CWC estimates that publicity generated as a result of the FDA ruling on the qualified health claim for walnuts generated more than 70 million impressions by the end of the 200304 crop year from news stoshyries magazine articles and associated publicity on diet and health Media impressions attributed to the CWC public relations program in the United States increased from a little more than one billion in 200102 to more than two billion in 200405 The cost per million impressions decreased from $059 in 2001-02 to $037 in 2004-05 Partnershying by the ABC the CAC and the CWC with organizations such as the AHA provides product exposure in diets offering particular benefits such as heart-healthy diets healthy food choices for diabetics or weight-control diets The funds allocated to nutrition
research by each organization tend to add to total research rather than substitute for traditional research on production and postharvest problems
Concluding Comments Health and disease problems related to food consumption are motivatshying consumers around the world to choose diets that promote healthy outcomes These same problems are motivating governments and others with a desire for a healthier populashytion to try to improve human diets The Mediterranean diet based on historic research of consumption patshyterns in Crete and Italy that may no longer be descriptive of existing diet patterns is associated with good health longevity and reduced heart disease The Mediterranean diet has received a large amount of favorable publicity in the United States but there is no one Mediterranean diet
While different organizations and individual authors have presented a variety of diets labeled as Meditershyranean foods included in the diet as commonly presented are accepted as likely to lead to healthful outcomes There appears to be a market for a Mediterranean-type diet if properly defined and marketed Success will depend on proper selection of ldquotargetrdquo markets together with imaginative and effective product development and positioning Careful examination of the effectiveness of relying on a diet pyramid versus promoting the healthshyful aspects of individual foods that are included in the pyramid is needed There is an opportunity for a well-organized and properly funded orgashynization with excellent leadership to successfully market a Mediterranean-type diet and improve health outcomes in target markets around the world It will require vision commitment time and a marketing orientation
Hoy F Carman is a professor in the Department of Agricultural and Resource Economics at UC Davis He can be reached by e-mail at carman primalucdavisedu
For more information the author recommends the following
Buzby Jean C Hodan Farah Wells and Gary Vocke Posshysible Implications for US Agrishyculture From Adoption of Select Dietary Guidelines USDA Ecoshynomic Research Service ERRshy31 November 20 2006 35 pages Available at wwwers usdagovpublicationserr31
Rickard Brad and Jana Gonsalves Examining Potential Changes in Nutrition Recommendations and Implications for Specialty Crops in California Report Preshypared for the California Instishytute for the Study of Specialty Crops California Polytechshynic State University San Luis Obispo April 30 2006 Availshyable athttpcissccalpolyedu research49946FinalReportpdf
Giannini Foundation of Agricultural Economics bull University of California 8
Brand Loyalty and Gasoline Pricing in Sacramento Jennifer R Thompson
Retail gasoline prices are known to vary substantially among retail stations Evidence from gasoline markets in Sacramento suggests that these price differences exist and persist because the marketing of supposed differences in branded gasoline is enough to split the ldquoretail gasolinerdquo market into two submarkets each supporting a different price
A brand-loyal consumer may not even be buying gasoline produced by that brandrsquos refiner
Photo by Jennifer Thompson
One interesting feature of retail gasoline prices is that they can vary at different stations on the
same day The retail station is the last link of a long marketing chain Once produced at a refinery gasoline is transshyported throughout the United States in pipelines and waterborne barges to wholesale terminals found along the network of pipelines and marine ports Sometimes unfinished gasoline is transported this way to a refinery for completion and then transported a second time through the network
California consists of four wholesale marketing areas Eureka Northern California Bakersfield and Southern California Sacramento is in the Northern California wholesale marketshying area Once at the wholesale terminals (called ldquoracksrdquo) gasoline is stored until the distributors whose trucks carry 7500ndash10000 gallons buy gasoline for delivery to retail stations
In Sacramento during June 2007 difshyferences between retail prices on the same day averaged 115 cents per gallon and reached as high as 182 cents per gallon Such price differences can persist for long periods In Sacramento the largshyest daily spatial price spreadmdashthe differshyence between prices at two different retail stations on the same daymdashnever fell below 10 cents per gallon during June
According to the law of one price prices at different retail stations should not differ by more than the cost to the consumer of traveling between the two stations With retail stations clustering on city streets the consumersrsquo travel cost is negligible Consequently the prices among retail stations ought not to differ by much Therefore some other force must contribute to the persistent differshyence in spatial prices Two possibilities are influences from the marketing chain price pass-through and consumer prefershyences namely as brand loyalty
Price Pass-through In 2003 the Energy Information Administration (EIA) conducted a study about gasoline pricing through the marketing chain in the United States Specifically the EIA quantified the effect on retail prices of a price-changing shock in the gasoline spot market The EIA concluded that 100 percent of spot market price changes
are transmitted to retail prices This is the so-called price pass-through effect
The wholesale market is the marketshying level between the spot and retail markets While the EIA only examined the spot-to-retail effect implicit in their hypothesis is that prices pass from spot through wholesale to retail Thus there should be a visible pass-through effect from wholesale to retail
Where there is a one-to-one pass-through of a price change from one price series to another the price series should move together In a case like gasoline where the price series represent different marketing levels there might be a markshyup from say wholesale to retail Such a mark-up will affect the averages of the two series but the direction magnitude and duration of the changes in each series should be comparable regardless
Figure 1 shows the daily wholesale and retail prices in Sacramento during June 2007 These two price series do not move together Several explanations might apply With only twenty-six observations this could be an anomaly in the data In addition the pass-through effect can take up to eight weeks rendershying a single month of data insufficient to capture complete pass-through
Another explanation is there is more going on in the Sacramento gasoline markets than the simple transmission of price changes from one marketing level to the next Moreover price pass-through is a concept about aggregate market prices over time not about individual company prices at different locations within the same marketing level at the same time Whether price pass-through applies to Sacramento does not address why there are idiosyncrasies among retail-station prices on a daily basis
Giannini Foundation of Agricultural Economics bull University of California 9
cent
s pe
Figure Wholesale Spatial Price Relationships in Sacramento
brand loyalty the competitive force that at the pump and fill the delivery truck would keep the prices at neighboring Distributors differ from consumers stations in line lessens A consumer however in that most cannot choose loyal to Brand A may not act on an where they buy gasoline Some 85 per-opportunity to buy Brand B gasoline cent of distributors buy gasoline under at a lower price The result is persis- a long-term supply contract Specified
10
Brand Loyalty
Although consumers are free to buy gasoline from any retail station at any location at any time many consumers develop preferences for a specific brand of gasoline Brand loyalty describes consumersrsquo decisions to only buy gasoshyline affiliated with their preferred brand regardless of the prices at other stashytions When many consumers exercise
0
0
00
80
60
0
0
00
cent
s pe
r ga
llon
616
0
61
0
611
0
610
0
69
0
68
0
66
0
6
0
6
0
6
0
6
0
61
0
6
0
61
0
619
0
618
0
61
0
61
0
61
0
61
0
6
0
6
0
6
0
6
0
66
0
6
0
68
0
69
0
60
0
60
0
Figure 1 Retail and Wholesale Gasoline Prices in Sacramento
r ga
llon
tently large differences in retail prices in supplier contracts are branding at different locations on a daily basis arrangements and required purchase
Distributors are similar to consum- locations Whereas consumers exercise ers in that a distributor will drive into a brand loyalty distributors have obligashylocal rack see the list of prices on a sign tory purchase points with specific
brands To examine the differences among
gasoline prices at different locations spatial price relationships (SPR) were calculated for wholesale and retail marshykets The SPR examined here is the simple law of one price adjusted for transportation For simplicity assume transportation costs are the only costs of moving product between terminals The SPR is
|Price of supplier i ndash Price of supplier j| -Transportation cost between i and j = 0
The wholesale supplier prices are the prices at which wholesale distributors buy gasoline for resale to retail stations The gasoline sold under a branding agreement is classified as ldquobrandedrdquo
Retail Wholesale Source Oil Price Information Service while the gasoline not sold under conshy
tract is classified as ldquounbrandedrdquo This information is gathered by the Oil Price Information Service and was provided with the price data Wholesale branded gasoline is sold only under contract with the right to sell the brand as much
10 a part of the contract as the product itself8
Figure 2 shows SPRs for three pairs of wholesale supplier prices The first the ldquobranded spreadrdquo is the SPR beshy
6
tween two branded suppliers in Sacrashymento The second the ldquounbranded
spreadrdquo is the SPR between two unshybranded suppliers in Sacramento The
1
616
0
61
0
611
0
610
0
69
0
68
0
66
0
6
0
6
0
6
0
6
0
61
0
6
0
61
0
619
0
618
0
61
0
61
0
61
0
61
0
6
0
6
0
6
0
6
0
66
0
6
0
68
0
69
0
60
0
60
0
1
third the ldquobranded-unbranded spreadrdquo is the SPR between a branded and an unbranded supplier in Sacramento
Unbranded Spread Branded Spread Branded-Unbranded Spread Because branded gasoline is only Source Oil Price Information Service sold under contract distributors cannot
Giannini Foundation of Agricultural Economics bull University of California
0
616
0
61
0
611
0
610
0
69
0
68
0
66
0
6
0
6
0
6
0
6
0
61
0
6
0
61
0
619
0
618
0
61
0
61
0
61
0
61
0
6
0
6
0
6
0
6
0
66
0
6
0
68
0
69
0
60
0
60
0
exercise spatial arbitrage across these suppliers That is a distributor under
1
1
contract to buy gasoline from Brand A cannot buy gasoline from Brand B even if the price is lower Therefore there ought to be more unexploited spatial 10
sumers associate themselves with a among consumers Specifically conports the concept of brand loyalty gasoline markets in Sacramento supstations on a daily basis Evidence from Retail prices typically vary among retail
unbranded gasoline and vice versa branded gasoline will not arbitrage However a consumer who prefers will arbitrage among branded stations consumer trage among unbranded stations If a fers unbranded That is if a consumer pregeneral designation as branded or brand so much as a preference for the not have a these SPRs show that consumers do the other two SPRs Taken together as much higher and more volatile than The branded-unbranded SPR stands out and variability to the unbranded SPR branded SPR is similar in magnitude variability of the three SPRs The retail lowest on average and has the least terpart the retail unbranded SPR is the pronounced Like its wholesale counamong the wholesale SPRs and is more
l
Figure
lon
nc
ts p
eer
ga
-
preference for a particular
-unbranded gasoline he will arbi-
prefers branded gasoline he
Conclusion
-
-
Daily Retail Spatial Price Relationships in Sacramento
arbitrage opportunities represented by nonzero values of the spatial price relashytionship involving branded gasoline prices On the other hand distributors do not need contracts to buy unbranded gasoline and are free to arbitrage across these suppliers Thus there ought to be fewer unexploited arbitrage opportunishyties among unbranded suppliers Figure 2 shows just that The unbranded SPR is lower on average and less volatile than the SPRs involving branded prices
Consumers do not face the conshystraint on buying gasoline that wholeshysale distributors face Consumers are free to buy gasoline from any retail supshyplier regardless of brand and location at any time Moreover studies have shown that retail gasoline is the same across the board Although proprietary brand-specific additives are mixed into the gasoline no substantial differences exist in the performance or emissions across gasoline brands The only differshyentiating factor in retail gasoline is marketing
Interestingly the consumer does not know which gasoline is supplied to which retail station A retailer may be supplied with branded or unbranded gasoline regardless of the retailerrsquos affilishyation It all depends upon the contracts and relationships between the refiner wholesaler and retailer The branding designation only signifies whether the gasoline was sold under a branded conshytract at the wholesale level Therefore a brand-loyal consumer may not even be buying gasoline produced by that brandrsquos refiner This reinforces that
8
6
0
Unbranded Spread Branded Spread Branded-Unbranded Spread Source Oil Price Information Service
general branding designation either ldquobrandedrdquo or ldquounbrandedrdquo The resultshying effects on retail prices are comparashyble to wholesale prices for which disshytributors are associated with both general branding designations and speshycific brands
Consumersrsquo association with some preferred branding designation introshyduces a split in the population that supshypliers might use as a guide for price discrimination Indeed many suppliers offer both branded and unbranded gasshyoline from the same refiner at different prices Whether retail gasoline is charshyacterized by brand loyalty of consumers or price discrimination by suppliers or some combination of both the effect on prices is similar The variation among retail gasoline prices on a daily basis persists because retail gasoline is suffishyciently differentiated by brand to supshyport two pricing schemes
Jennifer Thompson is a PhD candidate in the Department of Agricultural and Resourceretail branding is about marketing
Figure 3 shows the same SPRs for retail gasoline as Figure 2 shows for
Economics at UC Davis She can be reached by e-mail at thompsonprimalucdavisedu
wholesale gasoline The pattern among the retail SPRs mimics the pattern
Giannini Foundation of Agricultural Economics bull University of California 11
Agricultural and Resource Economics
UPDATE
Co-Editors
Steve Blank
Richard Sexton
David Roland-Holst
David Zilberman
Managing Editor and Desktop Publisher
Julie McNamara
Published by the Giannini Foundation of Agricultural Economics
httpgianniniucopedu
ARE Update is published six times per year by the Giannini Foundation of Agricultural Economics University of California
Domestic subscriptions are available free of charge to interested parties To subscribe to ARE Update by mail contact
Julie McNamara Outreach Coordinator Department of Agricultural and Resource Economics University of California One Shields Avenue Davis CA 95616 E-mail julieprimalucdavisedu Phone 530-752-5346
To receive notification when new issues of the ARE Update are available online submit an e-mail request to join our listserv to julieprimalucdavisedu
Articles published herein may be reprinted in their entirety with the authorrsquos or editorsrsquo permission Please credit the Giannini Foundation of Agricultural Economics University of California
ARE Update is available online at wwwageconucdaviseduoutreachareupdatephp
The University of California is an Equal OpportunityAffirmative Action employer
Department of Agricultural and Resource Economics UC Davis One Shields Avenue Davis CA 9616 GPBS
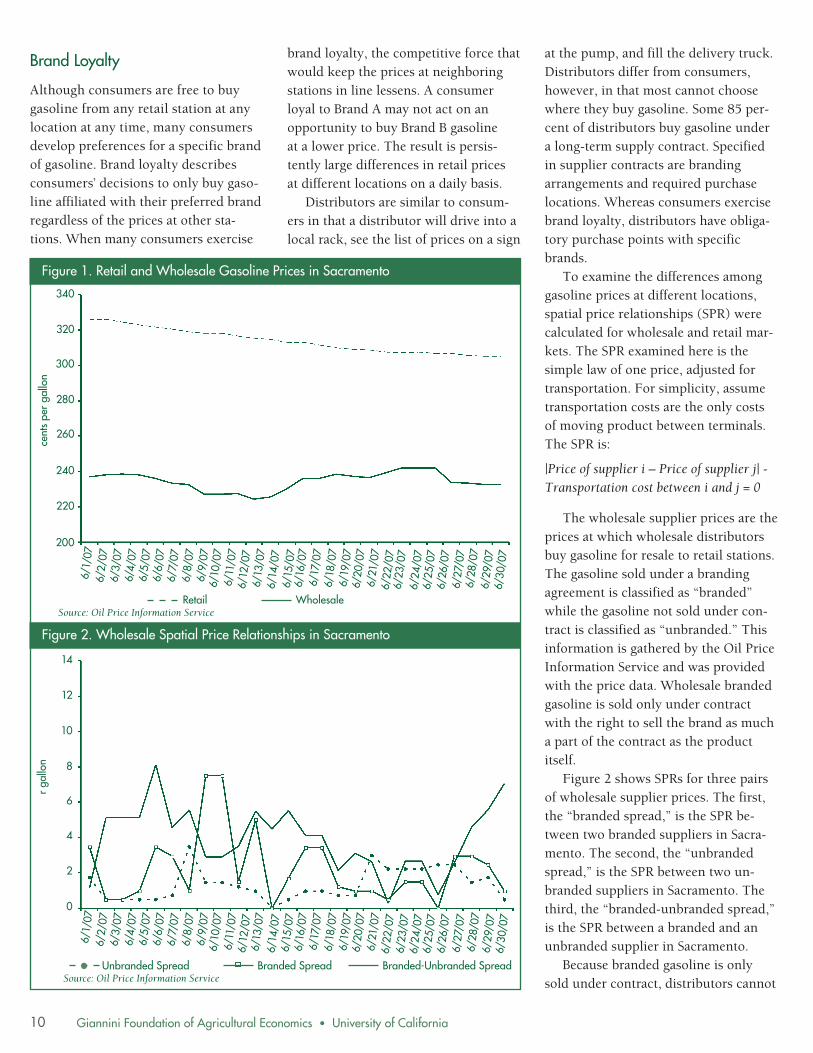
cent
s pe
Figure Wholesale Spatial Price Relationships in Sacramento
brand loyalty the competitive force that at the pump and fill the delivery truck would keep the prices at neighboring Distributors differ from consumers stations in line lessens A consumer however in that most cannot choose loyal to Brand A may not act on an where they buy gasoline Some 85 per-opportunity to buy Brand B gasoline cent of distributors buy gasoline under at a lower price The result is persis- a long-term supply contract Specified
10
Brand Loyalty
Although consumers are free to buy gasoline from any retail station at any location at any time many consumers develop preferences for a specific brand of gasoline Brand loyalty describes consumersrsquo decisions to only buy gasoshyline affiliated with their preferred brand regardless of the prices at other stashytions When many consumers exercise
0
0
00
80
60
0
0
00
cent
s pe
r ga
llon
616
0
61
0
611
0
610
0
69
0
68
0
66
0
6
0
6
0
6
0
6
0
61
0
6
0
61
0
619
0
618
0
61
0
61
0
61
0
61
0
6
0
6
0
6
0
6
0
66
0
6
0
68
0
69
0
60
0
60
0
Figure 1 Retail and Wholesale Gasoline Prices in Sacramento
r ga
llon
tently large differences in retail prices in supplier contracts are branding at different locations on a daily basis arrangements and required purchase
Distributors are similar to consum- locations Whereas consumers exercise ers in that a distributor will drive into a brand loyalty distributors have obligashylocal rack see the list of prices on a sign tory purchase points with specific
brands To examine the differences among
gasoline prices at different locations spatial price relationships (SPR) were calculated for wholesale and retail marshykets The SPR examined here is the simple law of one price adjusted for transportation For simplicity assume transportation costs are the only costs of moving product between terminals The SPR is
|Price of supplier i ndash Price of supplier j| -Transportation cost between i and j = 0
The wholesale supplier prices are the prices at which wholesale distributors buy gasoline for resale to retail stations The gasoline sold under a branding agreement is classified as ldquobrandedrdquo
Retail Wholesale Source Oil Price Information Service while the gasoline not sold under conshy
tract is classified as ldquounbrandedrdquo This information is gathered by the Oil Price Information Service and was provided with the price data Wholesale branded gasoline is sold only under contract with the right to sell the brand as much
10 a part of the contract as the product itself8
Figure 2 shows SPRs for three pairs of wholesale supplier prices The first the ldquobranded spreadrdquo is the SPR beshy
6
tween two branded suppliers in Sacrashymento The second the ldquounbranded
spreadrdquo is the SPR between two unshybranded suppliers in Sacramento The
1
616
0
61
0
611
0
610
0
69
0
68
0
66
0
6
0
6
0
6
0
6
0
61
0
6
0
61
0
619
0
618
0
61
0
61
0
61
0
61
0
6
0
6
0
6
0
6
0
66
0
6
0
68
0
69
0
60
0
60
0
1
third the ldquobranded-unbranded spreadrdquo is the SPR between a branded and an unbranded supplier in Sacramento
Unbranded Spread Branded Spread Branded-Unbranded Spread Because branded gasoline is only Source Oil Price Information Service sold under contract distributors cannot
Giannini Foundation of Agricultural Economics bull University of California
0
616
0
61
0
611
0
610
0
69
0
68
0
66
0
6
0
6
0
6
0
6
0
61
0
6
0
61
0
619
0
618
0
61
0
61
0
61
0
61
0
6
0
6
0
6
0
6
0
66
0
6
0
68
0
69
0
60
0
60
0
exercise spatial arbitrage across these suppliers That is a distributor under
1
1
contract to buy gasoline from Brand A cannot buy gasoline from Brand B even if the price is lower Therefore there ought to be more unexploited spatial 10
sumers associate themselves with a among consumers Specifically conports the concept of brand loyalty gasoline markets in Sacramento supstations on a daily basis Evidence from Retail prices typically vary among retail
unbranded gasoline and vice versa branded gasoline will not arbitrage However a consumer who prefers will arbitrage among branded stations consumer trage among unbranded stations If a fers unbranded That is if a consumer pregeneral designation as branded or brand so much as a preference for the not have a these SPRs show that consumers do the other two SPRs Taken together as much higher and more volatile than The branded-unbranded SPR stands out and variability to the unbranded SPR branded SPR is similar in magnitude variability of the three SPRs The retail lowest on average and has the least terpart the retail unbranded SPR is the pronounced Like its wholesale counamong the wholesale SPRs and is more
l
Figure
lon
nc
ts p
eer
ga
-
preference for a particular
-unbranded gasoline he will arbi-
prefers branded gasoline he
Conclusion
-
-
Daily Retail Spatial Price Relationships in Sacramento
arbitrage opportunities represented by nonzero values of the spatial price relashytionship involving branded gasoline prices On the other hand distributors do not need contracts to buy unbranded gasoline and are free to arbitrage across these suppliers Thus there ought to be fewer unexploited arbitrage opportunishyties among unbranded suppliers Figure 2 shows just that The unbranded SPR is lower on average and less volatile than the SPRs involving branded prices
Consumers do not face the conshystraint on buying gasoline that wholeshysale distributors face Consumers are free to buy gasoline from any retail supshyplier regardless of brand and location at any time Moreover studies have shown that retail gasoline is the same across the board Although proprietary brand-specific additives are mixed into the gasoline no substantial differences exist in the performance or emissions across gasoline brands The only differshyentiating factor in retail gasoline is marketing
Interestingly the consumer does not know which gasoline is supplied to which retail station A retailer may be supplied with branded or unbranded gasoline regardless of the retailerrsquos affilishyation It all depends upon the contracts and relationships between the refiner wholesaler and retailer The branding designation only signifies whether the gasoline was sold under a branded conshytract at the wholesale level Therefore a brand-loyal consumer may not even be buying gasoline produced by that brandrsquos refiner This reinforces that
8
6
0
Unbranded Spread Branded Spread Branded-Unbranded Spread Source Oil Price Information Service
general branding designation either ldquobrandedrdquo or ldquounbrandedrdquo The resultshying effects on retail prices are comparashyble to wholesale prices for which disshytributors are associated with both general branding designations and speshycific brands
Consumersrsquo association with some preferred branding designation introshyduces a split in the population that supshypliers might use as a guide for price discrimination Indeed many suppliers offer both branded and unbranded gasshyoline from the same refiner at different prices Whether retail gasoline is charshyacterized by brand loyalty of consumers or price discrimination by suppliers or some combination of both the effect on prices is similar The variation among retail gasoline prices on a daily basis persists because retail gasoline is suffishyciently differentiated by brand to supshyport two pricing schemes
Jennifer Thompson is a PhD candidate in the Department of Agricultural and Resourceretail branding is about marketing
Figure 3 shows the same SPRs for retail gasoline as Figure 2 shows for
Economics at UC Davis She can be reached by e-mail at thompsonprimalucdavisedu
wholesale gasoline The pattern among the retail SPRs mimics the pattern
Giannini Foundation of Agricultural Economics bull University of California 11
Agricultural and Resource Economics
UPDATE
Co-Editors
Steve Blank
Richard Sexton
David Roland-Holst
David Zilberman
Managing Editor and Desktop Publisher
Julie McNamara
Published by the Giannini Foundation of Agricultural Economics
httpgianniniucopedu
ARE Update is published six times per year by the Giannini Foundation of Agricultural Economics University of California
Domestic subscriptions are available free of charge to interested parties To subscribe to ARE Update by mail contact
Julie McNamara Outreach Coordinator Department of Agricultural and Resource Economics University of California One Shields Avenue Davis CA 95616 E-mail julieprimalucdavisedu Phone 530-752-5346
To receive notification when new issues of the ARE Update are available online submit an e-mail request to join our listserv to julieprimalucdavisedu
Articles published herein may be reprinted in their entirety with the authorrsquos or editorsrsquo permission Please credit the Giannini Foundation of Agricultural Economics University of California
ARE Update is available online at wwwageconucdaviseduoutreachareupdatephp
The University of California is an Equal OpportunityAffirmative Action employer
Department of Agricultural and Resource Economics UC Davis One Shields Avenue Davis CA 9616 GPBS