fast retailing - waseda.jp retailing is the japanese apparel retailing company which has...
TRANSCRIPT
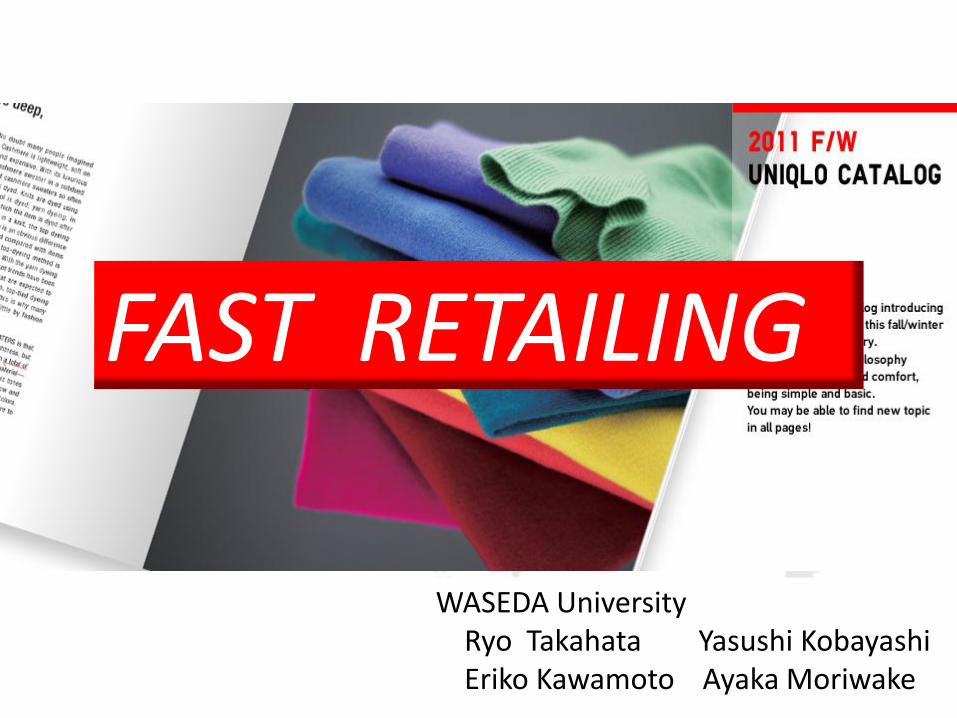
FAST RETAILING
WASEDA University Ryo Takahata Yasushi Kobayashi Eriko Kawamoto Ayaka Moriwake


The Investment Recommendation
Basic clothing
High-quality and Low-price
The system of SPA
Target stock prices :21556 Yen Current stock prices :13720 Yen
Growth in overseas market

Fast Retailing is the Japanese apparel retailing company which has “UNIQLO” brand and which offers high-quality basic clothing at reasonable prices.
Company Overview

Corporate Statement
“Changing clothes. Changing conventional wisdom. Change the world.”
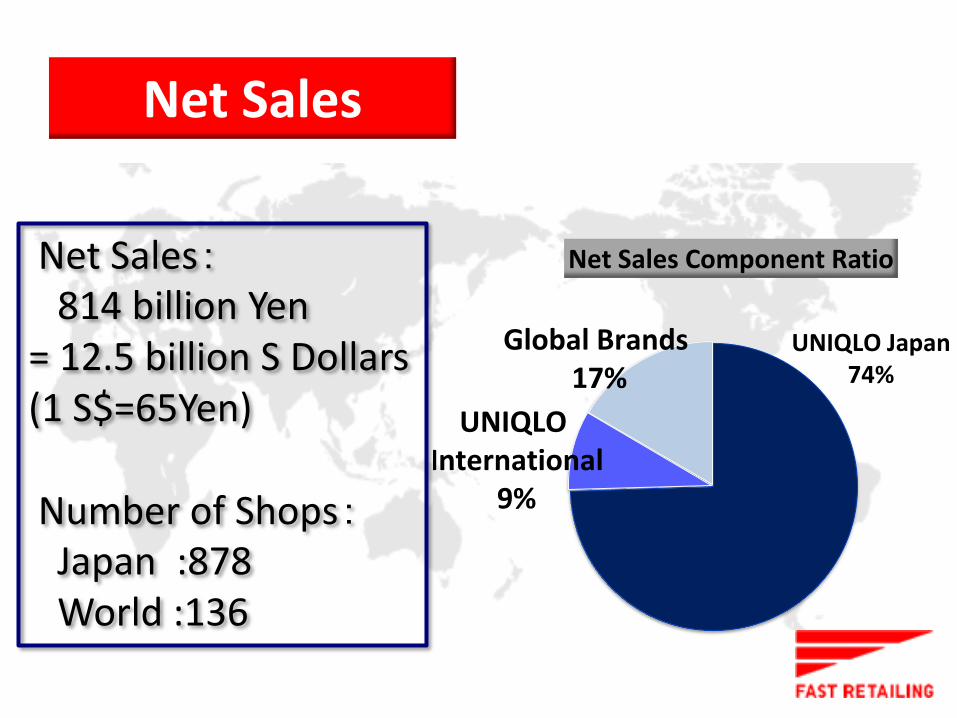
Net Sales Component Ratio
UNIQLO Japan 74%
UNIQLO International
9%
Global Brands 17%
Net Sales
Net Sales: 814 billion Yen = 12.5 billion S Dollars (1 S$=65Yen) Number of Shops: Japan :878 World :136

SPA Model(Specialty store retailer of Private label Apparel )
final sale production design
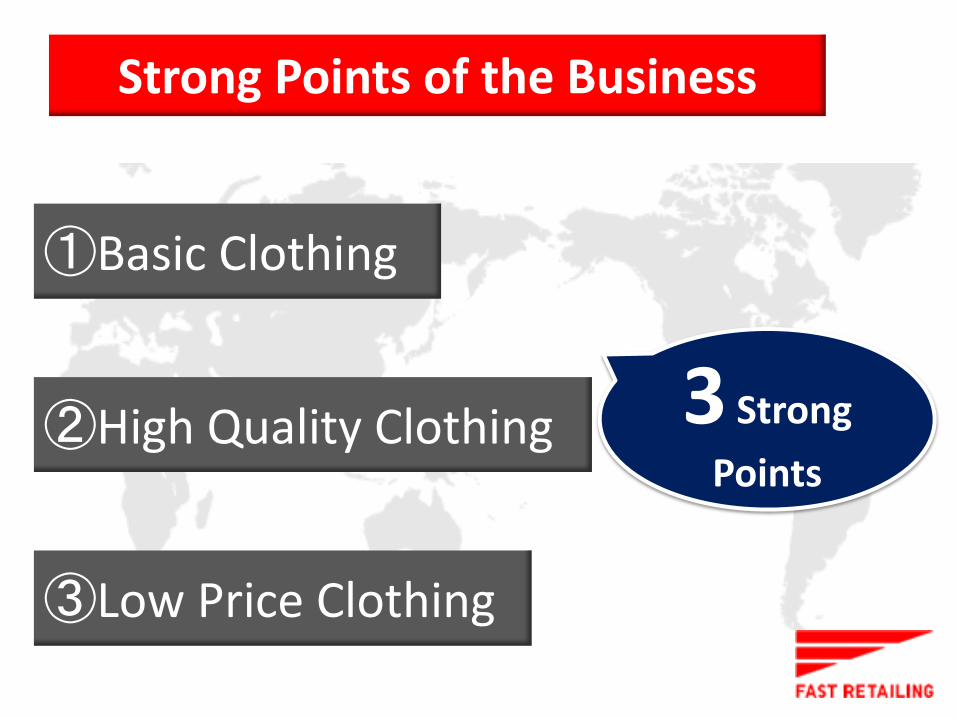
Strong Points of the Business
3 Strong
Points ②High Quality Clothing
③Low Price Clothing
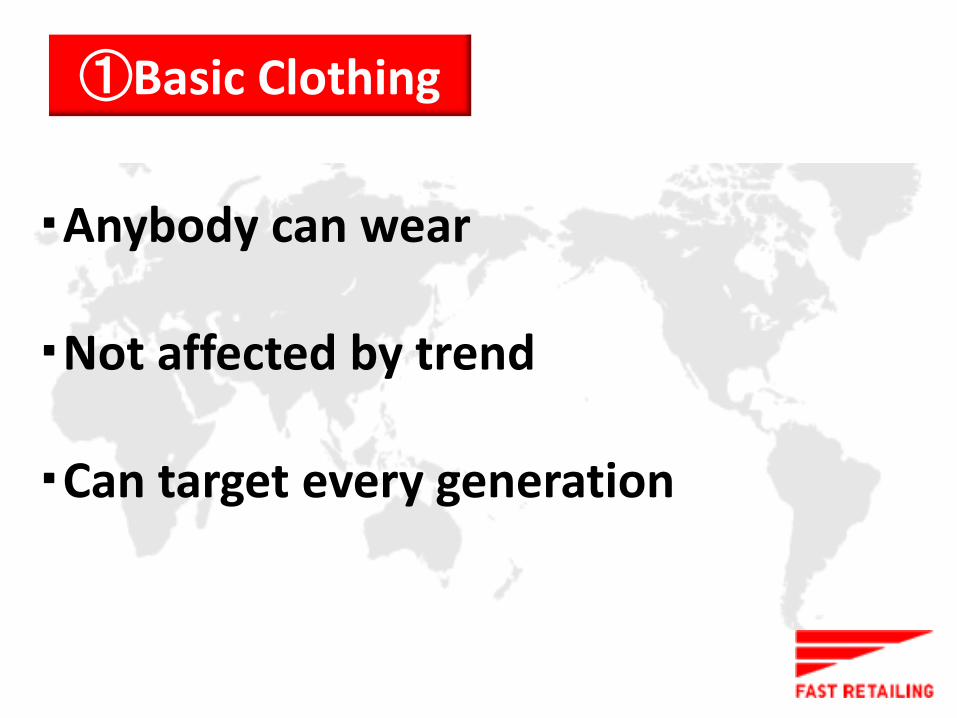
①Basic Clothing
①Basic Clothing
・Anybody can wear ・Not affected by trend ・Can target every generation

High Quality
Low Quality
Basic Fashion Specialty
Shops
GMS
Position in Apparel Market
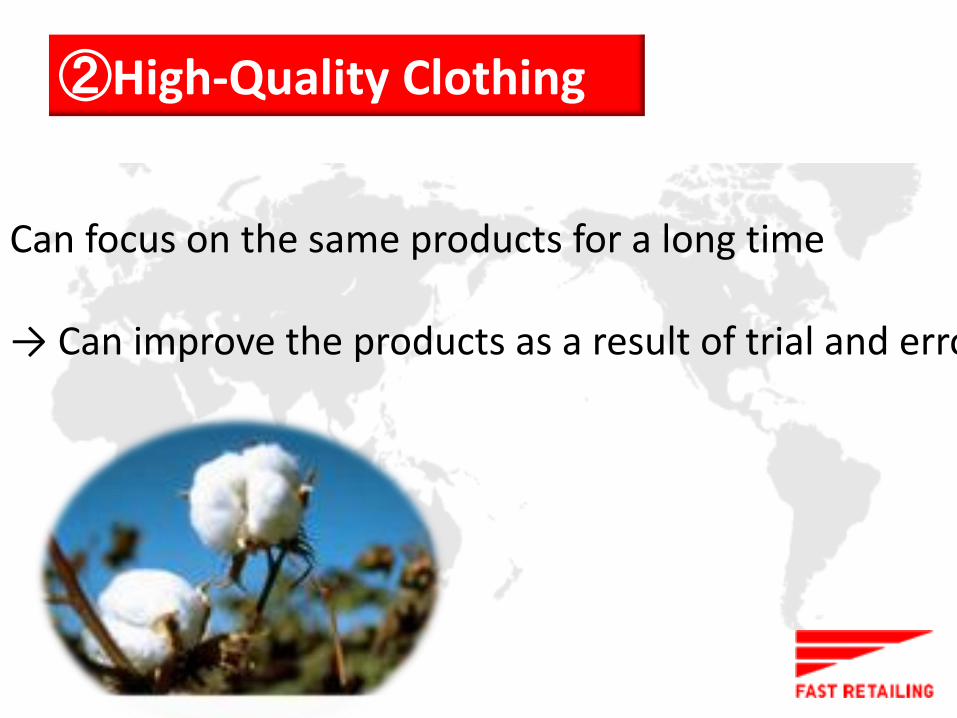
②High-Quality Clothing
Can focus on the same products for a long time → Can improve the products as a result of trial and error

③ Low Price Clothing
・Excluding the middleman
・ Most of the products of them are made in China
・Placing large amount of orders on factories

The Current and Future Situation of FR
UNIQLO Japan
UNIQLO International

Nation’s largest apparel retailer
UNIQLO Japan
Ranking Company Type of Bus inessApparel Retail
Sales (¥billion)Y/Y (%)
1 UNIQLO Specialty Store 571.9 12.5
2 Shimamura Specialty Store 440.1 2.4
3 Sogo and Seibu Department Store 384.4 ▲4.3
4 Takashimaya Department Store 325.2 ▲1.6
5Daimaru
MatsuzakayaDepartment Store 258.7 ▲22.0
6 Isetan Department Store 255.8 ▲8.2
Notes: Taken from the "FY2010 Buying Power Rankings" published in the Nikkei MJ (June 29, 2011).
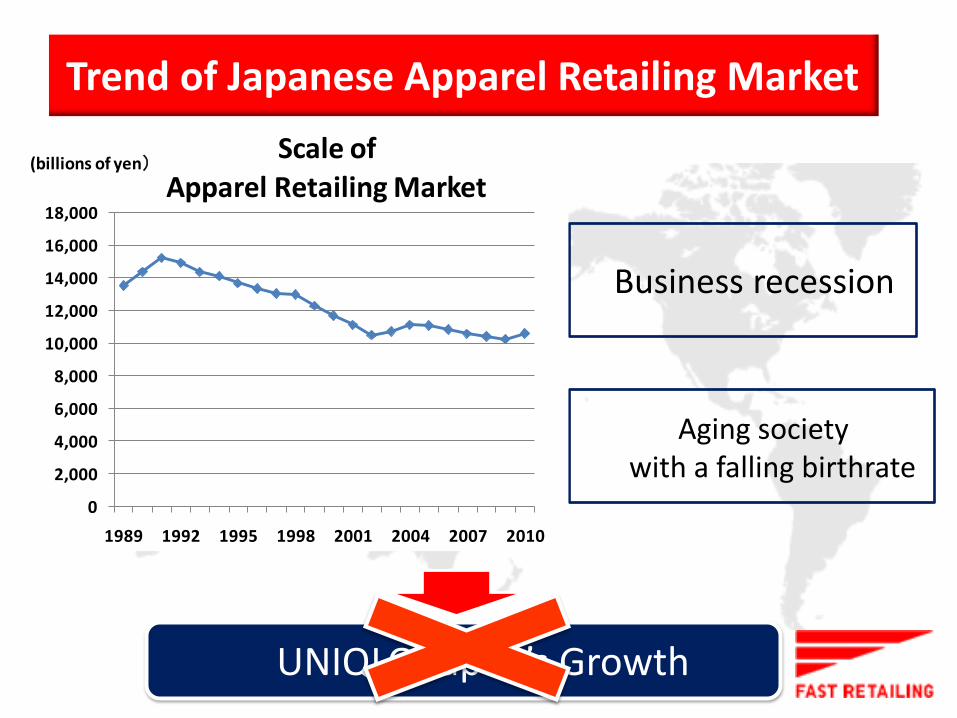
UNIQLO Japan’s Growth
Business recession
Trend of Japanese Apparel Retailing Market
Aging society with a falling birthrate
0
2,000
4,000
6,000
8,000
10,000
12,000
14,000
16,000
18,000
1989 1992 1995 1998 2001 2004 2007 2010
Scale of Apparel Retailing Market
(billions of yen)

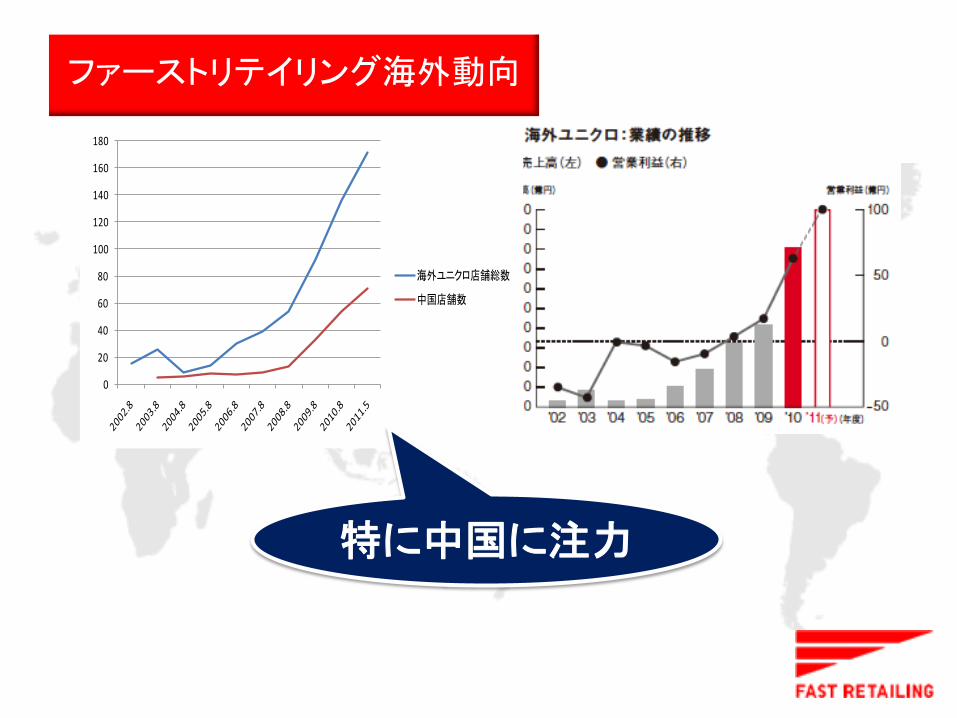
Focus on China
UNIQLO International
0
20
40
60
80
100
120
140
160
Stores Store Number Trends
UNIQLOinternational
Stores inChina

Estimate
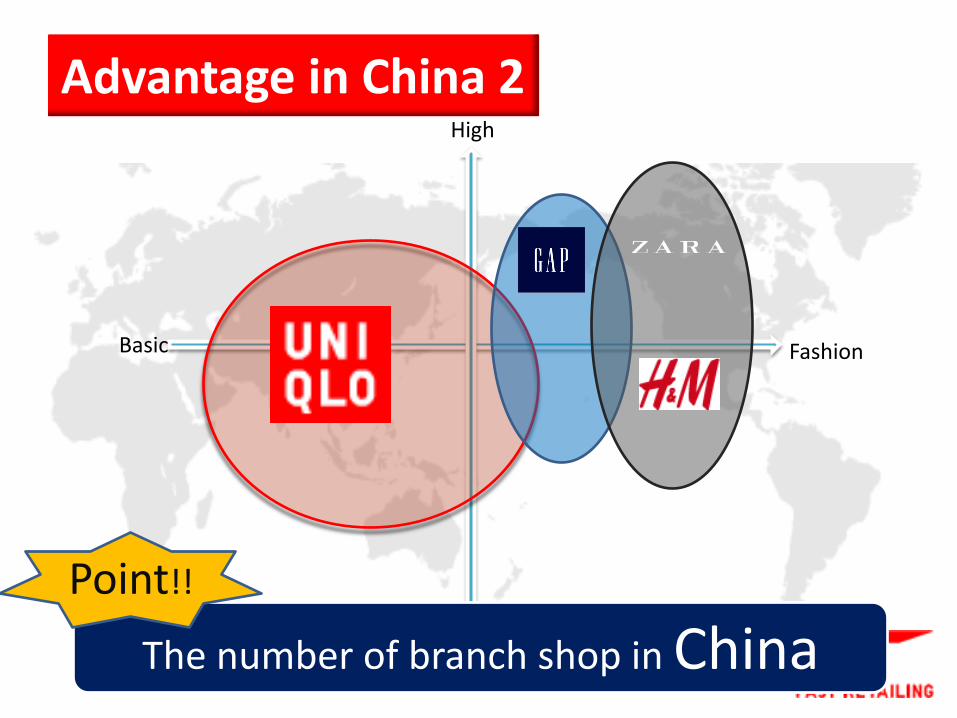
Advantage in China 1
220,000
555,112
856,589
990,415
0
200,000
400,000
600,000
800,000
1,000,000
1,200,000
2001 2009 2015 2020
Population of Middle-Income Group ( thousand)
High
Low
Basic Fashion
The number of branch shop in China
中国での優位性② Advantage in China 2
Point!!
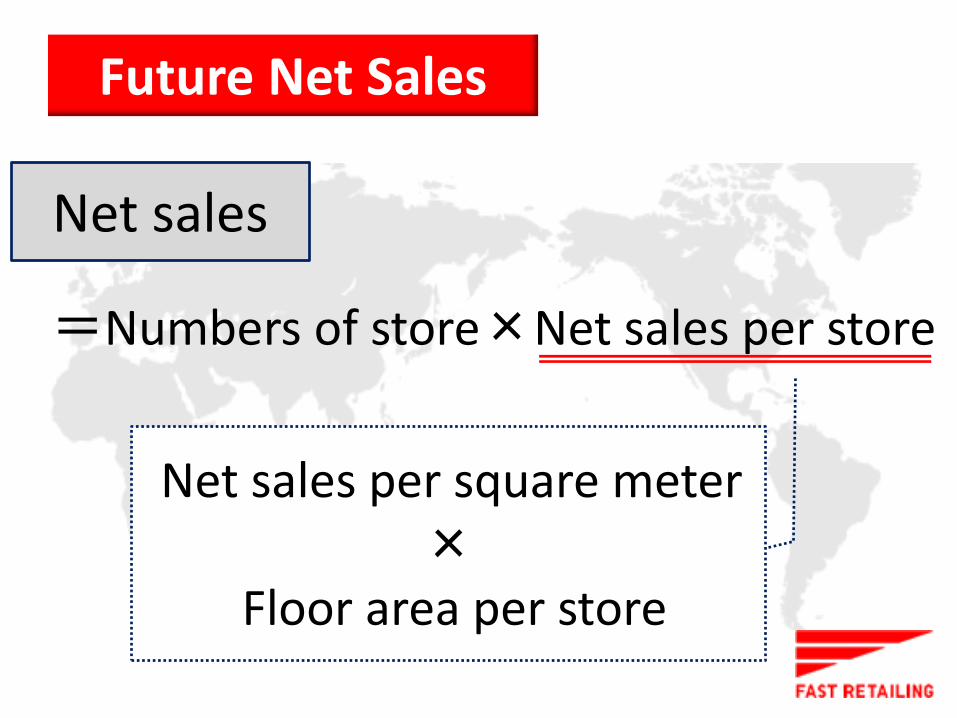
Net sales
=Numbers of store×Net sales per store
Net sales per square meter ×
Floor area per store
Future Net Sales

• = Net sales
Future Net Sales
Number of store
Net sales per square meter
Floor area per store
×
×

Number of stores
Net sales per square meter
Floor area per store
Future Net Sales of UNIQLO International
Increase in 50 stores every year
Reach the same level as Japanese stores by 2020.
Large scale stores:1566m²
China

0
500,000
1,000,000
1,500,000
2,000,000
0
500
1000
1500
2000
2500 Millions of yen
Stores
Trends of Net Sales andNumber of Stores
Others
Other Asia
China
UNIQLO Japan
(1S$=65 Yen)

Prediction term: 10 years WACC : 5.06% Permanent growing rate : 2%
Valuation : DCF Method
Target stock prices :21556 Yen Current stock price: 13720Yen
Calculate free cash flow from future net sales

Conclusion Conclusion
Basic clothing
High-quality and Low-price
The system of SPA
The target stock prices :21556 Yen
Growth in overseas market
The Investment Recommendation
BUY

Thank you for
listening

■Key Person Risk ■Risk of reliance on certain regions for production ■Risk of operations outside Japan
Risk Factor

Net sales =Number of store×Net sales per store
Net sales per square meter of retail floor space
× Shopfloor area per store
Future Net Sales of UNIQLO Japan
Number of store
Net sales per square meter of retail floor space
Shopfloor area per store
・The pace of opening large scale stores will decrease.
・ Square stays the same (about 0.9 million)
Normal stores … 766m² Large scale stores …1566m²

Company Name
(Flagship Brand)Country
Sales(Bi l l io
ns of do l lar)
Change
(%)(loca l base)
INDITEX(ZARA) Spain 17.8 13
H&M Sweden 17.2 0.7
GAP USA 14.7 3.3
FAST
RETAILING(UNIQLO)Japan 9.8 18.9
Limited Brands USA 9.6 11.4
NEXT UK 5.6 1.4
Polo Ralph Lauren USA 5 ▲0.8
Esprit Hong Kong 4.3 ▲2.2
Abercrombie & Fitch USA 3.5 18.4
Liz Claiborne USA 2.5 ▲14.3
Notes: Compiled from the annual reports of the companies listed above.
Worldwide Apparel Specialty Stores

Furure Net Sales2002.8 2003.8 2004.8 2005.8 2006.8 2007.8 2008.8 2009.8 2010.8
Net sales 344170 309789 339999 383973 448819 525203 586451 685043 814811UNIQLO Japan 365305 393608 424701 462343 538187 605561UNIQLO International 3078 8737 16998 29344 37789 72792Others 15588 46471 83503 94761 109064 136455
2011.8 2012.8 2013.8 2014.8 2015.8 2016.8 2017.8 2018.8 2019.8 2020.8
Net sales 818279 997283 1067542 1142990 1223629 1348274 1486910 1639534 1809759 1997584UNIQLO Japan 577100 712696 730747 745188 756018 763238 766849 766849 766849 766849UNIQLO International 104724 148132 200340 261348 331156 448581 583606 736231 906456 1094280Others 136455 136455 136455 136455 136455 136455 136455 136455 136455 136455
Total store 2002.8 2003.8 2004.8 2005.8 2006.8 2007.8 2008.8 2009.8 2010.8
The number of total store 585 621 655 1232 1632 1828 1958 2258 2203Total UNIQLO 585 621 646 693 750 787 813 862 944UNIQLO Japan 570 595 637 679 720 748 759 770 808Standard store 570 595 637 676 713 720 709 699 706Large-scale store 3 7 28 50 71 102UNIQLO international 15 26 9 14 30 39 54 92 136China 5 6 8 7 9 13 33 54Other Asia 0 0 0 0 11 18 26 43 64Others 15 21 3 6 12 12 15 16 18Other project 9 539 882 1041 1145 1396 1259Furure total store 2011.8 2012.8 2013.8 2014.8 2015.8 2016.8 2017.8 2018.8 2019.8 2020.8
The number of total store 2178 2230 2282 2334 2386 2488 2590 2692 2794 2896Total UNIQLO 1037 1089 1141 1193 1245 1347 1449 1551 1653 1755UNIQLO Japan 854 854 854 854 854 854 854 854 854 854Standard store 717 687 662 642 627 617 612 612 612 612Large-scale store 137 167 192 212 227 237 242 242 242 242UNIQLO international 183 235 287 339 391 493 595 697 799 901China 77 127 177 227 277 327 377 427 477 527Other Asia 87 87 87 87 87 137 187 237 287 337Others 19 21 23 25 27 29 31 33 35 37Other project 1141 1141 1141 1141 1141 1141 1141 1141 1141 1141
Future net sales
Stores

0
2
4
6
8
10
12
14
16
18
2006 2007 2008 2009 2010
(%)Operating Margin
FAST RETAILING
Averageof ZARA,H&M,GAP
Industry average in Japan
0
10
20
30
40
50
60
2006 2007 2008 2009 2010
(%)Gross Margin
FAST RETAILING
Averageof ZARA,H&M,GAP
Industry average in Japan

0
5
10
15
20
25
2006 2007 2008 2009 2010
(%)ROA
FAST RETAILING
Averageof ZARA,H&M,GAP
Industry average in Japan
0
5
10
15
20
25
30
35
2006 2007 2008 2009 2010
(%)ROE
FAST RETAILING
Averageof ZARA,H&M,GAP
Industry average in Japan

0.0%
10.0%
20.0%
30.0%
40.0%
50.0%
60.0%
70.0%
80.0%
2006 2007 2008 2009 2010
ROIC
FAST RETAILING
H&M
GAP
ZARA

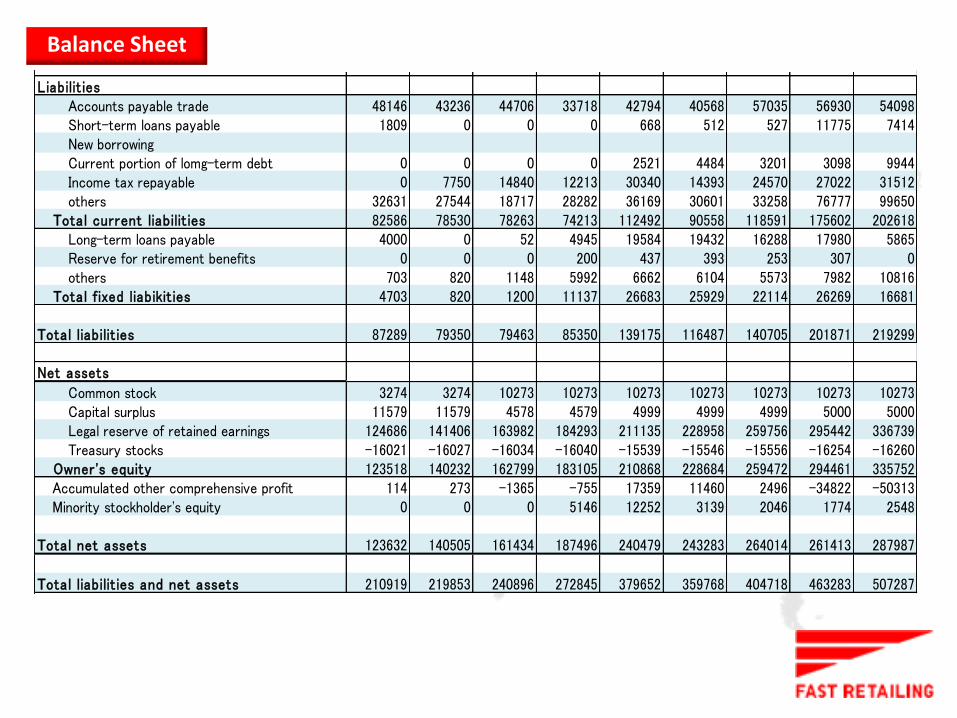
(milions of yen)Condenced Consolidated Balance Sheet 2002.8 2003.8 2004.8 2005.8 2006.8 2007.8 2008.8 2009.8 2010.8
AssetsCush and time deposit 67771 76447 83862 74759 121950 64091 67248 43876 62466Funds surplusAcounts receivable trade 3143 4277 3223 4472 8396 9849 13411 15213 15371Inventries 30995 20867 28803 33594 42862 55173 53778 74580 74079Defferd tax assets 293 4365 3755 2894 928 1752 2545 22187 29715others 64394 64581 60511 64332 76190 87113 126714 142315 163994
Total current assets 166596 170537 180154 180051 250326 217978 263696 298171 345625Total tangible assets 15910 14720 15819 18676 29892 37339 40317 45946 50144Goodwill 0 0 0 10787 32996 32536 28122 39399 28798others 783 3351 4852 6366 8225 10465 12715 15913 19042
Total intangible fixed assets 783 3351 4852 17153 41221 43001 40837 55312 47840Total investments and other assets 27630 31245 40071 56965 58213 61450 59868 63854 63678(Investment in securities) 63 584 6093 7431 1146 907 669 686 844(Long-term loans reciable) 0 0 0 0 0 0 0 0 0
Total fixed assets 44323 49316 60742 92794 129326 141790 141022 165112 161662
Total assets 210919 219853 240896 272845 379652 359768 404718 463283 507287
Liabilit iesAccounts payable trade 48146 43236 44706 33718 42794 40568 57035 56930 54098Short-term loans payable 1809 0 0 0 668 512 527 11775 7414New borrowingCurrent portion of lomg-term debt 0 0 0 0 2521 4484 3201 3098 9944Income tax repayable 0 7750 14840 12213 30340 14393 24570 27022 31512others 32631 27544 18717 28282 36169 30601 33258 76777 99650
Total current liabilit ies 82586 78530 78263 74213 112492 90558 118591 175602 202618Long-term loans payable 4000 0 52 4945 19584 19432 16288 17980 5865Reserve for retirement benefits 0 0 0 200 437 393 253 307 0others 703 820 1148 5992 6662 6104 5573 7982 10816
Total fixed liabikit ies 4703 820 1200 11137 26683 25929 22114 26269 16681
Total liabilit ies 87289 79350 79463 85350 139175 116487 140705 201871 219299
Net assetsCommon stock 3274 3274 10273 10273 10273 10273 10273 10273 10273Capital surplus 11579 11579 4578 4579 4999 4999 4999 5000 5000Legal reserve of retained earnings 124686 141406 163982 184293 211135 228958 259756 295442 336739Treasury stocks -16021 -16027 -16034 -16040 -15539 -15546 -15556 -16254 -16260
Owner's equity 123518 140232 162799 183105 210868 228684 259472 294461 335752Accumulated other comprehensive profit 114 273 -1365 -755 17359 11460 2496 -34822 -50313Minority stockholder's equity 0 0 0 5146 12252 3139 2046 1774 2548
Total net assets 123632 140505 161434 187496 240479 243283 264014 261413 287987
Total liabilit ies and net assets 210919 219853 240896 272845 379652 359768 404718 463283 507287
Balance Sheet

(mi l ions of yen)
Consolidated profit and loss statement 2002.8 2003.8 2004.8 2005.8 2006.8 2007.8 2008.8 2009.8 2010.8Net sales 344170 309789 339999 383973 448819 525203 586451 685043 814811Cost of sales 193765 172724 176804 213682 236401 276808 292769 343515 393930Gross profit 150405 137065 163194 170290 212418 248395 293682 341528 420881
Depliciation 1930 2272 1840 2433 5409 6567 8523 9765 12229Others 98057 93485 97400 111165 136653 176864 197666 223123 276274
Selling, general and administrative expenses 99987 95757 99240 113598 142062 183431 206189 232888 288503Operaring incom 50418 41308 63954 56692 70355 64963 87493 108639 132378
Interest incom 676 374 506 790 1045 1314 2240 847 344others 749 447 407 1939 3215 2953 513 881 657
Non-operating income 1425 821 913 2729 4260 4267 2753 1728 1001Interest payed 406 332 169 344 853 1775 1635 917 500others 328 228 515 470 624 2851 2912 8142 9124
Non-operating expenses 734 560 684 814 1477 4626 4547 9059 9624Ordinary income 51110 41569 64183 58607 73138 64604 85698 101308 123755
Extraordinary profit 109 0 0 6040 1300 1903 1027 464 917Extraordinary loss 773 6818 7735 6631 1685 3794 4731 6285 7804Net income before income tax 50445 34751 56448 58016 72752 62713 81994 95487 116867
Total income, inhabitant and business tax 22595 13817 25083 24058 30933 30775 38128 45433 54215Net income before minority stockholder's profit 27850 20934 31365 33958 41819 31938 43866 50054 62652Minority stockholder's profit 0 0 1 73 1381 163 336 257 971Net income 27850 20933 31365 33884 40437 31775 43529 49797 61681
Balance Sheet Income Statement

(milions of yen)Cash flow statement 2002.8 2003.8 2004.8 2005.8 2006.8 2007.8 2008.8 2009.8 2010.8Operating cash flow 30780 39563 13702 49965 -5342 36135 4062 46704
Net income 20933 31365 33884 40437 31775 43529 49797 61681Depliciation 2272 1840 2433 5409 6567 8523 9765 12229Acounts receivable trade -1134 1054 -1249 -3924 -1453 -3562 -1802 -158Inventries 10128 -7936 -4791 -9268 -12311 1395 -20802 501Defferd tax assets -4072 610 861 1966 -824 -793 -19642 -7528Dffered tax liabilities 0 0 0 0 0 0 0 0Others(current assets) -187 4070 -3821 -11858 -10923 -39601 -15601 -21679Accounts payable trade -4910 1470 -10988 9076 -2226 16467 -105 -2832Income tax repayable 7750 7090 -2627 18127 -15947 10177 2452 4490
Investment cash flow -7265 -13266 -34485 -41941 -19031 -7755 -33855 -8779Total current assets 1190 -1099 -2857 -11216 -7447 -2978 -5629 -4198Goodwill 0 0 -10787 -22209 460 4414 -11277 10601Others(intangible fixed assets) -2568 -1501 -1514 -1859 -2240 -2250 -3198 -3129Total investments and other assets -3615 -8826 -16894 -1248 -3237 1582 -3986 176
0 0 0 0 0 0 0 0Depliciation -2272 -1840 -2433 -5409 -6567 -8523 -9765 -12229
Free cash flow 23515 26297 -20783 8024 -24373 28380 -29793 37925
Financial cash flow -14839 -18883 11680 39168 -33486 -25224 6421 -19337Short-term loans payable -1809 0 0 668 -156 15 11248 -4361Current portion of lomg-term debt 0 0 0 2521 1963 -1283 -103 6846Others(current liabolities) -5087 -8827 9565 7887 -5568 2657 43519 22873Bonds 0 0 0 0 0 0 0 0Convertible bonds 0 0 0 0 0 0 0 0Long-term loans payable -4000 52 4893 14639 -152 -3144 1692 -12115Reserve for retirement benefits 0 0 200 237 -44 -140 54 -307Reserve for retirement benefits for officers 0 0 0 0 0 0 0 0Others(fixed liabolities) 117 328 4844 670 -558 -531 2409 2834Common stock 0 6999 0 0 0 0 0 0Capital surplus 0 -7001 1 420 0 0 1 0Legal reserve of retained earnings 1381 2907 -351 -361 -711 510 2179 3026Treasury stocks -6 -7 -6 501 -7 -10 -698 -6Others(owner's equity) 0 0 0 0 0 0 0 0Accumulated other comprehensive profit 159 -1638 610 18114 -5899 -8964 -37318 -15491Minority stockholder's equity 0 0 5146 7106 -9113 -1093 -272 774Divident paid -5594 -11696 -13222 -13234 -13241 -13241 -16290 -23410
Decrease and increase in cash and time deposit 8676 7414 -9103 47192 -57859 3156 -23372 18588
Cash and time deposit at beginning of year 67771 76447 83862 74759 121950 64091 67248 43876Cash and time deposit at end of year 76447 83862 74759 121950 64091 67248 43876 62466
Cash Flow Statement

Condenced Consolidated Balance Sheet(milions of yen) 2010 2011 2012 2013 2014 2015 2016 2017 2018 2019 2020Assets
Cush and time deposit 62466 163656 199457 213508 228598 244726 269655 297382 327907 361952 399517Funds surplus 0 0 0 0 0 0 0 0 0 0Acounts receivable trade 15371 16595 20225 21650 23180 24815 27343 30154 33250 36702 40511Inventries 74079 80524 98140 105054 112478 120414 132680 146323 161342 178093 196577Defferd tax assets 29715others 163994 157225 191619 205118 219615 235109 259058 285696 315021 347728 383817
Total current assets 345625 417999 509440 545330 583871 625064 688736 759555 837520 924475 1020421
Total tangible assets 50144 50357 61373 65697 70340 75303 82974 91505 100898 111374 122933
Goodwill 28798
others 19042 17435 21248 22745 24353 26071 28727 31681 34933 38559 42561Total intangible f ixed assets 47840 17435 21248 22745 24353 26071 28727 31681 34933 38559 42561
Total investments and other assets 63678 85126 103748 111057 118906 127295 140262 154684 170562 188270 207810(Investment in securities) 844 1221 1488 1592 1705 1825 2011 2218 2446 2700 2980(Long-term loans reciable) 0 0 0 0 0 0 0 0 0 0 0
Total f ixed assets 161662 152918 186370 199500 213599 228669 251962 277870 306392 338203 373303
Total assets 507287 570917 695810 744830 797470 853732 940698 1037425 1143912 1262679 1393725
LiabilitiesAccounts payable trade 54098 57038 69516 74414 79673 85294 93982 103646 114285 126150 139243Short-term loans payable 7414 7414 7414 7414 7414 7414 7414 7414 7414 7414 7414New borrowing 82912 146612 141100 136194 131679 148673 168076 189270 213652 240439Current portion of lomg-term debt 9944 9944 9944 9944 9944 9944 9944 9944 9944 9944 9944Income tax repayable 31512others 99650 55291 55291 55291 55291 55291 55291 55291 55291 55291 55291
Total current liabilities 202618 212599 288777 288163 288516 289621 315304 344370 376203 412451 452331Long-term loans payable 5865 5865 5865 5865 5865 5865 5865 5865 5865 5865 5865Reserve for retirement benefits 0 0 0 0 0 0 0 0 0 0 0others 10816 10816 10816 10816 10816 10816 10816 10816 10816 10816 10816
Total f ixed liabikities 16681 16681 16681 16681 16681 16681 16681 16681 16681 16681 16681
Total liabilities 219299 229280 305458 304844 305197 306302 331985 361051 392884 429132 469012
Future Balance Sheet
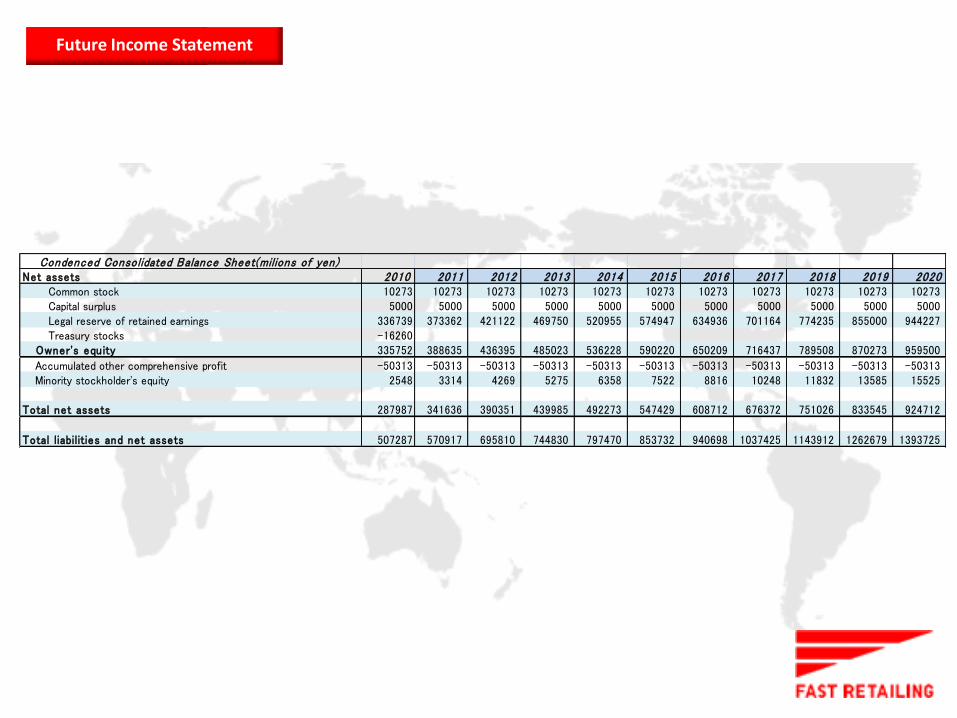
Condenced Consolidated Balance Sheet(milions of yen)Net assets 2010 2011 2012 2013 2014 2015 2016 2017 2018 2019 2020
Common stock 10273 10273 10273 10273 10273 10273 10273 10273 10273 10273 10273Capital surplus 5000 5000 5000 5000 5000 5000 5000 5000 5000 5000 5000Legal reserve of retained earnings 336739 373362 421122 469750 520955 574947 634936 701164 774235 855000 944227Treasury stocks -16260
Owner's equity 335752 388635 436395 485023 536228 590220 650209 716437 789508 870273 959500
Accumulated other comprehensive profit -50313 -50313 -50313 -50313 -50313 -50313 -50313 -50313 -50313 -50313 -50313Minority stockholder's equity 2548 3314 4269 5275 6358 7522 8816 10248 11832 13585 15525
Total net assets 287987 341636 390351 439985 492273 547429 608712 676372 751026 833545 924712
Total liabilities and net assets 507287 570917 695810 744830 797470 853732 940698 1037425 1143912 1262679 1393725
Income Statement Future Income Statement

Consolidated prof it and loss statement(milions of yen) 2010 2011 2012 2013 2014 2015 2016 2017 2018 2019 2020Net sales 814811 818279 997283 1067542 1142990 1223629 1348274 1486910 1639534 1809759 1997584Cost of sales 393930 415342 506201 541863 580159 621090 684357 754726 832195 918598 1013934Gross prof it 420881 402937 491082 525679 562831 602539 663917 732184 807339 891161 983650
Depliciation 12229 12495 12548 15294 16371 17528 18765 20676 22802 25143 27753Others 276274 277450 338144 361966 387548 414890 457153 504159 555909 613626 677311
Selling, general and administrative expenses 288503 289945 350692 377260 403919 432418 475917 524835 578711 638769 705064Operaring incom 132378 112992 140390 148419 158912 170121 188000 207348 228628 252392 278586
Interest incom 344 1795 2187 2341 2507 2684 2957 3261 3596 3969 4381others 657 1644 1644 1644 1644 1644 1644 1644 1644 1644 1644
Non-operating income 1001 3438 3831 3985 4150 4327 4601 4905 5239 5613 6025Interest payed 500 353 1615 2585 2501 2426 2357 2616 2911 3234 3605others 9124 4731 4731 4731 4731 4731 4731 4731 4731 4731 4731
Non-operating expenses 9624 5084 6346 7315 7231 7157 7088 7347 7642 7965 8336Ordinary income 123755 111346 137875 145089 155831 167292 185512 204906 226226 250041 276275
Extraordinary profit 917 1122 1122 1122 1122 1122 1122 1122 1122 1122 1122Extraordinary loss 7804 4860 4860 4860 4860 4860 4860 4860 4860 4860 4860Net income before income tax 116867 107608 134137 141351 152093 163554 181775 201169 222488 246303 272537
Total income, inhabitant and business tax 54215 49944 62256 65605 70590 75910 84366 93368 103262 114316 126491Net income before minority stockholder's prof it 62652 57665 71881 75746 81503 87644 97408 107801 119226 131987 146046
Minority stockholder's profit 971 766 955 1006 1083 1164 1294 1432 1584 1753 1940Net income 61681 56899 70926 74740 80420 86480 96114 106369 117642 130234 144106
Income Statement Future Income Statement

Cash f low statement(milions of yen) 2010 2011 2012 2013 2014 2015 2016 2017 2018 2019 2020Operating cash f low 46704 69638 40312 73093 78599 84564 84824 93617 103643 114332 126570
Net income 61681 56899 70926 74740 80420 86480 96114 106369 117642 130234 144106Depliciation 12229 12495 12548 15294 16371 17528 18765 20676 22802 25143 27753Acounts receivable trade -158 -1224 -3630 -1425 -1530 -1635 -2528 -2812 -3095 -3452 -3809Inventries 501 -6445 -17615 -6914 -7425 -7935 -12266 -13643 -15019 -16751 -18483Defferd tax assets -7528 29715 0 0 0 0 0 0 0 0 0Dffered tax liabilities 0 0 0 0 0 0 0 0 0 0 0Others(current assets) -21679 6769 -34394 -13500 -14497 -15494 -23950 -26637 -29325 -32707 -36089Accounts payable trade -2832 2940 12478 4897 5259 5621 8688 9664 10639 11866 13092Income tax repayable 4490 -31512 0 0 0 0 0 0 0 0 0
Investment cash f low -8779 -3751 -46000 -28423 -30471 -32597 -42058 -46584 -51324 -56954 -62853Total current assets -4198 -213 -11016 -4324 -4643 -4963 -7671 -8532 -9393 -10476 -11559Goodwill 10601 28798 0 0 0 0 0 0 0 0 0Others(intangible fixed assets) -3129 1607 -3814 -1497 -1608 -1718 -2656 -2954 -3252 -3627 -4002Total investments and other assets 176 -21448 -18622 -7309 -7849 -8389 -12967 -14422 -15878 -17709 -19539
0 0 0 0 0 0 0 0 0 0 0Depliciation -12229 -12495 -12548 -15294 -16371 -17528 -18765 -20676 -22802 -25143 -27753
Free cash f low 37925 65886 -5688 44669 48128 51967 42766 47033 52318 57378 63717
Financial cash f low -19337 -47608 -22211 -25106 -28132 -31324 -34831 -38709 -42988 -47715 -52939Short-term loans payable -4361 0 0 0 0 0 0 0 0 0 0Current portion of lomg-term debt 6846 0 0 0 0 0 0 0 0 0 0Others(current liabolities) 22873 -44359 0 0 0 0 0 0 0 0 0Bonds 0 0 0 0 0 0 0 0 0 0 0Convertible bonds 0 0 0 0 0 0 0 0 0 0 0Long-term loans payable -12115 0 0 0 0 0 0 0 0 0 0Reserve for retirement benefits -307 0 0 0 0 0 0 0 0 0 0Reserve for retirement benefits for officers 0 0 0 0 0 0 0 0 0 0 0Others(fixed liabolities) 2834 0 0 0 0 0 0 0 0 0 0Common stock 0 0 0 0 0 0 0 0 0 0 0Capital surplus 0 0 0 0 0 0 0 0 0 0 0Legal reserve of retained earnings 3026 0 0 0 0 0 0 0 0 0 0Treasury stocks -6 16260 0 0 0 0 0 0 0 0 0Others(owner's equity) 0 0 0 0 0 0 0 0 0 0 0Accumulated other comprehensive profit -15491 0 0 0 0 0 0 0 0 0 0Minority stockholder's equity 774 766 955 1006 1083 1164 1294 1432 1584 1753 1940Divident paid -23410 -20275 -23166 -26112 -29215 -32488 -36125 -40141 -44571 -49469 -54879
Decrease and increase in cash and time deposit 18588 18278 -27900 19564 19996 20643 7935 8324 9331 9663 10778
Cash and time deposit at beginning of year 43876 62466 163656 199457 213508 228598 244726 269655 297382 327907 361952Cash and time deposit at end of year 62464 163656 199457 213508 228598 244726 269655 297382 327907 361952 372730
Future Cash Flow Statement

(mi l i ons of yen) 2011 2012 2013 2014 2015 2016 2017 2018 2019 2020UNIQLO Japan 577100 712696 730747 745188 756018 763238 766849 766849 766849 766849UNIQLO International 104724 148132 200340 261348 331156 448581 583606 736231 906456 1094280Others 136455 136455 136455 136455 136455 136455 136455 136455 136455 136455Tota l sa les 818279 997283 1067542 1142990 1223629 1348274 1486910 1639534 1809759 1997584
Cost of sales 415342 506201 541863 580159 621090 684357 754726 832195 918598 1013934Selling, general and administrative expenses 289945 350692 377260 403919 432418 475917 524835 578711 638769 705064EBITA 112992 140390 148419 158912 170121 188000 207348 228628 252392 278586
Tax 46% 46% 46% 46% 46% 46% 46% 46% 46% 46%NOPLAT 60549 75231 79534 85157 91164 100744 111113 122516 135251 149287
Depliciation 12495 12548 15294 16371 17528 18765 20676 22802 25143 27753Gross cash f l ow 73045 87780 94827 101528 108692 119509 131789 145318 160393 177040
A change in working capital 4729 8768 3441 3696 3950 6105 6791 7476 8338 9200Capital investment 30932 37698 40354 43206 46254 50966 56206 61976 68410 75510Aggregate investment 35660 46466 43795 46901 50204 57071 62997 69451 76748 84710Operating f ree cash f l ow 37384 41314 51032 54626 58488 62438 68792 75867 83645 92330
Discount rate 1.05 1.10 1.16 1.22 1.28 1.34 1.41 1.48 1.56 1.64Present va lue 35584 37430 44008 44838 45695 46432 48693 51114 53640 56358
Tota l present va lue 463792
Risk free rate 1.17%Tarminal growth rate 2% Risk puremium 5.26%Discount rate 1.72 Levered beta 0.797Continuous va lue 1754650 Cost of equity 5.36%
Cost of debt 2.15%Enterpri se va lue 2218442 Tax rate 40%
Debt 23,223Non-enterprize assets 63678 Total net assets 287,987Corporate va lue 2282120 After-tax WACC 5.06%
Debt 23223Shares of minor shareholders 2548Shareholder's equi ty 2256349
Shares issueed 106073656Target s tock price 21272 (Yen)
Valuation
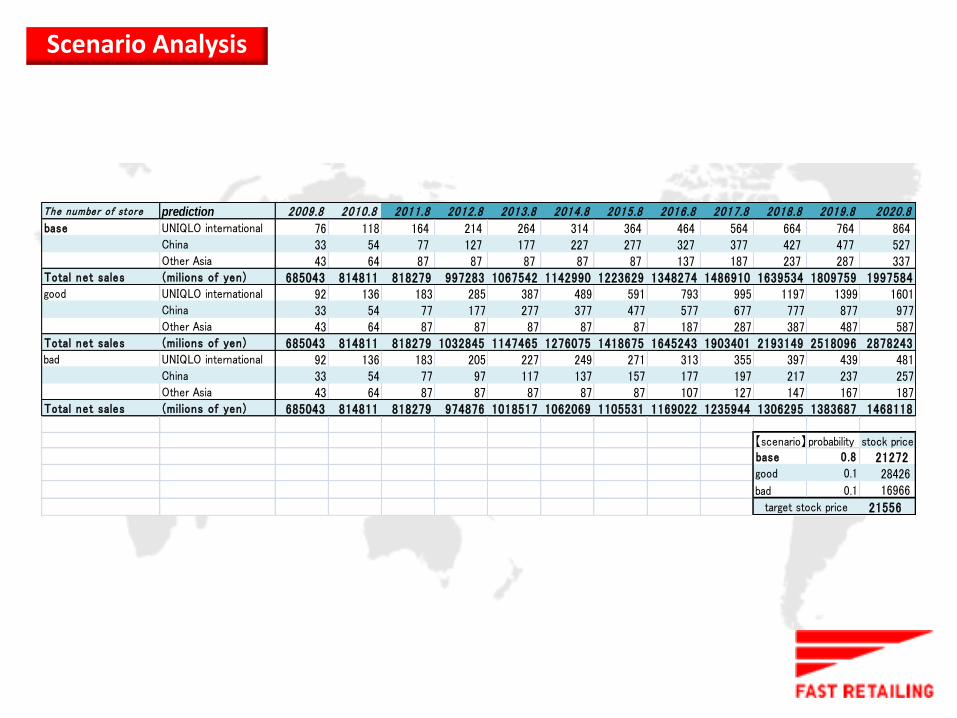
The number of store prediction 2009.8 2010.8 2011.8 2012.8 2013.8 2014.8 2015.8 2016.8 2017.8 2018.8 2019.8 2020.8base UNIQLO international 76 118 164 214 264 314 364 464 564 664 764 864
China 33 54 77 127 177 227 277 327 377 427 477 527Other Asia 43 64 87 87 87 87 87 137 187 237 287 337
Total net sales (milions of yen) 685043 814811 818279 997283 1067542 1142990 1223629 1348274 1486910 1639534 1809759 1997584good UNIQLO international 92 136 183 285 387 489 591 793 995 1197 1399 1601
China 33 54 77 177 277 377 477 577 677 777 877 977Other Asia 43 64 87 87 87 87 87 187 287 387 487 587
Total net sales (milions of yen) 685043 814811 818279 1032845 1147465 1276075 1418675 1645243 1903401 2193149 2518096 2878243bad UNIQLO international 92 136 183 205 227 249 271 313 355 397 439 481
China 33 54 77 97 117 137 157 177 197 217 237 257Other Asia 43 64 87 87 87 87 87 107 127 147 167 187
Total net sales (milions of yen) 685043 814811 818279 974876 1018517 1062069 1105531 1169022 1235944 1306295 1383687 1468118
【scenario】 probability stock pricebase 0.8 21272good 0.1 28426bad 0.1 16966
21556target stock price
Scenario Analysis
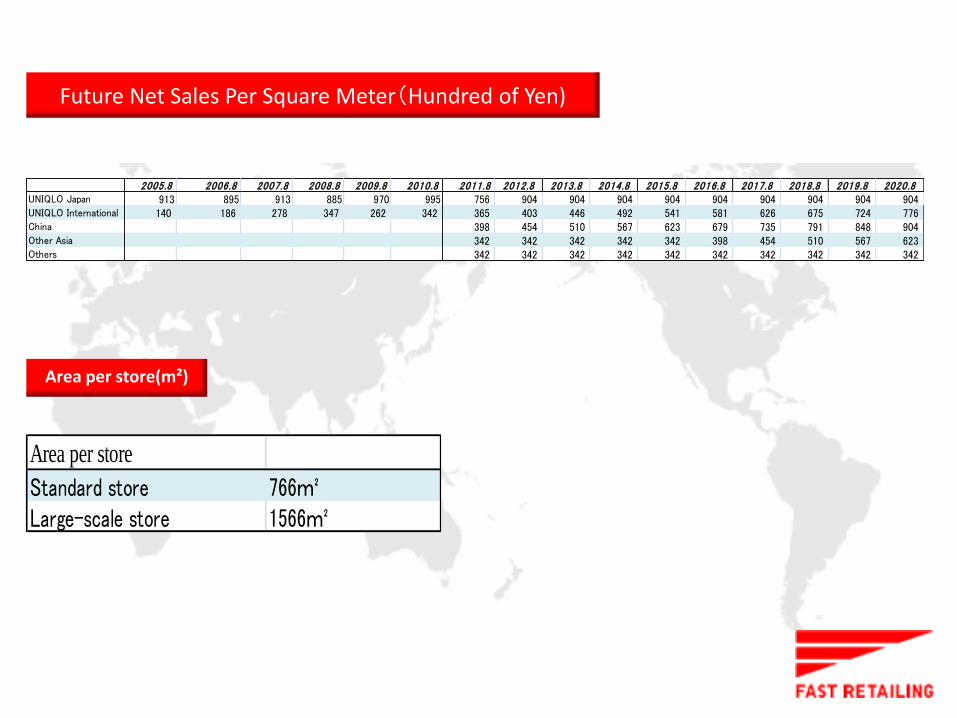
2005.8 2006.8 2007.8 2008.8 2009.8 2010.8 2011.8 2012.8 2013.8 2014.8 2015.8 2016.8 2017.8 2018.8 2019.8 2020.8UNIQLO Japan 913 895 913 885 970 995 756 904 904 904 904 904 904 904 904 904UNIQLO International 140 186 278 347 262 342 365 403 446 492 541 581 626 675 724 776China 398 454 510 567 623 679 735 791 848 904Other Asia 342 342 342 342 342 398 454 510 567 623Others 342 342 342 342 342 342 342 342 342 342
Area per store
Standard store 766m²Large-scale store 1566m²
Future Net Sales Per Square Meter(Hundred of Yen)
Area per store(m²)


リスク要因
•人件費の高騰 ―コストを圧迫する恐れ
•キーパーソンリスク
―柳井氏に依存した経営 ―後継者問題(柳井氏は65歳で引退?)
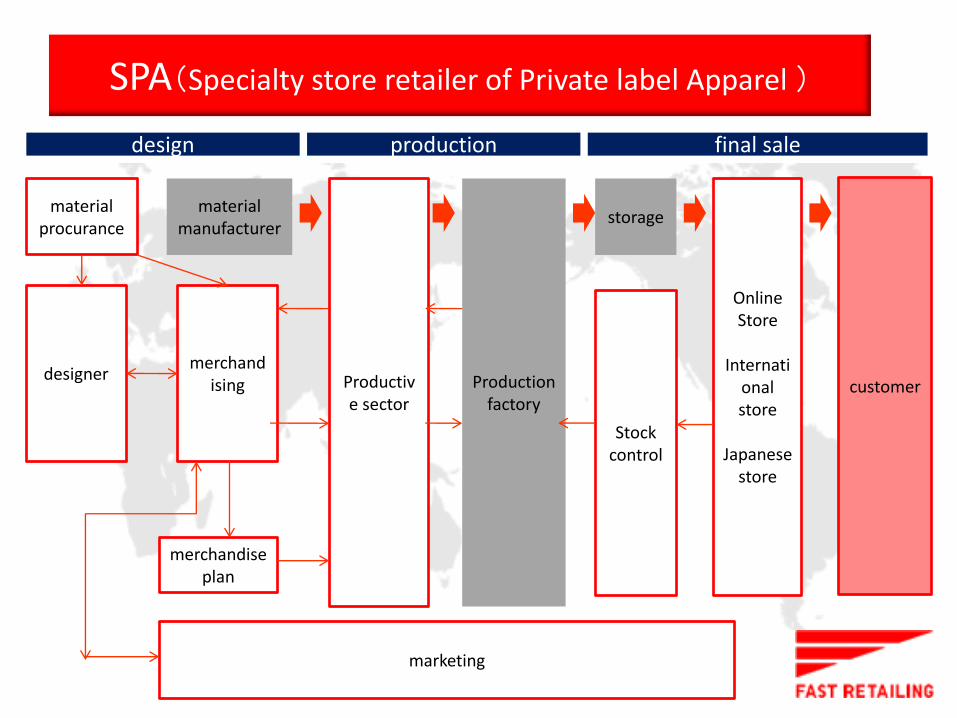
SPA(Specialty store retailer of Private label Apparel )
final sale production design
Production factory
Productive sector
material manufacturer
material procurance
designer merchand
ising
marketing
merchandise plan
storage
Online Store
Internati
onal store
Japanese
store
customer
Stock control

0
2,000
4,000
6,000
8,000
10,000
12,000
14,000
16,000
18,000
1989
1991
1993
1995
1997
1999
2001
2003
2005
2007
2009
衣服小売業販売額
衣服小売業販売額
国内ユニクロ事業の大きな成長は期待できない
市場規模
約10 兆
景気後退の影響 低価格カジュアルチェーン店が消費者に支持される →商品単価が下落
少子高齢化の進展 →経済規模の縮小
(billion yen)
国内アパレル市場動向
0
20
40
60
80
100
120
140
160
180
海外ユニクロ店舗総数
中国店舗数
特に中国に注力
ファーストリテイリング海外動向

220000
555,112
856,589
990,415
0
200000
400000
600000
800000
1000000
1200000
2001 2009 2015 2020
中間所得者層人口 (千人)
高品質
低価格
予測
中国での優位性①

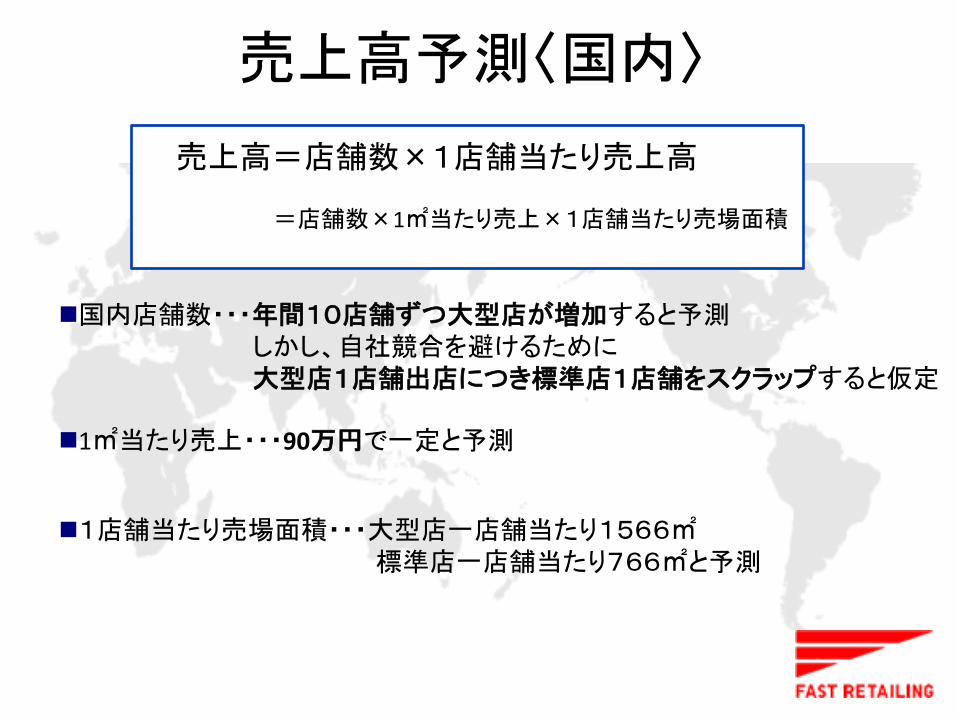
売上高予測〈国内〉
売上高=店舗数×1店舗当たり売上高
国内店舗数・・・年間10店舗ずつ大型店が増加すると予測 しかし、自社競合を避けるために 大型店1店舗出店につき標準店1店舗をスクラップすると仮定
=店舗数×1㎡当たり売上×1店舗当たり売場面積
1㎡当たり売上・・・90万円で一定と予測
1店舗当たり売場面積・・・大型店一店舗当たり1566㎡ 標準店一店舗当たり766㎡と予測

売上高予測〈海外〉 売上高=店舗数×1店舗当たり売上高
=店舗数×1㎡当たり売上×1店舗当たり売場面積
•日本平均出店増加数パターン・・・毎年41店舗ずつ増加
•(2009年以降)平均出店増加数パターン・・・毎年19店舗ずつ増加すると仮定
•柳井さんの言う通り・・・毎年100店舗ずつ増加
一店舗当たり売上高
店舗数

バリュエーション
売上高予測から営業CFを算出
理論株価 27938円 マルチプルのレンジ ~
WACC=5.05% 永久成長率=
現在株価 円より %