fatigue behavior of geopolymer mortar reinforced by …textroad.com/pdf/jaebs/j. appl. environ....
TRANSCRIPT

J. Appl. Environ. Biol. Sci., 5(10S)477-489, 2015
© 2015, TextRoad Publication
ISSN: 2090-4274 Journal of Applied Environmental
and Biological Sciences
www.textroad.com
Corresponding author: A. Refahi, Assistant Professor, Department of Mining, Faculty of Engineering, University of Zanjan. Postal address: Assistant Professor, Department of Mining, Faculty of Engineering, University of Zanjan, Tabriz Road, Zanjan, Iran. Postal code: 45371-38791 Tel Number: +989123034360 E-mail address: [email protected]; [email protected]
Fatigue behavior of geopolymer mortar reinforced by polypropylene fibers
under constant loading amplitude and variable block loading
A. Refahi1, J. Aghazadeh Mohandesi2, E. Gohari Behjat Abadi3
1Assistant Professor, Department of Mining, Faculty of Engineering, University of Zanjan.
2Professor, Department of Metallurgical Engineering, AmirKabir University of Technology, Tehran, Iran. 3MSc student, Department of Metallurgical Engineering, AmirKabir University of Technology, Tehran, Iran.
Received: April 20, 2015
Accepted: June 15, 2015
ABSTRACT
Fatigue behavior of geopolymer mortar reinforced by polypropylene fibers under constant loading amplitude and
variable block loading has been studied here; the geopolymer source material was Metakaolin prepared by calcining
Kaolin powder at 750° C. A fatigue-three-point-bending test was carried out on the geopolymer matrix, plain and
reinforced geopolymer mortar in order to examine growth of crack length generated after one loading cycle. The
obtained results showed that the fibers not only enhanced fatigue life of the reinforced specimens but also decreased
growth rate of fatigue crack length and damage rate. In addition, the fibers increased final crack length prior to fracture.
The results acquired from variable block loading test illustrated that under variable block loading, the strength of the
studied mortar was remarkably sensitive to kinds of loading; fatigue life of specimens under descending amplitude was
decreased in comparison by those under ascending, descending-ascending and ascending-descending amplitude.
Finally, fatigue life of the mortar specimens under variable block loading was calculated using the damage curve
approach; the estimated results were almost close to data experimentally evaluated.
KEYWORDS: Geopolymer mortar; Fatigue behavior; Variable block loading; Damage.
1. INTRODUCTION
It seems that geopolymer mortar may have remarkable mechanical properties with reasonable price to be
considered as a new and environment friendly construction material. Alkali-activated materials called geopolymer, one
of the three-dimensional aluminosilicate minerals with semicrystalline to noncrystalline structures introduced in early
1990s, exhibit similar mechanical behavior to that of conventional Portland cements. Geopolymer is produced through
chemical reactions between a highly reactive aluminosilicate source and an alkaline solution, and the hardened gel
products formed by this reaction process can present desirable mechanical performance in many applications. Its source
can be some industrial aluminosilicate waste materials (Xu and Van Deventer, 2000; Davidovits, 1991). The production
of geopolymeric cement requires much lower calcining temperature (600–800° C) and emits 80–90% less 2
CO than
Portland cement. Reasonable strength can be gained in a short period at room temperature. In most cases, 70% of the
final compressive strength is developed in the first 12 hours. Low permeability, comparable to natural granite, is
another property of geopolymeric cement. It is also reported that resistance to fire and acid attacks for geopolymeric
cement are substantially superior to those for Portland cement. Apart from the high early strength, low permeability and
good fire and acid resistance, geopolymeric cement also can attain higher unconfined compressive strength and shrink
much less than Portland cement. Other documented properties include good resistance to freeze–thaw cycles as well as
excellent solidification of heavy metal ions. These properties make geopolymeric cement a strong candidate for
substituting Portland cement applied in the fields of civil, bridge, pavement, hydraulic, underground and military
engineering (Davidovits, 1991; Barbosa and MacKenzie, 2003; Papakonstantinou et al., 2001; Singh et al., 2004;
Yunsheng et al., 2008). However, the poor mechanical properties of geopolymer materials usually result in catastrophic
failure during service, which is a well-known impediment to their wide applications (Zhao et al., 2007). Some short
fibers, such as polyvinyl alcohol (PVA), polypropylene (PP), basalt fibers and carbon fiber, were employed as additives
to improve geopolymeric mechanical performance because fibers were capable of providing a control of cracking and
increasing the fracture toughness of the brittle matrix through bridging action during both micro and macro cracking of
the matrix (Zhang et al., 2010). For example, it was reported that short polyvinyl alcohol (PVA) fibers were used to
reinforcing fly ash/Metakaolin-based geopolymer and no crack was found on the surface of geopolymer paste with 2%
of PVA fiber (Zhang et al., 2006). The short PVA fibers with an optimum volume fraction of 1% were successfully
employed to improve the brittle properties of ash-based geopolymer (Sun and Wu, 2008). Zhang et al. reported that
calcined kaolin/fly ash-based geopolymer reinforced by polypropylene (PP) fibers showed increasing compressive and
flexural strengths when the geopolymer was cured in steam at 80° C for 3 days (Zhang et al., 2009). Dias and
477
Refahi et al.,2015
Thaumaturgo investigated fracture toughness of geopolymeric concretes reinforced with basalt fibers. It was found that
the geopolymeric concretes with volume fractions of 0.5–1% basalt fibers showed higher splitting tensile strengths than
that of Portland cement concretes (Dias and Thaumaturgo, 2005). Li and Xu reported that the addition of basalt fiber
with an optimum volume fraction of 0.3% could significantly improve deformation and energy absorption capacities of
geopolymeric concrete (Li and Xu, 2009). Lin et al. stated that the short carbon fibers were used to increasing the
flexural strength and toughness of geopolymer (Lin et al., 2008, 2010). Natali et al. showed that glass fiber reinforced
geopolymer composites exhibited a flexural strength increment from 30% up to 70% and geopolymer composites
containing PVC and carbon fibers exhibited the best energy absorption capacity (Natali et al., 2011).
In this study, fatigue behavior of the geopolymer matrix and geopolymer mortar (made by mixing geopolymer and
silica sand particles) and the reinforced mortar by short polypropylene fibers was studied. For this purpose, a three point
bending test was initially carried out on the studied specimens, and subsequently a bending fatigue test was performed
with constant loading amplitude and variable block loading (i.e. ascending, descending, ascending-descending and
descending-ascending loading amplitude). During these tests, bending strength, fatigue life, crack growth rate and
damage growth rate of the studied specimens were determined. In addition, the curves of damage rate during the fatigue
test were determined and used to predict the fatigue life of geopolymeric mortar under the variable block loadings.
2. MATERIALS AND METHODS
In this work, the geopolymer matrix was produced by mixing Metakaolin, sodium hydroxide, sodium silicate and
water with weight ratio of 53%, 4.2%, 34% and 8.8%, respectively. Metakaolin was prepared by calcining Kaolin
powder at 750° C for 3 hours to obtain an amorphous structure that was examined by XRD (X-Ray Diffraction), FTIR
(Fourier Transform Infrared Spectroscopy) analysis; chemical composition and physical properties of Metakaolin are
given in Table 1 and 2. Sodium hydroxide solution was produced by mixing water and sodium hydroxide powder, and
then sodium silicate was added in order to make an activator solution; the mixture was stirred until a transparent
solution was acquired (Table 2 and 3). This activator was gradually and continually poured on the Metakaolin powder
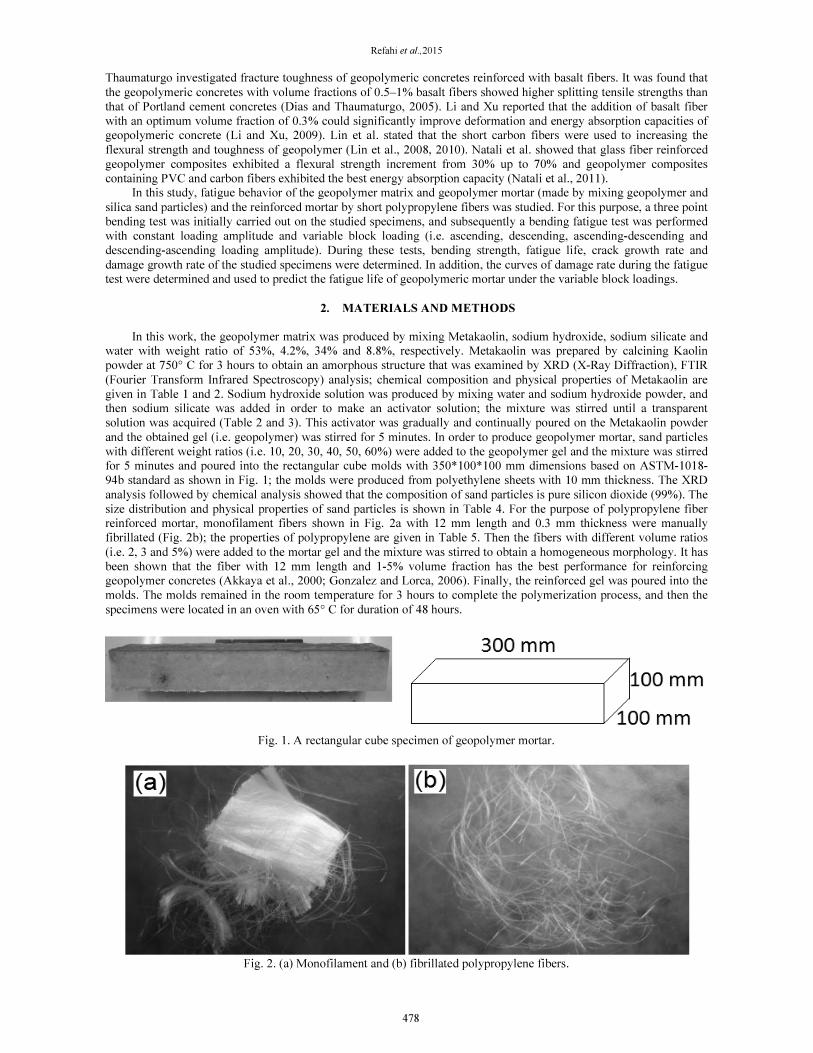
and the obtained gel (i.e. geopolymer) was stirred for 5 minutes. In order to produce geopolymer mortar, sand particles
with different weight ratios (i.e. 10, 20, 30, 40, 50, 60%) were added to the geopolymer gel and the mixture was stirred
for 5 minutes and poured into the rectangular cube molds with 350*100*100 mm dimensions based on ASTM-1018-
94b standard as shown in Fig. 1; the molds were produced from polyethylene sheets with 10 mm thickness. The XRD
analysis followed by chemical analysis showed that the composition of sand particles is pure silicon dioxide (99%). The
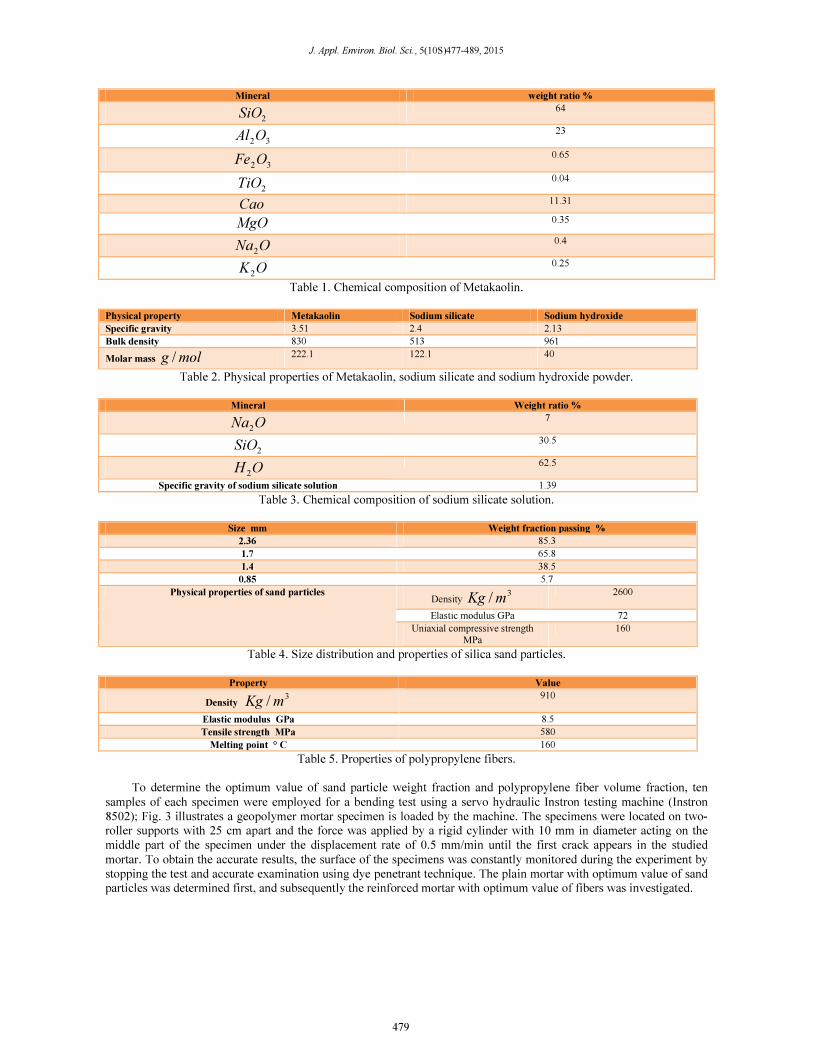
size distribution and physical properties of sand particles is shown in Table 4. For the purpose of polypropylene fiber
reinforced mortar, monofilament fibers shown in Fig. 2a with 12 mm length and 0.3 mm thickness were manually
fibrillated (Fig. 2b); the properties of polypropylene are given in Table 5. Then the fibers with different volume ratios
(i.e. 2, 3 and 5%) were added to the mortar gel and the mixture was stirred to obtain a homogeneous morphology. It has
been shown that the fiber with 12 mm length and 1-5% volume fraction has the best performance for reinforcing
geopolymer concretes (Akkaya et al., 2000; Gonzalez and Lorca, 2006). Finally, the reinforced gel was poured into the
molds. The molds remained in the room temperature for 3 hours to complete the polymerization process, and then the
specimens were located in an oven with 65° C for duration of 48 hours.
Fig. 1. A rectangular cube specimen of geopolymer mortar.
Fig. 2. (a) Monofilament and (b) fibrillated polypropylene fibers.
478
J. Appl. Environ. Biol. Sci., 5(10S)477-489, 2015
Mineral weight ratio %
2SiO
64
32OAl
23
32OFe
0.65
2TiO
0.04
Cao 11.31
MgO 0.35
ONa2
0.4
OK2
0.25
Table 1. Chemical composition of Metakaolin.
Physical property Metakaolin Sodium silicate Sodium hydroxide
Specific gravity 3.51 2.4 2.13
Bulk density 830 513 961
Molar mass molg / 222.1 122.1 40
Table 2. Physical properties of Metakaolin, sodium silicate and sodium hydroxide powder.
Mineral Weight ratio %
ONa2
7
2SiO
30.5
OH2
62.5
Specific gravity of sodium silicate solution 1.39
Table 3. Chemical composition of sodium silicate solution.
Size mm Weight fraction passing %
2.36 85.3
1.7 65.8
1.4 38.5
0.85 5.7
Physical properties of sand particles Density
3/mKg
2600
Elastic modulus GPa 72
Uniaxial compressive strength
MPa
160
Table 4. Size distribution and properties of silica sand particles.
Property Value
Density 3
/mKg 910
Elastic modulus GPa 8.5
Tensile strength MPa 580
Melting point ° C 160
Table 5. Properties of polypropylene fibers.
To determine the optimum value of sand particle weight fraction and polypropylene fiber volume fraction, ten
samples of each specimen were employed for a bending test using a servo hydraulic Instron testing machine (Instron
8502); Fig. 3 illustrates a geopolymer mortar specimen is loaded by the machine. The specimens were located on two-
roller supports with 25 cm apart and the force was applied by a rigid cylinder with 10 mm in diameter acting on the
middle part of the specimen under the displacement rate of 0.5 mm/min until the first crack appears in the studied
mortar. To obtain the accurate results, the surface of the specimens was constantly monitored during the experiment by
stopping the test and accurate examination using dye penetrant technique. The plain mortar with optimum value of sand
particles was determined first, and subsequently the reinforced mortar with optimum value of fibers was investigated.
479

Refahi et al.,2015
Fig. 3. Three point bending test applied to a geopolymer mortar specimen.
In order to determine the fatigue life of geopolymer mortar, a standard fatigue bending test was carried out on ten
samples of each studied specimen using the Instron universal testing machine (Fig. 3); the dimension of the fatigue
specimens was similar to that of the three point bending test. The frequency of cyclic loading was 1 Hz in the sinusoidal
waveform. The maximum applied load was 70%, 80% and 90% of the fracture load in the static bending test. To insure
the contact between the specimens and the jaws of the machine test, a minimum load of 0.1 KN was applied. In order to
obtain the fatigue crack growth rate, the generated crack after one loading cycle was taken as the initial crack length,
and then the growth of crack length during the test was examined using a special designed microscope. Also, to
determine the fatigue life under variable block loading amplitude, repeating an unit loading block of ascending,
descending, ascending-descending and descending-ascending (Fig. 4) were applied to the ten specimens of each studied
mortar until fracture.
Fig. 4. An unit loading block: a) descending, b) ascending, c) descending-ascending, d) ascending-descending (m
F is
fracture load in the static bending test).
480

J. Appl. Environ. Biol. Sci., 5(10S)477-489, 2015
3. RESULTS AND DISCUSSION
3.1. Bending test Table 6 shows the results obtained from the static-bending test applied to the specimens of geopolymer matrix; the
scatter of obtained fracture load is remarkably high. This is common for geopolymer matrixes under three point bending
test where the flaws vary in size, shape and orientation, causing the fracture load to vary from specimen to specimen
(Meyers and Chawla, 2009). Weibull statistical approach was used to determine the statistically most probable results.
The basic assumption in Weibull distribution is that a body of a material has a statistical distribution of noninteracting
fractures. If there are N broken specimens of a brittle material that were tested, the fracture probability of a specimen
with number of i ( )(VFi
) is equal to:
( ) )1/( += NiVFi
(1)
Based on Weibull distribution, the fracture probability of each specimen can be related to the maximum applied load or
fracture load ( F ) as follow:
( )[ ]m
FFVF0
/exp)(1 =− (2)
Where 0
F is a characteristic fracture load of the material that it is often defined as the mean fracture load, and m is the
Weibull modulus measuring the variability of the obtained data; the higher the value of m, the less is the material
variability in fracture load. A double-logarithmic plot of Eq(2) will give a straight line with slope m as following
expressed (Meyers and Chawla, 2009):
( )[ ]0
lnln))(1/(1lnln FmFmVF −=− (3)
Consequently, the mean fracture load and the corresponding Weibull modulus can be evaluated by passing the best
line through the points given in Table 6 using the regression approach (Kreyszig, 2006). Similar approach was
employed for results obtained by applying the test to other studied specimens, and the mean fracture loads of them were
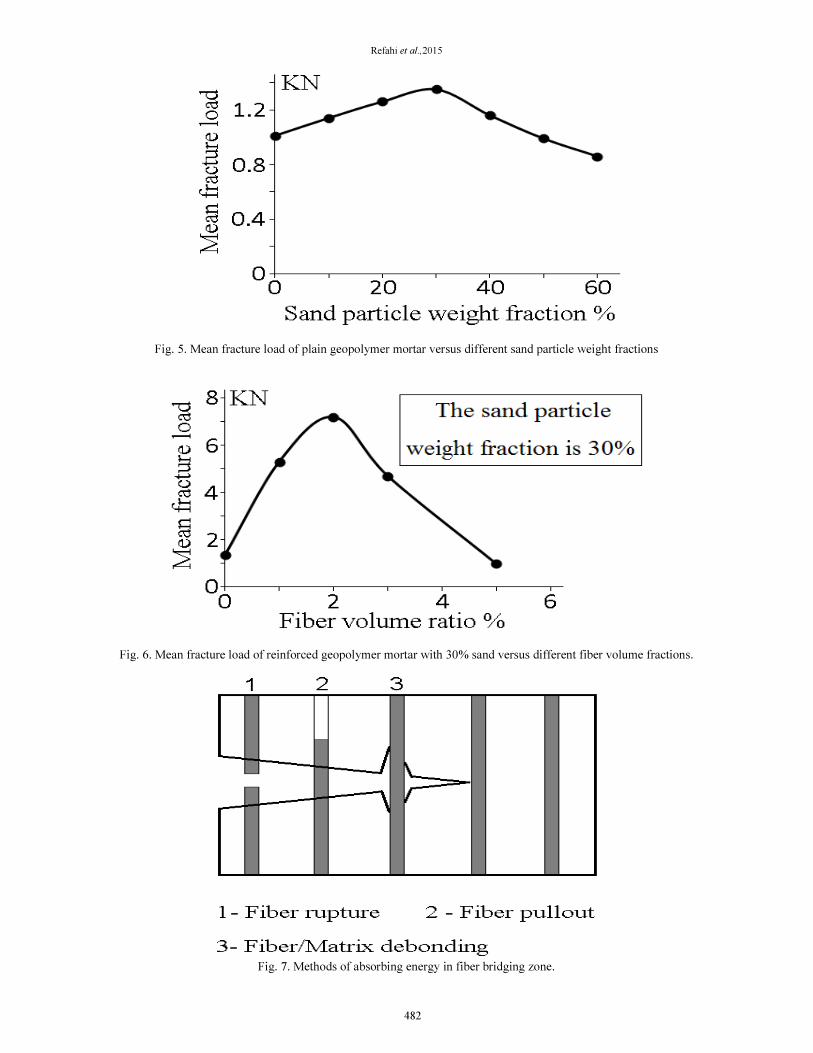
determined. Fig. 5 shows the variation of mean fracture load of the plain geopolymer mortar with the different amount
of sand particles. The specimen with 30% sand particles has the highest fracture load (1.35 KN); by increasing the
weight percent of particles up to 30%, the fracture load of mortar increases and beyond that (i.e. 40%, 50% and 60%
sand) it decreases. It seems that by increasing the amount of sand up to 60% the strength of mortar decreases due to
over population of particles, causing poorly bonds to occur between them (Aghazadeh et al., 2011). Fig. 6 illustrates the
mean fracture load of the reinforced geopolymer mortar with 30% sand versus the different values of fiber volume
fraction. It seems that the reinforced mortar with 2% fiber has the highest strength (7.2 KN); by increasing the fibers up
to 2%, the fracture load of mortar increases and beyond that (i.e. 3% and 5% fibers) it decreases.
The geopolymer mortar samples carry flaws and micro cracks both in the material and at the interfaces. Under an
applied load, the distributed micro cracks propagate, coalesce and align themselves to produce macro cracks. When load
are further increased, conditions of critical crack growth are attained at the tips of macro cracks and a catastrophic
failure is precipitated. However, the fibers bridge the propagating cracks in the reinforced specimens because the matrix
failure precedes the fiber failure. This causes the fiber bridging zone to absorb a lot of energy by fiber debonding, fiber
pullout (sliding) and fiber rupture when a crack propagates across a fiber through the matrix as illustrated in Fig. 7.
Consequently, the fibers enhance the energy absorption capacity and reduce the cracking sensitivity of the mortar,
causing the fracture strength to increase (Banthia and Sheng, 1996). In addition, the fibers reduce the shrinkage
contraction and thus reduce the interfacial relative slides between the matrix and other additive materials, causing to
improve the interfacial bonding strength (Sun and Xu, 2009).
Number of specimen
Fracture probability )(VF Fracture load KN
1 0.091 2
2 0.182 1.66
3 0.273 1.4
4 0.364 1.63
5 0.455 1.48
6 0.545 1.7
7 0.636 2.1
8 0.727 1.57
9 0.818 1.45
10 0.909 1.51
Table 6. Fracture load of ten specimens of geopolymer matrix.
481
Refahi et al.,2015
Fig. 5. Mean fracture load of plain geopolymer mortar versus different sand particle weight fractions
Fig. 6. Mean fracture load of reinforced geopolymer mortar with 30% sand versus different fiber volume fractions.
Fig. 7. Methods of absorbing energy in fiber bridging zone.
482
J. Appl. Environ. Biol. Sci., 5(10S)477-489, 2015
3.2. Fatigue test with constant loading amplitude
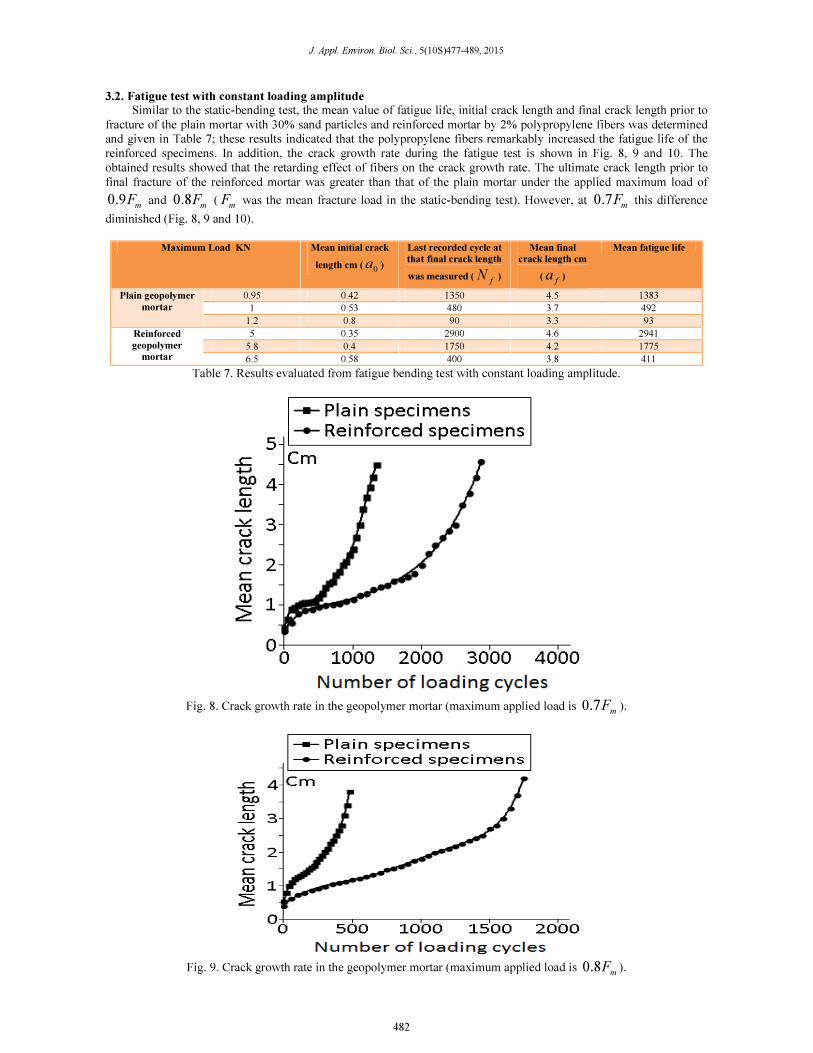
Similar to the static-bending test, the mean value of fatigue life, initial crack length and final crack length prior to
fracture of the plain mortar with 30% sand particles and reinforced mortar by 2% polypropylene fibers was determined
and given in Table 7; these results indicated that the polypropylene fibers remarkably increased the fatigue life of the
reinforced specimens. In addition, the crack growth rate during the fatigue test is shown in Fig. 8, 9 and 10. The
obtained results showed that the retarding effect of fibers on the crack growth rate. The ultimate crack length prior to
final fracture of the reinforced mortar was greater than that of the plain mortar under the applied maximum load of
mF9.0 and
mF8.0 (
mF was the mean fracture load in the static-bending test). However, at
mF7.0 this difference
diminished (Fig. 8, 9 and 10).
Maximum Load KN Mean initial crack
length cm (0
a )
Last recorded cycle at
that final crack length
was measured ( fN )
Mean final
crack length cm
( fa )
Mean fatigue life
Plain geopolymer
mortar
0.95 0.42 1350 4.5 1383
1 0.53 480 3.7 492
1.2 0.8 90 3.3 93
Reinforced
geopolymer
mortar
5 0.35 2900 4.6 2941
5.8 0.4 1750 4.2 1775
6.5 0.58 400 3.8 411
Table 7. Results evaluated from fatigue bending test with constant loading amplitude.
Fig. 8. Crack growth rate in the geopolymer mortar (maximum applied load is m
F7.0 ).
Fig. 9. Crack growth rate in the geopolymer mortar (maximum applied load is m
F8.0 ).
482

Refahi et al.,2015
Fig. 10. Crack growth rate in the geopolymer mortar (maximum applied load is m
F9.0 ).
In order to estimate the damage accumulated in the studied mortar, the damage curve theory was used; the damage after
applying n loading cycles is equal to (Manson and Halford, 1981):
faaD /= (4)
Where D is the damage, a is the crack length formed in the specimens after applying n loading cycles, and fa is
the ultimate crack length (Table 7); when the damage is equal to 1, the specimen will be broken. The damage versus the
relative loading cycles ( fNn / , Table 7) were determined and shown in Fig. 11, 12 and 13; subsequently the best
curve passing through these points were obtained using the regression approach (Table 8); The regression equations
given in Table 8 will be used for predicting the fatigue life of mortar under variable block loading. The results showed
that the difference between damage growth rate in the plain and reinforced geopolymer mortar under low loading (i.e.
mF7.0 ) was not significant. However, the damage growth rate in the plain mortar was greater than that in the
reinforced mortar under high loading (i.e. m
F8.0 and m
F9.0 ); by increasing the amount of loading, this difference
increased. It seems that under low cyclic loading the effect of fibers on crack growths is less significant than that under
high cyclic loading.
Fig. 11. Damage growth rate in the geopolymer mortar (maximum applied load is m
F7.0 ).
483

J. Appl. Environ. Biol. Sci., 5(10S)477-489, 2015
Fig. 12. Damage growth rate in the geopolymer mortar (maximum applied load is m
F8.0 ).
Fig. 13. Damage growth rate in the geopolymer mortar (maximum applied load is m
F9.0 ).
484
Refahi et al.,2015
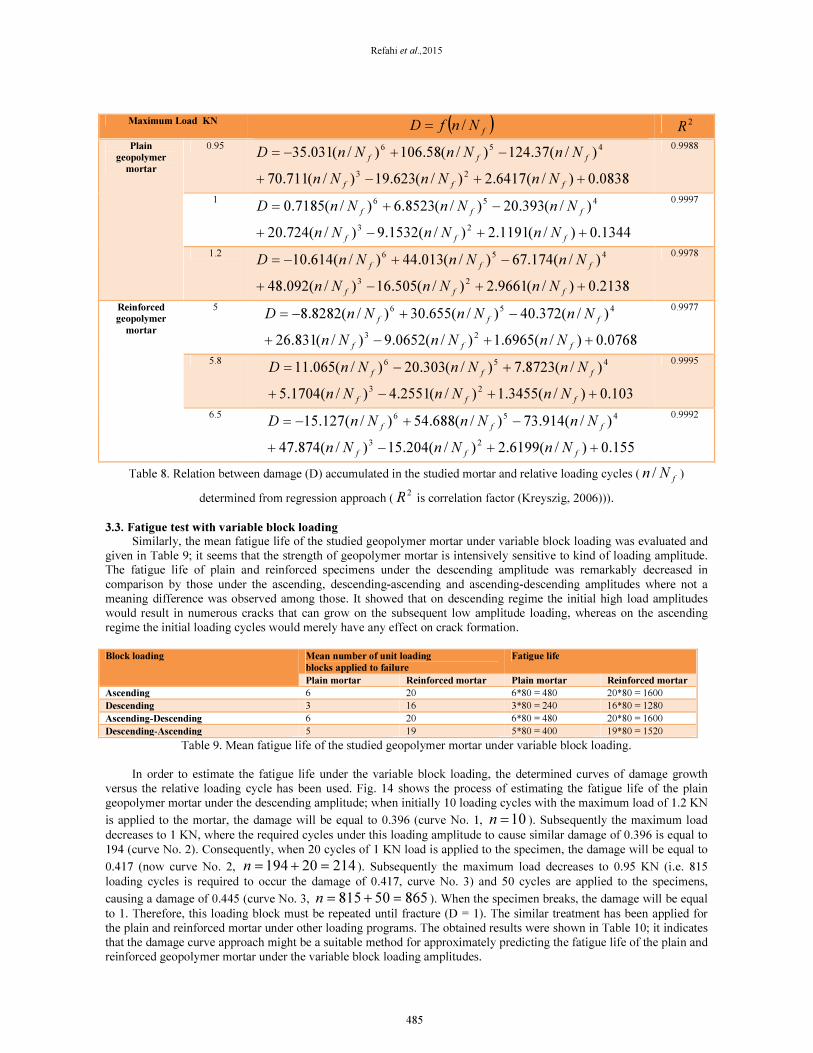
Maximum Load KN ( )
fNnfD /= 2
R
Plain
geopolymer
mortar
0.95
0838.0)/(6417.2)/(623.19)/(711.70
)/(37.124)/(58.106)/(031.35
23
456
++−+
−+−=
fff
fff
NnNnNn
NnNnNnD
0.9988
1
1344.0)/(1191.2)/(1532.9)/(724.20
)/(393.20)/(8523.6)/(7185.0
23
456
++−+
−+=
fff
fff
NnNnNn
NnNnNnD
0.9997
1.2
2138.0)/(9661.2)/(505.16)/(092.48
)/(174.67)/(013.44)/(614.10
23
456
++−+
−+−=
fff
fff
NnNnNn
NnNnNnD
0.9978
Reinforced
geopolymer
mortar
5
0768.0)/(6965.1)/(0652.9)/(831.26
)/(372.40)/(655.30)/(8282.8
23
456
++−+
−+−=
fff
fff
NnNnNn
NnNnNnD
0.9977
5.8
103.0)/(3455.1)/(2551.4)/(1704.5
)/(8723.7)/(303.20)/(065.11
23
456
++−+
+−=
fff
fff
NnNnNn
NnNnNnD
0.9995
6.5
155.0)/(6199.2)/(204.15)/(874.47
)/(914.73)/(688.54)/(127.15
23
456
++−+
−+−=
fff
fff
NnNnNn
NnNnNnD
0.9992
Table 8. Relation between damage (D) accumulated in the studied mortar and relative loading cycles ( fNn / )
determined from regression approach (2
R is correlation factor (Kreyszig, 2006))).
3.3. Fatigue test with variable block loading
Similarly, the mean fatigue life of the studied geopolymer mortar under variable block loading was evaluated and
given in Table 9; it seems that the strength of geopolymer mortar is intensively sensitive to kind of loading amplitude.
The fatigue life of plain and reinforced specimens under the descending amplitude was remarkably decreased in
comparison by those under the ascending, descending-ascending and ascending-descending amplitudes where not a
meaning difference was observed among those. It showed that on descending regime the initial high load amplitudes
would result in numerous cracks that can grow on the subsequent low amplitude loading, whereas on the ascending
regime the initial loading cycles would merely have any effect on crack formation.
Block loading Mean number of unit loading
blocks applied to failure
Fatigue life
Plain mortar Reinforced mortar Plain mortar Reinforced mortar
Ascending 6 20 6*80 = 480 20*80 = 1600
Descending 3 16 3*80 = 240 16*80 = 1280
Ascending-Descending 6 20 6*80 = 480 20*80 = 1600
Descending-Ascending 5 19 5*80 = 400 19*80 = 1520
Table 9. Mean fatigue life of the studied geopolymer mortar under variable block loading.
In order to estimate the fatigue life under the variable block loading, the determined curves of damage growth
versus the relative loading cycle has been used. Fig. 14 shows the process of estimating the fatigue life of the plain
geopolymer mortar under the descending amplitude; when initially 10 loading cycles with the maximum load of 1.2 KN
is applied to the mortar, the damage will be equal to 0.396 (curve No. 1, 10=n ). Subsequently the maximum load
decreases to 1 KN, where the required cycles under this loading amplitude to cause similar damage of 0.396 is equal to
194 (curve No. 2). Consequently, when 20 cycles of 1 KN load is applied to the specimen, the damage will be equal to
0.417 (now curve No. 2, 21420194 =+=n ). Subsequently the maximum load decreases to 0.95 KN (i.e. 815
loading cycles is required to occur the damage of 0.417, curve No. 3) and 50 cycles are applied to the specimens,
causing a damage of 0.445 (curve No. 3, 86550815 =+=n ). When the specimen breaks, the damage will be equal
to 1. Therefore, this loading block must be repeated until fracture (D = 1). The similar treatment has been applied for
the plain and reinforced mortar under other loading programs. The obtained results were shown in Table 10; it indicates
that the damage curve approach might be a suitable method for approximately predicting the fatigue life of the plain and
reinforced geopolymer mortar under the variable block loading amplitudes.
485

J. Appl. Environ. Biol. Sci., 5(10S)477-489, 2015
Fig. 14. Process of estimating damage accumulated in the plain geopolymer mortar under variable block loading with
descending amplitudes.
Block loading Number of block loading applied to specimen prior fracture
Plain mortar Reinforced mortar
From experimental
tests
From damage curves From experimental tests From damage curves
Ascending 6 5 20 18
Descending 3 4 16 14
Ascending-Descending 6 6 20 17
Descending-Ascending 5 4 19 17
Table 10. Fatigue life of the studied geopolymer mortar under variable block loading determined from the experimental
tests and damage curves.
4. Fractographic examination
In order to investigate the fatigue fracture mechanism, fractographic examinations were carried out on the fracture
surface of the studied mortar as shown in Fig. 15 and 16; the fiber bridging zone is shown in Fig. 15b. Low flexural
displacement was observed in the plain specimen, illustrating that a catastrophic fracture has occurred in the plain
geopolymer mortar (Fig. 15a) unlike that of the reinforced specimen where exhibited a typical progressive fracture
behavior rather than a catastrophic one (Fig. 15b). These results have been obtained in the previous work [16]. Also, the
multiple cracks were observed in the reinforced mortar, causing thin layers of the specimen to be separated from the
lateral specimen surface. This may be due to the separation of surface layer of the specimen from the reinforced fibers
during the bridging mechanism (Fig. 15b and 6).
486
Refahi et al.,2015
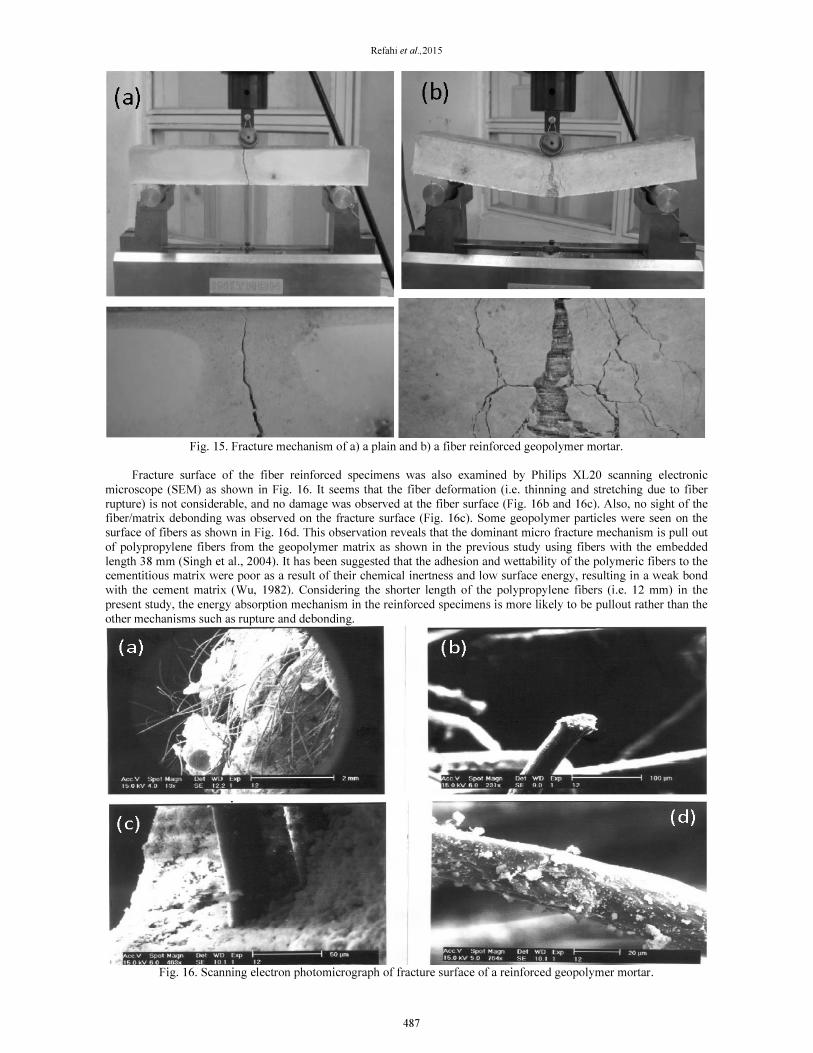
Fig. 15. Fracture mechanism of a) a plain and b) a fiber reinforced geopolymer mortar.
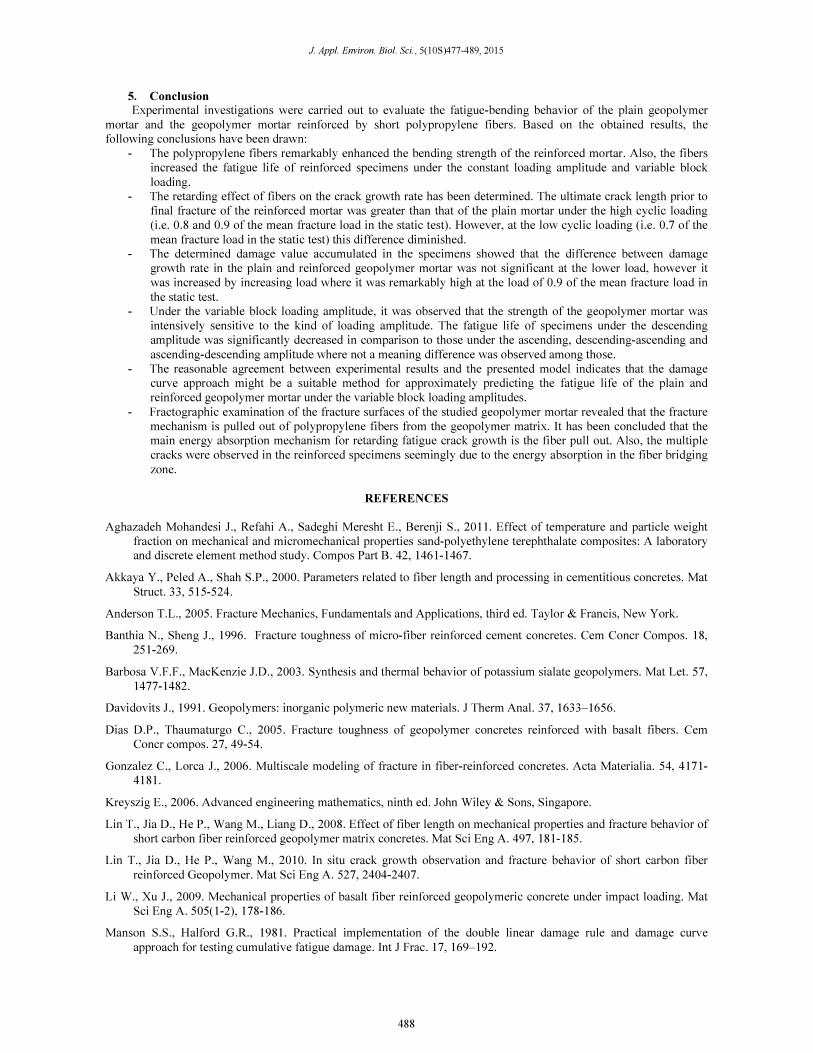
Fracture surface of the fiber reinforced specimens was also examined by Philips XL20 scanning electronic
microscope (SEM) as shown in Fig. 16. It seems that the fiber deformation (i.e. thinning and stretching due to fiber
rupture) is not considerable, and no damage was observed at the fiber surface (Fig. 16b and 16c). Also, no sight of the
fiber/matrix debonding was observed on the fracture surface (Fig. 16c). Some geopolymer particles were seen on the
surface of fibers as shown in Fig. 16d. This observation reveals that the dominant micro fracture mechanism is pull out
of polypropylene fibers from the geopolymer matrix as shown in the previous study using fibers with the embedded
length 38 mm (Singh et al., 2004). It has been suggested that the adhesion and wettability of the polymeric fibers to the
cementitious matrix were poor as a result of their chemical inertness and low surface energy, resulting in a weak bond
with the cement matrix (Wu, 1982). Considering the shorter length of the polypropylene fibers (i.e. 12 mm) in the
present study, the energy absorption mechanism in the reinforced specimens is more likely to be pullout rather than the
other mechanisms such as rupture and debonding.
Fig. 16. Scanning electron photomicrograph of fracture surface of a reinforced geopolymer mortar.
487
J. Appl. Environ. Biol. Sci., 5(10S)477-489, 2015
5. Conclusion
Experimental investigations were carried out to evaluate the fatigue-bending behavior of the plain geopolymer
mortar and the geopolymer mortar reinforced by short polypropylene fibers. Based on the obtained results, the
following conclusions have been drawn:
- The polypropylene fibers remarkably enhanced the bending strength of the reinforced mortar. Also, the fibers
increased the fatigue life of reinforced specimens under the constant loading amplitude and variable block
loading.
- The retarding effect of fibers on the crack growth rate has been determined. The ultimate crack length prior to
final fracture of the reinforced mortar was greater than that of the plain mortar under the high cyclic loading
(i.e. 0.8 and 0.9 of the mean fracture load in the static test). However, at the low cyclic loading (i.e. 0.7 of the
mean fracture load in the static test) this difference diminished.
- The determined damage value accumulated in the specimens showed that the difference between damage
growth rate in the plain and reinforced geopolymer mortar was not significant at the lower load, however it
was increased by increasing load where it was remarkably high at the load of 0.9 of the mean fracture load in
the static test.
- Under the variable block loading amplitude, it was observed that the strength of the geopolymer mortar was
intensively sensitive to the kind of loading amplitude. The fatigue life of specimens under the descending
amplitude was significantly decreased in comparison to those under the ascending, descending-ascending and
ascending-descending amplitude where not a meaning difference was observed among those.
- The reasonable agreement between experimental results and the presented model indicates that the damage
curve approach might be a suitable method for approximately predicting the fatigue life of the plain and
reinforced geopolymer mortar under the variable block loading amplitudes.
- Fractographic examination of the fracture surfaces of the studied geopolymer mortar revealed that the fracture
mechanism is pulled out of polypropylene fibers from the geopolymer matrix. It has been concluded that the
main energy absorption mechanism for retarding fatigue crack growth is the fiber pull out. Also, the multiple
cracks were observed in the reinforced specimens seemingly due to the energy absorption in the fiber bridging
zone.
REFERENCES
Aghazadeh Mohandesi J., Refahi A., Sadeghi Meresht E., Berenji S., 2011. Effect of temperature and particle weight
fraction on mechanical and micromechanical properties sand-polyethylene terephthalate composites: A laboratory
and discrete element method study. Compos Part B. 42, 1461-1467.
Akkaya Y., Peled A., Shah S.P., 2000. Parameters related to fiber length and processing in cementitious concretes. Mat
Struct. 33, 515-524.
Anderson T.L., 2005. Fracture Mechanics, Fundamentals and Applications, third ed. Taylor & Francis, New York.
Banthia N., Sheng J., 1996. Fracture toughness of micro-fiber reinforced cement concretes. Cem Concr Compos. 18,
251-269.
Barbosa V.F.F., MacKenzie J.D., 2003. Synthesis and thermal behavior of potassium sialate geopolymers. Mat Let. 57,
1477-1482.
Davidovits J., 1991. Geopolymers: inorganic polymeric new materials. J Therm Anal. 37, 1633–1656.
Dias D.P., Thaumaturgo C., 2005. Fracture toughness of geopolymer concretes reinforced with basalt fibers. Cem
Concr compos. 27, 49-54.
Gonzalez C., Lorca J., 2006. Multiscale modeling of fracture in fiber-reinforced concretes. Acta Materialia. 54, 4171-
4181.
Kreyszig E., 2006. Advanced engineering mathematics, ninth ed. John Wiley & Sons, Singapore.
Lin T., Jia D., He P., Wang M., Liang D., 2008. Effect of fiber length on mechanical properties and fracture behavior of
short carbon fiber reinforced geopolymer matrix concretes. Mat Sci Eng A. 497, 181-185.
Lin T., Jia D., He P., Wang M., 2010. In situ crack growth observation and fracture behavior of short carbon fiber
reinforced Geopolymer. Mat Sci Eng A. 527, 2404-2407.
Li W., Xu J., 2009. Mechanical properties of basalt fiber reinforced geopolymeric concrete under impact loading. Mat
Sci Eng A. 505(1-2), 178-186.
Manson S.S., Halford G.R., 1981. Practical implementation of the double linear damage rule and damage curve
approach for testing cumulative fatigue damage. Int J Frac. 17, 169–192.
488
Refahi et al.,2015
Meyers M.A., Chawla K.K., 2009. Mechanical behavior of materials, second ed. Cambridge University Press, New
York.
Natali A., Manzi S., Bignozzi M.C., 2011. Novel fiber-reinforced concrete materials based on sustainable geopolymer
matrix. Procedia Eng. 21, 1124-1131.
Papakonstantinou C.G., Balaguru P., Lyon R.E., 2001. Comparative study of high temperature concretes. Compos Part
B. 32(8), 637-649.
Singh P.S., Bastow T., Trigg M., 2004. Outstanding problems posed by nonpolymeric particulates in the synthesis of a
well-structured geopolymeric material. Cem Concr Res. 34, 1943-1947.
Singh S., Shukla A., Brown R., 2004. Pullout behavior of polypropylene fibers from cementitious matrix. Cem Concr
Res. 34, 1919-1925.
Sun P., Wu H.C., 2008. Transition from brittle to ductile behavior of fly ash using PVA fibers. Cem Concr Compos.
30(1), 29-36.
Sun Z., Xu Q., 2009. Microscopic, physical and mechanical analysis of polypropylene fiber reinforced concrete. Mat
Sci Eng A. 527, 198-204.
Wu S., 1982. Polymer Interface and Adhesion, first ed. Marcel Dekker, New York.
Xu H., Van Deventer J.S.J., 2000. The geopolymerisation of alumino-silicate minerals. Inl J Miner Proces. 59, 247-266.
Yunsheng Z., Wei S., Zongjin L., Xiangming Eddie Z., Chungkong C., 2008. Impact properties of geopolymer based
extrudes incorporated with fly ash and PVA short fiber. Constr Buil Mat. 22, 370-383.
Zhang Y.J., Wang Y.C., Xu D.L., Li S., 2010. Mechanical performance and hydration mechanism of geopolymeric
concrete reinforced by resin. Mat Sci Eng A. 527, 6574-6580.
Zhang Y., Sun W., Li Z., 2006. Impact behavior and microstructural characteristics of PVA fiber reinforced fly-ash
geopolymer boards prepared by extrusion technique. J Mat Sci. 41, 2787–2794.
Zhang Z.H., Yao X., Zhu H.J., Hua S.D., Chen Y., 2009. Preparation and mechanical properties of polypropylene fiber
reinforced calcined kaolin-fly ash based geopolymers. J Cent South Uni Techno. 16(1), 49–52.
Zhao Q., Nair B., Rahimian T., Balaguru P., 2007. Novel geopolymer based concretes with enhanced ductility. J Mat
Sci. 42(9), 3131-3137.
489