fatigue design curves of carbon and low; alloy steels · 2012-12-06 · effects of lwr coolant...
TRANSCRIPT
Effects of L WR Coolant Environments on
. NUREG/CR-6583 ANL-97/18
Fatigue Design Curves of Carbon and Low;_ Alloy Steels
Prepared by 0. K Chopra, W. J. Shack
Argonne National Laboratory
Prepared for • U.S. Nuclear Regulatory Commission · · ,
OAGI0000759 00001

AVAILABIUTY NOTICE
Availability of Reference Materials Cited in NRC Publications
Most documents cited In NRC publications will be available from one of the following sources:
1. The NRC Public Document Room. 2120 L Street, NW • Lower Level. Washington, DC 20555-0001
2. The Superintendent of Documents. U S. Government Printing Office. P 0 Box 37082. Washington. DC 20402-9328
3. The National Technical Information Service, Springfield, VA 22161-0002
Although the listing that follows represents the majority of documents cited in NRC publications, it is not intended to be exhaustive.
Referenced documents available for inspection and copying for a fee from the NRC Public Document Room include NRC correspondence and _internal NRC memoranda; NRC bulletins. circulars. information notices. in-· spectlon and investigation notices; licensee event reports; vendor reports and correspondence; Commission papers; and applicant and licensee documents and correspondence
The following documents In the NUREG series are available for purchase from the Government Printing Office: formal NRC staff and contractor reports, NRC-sponsored conference proceedings, international agreement reports, grantee reports, and NRC bool<lets and brochures Also available are regulatory guides, NRC regulations In the Code of Federal Regulations. and Nuclear Regulatory Commission Issuances.
Documents available from the National Technical Information Service include NUREG-series reports and technical reports prepared by other Federal agencies and reports prepared by the Atomic Energy Commission, forerunner agency to the Nuclear Regulatory Commission.
Documents available from public and special technical libraries include all open literature items. such as books. journal articles, and transactions Federal Register notices. Federal and State legislation. and congressional reports can usually be obtained from these libraries
Documents such as theses. dissertations. foreign reports and translations. and non-NRC conference proceedings are available for purchase from the organization sponsoring the publication cited.
Single copies of NRC draft reports are available free. to the extent of supply. upon written request to the Office of Administration, Distribution and Mail Services Section. U S. Nuclear Regulatory Commission. Washington. DC 20555-0001.
Copies of Industry codes and standards used in a substantive manner in the NRC regulatory process are maintained at the NRC Ubrary. Two White Fllnt North. 11545 Rocl<ville Pike. Rockville, MD 20852-2738. for use by the public. Codes and standards are usually copyrighted and may be purchased from the originating organiZation or, If they are American National Standards. from the American National Standards Institute, 1430 Broadway, New York. NY 10018-3308
DISCLAIMER NOTICE ·
This report was prepared as an account of work sponsored by an agency of the United States Government. Neither the United States Government nor any agency thereof, nor any of their employees, makes any warranty, expressed or implied, or assumes any legal liability or responsibility for any third party's use. or the results of
such use, of any information, apparatus, product, or process disclosed in this report, or represents that its use by such third party would not infringe privately owned rights.
; • !
:, I: OAGI0000759 00002

Effects of L WR Coolant Environments on Fatigue Design Curves of Carbon and Low-Alloy Steels
Manuscript Completed: November 1997 Date Published: March 1998
Prepared by 0. K Chopra, W J. Shack
Argonne National Laboratory 9700 South Cass Avenue Argonne,IL 60439
M. McNeil, NRC Project Manager
Prepared for Division of Engineering Technology Office of Nuclear Regulatory Research U.S. Nuclear Regulatory Commission \Vashington, DC 20555-0001 NRC Job Code W6610
NUREG/CR-6583 ANL-97118
OAGI0000759 00003

OAGI0000759 _ 00004
EFFECTS OF LWR COOLANT ENVIRONMENTS ON FATIGUE DESIGN CURVES OF CARBON AND LOW-ALLOY STEELS
by
0. K. Chopra and W. J. Shack
Abstract
The ASME Boiler and Pressure Vessel Code provides rules for the construction of nuclear power plant components. Figures 1-9. 1 through I-9.6 of Appendix I to Section III of the Code specify fatigue design curves for structural materials. While effects of reactor coolant environments are not explicitly addressed by the design curves, test data indicate that the Code fatigue curves may not always be adequate in coolant environments. This report summarizes work performed by Argonne National Laboratory on fatigue of carbon and lowalloy steels in light water reactor (LWR) environments. The existing fatigue 5-N data have been evaluated to establish the effects of various material and loading variables such as steel type, dissolved oxygen level. strain range, strain rate, temperature, orientation, and sulfur content on the fatigue life of these steels. Statistical models have been developed for estimating the fatigue 5-N curves as a function of material, loading, and environmental variables. The results have been used to estimate the probability of fatigue cracking of reactor components. The different methods for incorporating the effects of LWR coolant environments on the ASME Code fatigue design curves are presented.
iii NUREG/CR-6583
OAGI0000759 00005

Contents
Executive Summacy . . . . . . .. .. . . . .. . . ... .. .. .. . . . . . . . . . . . .. . . . . . .. ... .. . . .. . .. .. . . . . . . . . . .. . . . . . ...... . . . . . .. . . . ... ... .. . . . . . . xiii
Acknowledgments . . . . . . . . . . . . . .. . .. . .. ...... . . . . . . . . .. . . . .. . ... ... .. .. . ...... .. . . .. . . . .. . ... . .. . . .. .. ... . . . . . .. . . . . . . ... .... .. xvii
I Introduction............................................................................................................... I
2 Experimental.............................................................................................................. 5
3 Mechanism of Fatigue Crack Initiation ....................................................................... 12
3.1 Formation of Engineering Crack........................................................................ 12
3.2 Environmental Effects ...................................... ."................................................ 17
4 Overview of Fatigue 5-N Data..................................................................................... 33
4.1 Air Environment ... .... .. ......... .......... .... ................ ................. ....... ......... ... ........ ... 36
4.1.1 Steel 'Type . ......................................... ........... ........................................ 36
4.1.2 Temperature ......................................................................................... 36
4.1.3 Orientation . ....... ... ..... ...... ....... ...................... ... .. ................................ ... 36
4.1.4 Strain Rate............................................................................................ 37
4.1.5 Cyclic Stress-versus-Strain Behavior ..................... ............................... 38
4.2 LWR Environments........................................................................................... 42
4.2.1 Strain Amplitude................................................................................... 42
4.2.2 Strain Rate............................................................................................ 42
4.2.3 Temperature......................................................................................... 47
4.2.4 Dissolved Oxygen ...... .............. ............ .................... .... ......... ..... ............ 50
4.2.5 Sulfur Content in Steel.......................................................................... 51
4.2.6 Tensile Hold Period ............................................................................... 53
4.2. 7 Low Dissolved Oxygen ........................................ ................................... 54
4.2.8 Orientation .. .............. ......... ....... ............... .... ..... .. ..... ........... ................. 55
v NUREG/CR-6583
OAGI0000759 00006

4.2.9 Temperatures below 150°C.................................................................... 56
5 Statistical Model ......... ..... ............. .............. ........... .................. .... ... .... .. .. .... ...... .. .. ..... 58
5. l Modeling Choices .. .. .. . .. .. .. .. .. ... . .. ... .... .. .. .. . ... .. .. .. .. . .. .. ... .. .. ... . . .. . . . . . . .. . . ..... . . . . . . . . . . . . 58
5.2 Least-Squares Modeling within a Fixed Structure .. ... .. ....... .. ..... .. ....... .. ..... .... .. .. 58
5.3 The Model......................................................................................................... 60
5.4 Distribution of Fatigue Life............................................................................... 61
6 Fatigue Life Correction Factor .... .. .... ............... ...... ...... ...... ...... .... .. ... .. .. .. .... ........ ........ 65
7 Fatigue 8-N Curves for Components........................................................................... 69
7.1 Factors of 2 and 20...... .. .. . . . . .. .. .. . . . .. .. . . . . . . . . . . . .. .. .. . . . . . .. . . . . . .. . . . . . . . . . . . . . . . .. . . . . . . . . . . . . . . . . 70
7.2 Design Fatigue Curves...................................................................................... 72
7.3 Significance of Design Curves . ... .. .. ... .... .. .. .. .. .... .... .... .. .. .. . . .. . . . . .. .. . .. .. .. .. .. .. . . . .. . . .. 76
8 Fatigue Evaluations in LWR Environments ................................................ :................ 78
9 Summary .. .. .. .. .. .. .. . ... . .. . . . .. .. . . .. . .. .. . .. . . .. .. .. ... . . .. .. . . .. .. . .. ... .. .. . . .. . . . . . . . . . .. . . .. . . . ..... ... .. .. .. . .. . . . 82
Nomenclature.................................................................................................................... 86
References......................................................................................................................... 88
Appendix A: Fatigue Test Results ... . ..... ...................... ... .... ..... ....... ...... .. ................ .... ....... A-1
Appendix B: Design Fatigue Curves for LWR Environments ............ ..... ............. .............. .. B-1
NUREG/CR-6583 vi
OAGI0000759 00007

Figures
1. Fatigue 5-N data for carbon steels in water ............ _.................................................. 2
2. Fatigue data for carbon and low-alloy steel vessels tested in room-temperature water ...... ·................................................................................................................. 4
3. Microstructures of A106-Gr B carbon steel and A533-Gr Blow-alloy steel............... 6
4. Microstructures along fracttire planes of A302-Gr B steel specimens with orientations in rolling, transverse, and radial direction .............................. _............... 6
5. Configuration of fatigue test specimen...................................................................... 7
6. Schematic diagram of electron-beam-welded bar for machining A302-Gr B fatigue test specimens ................................. _ .. ,._.......................................................... 7
7. Autoclave system for fatigue tests in water............................................................... 8
~- Schematic diagram of autoclave system for fatigue tests in water environment......... 9
9. Loading waveform for variable strain rate tests~ .......................... ~ .......... ~·················· 10
10 .. Loading strain applied to specimen gauge section during stroke-controlled tests with a sawtooth waveform ....................................................................................... 10
11. ECP of platinum during fatigue tests at 288°C as a function of dissolved oxygen in effluent . . . . . . . . . . . . . . . . . . . . .. . . .. . . . . . . . . . . . .. . .. . . . . . . . . . . . .. . . . . . . . . . . . .. . ... .. .. .. . . . . ... . .. . . .. . . .. . . . . . .. . . . . . .. . . 11
12. ECP of carbon and low-alloy ferritic steels during fatigue_ tests at 288°C as a function of dissolved oxygen in effluent ........... :........................................................ 12
13. ECP vs. dissolved-oxygen data for carbon and low-alloy steels at 250-:-290°C ........... 12
14. Two stages of fatigue crack growth in smooth test specimens .. .. . . . . . .. . . . . .. .. .. . . .. . . .. . .. .. . 13 . . -
15. Schematic illustration of plastic blunting process of fatigue crack growth in Stage II ................................. ; ...................... ~ ............ -........................................... 14
16. Growth of cracks in smooth fatigue specimens......................................................... 15
17. Crack depth plotted as a function of fractional life for carbon and low-alloy steels tested in room-temperature air................................................................................ 15
18.- . Schematic illustration of short crack behavior ........... : ................... ~ ............ ;............ 16
19. Photomicrograph ofsurface'crack along longitudinal section of AI06-Gr B steel 16
Vii NUREG/CR-6583
OAGI0000759 00008
20. SEM photomicrographs of gauge surface of Al06-Gr B and A533-Gr B steels . tested in different environments at 288°C ............ ........... ..... ... . .... ... ..... ...... ....... ....... 18
21. X-ray diffraction results of A533-Gr B steel as a function of dissolved oxygen ... . .. ... 19
22. Pitting behavior ofA106-Gr B carbon steel and A50~Cl2 low-alloy steel tested in high-purity water . . . .. . . . .. .. ... .. .. . . .. . . ... .. . .... .. ..... .. .. .. .. .... . .. .... . .. . . .. .. . .. .. .. . .. .. .. .. .. .. ...... 19
23. Micropits on surface of A106-Gr B carbon steel and A533-Gr B low-alloy steel tested in oxygenated water at 288°C ........................................................................ 19
24. Relationship between density of micropits and strain rate ...... .. .. .. ..... ........... ............ 20
25. Environmental effects on formation of fatigue cracks in carbon and low-alloy steels . .... .. .. .. . ..... ... .. .... .. .... .. . .. ... .. .. .. .. .. .. .... .. .... .. .. .. .. . . .. .. .. .. . .. .. .. .. .. .. .. .. 20
26. Number of cracks along longitudinal section of fatigue specimens tested in different environments............................................................................................. 21
27. Nucleation of cracks along slip bands, carbide particles, and ferrite/pearlite phase boundaries of carbon steel fatigue specimen .. .. . .. .. .. ... ... . .. . .... .. . .. . .. . .. .. .. .. .. .. .. .. 21
28. Schematic illustration of film rupture/slip dissolution process................................. 23
29. Schematic illustration of hydrogen-induced cracking oflow-alloy steels................... 25
30. Fracture morphology of A106-Gr B carbon steel tested in high-dissolved oxygen water at 288°C and =0.4% strain range.................................................................... 27
31. Fracture morphology of Al06-Gr B carbon steel tested in simulated PWR water at 288°C and ""0. 75o/o strain range.· .......................................................................... '.... 28
32. Fracture morphology of A533-Gr B low-alloy steel tested in high-dissolved oxygen water at 288°C and ::::0,75% strain range....................................................... 29
33. Fracture morphology of A533-Gr B low-alloy steel tested in simulated PWR water at 288°C and ""0. 75% strain range........................................................................... 30
34. Examples of cleavage fracture in Al06-Gr B Specimen pulled apart at room temperature after the fatigue test ... .................. ... ... ........... .......... .. .. .. .... .. ..... .. .. .. .... .. 31
35. Sulfide inclusions on fracture surface of Al06-Gr B carbon steel tested in highdissolved oXygen water at 288°C and ::;0.4% strain range ..... .. .. . .. . .. .. .. .. . .. ... .. .. .. . .. .. . . . 31
36. Depth of largest crack plotted as a function of fatigue cycles for A533-Gr B low-alloy steel and A106-Gr B carbon steel in air and water environments .................. ~.. 32
37. Crack growth rates plotted as a function of crack depth for A533-Gr Blow-alloy steel tested in air and water environments .... ................................. ... .. .. .......... ......... 32
NUREG/CR-6583 viii
OAGI0000759 00009

38. Photomicrographs of surface cracks along longitudinal sections of A533-Gr B low-alloy steel and Al06-Gr B carbon steel in air, simulated PWR environment, and high-dissolved-oxygen water............................................................................. 34
39. Photomicrographs of cracks on gauge surfaces of A533-Gr B low-alloy steel and Al06-Gr B carbon steel specimens tested in air, simulated PWR environment, and high-dissolved-oxygen water . . ... .. . . . .. . . . .. .. . . . . . . . .. . . . . . . . . . . . .. .. . . . .. . . . .. . .. . . . . . . ... ... . . . . . . .. . . 35
40. Strain amplitude vs. fatigue life data for carbon and low-alloy steels in air at 288°C ........ ..... .. .. .................... ...... ... .. ..... .... .. ..... ... .... .... ..... .. .. ..... .... .. .......... 36
41. Strain amplitude vs. fatigue life data for carbon. and low-alloy steels in air at room temperature and 288°C ... .. ............................... ... .... ................ .. ..... .... ... .. ........ 37
42. Effect of material orientation on fatigue life of A302-Gr B low-alloy steel in air at 288°C ........................................................ ,....................... ......................... 37
43. Effect of strain rate and temperature on cyclic stress of carbon and low-alloy steels .. ... . . . . .. . . ... . .. . . . . . . . . . . . . ... . . . . . . . . .. . . . . . . . . . . . . . . . . . . . . .. . .. . . . . . . . . . . . . . . . .. . . . . . . . . . . 39
44. Typical microstructure in Al06-Gr.B specimen tested at 0.4 %/s strain rate showing immature dislocation walls in three pearlite grains consisting of Fe3C plates in the ferrite matrix ............................................... ~ ............................ : ...... ~.... 39
45. Ferrite grain between two pearlite grains in Al06-Gr B specimen tested at 0.4 o/o/s strain rate ............... ·; ................... ~ .... ; .......................... ~;;.............................. 40
46. Typical microstructure in Al06-Gr B specimen tested at 0.04 %/s strain rate showing a cell structure in ferrite and two pearlite grains ... ·...................................... 40
47. Formation of dislocation walls in two pearlite grains in Al06-Gr B specimen tested at 0.004 °/o/s strain rate ....................................... ; ... ~ ................ ;................... 41
48. Cyclic stress-strain curve for carbon and low-alloy steels at 288°C in air .. . .... .. . .. .. .. . 41
49. Strain amplitude vs. fatigue life data for A533-Gr B and Al06-Gr.B steels in high-dissolved-oxygen water at 288°C ............................... :..................................... 43
50. Dependence of fatigue life of carbon and low~alloy steels on strain rate ... ........ ..... .... 44
51. Fatigue life of Al06-Gr B carbon steel at 288°C and 0.75% strain range in air and water environments under different loading waveforms . .................................... 45
52. Fatigue life of carbon and low-alloy steels tested with loading waveforms where slow strain rate is applied during a fraction of tensile loading cycle ......... ... ...... ......... 46
53. Change in fatigue life of A333-Gr 6 carbon steel with temperature and DO.............. 47
ix NUREG/CR-6583
OAGI0000759 00010
54. Dependence of fatigue life on temperature for carbon and low-alloy steels in water at two strain rates ............................................. :...................................................... 49
55. Waveforms for change in temperature during exploratory fatigue tests ..................... 49
56. Fatigue life of· A333-Gr 6 carbon steel tube specimens under varying temperature. indicated by horizontal bars . . . . . . . . . . .. . . .. . . . . . . . . . . . . . . . . .. . . . . . . . . . . . .. . .. .. .. . . . .. . . . . . 50
57. Dependence on DO of fatigue life of carbon steel .................... .................................. 51
58. Effect of sulfur content on fatigue life of low-alloy steels in high-dissolved-oxygen water at 288°C..... .. . ... . .. . . . . . . . .. . .. . . . . .. . .. . . . . .. . . . .. . . . . . . . .. . . . . . .. . . .. . . . . . . . . . . . .. . . . . . . . . . . . ... . . . . . . . . . . .. 52
59. Effect of strain rate on fatigue life of low-alloy steels with
different sulfur contents........................................................................................... 52
60. Effect of sulfur content on fatigue life of carbon steels in high-dissolved-oxygen water at 288°C .......................................................................................... ·...... ......... 52
61. Effect of strain rate on fatigue life of A333-Gr 6 carbon steels with
different sulfur·contents........................................................................................... 53
62. Fatigue life of Al 06-Gr B steel in air and water environments at 288°C, 0. 75% strain range. and hold period at peak tensile strain.................................................. 53
63. Strain amplitude vs. fatigue life data for A106-Gr B and A533-Gr B steels in simulated PWR water at 288°C................................................................................. 54
64. Effect of material orientation on fatigue life of A302-Gr B low-alloy steel in highdissolved-oxygen water and simulated PWR environments ... .. .. .. .... .... .... .. .. ..... .. ....... 55
65. Relative fatigue lives of different orientations of A302-Gr B low-alloy steel in high-dissolved-oxygen water and simulated PWR environments............................... 56
66. SEM photomicrograph of fracture surface and longitudinal section of A302-Gr B steel specimen in T2 orientation tested in PWR water at 288°C, ..,Q. 75% strain range, and slow/fast waveform................................................................................. 57
67. Experimental and predicted fatigue lives of A106-Gr Band A533-Gr B steels in water at temperatures below 150°C.......................................................................... 57
68. Fatigue life of A333-Gr 6 carbon steel as a function of dissolved oxygen in water at 100 and 150°C .................................................... ................................................. 58
69. Schematic of least-squares curve-fitting of data by minimizing sum of squared Cartesian distances from data points to predicted curve........................................... 59
70. Fatigue s-N behavior for carbon and low-alloy steels estimated from model and determined experimentally in air at room temperature ...... ......... .............. .. .. ............ 61
NUREG/CR~583 X
OAGI0000759 00011

71. · Experimental data and probability of fatigue cracking in carbon and low-alloy steel test specimens in air ........................................... ~............................................ 63
72. Experimental data and probability of fatigue cracking in carbon and low-alloy steel test specimens in simulated PWR environments............................................... 64
73. Experimental data and probability of fatigue cracking in carbon and low-alloy steel test specimens in high-dissolved-oxygen water ..... ;·.......................................... 64
7 4. Experimental fatigue lives and those estimated from statistical and EFD models ·for carbon and low-alloy steels in simulated PWR water ............................... ~........... 66
75. · Experimental fatigue lives and those estimated from statistical and EFD models for carbon and low-alloy steels in water at te!llperatures below 150°C...................... 66
76. Experimental fatigue lives and those estimated from statistical and EFD models for carbon and low..;.alloy steels in high-dissolved-o:Xygen water .............. : ...... ~ ..... ·..... 67
77. Dependence on strain rate of fatigue life of carbon steels obsenred experimentally and that estimated from statistical and EFD models ... .. ..... .. . . .. .. ..... .. .. . ... .. .... .. . .... .... 68
78. Dependence on dissolved oxygen of fatigue life of carbon· steels observed . experimentally and that estl~ated from statistical and EFD models......................... 68
79. Adjustment for mean stresseffects and factors of2 and 20 applied to best-fit 8-N cunres for carbon and low...:alloy steels to obtain the ASME Code design fatigue cunre ....................................................................................................................... 70
80. Fatigue design cunres developed from statistical model for carbon and low-alloy steels in air at room temperature and 28S°C ................. :.......................................... 73
81. Fatigue design curves developed from statistical model for carbon and low-alloy steels under service conditions where one or more critical threshold values are not satisfied ................ ; ......... : ............... : ..... .' .... ~........................................................ 74
82. Fatigue design cunres developed from statistical model for carbon and low-alloy steels under service conditions where all critical threshold values are satisfied......... 75
83. Probability distribution on fatigue life of carbon and low-alloy steels in air............... 76
84. Probability of fatigue cracking in low-alloy steel in low-dissolved-oxygen water plotted as a function of cumulative usage factor at different stress levels.................. 77
85. Probability of fatigue cracking in carbon steel in high-dissolved-oxygen water plotted as a function of cumulative usage factor at different stress levels.................. 77
B 1. Fatigue design cunres developed from statistical model for carbon and low-alloy steels under service conditions in which any one of the critical threshold values is riot satisfied . . . . . . .. .. .. . . . . . .. .. .. . . ... ... . . .. .. . . . .. . .... . ... . . . . . . . . . ... . . . . .. . ... ... . . . . . .. . . . . . . . . . . .. . .. .. . . . . .. . .. B-2
xi NUREG/CR-6583
OAGI0000759 00012

B2. Fatigue design curves developed from statistical model for carbon and low-alloy steels at 200°C in water with ==0.2 ppm dissolved oxygen .......................................... B-3
B3. Fatigue design curves developed from statistical model for carbon and low-alloy steels at 250°C in water with ==0.2 ppm dissolved oxygen .......................................... B-4
B4. Fatigue design curves developed from statistical model for carbon and low-alloy steels at 288°C in water with ==0.2 ppm dissolved oxygen.......................................... B-5
Tables
1. Chemical composition (wt.%) offerritlc steels for fatigue tests.................................. 5
2. Average room-temperature tensile properties of steels.............................................. 6
3. Inverse of standard cumulative distribution function .... .. ... .... .. ... .. .. .. .. .. ....... ... ......... 63
4. Factors on cycles and on strain to be applied to mean s-N curve............................. 72
5. Fatigue evaluation for SA-508 Cl I carbon steel feedwater nozzle safe end for a BWR ................................................................................................................ 80
6. Fatigue evaluation for SA-333 Gr 6 carbon steel feedwater line piping for a BWR ..... 80
7. Fatigue evaluation for SA-508 C12low-alloy steel outlet nozzle for a PWR................ 81
Al. Fatigue test results for Al06-Gr B carbon steel at 288°C ......................................... A-2
A2. Fatigue test results for A533-Gr B low-alloy steel at 288°C ..... .. .... .... .... ................. .. A-3
A3. Fatigue test results for A302-Gr B low-alloy steel at 288°C . .. .... .. .. ....................... .... A-4
A4. Results of exploratory fatigue tests in which slow strain rate was applied during only part of tensile-loading cycle . . .. . . . . .. . . . . . .. . . . . . . . .. . . . .. . . . . . . . .. . . . . . . . . . . . . . . . . . . . . . . . . . . . .. . . . . . . . .. A-5
NUREG/CR-6583 xii
OAGI0000759 00013

. Executive Summary
The ASME Boiler and Pressure Vessel Code Section III, Subsection NB, contains rules for ·the design of Class I components. Figures 1-9.1 through 1-9.6 of Appendix I to Section III specify the Code design fatigue curves for the applicable structural materials. However, Section III, Subsection NB-3121, of the Code states that effects of the coolant environment on fatigue resistance of.a material were not intended to be addressed in these design curves. Therefore, there is· uncertainty about the effects of environment on fatigue resistance of materials for operating pressurized water reactor (PWR) and boiling water reactor (BWR) plants, whose primary~coolant-pressure-boundary components were designed in accordance with the Code.
The current ASME Code Section III design fatigue curves were based primarily on straincontrolled fatigue tests of small polished specimens at room temperature in air. Best-fit curves to the experimental test data were lowered by a factor of 2 on stress or a factor of 20 on cycles, whichever was more conservative. to obtain the design fatigue curves.· These factors are not safety margins but rather adjustment factors that must be applied to experimental data on specimens to obtain estimates of the· Jives of components. They. were not intended to address the effects of the coolant environment on fatigue life.
Recent fatigue strain vs. life (S-N) data obtained in the U.S. and Japan demonstrate that light water reactor (LWR) environments can have potentially significant effects on the fatigue resistance of materials. Specimen lives in simulated LWR environments can be much shorter than· those for corresponding tests in air. Under certain conditions of loading and environment,' fatigue lives in water can be up to a factor of 70 shorter than those for the tests in air. ·
This report summarizes work performed by Argonne National Laboratory on fatigue of ·carbon and low-alloy ferritic steels in simulated LWR environments. The existing fatigue S-N data, foreign and domestic, for these steels have been evaluated to establish the effects of various material and loading variables ori the faligue life. The influence of reactor environments on the formation and growth of short fatigue cracks is discussed. Statistical methods have been used to develop fatigue S-N curves that include the effects of material. loading. and environmental variables. The results have also been· used to estimate the probability of fatigue cracking of reactor components associated with a particular choice of design curve. Several methods for incorporating the effects of LWR coolant environments on
· the ASME Code fatigue design curves are presented.
Mechanism of Fatigue Crack Initiation
Fatigue· life of a material is defined as the number of cycles to form an "engineering" crack. e.g.;' a 3-mm-deep crack. During cyclic loading. surface cracks, ·10 pm or more in length, form quite early in life, i.e., <10% of life even at low strain amplitudes. The fatigue life may be considered to be composed entirely of the growth of these short cracks. Fatigue damage in a material is the current size of.the fatigue crack, and damage accumulation is the rate of crack growth. Growth of short fatigue cracks may be divided into three regimes: (a) an initial period that involves growth of microstructurally small cracks that is very sensitive to microstructure and is characterized by a decelerating growth rate, (b) a final period of growth
xiii NUREG/CR-6583
OAGI0000759 00014

that can be predicted from fracture mechanics methodology and is characterized by accelerating crack growth rate, and (c) a transition period controlled by a com}linatlon of the two regimes.
Tests have been conducted to characterize the formation and growth of short cracks in carbon and low-alloy steels in LWR environments .. The results indicate that the decrease in fatigue life of these steels in high-dissolved-oxygen (DO) water is primarily caused by the effects of environment on the growth of short cracks < 100 J.lm deep. The growth rates of cracks < 100 J.lm in size in high-DO water are nearly two orders of magnitude higher than those in air. In high~DO water, surface cracks grow entirely as tensile cracks normal to the stress. In air and low-DO water, surface cracks gr<?w initially as shear cracks ::::45° to the stress axis, and then as tensile cracks normal to the stress axis when slip is no longer confined to planes at 45° to the stress axis. The results also suggest that in LWR environments, the growth of short fatigue cracks occurs by anodic dissolution: the growth rates depend on DO level in water and possibly on sulfur content in steel.
Overview of Fatigue 5-N Data
In air, the fatigue life of carbon and low-alloy steels depends on steel type, temperature, orientation (rolling or transverse), and strain rate. The fatigue life of carbon steels is a factor of"" 1.5 lower than that of low-alloy steels. For both steels, fatigue life decreases with increase in temperature. Some heats of carbon and low-alloy steels exhibit effects of strain rate and orientation. For these heats, fatigue life decreases with decreasing strain rate. Also, based on the distribution and morphology of sulfides, the fatigue properties in transverse orientation may be inferior to those in the rolling orientation. , The data indicate significant heat-to-heat variation: at 288°C, fatigue life may vary by up to a factor of 5 above or below the mean value. The results also indicate that the ASME mean curve for low-alloy steels is in good agreement with the experimental data and that for carbon steels is somewhat conservative.
Environmental effects on fatigue life are significant only when five conditions are satisfied simultaneously, viz., applied strain range, temperature. DO level in water, and sulfur content in steel are above a minimum threshold level, and strain rate is below a critical value. There is little or no difference in susceptibility to environmental degradation of fatigue life of carbon and low-alloy steels. The fatigue life of these steels in air and LWR environments can be estimated from the statistical models presented in this report.
For both steels, the fatigue data indicate threshold values of 150°C for temperature and 0.05 ppm for DO, above which fatigue life may be decreased in LWR environments .. The effect of DO content on life saturates at 0.5 ppm. The data also indicate a threshold strain rate of 1 %/s, below which fatigue life is decreased in LWR environments: the effect saturates at ::::0.001%/s. Limited data suggest that the threshold strain is either equal to or slightly greater than the fatigue limit of the material. When the threshold conditions for all five parameters are satisfied, fatigue life decreases logarithmically with decreasing strain rate and DO level. Only a moderate decrease in fatigue life is observed in LWR environments when any one of the threshold condition is not satisfied, e.g., at temperatures· :s;I50°C or in low-DO PWR environments (:s;0.05 ppm DO). Under these conditions, life in water is 30-50°/o lower than that in air.
NUREG/CR-6583 xiv
OAGI0000759 00015

Statistical Model -
The fatigue 5-N curves are generally expressed in terms of the Langer equation, which may be used to represent either strain amplitude in terms of life or life in terms of strain amplitude.· The parameters of the equation are commonly established through least-squares curve-fitting of the data to minimize the sum of. the square of the residual errors for either strain amplitude or: fatigue life. A predictive model based on least-squares fit on life is biased for low strain amplitude. The model leads to probability curves that converge to a single value of strain, but the model fails to address the fact that at low strain values, most of the error in life is due to uncertainty associated with either measurement of strain or variation in fatigue limit caused by material variability. On the other hand, a least-squares fit on strain does not work well for higher strain amplitudes. In the present study, statistical models have been developed by combining the two approaches and minimizing the sum of the squared Cartesian distances from the data point to the predicted curve.
The statistical models predict fatigue life of small smooth specimens of carbon and lowalloy steels as a function of various material, loading, and environmental parameters.' The functional form and bounding values of these parameters were based upon experimental observations and data trends. The models are recommended for predicted fatigue lives of S 1 Q6
cycles. The results indicate that the ASME mean curve for carbon steels is not consistent with the experimental data at strain amplitudes of <0.2%: the mean curve predicts significantly
·lower fatigue lives than those observed experimentally.· The estimated curve for low-alloy · steels is comparable with the ASME mean curve. An alternative model, proposed by the ·Environmental Fatigue Data (EFD) Committee of Japan, for incorporating the effects of LWR environments on fatigue life of carbon and low-alloy 'steels is also discussed.
· The results of a rigorous statistical analysis have been used to estimate the probability of fatigue cracking in smooth fatigue specimens. The results indicate that relative to the mean or 50% probability curve, the 5% probability curve is a factor of ""2.5 lower in life at strain amplitudes >0.3% and a factor of 1.4-1.7 lower in strain at <0.2% strain amplitudes. Similarly, the I% probability curve is a factor of z3.7lower in life and a factor of 1.7-2.2 lower in strain.
Fatigue S-N Curves for Components
The design fatigue curves for components have been determined by adjusting the best-fit experimental curve for the effect of mean stress and setting margins of 20 on cycles and 2 on strain. The factor of 20 on cycles is intended to account for the uncertainties in fatigue life associated with material and loading conditions, and the factor of 2 on strain to account for uncertainties in threshold strain caused by material variability. Data available in the literature were reviewed to evaluate the effects of various material, loading, and environmental variables on fatigue life. The results indicate that a factor of at least 10 on cycles and 1.5 on strain is needed to account for the differences and uncertainties in relating the fatigue lives of laboratmy test specimens to those of actual components. Design fatigue curves are presented for various LWR service conditions.
The statistical models have been used to interpret the significance of the ASME Code design curves in terms of the implicit probability of initiation associated with the curve. The estimated S-N curves representing 5 and 1% probabilities of fatigue cracking in carbon and
XV NUREG/CR-6583
OAGI0000759 00016

low-alloy steel components in room-temperature air are compared with the ASME Code design fatigue curve. The results indicate that the current design fatigue curve results in a <5% probability of fatigue cracking in LAS components and <1% probability in CS components. The probabilities of fatigue cracking in carbon and low-alloy steel components have also been estimated as a function of cumulative usage factor (CUF) for various service conditions. As expected, the probability of fatigue cracking increases with increasing CUF ... For a specific CUF, the probability also depends on the applied stress amplitude. The dependence on stress
. ·is relatively weak for high stress levels, but at low stresses the probability is quite sensitive to the stress amplitude. At low stresses, the probability of fatigue cracking is not well characterized by cycle counting, i.e., CUF. Rather, it is controlled by the uncertainty in defining fatigue limit for the material.
Fatigue Evaluations in LWR Environments
Fatigue evaluations are presented for a carbon steel feedwater nozzle safe end and feedwater line piping for a BWR, and for a low-alloy steel outlet nozzle for a PWR vessel. The values of CUF were determined either from the design fatigue curves developed from the statistical model or by applying a fatigue life correction factor that was obtained from the statistical model or the EFD correlations.
The correction factor approach yields higher values of CUF than those obtained from the design fatigue curves. The difference arises because the design curves not only account for the effect of environment but also for the difference between the ASME mean air curve and the statistical model air curve, which better represents the data. For carbon steels, this difference can be significant at stress amplitudes of <180 MPa (<26 ksi}. The results also show that for the feedwater nozzle safe end and the feedwater line piping, the BWR environment increases the fatigue usage by a factor of =2. For the low-alloy steel outlet nozzle for a PWR, the effect of environment on fatigue usage is insignificant.
NUREG/CR-6583 xvi
OAGI0000759 00017

Acknowledgments
The authors thank W. F. Burke, T. M. Galvin, D. J. Gavenda, J. L. Smith, J. E. Franklin, and J. Tezak for their contributions to the experimental effort. The authors also thank T. F. Kassner for helpful discussions. This work is sponsored by the Office of Nuclear Regulatory Research, U.S. Nuclear Regulatory Commission, under Job Code W6610-6; Program Manager: Dr. M. B. McNeil.
xvii NUREG/CR-6583
OAGI0000759 00018

1 Introduction
The ASME Boiler and Pressure Vessel Code Section Ill, Subsection NB,l which contains rules for the construction of Class 1 components for nuclear power plant, recognizes fatigue as a possible mode of failure in pressu-re vessel steels and piping materials. Cyclic loadings on a structural component occur because of changes in the mechanical and thermal loadings as the system goes from one load set (e.g .• presstire, temperature, moment, and force loading) to any other load set. For each pair of load sets, an individual fatigue usage factor is determined by the ratio of the number of cycles anticipated during the lifetime of the component to the allowable cycles. Figures 1-9.1 through I-9.6 of Appendix I to Section III of the Code specify fatigue design curves which define the allowablenumber of cycl~s as a function of applied stress amplitude. The cumulative usage factor (CUF) is sum of the individual usage factors. The ASME Code Section III requires that the CUF at each location must not exceed 1.
The Code design fatigue curves were based--on strain-controlled tests of small polished specimens at room temperature (RI') in air. In most studies, the fatigue life of a test specimen is defined as the number of cycles for the tensile ~ti-~ss to drop 25% from its peak value, which corresponds to a ::::3-mm-deep crack. Consequently, fatigue life N represents the nu~ber of cycles required to initiate a crack :::::3 mm deep. The best-fit curves to the experimental data were expressed in terms of the Langer equation2 of the form
Ea = B(N)-b + A, (1.1)
where A, B. and b are para:meters of the model (Eq. 1.1 may be written in terms of stress amplitude sa instead of strain amplitude ea. where stress. amplitude is the product of strain amplitude and elastic modulus, i.e., Sa = E Ea). The _design fatigue curves were obtained by decreasing the best-fit curves by a factor of 2 on. stress or 20 on cycles, whichever was more conservative, at each point on the. best-fit curve. _ As described in the. Section III criteria document. these factors were intended to account for the differences and uncertainties in relating the fatigue lives of laboratory test specimens' to those of actual reactor components. The factor of 20 on cycles is the product of three separate subfactors: 2 for scatter of data (minimum to mea~). 2.5 for size effects, and 4- for surface finish, ·atmosphere, etc.3 "Atmosphere" was intended to reflect the effects of an industrial environment rather than the controlled environinent of a· laboratory. The facto~s-of 2 and 20 are not safety margins but 'rather conversion factors that must bea:pplied to the eip~rimental data to o}Jtain reasonable estimates of the lives of actual reactor' components. They were not intended' to address the effects of the coolant environment on fatigue ~~~~· .
Subsection NB-3121, of Section lii of tb."e Code state~ that the data on which the fatigue design curves (Figs. I-9.1 through 1-...:9.6) are based 'ctid not lllclude tes~s trl the presence of
. corrosive environments that might accelerate fatigue failure. 'Article &-2131 iri Appendix B to · Section HI states ·that the owner's design specification~ should provide information regarding any reduction to fatigue· .design ct'tives necessitated by. environm.ental conditions. Recent fatigue. strain-vs.-life (S-N) data illustrate potentially significant effects of light water reactor (LWR) coolant en~ronments on the fatigue resistance of carbon steels ·(CSs) and low-alloy steels (LASs),4-14 as well as of austenitic stainle~s 'steels ·(sss).I5.16 Under certain conditions of joading and . environment, fatigue lives of carbon steels c;an . b~ ~ factor of 70 lower in the
1 . NUREG/CR-6583
OAGI0000759 00019

~ 0 -c:o w Q)
"'0 :::1 ~
Ci. E <(
c -~
U5 0.1
1 Q1 1~ 1@ )~ 1~ 1 as Cycles to Failure, N25
Figure 1. Fatigue 5-N datafor carbon steels in water
environment than those in air (Fig. 1). Therefore, the margins in the ASME Code may be less conservative than originally intended.
Experience with operating nuclear plants worldwide reveals that many failures may be attributed to fatigue. Examples of such failures include emergency core cooling system (ECCS) or residual heat removal (RHR) system (USNRC Bulletin No. 88-08), pressurizer surge lines (USNRC Bulletin No.· 88-11), pressurized water reactor (PWR) feedwater lines (USNRC Information Notice No. 79-13), boiling water reac'tor (BWR) pressure vessels (USNRC Information Notice No. 90..:29), PWR steam generator vessels (USNRC Information Notice No. 90-04).~ and steam generator feedwater distribution piping (USNRC Information Notice No. 91-19 and No. 93-20). These failures may be classified into three categories: thermal fatigue caused by thermal stratlfica~on, cycling, and striping loadings; mechanical fatigue due to vibratory loading; and corrosion fatigue resulting from the exposure to corrosive
· environment. Significmt thermal lo~dings due to stratification were not included in the original design basis ana.lysis. Sollle fatigue sensitive locations are· routinely' monitored in
. nudear power. plants worldwide to better define the transients and assess CUF more accurat~ly. Occurrences of mechanical-vibration- and thermal-fluctuation-induced fatigue failures ill LwR plants in Japan have also been documented.l7
In 1991, the U. S. Nuclear Regulatory Commission (NRC) issued a draft Branch Technical Position (BTP) for fatigue evaluation of nuclear plant components for license renewal. The BTP raised the concern regarding adequacy of the ASME Code in addressing environmental effects on fatigue resistance. of materials for operating PWRS and BWRs, whose primary-Coolantpressure-boundaty componentS are constructed as specified in Section III of the Code. A program :was initiated at Argonrie National I..aboratocy (ANL) to provide data and models for predicting environmental effects on fatigue design curves and an assessment· of the validity of fatigue damage summation in piping and vessel steels under load histories typical of LWR components. The results have been p~esented in several progress reports.IB-25 Based on the S-N data available at that time, interim fatigue design curves that address environmental effects on fatigue life of carbon and low-alloy steels and austenitic stainless steels· (sSs) have been proposed.26 More rigorous statistical models have been developed27.28 based on a larger
NUREG/CR-6583 2
OAGI0000759 00020

data base than that which 'wa§ available when the intertm 'design CUrVeS were developed. Results of the statistical analysis have been used. to interpret 5-N curves in terms of the probability of fatigue cracking. The Pressure Vessel Research Council (PVRC) has also been compiling and evaluating fatigue 5-N data related to the effects of LWR coolant environments on the fatigue life of pressure boundary materials; these results have been summarized by Van Der Slt~ys and Yukawa.29 · · · ·
In 1993, th~ Commission directed the NRC stili to treat fatig~e as potential safety issue within the existing regulatoxy process for operating reactors. 'The staff developed a Fatigue Action Plan (FAP) to resolve three principal issues: (a) adequacy of fatigue resistance of older vintage plants designed to the United States of' America Standard (uSAS) B31.1 Code that did
. not require an explicit fatigue analysis of components, (b) the effect of LWR environments on the fatigue ·resistance of primary pressure boundaxy materials. and (C) the appropriate corrective action required when the Code fatigue allowable limits have been exceeded, i.e., CUF is > 1. The Idaho National Engineering Laboratoxy (INEL) assessed the significance of the
. interim fatigue design curoes by performing fatigue evaluations of a sample of components in the reactor coolant pressure boundacy.30 In all, six locations were evaluated fr~m facilities designed by each of the four U.S. nuclear steam supply system (NSSS) vendors. Selected components fr()m older vintage plants 'designed using the B3 ~.I Code were also included in the evaluation. An assessment of risk to reactor coolant pressure boundaxy components from failure due to fatigue was performed under Generic Safety Issue (GSI) 78, "Monitoring of Fatigue Transient Limits for the Reactor :Coolant System." · On the basis of these studies, it was concluded" that no immediate action is necessaxy to deal with fatigue issues addressed in the FAP. The risk study indicated that a fatigue failure of piping is not a significant contributor to the core-melt frequency. While fatigue cracks may occur, they may not propagate to failure and, even if failure did occur, safety systems, such as emergency core cooling system (ECCS). mitigate the consequences. On the basis of the risk assessment, a backfit to incorporate enVironmental effects in the analysis of fatigue in operating plants could not be justified.
The types and extent of conservatisms present in the ASME Section III fatigue evaluations and the effects of LWR environments on fatigue margins were assessed in a study by the Structural Integrity Associates, Inc., under contract to Sandia National Laboratories for the U.S. Department of Energy and in cooperation with the Electric Power Research Institute (EPRI).31 A review of numerous stress reports indicated a substantial amount of conservatism in many existing component fatigue evaluations. The sources of conservatism include design transients considerably more severe than those experienced in service, grouping of transients, bounding heat transfer and stress analysis, and simplified elastic-plastic analysis. Environmental effects on two components, the BWR feedwater nozzle/safe end and PWR steam generator feedwater nozzle/safe end, ~own.to.be affected by severe thermal transients, were also investigated in the study.· It was conchicled that the reductions in fatigue life due to environmental effects (factors of up to 40 and 22 for PWR and BWR nozzles, respectively) are more than offset by the margins infatigue life (==60 and 9o; respectively; for PWR and BWR nozzles) associated with typical AS.fv1E Code fatigue evaluations.· These imirgins were defmed as· the ratio of CUFs based on the mean experimental 5-N curve and .the Code design fatigue cur\re, i.e., rio allowance -.was made for any 'difference between· the fatigue·· life of laboratory specimens and components due to the effects of mean stress, loading histoxy. or component
• Policy Issue, SECY-95-245, Completion of the Fatigue Action Plan. Sept. 25. 1995.
3 NUREG/CR-6583
OAGI0000759 00021
size and geometry. As discussed earlier, the factors of 2 on stress and 20 on cycles should not be considered' as safety margins but rather conversion factors that are required to obtain reasonable estimates of the lives of actual reactor components.
The overall conservatism in ASME Code fatigue evaluation procedures have also been demonstrated in fatigue tests on piping welds and components.32 In air, the margins on the number of cycles to failure for elbows and tees were 118-2500 and 123-1700, respectively, for carbon steels, and 47-170 and 25-322, respectively, for stainless steels. The margins for girth butt welds were 'significantly lower, e.g., 14-128 arid 6-76, respectively, for carbon steels and stainless steels. In these tests on welds and components, the fatigue life was expressed as the number of cycles ·for the crack to penetrate through the wall, which ranged from 6-18 mm (0.237-0.719 in.) .. The fatigue design curves represent number of cycles to form a 3-inm-deep crack. Consequently, depending on the wall thickness. the actual margins to failure may be lower by more than a factor of 2.
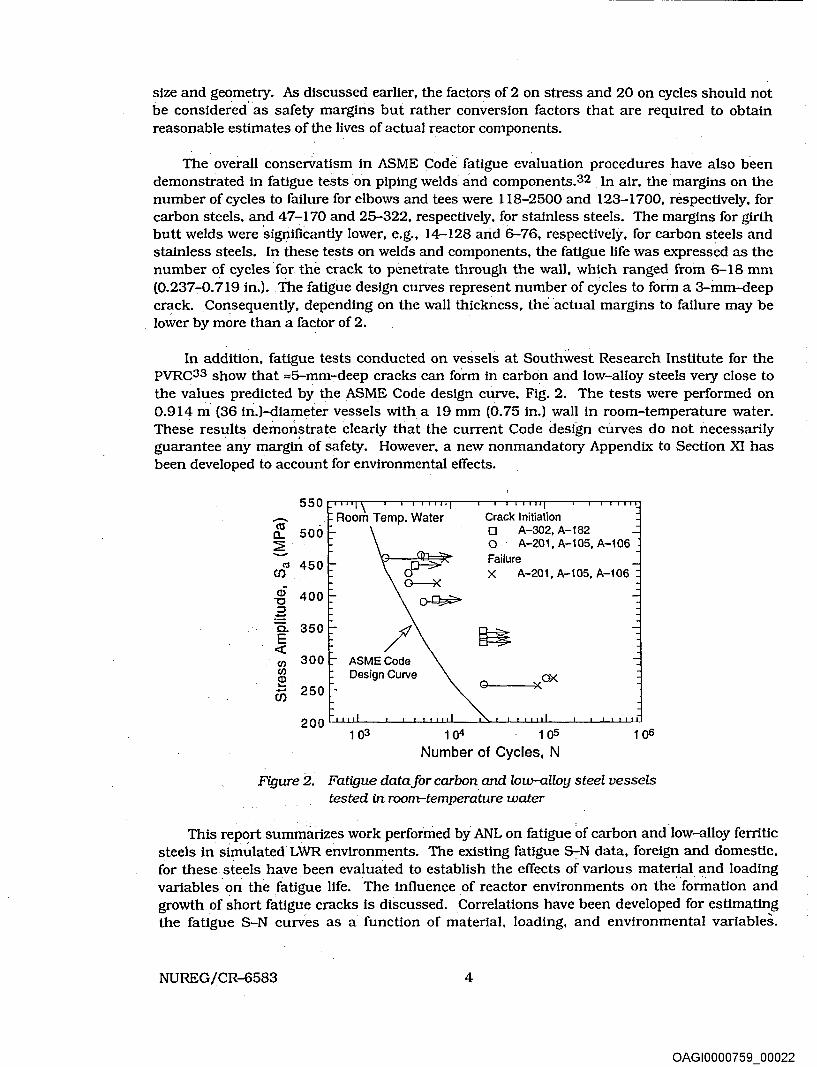
In addition, fatigue tests conducted on vessels at Southwest Research Institute for the PVRC33 show that z5-mm-:-deep cracks can form in carbo_n and low-alloy steels vecy close to the values predicted by the ASME Code design curve, Fig. 2. The tests were performed on 0.914 m (36 in.)-diameter vessels with a 19 mm (0.75 in.) wall in room-temperature water. These results demonstrate clearly that the current Code design curves do not necessarily guarantee any margin of safety. However, a new nonmandatocy Appendix to Section XI has been developed to account for environmental effects.
550 - Room Temp. Water Crack Initiation a3
500 0 A-302, A-182 a.. ::::2: 0 A-201,A-105,A-106 - Failure
Cll 450 (J) X A-201,A-105,A-106
Q) 400 "0
~ a. 350
~ E <( (/) 300 ASMECode CJ) Design Curve
XCJK Q) 0 .... - 250 -(J)
200 103 104 1 as 1 Q6
Number of Cycles, N
Figure 2. Fatigue data for carbon and low-alloy steel vessels tested in room-temperature water
This report summarizes work performed by ANL on fatigue of carbon and.low-alloy ferritic steels in sim~lated LWR environments. The existing fatigue 8-N data, foreign and domestic, for these steels have been evaluated to establish the effects of various material and loading variables· on the fatigue life. The influence of reactor environments on the. formation and growth of ~hort fatigue cracks is discussed. Correlations have been developed for estimating the fatigue 8-N curv'es as a function of material, loading, and environmental variables.
NUREG/CR-6583 4
OAGI0000759 00022

Several methods for incorporating the effects of LWR coolant environments in fatigue design and analysis are presented. "
2 Experimental
Low-cycle fatigue tests have been conducted on Al06-Gr B and A333-Gr 6 carbon steels and A533-Gr B and A302-Gr B low-alloy steels with MTS closed-loop electrohydraulic machines. The A106-Gr B material was obtained from a 508-mm-diameter, schedule 140 pipe fabricated by the Cameron Iron Works of Houston, TX. The A333-Gr 6 material was supplied by the Ishikawajima-Harima Heavy Industries Co: {IHn of Japan and was obtained from a 436-mm-diameter x 36-mm-wall pipe fabrtcated by Sumitomo Metal Industrtes, Ltd. The A533-Gr B material was obtained from the lower head of the Midland reactor vessel. which was scrapped before the plant was completed. The A302-Gr B low-alloy steel had been used in a previous study of the effect of temperature and cyclic frequency on fatigue crack growth behavior in a high-temperature aqueous environment at the Bettis Atomic Power Laboratory.34 The matertal showed increased crack growth rates (CGRs) in simulated PWR water at 243°C. The chemical compositions and heat treatments of the materials are given in Table 1, and the average room-temperature tensileproperties are given in Table 2.
Microstructures of the AlO~r B carbon steel arid A533-Gr B low-alloy steel are shown in Fig. 3. The A106-Gr B carbon steel consists of p~arlite and ferrite, and A533-Gr B lowalloy steel contains tempered bainite plus ferrtte. Figure 4 shows microstructures of the A302-Gr B steel along three orientations, e.g., rolling (R), transverse (T), and radial (T2) directions.* The structure consists primarily of tempered bainite and ferrite. However, the morphology of sulfides in the three orientations is significantly different.
Table 1. Chemical composition (wt.%) offerritic steelsfor fatigue tests
" Material Source
Carbon Steel
Al06-GrBa ANL Supplier
A333-Gr 5b IHI (Ref. 8}
Low-Alloy Steel
A533-Gr Be ANL
C P ·S Sl
0.29 0.013 0.015 0.25
0.29 0.016 0.015 . 0.24 0.21 0.016 0.012 .. 0.31
0.22 0.010 0.012 0.19
Cr Ni
0.19 0.09
0.18 0.51
Mn
0.88
0.93 1.14
1.30
Mo
0.05
0.48
Supplier 0.20 0.014 0.016 0.17 0.19 0.50 1.28 0.47 A302-Gr Bd Bettis (Ref. 34) 0.21 0.021 0.027 0.22 0.14 0.23 1.34 0.51
Supplier · 0.19 0.015 0.027. 0.21 1.17 0.48
a 508-mm O.D. schedule 140 pipe fabricated by Cameron Iron Works, Heat J-7201. Actual heat treatment not known. . · .
b 436-mm 0.0. 36-mm wall pipe fabricated by Sumitomo Metal Industries, Ltd.· Austenltized at 900°C for 1/2 h and air cooled. ·
c 162-mm thick hot-pressed plate from Midland reactor lower head. Austenitized at 871-899°C for 5.5 h and brine quenched; then tempered at 649-663°C for 5.5 h and brine quenched. The plate was
· machined to a fmal thickness of 127 mm .. The Inside surface was inlaid with 4.&-mm weld cladding . and stress relieved at 607°C for 23.8 h. · ..
d 102-mm thick plate. Austenltlzed ·at 899-927°C for 4 h. water quenched to 538°C, and air cooled; tempered at 649-677°C; then stress relieved 621-649°C for 6 h (6 cycles).
-The three orientations are represented by the 1
direction that is perpendicular to the fracture plane. Both transverse and radial directions are perpendicular to the rolling direction but the fracture plane is across the thickness of the plate in transverse orientation, and parallel to the plate surface in radial orientation.
5 NUREG/CR-6583
OAGI0000759 00023

Table 2. Average room-temperature tensile properties of steels
Yield Stress Ultimate Elongation Reduction in Material Referencell (MPa) Stress (MPa) %) Area(%)
QarbQn Steel Al06-GrB ANL 301 572 23.5 44.0
A333-Gr6 IHI (8) 383 549 35.0
Low-Allo:l!: Ste~l A533-GrB ANL 431 602 27.8 66.6
A302-GrB Bettis (34) 389 552 a Reference number given within parentheses.
(a) (b)
FYgure 3. Microstructures of (a) Al 06-Gr B carbon steel and (b) A533-Gr B lo~loy steel
(a) (b) (c)
Figure 4. Microstructure~ along .fracture planes of A302:..0r B steel specimens with orientations in (a) rolling, (b) transverse, and (c) radial direction
NUREG/CR-6583 6
OAGI0000759 _ 00024

'··:·i; . ;!, :
Smooth cylindrical specimens with 9.5-mm diameter and 19-mm gauge length were used for the fatigue tests (Fig. 5). Unless otherwise specified, the gauge section of the specimens was oriented along the axial directions of the carbon steel pipes and along the rolling direction for low-alloy steel plates. The test specimens for A302-Gr B steel were machined from a composite bar fabricated by electron-beam welding two 19.8-mm-diameter. 137-mm-long bars of A533-Gr B steel on each side of an 18.8-mm-dianieter. 56-mm-long section of A302-Gr B steel (Fig. 6). Thus, the gauge length and shoulders of the specimen were A302-Gr B and the grip region was A533-Gr B steel. Mter welding, the composite bar was stress relieved at 650°C for 6 h. Specimens of A302-Gr B steel were also fabricated in the transverse and radial orientations. The gauge length of all specimens was given a 1-J.Lm surface finish in the axial ,direction to prevent circumferential scratches that might act as sites for crack initiation.
~---------11 7/8 -----------~
Figure 5. Configuration of fatigue test specimen {all dimensions in inches)
ELECTRON :....;..:::::::::::=-__;;::-4:;:~f BEAM WELD
;_•;
·SPECIMEN IDENTIFICATION NUMBER (STAMPED)
· ' ALL DIMENSIONS ARE IN mm
Figtire 6. · Schematic diagram of electron-beam-welded bar for machining A302-Gr B fatigue test specimens
7 NUREG/CR-6583
OAGI0000759 00025

Figure 7. Autoclave systemjor fatigue tests in water
Tests in water were conducted in a small. autoclave {shown schematically in Fig. 8) with an annular volume of 12 mL {Fig. 7). The once-through system consists of a 132-L supply tank, PulsafeederTM pump, heat exchanger, preheater, and autoclave. Water is circulated at a rate of ""10 mL/min and· a system pressure of 9 MPa. The autoclave is constructed of Type 316 SS and contains a titanium liner. The supply tank and most of the low-temperature piping are Type 304 SS; titanium tubing is used in the heat exchanger and for connections to the autoclave and electrochemical potential {ECP) cell. An Orbisphere meter and CHEMetricsTM ampules were used to measure the DO concentrations in the supply and effluent water. The redox and open-circuit corrosion potentials were monitored at the autoclave outlet by measuring ECPs of platinum and an electrode of the test material, respectively, agains~ a 0.1 M KCl/AgCl/Ag external (cold} reference electrode. The measured ECPs, E(meas) (mV), were converted to the standard hydrogen electrode (SHE) scale, E(SHEl (mV), by the polynomial expression35 ·
E(SHEl = E(measl + 286.637- 1.0032(Kf) + 1.7447xl0-4(,1T)2- 3.03004xlQ-6(,1'f}3, (2.1)
where .1T(°C) is the temperature difference of the salt bridge in a 0.1 M KCl/ AgCl/ Ag external reference electrode (i.e., the test temperature minus ambient temperature).
The DO level in water was established by bubbling nitrogen that contains l-2o/o oxygen through deionized water in the supply tank. The deionized water was prepared by passing purified water through a set of filters that comprise a carbon filter, an Organex-Q filter, two ion exchangers, and a 0.2-mm capsule filter. Water samples were taken periodically to
NUREG/CR-6583 8
OAGI0000759 00026

2
.. ;., . ; f ." ~
1. Cover-gas supply tank 2. Water supply tank ' 3. Pulsafeeder high-pressure pump 4. Check valve 5. Heat exchanger 6. Preheat exchanger 7. Pipe autoclave 8. Fatigue test specimen 9. MTS hydraulic collet grips
10. MTS load cell 11. Displacement LVDT 12.· MTS hydraulic actuator 13. ECP cell _ 14. Platinum electrode 15. Specimen electrode 16. Reference electrode . 17. Mity MiteTM back-pressure regulator 18. Orbisphere dissolved-<>xygen meter 19. MTS electrohydraulic controls
Figure 8. Schematic diagram of autoclave system for fatigue tests in water environment
measure pH, resistivity, and DO concentration. After the desired concentration of DO was achieved, the nitrogen/oxygen gas mixture in the supply tank was maintained at a 20-kPa overpressure. After an initial transition period during which an oxide film develops on the fatigue specimen, both the DO level and the ECP in the effluent water remained constant during the test. Although the difference in the DO levels between the feedwater and the effluent water was 0.10-0.35 ppm, most of the decrease in DO occurred ac~oss the preheater, i.e., item 6 in Fig. 8. The difference between· the inlet and outlet of the autoclave was -=0.02 ppm. Test conditions were described in terms of the DO in effiuent water.
Simulated PWR water was obtained by dissolving boric acid and lithium hydroxide in 20 L of deionized water before adding the solution to the supply tank. ; .The DO in the deionized water was reduced to < 10 ppb by bubbling nitrogen through the water. A vacuum was drawn on the tank cover gas to speed deoxygenation. · After the DO was reduced to the desired level, a 34-kPa overpressure of hy~rogen was maintained to provide -=2 ppm dissolved hydrogen (or -=23 cc/kg) in the feedwater ..
The tests were conducted with fully reversed axial loading (i.e., strain ratio R = -1) and a triangular or sawtooth waveform. The strain rate for the triangular wave and fast-loading half
9 NUREG/CR-6583
OAGI0000759 00027
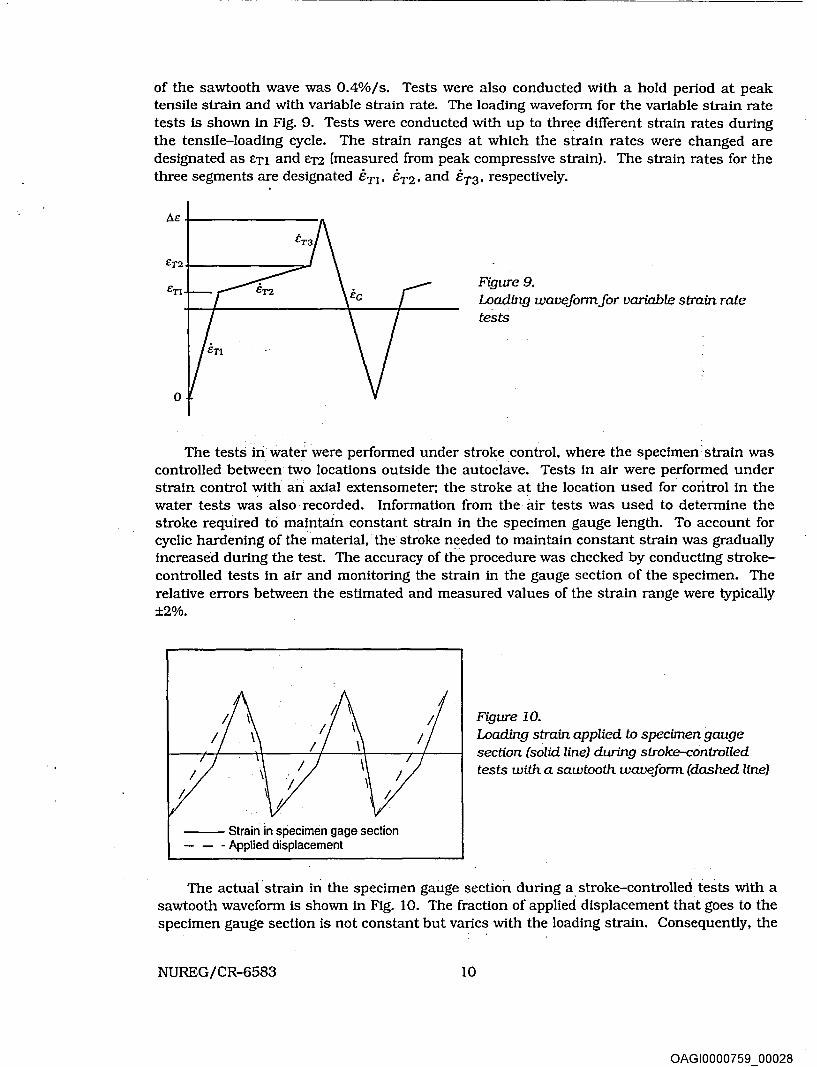
of the sawtooth wave was 0.4%/s. Tests were also conducted with a hold period at peak tensile strain and with variable strain rate. The loading waveform for the variable strain rate tests is shown in Fig. 9. Tests were conducted with up to three different strain rates during the tensile-loading cycle. The strain ranges at which the strain rates were changed are designated as en and ET2 (measured from peak compressive strain). The strain rates for the three segments are designated eTl• er2. and er3. respectively.
Figure 9. Loading waveform for variable strain rate tests
The tests in water were performed under stroke control, where the specimen strain was controlled between two locations outside the autoclave. Tests in air were performed under strain control with an axial extensometer; the stroke at the location used for control in the water tests was also recorded. Information from the air tests was used to determine the stroke required to maintain constant strain in the specimen gauge length. To account for cyclic hardening of the material,· the stroke ne_eded to m8intain constant strain was gradually increased during the test. The accuracy of the procedure was checked by conducting strokecontrolled tests in air and monitoring the strain in the gauge section of the specimen. The relative errors between the estimated and measured values of the strain range were typically ±2%.
--- Strain in specimen gage section - - - Applied displacement
Figure 10. Loading strain applied to specimen gauge section (solid line) during stroke-controlled tests with a sawtooth waveform (dashed line}
The actual, strain in the specimen gauge section during a stroke-controlled tests with a sawtooth waveform is shown in Fig. 10. The fraction of applied displacement that goes to the specimen gauge section is not constant but varies with the loading strain. Consequently, the
NUREG/CR-6583 10
OAGI0000759 00028

loading rate also varies during the fatigue cycle; it is lower than the applied strain rate at strain levels below the elastic limit and higher at larger strains.
The fatigue results obtained for A106-Gr B. A333-Gr 6, A533-Gr B, and A302-Gr B steels are summarized in Appendix A. The fatigue life is defined as the number of cycles N25 for tensile stress to drop 25% from its peak value; this corresponds to an :=:3-mm-deep crack in the test specimen. Fatigue lives defined by other criteria, e.g., a 50% decrease in peak tensile stress or complete failure, may be converted to N25 value according to
N2s = Nx I (0.947 + 0.00212 X), (2.2)
where X is the failure criteria; i.e., 25, 50, or 100% decrease in peak tensile stress. For stroke controlled tests, the reported strain rates represent target values, the actual values are within ±5% of the reported rates. Because the strain rate varies during the loading cycle (Fig. 10}, the reported strain rates for tests in water are a~erage values over the tensile or compressive portion of the cycle. Similarly, the strain rates ·for the testS conducted with a sine waveform are also average values. · ' ·
For the tests in water, the DO levels in feedwater and the effluent,- and the ECPs of platinum and steel electrodes are included in the fatigue data tabulated in Appendix A. The DO levels for the tests were represented by the values in effluent water. The ECPs of platinum and carbon or low-alloy steel measured during the various tests are plotted as a function of DO levels in the effluent in Figs. 11 and ·12, respectively. For both electrodes, the ECP values varied from approximately -700 mV at low Do"" levels (<10 ppb DO} to z200 mV at high DO levels (>200ppb DO); the ECPs of platinum at low- and high-DO levels were ""16 mV higher than those of carbon or low-alloy steel. In the transition region betwee:ri ""10 and 200 ppb DO, the EC~s of platinuin follow the typical sigmoidal curve. For the few tests conducted at 10-200 ppb DO levels, the ECPs of the steel were either_ above 100 mV or below -600 mV. The results from the present study are compared in Fig. 13 with the ECP vs. DO data from other studies.36-40 · · ·
200
w 0 :c ~ -200 > E ~ -400 () w
-600
-800
--- --- -- ... -- ...... l. . .. 0... . . .
···---. ··1·-···s a.
-- --:~-I~ -J ~_o•_®l-
;
-r· ·: : T------ ---- ·--
!:;. 0 0
-1 000 L----'~--'--'--'-~L-----L---'---1.--'-.L...I.-Ju.J.l _ _:..___.__,__;_L.WLWJ
1 oo 1 Q1 : l.. • 1 Q2 1 Q3
Dissolved Oxygen {ppb)
. Figure 11. ECP of platinum during fatigue tes~s at 288°C as a function of _ dissolved oxygen in e.ffluent
11 NUREG/CR-6583
OAGI0000759 00029

-w :::c en >~
E -a.. () w
200
iiJ 0 J: w_ -200 g a.. -400
frl -600
-800
......... ······ ... ""l" -~0 0
.. ···_··: -~----~: .. : .... -!-:·: _______ _ 1 .. ~ .. . . ........ - .. . . 1 .
~ ................... -· -l- --··· - • -.
<> i ~ o 6 g f! <>
....... A .................. --~- ..
-1ooo~~~~~~~~~~~~~~~~~~
1~ 1~ 1~ 1~ Dissolved Oxygen (ppb)
. . . . .
Figure 12. ECP of carbon and [ow-alloyferritic steels during fatigue tests at 288°C as a function of dissolved oxygen in e.ffluent
400
200
0
-200
-400
-600
-800
·i f 7i .. ! i 0 l . ~ El3 ·············!· ~~~tl"ffi ... :o ~<o. '-'f ~ ·----·
-:~~~-~-l~~~~~:~ 1:" ~--~:---...... 8. s.g~tf.~ ~ ... -- . ... . .. ~ ....... . ~B8~ [ 0 . i i
······· ..... ., .. L ....... ·-···-r··· ······-···· . -- ·r -1000~~~~~~--~~~~~--~~~~
1~ 1~ 1~ 1~
Dissolved Oxygen (ppb)
Present Study D A302-B
0 A533-B ~ A106-B
Other Studies El3 A533-8
(Katada et al)
- · - · - A333-6 (lndig)
0 A508-2 (Auten & Monter)
+ A508-2 (McDonald et al)
\1 (Cited in Ref. 40)
Figure 13. ECP vs. dissolved-oxygen data for carbon and low-alloy steels at 25D-290°C
3 Mechanism of Fatigue Crack Initiation
3.1 Formation of Engineering Crack
Deformation and microstructural changes in the surface grains are responsible for fatigue cracking. During cyclic· straining, the irreversibility of dislocation glide leads to the development of surface roughness. Strain localization in persistent slip bands (PSBs) results in the formation of extrusions and intrusions. With continued cycling, microcracks ultimately form in PSBs or at the edges of slip-band extrusions. At high strain amplitudes, microcracks
NUREG/CR-6583 12
OAGI0000759 00030

form in notches that develop at grain, twin, or phase boundaries (e.g., ferrite/pearlite) or by cracking of second-phase particles (e.g., sulfide or oxide inclusions).
Once a microcrack forms, it continues to grow along its slip plane or a PSB as a Mode II (shear) crack in Stage I growth (orientation of the crack is usually at 45° to the stress axis). At low strain amplitudes, a Stage I crack may extend across several grain diameters before the increasing stress intensity of the crack promotes slip on systems other than the primary slip. A dislocation cell structure normally forms at the crack tip. Because slip is no longer confined to planes at 45° to the stress axis, the crack begins to propagate as a Mode' I (tensile) crack, normal to the stress axis in Stage II growth. At high strain amplitudes, the stress intensity is quite large and the crack propagates entirely by the Stage II process. Stage II crack propagation continues until the crack reaches an engineering size (==3 mm deep). The two stages of fatigue crack growth in smooth specimens are shown in Fig. 14~
In air or mildly corrosive environments, Stage II cracking is characterized by fatigue striations. The process of Stage II fatigue crack growth and formation offatigue striations41 is illustrated in Fig. 15. As tensile load is applied, slip bands form at the double notch or "ears" of the crack tip (Fig. 15b). The slip bands widen with further straining, causing blunting of the crack tip (Fig. 15c) .. Crack surfaces close during compressive loading and slip is reversed, producing ears at the edges of the blunt crack tip (Figs. ISd and ISe). The ears are observed as fatigue striations on the fracture surface. However, there is not necessarily a 1: 1 correlation between striation spacing and fatigue cycles. At high· strain amplitudes, several striations may be created during one cycle, whereas.at low strain amplitudes one striation may represent several cycles. ·
Intense Shear Band
Stage II Crack
~ . : - - '
Figure 14. Two stages of fatigue crack growth in smooth test specimens
13 NUREG/CR-6583
OAGI0000759 00031

I!;
(a) (d)
(b) (e)
(c) (0
Figure 15. Schematic illustration of plaStic blunting process of fatigue crack growth in Stage II: (a) zero load; (b) small tensile load; (c) maximwn tensile load. widening of slip bands; (d) crack closure, and formation of "ears" at crack tip; (e) maximum compressive load; (f) small tensile load in next cycle
The formation of surface cracks and their growth as shear and tensile cracks (Stage I and II growth) to an .. engineering" size (e.g., a 3-mm-deep crack) constitute the fatigue life of a material, which is represented by the fatigue S-N curves. The curves specify, for a given stress or strain amplitude, the number of cycles needed to form an engineering crack. Fatigue life has conventionally been represented by two stages: (a) initiation, which represents the cycles N1 for formation of microcracks on the surface; and (b) propagation, which represents cycles Np for propagation of the surface cracks to an engineering size. Thus, fatigue life N is the sum of the two stages, N = N1 + Np. The increase in length of cracks greater than "engineering" size is usually described in terms of fracture mechanics models rather than in terms of 5-N behavior. N1 is considered to be sensitive to the stress or strain amplitude, e.g., at low strain amplitudes, most of the life may be spent in initiating a crack whereas, at high strain amplitudes, cracks initiate easily.
An alternative approach considers fatigue life of engineering structures and components to be entirely composed of the growth of short fatigue cracks, i.e., cracks less than "engineering " size. 42.43 For polycrystalline materials, the period for the formation of surface cracks is negligible (Fig. 16). Fatigue damage in a material is the current size of the fatigue crack, and damage accumulation is the rate of crack growfu.43 However, the growth rates of short cracks can not be predicted accurately from fracture mechanics methodology on the basis of range of stress intensity factor (6K). Under cyclic loading and the same .6K, short fatigue cracks (i.e., having lengths comparable to the unit size of the microstructure) grow at a
NU:REG/CR-6583 14
OAGI0000759 00032

faster rate than long fatigue cracks.44 Also, short cracks can grow at .6.K values below those predicted from linear elastic fracture mechanics (LEFM). The differences between the growth rates of short and long cracks have been attributed to interactions with mi~rostructural features, contributions of crack closure with increasing crack length, effects of mixed mode crack propagation, and an inadequate characterization of the crack tip stress/strain fields associated with short cracks.
0
Mechanically Small Crack (Stage II Tensile Crack)
.'7 --8-----------------~-;;1·
Microstructurally Small Crack (MSC) (Stage I Shear Crack)
0.2 0.4 0 6 Life Fraction
0 8
Figure 16. Growth of cracks in smooth fatigue specimens
Recent studies indicate that during fatigue loading of smooth test specimens, surface cracks 10 J.lm or longer form quite early in life. i.e., <10% of life even at low strain amplitudes (Fig. 17). 45-47 These cracks form at surface irreguhi.rities/discontinuities either already in existence or produced by slip bands, grain boundaries, second-phase particles, etc. Growth of these surface cracks may be divided into three regimes: (a) initial period that involves growth of microstructurally small cracks (MSCs) below a critical length, characterized by decelerating crack growth rate, seen in region AB_ of Fig. 16; (b) final period of growth, characterized by accelerating crack growth rate, region CD; and (c) a transition period controlled, by a combination of the two regimes, region BC. The crack growth rates as a function of crack length during the three regimes of fatigue life are shown in Fig. 18.
-1~ .c: . E. Q)
Cl ... .::.:. 0 0 ...
~ u
....
Room Temp. Air <><>
~ ~~ · ~<6~xv
eo~w~x t.. 6QJ o xx
~o08~ o~ vx x . _ . o · Carbon Steel
(Tokaji et al, 1988) 0 310 MPa
270 MPa 240 MPa
1020 Steel ·(Suh eta!, 1985)
0 294 MPa V' 274 MPa X·. 265 MPa ·
A533-Gr 8 Low-Alloy Steel + . r Room :remp Air . ,. . . <> ~d
. . & ~~Cb! 0
=- . . . . . . ~~ 6.<>\-b V' + · rgw0..ft~ .;_ + · x Strain Range(%) ~ + Dowling Gavenda et al
~ ++ x (19n) (1997) X 0 4.0 + 0.8
<> 2.0 X 0.4 {j, 1 2 ·o 0.9 V' 0.5
• I t
0.0 0.2 0.4 0.6 0.8. .•. 1 0 0.0 .0.2 0.4 0.6 0.8 Fraction of_ Fatigue Life, N/N1
1.0
... Fraction of Fatigue Life, N/N1
Figure 17. Crack depth plotted as a function of fractionallifefor carbon and low-alloy steels tested in room-temperature air
15 .NUREG/CR-6583
OAGI0000759 00033

I
~-~-i· -. • .,MSC j
' \ ' ' ' ;
I
. • I LEFM
_..J.._L--L..J_~j I I I I I I
Crack Length
IJ...
Figure 18. Schematic illustration of short crack behavior
Figure 19. Photomicrograph of surface crack along longitudinal section of A106-Gr B steel tested in air
The growth of MSCs is very sensitive to microstructure.47-53 The MSCs correspond to Stage I cracks and grow along slip planes as shear cracks in the early stage of growth. For MSCs, microstructural effects are strong because of Stage I growth, i.e., crystallographic growth. The growth rates are markedly decreased by grain boundaries, triple points, and phase boundaries. In ferritic-pearlitic steels, fatigue cracks initiate and propagate preferentially in the ferrite phase that forms as long allotriomorphs at prior austenite phase boundaries.47,52,53 An example of surface cracking in an A106-Gr B specimen tested in air is shown in Fig. 19. The ferrite/pearlite phase boundaries act as strong barriers to crack propagation, and growth rates decrease significantly when small cracks grow into the pearlite from the ferrite.47 Limited data suggest that microstructural effects are more pronounced at negative stress ratios; the compressive component of the applied load plays an important role in the formation· of Stage I facets and as a driving force· during the formation of cracks. 50
NUREG/CR-6583 16
OAGI0000759 00034

. Fatigue cracks greater than the critical length of MSCs show little or no influence of microstructure and are termed mechanically small cracks.49,50 For a stress ratio of -1, the transition from MSC to a mechanically small crack for several materials has been estimated to be =8 times the unit size ·of the rilicrostructure. 50 MechanicallY small cracks correspond to Stage II, or tensile, cracks characterized by striated crack growth, with· a fracture surface normal to the maximum principal stress. Their groWth rates tend to decrease as the cracks grow because crack closure becomes more significant for larger cracks. For ferritlc-pearlitlc steels, Stage II crack propagation occurs when stress intensity ·and mode; of growth attain a critical level and break through the pearlite and join other fenite cracks.52
At low stress levels, e.g., flcr1 in Figs. 16 and IS. the transition from MSC growth to accelerating crack growth does not occur and the cracks are nonpropagating. This circumstance represents the fatigue limit for the smooth specimen. Although cracks can form below the fatigue limit, they can grow to engineering size only at stresses greater than the fatigue limit. Note that possible preexisting large cracks in the material. e.g .• defects in welded samples, or those created by growth of microcracks at high stresses, can grow at stress levels below the fatigue limit, and their growth can be estimated from flK-based LEFM.
3.2 Environmental Effects
The available fatigue 8-N data indicate a significant decrease in fatigue life of CSs and LASs in LWR environments when five conditions are satisfied simultaneously, viz., the applied strain range, temperature, DO in water, and sulfur content in steel are above a minimum threshold level. and· strain rate is below a critical value. Although the strUcture and cyclic hardening behavior of carbon and low-alloy steels are distinctly different. there is little or no difference in susceptibility to enVironmental degradation of fatigue life of these steels. Reduction in life in LWR coolant environments may arise from easy formation of surface microcracks and/or an increase in growth rates ofcracks, during either the initial stage of :Msc and shear crack growth or the transition and final stage of tensile crack growth. Carbon and low:...anoy steel specimens tested in water show surface micropitting and cavities that form either by corrosion of the material in oxygenated water or by selective dissolution of MnS or other iii elusions. These micropits can act as sites for the formation of fatigue cracks.
Photomicrographs of the gauge surfaces20 of Al06-Gr B CS and A533-Gr B LAS specimens tested at288°C in air, simulated PWR, and high-DO water (=0.7 ppm DO) are shown in Fig. 20. The specimens tested in air show slight discoloration, while those tested in water develop a gray /black corrosion scale and are covered with magnetite (Fe304} at all DO levels and hematite (a-Fe20s) forms at DO levels >200 ppb.l0,20,36 The amount of hematite increases with increasing DO levels in watei36 (Fig. 21)~ The pitting behavior of CSs54 and LASs39 in high-purity water at different temperatures and DO levels is shown in Fig. 22. The results indicate thatpittirig corrosion does not occur in these steels at all temperatures in lowDO PWR environments (typically <0.01 ppm DO), and at temperatures >200°C in water that contains 0.1-0.2 ppm DO, which-represents normal BWR water chemistry. However, even under these conditions, micropits form in both carbon and low-alloy steels due to dissolution of MnS · inclusions6 or by anodic reaction in the S contaminated matrtx55 close to sulfide inclusions. However, mlcropits formed by these p~ocesses stop growing when either the MnS i~clusion dissolves completely or falls off. Typical examples of micropits on A106-Gr B and A533-Gr B steel specimens are shown in Fig. 23.
17 NUREG/CRJ.,'6583·'
OAGI0000759 00035

The reduction in fatigue life in high-temperature water has been attributed to the presence of micropits6 that act as stress raisers and provide preferred sites for the formation of fatigue cracks. The strain rate effects in water, i.e., fatigue life decreases with decreasing strain rate, have been explained on the basis of higher density of micropits at lower strain x:ates (Fig. 24). It has been argued that the longer test durations for slow strain rate tests result in higher density of micropits and hence shorter periods for formation of surface
Al06-Gr B Carbon Steel A533-Gr B Low~Alloy Steel
Air
Water with ==0.8 ppm Dissolved Oxygen
Figure 20. SEM photomicrographs of gauge surface of Al06-Gr B andA533-Gr B steels tested in different environments at 288°C
NUREG/C,R-6583 18
OAGI0000759 _ 00036

8 -
':'
....... ,.
s 6
(I) .... ::J
~ .... (I) 0.. E (I)
1-
350
300
200
150
0
0 0
1 o, 1 o2 1 o3 Dissolved Oxygen (ppb)
A 0 0
A 0 0
0 0 0
------·--------· A X X
Domain of A X X Pitting
Corrosion
6 6 X X o~~~~~~=-~~~~~~~~~
1~ 1~ 1~ 1~ 1~ 1~1~
Dissolved Oxygen (ppm)
(a)
Figure21. X-ray d
i 300
~ .. ~ 200 a. 0 .2:·u; c: 100 Q)
0
;g ~ tiT" <l a) ~ 1.0 ra a: c: -~
U5 _£g 0 t-
A£t (%)
o• 2 2 • 1 0
II 1 5 ~ ... 1 0 o• o a
1 o·3 1 o·2 1 o-1 Strain Rate (%/s)
T f nllTTf--r-rn'IO'f-, .. r-nn"( - f ,"'TTn"J T 'lTim( T T n1111
A106-Gr B Steel Strain Rates (o/ols) 2Baoc Water S: o 004 & F: 0.4
0.5--0.8 ppm DO Air ~ :
'' , • / Preoxidized ~ ~ F/Fin air
'V F/F in <10 ppb D X SIF in <10 ppb D
--- ... _- ..
0.1~~uw~~~~~~~~~~~~~w=
Figure24. Relationship between density of micropits and strain rate
TliTU":'~ lTlllfllJ
A533-Gr B Steel 2BB°CWater
r r 1tnr'l
o S-{).8 ppm po Air
',, __ / ',
I ' T "TnJ --r-TTn rTTJ I T TTTlll
Strain Rates ("'ois) S: 0 004 & F: 0 4 o F/F <> SIF Preoxidized ~ F/F in air II FIF in <10 ppb D
1~ 1~ 1~ 1~ 1~ 1~ 1~1~ 103 104 105
Fatigue Life, N25 Fatigue Life, N25
Figure 25. Environmental effects on formation of fatigue cracks in carbon and low-alloy steels. Preoxidized specimens were exposed at 288°C for 3D-1 00 h in water with 06-0.8 ppm dissolved oxygen.
microcracks. 6 If the presence of micropits was responsible for reduction in fatigue lives of carbon and low-alloy steels in LWR environments, then specimens preexposed to high-DO water and then tested in air should also show a decrease in fatigue life.
The fatigue lives of A106-Gr B CS and A533-Gr B LAS specimens preexposed at 288°C for 30-100 h in water with 0.6-0.8 ppm DO and then tested in air or low-DO water (<0.01 ppm DO), are shown in Fig. 25.11-14,21 Fatigue lives of the preoxidized specimens are identical to those of unoxidized specimens; life would be expected to decrease if surface micropits facilitate the formation of fatigue cracks. Only a moderate decrease in life is observed for both preoxidized and unoxidized specimens tested in low-DO water. Furthermore, if micropits were responsible for the decrease in fatigue life in LWR environments, then fatigue limit of these steels should be lower in water than in air. Fatigue data in high-DO waterll-14,21 indicate that the fatigue limit in water is either the same or ::::20% higher than in air (Fig. 25).
NUREG/CR-6583 20
OAGI0000759 00038

120
100
(/) 80 .:.!
u e u 60 0 ..... 40 <ll .0 E 20 ::l z
0
-20
A106 Gr-s carbon' steer ! ! ! 0 Air ·i, .; ... ; .. ; .... ; ... --- --~ PWR . l l ! !
A533 Gr-B Lciw-Aiioy Steei i i ~ ~~R . . - ·t·:· t-- t-4~ t-- .. ..
<> >0 6 wm DO .. .i ... L-~-L- i · l .................. . Open Symbols: fasVfast te'st l l l l Closed Symbols: slow/fast or l l l l
fasVslow tesl [ [ · [ l <> >0 6 ppm DO l .... L .. L .. l· .L ....................... .
Open Symbols: fasVIast t~st l l '1 l Closed Symbols: slow/fast or l l -l l
fasVslow testr 1' f' 'j
-~~~llH!f~:~~ ~ ~ ~ ~ ~ ·j ~ i
=:: 1··~-=::::·-0 2 0.4 0.6 0.8 1 0 2.0 0.2 0.4 0.6 0.8 1.0 2.0
Strain Range (%) Strain Range (%)
Figure 26. Number of cracks along longitudinal section of fatigue specimens tested in d!(ferent environments ·
Figure 27. Nucleation of cracks along slip bands, carbide particles, and feni.te/pearlite phase boundaries of carbon steel fatigue specimen
Figure 26 shows plots of the number of cracks, greater than 10 IJ.m, along longitudinal sections of the gauge length of AI06-Gr Band A533-Gr B specimens as a function of strain range in air, simulated PWR, and high-DO water at two different strain rates.21 In all cases, the number of cracks represents the average value along a 7 mm ·gauge length. The results show that with the exception of the LAS tested in simulated PWR water,· environment has no effect on the frequency (number per unit gauge length) of cracks. . For similar loading conditions, the number of cracks in the specimens tested in air and high-DO water are identical, although fatigue life is lower by a fact()r of =8 in water. If the reduction in life is caused by enhanced crack nucleation, the specimens tested in high-DO water should show more cracks. Detailed metallographic evaluations of the fatigue test specimens21 also indicate that water environment has little or no effect on the formation of surface microcracks. Irrespective of environment, cracks in carbon and low-alloy steels nucleate along slip bands, carbide particles, or at the ferrite/pearlite phase boundaries (Fig. 27).2L45
The environmental enhancement of fatigue crack-growth in pressure vessel steels in hightemperature oxygenated water and the effects of sulfur content, loading rate, and flow velocities are well known. 34,56-72 The enhanced growth rates in LWR environments have been
21 NUREG/CR-6583
OAGI0000759 00039

attributed to either slip oxidation/dissolution73-76 or hydrogen-induced cracking77-79 mechanisms. A critical concentration of sulfide (S2-) or hydrosulfide (HS-) ions, which are produced by the· dissolution of sulfide inclusions in the steel, is required at the crack tip for environmental effects to occur. The crack tip is supplied with sz- and HS- ions as the advancing crack intersects the sulfide inclusions, and the inclusions dissolve in the hightemperature water environment. Sulfide ions are removed from the crack tip by one or more of the following processes: (a) diffusion due to concentration gradient, (b) ion transport due to ECP gradient, (c) pumping action due to cyclic loading on the crack, and (d) fluid flow induced within the crack due to the flow of coolant outside the crack. The morphology, size, and distribution of sulfide inclusions and the probability of advancing crack to intercept sulfide inclusions are important parameters affecting growth rates of CSs and LASs in LWR environments.57,60,67-70 The main electrochemical and chemical reactions in the crack cavity are given below.
Dissolution of sulfide:
(3.1)
Anodic reactions:
(3.2)
(3.3)
Hydrolysis reactions:
(3.4)
(3.5)
(3.6)
Cathodic reactions:
(3.7)
(3.8)
(3.9)
(3.10)
(3.11)
Reactions 3.10 and 3.11 occur in high-DO water.
NUREG/CR-6583 22
OAGI0000759 00040
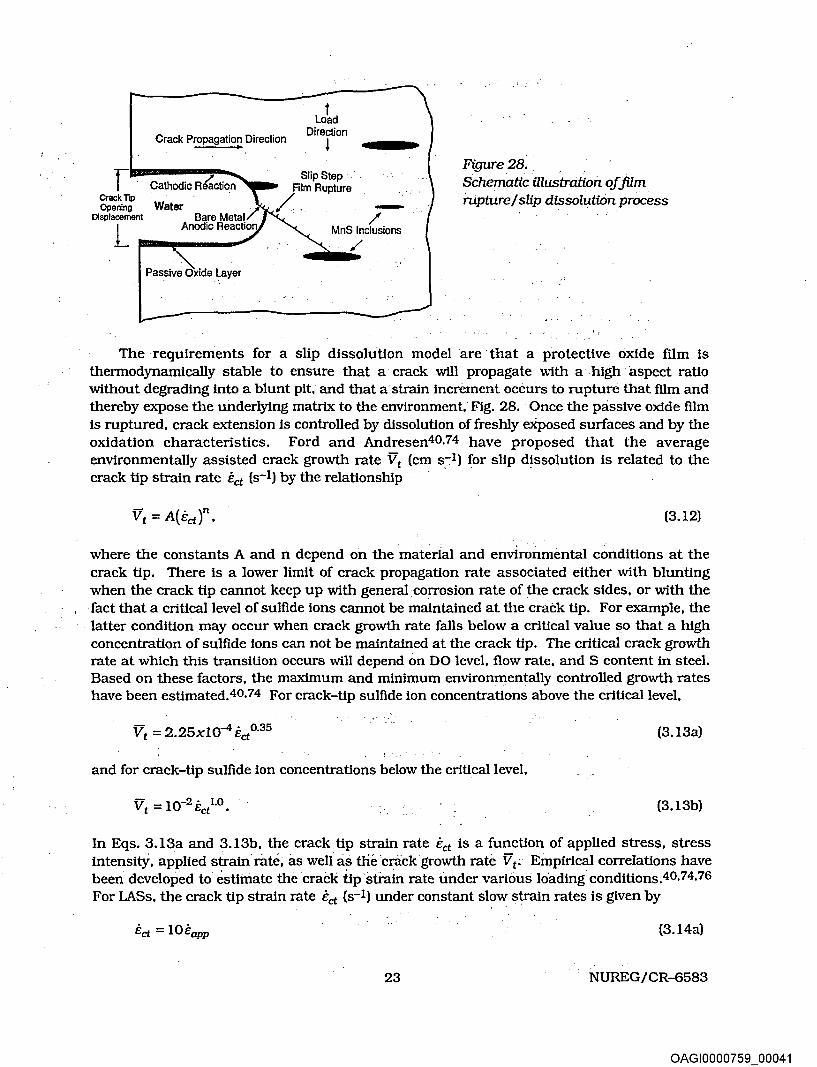
1 Load
Crack Propagation Direction Direction
l
r . Cathodic Rfaction Slip Step· .
Crack TIP Opening
Displacement
Rim Rupture
/. -/ l MnS Inclusions
/
Passive Oxide layer
Figure_28 •. Schematic illustration of .film
. rupture/slip dissolutiOn process
The requirements for a slip dissolution model are that a protective oxide film is thermodynamically stable to ensure that a crack will propagate with a· high aspect ratio without degrading into a blunt pit, and that a strain increment occurs to rupture that film and thereby expose the underlying matrix to the environment; Fig. 28. Once the passive oxide film is ruptured, crack extension is controlled by dissolution of freshly eXposed surfaces and by the oxidation characteristics. Ford and Andresen40,74 have proposed that the average environmentally assisted crack growth rate Vt (em s-1) for slip dissolution is related to the crack tip strain rate Ect (s-1) by the relationship . .
(3.12)
where the constants A and n depend on the material and environmental conditions at the crack tip. There is a lower limit of crack propagation rate associated either with blunting when the crack tip cannot keep up with general corrosion rate of the crack sides, or with the ·fact that a critical level of sulfide ions cannot be maintained at the crack tip. For example, the latter condition may occur when crack growth rate falls below a critical value so that a high concentration of sulfide ions can not be maintained at the crack tip. The critical crack growth rate at which this transition occurs will depend on DO level, flow rate, and S content in steel. Based on these factors, the maximum and minimum enviromnentally controlled growth rates have been estimated.40,74 For crack-tip sulfide ion concentrations above the critical level,
(3.13a)
and for crack-tip sulfide ion concentrations below the critical level,
V- _ 10-2 ;, 1.o t - "ct • (3.13b)
In Eqs. 3.13a and 3.13b, the crack tip strain rate Ect is a function of applied stress, stress intensitY, applied strain riite, as well as the crack growth rate Vt; Empirical correlations have been developed to estimate the crack tlpstrain rate under various loading'conditions.40,74,76 For LASs, the crack tip strain rate Ect (s-1) under constant slow strain rates is given by
(3.14a)
23 NUREG/CR-6583
OAGI0000759 00041

and under cyclic loading (for stress ratio R <0.42) by
(3.14b)
where AK is the stress intensity range (MPavm) and vis the frequency of cyclic loading (s-1). For cyclic loads, the crack tip strain rate estimated from Eq. 3.14b is typically 10-100 times the growth rate in an inert environment. 40,73 The latter has been expressed in terms of R ratio and AKin Eq. 3.14b; it can also be obtained from experimental data.
It is assumed that there is no environmental enhancement of crack propagation during the compressive load cycle, because during that period the water does not have access to the crack tip. The total crack advance per cycle Aatotal is given by the summation of crack advance in air Aaatr due to mechanical factors, and crack advance from a slip-dissolution mechanism 11aro once the tensile strain increment exceeds the fracture strain of the oxide E 1 . If the fatigue life is considered to represent the number of cycles required to form a 0.3 em crack, the crack advance per loading cycle in air is given by 0.3/N,,r. Thus, assuming that environmental conditions are such as to maintain a high sulfide ion concentrations at the crack tip (Eq. 3.13a) and that for short cracks, the crack-tip strain rate Ect is the same as the applied strain rate Eapp {s-1), the environmental increment in crack growth is given by integrating Eq. 3.13a
a t 0~5 r r -4( . ) Aar = J da = f . 2.25x10 Eapp dt
0 e1 je (3.15)
or
-4(. )o.as( 11e e 1 ) 11ar = 2.25x10 Eapp -.---.-.- , Eapp Eapp
(3.16)
where the relevant time for integration is the rise time tr (s) minus the time taken for the strain increment· to exceed· the fracture strain of the' oxide ( E 1 / i:app), and Ae is the applied strain range. Similarly, increment in crack growth when the concentration of sulfide ions at the crack tip is low, can be obtained by integrating Eq. 3.13b
(3.17)
Crack growth under low crack-tip sulfide ion concentration is independent of Eapp·
In the case of a high sulfide ion concentration, from Eq. 3.16, the total crack advance per cycle 11atotal (em) is given by
0.3 5 -4( )(. )-Q.65 Aatotal = 11aair + 11ar = --+ 2.2 xlO Ae- E 1 Eapp • Nair
(3.18}
The fatigue life in water Nwater is given by the initiation crack depth (0.3 em) divided by the total crack advance per cycle Aatotal Hence, Ford et al. estimate the fatigue life in water as
ll[ 0.3 . 5 -4( )(. )-065] Nwater = 0.7 Nair +2.2 xiO AE- e1 Eapp • (3.19)
NUREG/CR-6583 24
OAGI0000759 00042

~~ ~---~------------------------------------
r CrackTrp Opening
Displacement
L~~~
Figure29._ Schematic illustration of hydrogenindr.U:ed cracking of low-alloy steels
The fatigue lives estimated from Eq. 3.19 show fair agreement 'with those observed experimentally for high-sulfur steels tested in high-DO water.74,75,80
- ·, - - -_, . ' .. ·
Hydrogen.:_iriduced cracking of LASs is explained as follows (Fig. 29): hydrogen produced ~ by the oxidation' reaction at or near the crack tip is partly absorbed into the metal; the absorbed hyd~ogen -diffuses ahead of the crack tip and interacts with MnS inclusions and leads to the formation of cleavage cracks at the incl~sion matrix interface; and linkage of the
. cleavage cracks results in discontinuous crack. extension in addition to eXtension caused by -mechanical fatigue~ For hydrogen-induced cracking, the average environmentally assisted growth rate vt (em' s-1) may be expressed as -. ' ..
(3.20)
where X is the distance from the crack tip to the reglon of cleavage cracks and tc is the time for the concentr~tlon of absorbed hydrogen to reach .a critical level to cause cleavage cracks.
Other hydrogen-induced fracture processes ~ayalso enhance crack growth rates in LWR environments. According to the decohesion mechanism, significant accumulation of hydrogen at or near the crack tip' decreases th~- cob~sive interatomic strength of the lattice.Bl Hydrogen-induced bond rupture ahead of the crack tip link up with the main crack resulting in discontinuous but enhanced crack growth. The hydrogen adsorption mechanism states that ad~orbed hydrogen lowers the ~urface energy or' the metal,~ thus facilitating crack growth at a lower fracture stress level. ·Also, hydrogen~ can ·cause loccliized crack tip plasticity by reducing the stress required for dislocationmotlo~.B2 .. · · _
Both slip-oxidation/dissolution ·and hydrogen-induced cracking mechanisms are dependent on oxide rupture rates, passivation rates, and liquid diffusion rates. Therefore, it is .often difficult to differentiate between the two ·mechanism or:to establish their relative contribution to crack g~owth ~ates in L\vR enVirorim~nts. Dissolution ofMnS inclusions changes the water chemist:Iy near the crack \ip: making _it more aggressive. This results in enhanced crack growth rates because either (a} the dissolved ~sulfides decrease the repassivation rate, which increases the amount of metal dissolution for a given oxide rupture rate;72 or (b) the dissolved sulfide poisons the recombination of H atoms liberated by
25 NUREG/CR-6583
OAGI0000759 00043

corrosion, which enhances H uptake by the steel at the crack tip.83 A change in fracture appearance from ductile striations in air to brittle facets or cleavage-like fracture in LWR environments lend the·greatest support for hydrogen-induced cracking.67,70,78,79
In crack growth studies in long cracks, brittle fracture is generally associated with MnS inclusions and spreads like a fan from these inclusions, 78,79 which is reminiscent of the quasi-cleavage facets produced in hydrogen-charged specimens. . In LWR environments. fracture surface often ~as a terraced appearance produced by linkage of main. crack with the hydrogen-induced cracks ahead of the crack tip at inclusion matrix interface. However, such fracture morphologies are not observed for short cracks produced in cylindrical fatigue test specimens used for obtaining fatigue 5-N data. Fracture morphologies of A106-Gr B CS and A533-Gr B lAS specimens tested at 288°C in high-DO water and simulated PWR environment are shown in Figs. 30-33. High-magnification photomicrographs of select regions of the specimens before and after they were descaled (with an electroyte of 2 g hexamethylene tetramine in 1000 cm3 of 1 N HCl} are also shown in the figures. The specimens tested in water show the following salient features.
(a} All specimen exhibit a ductile fatigue fracture; quasi-cleavage facets or fan-like features extending from MnS inclusions are not observed. Examples of cleavage fracture in Al06-Gr B CS fatigue specimen pulled apart at room temperature after the fatigue test at 288°C in water, are shown in Fig. 34. Note that in CSs, cleavage fracture occurs entirely along
. the ferrite matrix, with ductile tearing of the pearlite regions. In LWR envir~nments. although some regions of the fracture surface resemble a fan-like fract:ure morphology before chen:tical cleaning (e.g., Fig. 30), examination of the specimens after chemical cleaning indicates that cracks propagate across phase boundaries through both ferrite and pearlite regions.
(b) A terraced morphology which is generally produced by linkage of hydrogen-induced cracks at the sulfide/matrix interface ahead of the main crack, was not observed in any of the specimens. The number of sulfide inclusions obseryed on the fracture surface of specimens tested in water is similar to that observed for tests in air. Also, as seen in Fig. 35, the sulfide inch.isions that' are observed on the surface do not appear to change the fracture morphology. As discussed later in Section 4.2.5, the. existing fatigue 5-N data indicate that in high-DO water (>0.05 ppm DO). environmental effects on fatigue life of carbon steet~ ·seem to be independent of sulfur content in the range of 0.002-0.015 wt.%.
•f ••
. (c) Faint fatigue striations are obserVed for crack depths greater than ==0.8 mm. Further examination of the specimens after chemical cleaning suggests that these striations are most likely produced by rupture of the surface oxide film rather than the formation of double notches or Mears" at the crack tip. Also, note that in CS specimens, the· striations extend across both ferrite and pearlite regions.
Studies on uie formation arid growth characteristics of short cracks in carbon and lowalloy steels in LWR environments indicate that environmentally assisted reduction in fatigue life of these steels is caused prlmarily by slip dissolution/oxidation mechanism and is discussed later in this section ..
NUREG/CR-6583 26
OAGI0000759 00044

Region A ·Region B
Before Chemical Cleaning Before Chemical ci~aning
After Chemical Cleaning After Chemical Cleaning
Figure 30. ·Fracture morphology of Al 06-Gr B carbon ~teel tested iri high-dissolved oxygen water at 288°C and ::::0.4% strain range ·
.,
27 NUREG/CR-6583
OAGI0000759 00045

. Region A Region B
Befo.re Chemical Cleaning Before Chemical Cleaning
After Chemical Cleaning After Chemical Cleaning
Figure 31. Fracture morphology of Al 06-Gr B carbon steel tested in simulated PWR water at 288°C and ,0. 75% strain range .
NUREG/CR-6583 28
OAGI0000759 _ 00046
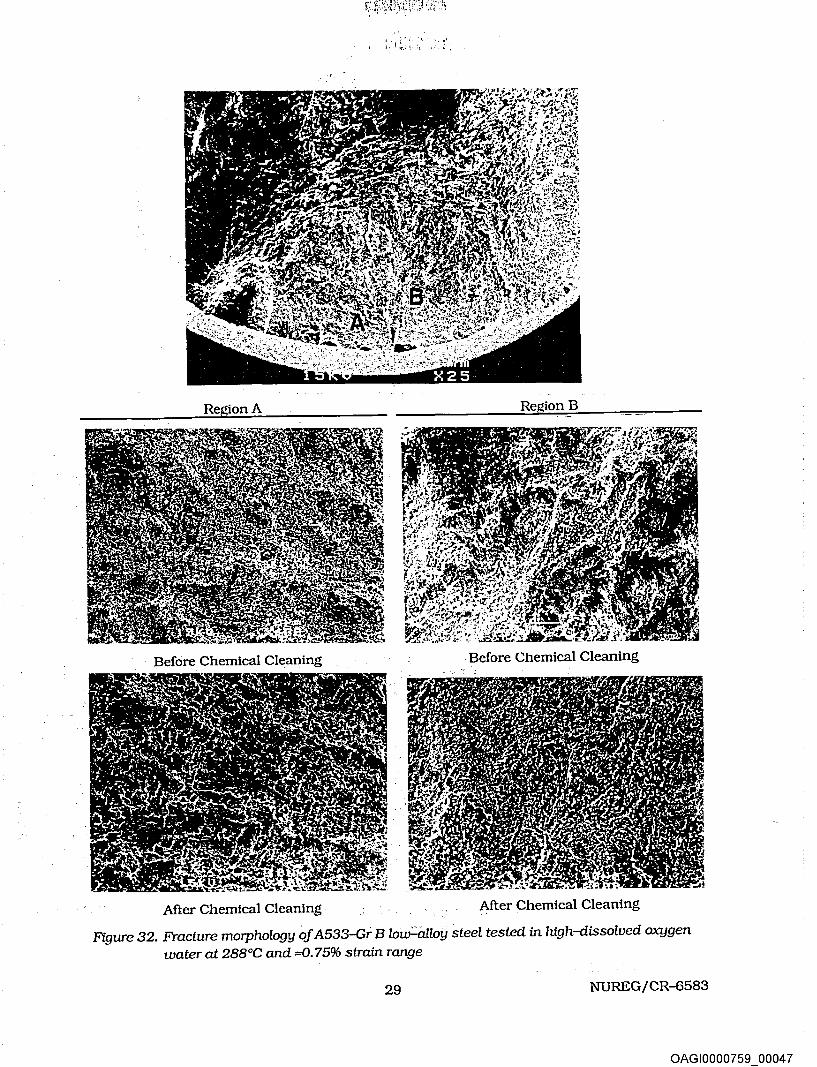
,.
Before Chemical Cleaning Before Chemical Cleaning
Mter Chemical Cleaning Mter Chemical Cleaning
Figure 32. Fracture morphology of A533-Gr B low=aJloy steel tested in high-dissolved oxygen
water at 288°C and =0. 75% strain range
29 NUREG/CR-6583
OAGI0000759 _ 0004 7

Region A Region B
Betore Chemical Cleaning
After Chemical Cleaning After Chemical Cleaning
Figure 33. Fracture morphology of A533-Gr B low-alloy steel tested in simulated PWR water at 288°C and ::0. 75% strain range
NUREG/CR-6583 30
OAGI0000759 00048

Figure 34. Examples of cleavage fracture in Al 06-Gr B specimen pulled apart · at room temperature after the fatigue test ·
Figure35. Sulfide inclusions on fracture surface of
· ·A106-Gr'B carbon steel tested in highdissolved oxygen water at 288°C and
• > • ( -=0.4% strain range
Estimates of the average critical velocity Vin (mm/ s) for initiation of environmentally assisted enhancement of crack growth based on a balance between sulfide supply rate and mass transport away from the crack tip62,63 give ·· · ·
V- _ 1.27xlo-6
in- a (3.21}
. .where a is the crack depth (mm) .. However, nearly all of the studies that support Eq. 3.21 have been conducted in low-DO environments, i.e., <0.05 ppm DO. For a 2.54 mm crack depth, a minimum average crack velocity of 5 X lQ-7 mm/ S is required to produce the sulfide ion concentration for environmental effects on crack growth.62 In addition, the critical velocity must be maintained for a minimum crack extension of 0.33 mm before environmental effects can occur.63 Equation 3.21 indicates that the 'minimum crack ~elocity to initiate environmental effects on crack growth increases with decreasing crack depth. For crack depths of 0.01-3 mm. crack velocities in the range of 1.27 x I0-4 to 4.23 x I0-7 mm/s are required for environmentally assisted reduction in fatigue life of CSs and LASs in low-DO water. For smooth cylindrical fatigue specimens, these growth rates are not achieved under
31 NUREG/CR-6583
OAGI0000759 00049

the loading conditions typically used for fatigue S-N data, which suggests that environmental effects on fatigue life in low-DO environments will not be significant. This result is consistent With the existin!f fatigue S-N data; for most compositionsof CSs and LASs, only moderate reductions in fatigue life (less than a factor of 2) are observed in 288°C water containing <0.0 1 ppm DO.
Recent studies that characterize the influence of reactor environment on the formation and growth of fatigue cracks in polished smooth· specimens of CSs and LASs indicate that the decrease in fatigue life of these steels in high-DO water is primarily caused by the effects of environment on the growth of short crack. 45 Measured crack lengths as a function of fatigue cycles for smooth cylindrical specimens of A533-Gr B LAS. and Al06-Gr B CS tested in air, simulated PWR, and high-DO water are shown in Fig. 36. · The corresponding crack. growth rates for A533-Gr B steel are plotted as a function of crack length in Fig. 37. The results indicate that at ::::0.8% strain range, only 30-50 cycles are needed to form a 100-J.l.m crack in high-DO water, whereas ::::450 cycles are required to form a 100-!-lm crack in low-DO PWR environment and more than 3000 cycles in air. These values correspond to average growth rates of ::::2.5, 0.22, and 0.033J.Lm/cycle in high-DP water, low-DO PWR environment, and air,
.... 0
0 0
A533-Gr B Low-Alloy Steel -ie1 =08%
• Strairi Rate (%/s) Open Symbols: 0.004 Closed Symbols: o 4
--a-Air ll V . High-DO Water
-0· ·- PWR Water .
Carbon & Low-Alloy Steels -ie1..,04%
O• o-·
9 .. c
9 I
' I
,do
-- -0- - • A533-B, RT air -•·-- A533-B, 2ss•c High-DO Water --:.t.- - A106-B, 2ss•c High-DO Water
. " 103 1o4 105 1rf3 102 103 1o4 105
Fatigue Life (Cycles) Fatigue Life (Cycles)
Figure 36. Depth of largest crack plotted as a function of fatigue cycles for A533-Gr B low-alloy steel and Al 06-Gr B carbon steel in air and water environments
Average Velocity '!V t? (IJm/cycle) 1::1
-- -;25'' ---- ij$8 0 0 0
_____ ·: ______ 0 0
~022 0 ' 0 '
10
o Air 0 PWR 6.\1
100 1000
Crack Depth (Jlm)
NUREG/CR-6583 32
Figure37. Crack growth rates plotted as aftmetion of crack depth for A533-Gr B low-allOy steel tested in air and water environments
OAGI0000759 00050

respectively. The results also indicate that relative to air, crack growth rates in high-DO water are nearly two orders of magnitude higher during the initial stages of fatigue life (i.e., for crack .sizes <100 Jlm}, and are one order of magnitude higher for crack sizes >100 JJ.m. ·
Metallographlc examination of the test specimens indicates that in high-DO water, the surface cracks appear to grow entirely in Stage II growth as Mode I tensile cracks normal to the stress axis (Fig. 38).45 In air as well as in low-DO PWR environments, both Stage I and . .
?tage II growth is obseiVed, i.e., surface cracks grow Initially as Mode II (shear) crack along planes 45° to the stress axis and, when the stress intensities are large enough to promote slip on systems other than the primary slip, they grow as Mode I (tensile} crack normal to the stress axis. Also, for CSs. Stage 1 crack growth in air and low-DO water occurs entirely along the soft ferrite grains, whereas in high-DO water, cracks propagate across both ferrite and pearlite regions. A similar crack morphology is also obseiVed on gauge surfaces (Fig. 39); surface cracks in high-DO water are always straight and normal to stress axis, whereas in air or simulated PWR environments, they are 45° to the stress axis. The different crack morphology, absence of Stage I crack growth, and propagation of cracks across pearlite regions suggest that factors other than mechanical fatigue are important for growth of surface cracks in high-DO water. ·
These results are consistent with the slip oxidation/ dissolution mechanism of crack growth, i.e., in LWR environments, the growth of MSCs probably occurs by anodic dissolution. The growth rates depend on DO level in water and S content in the steel. In LWR environments, the formation of engineering cracks may be explained as follows: (a) surface microcracks form quite early in fatigue life at PSBs, edges of slip-band extrusions, notches that develop at grain or phase boundaries, or second-phase partiCles, (b) during cyclic loading. the protective oxide film is ruptured at strains greater than the fracture strain of surface oxides, and the microcracks or MSCs grow by anodic dissolution of the freshly exposed surface to sizes larger than the critical length . of MSCs, and (c) growth of these large cracks characterized by accelerating growth rates. ·The growth rates during the final stage are controlled by both environmental and mechanical factors, and may be represented by the proposed ASME Section XI reference curves for CSs and LASs in water environments.84 Growth rates during the initial stage are controlled primarily by the environment but mechanical fatigue is required for film rupture. For A533-Gr B steel tested in water at 288°C, 0.8% strain range, and 0.004% strain rate, .the initial growth rates, from Eqs. 3.18 and 3.17, are =7 and 0.4 JJ.m/cycle, respectively, for high- and low-DO levels in water. These values are a factor of =2 higher than the measured growth rates (Fig. 37).
4 Overview of Fatigue 5-N Data
The primary sources of relevant 5-N data for CSs ·and LASs are the tests performed by General Electric Co. (GE} in a test loop at the Dresden 1 reactor;B5.86 work sponsored by EPRI at GE;4.87 the work of Terrell at Mechanical Engineering Associates (MEA);88-90 the present work atANL on fatigue of pressure vessel and piping steels;ll-14,20-25 the large JNUFAD* data base for "Fatigue Strength of Nuclear Plant Component" and recent studies at IHI, Hitachi, and Mltsubishi Heavy Industries in ·Japan.&-:10 The data base is composed of ""1200 tests.
* . •. . . . ' .- . . . Private communication from M. Higuchi, Ishikawajima-Harima Heavy Industries Co .• Japan. to M. Prager of the Pressure Vessel Research Council, 1992. The old data base MFADAL" has been revised and renamed MJNUFAD."
33 NUREG/CR-6583
OAGI0000759 00051

Al06-Gr B Carbon Steel A533-:-Gr B Low-Alloy Steel
Air
Simulated PWR Environment
Water with :::0,7 ppm Dissolved Oxygen
Figure 38. Photomicrographs of surface cracks along longitudinal sections of A533-Gr B lowalloy steel and Al 06-Gr B carbon steel in air, simulated PWR environment, and high-dissolved-oxygen water
NUREG/CR-6583 34
OAGI0000759 00052

Al06-Gr B Carbon Steel A533-Gr B Low-Alloy Steel I''. •
Air
Simulated PWR Environment
Water with =0.7 ppm Dissolved Oxygen
Figure 39. Photomicrographs of cracks on gauge surfaces of A533-Gr B low-alloy st~el and Al 06-Gr B carbon steel specimen$ tested in air, simulated P\VR environment, and
high-dissolved-oxygen water
35 NUREG/CR-6583
OAGI0000759 _ 00053

:::600 each in air and water environments. Carbon steels incl.ude :::10 heats of A333-Grade 6, Al06-Grade B, A516-Grade 70, and A508-Class 1 steel, while the LASs include ==15 heats of A533-Grade B. A302-Gr B, and A508-Class 2 and 3 steels.
4.1 Air Environment
· 4.1.1 Steel Type
In air, the fatigue life of carbon and low-alloy steels depends on steel type, temperature. orientation (i.e., rolling or transverse) and for some compositions on applied strain rate. Fatigue 8-N data from various investigations4,6.7,11-14.88 on CSs and LASs are shown in Fig. 40. The ASME Section III mean-data curves (at room temperature) are also included in the figures. The results indicate that although there is significant scatter due to material variability, the fatigue lives of LASs are a factor of :::::1.5 greater than those of CSs. Also. the fatigue limit of LASs is slightly higher than that of CSs. The data for CSs are inconsistent with the ASME mean data curve; the data are above the mean curve at strain amplitudes >0.2% and below the curve at <0.2% strain. The data for LASs show good agreement with the ASME mean data curve.
Carbon Steels 288°CAir
Best-Frt
A106-GrB x 1 Hz (Terrell) 0 04 (ANL) 0 0 04-0 01 (ANL) <> 0 004 (ANL)
ASME Mean Curve/' • , •••• • ·- ••••
at Room Temp
Best-Fit
Strain Rate o/o/s A508--CI3 6. 0 1 (Nagata et at )
v 0 01 (Nagata et at )
x 0 4 (Higuchi & lida) rA533£fu!QH1guch1 & !ida
04 (ANL)
0004(ANL)
1 o2 1 r9 1 o4 1 o5 1 o6 1 o7 1 o2 1 r9 1 o4 1 o5 1 o6 1 o7
Fatigue Ufe, N25 Fatigue Life, N25
Figure 40. Strain amplitude vs.fatigue life datajor carbon and low-alloy steels in air at 288°C
4.1.2 Temperature
For both carbon and low-alloy steels, fatigue life decreases as temperature increases from room temperature to 320°C. Fatigue 5-N data from the JNUFAD data base and other investigations4,11-14.BB in air at room temperature and :::288°C are shown in Fig. 41. For each grade of steel, the data represent several heats of material. The results indicate a factor of "'1.5 decrease in fatigue life of both CSs and LASs with increasing temperature.
4.1.3 Orientation
Some steels show very poor fatigue properties in the transverse orientation, e.g., the fatigue life as well as the fatigue limit may be lower in the transverse orientation than in the
NUREG/CR-6583 36
OAGI0000759 00054

~ "i_CIS1,0 <D '0 ~ 'a. E <(· c: ~ w
0.1
Best-Fit
Carbon Steels Air Strain Rate 0 4%/s
Best-Fit 2as•c
o A333-Gr6 t. A106-GrB
Open Symbols: Room Temp Closed Symbols: 2as•c
IS. .o · A533-Gr8 · ~ t. - · A508-CI 3 • A302-Gr8
Open Symbols: Room Temp Closed Symbols: 2as•c
1 o2 1 OJ 1 o4 1 oS 1 o6 1 o7 ·1 c:f 1 OJ 1 o4 · 1 oS 1 o6 1 o7
Fatigue Life, N25 Fatigue Life, ~5 . Figure 41. Strain amplitude us. fatigue life datafor carbon p.nd low-alloy steels in air~ room
temperature and 288°C
CIS w a) "§ 'K E <( c: ·e
J
A302-Gr Blow-Alloy Steel 2aa•cAir ·
•
· w 0.1 ~ Rolling(R) - -~- • Radial (T2)
0 Transverse (T1)
1rf . 10J
·Strain Rate ('%/s) . Open Symbols: 0 4
Closed Symbols: 0 004 .
.1 as Fatigue Life, N25
Figure 42. ·- Elfeet.ofmatenaz orientation on fatigue life :of A302-Gr B 'low-alloy ·steel in air at 288°C
rolling orientation.I3,I4 The fatigue lives of A302-Gr B steel in three orientations• in air at 288°C are shown in Fig. "42. . The res.ults iridicate . that fatigue lives for the R and Tl orientations are approximately'the same, but forT2 orientation both fatigue life and fatigue limit are lower than those in the other orientations. Atslow strain rates,' fatigue life in the T2 orientation is nearly one cirder 'of magnitu-de lower than ·in the R orientation. Metallographic examination indicates that 'structural facto.rs, such as distribution: and morphology of sulfides, are responsible for the poor fatigue resistance in transverse orientations, in which a fatigue
· crack propagates preferentially along the' sitlfide strtngers. · ' - . ' ~- .
4.1.4 Strain Rate
The existing fatigue s-N data i~dicate that in· the temperature range of dynamic strain aging (200.:.370°C), some hea"ts' of cs' and LAS a:r·e sensitive·to strain rate 'even in ~ inert environment: with decreasing strain rate, the fatigue life may be either unaffected, 11-14 decrease for some heats,91 or increase for others.92 At 288°C,- a decrease in strain rate by 2
. . . • • • • t •
Both transverse and radial directions are perpendicular to the rolling direction but the fracture plane is across the thickness of the plate in transverse orientation and parallel to the plate surface in radial orientation.
37 NUREG/CR-6583
OAGI0000759 00055

orders of magnitude has little or no effect on fatigue lives of the ANL heats o( AI 06-Gr B and A533-Gr B steel {Fig. 40}, whereas fatigue lives of A302-Gr B steel in radial orientation (Fig. 42) decreased by a factor of ==5. A decrease in life with decreasing strain rate is observed for the A333-Gr 6 CS, see Table A2 of the Appendix. Inhomogeneous plastic deformation can result in localized plastic strains, this localization retards blunting of propagating cracks that is usually expected when plastic deformation occurs and can result in higher crack growth rates.9D The increases in fatigue life have been attributed to retardation of crack growth rates due to crack branching and suppression of plastic zone. Formation of cracks is easy in the presence of dynamic strain aging. 92
4.1.5 Cyclic Stress-versus-Strain Behavior
The cyclic stress-strain response of carbon and low-alloy steels varies with steel type, temperature, and strain rate. In general, these steels show initial cyclic hardening, followed by cyclic softening or a saturation stage at all strain rates. The CSs, with a pearlite and ferrite structure and low yield stress, exhibit significant initial hardening. The LASs, which consist of tempered ferrite and a bainitic structure. have a relatively high yield stress, and show little or no initial hardening, may exhibit cyclic softening during testing; For both steels, maximum stress increases as applied strain increases and generally decreases as temperature increases. However, at 200-370°C, these steels exhibit dynamic strain aging, which results in enhanced cyclic hardening, a ~econdary hardening stage, and negative strain rate sensitivity.91,92 The temperature range arid, eXtent of dynamic strain aging vary with composition and structure. Under c~riditions of dynamic strain aging, cyclic stress increases with decreases in strain rate.
The effect of strain rate and temperature on the cyclic stress response of AI06-Gr B, A333-Gr 6, A533-Gr B. and A302-Gr B steels is shown in Fig. 43. For both carbon and lowalloy steels, cyclic stresses are higher at 288°C than at room temperature. At 288°C, all steels exhibit greater cyclic and secondary hardening because of dynamic strain aging. The extent of hardening increases as applied strain rate decreases.
During cyclic loading, the stress response is essentially controlled by microstructural . changes that occur in the materiat during th(! test. In the temperature regime of dynamic
strain aging, the microstructural changes are significantly altered because of the interactions between mobile dislocations and interstitial carbon or nitrogen atoms. Such interactions are
. strongly dependent on temperature and strain rate. The microstructures that developed in A106-Gr B carbon steel specimens tested at 288°C, ::::0.75% strain range, and three different strain rates are shown in Figs. 44-4 7 ~ • The res tilts indicate that the dislocation structure varies significantly with strain rate; the lower the strain rate the more mature the dislocation structure. At 0.4 %/s strain rate, there is no well-established dislocation structure, although immature dislocation walls can be observed (Figs. 44 and 45). A mature microstructure consisting of dislocation cells, walls, and/ or veins with high dislocation density is observed in both the ferrite and pearlite -grains at 0.04 and 0.004 %/s strain rates (Figs. 46 and 47). The dislocation walls may cross individual cementite plates or particles within a pearlite grain to keep a consistent crystallographic structure.
• Work performed by Ms. Gordana Avramovic-Cingara and Prof. Zhirui Wang, Department of Metallurgy and Materials Science. University ofToronto, November 1994.
NUREG/CR-6583 38
OAGI0000759 00056

(?1000 0.. ~ 900 1:)
<I 800 a) Cl @ 700 a: gJ 600 ~
U5 500
A106-Gr B Carbon Steel . ~· t:. t 1=0.75% .... ~·
•.. oocP 0~• · 0 0 Ci.
"" ••• A ......... ~~tlt~OA oA~~- .·
o 2ae•CAir <> t;. AT Air Strain Rate (%/s) Open Symbols: 0 4 Closed Symbols: 0.004
A333-Gr 6 Carbon Steel
l;. £1<=080%
• • •• •• ••• • 0
• 0
•o 0
.. -~~ •• 0
0 0 0
00 0
Strain Rate (%/s) Open Symbols: 0 4 Closed Symbols: 0 004 0 2BBOC Air
4 00 L-..I.....Jw.....L.U.UL-...L..-'w.....L.L.lllL-...L...JU-L.l.U.Ll.__.1-1--L..L.U.U.L-.:l
10° 101 . to2 103
(?1000 0.. ~ 900 1:)
~ 800 Q) Cl
~ 700 a: gJ 600 ~
U5 500
Number of Cycles
A533-Gr 8 Low-Alloy Steel ·
/!,. £,=0.75%
Strain Rate (%/s) · Open Symbols: 0.4 Closed Symbols: o 004
o 288•CAir t;. Room-Temperature Air
. 1:;..
400 ~~~UUL-.1-I~.U.U.~.1-1~~--~~aw~
101 to2 1if Number of Cycles
A302-Gr B Low-Alloy Steel
t. e1 .. 075% • ••••••• ••• o •o• oo oo oooo oo
Strain Rate {%/s} · Open Symbols: o 4 Closed Symbols: 0 004 o 2ee•cAir
0
1 0° 1 01 1 02 1 o3 1 04 1 0° 1 01 1 o2 1 o3 1 04
Number of Cycles Number of Cycles
Figure 43. Effect of strain rate and temperature on cyclic stress of carbon and low-alloy steels
Figure 44. Typical microstructure in A106-Gr B specimen tested at 0.4 %/s strain rate slwwing immature dislocation walls in three pearlite grains consisting of Fe3C plates in the ferrite matrix
39 NUREG/CR-6583
OAGI0000759 00057

Figure 45. Ferrite grain between two pearlite grains in A 1 06-Gr B specimen tested at 0.4 %/s strain rate
Figure 46. Typical microstructure inA106-Gr B specimen tested at 0.04 %/s strain rate showing a cell structure in ferrite (C) and two pearlite grains (A and B)
NUREG/CR-6583 40
OAGI0000759 00058

--------------------------------------------~------------------------------------------------------.•! ;,
Figure 47. Formation of dislocation walls in two pearlite grains (A and B) in A106-Gr B specimen tested at 0.004 %/s strain rate
"2"1000 0. ~ -; 800 <l
g; 600 c I'CI
a: 400 1/) (I)
~ U5 200
.6.tt (%) = (.6. o/1965) + (.6. o/C)7 74 c = 1080-50 9Log( )E
TenJComp. Strain Rate (%/s)
0 0 4/0 4 . t::. 0 04/0 4
'<> 0 004/0 4
0 UJ~LWWU~WU~~~~UU~WW~~UW4J
. 0.0 05 10 15 2.0 0 0
Totai.Strain Range, ~£1 (%)
low:...Anoy Steels 288°C
o 4%/s
L\ft (%) = (.6.ol1965) + (.6.o/C)9 09 C = 962 - 30 3Log( "f.
Ten./Comp Strain Rate (%/s)
0 4/0 4 0 01/0.4 0 004/0 4
0 5 1 0 1.5
Total. Strain Range, ~ t 1 (%) 2.0
Fi!Jure 48. Cyclic stress-strain curve for carbon and low-alloy steels at 288°C in air
The cyclic-stress-vs.~trairi CUrVes for carbon and low-allciy steels at 288°C are shown in Fig. 48; cyclic stress corresponds to the value at half life. The stress-strain curve for carbon steels can be represented with the equation
l:la ( l:la)7.74 .!:lEt=--+ - .
1965 c .
where the constant C is expressed as
.·:C = 1080-50.9Log{i):
and for low:-:-alloy steels, with the equation
41
{4.la)
(4.lb)
','·
NUREG/CR-6583
OAGI0000759 00059

(4.2a)
where the constant D is expressed as
n = 962- 30.3Log(e) •. (4.2b)
where .6.cr is the cyclic stress range (MPa), and e is applied total strain rate (%/s). The cyclic stress response is lower at room temperature than at 288°C.
4.2 LWR Environments
The fatigue data in LWR environments indicate a significant decrease in fatigue life of CSs and LASs when five conditions are satisfied simultaneously, viz., applied strain range, service temperature, DO in the water, and sulfur content of the steel are above a minimum threshold level, and the loading strain rate is. below a threshold value. Although the microstructures and cyclic-hardening behavior of CSs and LASs are significantly different, environmental degradation of fatigue life of these steels is identical. Also, studies on fatigue crack growth behavior of CSs and LASs indicate that flow rate is an important parameter for environmental effects on crack growth rate in water. 39,58,59.64 However, experimental data to establish either the dependence of fatigue life on flow rate or the threshold flow rate for environmental effects to occur are not available. For both steels, environmental effects on fatigue life are minimal if any one of these conditions is not satisfied. The effects of these parameters on fatigue life are discussed below in greater detail to define the threshold values.
4.2.1 Strain Amplitude
A minimum threshold strain is required for environmentally assisted decrease in fatigue life. This behavior is consistent with the slip-dissolution model for crack propagation;74,76 the applied strain must exceed a threshold value to rupture the passive surface film in order for environmental effects to occur. This threshold value most likely depends both on material parameters such as amount and distribution of sulfides, and on parameters such as temperature,· strain· rate, and DO level in water. The fatigue lives of A533-Gr B and AI 06-Gr B steels in high-DO water at 288°C and various strain ratesl3,14 are shown in Fig. 49. For these heats of carbon and low-alloy steels, the threshold strain amplitude appears to be at ::::0.18%, i.e., a value <=20% higher than the fatigue limit of these specific heats of steel.
4.2.2 Strain Rate
The effects of strain rate on fatigue life of CSs and LASs in LWR environments depend on whether or not all threshold conditions are satisfied. When any one of the threshold conditions is not satisfied, e.g., low-DO PWR environment. the effects of strain rate are similar to those in air; heats of steel that are sensitive to strain rate in air also show a decrease in fatigue life in water with decreasing strain rate (discussed further in Section 4.2. 7). Effects of strain rate are much greater when all threshold conditions are satisfied. The existing data indicate that a slow strain rate applied during the tensil~loading cycle is primarily responsible
NUREG/CR-6583 42
OAGI0000759 _ 00060

for environmenta1ly assisted reduction in fatigue life. ·A slow strain rate applied during both tensile- and compressive-load cycles does not cause further decrease in fatigue life, e.g., solid diamonds and square in Fig. 49 for AI 06-Gr B steel. These results are consistent' with a slip oxidation/dissolution mechanism74-76 discussed in Section 3.2. During tensile load cycle, the protective oxide film is ruptured at strains greater than the fracture strain of surface oxides, and growth rates are enhanced because of anodic dissolution of !_h<::Jreshly exposed surface. The effect of environment increases with decreasing strain rate. The mechanism assumes that environmental effects do not occur during the compressive load cycle,. because during that period water does not have access to the crack tip.
A533-<3r B Low-Alloy Steel 288°C
Best-Fit Curve •' '-' , 0 4"/ols Strain Rate
Strain Rate "'ois
0 0 4/0.4 0 0 004/0.4 'il 0 4/0.004 • 0.0004/04
-~-- / . "tf., Best-Fit Curve Air
'.b~ / T 'e O'Q) •• --. '·
,.. ...... ~--8·
l
Best-Fit Curve , 0.4"/ols Strain Rate ,--- /
· j:{.' , Best-Fit Curve Air
• -~--~-<:/ j1 ·e..Op. ••
Best-Fit Curve 0.004%/s Strain Rate
Open Symbols: Air
-..a
Closed Symbols: High-DO Water
Strain Rate "'ois 0 0.4/0.4 0 0 004/0 4 'V 0.4/0 004 • 0 0004/0 4 • 0.004/0.004
,. ___ _
1 o2 1 o3 1 o4 1 o5 1 o6 1 o7 1 o2 1 o3 1 o4 105 1 o6 1 o7
Fatigue Ufe, ~5 Fatigue Life, N25
Figure 49. Strain amplitude vs.fatigue life datajor A533-Gr B andA106-Gr B steels in highdissolved-oxygen water at 288°C
However, limited data indicate that a slow strain rate during the compressive load cycle also decreases fatigue life, although the decrease in life is small. For example, the fatigue life of A533-Gr B steel at 288°C, 0.7 ppm DO, and =0.5% strain range decreased by factors of 5, 8, and 35 for the fast/fast, fast/slow, and slow/fast tests, respectively, i.e.~ solid circles, diamonds, and inverted triangles in Fig. 49. Similar results have been observed for A333-Gr 6 carbon stee1;B relative to the fast/fast test, fatigue life for slow/fast and fast/slow tests at 288°C, 8 ppm DO, and 1.2% strain range decreased by factors of 7.4 and 3.4, respectively. For fast/slow tests, 'redu.ction in life 'is most likely caused by enhanced growth rates due to ·anodic dissolution -of freshly exposed surface during the period starting from film rupture during the fast tensile load cycle, to repassivation of the surface during the slow compressive load cycle. The major contribution of environment :occurs during slow compressive loading near peak tensile load. · '·
The 5-N data indicate that strain rates above 1 %/shave little or no effect on fatigue life · of CSs and LASs iri LWR eirviroriments.; For strain rates <1 %/s,, fatigue life decreases rapidly with 'decreasing strain'rate.' ·The fatigue lives of several heats of CSs and LASs6-14 are plotted as a function of strain rate in Fig." 50/ The results indicate that when the five threshold conditions are satisfied, fatigue life decreases with decreasing stniin rate and increasing levels of DO iri water:·· Only a moderate decrease in fatigue life is observed in low-DO water, e.g., at -DO levels of:S0.05 ppm. For two heats of steel, e.g., Al06-GrB CS and A533-GrB LAS, the effect of strain rate on fatigue life appears to· saturate at =0.001%/s strain rate. This is
43 NUREG/CR-6583
OAGI0000759 00061

0 o. r······-·· .
2aa•c ' Strain Amplitude: ~0.38% Sulfur: A333-Gr 6 = 0 012 wt.%
Ai106-Gr B = Ol 015 wt%
1Q1L-~uum_~~~~~uwL-~uuw_~~~
1 o-5 1 o-4 1 o-3 1 o-2
Strain Rate (%/s)
104 ~rrnnm-~~mr.\-o~mmr-rrnnrr-~Tn=
2ss•c i Strain Amplitude: 0 6%! Sulfur: o 015 wt% l·
DO(ppm) A333-Gr 6
o o:o1 o o:to A o:2o- ·• o a:o X Air
A106-Gr B '\1 8 'o
--·-·r --1Q1L-~UUill+~~~~~~L-~~~~~~
25o•c Strain Amplitude: o 6% Sulfur: 0 015 wt%
"""1"" -- ... -
1 o-5 1 o-4 1 o-3 1 o-2
Strain Rate (%/s)
2ss•c i Strain Amplitude: 0 6'l'J Sulfur: ~0.01 wt % j
i· ; A
r-- -g
1 o-5 1 o-4 1 o-3 1 o-2 1 o·1 1 oo 1 o-5 1~ 1~ 1~ 1~ Strain Rate (%/s) Strain Rate (%/s)
Figure 50. Dependence of fatigue life of carbon and low-alloy steels on strain rate
consistent with the predictions of a crack growth modei.26 However, a heat of A333-Gr 6 carbon steel did not show saturation at this strain rate at 250°C and 8 ppm DO. Saturation strain rates are likely to depend both on material and environmental variables.
Nearly all of the existing fatigue s-N data have been obtained under loading histories with constant strain rate, temperature, and strain amplitude. Actual loading histories encountered during service of nuclear power plants are far more complex. Exploratory fatigue. tests have been conducted with waveforms in which the slow strain rate is applied during only a fraction of the tensile loading cycle.S,ll-14 The results of such tests provide guidance for developing procedures and rules for fatigue evaluation of components under complex loading histories.
Results for Al06-Gr B steel tested in air and low-: and high-DO environments at 288°C and =:0. 75o/o strain range are summarized in Fig. 51. The waveforms consist of segments of loading and unloading at fast and slow strain rates .. The _variation in fatigue life of Al06-Gr B and A333-Gr 6 carbon steels and A533-Gr Blow-alloy steel8,13,14 is plotted as a function of the fraction of loading strain at slow strain rate in Fig. 52. Open symbols indicate tests where the slow portions occurred near the maximum tensile strain. Closed symbols indicate tests where the slow portions occurred near the maximum compressive strain. In Fig. 52. if the relative damage were independent of strain amplitude, fatigue life should decrease linearly
NUREG/CR-6583 44
OAGI0000759 00062

A
D
G
J
----------------------------------------------------------------------------------
Fraction cl strain at slow rate: 0
Air: 3.253; 3,753
PWR: 2,230; 1,525
Hi DO: 2,077; 1. 756
Fractton of strain at sLow rate: 0 65
Air: 4,356
·PWR:
Hi DO: 615
Fraction of strain at slow rate: 0 347
Air: 5,139
PWR:
Hi DO: 615; 553
Fraction olstrain at s1ow rate: 0170
Air: 4,122
PWR:
HiDO: 888
B
E
H
I K
Fracttoil o1 strail\ at skM rate: 1
Air: 3,721; 3,424;
6,275
PWR: 2,141
Hi DO: ~ 303; 469 Fraction ot strain at slow rate: 0 666
Air: 5,261
PWR:
Hi DO: 545
Fradion of strain at sbw rate: 0 167
Air: 4,087
PWR:
Hi DO: 1,649; 2,080
Fraction of stran at slow rate: 0 084
Air: 4,105
PWR:
Hi DO: 2,093
c
F
I
fraction of strain at slow rate: 0 83
Air: 3,893
PWR:
. Hi DO: 340
Fraction of strain at slow rate: 0 334
Air:
·PWR:
Hi DO:. 1.935
Fractton ol itrain at slow rate: 0 319
Air: 5,240
PWR:
HI DO: 1,306
Figure 51. Fatigue life of Al06-Gr B carbon steel at 288°C and 0.75% strain range . . . . . in air and waie~ ~~~ironments under d
1()2
0
1()2
0
A106-Gr B Steel o Air i f>. PWRl 0 IHI 0.6 ppm DO 0 ANLOBppmD
i 0 i 0 ~verage r)te in air --• -r • ---r ----r ---e-1- ----i i D _Av. in P~R water
-~~-.:~ --~-·-T--'·<r··-····r· ----. -.: :..... :
-·-· ····o·l··-···-······r·:·;··.-·r~~;-~~-:l~·:,~--286°C, e1 =0.75%, 8 i o slow 0 004 & last 0 4%/s l Eth = 0.36% Slow strain rate applied near Open symbols: peak tensile strain . Closed symbols: peak compressive strai · ·· •·• ··•
0.2 0.4 0.6 0.8 Fraction of Strain at Slow
Strain Rate
A333-Gr 6 Steel 0 IHI Air C 6 IHIBopm 28SO ' £• ~ SO/o, o IHI 0.8 ppm
Slow 0 004 & Fast 0 4%/s n ANL Air i i '\1 ANL08ppm
···:··:o:··:t . :..:··-::··t: ·. r:.··:··:r.·····:·:··: L ·: ::.··. • i i • ~verage I if~ in air
1J~~:~J---.J __ j_ I 'l'',,h~~~~~~--! I I B .
Slow strain rate applied near Open symbols: peak tensile strain Closed symbols: peak compressive stra ····- ••
0.2 0.4 0.6 0.8 Fraction of Strain at Slow
Strain Rate
A
c
A
c
0
0
A5 3-Gr B Steel 0 Air : f>. PWR i o ~o7ppmOO J"
i \ Average rite in air ----~----r-D--~----~---
1 ° ! i i : : : :
'j·- .: i [ :""-. : :
--------·-·r. . ~-- ~ ,--: ~r~ -- ..... , .......... .
: : - :
268°C, e1 =0.75%, B \ o 'j'-~~----~----~ c
slow 0.004 & last 0 4"/o/s \Eth =0.36% Slow strain rate applied near Open symbols: peak tensile strain Closed symbols: peak compressive stra" ·- ••· ••••
0.2 0.4 0.6 0.8 Fraction of Strain at Slow
Strain Rate
A333-Gr 6 steel o Boom 288°C, e1 1 2%, 11 0 OS oom
0 AT Air
-0~·~~04~ I L=-~"' - - . ..._ . - . - - . -- . ~ - - . -:- - - --~ ·' .. ! ..... t:·······
01 f.th=0.25%
Strain fraction measured from Open symbols: peak tensile strain Closed symbols: peak compressive stra" · ------····· ·
0.2 0.4 0.6 0.8 Fraction of Strain at Slow
Strain Rate
FYgure 52. Fatigue life of carbon and low-alloy steels tested with loading waveforms where slow strain rate is applied during a.fraction ojtensUe loading cycle
from A to C along the chain-dot line. Instead, the results indicate that the relative damage due to slow strain rate is independent of strain amplitude once the amplitude exceeds a threshold value to rupture the passive surface film. The threshold strain range is 0.36 % for Al06-Gr B steel: a value of0.25o/o was assumed for A333-Gr 6 steel.
Loading histories with slow strain rate applied near maximum compressive strain (i.e .• waveforms D, F, H, or K) produce no damage (line AD) until the fraction of the strain is sufficiently large that slow strain rates are occurring for strain amplitudes greater than the threshold. In contrast, loading histories with slow strain rate applied riear the maximum
NUREG/CR-6583 46
OAGI0000759 _ 00064
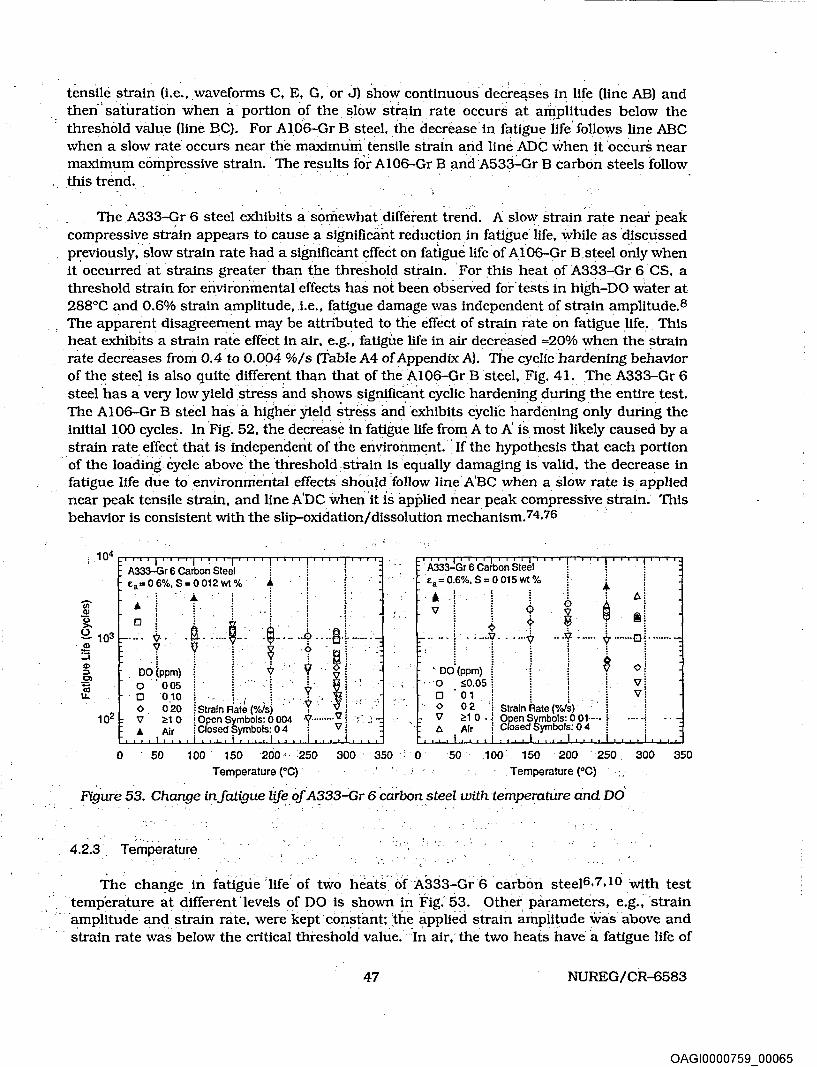
tensile strain (i.e· .. waveforms C, E, G, or J) show continuous dec~eqses in life (line AB) and then·' saturation when a portion of the slow strain rate occurs at ariiplit~des below the threshold value (line BC). For A106-Gr B steel, the decrease-in fatigue life' follows line ABC when a slow rate occurs near the maximu·rri tensile strain and line ADC when it occurs near maximum compressive strain. The resul~ for Al06-Gr B and :A533-Gr B carbo~ steels follow _this trend.·
The A333-Gr 6 steel exhibits a s~mewhat. different t~end .. A slow strain rate near peak ( . - - -. . . -
compressive strain appears to cause a significant reduction in fatigue life, while as discussed previously,' slow strain rate had a significant effect on fatigue life of Al06-Gr B.steel ocly when it. occurred at strains greater than the threshold strain. ·For this heat of A333....,Gr 6_ · CS, a threshold strain for environmental effects has not been observed for tests in high-DO water at 288°C and 0.6% strain amplitude, .i.e., fatigue damage was independent of strain amplitude.B The apparent disagreement may be attributed to the effect of strain rate on fatigue life. This heat exhibits a strain rate effect in air, e.g., fatigue life in air decreased ==20% when the strain rate decreases from 0.4 'to 0.004 %/s (Table A4 of Appendix A) .. The cy<:lic hardening behavior of the steel is also quite different than that of the Al06-Gr B steel, Fig. 41. The A33s-:..Gr 6 steel has a very low yield stress ~d shmys significant cyclic hardening during the entire test. The Al06-Gr B steel has a higher jield stress and exhibits cyclic hardening only during the initiallOO cycles. In Fig. 52, the decrease in ·fatigue life from A to A' is most likely caused by a strain rate effect that is independent of the environment:·· If the hypothesis that each portion of the lmiding cycle above· the threshold sti-airi is- equally damaging is valid, thedecrease in fatigue life due to enviromrientaleffects should.follow iine A'BC when a slow rate is applied near peak tensile strain, and line A'DC when· it is applied ~ear peak compressive strain. This behavior is consistent With the slip-oxidation/dissolution mechanism.74,76 ·
' A3~r 6 Carbon Steel
Ea=06%,S=0012Wt% 1, 4 '
'~ -~. ~- l . + . .tij .• ·····~··· -~···- ··9 ····~h-····· v ~. -~ 0 ~i .
DO (ppm) I I · . ~ · ~ · •;;,/-g . ~~~ I I . ·I {r· . ~! , <> o 2o i Strain Raie (o/ds) · · Y · ~\ " 'V :!:1 0 · i Open Symbols: 0 004 ·'11 .. ·•··••• 'i7. l .A i Closed Symbols: 0 4 i 'V ~
Ea= 0.6%, S = 0 015 wt% · j
• . = •. '. t 6~ "'I 0 6 ~ .
.. -~·. ·--f . + -1· -· t-=1·--< oo· (ppm) ! ! ! $ <> ! 0 ~0.05 i i i i vi o 01 ! i i i vi <> 0 2 l Strain Rate (%/~) · · i l 'V :!:1 0 • { Open Sl!mbols: 0 01---- f •··· ·{ A Air i Closed Symbols: 0 4 ~ ~
0 ' 50 . 100 150 200' 250 300 . 350 : 0 50 100. 150 200 . 250 300 350
Temperature (0 C) · Temperature (0 C)
Fig'ure 5S. Change infatig~e life oiA?33~r 6 carbon. steel with temperatUre and bd ' ..
-- l
Th~ change in fatigue life. of two heats'of ASS3-Gr6 ca~bon steel6,7,Hl with test temperature at different. levels of DO is shown. in :Fig.' 53. Other parameters, e.g.~ 'strain amplitude and strain rate, were kept·con~tant;_'th~ ;;tpplied strain ampli~ude was above and
.·.strain rate was below the critical threshold value.· In air, the two heats have a fatigue life of
47 NUREG/CR-6583
OAGI0000759 00065

==3300 cycles. The results indicate a threshold temperature of 150°C, above which environment decreases· fatigue life if DO in water is ·also above the critical l-eveL· In the temperatun!'rahge of 15Q-320°C. fatigue life-decreases linearly with tempe.ratur~; the 4ecrease in life is greater at high temperatures and DO levels. Only a moderate decrease in fatigue life is observed in water at temperatures below the threshold value of 150°C or at DO levels :5:0.05 ppm. Uncter these conditions~ fatigue life in water is 30-50% lower than in air; Fig. 53 shows an average life of ==2100 cycles for the heat with 0.015 wt.% sulfur and =1200 cycles for the 0.012 wt.% sulfur steel. For the latter, the larger decrease in fatigue life in low-DO water relative to room temperature air. is most likely due to ·strain rate effects. As discussed in the preceding section, the A333-Gr 6 steel with 0.012 wt.% sulfur is sensitive to strain rate even in air; life decreases with a decrease in strain rate.I3,24 Tlie strain rate effects are similar in . .
air and in water when any one of the threshold conditions is not satisfied.
Fatigue &-N data on high-sulfur LASs are inadequate to determine the temperature dependence of fatigue life in water. Establishing the threshold conditions and the functional forms for the dependence of fatigue life on various loading and environmental conditions requires ~omplete data sets where one parameter is varied while others are kept constant. Although the existing fatigue 5-N data for LASs cover an adequate range of material, loading. and environmental parameters, they provide incomplete data sets for temperature. An artificial neural network (ANN} has been used to find patterns and identify the threshold in fatigue S-N data for CSs and LASs in LWR environments.93 ·The main benefits of the ANN approach are that estimates of life are based purely on the data and not on preconceptions. and that the network can interpolate effects where data are not present by learning trends. The factors which effect fatigue lif~ can have synergistic effects on one another. A neural network can detect and utilize these effects in its predictions.
A neural network, consisting of two hidden layers with the first containing ten nodes and the second· containing six nodes. was trained six times; each training was based on the same data set, but the order in which the data were presented to the ANN for training was varied and the initial ANN weights were randomized to guard against overtraining and to ensure that the network did not arrive at a solution that was a local minimum. The effect of temperature on the fatigue life of CSs and LASs estimated from ANN is shown in Fig. 54. The solid line represents estimates based on the statistical model27,28 and open circles represent the experimental data. The results indicate that at high strain rate (0.4%/s), fatigue life is relatively insensitive to change in temperature. At low strain rate (0.004%/s), fatigue life decreases with increase in temperature beyond a threshold value of = 150°C. The precision of the data indicates that this trend is present in the data used to train the ANN.
As discussed in the previous section; actual loading histories encountered during service of nuclear power plants involve variable loading and environmental conditions, whereas the existing fatigue &-N d~ta have been obtained under loading histories with constant strain rate, temperature. and strain amplitude. Fatigue tests have been conducted in Japan on tube specimens (1 or 3 mm wall thickness) of A333-Gr 6 carbon steel in oxygenated water under combined mechanical and thermal cycling.9 Triangular waveforms were used for both strain and temperature cycling. 1\vo sequences were selected for temperature cycling (Fig. 55): an in-phase sequence in which temperature cycling was synchronized with mechanical strain cycling, and another sequence in' which temperature and strain were out ~f phase, i.e .. maximum temperature occurred at minimum strain level and vice-versa. Three ·temperature ranges, 5D-290°C, 50--200°C, and 200-290°C, were selected for the tests. The results are
NUREG/CR-6583 48
OAGI0000759 00066

Ci) Q)
0 >. (.) -
. 1 cf 0
0
Dissolved Oxygen = 0.2 ppm Strain Rate = 0.4 %/s E =0.6%
II
Dissolved Oxygen = o.2 ppm Strain Rate = 0.4 %/s ·
50 100. 150 200 250 300 350 0 Temperature (°C)
~-~;:;~;,~;:~~~i~ ...... ~- .. --..~-o
Dissolved Oxygen = 0.2 ppm · "g; Strain Rate = 0.004 %/s E =0.6% a
'e =0.6% a
-=-----•. -.~----=--,.-=-=:....::~~:::..:-:.: ~-; t:":: ~;;:. Dissolved Oxygen = 02 ppm
· Strain Rate = 0.004 %/s
50 100 150 200 250 300 350 Temper~ture (0 C)
Figure 54. Dependence of fatigue life on temperature for carbon and low-alloy steels in water at two strain rates: Open circles = experimental data; solid line = statistical model: other lines = ANN estimates for the six trained data sets.
06 High: High
(I) ~ ..... -::l ·~ '::l
~ 1ii ... (I) c: Q)
c. <ii c. E -~ E. (I) {/) (I)
1- 1-:-·
Low Low
-0 6
Figure 55. Waveforms for change ·0 t~;np~rC!-ti.ffe during exploratory fatigue tests
shown i~ Fig. 56. An average t~mperatt~re is: ;tis~d. for the thermal cycling tests. Because environmental effects ~n fatigue life a~e mod~rate -·_and Indep~ndent of_ temperature below 150°C, the temperature for tests cycled in the rarige of 50-290°C or 50-200°C was determined from the average of 150°C and the maximum temperature.
The results of constant temperature tests are consistent with the results in Fig. 53 and . confirm that environmental effects on fatigue life are minimal at temperatures below 150°C.
The results also indicate. that the fatigue life for in-phase temperature cycling is comparable to that for out-of-phase cycling. At firs( glance, these results are somewhat surprising. If we consider that the tensile-load cycle is primarily responsible for environmentally assisted
49 NUREG/CR-6583
OAGI0000759 00067

1o2
0
A33~Gr 6 Carbon Sieel Tube specimen; :Hnin wall Ea = 0 6%;·£ = 0 002 "'ois S =; 0012 ~%;DO=: 1 ppm
j . ..0.t. ___ ~--~ .. ti !.. 1. ..... -r,_--.... -----?,.--....... -l $ l l
i ! : ! i i I! Temperatur_e o · Constant 6 · In phase A · Out of phase
50 100 150 200 250 300 350 0
Temperature (°C}
A33~r 6 C~rbon St:eel T~mperature Tube speclmen;'1-mm w'all o' Constant ta = 0 6%;·£ = 0 002 "lois ! 6 In phase S = 0.012 w1 %; DO = 1 ppm t A. 0 'f h I l l I utopase
r 7 ~ • I ~ ~ ~ ¢ : : : ~
l,,· : : A il ! i¥ It ; t,_·- .... 1,,· ... o .. Q;. .......
j 0)
50 100 150 200 250 300 350
Temperature (°C}
Figure 56. Fatigue life of A333-Gr 6 carbon steel tube specimens under varying temperature, indicated by horizontal bars
reduction in fatigue life and that the applied strain and temperature must be above a minimum threshold value for environmental effects to occur, then life for the out-of..:.phase tests should be longer than for the in-phase tests, because applied strains above the threshold strain occur at temperatures above 150°C for in-phase tests, whereas they occur at temperatures below 150°C for the out-of-phase tests. If environmental effects on fatigue life are considered to be minimal below the threshold values of 150°C for temperatures and <0.25 % for "strain range, the average temperatures for the out-of-phase tests at 50-290°C, 50-200°C, and 200-290°C temperature ranges should be 195, 160, and 236°C, respectively, instead of 220; 175, and 245°C, as plotted in Fig. 56. The fatigue lives of out-of-phase tests should be at least 50% higher than those of the in-phase tests.
The nearly identical fatigue lives for the two sequences suggest that environmental effects can occur at strain levels below the threshold strain. These results are difficult to reconcile in terms of the slip oxidation/dissolution mech~nism; the surface oxide film must be ruptured for environmental effects to occur. However, the results may be explained by considering the effect of compressive-load cycle on fatigue life: As was discussed in the previous section, the fatigue data suggest that a slow strain rate during the compressive-load cycle could also decrease fatigue life. The thermal cycling test results shown in Fig. 56 were obtained with a triangular waveform. For out-of-phase tests, although maximum temperatures occur at strain levels that are below the threshold value for the tensile-loading cycle, they occur at maximum strain levels for the compressive-loading cycle. The contribution of compressive loading cycle on fatigue life may result in nearly the same fatigue life for in-phase and out-ofphase tests. For in-phase tests, maximum temperatures occur at strain levels that are below the threshold value for the compressive-loading cycle; the contribution of the compressive cycle on fatigue life would be negligible.
4.2.4 Dissolved Oxygen
The dependence of fatigue life of carbon steel on DO content in water6,10 is shown in Fig. 57. The test temperature, applied strain amplitude, and sulfur content in steel were above, and strain rate was below, the ciitical threshold values. The results indicate a
NUREG/CR-6583 50
OAGI0000759 00068

Strain Rate (o/.Js} 0 0004 6 001
2ss•c (a) Strain Amplitude: 0 6% Sulfur: 0.012 or 0.015 wt.%
0 o-
1o·2 10·1 10°
Dissolved Oxygen (ppm)
10-3
---6----"t~ 6
2500C (b) Strain Amplitude: o 6% SuHur: 0 012 or 0 015 wt%
0 6
Strain Rate (0k's} 0 0004 ll 0 01
1Q•2
0
1Q•1
0
0 0
Dissolved Oxygen (ppm)
Figure 57. Dependence on DO of fatigue. life of carbon steel
minimum DO level of 0.05 ppm, above which environment decreases the fatigue life of the steel. The effect of DO content on fatigue life saturates at 0.5 ppm, Le., increases in DO levels above 0.5 ppm do not cause further decreases in life. In Fig. 57, for DO levels between 0.05 and 0.5 ppm, fatigue life appears to decrease logarithmically with DO. Estimates of fatigue life from a trained ANN also show a similar effect of DO on the fatigue life of CSs and LASs. 93
4.2.5 ·Sulfur Content in Steel
It is well known that sulfur content and morphology are the most important materialrelated parameters that determine susceptibility of LASs to environmentally enhanced fatigue crack growth rates.64.65.69-71 A critical concentration of s2~ or HS- ions is required at the crack tip for environmental effects to occur. Corrosion fatigue crack growth rates are controlled by the synergistic effect of sulfur content, environmental conditions, and flow rate. Both the corrosion fatigue growth rates and threshold stress intensity factor .6Kth are a function of the sulfur content in the range 0.003-0.019 wt.%.70 The probability of environmental enhancement of fatigue crack growth rates in precracked specimens of LASs appears to diminish markedly for sulfur contents <0.005 wt. %. The fatigue S-N data for LASs also indicate a dependence of fatigue life on sulfur content. When all the threshold conditions are satisfied, environmental effects on the fatigue life increase with increased sulfur content (Fig. 58). The fatigue lives of A508-Cl3 steel with 0.003 wt.% sulfur and A533-Gr B steel with 0.010 wt.% sulfur are plotted as a function of strain rate in Fig. 59. However, the available data sets are too sparse to establish a functional form for dependence of fatigue life on sulfur content and to define either a lower threshold for sulfur content below which environmental effects are unimportant or an upper limit above which the effect of sulfur on fatigue life may saturate. A linear dependence of fatigue life on sulfur content has been assumed in correlations for estimating fatigue life of CSs and LASs in· LWR environments;27,28 Limited
. data ·suggest that environmental effects on fatigue life may saturate at sulfur contents above 0.012 wt.%. e.g., in Fig. 58, A302-Gr B steel with 0.027 wt.% sulfur and A533-Gr B steel with 0.012 wt.% sulfur yield identical fatigue lives-in water at 288°C and ""0.7 ppm D0.24
51 .NUREG/CR-6583
OAGI0000759 00069

.,; "0
. € a. ~ c:
~
'I "I
low-Alloy Steel 2ss•c 8 ppm Dissolved Oxygen
• .. m::o• --~ •
... ,'1 ""
0 A508-CI 3 (0.003wt % S)
<> A533-Gr 8 (0 010 wt% S)
eo ~•. 0 • <> :.
en Strain Rate (%fs) 0 11- Open Symbols: 0.004
Closed Symbols: 0 4
uul uul
Fatigue Life, N25
""I low-Alloy Steel 2ss•c ..0 8 ppm Dissolved Oxygen
• <>9 ••
"I
0 A533-Gr B (0.012wt.% S)
<> A302-Gr B (0027wt% S)
0 ., .o Strain Rate (%Is}
::- Open Symbols: 0.004 Closed Symbols: 0 4
.. 1 .,1 ,I
1 o1 1 o2 1 o3 1 o4 1 o5 Fatigue life, N:?s
-
-
Figure 58. Effect of sulfur content on fatigue life of low-alloy steels in high-dissolved-oxygen water at 288°C
0 A508-C13 (0 003 wl/% S) V ~r 8 (0 01:0 wl/% S}
Strain Rate ("'ois)
A333-Gr 6 Carbon Steel 2aa•c 8 ppm Dissolved Oxygen
.;1 01:-~ ~ a. !t c: ·~
Oaf
Ci5 0 1
Strain Rata (o/o/s) -t"" Open Symbols: o 004
Closed Symbols: 0 ~.I
• -Fatigue Life, N25
Sulfur (wt %) v 0002 <> 0006 0 0012 .... 0015
•
,I
1ri>
Figure 59. Effect of strain rate on fatigue Ufe of lowalloy steels with different sulfur contents
Figure 60. Effect of sulfur content on fatigue life of carbon steels in high-dissolved-oxygen water at 288°C
In contrast to LASs, the existing fatigue 5-N data for CSs indicate significant reductions in fatigue life* of some heats of steel with sulfur levels as low as 0.002 wt.%. The fatigue lives of A333-Gr 6 CSs with sulfur contents in the range of 0.002-0.015 wt.% in high-DO water at 288°C are plotted in Fig. 60: the lives of these steels at 0.6% strain amplitude are plotted as a function of strain rate in Fig. 61. Environmental effects on the fatigue life of these steels seem to be independent of sulfur content in the range of 0.002-0.015 wt.%.
• M. Higuchi, presented at the Pressure Vessel Research CouncU Meeting. June 1995. Milwaukee.
NUREG/CR-6583 52
OAGI0000759 00070

A333-Gr 6 Carbon Steel 288°C ' Strain Amplitude: 0 6% 8 ppm Dissolved Oxygen ---------···t·------- ----·-·!
: : i i
........ ·:l· , Figure 61. ! i
- ~-- -·- -- -
I Strain Rate (%/s)
Fast/Fast
A
~
Strain or Stroke Control Air: 4740±1250 cycles PWR: 1965±385 cycleS High DO: • 2077 cycles
l i !
··· ·suifur.(wt %)
0 0006 v 0012 h 0002
Effect of strain rate on fatigue life of A333-Gr 6 carbon steels with different sulfur contents
•04 -02 0 02 04
Strain(%)
Hold Period r. Paal< Tonsile S8ain
n n n' n n ·,..
Strain Control . Air: 6,275 cycles
' . '
!:
a.. -oz o o2 04 Strain(%)
Hold Period a1 PGB Tensile Strain
nnnnnr
~
Stroke Control (5-min hold} Air: 2592 cycles High DO: 1007, 1092 cycles Stroke Control (3D-mln hold) High DO: 840 cycles
Figure 62. Fatigue life of Al 06-Gr B steel iri eur and water environments at 28B°C, o. 75% strain range, and hold period at peak tensile_strain. HysteresiS loops ·are for tests in air.
. .. ' - • i .~ • • . . ~ -.
4.2.6 Tensile Hold Period
· Fatigue data indicate that a hold peiiod at peak tensile strain decreases fatigue life in high-DO water but not in air. Loading wavefoms, hysteresis loops, and fatigue lives for the
·tests are shown in Fig. 62. ,.A· 300-s hold period is sufficient to reduce fatigue life; a longer hold period. results in life only slightly decreased from 'that with a son.:..s-hold period. Two 3oo-s-hold tests at 2S8°C and ""0.8% stratn range.inoxygenated water Y-rith 0.7 ppm DO gave fatigue lives of 1.007 and 1,092 cycles. Fatigue life in a 1800-s-hold test was 840 cycles. These tests were conducted in stroke-controlmode and are somewhat different than the conventional hold-time test in strain-control mode. In the strain-control test, the total strain in the sample is held constant during the hold period. However, a portion of the elastic strain
53 NUREG/CR-6583
OAGI0000759 00071

is converted to plastic strain because of stress relaxation. In a stroke-control test, there is an additional plastic strain in the sample due to relaxation of elastic strain from the load train (Fig. 62). Consequently, these are not true constant-strain-hold periods and significant strain changes occur during the hold period; the measured plastic strains during the hold period were ::0.028% from relaxation of the gauge and 0.05-0.06% from relaxation of the load train. These conditions resulted in strain rates of 0.005-0.02%/s during the hold period. The reduction in life may be attributed to the slow strain rates during the hold period.
....... 1 . c <II
w ai '0
.~ c. E ~ c:
~ CJ)0.1
ANL Strain Rate~ o 0.4%/s v 0.004%/s x 00004%/s
Terrel Freq. o 1Hz A 0.1 Hz o 0017 Hz
<10 ppb DO 1 000 ppm Boron 2 ppm Lithium Open Symbols: A533-Gr B Closed Symbols: A302-Gr B Crossed Symbols: w/o B & U
Strain Rate (%/s)
0 0.410.4 A 0.004/0.4 0 0.4/0 004
Best-RI Curve
Fatigue Ufe, N25 Fatigue Life, N25
Figure 63. Strain amplitude vs.fatigue life datafor Al06-Gr Band A533-Gr B steels in simulated PWR water at 288°C
4.2.7 Low Dissolved Oxygen
With a few exceptions, only a moderate decrease in fatigue life of carbon and low-alloy steels has been observed in water when any one of the threshold conditions is not satisfied, e.g., low-DO PWR environments. 7.10-14,89,90 The fatigue life of CSs and LASs in simulated PWR water is shown in Fig. 56. For both steels, fatigue lives in a PWR environment are lower than those in air by a factor of less than 2. The exception to this behavior are the high-s -steels, whichexbibit enhanced crack growth rates in PWR water.34 Limited data indicate that heats of high-s steels that have unfavorable sulfide distribution and morphology, fatigue life may decrease by moi-e than a factor of 2 in low-DO PWR water (see next section).
In low-DO water, the effects of strain rate are similar to those in air; heats of CS and LAS that are sensitive to strain rate in air, also show a decrease in fatigue life in PWR water with
-decreasing strain rate. In air, the fatigue life of some heats decreased by a factor of =4 when strain rate decreased from 0.4 to 0.004%/s, e.g .. the A302-Gr B steel tested in the radial orientation (Fig. 42), whereas for other heats, a decrease in the strain rate by three orders of magnitude did not cause any additional decrease in fatigue life, e.g., ANL heats of Al06-Gr B and A533-Gr B steel in Fig. 40. However, certain orientations of high-S steels that have an unfavorable sulfide distribution and morphology may exhibit strain rate effects larger than those in air because of the contribution of the environment.
NUREG/CR-6583 54
OAGI0000759 00072

· 4.2.8 Orientation
In air, some steels exhibit very poor fatigue properties in the transverse orientation because of structural factors such as the distribution and morphology of sulfides. In air, the effect of strain rate on fatigue life can also be larger for these orientations than for other orientations. Limited data indicate that orientation may also influence growth rates of CSs and LASs in LWR environments. As discussed in Section 3.2. a critical concentration of s2- or HS- ions. which are produced by the dissolution of sulfide inclusions in the steel, is required at the crack tip for environmental effects to occur. Therefore, the distribution, morphology, and size of sulfide inclusions and the probability ·of advancing crack to intercept these inclusions are important parameters that influence' growth rates of CSs and LASs in LWR environments.
The fatigue lives of A302-Gr B steel in the rolling (R). transverse (Tl), and radial (T2) orientations in air and low- ·and high-DO water at 288°C are shown in Fig. 64. The relative life (ratio of life in water and air) is plotted as a function of strain rate in Fig. 65. The size and distribution of sulfide inclusions for the three orientations are significantly different, Fig. 4 .
. The results indicate that in high-DO water (0.6-0.8 ppm DO), the fatigue life of A302-Gr B · steel is insensitive to the differences in sulfide distribution and size; life for both the Rand Tl
-- 1.0 ~ ~
"' w a) "0 ::1
:a E < c: §
U5 0.1
. A302-Gr B Low-Alloy Steel 288°C Simulated PWA Water 0.004%/s Strain Rate
' ' -' • b. ---. -·6 Rolling (R)
0 Radiai(T2) 0 Transverse (T1)
Open Symbols: Water Closed Symbols: Air
Best-Fit Air R & T1 Orientations 0.4 %/s Strain Rate
/ ...
-... --,----------
A302-Gr B LOW-'AIIoy Steel c 288°C .- .. Simulated PWR Water 0.4%/s Strain Rate
Best-Fit Air ' ' R & T1 Orientations
. 0 4 %/s Strain Rate
/ ~--· --~ >
6 Rolling (A) . 0 · ·Radial (T2)
.o · Transverse (T1)
Open Symbols: Water · Closed Symbols: Air
--- --~ --- --· -··-. '
1o2 103 104 1oS Fatigue Life, N25
1 o7 1 o2 1 o3 1 o4 1 o5
Fatigue Life, N25
"' w a) "0
-~ Ci E < c
:<a
~ 0.1
--r 1 1 111111 r-r-r llJTlf --r rllurq-..--rnTI"11&--r-r T niT
A302-Gr B Low-Alloy Steel 288°C c.
0.6-0 8 ppm DO Water 0.004%/s Strain Rate · ·
Ot;
0~0
. '
6 Rolling (R) . o Radial (T2) o Transverse (T1)
Open Symbols: Water Closed Symbols: Air
Best-Fit Air R & T1 Orientations · ' ' 0.4 %/s Strain Rate
/. -- .... ----, ·-· -.-- ~-- ~
Best-Fit Air T2 Orientation 0.4 o/ols Strain Rat
103 1o4 10S Fatigue Ufe, ~5
55
Figure 64. , _ Effect of material orientati~m on fatigue life
. of A302-Gr B low-alloy steel in high
. dissolved-oxygen water and simulated .PWR environments
NUREG/CR-6583
OAGI0000759 00073

~~~-!l Sieel 1 ! '!
~ 1 00 1:- • r···· -- _@- -- ~------ -- ~- ~-r~ :~~·.-G-.. . -
~ l l l -~ ~ l 0 I / -t-Q) 1 o·1 l:- l - -;;--t· - ·l -~ l .- • . ~ o Roll'ing (A) £ l ! <> Transverse (T1)
j bpen Symbols:;PWRWater l ~losed Symbol~: High-DO W?-ter
1 0-2...._-'--'-'-'-.Lll.Loi...._-'-'_,_,_.LJ-UJ, ''---'--'-L.J...LJ-UJ"'--.1-J.....L..L.Ju.J.U."--'
1~ 1~ 1~ 1~ 1~ Strain Rate (%/s)
:-
'! A302-B Steel 28B°C
I .. I
1 o-4 1 o·3
.I ! : I
t:. Ra~ial (T2)
Open Symbols: PWR Water slosed Symbo~f High-DO ~fter
Strain Rate (%/s)
Figure 65. Relative fatigue lives of different orientations of A302-Gr Blow-alloy steel in highdissolved-oxygen water and simulated PWR environments
orientations is a factor of o:l4 lower than in air. However, in PWR water, larger sulfide inclusions rimy result in a larger decrease in life, e.g., life in Tl orientation shown as diamonds in Fig. 65.
Metallographic examination of the specimens indicates that structural factors are responsible for poor fatigue resistance of the radial orientation. The fracture surface and longitudinal section of A302-Gr 8 steel in the T2 orientation tested in PWR water at 288°C, ==0.75% strain range, and slow/fast waveform are shown in Fig. 66. The longitudinal section of the specimen shows an abundance. of cracks that connect the sulfide stringers. These cracks are present throughout the specimen away from the fracture surface. A fatigue crack propagates preferentially along these sulfide stringers; the fracture surface contains several fractured sulfide stringers. These results suggest that environmental effects on fatigue life are not necessarily cumulative: the reduction in life due to environment alone may be small for those steels that have inherently low fatigue life in air because of microstructural or other factors.
4.2.9 Temperatures below 150°C
As discussed in Section 4.2. 7, only a moderate decrease in fatigue life of carbon and lowalloy steels is observed in water when any one of the threshold conditions is not satisfied, e.g., temperatures below 150°C or low-DO PWR environments. 7,Io-I4,89,90 The fatigue lives of CSs and LASs in water at <150°C are shown in Fig. 67. The results show only a moderate decrease in fatigue life in water at temperatures below the threshold value of 150°C. At these temperatures, life in water is 30-50% lower than in room-temperature air. The fatigue life of A333-Gr 6 carbon steel in water at 100 and 150°C, 0.6% strain amplitude, and 0.004%/s strain rate is plotted as a function of DO in Fig. 68. At these temperatures, the fatigue life of the steel does not change even when the DO level is increased from 0.005 to 1 ppm.
NUREG/CR-6583 56
OAGI0000759 00074

Figure 66. SEM photomicrograph of fracture ·surface (A) and longitudinal section (B) of A302-Gr B steel specimen in T2 orientation tested in PWR water at 288°C, =0. 75% strain range, and slow /fast waveform
0 1
Carbon Steels
o 25"C o · too•c
Best-Fit. Room Temp pjr
Best-Fit <1500C Water
Fatigue Lile, N25
-·-:--·
Low-Alloy Steels
. ,-;
Best-Fit· Room Temp pjr ..
0 25"C tJ. so•c o too•c
. 1 o6
'-·
Figure 67. Experimental and-predicted fatigue lives of .Al 06..:.0r B and A533-Gi B steels in water at terriperatu.res below· J 50°C . · . . · · · '· ::
57 NUREG/CR-6583
OAGI0000759 _ 00075

A333-Gr 6 Carbon Steel l ~ ! ~ i : :
Strain Amplitirda: 0.6% Sulfur: 0 012 wt.% Strain Rata: ? 004 %/s
o ... !... e $ ~~~ !
~--~ ~
I I o 1oolc... .L .. .6. 150"C ·l •• • •1• • o ••u
1 o·2 1 o·1 1 oo Dissolved Oxygen (ppm)
5 Statistical Model
5.1 Modeling Choices
FigtUe 68. Fatigue Ufe of A333-Gr 6 carbon steel as a function of dissolved oxygen in water at 100 and 150°C
In attempting to develop a statistical model from incomplete data and where physical processes are only partially understood, care must be taken to avoid overfitting the data. Different functional forms of the predictive equations (e.g., different procedures for transforming the measured variables into data used for fitting equations) were tried for several aspects of the model. Fatigue S-N data are generally expressed by Eq. 1.1, which may be rearranged to express fatigue life N in terms of strain amplitude ea as
ln(N) = (lnB -ln(ea - A)]/b. (5.1)
Additional terms may be added to the model that would improve agreement with the current data set .. However, such changes may not hold true in other data sets, and the model would typically be less robust, i.e., it would not predict new data well. In general, complexity in a statistical model is undesirable unless it is consistent with accepted physical processes. Although there are statistical tools that can help manage the tradeoff between robustness and detail in the model, engineering judgment is required. Model features that would be counter to known effects are excluded. Features that are consistent with previous studies use such results as guidance, e.g .• defining the threshold or saturation values for an effect, but where there are differences from previous findings, the reasons for the differences are evaluated and an appropriate set of assumptions is incorporated into the model.
5.2 least-Squares Modeling within a Fixed Structure
The parameters of the model are commonly established through least-squares curvefitting of the data to either Eq. 1. 1 or 5.1. An optimization program sets the parameters so as to minimize the sum ofthe square of the residual errors, which are the-differences between the predicted_ and actual values of Ea or ln(N). A predictive model based on least-squares fit on ln(N) is biased for low Ea; in particular, runoff data cannot be included. The model also leads
NUREG/CR-6583 58.
OAGI0000759 00076

to probability curves that converge to a single value of threshold strain. However, the model fails to address the fact that at low Ea. most of the error in life is due to uncertainty associated with either measurement of stress or strain or variation in threshold strain caused by material variability. On the other hand, a least-squares fit on Ea does not work well for higher strain amplitudes. The two kinds of models are merely transformations of each other, although the precise values of the coefficients differ. ' ,
-c Ax Data Point .. ~ 1.0 Q) "0
:e a. E <(
c: !§ (i)
0.1
1 o1 1 o2 1 o3
1 o4 1 o5
'
Cycles to Failure. N25
Figiire69. Schematic of least-squares curve-fitting
.. of data by minimizing sum of squared Cartesian distances from data points to predicted curve
The statistical models27,28 were developed by combining the two approaches and , minimizing the sum of squared Cartesian .distances from the data points to the predicted curve (Fig. 69). For low Ea. this is very close to optimizing the sum of squared errors in predicted Ea: at high Ea. it is very close to optimizing the sum of squared errors in predicted life; and at medium Ea. this model combines both factors. However, because the model includes many nonlinear transformations of. variables and because different variables affect different parts of the data, the actual functional form and transformations are partly responsible for minimizing the squares of the errors .. Jbe functional forms and transformation are chosen a priori, and no direct computational means exist for establishing them.
To perform the optimization, it was necessary to normalize the x and y axes by assigning relative weights to be used in combining the error in life and strain amplitude because x and y axes are not in comparable units. In this analysis, errors in strain amplitude(%) are weighted 20 times as heavily as errors in ln(N); A value of 20 was selected for two related reasons. First, this factor leads to approximately equal weighting of low- and high-strain-amplitude data in the least-squared error computation of model coefficients. Second, when applied to the model to generate probability curves, it yielded a standard deviation on strain amplitude comparable to thaf obtained ·from the 'best-fit of the high cycle fatigue data to Eq. 1.1. Because there is necessarily judgment applied in the selection of this value, a sensitivity analysis was performed, and it showed that the coefficients of the model do not change much for weight factors between 10 and 25. Dist~ce from the curve was estimated as
. .
{ 2 . 2}1/2
D = (x-x) +[k(y-y)] .. (5.2)
· where x and y represent predicted values, arid k = 20.
59 NUREG/CR-6583
OAGI0000759 00077

5.3 The Model
Based on the exis~ng fatigue 5-N data base, statistical models have been developed for estimating the effects of material and loading conditions on the fatigue lives of CSs and LASs.27,28 The dependence of fatigue life on DO level has been. modified because it was determined that in the range of 0.05-0.5 ppm, the effect of DO was more logarithmic than linear.45,93 In this report, the models have been further optimized with a larger fatigue 5-N data base. Because of the conflicting possibilities that with decreasing strain rate, fatigue life may either be unaffected, decrease for some heats, or increase for others, effects of strain rate in air were not explicitly considered in the model. The effects of orientation, i.e., size and distribution of sulfide inclusions, on fatigue life were also excluded because the existing data base does not include information on sulfide distribution and morphology. In air, the fatigue data for CSs are best represented by
ln(N2sl = 6.595- 1.975 ln(Ea- 0.113) - 0.00124 T {5.3a)
and for LASs by
ln(N2sl = 6.658- 1.808 ln(ea- 0.151)- 0.00124 T. (5.3b)
In LWR environments, the fatigue data for CSs are best represented by
ln{N25) = 6.010- 1.975 ln{ea- 0.113) + 0.101 s• T* o• e* {5.4a)
and for LASs by
ln{N25) = 5.729- 1.808 ln(ea- 0.151} + 0.101 s• T* o• e*, {5.4b}
where s•, T", o•, and- t• = transformed sulfur content, temperature, DO, and strain rate, respectively, defined as follows:
S*=S s* = o.o15
T*=O T" =T- 150
o• =O
o· = ln(D0/0.04) o· = ln( 12.5)
e.·= 0; e.·= ln(e) e* = ln(O.OOl}
(0 < s :5 0.015 wt.%) (S >0.015 wt.%)
(T <150°C) {T = 150-350°C)
(DO <0.05 ppm) (0.05 ppm :5DO :50.5 ppm) (DO >0.5 ppm)
(e >1 %/sl (0.001 se :51 %/s) (e <0.001 %/s)
{5.5a)
(5.5b}
(5.5c)
(5.5d)
The functional form and bounding values of the transformed parameters s·. T". o·. and e* were based upon experimental observations and data trends discussed in Section 4.2. Significant features of the model for estimating fatigue life in LWR environments are as follows:
NUREG/CR-6583 60
OAGI0000759 00078

·(a) : The model assumes that environmental effects on fatigue life occur primarily during the tensile-loading cycle; minor effects during the, compressive loading cycle have been excluded. Consequently, the loading and environmental conditions, e.g., temperature, strain rate, and DO, during the tensile-loading cycle are used for estimating fatigue lives.
(b) When any one of the threshold condition is not satisfied, e.g.; <0.05 ppm DO in water, the effect of strain rate is not considered in the model, although limited data indicate that heats of steel that are sensitive to strain rate in air also show a decrease in life in water with decreasing strain rate.
(c) The model assumes a linear dependence of S* on S content in steel and. saturation at 0.015 wt.% s.
The model is recommended for predicted fatigue lives of :::;;IQ6 cycles. For fatigue lives of 106 to 108 cycles, the results should be used with caution because, in this range, ~e model is based on ve:ry limited data obtained from relatively few heats of material.
The estimated and experimental 8-N curves for CS and LAS in air at room temperature and 288°C are shown in Fig. 70 .. The mean curves used in developing the ASME Code design curve and the average curves. of Higuchi and lida 7 are also included in the figure. The results indicate that the ASME mean curve for carbon ste(!lS is not co~~istent with the experimental data; at strain amplitudes <0.2%, the mean curve predicts significantly lower fatigue lives than
.·those observed experimentally. The estimated curve for low-alloy steels is comparable with the ASME mean curve. For both steels, Eq. 5.3 shows good agreement. with the average curves of Higuchi and !ida.
0. 1 Carbon Steel
Room Temp. Air
A Data used to define ASME Mean Curve
o OtherData --Statistical Model · - - - - - ASME Mean Curve - - - - - Higuchi & lida·
nf · 1<f 106
Cycles to Failure, N25
' " . .
Cycles to Failure, N25
Figure 70. Fatigue &-N behavior for carbon and low-alloy steels estimated from model and determined experini.entally in air at room ·temperature
.. \ ; .
5.4 'Distribution of Fatigue Life
For a given steel type. the average distance of data points from the mean curve does not va:ry much for different environmental conditions. To develop a distribution on life, we start with the assumption that there are three sources of prediction error: (a) measurement errors
61 NUREG/CR-6583
OAGI0000759 00079

for the applied strain amplitude, {b) variations in the threshold strain amplitude due to material variability, and (c) errors due to uncertainty in test and material conditions or other unexplained vanation. Because measurement errors are small at· high strain amplitudes, the standard deviation of distance from the mean curve at high strain amplitudes is a good measure of the scatter in fatigue life due to unexplained variations. At low amplitudes where the 8-N curve is almost horizontal, the errors (as measured by the distance from the mean curve) are dominated by the variation in strain amplitude. The standard deviation of the error in strain amplitude was taken to be equal to the standard deviation in the predicted fatigue life divided· by a factor of 20 consistent with the weighting factor used for optimization. The standard deviation on life was 0.52 for CSs and LASs. These results can be combined with Eq. 5.3 to estimate the distribution in life for smooth test specimens. In air, the xth percentile of the distribution on life N2slxJ for CSs is
ln(N25l = 6.595 + 0.52 F-l[x)- 1.975 ln(Ea- 0.113 + 0.026 F-1[1-x))- 0.00124 T
and for LASs it is
ln(N2sl = 6.658 + 0.52 F-l[x)- 1.808ln(Ea- 0.151 + 0.026 F-1[1-xll- 0.00124 T.
In LWR environments, the xth percentile of the distribution on life N2slx) for CSs is
ln(N2sl = 6.010 + 0.52 F-l[x)- 1.975ln(Ea- 0.113 + 0.026 F-1[1-x)) + o.1cn s• T" o• e*
and for LASs it is
ln(N2sl = 5.729 + 0.52 F-l(x)- 1.808ln(Ea- 0.151 + 0.026 F-1[1-x)) + o.101 s·r o· e*.
(5.6a)
(5.6b)
(5.7a)
(5.7b)
The parameters S*, T*, o•. and e* are defined in Eqs. 5.5, and p-1[.) denotes the inverse of the standard normal cumulative distribution function. The coefficients of distribution functions F-l[x] and F-1(1-x) represent the standard deviation on life and strain amplitude, respectively. For convenience, values of the inverse of standard normal cumulative distribution function in Eqs. 5.6 and 5. 7 are given in Table 3. The standard deviation of 0.026 on strain amplitude obtained from the analysis may be an overly conservative value. A more realistic value for the standard deviation on strain could be obtained by analysis of the fatigue limits of different heats of material. The existing data are inadequate for such an analysis because (a) not enough heats of materials are included in the data base, and (b) there are very few high-cycle fatigue data for accurate estimations of the fatigue limit for specific heats.
The estimated probability curves for the fatigue life of CSs and LASs in an air and LWR environments in Figs. 7l-73 show good agreement with experimental data; nearly all of the data are bounded by the 5% probability curve. Relative to the 50% probability curve, the 5% probability curve is a factor of :::::2.5 lower in life at strain amplitudes >0.3% and a factor of l.4-1.7lower in strain at <0.2% strain amplitudes. Similarly, the 1% probabilitycurve is a factor of ===3. 7lower in life and a factor of 1. 7-2.2 lower in strain.
NUREG/CR-6583 62
OAGI0000759 00080

TableS. Inverse of stcinclard cwriulative distribution function
Probability r 1Jx]
0.01 -3.7195
0.02 -3.5402
0.03 -3.4319
0.05 -3.2905.
0.07 -3.1947
0.10 ·3.0902
0.20 -2.8782
0.30 -2.7478
0.50. -2.5758
0.70 -2.4573
1.00 -2.3263
2.00 -2.0537
0.1 0 Room Temp
r-111-xl
3.7195
3.5402
3.4319
3.2905
3.1947
3.0902
2.8782
2.7478
2.5758
2.4573 <
2.3263
2.0537
Probability of Crack Initiation
-·-.--1% ---5%
-. -·-Cycles to Failure, ~5
·A106-B & A333-6 288°C Air Probability of
Crack Initiation
-·-·-1%
-·-
Probability
3.00
5.00
7.00·
10.00
20.00
30.00
50.00
65.00
80.00
:90.00
95.00
98.00
0
0
r 1Jx]
-1.8808
-1.6449
-1.4758
-1.2816
-0.8416
-0.5244
0.0000
0.3853
0.8416
1.2816
1.6449
2.0537
1 o4 ·' .·
r-1(1-x]
1.8808
1.6449
1.4758
1.2816
0.8416
0.5244
0.0000
-0.3853
-0.8416
-1.2816
-1.6449
-2.0537
Probability of Crack Initiation
----·1% -- ·5% -- ·25% --50%
Cycles to Fail~re, ~5
Probability of Crack Initiation
-.-. ·1% ---So/o
102 1oa 104 105 ·1o6 1·102 1o3. 104 1o5 106 Cycles to Failure, N:15 Cycles to Failure, ~5
FYgure 71. Experimental data and probability of fatigue cracking in carbon and low-alloy steel test specimens in air
63 NUREG/CR-6583
OAGI0000759 00081

0.1
A106-B & A333-6 Carbon Steels
........
-----1 "'o -- -5"/o -- -25%
1 o2 1 o4
DO ~0.05 ppm Temp 25-'!00"C Strain Rate (%/s)
0 ~0 2 A •0.01 0 ~0004
A533-B & ASOB-3 Low-Alloy Steels
"
---5% - --25% ---50% -----95%
1 o2
DO ~0.05 ppm Sulfur 0.003-0.012 wt% Temp. 10o-2900C Strain Rate (o/o/s)
0 04 A 0 01 0 0.004
Cycles to Failure, ~5 Cycles to Failure, ~5
Figure 72. Experimental data and probability of fatigue cracking in carbon and low-alloy steel test specimens in simulated PWR envirorunents
c:
~ en 0 1
r-~~~nrl--ro ,o-ro niiTIImllr-,o~o,l~l~l~limoi--
A106-B & A333-6 • Carbon Steels
............
----50% -----95%
D0~5ppm Temp 2sa•c Strain Rate 0.4o/o/s Sulfur 0 012-Q 015 wt%
1o3 104 1o5 Cycles to Failure, ~
A106-B.& A333-6 D0~.5ppm Temp. 2SSOC • Carbon Steels "" '
- - - -- 1,% ---5%
Strain Rate 0.004o/ols Sulfur 0.012-o 015 wL o/o
- - -25% 0.1 .---50%
-----95"/o ·-·-1 o3 1 o4 1 o5
00~.5ppm Temp. 288"C Strain Rate 0.4%/s Sulfur 0.010-Q 012 w1%
1o2 1o3 104 1o5
- - - 25"/o ---50% -----95%
1 o1 1 o2
Cycles to Failure, ~5
1 o3
00~5ppm Temp 2aa•c Strain Rate 0.004%/s Sulfur 0 010-Q.012 wt "'o
---
1 o4
Cycles to Failure, ~5 Cycles to Failure, ~5
1 o6
1 o5
Figure 73. Experimental data and probability of fatigue cracking in carbon and low-alloy steel test specimens in high-dissolved-oxygen water
NUREG/CR-6583 64
OAGI0000759 00082

-------------------------------
As with other aspects of this model, the estimates of the probability of cracking should not be extrapolated much beyond the data. The probabilities assume a normal distribution, which is consistent with the data for most of the range. The existing data are not sufficient to determine precise distributions because more data are required to estimate distributions than to estimate the mean curve. However, the assumption of normality is reasonable (and ·conservative) down to 0.1-1% probability of cracking and it is empirically verified by the number of data points that fall below the respective curves. The probability is not expected to deviate significantly-from the normal curve for another order of magnitude (one more standard deviation) even if the probabilitY distribution is not the same·. Because estimates of extremely low or high probabilities are sensitive to the choice of distribution, the probability distribution curves should not be extrapolated beyond 0.02% probability.
6 Fatigue Life Correction Factor
An alternative approach for incorporating the effects of reactor coolant environments on fatigue 5-N curves has been proposed by the E~vironmental Fatigue Data (EFD) Committee of the Thermal and Nuclear Power Engineering Society (TENPES) of Japan.• A fatigue life correction factor Fen is defined as the ratio of the life in air at room temperature to_ that in water at the service. temperature. The fatigue usage for a specific load pair based on the current Code fatigue design curve is multiplied by the correction factor to account for the environmental effects.· Note that the fatigue life correction factor does not account for any differences that might exist between the current ASME mean air curves and the present mean air curves developed from a larger data base. The specific expression for Fen. proposed initially by Higuchi and lida, 7 assumes that life in the environm~nt Nwater is related to life in air Nair at room temperature through a power-law dependence on the strain rate
F _ Nair _ ( · )-P en- -e •
· Nwater · (6.1a)
(6.1b)
In air at room temperature, the fatigue life Nair of CSs is expressed as
ln(Natr) = 6.653 -· 2.119 ln(E~ - 0.1 08} (6.2a}
and for lASs by
ln(Natr) = 6.578- 1.761ln(Ea- 0.140), (6.2b)
w}1ere .€a is the applied strain ampli~ude (%). Only the tensile loading cycle is considered to be important for environmental effects on fatigue ·life. The exponent P is a product of a environmental factor Rp. which depends on temperature T (0 C) and DO level (ppm), and a material factor.Pc, which depends on the ultimate tensile strength cru (MPa) and sulfur content s (wt/.%) ofthe steel,- Thus' .
(6.3a)
• Presented at the Pressure Vessel Research Council Meeting, April 1996, Orlando, FL.
65 NUREG/CR-6583
OAGI0000759 00083

Pc = 0.864- 0.00092 <Ju + 14.6 S, (6.3b)
RpT -0.2 ( ) RP = In 00 + 1.75RpT -0.035,
2.64 0.2 :=; Rp :=; RpT (6.3c)
and RpT == 0.198 exp(0.0055711. (6.3d)
The fatigue lives of carbon and low-alloy steels measured experimentally and those estimated from the statistical and EFD models are shown in Figs. 74-78. Although the EFD correlations for exponent P were based entirely on data for carbon steels, Eqs. 6.3a-6.3d were also. used for estimating the fatigue lives of LASs. Also, au in Eq. 6.3b was assumed to be 520 and 650 MPa, respectively, for CSs and LASs. The significant differences between the two models are as follows:
(a) The EFD correlations have been developed from data for CSs alone.
0.1
A 1 06-B Carbon Steel ·
0 004%/s
S Content {wt %) Open Symbols: 0.020 Closed Symbols: 0 015 Crossed Symbols: 0 007
1 o4
28B"C, <0.01 ppm DO Strain Rate (%/s)
0 ~0 4 "V ·0 2 o -o 02 6. s:o 004
Estimated Curves -- Statistical Model - · - • · EFD Model
1 os
Fatigue Life, N25
Low-Alloy Steels
t l Strain Rate (%/s)
Open Symbols: 0 4 : ~ Closed Symbols: 0.004
~ 1 o7 1 o2
2ss•c, <0 01 ppm oo 0 A533-B (0 015% S) to. A302-B (0 024% S 0 ASOB-2 (0 011% S) Estimated Curves -- Statlstlcal Model - - - • • EFD Model
1 os
Fatigue uta, N25
Figure 74. Experimentalfatfgue lives and tlwse estimatedjrom statistical and EFD models for carbon and low-alloy steels in simulated PWR water
0.1
Statistical Model , • : • / All Strain Rates
fl.~>
o 2s•c to. 1oo•c o 4%/s o too•c o 004%/s
EFDModel 0 4o/ols Strain Rate
EFDModel 0 004%/s Strain Rate
'to / ...... to. <> .............
Fatigue lile, N25
1o3
A508·3 (0 003% S) 100•c Asos-3 (0.003% S) 1so•c Asos-2 (0011% S) too•c A533-B (0 015% S) 2s•c
Estimated Curves
-- Statistical Model - ·- • • EFOModel
Fatigue life. N25
Figure 75. Experimentalfatfgue lives and tlwse estimatedfrom statistical and EFD models for carbon and low-alloy steels in water at temperatures below 150°C
NUREG/CR-6583 66
OAGI0000759 00084

0.1
0.1
0.1
A106-B Carbon Steel 288•C, >0.5 ppm DO 0 015 wt.o/. s Strain Rate (%/s)
0 0 4 A 0 004 <> 0 0004
Fatigue Life, N25
A333-6 Carbon Steel
1o4
2sa•c, >0 5 ppm oo 0.012 wt% s -Strain Rate (%/s) .
0 0 4 A 0.04 <> 0 004
Fatigue lite, N25
-Estimated Curve --- Statistical Model - ·- • • EFDModel
1o4 Fatigue Life, N25
A533-B Low-Alloy Steel
0 04 A 0 004 <> 0.0004
l '-~.·,__ ...... · ... <? .....
Estimated Curves for ~:=::;~~~~!J:.:;:==J the three Strain Rates
--- Statistical Model - ·- • ·.EFDModel
Fatigue Life, N25
ASOB-3 Low-Alloy Forging
~ Estimated Curves for the three Strain Rates
--- Statistical Model - ·- • • EFOModel
1 os 1 o1 1o3 1o4
2ss•c, a ppm oo 0.003 WI% S Strain Rate (%fs)
0 0 4 A 0 04 <> 0 004
Fatigue lite, N25
Estimated Curves for the three Strain Rates
--·-- Statistical Model - ·- • • EFOModel Closed Symbols: Thermally Aged
. 1 o3.
0 0.4 . A 0 004
<> 0 0004
Fatigue Life, N25
Figure 76. Experimentalfatigue lives and those estimatedfrom statistical and EFD models for carbon and low-alloy steels in high-dissolved~xygen water
67 ·NUREG/CR-6583
OAGI0000759 00085

.A333-6 Sieel 250"C . Strain Amr=0.6%, S=r015 wt.%
() 01 ppmj \
....... ---J- ·. ~ : .. -:. r· .... -·: ~-~--~c-.: .. ~ ·... .. 02ppm~ .:-·
~ _, .
Strain Rate (%/s)
A333-6 (0 012% S) <> ·a
-· - Statisiical Model - ·- • • EFDModei
1 o·2 1 o-1
Strain Rate (o/ols)
1 oo
Figure 77. Dependence on strain rate of fatigue life of carbon steels obseroed experimentaUy and that estimatedfrom statistical and EFD models
to-3
A333-6 Steel 250"C Strain Amplitude: 0.6%
-- Statistical Model - ·- ·- EFDModel
Strain Rate (•kJs) 0 0.004 (0 012'l'o) 6 0 01 (0 015%) <> 0 002 (0 012%)
Dissolved Oxygen (ppm)
A333-6 Steel 2aa•c Strain Amplitude: 0.6%
-- Statistical Model - ·- • • EFDModel Two sets ol lines correspond to Rate=O 004%/s 5=0.012% & Rate=O 01%/s S=O 015%
Strain Rate (%/s) 0 0 004 (0 012%) 6 0 01 (0 015%) <> 0 002 (0.012%)
Dissolved Oxygen (ppm}
Figure 78. Dependence on dissolved oxygen of fatigue life of carbon steels obseroed experimentally and that estimated .from statistical and EFD models
1 o1
(b) The statistical model assumes that the effects of strain rate on fatigue life saturate below 0.001%/s, Fig. 77. Such a saturation is not considered in the EFD model.
(c) A threshold temperature of 150°C below which environmental effects on fatigue life are modest is incorporated in the statistical model but not in the EFD model.
(d) The EFD model includes the effect of tensile strength on fatigue life of CSs in LWR environments.
Another estimate of the fatigue life correction factor Fen can also be obtained from the statistical model. Since
In( Fen)= In( Nair)- In(Nwater)• (6.4)
from Eqs. 5.3a and 5.4a, the fatigue life correction factor for CSs is given by
NUREG/CR-6583 68
OAGI0000759 00086

ln{Fen) = 0.585 -0.00124T -O.IOIS•T•o•t•
and from Eqs. 5.3b and 5.4b, the fatigue life correction factor for LASs is given by
ln(Fen) = 0.929- 0.00124T- O.IOIS•T•o•t,
(6.5a)
(6.5b)
where the threshold and saturation values for S*, T'. 0*, and i;* are defined in Eqs. 5.5. A value of 25°C is used forT in Eqs. 6.5a and 6.5b if the fatigue life correction factor is defined relative to Rr air. 'otherwise, both T and T' represent the service temperature. A fatigue life correction factor Fen based on the statistlca1 model has been proposed as part of a nonmandatoryAppendix to ASME Section IX fatigue evaluatioris.94,95
7 Fatigue S-N Curves for Components
The current ASME Section III Code design fatigue curves were based on experimental data on small polished test specimens. The best-fit or mean curve to the experimental data used to develop the Code design curve, expressed in terms of stress amplitude Sa (MPa). and fatigue cycles N, for carbon steels is given by
Sa,= 59,736/'..JN + 149.24 (7.la}
and for low-alloy steels by
Sa = 49,222/-./N + 265.45. (7.lb)
. The stress amplitude Sa is the .product of strain amplitude Ea and elastic modulus E; the room temperature value of 206.8 GPa (30,000 ksi) for the elastic modulus for carbon and low-alloy steels was used in converting the experimental strain-versus-life data to stress-ve~sus-life curves. To obtain design fatigue curves the best-fit curves (Eqs. 7 .. la and 7.lb) were first adjusted for the effect of mean stress based on the modified Goodman relation
(7.2a)
and
(7.2b)
where S~ is the adjusted value of stress amplitude, and aY and au are yield and ultimate strengths of the material, respectively. The Goodman relation assumes the maximum possible mean stress and typically gives a conservative adjustment for mean stress at least when environmental effects are not significant. The design fatigue curves -were then obtained by lowering the adjusted best-fit curve by a factor of 2 on.strcss or 20 on cycles, whichever was more conservative, at each point on the curve. The factor of 20 on· cycles was intended to account for the uncertainties in fatigue life associated with material and loading conditions,
. and the factor of 2 on strain was intended to account for uncertainties in threshold strain caused by material variability.· This pr~cedure is illustrated for CSs and LAS~ ~nFig. 79.
69 NUREG/CR-6583
OAGI0000759 00087

ay = 275.8 MPa
E = 20684 GPa
ASMECode Design Curve·
Number of Cycles, N
·-.
1 o7 1 o1
Number of Cycles, N
Figure 79. Adjustment for mean stress effects and factors of 2 and 20 applied to best-fit 8-N curves for carbon and low-alloy steels to obtain the ASME Code design fatigue curve
7.1 Factors of 2 and 20
The ASME Code design fatigue cuiVes were obtained by lowering the best-fit 5-N cuiVe by a factor of 2 on strain and 20 on cycles to account for the differences and uncertainties in relating the fatigue lives of laboratory test specimens to those of actual reactor components. These factors were intended to cover several variables that can influence fatigue life.3 The actual contribution of these variables is not well documented. Although the factors of 2 and 20 were intended to be somewhat conseiVative, they should not be considered as safety margins. The variables that can effect fatigue life in air and LWR environments can be broadly classified into three groups:
(a) Material (i) Composition:. sulfur conterit (ii) Metallurgy: grain size. inclusions, orientation within a forging or plate (iii) Processing: cold work, heat treatment (iv) Size and geometry (v) Surface finish: fabrication surface condition (vi) Surface preparation: surface work hardening
(b) Loading (i) Strain rate: rise time (ii) History: linear damage summation or Miner's rule (iii) Mean stress (iv) Biaxial effects: constraints
(c) Environment (i) Water chemistry: DO, lithium hydroxide. boric acid concentrations (ii) Temperature (iii) Flow rate
The existing fatigue 5-N data base covers an adequate range of material parameters (i)(iii), loading parameter (i). and environment parameters (i) and (ii): therefore. the variability and uncertainty in fatigue life due to these parameters have been incorporated into the model.
NUREG/CR-6583 70
OAGI0000759 00088

The results indicate' that reiative to the mean curve. the curve r:epresenting a 5% probability of fatigue cracking is a factor of ==2.5 lower in life and a factor of 1.4-1.7 lower in strain.
'Therefore, factors of 2.5 on life and 1.7 btt:strain-pro~ide'a 90% confidence for the variations in fatigue life associated,with compositional and meta11urgical differences, material processing. and experimental scatter. As di~cussed tri Section 5.4, 'the factor of 1. 7 on strain has been estimated from the standard deviation on cycles and, therefore may be a conservative value.
' - ; . . .. .. . " ~ .
Biaxial effects are covered by de~ign' procedures and need not be considered in the design fatigue curves. " The existing data' are conservative With respect to' the effects of surface preparation because the fatigue S-N data are obtained for' specimens that are free of surface cold work; specimens with surface cold work typically give longer fatigue lives. Fabrication procedures for fatigue t~st -specimens generally followASTM guidelin'es, which require that the final polishing of the specimens avoid surface :work hardening. Insufficient data are available to evaluate.the contribtitions of flow rate ~n fatigue life; most of the tests in water have been conducted at- relatively .low flow rates. •. Based on the results for environmentally assisted cracking,58.59,64 it appears 'that the available 'fatigue S-N data on environmental effects should' be' conservative coin pared 'With the. results e:Xpected at the higher flow' velocities expected in most reactor applications: , However, it is difficult to assess. the degree of
· conservatism introduced by ·the low flow r~tes.; , , · ·
Because the effects. of tlie environment can be included in mean S-N curves for test .specimens, only the contributions of size. geometry, surface finish. and loading history (Miner's rule) need to be considered In development of the design fatigue curves that are applicable to components .. The effect of specimen size on the fatigue life of CSs and LASs has been investigated for smooth specimens of various diameters in the range of 2-60 mm.96-99 No intrinsic size effect h~s been observed for :smooth specimens tested in axial loading or plain bending. ~owever. a size effect does occur in specimens tested in rotating bending; the fatigue
· endurance limit decreases by =::25% by increasing the specimen size from 2 to 16 mm but does not decrease fuither with larger sizes.99 In addition. some effect of size and geometry has been observed on small~scale vessel tests conducted at the Ecole Polytechnique in conjunction with the large-size pressure vessel tests carried out by the Southwest Research Institute.33 The tests at the Ecole Polytechnique were conducted in room temperature-water on =::305-mm
·inner-diameter, 19-mm-thick shells With· nozzles made of machined bar stock. The results indicate that the nu.mber of cycles _to form_a 3-:-mm-deep_ crack }n an)9-mm-thick shell may be 30-50% lower than those in a small test specimen.2! Thus; a factor of=::l.4 on cycles and a factor of"" 1.25 on strain can be used to account for size and geometry,.
',.
Fatigue life is sensitive~to surface finish; cracks can initiate at surface irregularities that are normal to the stress axts. The height, spacing, shape; ·and distribution of surface irregularities are important for crack initiation. The !fiOSt G()~mon ~easur~ of roughness is average surface roughness Ra. which is a measure of the height of the irregularities. Investigations of the effects of surface roughness on the low-cycle fatigue of Type 304 SS in air at 593°C indicate that fatigue life decreases as surface roughness increases.lOO,lOI The effect of roughness on crack initiation Nt(R) is given by
. c ' (7.3)
where the RMS value .of surface roughness Rq is in micrometers. Typical values of Ra for surfaces finished by different metalworking processes in the automotive industryl02 indicate
71 NUREG/CR-6583
OAGI0000759 00089
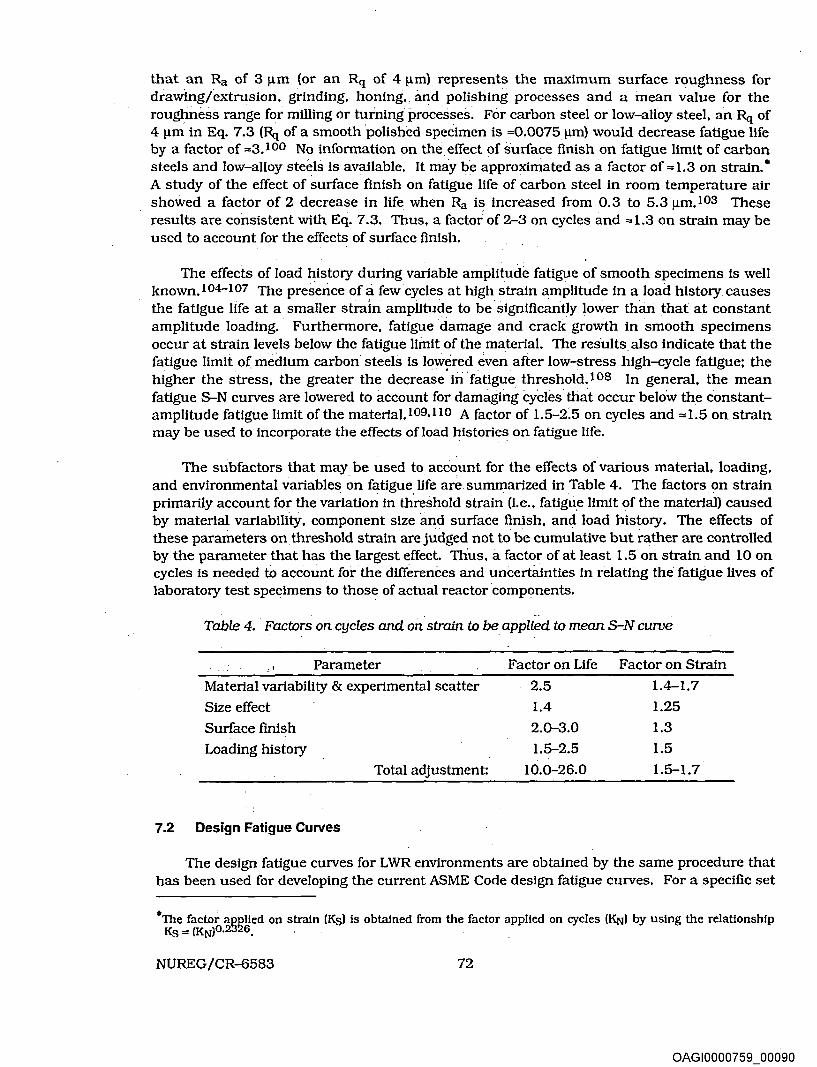
that an Ra of 3 ).lm (or an Rq of 4 ).lm) represents the maximum surface roughness for drawing/extrusion, grinding. honing, and polishing processes and a mean value for the roughness range for mllling or turning processes: For carbon steel or low-alloy steel, an Rq of 4 ).lm in Eq. 7.3 (Rq of a smooth polished specimen is =0.0075 ).lm} would decrease fatigue life by a factor of ::::3,1 oo No information on the. effect of surface finish on fatigue limit of carbon steels and low-alloy ste~ls is available. It may be approximated as a factor of ::::1.3 on strain.* A study of the effect of surface finish on fatigue life of carbon steel in room temperature air showed a factor of 2 decrease in life when Ra i~ increased from 0.3 to 5.3 ).lm.I03 These results are consistent with Eq. 7 .3. Thus, a factor of 2-3 on cycles and ""1.3 on strain may be used to account for the effects of surface finish.
. ' .
The effects of load ~istory during variable amplitude fatigue of smooth specimens is well known.I04-I07 The presence of a few cycles at high strain amplitude in a load history causes the fatigue life at a smaller strain amplitude to be· significantly lower than that at constant amplitude loading. Furthermore, fatigue damage and crack growth in smooth specimens occur at strain levels.below the fatigue limit ofthe.material. The results also indicate that the fatigue limit of medium carbon· steels is low~red. even after low-stress high-cycle fatigue; the higher the stress, the greater the decrease in ·fatigue threshold.l os In general, the mean fatigue S-N curves are lowered to account for damaging cydes,that occur below the constantamplitude fatigue limit of the materiaJ.I09,110 A factor of 1.5-2.5 on cycles and :::sl.5 on strain may be used to incorporate the effects of load historieS. on fatigue life.
The subfactors that may be used to account for the effects of various material, loading, and environmental variables on fatigue life are summarized in Table 4. The factors on strain primarily account for the variation in threshold strain (i.e., fatigue limit of the material) caused by material variability, component size and surface finish, and load history. The effects of these parameters on threshold strain are judged not to be cumulative but rather are controlled by the parameter that has the largest effect. Thus, a factor of at least 1.5 on strain and 10 on cycles is needed to account for. the differences and uncertainties in relating the' fatigue lives of laboratory test specimens to those of actual reactor components.
Table 4. Factors on cycles and on strain to be applied to mean 8-N curoe
Parameter
Material variability & experimental scatter
Size effect
Surface finish
Loading history
Total adjustment:
7.2 Design Fatigue Curves
Factor on Life
2.5
1.4
2.0-3.0
1.5-2.5
10.0-26.0
Factor on Strain
1.4-1.7
1.25
1.3
1.5
1.5-1.7
The design fatigue curves for LWR environments are obtained by the same procedure that has been used for developing the current ASME Code design fatigue curves. For a specific set
. ' The factor applied on strain fKsl is obtained from the factor applied on cycles (KNl by using the relationship Kg= [KN)0.2326. . .
NUREG/CR-6583 72
OAGI0000759 00090

- ----------------------------------------------------------------------
of environmental conditions. the best-fit curve obtained from Eqs. 5.3-5.5 is first adjusting for the effect of mean stress using the Goodman relation (Eq. 7.2) and then the curve lowered by factors of 2 on stress and 20 on cycles to account for the differences and uncertainties in fatigue life associated with material and loading conditions. The stress-versus-life design curves were obtained from the strain-versus-life curves by using the room-temperature values of elastic modulus. The design fatigue curves based .on the statistical model.for CSs and LASs in air at room temperature and 288°C are shown in Fig. 80. The results indicate that for both steels the current ASME Code curie is conservative relative to the curves obtained from the statistical model. For LASs, the difference between the two curves is insignificant. whereas for CSs, the fatigue lives predicted by the current Code curve at stress levels of 100-200 MPa (14.5-29 ksi} are more than a factor of 3 lower than those predicted by the curve from the statistical model.
Figure 81 shows the design .curves for LWR environments under service conditions where any one of the following critical threshold conditions is true.
Temperature: .··Dissolved-oxygen: Strain Rate:
· <150°C <0.05 ppm 2:1%/s
I " l , , ~ o0 = 551 6 MPa
------- --~ 1 '' : a - 275 8 MPa "' l'-.. ··-·--t- . y- ',:,' -
. i.===. .. • ' r ..... ~-~.·. ' ... j - -.: ..... ......_"'!'-. ; ....
E 206.84 GP ':, .. · . ~ : = ; a '1--. ""t-: .. -----.:Best-Fit to
, Experimental Data i . .... ; ... -- Design Curve Basee!_ .... L ·.. .. ...... 1 ..... · .-:. ., ...
· on Statistical Model : ; · · -- · - ASME Code Curve i i .
'
Number of Cycles, N
1 .,, ·"'T ....-rrTJmf ! : :. : : :
-~ I :.~- .. - I
--Statistical Model_ - • ..:. · ~ ASME Code Curve ·
: :
-------Best-Fit to · · Experimental Data
-· --·Design Curve Based on Statistical Model
- · -'- · - ASME Code Curve
_ ~y = 4r6 MPa.
...... ,~ .....
Number of Cycles, N
n """I "-
If "'"'f
l I
!:.~': . ~ . . : ~
--Stati;tical Mod~! · . - · ~ · ~ ASME Cod~ Curve
--r-r TT ITT1J'" o ,.., T
. Low-Alloy Steel 288°C Air
~ l ..... I
Number of Cycles, N Number of Cycles, N
Figure 80. Fatigue design curves developed from statistical model for carbon and low-alloy steels in air at room temperature and 288°C
73 · NUREG/CR-6583
OAGI0000759 00091

I When any one of
·······-·-·-·r -~ [ the following
· ··+···--·conditions is true
t.,,
'.;:'. ~ '
•. -- Statistical Model_ .•.... - . - . ~ ASME Cod~ Curve
1 Temp. <15o•c i DO <0.05 ppm \ Strain ~ate ~1%/s
-~·-·t····· . -. --1 .
0 :
l When any one of l the following f ···conditions is true -l Temp. <1so•c J DO <0.05 ppm l Strain Ra,te ~1 %/s
'L ~
~ .--: Statistical ~odei •.......... L. ........ -.... l - • - - ~ ASME Code Curve i i
: : :
Number of Cycles, N Number of Cycles, N
Figure 81. Fatigue design curves developed from statistical model for carbon and low-alloy steels under service condUions where one or more critical threshold values are not satisfied
A threshold value of sulfur content in the steel is not defined because, as discussed in Section 4.2.5, limited data suggest that in high-DO water the fatigue life of CSs may be independent of sulfur content in the range of0.002-0.015 wt.%.
Figure 82 shows the design curves under service conditions where temperature and DO · level are above the threshold value and strain rate is <1%/s. The design fatigue curves in water at 200, 250, and 288°C, corresponding to strain rates of 0.1. 0.01. and a saturation value of 0.001%/s, are shown in the figure. A DO level of 0.2 ppm in water and high sulfur content (0.015 wt.% or higher) is assumed in the steels. Also, a minimum threshold strain amplitude is defined below which environmental effects are modest and are represented by the curves shown in Fig. 81. In Section 4.2.1 it was shown that the threshold strain appears to be z20% higher than the fatigue limit of the steel. This translates to strain amplitudes of 0.140 and 0.185%, respectively, for CSs and LASs. These values have to be adjusted for mean stress effects and variability due to material and experimental scatter. To account for the effects of mean stress, the threshold strain amplitudes are decreased by ==15% for CSs and by ==40% for LASs; which results in a threshold strain amplitude of =0.12% for both steels. A factor of 1. 7 on strain provides a 90% confidence for the variations in fatigue life associated with material variabUity and experimental scatter. Thus, a threshold strain amplitude of 0.07% (or a stress amplitude of 145 MPa} was selected for both steels.
The design fatigue curves in Figs. 81 and 82 can be used for fatigue evaluations in LWR applications. For convenience, the design fatigue curves for LWR environments are reproduced in Appendix B. Note that these curves not only account for environmental effects but also include minor differences between the current ASME mean air curves and the present mean air curves that have been developed from a more extensive data base. Figure 80 shows that the differences are insignificant for LASs and may result in lower values of fatigue usage forCSs.
NUREG/CR-6583 74
OAGI0000759 00092

-~, I . ·~ . :. ',...}-.: "-~ . . ... -~ .
·-~~, l - -~: .,J
-~~--
Temp. 200"C .D00.2ppm ·Sulfur ::!O.Q15 wt.%
i
•::·!~ .....
Strain R~te (%/s) ··-~ -···-0.1 l --~~_tN,. -------0.01 i - t·-_ .......... _-._j
·---. -_-_-_ A:~· ~~;~-~~rve ... 1· ··-·-· .. !
Number of Cycles, N
: i :
' ! . : '' ' , .i-- . l DO 0.2 ppm ,
..... ~-~~ :?" ~ • ~. 1 ................ · i .. - Sulfur ;;:o 015 wt.%
·r~~4~,,~J 1. · Strain Rate (%/s) i -. r:~ i
' - .. -- 0 .1 i ~ --·-.:..:: ~ .. --~..:.......--!
-~------g·g~1 ---! .... ) ............. t>,. -.-.- ASME Code Curve .l !
Number of Cycles, N
· ! l Temp. 288°C '',: · .~ . · l l DO 0.2 ppm .
... ·-·.; ~-! · -~ ~ ..... 1· • ··- • • .. 1 .. ·--Sulfur~ 015 wt.%
St~tn ;:~.,:>t .. ~. ·.? :·:~:!,;_:~,J -------0.01 ----=--.-;=-:.~---~ ·--- 0.001' ! . .. ·--r- .,._. ·.:..-- • - • - ASME Code Curve j
Strain Ra_te (%/s) -----0.1 -------001 ----0001-·· - · - • - ASME Code Curve
low-Alloy Steel Water Temp 2oooc D00.2ppm Sulfur ::!0.015 wt.%·
! I ~
Number of Cycles, N
· Number of Cycles, N
Number of Cycles, N · Number of Cycles, N
FYguie 82. Fatigue design curves develo~dfrom statistical model for carbon and low-alloy steels under service conditions where all critical threshold values are satisfied
75 NUREG/CR-6583
OAGI0000759 00093

--~ .. , .... ·-:~
' ... ·.~~.! ' '
E: 206.84 GP• T::: .. Probability of .!':.
Fatigue Cracking -···-5% ------- 1% ·•··•·· j .•• -- ASME Code Curve
au = 551.6 MPa
ay = 275.8 MPa
' 1'--.' ,.
>, au = 689.5 MPa
ay = 482.6 MPa .
1~ 1~ 1~ 1~ 1~ 1~1~ 1~ 1~ 1~ 1~ 1~ Number of Cycles, N Number of Cycles, N
Figure 83. Probability distribution on fatigue life of carbon and [ow-aHoy steels in air
7.3 Significance of Design Curves
The fatigue life of a material is defined as the number of cycles to form an engineering crack, i.e., =3 mm deep crack. The best-fit 8-N curves to the experimental data represent a 50% probability of forming a fatigue crack in a small polished test specimen under constant loading conditions. It is not clear whether the design fatigue curves represent greater than, equal to, or less than 50% probability of forming a fatigue crack in power plant components.
Statistical models have been used to evaluate the significance of ASME Code design curves in terms of the probability of fatigue cracking associated with the curves.27,28 Equations 5.6 and 5.7 for the probability distribution of life indicate that relative to the mean curve (50% probability), the 5% probability for fatigue cracking in smooth specimens is lower by a factor of 2.5 on cycles and 1. 7 on strain. The factors on strain primarily account for the uncertainties in the fatigue limit. The effects of these factors are judged not to be cumulative but rather are controlled by the parameter that has the largest effect. Therefore, a factor of 1. 7 on strain, i.e., a fatigue curve corresponding to probabilities of 5% or less, is adequate to account for the differences and uncertainties in fatigue life associated with material and loading conditions. The probability distribution curves for components can be obtained by lowering the mean-stress-adjusted curves for smooth specimens {Eqs. 5.6 and 5.7) by a factor of 4 (i.e., product of 1.4 and 3) on cycles to include the effects of size/geometry and surface finish in the low cycle regime. Because the Goodman relation assumes maximum possible mean stress, the mean-stress-adjusted curves typically yield conservative estimates of life.
The estimated s-N curves representing 5 and 1% probabilities of fatigue cracking in CS and LAS components in Rf air are compared with the ASME Code design fatigue curve in Fig. 83 .. The results indicate that the current design fatigue curve represents <5% probability of fatigue cracking in LAS components and < 1% probability in CS components. A typical fatigue analysis has additional conservatisms due to the stress analysis and loading history assumptions that are unaccounted for in these estimates.
The significance of the proposed interim fatigue design curves in fatigue evaluation of reactor components has also been evaluated with the statistical models.27,28 The probabilities
NUREG/CR-6583 76
OAGI0000759 00094

of fatigue cracking in carbon and low-alloy ferritic steel compone~ts have been estimated as a function of CUF for various service conditions. The CUFs were calculated using the interim fatigue design curves corresponding to low DO water typ!cal of PWRs or high-DO water, which represent a conservative estimate of environmental_ effects on fatigue life in.· BWRs. The probability of fatigue cracking was estimated from the statistical models.
The probabilities of fatigue cracking in LASs in low-DO water and in CSs in high-DO water are plotted as a function of_ CUF in Figs. 84 and 85,respectively. As e:xpected, the probability of fatigue cracking Increases With Increasing CUF. However, because the curves of constant probability are not parallel, for a given CUF, the probability also depends on the applied stress amplitude. This dependence on stress amplitude is relatively weak for high stress levels, but at low stresses the probability is quite sensitive to the stress amplitude. At stress amplitudes below the· fatigue limit for the material,. the ·probability of· cracking is relatively insensitive to CUF values above 0.2.
Although these results seem somewhat surprising upon 'first e:xamination, they do seem heuristically plausible upon further reflection. Because . the scatter in life is so large at low
Low-Alloy Steel PWR Water c.1~~~=:~~:;~;;~~~~~~~~~ 0
~ ~ 1 o·1
~ ~ u 0
. >-
~ 1 o·2 -
..• 111 · Low-Alloy Steel PWR Water
_ 1! CUFs obtained from c. Interim Design Curves
E=26,700 ksi .· 1 ksi = 6 895 M?a ·
2 4 6
Stress Amp (ksi) ---e--20 --e-28 --as --+f--45 ---6-60 --<~--105 --150 --210
8
. Cumulative Usage Factor Cumulative Usage Factor
Figure 84. Probability of fatigue cr~king in low-cl.ioy ~·teel in lo'urdis~olved-oxygen ~ater . (<O.OS ppm) plotted as afunction of_ cumul~ve usage factor at different st;ress levels
. ; ' . Stress Amp (ksl) ---e--225
.-e--28. CUF based on • --+-- 3 5
Interim Curves . ' · · =:= ~ g .E=27,000 ksl ---9- 105 :1 ks1=6895 M?a __
150.
Carbon Steel High-DO Water 290"C 0 001 'l'ols Strain Rate
CUFs obtained from Interim Design Curves E=27,000 ksi 1 ksl = 6 895 MPa
Stress Amp. (ksi) ---e--225 --e-28 --+--35 --t<-45 ---6-60 --<~--105 --150
1 o·3 L-!..-..1_..--~.__._"-'-__,__.__.__,__,___,__...._..._..._..___.!..-..1
0.2 0.4 .. 06 .. 0;~ ·-:1.,. 2 .;4 6 8 10 Cumulative Usage Factor Cumulative Usage Factor
Figure 85. Probability of fatigue cracking in carbon steel in high-dissolved-oxygen water (~0.5 ppm) plott~d as 'c':tJunction of c~ulative tiSage factor at different stress levels
77 NUREG/CR-6583
OAGI0000759 00095

strain amplitudes. the probability of fatigue cracking in this region is not very well characterized by cycle counting. i.e .• CUF. Rather. the- probability of fatigue cracking is controlled primarily· by the uncertainty in defining fatigue limit for the material. This is reflected in the relative insensitivity to CUF value. Because we have relatively little data in the high-cycle regime. the uncertainty in the probability estimates at low strain amplitudes is rather large.
8 Fatigue Evaluations in LWR Environments
The ASME Boiler· and Pressure Vessel Code Section IIIl contains rules for the construction of nuclear power plant Class 1 components. It provides the requirements for design against cyclic loadings that occur on a structural component because of changes in the mechanical and thenrial loadings as the system goes from one load set (pressure. temperature. moment. and force) to any other load set. The ASME Section III. NB-3600 (piping design) methodology is used exclusively for piping and· sometimes for branch nozzles. The ASME Section III. NB...;.3200 ·(design by analysis) methodology is generally used for vessels and frequently for nozzles. In both analyses. first the various sets of load states are defined at the most highly stressed locations in the component. The load states are defined in terms of the three principal stresses in NB-3200 analysis, and in terms of internal pressure. moments. average temperature. and temperature gradients in NB-3600 analysis. A peak stress-intensity range and an alternating stress-intensity amplitude Sa is then calculated for each load state. The value of Sa is used to first obtain the allowable number of cycles from the design fatigue curve and then to calculate the fatigue usage associated with that load state. The CUF is sum of the partial usage factors. The Section III. NB-3200- or NB-3600-type analyses for components for service in LWR environments can be performed with the design fatigue curves presented in Figs. Bl-B4. Note that fatigue evaluations performed With these updated curves not only account for the environmental effects but they also include minor differences that exist between the current ASME mean air curves and the statistical model air curves.
An alternative approach for fatigue evaluations in LWR environments has been proposed by EPRI94,95 and by the EFD committee of TENPES. • As was discussed in Section 6. the effects of LWR coolant environments on the fatigue S-N curves are expressed in terms of fatigue life correction factor Fen. In the EPRI approach, Fen is expressed as the ratio of the life in air to that in water, both at service temperature, whereas in the EFD approach. Fen is expressed as the ratio of the life in air at room temperature to that in water at service temperature. The effects of environment are incorporated into the ASME fatigue evaluation by obtaining a· fatigue usage for a specific load pair based on the current Code design curves and multiplying it by the correction factor. Fatigue evaluations performed using Fen incorporate the effect of environment alone in the EPRI approach, and effects of environment as well as temperature that might exist in air in the EFD approach.
Both these approaches require additional information regarding the service conditions, e.g., temperature, strain rate, and DO level. The procedure for obtaining these parameters depends on the details of the available information, i.e .• whether the elapsed time versus temperature information for the transient is available. The values of temperature and DO may be conservatively taken as the maximum values for the transient. As discussed in
• Presented at the Pressure Vessel Research Council Meeting, April 1996, Orlando, FL.
NUREG/CR-6583 78
OAGI0000759 00096

- --------------------------------------------
S~ction 4.2.3, an average temperature may be -~sed if the time versus temperat~re information is available. Because environme_ntal effects on fatigue life are modest below 150°C and the threshold strain, the average temperature should be determined by the average of the "maXimum temperature and either 150°C or tlie temperature at threshold strain, whichever is higher. An average strain rate is generally ·used for each load state; it is obtained from the peak strain and elapsed time for the transient. · However, fatigue monitoring data indicate that -actual strain rates may vary significantly during the tr~msient. The slowest strain rate can be , used for a conservative estimate of life. · - · · · ·
An "improved rate approach" has been proposed in ·Japan for obtaining the fatigue life correction factor Fen under conditions of varying temperature, strain rate, and DO level.9
-During each loading cycle, Fen is assumed to vary linearly with strain increments. The effective correction factor F~n for varying conditions is expressed as
• Emax F -1 Fen= 1 + J en de, . - . . Eth Emax - Eth
(8.1)
where emax and eth are the maximum and threshold values of strain, respectively. For varying service conditions, Eq. 8.1 may be written in .terms of the effective fatigue life in water N~r expr~ssed as
1 Emax 1 . de - . ---:--= J N~er Eth N water ( e~ - Eth)
_(8.2)
or 1 Tmax · 1 dT
. = 1 . Nwater Tth Nwater (T max -Tth)
(8.3)
where N water is the life under constant temperature and strain rate, and T max and T th are the maximum and threshold values of temperature. respectively.
. . -
Sample fatigue evaluations have been performed for a SA-508 CI I CS feedwater nozzle safe end and SA-333 Gr 6 CS feedwater line piping for a BWR and a SA-508 Cl 2 LAS outlet nozzle for a PWR vessel; the results are given in Tables 5-7. The stress records and the associated service conditions were obtained from Ref. 30. The following three methods were
! • < ' ~ ' ' • •
used to calculate the CUF.
' ~·· '
(a) For each set of load pair, a partial usage factor was obtained from the appropriate design fatigue curve shown in Figs. B1-B4~
(b) For each set of load pair, fir~t a partial usage factm~ 'was obtained from the current ASME Code design curve. This value was adjusted for e~Vironmental effects by multiplying by Fen• which is calculated from Eqs; 6.5a ·and 6.5b.: ·Fen values were calculated for only those load pairs that satisfy the folloWing three threshold conditions: temperature ~150°C, strain rate :s;1%/s·, and stress amplitude _~145 MPa· (2:21 ksi). The DO level was assumed to be' 0.2 ppm. Also, because the sulfur content in the steel is n'ot always available, a conservative value of 0.015 wt.% was assumed.
79 NUREG/CR-6583
OAGI0000759 00097

Table5. Fatigue evaluation for SA-508 Cll carbon steelfeedwater nozzle safe endfor a BWR
Strain Design ASMECode Curves Based on Correction Based on Correction Based Salt Temp. Rate Cycles Curve Statistical Model Statistical Model on EFD Model
(MPa) (oC) (%/s) n N Uatr N Uenv Fen Uenv Fen Uenv
567.2 200 0.028 120 1024 0.1172 417 0.2878 2.18 0.2552 2.52 0.2956 500.6 200 0.026 90 1429 0.0630 617 0.1459 2.20 0.1384 2.57 0.1619
' 444.1 200 0.026 142 1967 0.0722 1000 0.1420 2.20 0.1586 2.57 0.1856 268.8 200 0.002 555 9272 0.0599 6457 0.0860 3.01 0.1804 4.99 0.2989 201.9 200 0.001 10 23830 0.0004 21878 0.0005 3.28 0.0014 5.97 0.0025 143.8 ·zoo 0.001 120 81350 0.0015 229087 0.0005 1.00 0.0015 1.00 0.0015 132.4 200 0.001 98 115630 0.0008 1288250 0.0001 1.00 0.0008 1.00 0.0008 121.1 200 0.001 10 159810 0.0001 2000000 1.00 0.0001 1.00 0.0001 120.2 288 0.001 10 163810 0.0001 2000000 1.00 0.0001 1.00 0.0001 95.5 288 0.001 222 444850 0.0005 2000000 0.0001 1.00 0.0005 1.00 0.0005 92.6 200 0.001 666 523970 0.0013 2000000 0.0003 1.00 0.0013 1.00 0.0013 91.9 288 0.001 120 560450 0.0002 2000000 1.00 0.0002 1.00 0.0002
0.3171 0.6632 0.7384 0.9489
Table6. Fatigue evalualionfor SA-333 Gr 6 carbon steelfeedwater Line piping for a BWR
Strain Design ASMECode Curves Based on Correction Based on Correction Based Salt Temp. Rate Cycles Curve Statistical Model Statistical Model on EFD Model
(MPa) (oC) (%/s) n N Ualr N Uenv Fen Uenv Fen Uenv
758.9 200 0.117 5 447 0.0112 229 0.0218 1.82 0.0204 1.74 0.0195 744.4 200 0.114 5 468 0.0107 245 0.0204 1.83 0.0195 1.75 0.0187 734.4 200 0.113 5 490 0.0102 251 0.0199 1.83 0.0186 1.76 0.0179 654.2 200 0.001 8 692 0.0116 363 0.0396 3.25 0.0376 5.97 0.0691 616.4 200 0.095 10 776 0.0129 407 0.0246 1.87 0.0241 1.84 0.0237 608.6 200 0.094 5 832 0.0060 437 0.0114 1.87 0.0112 1.84 0.0111 598.3 200 0.041 126 871 0.1447 479 0.2630 2.07 0.2991 2.29 0.3306 561.4 215 0.086 10 1096 0.0091 603 0.0166 2.03 0.0185' 1.97 0.0180 468.4 200 0.001 97 1698 0.0571 603 0.1609 3.25 0.1858 5.97 0.3412 459.9 200 .0.001 14 1820 0.0077 676 0.0207 3.25 0.0250 5.97 0.0460 422.6 200 0.001 6 2344 0.0026 955 0.0063 3.25 0.0083 5.97 0.0153 421.7 212 0.001 64 2239 0.0286 955 0.0670 3.92 0.1121 6.59 0.1884 382.7 200 0.001 92 3090 0.0298 1445 0.0637 3.25 0.0968 5.97 0.1779 321.5 215 0.001 88 5623 0.0157 3090 0.0285 4.11 0.0643 6.76 0.1058 295.6 212 0.001 15 7413 0.0020 4467 0.0034 3.92 0.0079 6.59 0.0133 271.9 215 0.001 212 8710 0.0243 6310 0.0336 4.11 0.1000 6.76 0.1646 262.9 224 0.001 69 9772 0.0071 7244 0.0095 4.73 0.0334 7.32 0.0517 253.7 224 0.001 11 11220 0.0010 8511 0.0013 4.73 0.0046 7.32 0.0072 236.6 215 0.001 60 13804 0.0043 11220 0.0053 4.11 0.0179 6.76 0.0294 227.2 200 0.001 203 15849 0.0128 13490 0.0150 3.25 0.0416 5.97 0.0765 224.3 200 0.001 360 16218 0.0222 14125 00255 3.25 0.0722 5.97 0.1326 205.3 200 0.025 222 21878 0.0101 26687 0.0083 2.20 0.0223 2.60 0.0264 179.9 212 0.028 30 33884 0.0009 50720 0.0006 2.37 0.0021 2.65 0.0023 179.5 200' .. 0.028 81 33113 0.0024 50720 0.0016 2.17 0.0053 2.52 0.0062 149.2 212 0.001 96 63096 0.0015 141254 0.0007 3 92 0.0060 6.59 0.0100 141.8 200 0.001 40 83176 0.0005 602560 0.0001 1.00 0.0005 1.00 0.0005 97.8 200 0.001 30 389045 0.0001 2137962 0.0000 1.00 o:ooo1 1.00 0.0001 77.4 200 0.001 11545 2238721 0.0052 1.00 0.0052 1.00 0.0052
0.4522 0.8693 1.2603 1.9091
NUREG/CR-6583 80
OAGI0000759 _ 00098

·Table 7. Fatigue evaluation for SA -508 Cl2 low-alloy steel outlet nozzle for a PwR
Strain Design ASMECode Cmves Based on · Correction Based on Correction Based Salt Temp. Rate Cycles Curve·· Statistical Model . Statistical Model on EFD Modela
(MPa) (oC) (%/s) n 'N Uatr ':N Uenv Fen - - Uenv Fen Uenv
335.6 80 4670 0.0171 2573 0.0311 .· 1.77 0.0303 313.0 10 5741 0.0017 3091 0.0032 1.77 0.0031 305.7 20 6010 0.0033 3388 0.0059 1.77 0.0059 275.4 20 8098 0.0025 4670 0.0043 1.77 0.0044 237.1 70 13723 0.0051 9508 0.0074 1.77 0.0090 202.1 130 23795 0.0055 24912 00052 1.77 0.0097 195.1 150 26082 0.0058 27939 0.0054 1.77 0.0102 186.8 50 .. 29251 0.0017 32061 0.0016 1.77 0.0030 186.1 30 28587 0.0010 33566 0.0009 1.77 0.0019 . 147.3 40 68338 0.0006 76641 0.0005 1.77 0.0010 139.3 ,•,- 1930' 94211 0.0205 94211 : 0.0205 1.00 0.0205 139.3 2000 94211 0.0212 94211 .. 0.0212 1.00 . ' 0.0212 138.8 9270 94211 0.0984 94211 0.0984 1:oo 0.0984' 130.0 60 115810 0.0005 115810 0.0005 1.00 0.0005 127.1 230 132894 0.0017 129881 0.0018 '. 1.00 0.0017 126.5 .. 10 135977 0.0001 135977 0.0001· 1.00 ·o.0001 124.5 80 142360 0.0006 149041 0.0005 1.00 0.0006 121.6 " 160 149041 0.0011 183210 0.0009 1.00 0.0011 121.6 26400 152499 0.1731 167150 0.1579 1.00 0.1731 117.6 2000 167150 0.0120 205470 0.0097 . 1.00 0.0120. 113.0 400 191809 0.0021 252575 0.0016 1.00 0.0021 110.2 13200 215114 0.0614 310479 0.0425 1.00 0.0614 106.0 13200 241252 0.0547 364547 0.0362 1.00 0.0547 102.7 80 289835 0.0003 617784 00001 1.00 0.0003 102.3 80 289835 0.0003 603777 0.0001 1.00 0.0003 101.4 70 317682 0.0002 777031 0.0001 1.00 0.0002
0.4924 0.4576 0.5266 a Not calculated because strain rates were not available in the stress records .
..
. (c) Same procedure as item (b), except that ,F ~ was calculated from the EFD correlations of . . . Eqs. 6.1-6.3 for the load pairs with stress amplitude 2:145 MPa (<':.21 ksl). The DO level was assumed to be 0.2 ppm and sulfur content of 0.015 wt.o/o. Also. O"u in Eq. 6.3b was assumed to be 520 MPa for CSs and 650 MPa for LASs.
. ,_ . . . .. .
The results indicate .that the approach.using Fen yields higher values of CUF than those . obtained from the design fatigue .curves that have been adjusted .for environmental effects . . The difference arises because the environmentally adjusted design Ctll~es account not only for the environrnent but also for the differences between the ASME mean air curve' and statistical model air curve. Figure 80 show that for CSs, this difference can be significant at stress amplitudes <180 MPa (<26 ksl). The results also show that for the feedwater nozzle safe end and the feedwater line piping. the BWR enVIronment i~creases the fatigue. u~age by a f~ctor of <=2. For the LAS outlet nozzle of a PWR, the effect environment on· fatigue usage is insignificant .. The CUF values from the EFD model were not calculated because information regarding the strain rate. was not available. in the stress 'records. F:o~. stress .levels above .,;145 MPa .(21 ksi), the EFD approach would .yield Fen values ~f 1.25 and 1.95 fo~ strain rates ofo.I anci o.oo1%/s. respectively. . - . . - .
81 NUREG/CR-6583
OAGI0000759 00099

9 Summary
The work performed at ANL on fatigue of carbon and low-alloy steels in LWR environments is sumlllarized. The existing fatigue ~N data have been evaluated to establish the effects of various material and loading variables such as steel type, strain range, strain rate, temperature; sulfur content in steel, orientation, and DO level in water on the fatigue life of these steels. Current understanding of the fatigue 5-N behavior of carbon and low-alloy steels may be summarized as follows.
Air Environment·
(a) Steel Type: The fatigue life of carbon steels is a factor of"' 1.5 lower than that of low-alloy steels.
(b) Temperature: For both steels, life is decreased by a factor of ""1.5 when temperature is increased from room temperature to 288°C.
(c) Orientation: Transverse orientations may have poor fatigue resistance than the rolling orientations because of the distribution and morphology of sulfide inclusions.
(d) Strain Rate: In the temperature range of dynamic strain aging (200-370°C), some heats of carbon and low-alloy steels are sensitive to strain rate. The effect strain rate on fatigue life is not clear: life may either be unaffected, decrease for some heats, or increase for others. In this temperature range, however, cyclic stresses increase with decreasing strain rate.
(e) Heat-to-heat Variation: At 288°C, both steels show significant heat-to-heat variation; fatigue life may vary up to a factor of 5 above or below the mean value.
(0 ASME Code Mean Curve: The ASME mean curve for low-alloy steels is in good agreement with the existing fatigue 5-N data and that for carbon steels is somewhat conservative.
LWR Environments
(a) Environmental Effects: The fatigue life of both carbon and low-alloy steels is decreased significantly when five conditions are satisfied simultaneously, viz., strain amplitude, temperature, DO level in water, and sulfur content in steel are above a minimum level, and strain rate is below a threshold value. Only moderate decrease in life (by a factor of less than 2) is observed when any one of these conditions is not satisfied.
(b) Steel Type: The effect of LWR environments on fatigue life of both carbon and low-alloy steels is comparable.
(c) Strain AmpUtude: A minimum threshold strain is required for environmentally assisted decrease in fatigue life of these steels. The threshold value most likely COITesponds to the rupture strain of the surface oxide film. Limited data suggest that the threshold value is :o:20% higher than the fatigue limit for the steel.
NUREG/CR-6583 82
OAGI0000759 00100

(d) Loading Cycle: Environmental effects on fatigue :life occur pnmarily during the tensileloading cycle, and at strain levels greater than the threshold value required to rupture the surface oxide fllm. Compressive-loading cycle has little or no effect on life. Consequently, loading and environmental conditlons,;e.g.,'strain rate, temperature, and DO level, during the tensile-loading cycle in excess of the oXide rupture strain, are important parameters for environmentally assisted reductio~ in 'fatigue life of these steels.
(e) Strain Rate::. When any one of the, thn;shold conditions is not satisfied, e.g., DO <0.05 ppm or temperature <IS06C. the effects of strah1 rate are consistent with those in air, i.e., heats that are sensitive to strain cite in air, aiso showa decrease in life in water. When all other threshold conditions are satisfied, fatigue life de.creases logarithmically with decreasing strain rate below 1 %is; the effect of environment on life saturates at =0.001%/s. · · .
(0 Tempercdure:' when other threshold conditions are satisfied, fatigue life decreases linearly with temperature above 150°C and ·up to 320°C. Fatigue life is insensitive to temperatures below 150°C or when ariy other threshold condition is not satisfied. . ' . ' ' . . . .
(g) Dissolved Oxygen in Water: ·When other threshold-conditions are satisfied, fatigue life decreases logarithmically with DO above 0.05 ppm; the effect saturates at =0.5 ppm DO.
(h) Sulfur Content in Steel: Although sulfur content and morphology are the most important ·parameters that d-etermine susceptibility of · carbon and low-alloy steels to environmentally enhanc~ci fatigti~' crack growth rates. the eXisting fatigue S-N data are
. inadequat~ to establish unequivocaliy'the effect of sulfurcontent on the fatigue life of these steels. When any orie of the threshold conditions is hot satisfied; environmental effects on life are minimal and relatively insehsitive to changes in sulfur content. When 'the threshold conditions a.'re satisfied: i.e., high~temperatl.rre high-DO water; the fatigue
·life of low-alloy steels' decreases with increasing sulfur content: Limited data suggest that the effects of environment on life saturate at sulfur coO:tents above 0.012 Wt.%. However, in' high-temperature high-DO water, the fatigue life of carbon steels seems to be insensitive to sulfur content in the range of0.002.:.0.015 Wt.o/o: The effect of sulfur on the growth of short cracks (during crack initiation) may be different than that of long cracks and need to be further investigated .
. ; .'· .· ·-..
(i) o~ntation: ··The effect of orientation-on fatigue life is expe~ted'because.of differences in the distribution mid morphology' of s~lfide inclusions; and 'is. well known in crack growth studies with precracked speCimens·.·· Existing fatigue S-N data indicate that in high-DO water (:5:0.1 ppm DO), the fatigue life oflow-alloy steels is insensitive to the differences in sulfide distribution and size. In low-DO PWR environments; larger sulfide inclusions may result in a larger decrease in life; however, environmental effects on fatigue life in low-DO wat~r 'are minimal. . . , . . ' ' ' . . , .
OJ Flow Rate: Studies on fatigue crack. groWth behavior of carbon and low-alloy steels indicate that flow rate is an important parameter for environmental· effects on crack growth rates. However, experlmental data to _establish either the dependence of fatigue life on flow rate or the threshold flow rate for''environmental effects to occur are not available and should be developed. · · ·
83 NUREG/CR-6583
OAGI0000759 00101
Mechanism of Fa~igue Crack Initiation
Fatigue life of. a material is defined as the number of cycles to form an "engineering" crack, e.g., a 3-mm-deep crack. During cyclic loading, surface cracks of 10 11m or longer form quite early in life, i.e., <10% of life even at low strain amplitudes. The fatigue life may be considered to be composed entirely of the groWth of these short cracks.
Fatigue tests have been conducted to determine the formation and growth characteristics of short cracks in carbon and low-alloy steels in LWR environments. The results indicate that the decrease in fatigue life of these steels in high-DO water is primarily caused by the effects of environment on the growth of short cracks <100 11m deep. In LWR environments, the formation of engineering cracks or fatigue crack initiation may be explained as follows: (a) surface microcracks form quite early in fatigue life atpersistent slip bands, edges of slipband extrusions, notches that develop at grain or phase boundaries, or second-phase particles: (b) during cyclic loading, the protective oxide film is ruptured at strains greater than the rupture strain of surface oxides, and the microcracks grow by anodic dissolution/ oxidation of the freshly exposed surface to sizes > 100 11m: and (c) growth of these large cracks characterized by accelerating growth rates that may be represented by the proposed ASME Section XI reference curves for these steels in water environments.
Statistical Model
Statistical models have been developed to pnidict fatigue life of small smooth specimens of carbon and low-alloy steels as a function of various material, loading. and environmental parameters. The functional form and bounding values of these p~rameters were based upon
· experimental observations and data trends. Th~ statistical models were obtained by minimizing the squared Cartesian distances from the data point to the predicted curve instead of minimizing the sum of the square of the residu-al errors for either strain amplitude or fatigue life. The. models are recommended for predicted f~tigue lives of s;I06 cycles. The results indicate that the ASME mean CUrVe for carbon steels is not consistent with the experimental data at strain amplitudes <0.2% or stress amplitudes <410 MPa (<BO ksi); the ASME mean curve is conservative. The statistical model for low-alloy steels is comparable with the ASME mean curve.
The results of statistical analysis have been used to estimate the probability of fatigue cracking in smooth fatigue specimens. The results indicate that relative to the mean or 50% probability curve, the 5% probability curve is a factor of "'2.5 lower in life in the low-cycle fatigue regime and a factor of 1.4-1. 7 lower in strain in the high-cycle regime.
Fatigue Design Curves in LWR Environments
The design fatigue curves for carbon and low-alloy steels in LWR environments were obtained by the procedure that has been used to develop the current ASME Code design fatigue curves. The design fatigue curve for a specific service condition is obtained by adjusting the best-fit experimental curve for the effect of mean stress and setting margins of 20 on cycles and 2 on strain to account for the uncertainties in life associated with material and loading conditions. Da~a available in the literature were reviewed to evaluate the effects of various material, loading. and environmental-variables on fatigue life. The results indicate that the current ASME design fatigue curve represents <5% probability of fatigue cracking in
NUREG/CR-6583 84
OAGI0000759 00102

low-alloy steel components and <I% probability in carbon steel components. The margins of 20 on cycles and 2 on strain may be decreased and still maintain a 5% probability of fatigue cracking in reactor components.
Sample fatigue evaluations have been performed for carbon and low-alloy steel components. The values of cumulative usage factor were determined either from the design fatigue curves based on the statistical model or by applying a fatigue life correction factor that was obtained from the statistical model or- tlie correlations developed by EFD committee of Japan. For carbon steels, the approach using a correction factor yields higher values of usage than those determined from the proposed designfatigueeurves. The difference arises because the environmentally adjusted design curves not only account for the environment but also for the difference between the ASME mean air curve and statistical model air curve. For carbon steels, this difference can be significant at low str~ss amplitudes; the current Code design curve yields higher values of fatigue usage.
§.- ••
85 NUREG/CR-6583
OAGI0000759 00103

. Nomenclature
.1ar
.1Et
.1K
.10' I:J.T Ea Ej
Emax
eth
e~P Ect
O'a
O'u
O'y
v a DO E
E(meas)
E(SHE) p-1[.]
Fen
F~ KN
Ks
N25(X)
Nair
Nt Nwater N:Vater Nx
N(x)
o• p
Crack advance from a slip-dissolution mechanism (em) Total strain range (%)
Stress intensity range (MPaim) Total stress range (MPa)· Temperature difference in salt bridge in external reference electrode
. Applied strain amplitude (%)
Fracture strain of surface oxide Maximum strain for loading cycle Threshold strain below which environmental effects on fatigue life are insignificant Applied total strain rate (s-1) · Transformed total strain rate Applied strain rate (s-1) Crack tip strain rate (s-1) Cyclic stress amplitude (MPa) Ultimate strength (MPa) Yield strength (MPa) Frequency of cyclic loading (s -l) crack depth (mm) Dissolved oxygen in water (ppm, ppb) Young's modulus Measured electrochemical potential (ECP) ECP converted to standard hydrogen electrode (SHE) Inverse of standard normal cumulative distribution function Fatigue life correction factor under constant loading and environmental conditions Fatigue life correction factor under varying loading and environmental conditions Factor applied on life to account for uncertainties in relating fatigue lives of smooth test specimens to those of reactor components Factor applied on strain to account for uncertainties in relating fatigue lives of smooth test specimens to those of reactor components Fatigue life defined as number of cycles to initiate fatigue crack Fatigue life of smooth test specimen defined as number of cycles for tensile stress to drop 25% from its peak value xth percentile of probability distribution on life for smooth test specimens Fatigue life in air
Number of cycles to initiate a crack Fatigue life in water under constant loading and environmental conditions Fatigue life in water under varying loading and environmental conditions Fatigue life of smooth test specimen defined as number of cycles for tensile stress to drop xOAl from its peak value Number of cycles corresponding to xth percentile of probability for fatigue crack initiation in a component Transformed dissolved oxygen (ppm) Exponent of power-law dependence of fatigue life on strain rate defined as the product ofPcand Rp Material parameter that depends on tensile strength and sulfur content of steel
NUREG/CR-6583 86
OAGI0000759 00104

------------------------------------------ --------
Ra Average surface roughness, defined as arithmetic mean deviation of surface height from mean line through profile - · Environmental parameter that depends on temperature and dissolved oxygen Parameter that defines temperature dependence of environmental.factorRp RMS surface roughness, defined as root-mean-square deviation of surface profile from mean line Sulfur content of steel (wt.%) Transformed sulfur content (wt.o/o) Applied stress amplitude (MPa) Value of stress amplitude adjusted for mean stress (MPa) · . Time for concentration of absorbed hydrogen to· reach a criticaJ ,level to cause cleavage fracture -Rise time of loading cycle {s) Test temperature {0 C) · Transformed temperature (°C) Average critical velocity for initiation of environmentally·- assisted enhancement of crack growth (mm·s-1) -
_ Average environmentally assisted crack growth rate (cm·s-1) Percentile of probability distribution ·Failure criteria defined as 25, 50, or,lOOo/o decrease in peak tensile stress
-87 NUREG/CR-6583
OAGI0000759_001 05

References
1. ASME Boiler and Pressure Vessel Code Section m- Rules for Construction of Nuclear Power Plant Components, The American Society of Mechanical Engineers. New York, 1992 Ed.
2. B. F. Langer, Design of Pressure Vessels for Low-Cycle Fatigue, ASME J. of Basic Engineering 84 (1962) 389-402.
3. Tentative Structural Design Basis for Reactor Pressure Vessels and Directly Associated Components (Pressurized,.Water Cooled Systems}, PB 151987, U.S. Dept. of Commerce, Office ofTechnical Service, 1 Dec. 1958 Revision.
4. S. Ranganath, J. N. Kass, and J. D. Heald, Fatigue Behavior of Carbon steel Components in High-Temperature Water Environments, in BWR Environmental Cracking Margins for Carbon Steel Piping, EPRI NP-2406, Electric Power Research Institute, Palo Alto, CA. Appendix 3 (May 1982}.
5. W. A. VanDer Sluys, Evaluation of the Available Data on the Effect of the Environment on the Low Cycle Fatigue Properties in Light Water Reactor Environments, in Proc .. 6th Intl. Symp. on Environmental Degradation of Materials in Nuclear Power Systems - Water Reactors, R. E. Gold and E. P. Simonen, eds., The Metallurgical Society, Warrendale, PA, pp. 1-4 (1993).
6. N. Nagata, S. Sato, and Y. Katada, Low-Cycle Fatigue Behavior of Pressure Vessel Steels in High-Temperature Pressurized Water, ISIJ Intl. 31 (1}, 106-114 (1991).
7. M. Higuchi and K. lida, Fatigue Strength Correction Factors for Carbon and Low-Alloy Steels in Oxygen-Containing High-Temperature Water. Nucl. Eng. Des. 129, 293-306 (1991).
8. M. Higuchi, K. Iida, and Y. Asada, Effects of Strain Rate Change on Fatigue Life of Carbon steel in High-Temperature Water, in Fatigue and Crack Growth: Environmental Effects, Modeling Studies, and Design Considerations, PVP Vol. 306, S. Yukawa, ed., American Society of Mechanical Engineers, New York, pp. 111-116 (1995); also in Proc. ofSymp. on Effects of the Environment on the Initiation of Crack Growth, ASTM STP 1298, American Society for Testing and Materials, Philadelphia ( 1997).
9. H. Kanasaki, M. Hayashi, K. Iida, and Y. Asada, E;jfects of Temperature Change on Fatigue Life of Carbon steel in High Temperature Water, in Fatigue and Crack Growth: Environmental Effects, Modeling Studies, and Design Considerations, PVP Vol. 306, S. Yukawa, ed., American Society of Mechanical Engineers, New York, pp. 117-122 (1995}.
10. G. Nakao, H. Kanasaki, M. Higuchi, K. Iida, and Y. Asada, Effects of Temperature and Dissolved Oxygen Content on Fatigue Life of Carbon and Low-Alloy Steels in LWR Water Environment, in Fatigue and Crack Growth: Environmental Effects, Modeling Studies. and Design Considerations, PVP Vol. 306, S. Yukawa, ed., American Society of Mechanical Engineers, New York. pp. 123-128 (1995).
NUREG/CR-6583 88
OAGI0000759 00106

11. 0. K. Chopra and W. J. Shf.tck. Effects of LWR Environments on Fatigue Life of Carbon and Low-Alloy Steels, in Fatigue and Crack Growth: Environmental Effects, Modeling Studies, and Design Considerations, PVP Vol. 306, S. Yukawa, ed., American Society of Mechanical Engineers, New York, pp. 95-109 (1995).
12. 0. K. Chopra and W. J. Shack, Effects of Material and Loading Variables on Fatigue Ufe of Carbon and Low-Alloy Steels in LwR Environments, in Transactions of 13th Int. Conf. on Structural Mechanics in Reactor Technology (SMiRf 13), Vol. II, M. M. Rocha and J. D. Riera, eds., Escola de Engenharia - Universidade Federal do Rio Grande do Sui. Porto Alegre, Brazil, pp. 551-562 (1995).
13. 0. K. Chopra and W. J. Shack, Evaluation of Effects of LWR Coolant Environments on Fatigue Life of Carbon and Low-Alloy Steels, :in Effects of the Environment on the Initiation of Crack Growth, ASTM STP 1298, W. A. VanDer Sluys, R. S. Piascik, and R. Zawierucha, eds., American Society for Testing and Materials, Philadelphia, pp. 247-266 (1997).
14. 0. K. Chopra and W. J. Shack, Low-cycle Fatigue of Piping cind Pressure Vessel Steels in LWR Environments, Nucl. Eng. Des. (1998).
15. H. Mimaki, H. Kanasaki, I. Suzuki, M. Koyama; M. Akiyama, T. Okubo, and Y. Mishima, Material Aging Research Program for PWR ·Plants,· in Aging Management Through Maintenance Management, PVP Veil. 332; I. T. Kisisel, ed., American Society of Mechanical Engineers, New York, pp. 97-105 (1996).
16. W. J. Shack and W; F. Burke, Fatigue of Type 316NG SS, in Environmentally Assisted Cracking in Light Water Reactors, Semiannual Report, October 1989-March 1990, NUREG/CR-4667 Vol. 10, ANL-91/5, pp. 3-19 (March 1991).
17. K. lida, A Review of Fatigue Failures in LWR Plants in Japan; Nucl. Eng. Des. 138, 297-312 (1992).
18. P. D. Hicks, in Environmentally Assisted Cracking in Light Water Reactors: Semiannual Report October 199D-March 1991, NUREG/CR-4667 Vol. 12, ANL-91/24, pp. 3-18 (Aug. 1991).
19. P. D. Hicks and W. J. Shack, in Environmentally Assisted Cracking in Light Water Reactors, Semiannual Report, April-september 1991, NUREG/CR-4667 Vol. 13, AN~ 92/6, pp. 3-8 (March 1992). ·
20. 0. K. Chopra, W. F. Michaud,·and W. J. Shack, in Environmentally Assisted Cracking in Light Water Reactors, Semiannual Report, October 1992-March 1993, NUREG/CR-4667 Vol. 16, AN~93/27, pp. 3-19 {Sept. 1993).
21. 0. K. :chopra. W; F. Michaud, W. J, Shack, and W. K. Soppet, in Environmentally Assisted Cracking in Light Water Reactors, Semiannual Report, April-September 1993, NUREG/CR-4667 Vol. 17, AN~94/16, pp. 1-22 {June 1994}.
89 NUREG/CR-6583
OAGI0000759 00107

22. 0. K. Chopra, W. F. Michaud, and W. J. Shack, in Environmentally Assisted Cracking in Light Water Reactors, Semiannual Report, October 1993-March 1994, NUREG/CR-4667 Vol. 18, ANL-95/2, pp. 1-10 (March 1995).
23. 0. K. Chopra, D. J. Gavenda, and W. J. Shack, in Environmentally Assisted Cracking in Light Water Reactors, Semiannual Report, April-September 1994, NUREG/CR-4667 Vol. 19, ANL-95/25, pp. 1-17 (Sept. 1995).
24. 0. K. Chopra, D. J. Gavenda, and W. J. Shack.- in Environmentally Assisted Cracking in Light Water Reactors, Semiannual Report, October·1994-March 1995, NUREG/CR-4667 Vol. 20, ANL-95/41. pp. 1-19 (Jan. 1996).
25. 0. K. Chopra and W. J. Shack, in EnvironmentaHy Assisted Cracking in Light Water Reactors, Semiannual Report, April 1995-December 1995, · NUREG/CR-4667 Vol. 21, ANL-96/1, pp. 1-27 (July 1996).
26. S. Majumdar, 0. K. Chopra, and W. J. Shack, Interim Fatigue Design Curves for Carbon, Low-Alloy, and Austenitic Stainless Steels in LWR Environments, NUREG/CR-5999, ANL-93/3 (April 1993).
27. J. Keisler, 0. K. Chopra, and W. J. Shack, Fatigue Strain-Life Behavior of Carbon and Low-Alloy Steels, Austenitic Stainless Steels, and Alloy 600 in LWR Environments, NUREG/CR-6335, ANL-95/15 (Aug. 1995). ·
28. J. Keisler, 0. K. Chopra, and W. J. Shack. Statistical Models for Estimating Fatigue Strain-Life Behavior of Pressure Boundary Materials in Light Water Reactor Environments, Nucl. Eng. Des~ 167, 129-154 (1996).
29. W. A. Van Der Sluys and S. Yukawa, Status of PVRC Evaluation of LWR Coolant Environmental Effects on the s-N Fatigue Properties of Pressure Boundary Materials, in Fatigue and Crack Growth: Environmental Effects, Modeling Studies, and Design Considerations, PVP Vol. 306, S. Yukawa, ed., American Society of Mechanical Engineers, New York, pp. 47-58 (1995).
30. A. G. Ware, D. K. Morton, and M. E. Nitzel, Application of NUREG/CR-5999 Interim Design Curves to Selected Nuclear Power Plant Components, NUREG/CR-6260, INEL-95/0045 (March 1995).
31. A. F. Deardorff and J. K. Smith, Evaluation of Conservatisms and Environmental Effects in ASME Code, Section III, Class 1 Fatigue Analysis, SAND94-0187. prepared by Structural Integrity Associates, San Jose, CA. under contract to Sandia National Laboratories (Aug. 1994).
32. M. E. Mayfield, E. C. Rodabaugh, and R. J. Eiber, A Comparison of Fatigue Test Data on Piping with the ASME Code Fatigue Evaluation Procedure, ASME paper 79-PVP-92, American Society of Mechanical Engineers, New York (1979).
33. L. F. Kooistra, E. A. Lange, and A. G. Pickett, Full-Size Pressure Vessel Testing and Its Application to Design, J. Eng. Power 86, 419-428 {1964).
NUREG/CR-6583 90
OAGI0000759 00108

--------------------------------------------------------------------------
34. L.A. James, The Effect ofTemperature and Cyclic Frequency Upon Fatigue Crack Growth Behavior of Several Steels in an Elevated Temperature Aqueous Environment, J. Pressure Vessel Technol. 116, 122-127 (1994).
35. D. D. Macdonald, A. C. Sco.tt, and P. Wentrcek, External Reference Electrodes for Use in High Temperature Aqueous Systems, J. Electrochem. Soc. 126, 908-911 (1979).
36. Y. Katada, N. Nagata, and S. Sato,.E.ffec{of Dissolved Oxygen Con~entration on Fatigue Crack Growth Behavior of A533 B Steel in High-Temperature Water, ISIJ Inti. 33 {8), 877-883 (1993).
37. M. E. Indig, Environmental Aspects of Carbo_n Steel Stress C~rrosion iry. High Purity Water, in BWR Environmental Cracking Margins for Carbon steel Piping,· EPRI NP-2406, Electric Power Research Institute, Palo Alto. CA. Appendix 1 (May 1982)_.
38. T. A. Auten and J. V. Monter, Temperature and Environmentally Assisted Cracking in Low Alloy Steel, in Proc. Seventh Inti. Symp. on Enviro~mental Degradation of Materials in Nuclear Power Systems- Water Reactors, ·G. Airey et al., eds .• The Metallurgical Society, Warrendale, PA, pp. 1145-1156 (1995)~ ·
39. H. Choi, S. Smialowska, and D. D. Macdon~ld, Stress Corrosion C~acking of ASME SA508-Cl2 Pressure Vessel Steel, EPRI-2853, Electric Power Research Institute, Palo Alto, CA. Section 4 (Feb. 1983).
40. F. P. Ford, D. F. Taylor, and P. L. Andresen, Corrosion-Assisted Cracld.ng of Stainless and Low-Alloy Steels in LWR .Environments, EPRI NP-5064s: Electric· Power Research Institute, Palo Alto, CA (Feb. 1987) .
41. C. Laird, The Influence of Metallurgical Structure on the Mechanism of Fatigue Crack Propagation, in Fatigue Crack Propagation, ASTM STP 415, AmeriCan Society for Testing and Materials, Philadelphia, pp. 131-1SO (1967). · · , ·
42. K. J. Miller, Initiation and Growth Rates ojShort Cracks, in Fundamentals of Deformation and Fracture. B. A. Bilby,· K. J~ Miller, and J. R. Willis, eds .• Cambridge United Press, pp. 476-500 (1984).
43. K. J. Miller, Damage in Fatigue: A New Outlook, in Pressure Vessels and Piping Codes and Standard: Volume 1- Current Applications. PVP Vol. 313-1, K. R. Rao andY. Asada, eds., American Society of Mechanical Engineers, NewYork, pp. 191-192 (1995).
. :· l '··
44. S. Suresh and R. 0. Ritchie, Propagation of Short Fatigue Cracks, Int. Metals Reviews 29, 445-476 (1984).
. .
45. D. J. Gavenda, P. R. Luebbers, and 0. K. Choprea: Crack Initiation and Crack Growth Behavior of Carbon and Low-Alloy St~elss, i~ Fatigue and Fracture 1, PVP Vol. 350, S. Rahman, K. K. Yoon. s. Bhandari: R. Warke, a~d J. M. Bloom, eds .• American Society of Mechanical Engineers, New York, pp. 243-255 (1997). ·
91 NUREG/CR-6583
OAGI0000759 00109

46. C. M. Suh, R Yuuki, and H. Kitagawa, Fatigue Microcracks in a Low Carbon Steel, Fatigue Fract. Engng. Mater. Struct. 8, 193-203 (1985).
4 7. K. Tokaji, T. Ogawa, and S. Osako, The Growth of Microstructurally Small Fatigue Cracks in aFerritic-Pearlitic Steel, Fatigue Fract. Engng. Mater. Struct. 11, 331-342 (1988).
48. K. Tokaji, T. Ogawa, and Y. Harada, The Growth of Small Fatigue Cracks in a Low Carbon Steel; The Effect of Microstructure and Limitations of Linear Elastic Fracture Mechanics, Fatigue Fract. Engng. Mater. Struct. 9, 205-217 (1986).
49. M. W. Brown, Inteiface Between Short, Long, and Non-Propagating Cracks, in The Behavior of Short Cracks, EGF Pub. 1, M. J. Miller and E. R de los Rios, eds .. Mechanical Engin~ering Publication, London: pp. 423-439 (1986).
50. K. Tokaji and T. Ogawa, The Growth of Microstructurally Small Fatigue Cracks in Metals, in Short Fatigue Cracks, ESIS 13, M. J. Miller and E. R. de los Rios, eds., Mechanical Engineering Publication, London, pp. 85-99 (1992).
51. K. Tokaji, T. Ogawa·. Y. Harada, and Z. Ando, Limitations of Linear Elastic Fracture Mechanics in Respect of Small Fatgue Cracks and Microstructure, Fatigue Fract. Engng. Mater. Struct. 9, l-14 (1986).
52. E. It de los Rios, Z. Tang, and K. J. Miller, Short Crack Fatigue Behavior in a Medium Carbon Steel, Fatigue of Engineering Materials and Structures 7, 97-108 (1984).
53. E. ·R de los Rios, A: Navarro, and K. Hussain, Microstructural Variations in Short Fatigue Crack Propagation of a C-Mn Steel, in Short Fatigue Cracks, ESIS 13, M. J. Miller and E. R de los Rios, eds., Mechanical Engineering Publication, London, pp. 115-132 (1992).
54. T. Mizuno, S. Pednekar, S. Sinialowska, and D. D. Macdonald. Corrosion Behavior of Carbon Steel in OX!}genated Water Environments, EPRI-2853, Electric Power Research Institute, Palo Alto, CA, Section 2 (Feb. 1983).
55. G. Wranglen, Pitting and Sulphide Inclusions in.Steel. Corr. Sci. 14, 331-349 (1974).
56. J. H. Bulloch, A Review of the Fatigue Crack Extension Behaviour of Ferritic Reactor Pressure Vessels Materials in Pressurized Water Reactor Environments, Res. Mech. 26, 95-172 (1989).
57. W. A. VanDer Sluys and R H. Emanuelson, Environmental Acceleration of Fatigue Crack Growth in Reactor Pressure Vessel Materials, EPRI Report TR-102796 (Aug. 1993).
58. E. Lenz, N. Wieting, and H. Munster, Influence ofVariation of Flow Rates and Temperature on the.· Cyclic. Crack Growth Rate under BWR Conditions, in Proc. 3rd Int. Symp. on Environmental Degradation of Materials in Nuclear Power Systems- Water Reactors, G. J. · Theus and J. R. Weeks, eds., The Metallurgical Society, Warrendale, PA, pp. 283-288 (1988).
NUREG/CR-6583 92
OAGI0000759 00110

59. L. .A. James, G. L. Wire, and W. H.· ~ullen, The Effect· of Water Floiv Rate Upon the Environmentally-Assisted Cracking Response of a Low-Alloy Steel, J. Pressure Vessel Technol. 117 (3), 238-244 (1995). · ·
.. 60. L.A. James and T. J. Poskie, Correlation Between MnS Area Fraction and EAC Behavior,
WAPD-T-3012, USDOE Office ofScientificTechni~al Information, Oak Ridge, TN (1993).
61. L. A. James, H. B. Lee, G. L. Wire, S. R. Novak. and W. H. Cullen, Corrosion Fatigue Crack Growth in Clad Low-Alloy Steels- Part II: Water Flow Rate Effects in High-8ulfur Plate Steel, J. Pressure Vessel Techno!. 119 (3), pp. 255-263 (1997).
62. G. L. Wire, and Y. Y. Li, Initiation of Environmentally-Assisted Cracking in Low-Alloy Steels, in Fatigue and Fracture Volume 1, PVP Vol. 323, H. S. Mehta, ed., American Society ofMechanic~l Engineers, New York, pp. 269-289 (1996).
63. L.A. James, The Initiation of Environmentally-Assisted Cracking in Semi-Elliptical Swjace Cracks, in Pressure Vessel and Piping Codes and Standards, PVP Vol. 353, T. C. Esselman, ed., American Society_ofMechanical Engineers, New York. pp. 125-139 (1997). . ..
64. W. H. Cullen, M. Kemppainen, H. mmninen, and K. Torronen, The Effects of Sulfur Chemistry and Flow Rate on Fatigue Crack Growth Rates in LWR Environments, NUREG/CR-4121 (1985).
65. J. H. Bulloch, Environmental Assisted Cracking Phenomena in Reactor Pressure Vessel Steel - The Role of Manganese Sulphide Segregation, ·in Proc. 3rd Int. Symp. on Eiwironmental Degradati<?n of Materials in N~clear Power Systems ..:. Water Reactors, G. J. Theus and J. R. Weeks, eds., The Metallurgical Society, Warrendale, PA, pp. 261-267 (1988).
66. H. Hanninen, M. Vulli, and W. H. Cullen. Study of Corrosion Pr~ducts on Fatigue Fracture Surfaces of Pressure Vessel Steels Tested in PWR Environments by Using X-Ray Photoelectron and Auger Electrori Spectroscopy, in Proc. 3rd Int. Symp. on Environmental Degradation of Materials in _Nuclear Power Systems - Water Reactors., G. J. Theus and J. R Weeks, eds .. The Metallurgical SocietY. Warrendale, PA pp. 289-298 ·(1988).
67. J.D. Atkinson, J. H. Bulloch, and J. E .. Forrest, A Fractographic Study of Fatigue Cracks Produced in A533B Pressure Vessel "Steel Exposed to Simulated PWR Pri.Tri.ary Water
_ Environmen.ts, ~n Proc. 2nd Int. Atomic E'n.ergy Agency Speci~iists' Meeting on Subcritical Crack Growth, NUREG/CP..;.o067, MEA-2090, Vol.~· pp. 269-290 (April 1986).
68. J. D. Atkinson and J. E. Forrest, The Role of MnS Inclusions in the Development of Envii-omnentally Assisted Cr~king.of Nuclear ReaCtor Pressure 'vessei Steels, in Pro c. 2nd Int. Atomic Energy Agency Specialists' M~eting: on SubcritiCal Crack Growth, NUREG/CP-0067, MEA-2090, Vol. 2, pp. 153-178 (Aprill986).
93 NUREG/CR-6583
OAGI0000759 00111

69. W. A. Van Der Sluys and R H. Emanuelson, Environmental Acceleration of Fatigue Crack Growth in Reactor Pressure Vessel Materials and Environments, in Environmentally Assisted Cracking: Science and Engineering, ASTM STP 1049, W. B. Lisagor, T. W. Crooker, and B. N. Leis, eds .. American Society for Testing and Materials, Philadelphia. PA, pp. 117-135 (1990).
70. J. D. Atkinson, J. Yu. and Z.-Y. Chen, An Analysis of the Effects of Sulfur Content and Potential on Corrosion Fatigue Crack Growth in Reactor Pressure Vessel Steels, Corros. Sci. 38 (5), 755-765 (1996).
71. T. A. Auten, S. Z. Hayden. and R. H. Emanuelson, Fatigue Crack Growth Rate Studies of Medium Suifllr Low Alloy Steels Tested in High Temperature Water, in Proc. 6th Int. Symp. on Environmental Degradation of Materials in ~uclear Power Systems·...:_ Water Reactors. R. E. Gold and E. P. Simonen, eds., The Metallurgical Society, Warrendale, PA, pp. 35-40 (1993).
72. F. P. Ford and P. L. Andresen, Stress Corr.osion Cracking of Low-Alloy Pressure Vessel Steel in 288°C Water, in Proc. 3rd Int. Atomic Energy Agency Specialists' Meeting on Subcritical Crack Growth, NUREG/CP-0112, Vol. 1, pp. 37-56 (Aug. 1990).
73. F. P. Ford, Overview of Collaborative Research into the Mechanisms of Environmentally Controlled Cracking in the Low Alloy Pressure Vessel Steel/Water System, in 'Proc. 2nd Int. Atomic Energy Agency Specialists' Meeting on Subcrittcal Crack Growth, NUREG/CP-0067, MEA-2090, Vol. 2, pp. 3-71 (April1986).
74. F. P. Ford, S. Ranganath, and D. Weinstein, Environmentally Assisted Fatigue Crack Initiation in Low-Alloy Steels - A Review of the Literature and the ASME Code Design Requirements, EPRI Report TR-102765 (Aug. 1993).
75. F. P. Ford, Prediction of Corrosion Fatigue Initiation in Low-Alloy and Carbon Steel/Water Systems at 288°C, in Proc. 6th Int. Symp. on Environmental Degradation of Materials in Nuclear Power Systems - Water Reactors, R. E. Gold and E. P. Simonen, eds .• The Metallurgical Society, Warrendale, PA. pp. 9-17 (1993).
76. F. P. Ford, Quantitative Prediction of Environmentally Assisted Cracking, Corros. 52 (5), 375-395 (1996).
77. H. Hanninen, K. Torronen, and W. H. Cullen, Comparison of Proposed Cyclic Crack Growth Mechmi.isrrts of Low Alloy Steels in LwR Environments, in Proc. 2nd Int. Atomic Energy Agency Specialists' Meeting on Subcritical Crack Growth, NUREG/CP-0067, MEA-2090, Vol. 2, pp. 73-97 (April 1986). .
78. H. Hanninen, K. Torronen, M. Kempainen, and S. Salonen, On the Mechanisms of Environment Sensitive Cyclic Crack Growth of Nuclear Reactor Pressure Vessel Steels, Corros. Sci. 23, 663-679 (1983).
79. K. Torronen, M. Kempainen, and H. Hanninen, Fractographic Evaluation of Specimens of A533B Pressure Vessel Steel, EPRI Report NP-3483. Project 1325-7 (May 1984).
NUREG/CR-6583 94
OAGI0000759 00112

80. 0. · K. Chopra and W. J. Shack, Effects of LWR Coolant Environments on Fatigue S-N Curoes for Carbon and Lo~Alloy Steels, 'in· Pressure Vessel and Piping Codes and Standards, PVP Vol. 339, T. C. Esselman, ed., American Society of Mechanical Engineers, New York, pp. 185-198 (1996). ·
81. · R. A. Oriani, A Mechanistic ·Theory of Hydrogen Embrittlement of Steels, Ber. Bunsenges. Phys. Chern: 76, 84~57 (1972).- ·
82. C. D. Beachem, A New Modelfor Hydrogen Assisted Cracking, Met. Trans. 3A (2), 437-451 (1972) ..
83. T. F. Kassner, W. J. Shack, W. E. Ruther, and J. H. Park, Environmentally Assisted Cracking ofFerritic Steels, in Environmentally Assisted Cracking in Light Water Reactors, Semiannual Report, April-September 1990, NUREG/CR-4667 Vol. 11, ANI...:-91/9, pp. 2-9 (May 1991). , ...
84. E. D. Eason, E. E. Nelson, and J.D. Gilman. Modeling of Fatigue Crack Growth Rate for -Femtic Steels in Light Water Reactor Environments. PVP-Vol. 286, Changing Priorities of Code and Standards, ASME. pp. '13f-142 (1994).
· 85. D. A. Hale, S. A. Wilson, E. Kiss, and A. J. · GianuZzi, Low· Cycle Fatigue Evaluation of Primary Piping Materials in a BWR Environment, GEAP-20244, U.S. Nuclear Regulatory Commission (Sept. 1977).
86. D. A. Hale, S. A. Wilson, J. N; · Kass.· and E. Kiss;; Low Cycle Fatigue Behavior of Commercial Piping Materials in aBWR Environment, J. Eng. Mater. Technol. 103, 15-25 (1981).
87. S. Ranganath, J. N. Kass, and J. D. Heald, Fatigue Behavior of Carbon steel Components in High-Temperature Water Environments, in Low...:cycle Fatigue and Life Prediction, ASTM STP 770, C. Amzallag, B. N. Leis, and P. Rabbe, eds .• American Society for Testing and Materials, Philadelphia, pp. 436-459 (1982): '
88. J. B. Terrell, Fatigue Life Characterization of Smooth and Notched Piping Steel Specimens in 288°C Air Environments. NUREG/CR-5013, EM-2232 Materials Engineering Associates. Inc .. Lanham. MD (May 1988).
89. J. B. Terrell, Fatigue Strength of Smooth and Notched Specimens of ASME SA 1 06-B Steel in PWR Environments, NUREG/CR-5136, MEA-2289, Materials Engineering Associates, Inc., Lanham, MD (Sept. 1988).
90. J: B. Terrell, Effect of Cyclic Frequency on the Fatigue Life of ASME SA-106-B Piping Steel inPWREnvironments, J. Mater. Eng. 10,193.:..203 {1988).
91. H. Abdel-Raouf, A. Plumtree, and T. H. Topper, Effects of Temperature and Deformation Rate· on Cyclic Strength and Fracture of Low-carbon steel, in Cyclic . Stress-Strain Behavior- Analysis, Experimentation, and Failure Prediction, ASTM STP 519, American Society for Testing and Materials, Philadelphia, pp. 28-57 (1973).
95 NUREG/CR-6583
OAGI0000759 00113

92. B. H. Lee, and I. S. Kim. Dynamic Strain Aging in the High-:Temperature Low-Cycle Fatigue of SA 508 CL 3 Forging Steel. J. Nucl. Mater. 226, 216-225 (1995).
93. T. T. Pleune and 0. K. Chopra, Artificial Neural. Networks and Effects of Loading Cinditions on Fatigue Life of Carbon and Low-Alloy Steels, in Fatigue and Fracture I, PVP Vol. 350, S. Rahman, K. K. Yoon, S. Bhandari, R. Warke, and J. M. Bloom, eds., American Society of Mechanical Engineers, New York, pp. 413-423 (1997).
94. H. S. Mehta and· S. R . Gosselin, An Environmental Factor Approach to Account for Reactor Water Effects in Light Water Reactor Pressure Vessel and Piping Fatigue Evaluations, EPRI Report TR-105759 (Dec. 1995).
95. H. S. Mehta and S. R. Gosselin, An Environmental Factor Approach to Account for Reactor Water Effects. in Light Water Reactor Pressure Vessel and Piping Fatigue Evaluations, in Fatigue and Fracture Volume I, PVP Vol. 323, H. S. Mehta, ed., American Society of Mechanical Engineers, New York, pp. 171-185 (1996).
96. R. E. Peterson, Fatigue Tests of Small Specimens with Particular Reference to Size Effect. Trans. Amer. Soc. Steel Testing 18, 1041-1053 (1930).
97. D. Morkovin and H. F. Moore, Third Progress Report on the Effect of Size of Specimen on Fatigue Strength of Three Types of Steel, Proc. Amer. Soc. Test. Mater. 44, 137-158 (1944).
98. C. E. Philips and R. B. Heywood, The Size Effect in Fatigue of Plain and Notched Steel Specimens Loaded Under Reversed Direct Stress,·Proc. Inst. Mech. Engr. 165, 113-124 (1951).
99. C. Massonnet, The. Effect of Size, Shape, and Grain Size on the Fatigue Strength of Medium Carbon steel. Proc. Amer. Soc. Test. Mater. 56, 954-978 {1956).
100. P. S. Maiya and D. E. Busch, Effect of Surface Roughness on Low-Cycle Fatigue Behavior ofType304StainlessSteel. Met. Trans. 6A, 1761-1766 (1975).
101. P. S. Maiya, Effect of Surface Roughness and Strain Range on Low-Cycle Fatigue BehaviorofType 304 Stainless Steel. Scripta Metall. 9, 1277-1282. (1975).
102. K. J. Stout. Surface Rouglmess- Measurement, Interpretation. and Signifz.cance of Data. Mater. Eng. 2, 287-295 (1981).
103. K. !ida, A Study of Surface Finish Effect Factor in ASME B & PV Code Section III, in Pressure Vessel Technology, Vol. 2, L. Cengdian and R. W. Nichols, eds., Pergamon Press, New York, pp. 727-734 (1989);
104. M. A. Pompetzki, T. H. Topper, and D. L. DuQuesnay, The Effect of Compressive Underloads and Tensile Overloads on Fatigue Damage Accumulation in SAE 1045 Steel. Int. J, Fat. 12 (3); 207-213 (1990).
NUREG/CR-6583 96
OAGI0000759 00114
--------------------------------------------------------------------------------------
105. A. Conle and T. H. Topper, Evaluation of Small Cycle Omission Criteria for Shortening of Fatigue Service Histories, Int. J. Fat. 1, 23-28 (1979).
106. A. Conle and T. H. Topper, Overstrain Effects During Variable Amplitude Service History Testing, Int. J. Fat. 2, 130-136 (1980).
107. Li Nian and Du Bai-Ping, Effect of Monotonic and Cyclic Prestrain on the Fatigue Threshold in Mediwn-carbon steels, Int. J. Fat. 14 (1), 41-44 (1992).
108. Li Nian and Du Bai-Ping, The Effect of Low-Stress High-Cycle Fatigue on the Microstructure and Fatigue Threshold of a 40Cr Steel, Int. J. Fat. 17 (1). 43-48 (1995).
109. E. Haibach and D. Schutz, Fatigue Life Evaluation with Particular Attention to Local Strain and Stress Time Histories, Pro c. Inst. Mech. Engr .. 197 4.
110. D. J. Dowdell, H. H. E. Leipholz, and T. H. Topper, The Modified Life Law Applied to SAE-1045 Steel, Int. J. Fract. 31, 29-36 (1986).
97 NUREG/CR-6583
OAGI0000759 00115

Appendix A: Fatigue Test Results _
A-1 NUREG/CR-6583
OAGI0000759 00116

TableAl. Fatigue test results for Al 06-Gr B carbon steel at 288°C
Dissolved Conduct!- Tensile Compres- Stress Strain Ufe Test Environ Oxygenb pH vity Rate sive Rate Range Range N2s
Nwnber -menta (ppb} atRT (j.i.S/cm) (%/s) (%/s) (MPa) (%) (Cycles)
1508 Air 0.4 0.4 910.9 1.002 3,305 1524 Air 0.4 0.4 892.3 0.950 3.714 1523 Air 0.4 0.4 898.6 0.917 2,206 1521 Air 0.4 0.4 889.4 0.910 3.219 1522 Air 0.4 0.4 905.4 0.899 3,398 1515 Air 0.4 0.4 866.1 0.752 6,792 1749C Air 0.4 0.4 6.372 1717 Air 0.4 0.004 884.6 0.758 6.217 1625 Air 0.004 0.4 887.7 0.757 4.592 1629d Air 0.4 0.4 782.9 0.503 31.243 1590 Air 0.4 0.004 821.1 0.503 24.471 1576 Air 0.004 0.4 805.8 0.503 28,129 1505 Air 0.4 0.4 767.6 0.501 31,200 1525 Air 0.4 0.4 743.6 0.452 65,758 1640 Air 0.4 0.4 710.9 0.402 65,880 1538 Air 0.4 0.4 708.0 0.387 >1,000,000 1517 Air 0.4 0.4 692.5 0.353 2.053,295 1659 Air 0.004 0.4 656.2 0.343 >114.294 1526 DI 0.4 0.4 876.4 0.873 3.332 1527 DI 6.0 0.4 0.4 752.8 0.493 10.292 1528 DI 5 5.8 0.4 0.4 744.1 0.488 25,815 1743e DI <1 6.5 0.08 0.4 0.4 712.6 0.386 84,700 1530 PWR 3 6.9 41.67 0.4 0.4 885.5 0.894 1.355 1545 PWR 8 6.9 22.73 0.4 0.4 889.7 0.886 3.273 1533 PWR 4 6.9 45.45 0.004 0.4 916.0 0.774 3.416 1529 PWR 3 6.9 45.45 0.4 0.4 743.4 0.484 31,676 1605 PWR 9 6.5 23.81 0.4 0.004 785.2 0.460 >57,443 1588 PWR 6 6.5 23.26 0.004 0.4 828.7 0.514 15,321 1539 PWR 6 6.8 38.46 0.4 0.4 690.9 0.373 136.570 1542 PWR 6 6.6 27.03 0.4 0.4 631.8 0.354 >1.154,892 1645 Hi DO 800 6.1 0.07 0.4 0.4 831.1 0.721 2.736 1768 Hi DO 600 6.0 0.07 0.4 0.004 907.3 0.755 1,350 1626 Hi DO 900 5.9 0.13 0.004 0.4 910.1 0.788 247 1715 Hi DO 600 5.9 0.08 0.004 0.4 904.1 0.813 381 1711 Hi DO 630 5.8 0.31 0.4 0.4 772.1 0.542 5.850 1707 Hi DO 650 5.9 0.08 0.4 0.004 803.0 0.488 3.942 1709 Hi DO 650 5.9 0.11 0.4 0.004 805.1 0.501 3.510 1627 Hi DO BOO 5.9 0.10 0.004 0.4 826.8 0.534 769 1641 Hi DO BOO 5.9 0.09 0.4 0.4 693.0 0.385 17,367 1665 Hi DO BOO 6.1 0.08 0.004 0.4 717.0 0.376 3.455 1666 Hi DO 750 6.1 0.09 0.0004 0.4 729.6 0.376 >7,380 1647 Hi DO BOO 6.1 0.09 0.4 0.4 688.0 0.380 26,165 1660 Hi DO 750 6.1 0.11 0.004 0.4 689.6 0.360 >83.024 1649 Hi DO 700 6.3 0.08 0.4 0.4 673.4 0.352 28,710 1652 Hi DO 700 6.1 0.09 0.4 0.4 638.1 0.328 56,923 1655 Hi DO 750 6.1 0.10 0.4 0.4 567.6 0.289 >1,673.954 a DI = Deionized water and PWR = simulated PWR water with 2 ppm lithium and 1000 ppm boron. b Represent DO levels in effiuent water. c Tested with 5-min hold period at peak tensile strain. d Specimen preoXidized in water with 600 ppb DO for 100 h at 288°C. e Specimen preoxidized in water with 600 ppb DO for 30 h at 288°C.
NUREG/CR-6583 A-2
OAGI0000759_00117

TableA2. Fatigue test results for A533-Gr B low-alloy steel at 288°C
Dissolved Conducti- Tensile Compres- Stress Strain Ufe Test Environ Oxygenb · · pH vity Rate sive Rate Range Range N25
Number :...menta . (ppb) ·atRT (J.1S/cm) (%/s) (%/s) (MPa) (%) (Cycles) 1508 Air 0.4 0.4 910.9 1.002 3,305 1524 Air 0.4 0.4 892.3 0.950 3,714 1523 Air 0.4 0.4 898.6 0.917 2,206 1521 .Air 0.4 0.4 889.4 0.910 3,219 1522 Air 0.4 0.4 905.4 0.899 3,398 1515 Air 0.4 0.4 866.1 0.752 6,792 1749C Air 0.4 0.4 6,372 1717 Air 0.4 0.004 884.6 0.758 6,217 1625 Air - 0.004 0.4 887.7 0.757 4,592 1629d Air 0.4 0.4 782.9 0.503 31,243 1590 Air . 0.4 .0.004 821.1 0.503 24,471 1576 Air 0.004 0.4 .805.8 0.503 28.129 1505 Air 0.4 0.4 767.6 0.501 31,200 1525' Air 0.4 04 743.6 0.452 65,758 1640 Air 0.4 0.4 710.9 0.402 65,880 1538 .Air 0.4 0.4 708.0 0.387. >1.000,000 1517 Air 0.4 0.4 692.5 0.353 2,053,295 1659 Air 0.004 0.4 656.2 0.343 >114,294 1526 DI 0.4 0.4 876.4 0.873 3,332 1527 Dl 6.0 0.4 0.4 752.8 . ·0.493 10,292 1528 DI 5 5.8 0.4 .. 0.4 744.1 0.488 25,815 1743e DI <1 6.5 0.08 0.4 0.4 712.6 0.386 84,700 1530 PWR 3 6.9 41.67 ' 0.4 0.4 885.5 0.894 1,355 1545 PWR 8 6.9 22.73 0.4 0.4 889.7 0.886 3,273 1533 PWR 4 6.9 45.45 0.004 0.4 916.0 0.774 3,416 1529 PWR 3 6.9 45.45 0.4 04 743.4 0.484 31,676 1605 PWR 9 6.5 23.81 0.4 0.004 785.2 0.460 >57,443 1588 PWR 6 6.5 23.26 0.004 0.4 828.7 0.514 15,321 1539 PWR 6 6.8 38.46 0.4 0.4 690.9 0.373 136,570 1542 PWR 6 6.6 27.03 0.4 0.4 631.8 0.354 >1.154,892 1645 Hi DO 800 6.1 0.07 0.4 04 831.1 0.721 2,736 1768 Hi DO 600 6.0 0.07 0.4 0.004 907.3 0.755 1,350 1626 Hi DO 900 5.9 0.13 0.004 0.4 910.1 0.788 247 1715 Hi DO 600 5.9 0.08 0.004 0.4 904.1 0.813 381 1711 Hi DO 630 5.8 0.31 0.4 0.4 772.1 0.542 5,850 1707 Hi DO 650 5.9 0.08 0.4 0.004 803.0 0.488 3,942 1709 Hi DO 650 5.9 0.11 0.4 0.004 805.1 0.501 3,510 1627 Hi DO 800 5.9 0.10 0.004 0.4 826.8 0.534 769 1641 Hi DO 800 5.9 0.09 0.4 0.4 693.0 0385 17,367 1665 Hi DO 800 6.1 0.08 0.004 0.4 717.0 0.376 3,455 1666 Hi DO 750 6.1 0.09 0.0004 0.4 729.6 0.376 >7,380 1647 Hi DO 800 6.1 0.09 0.4 0.4 688.0 0380 26,165 1660 Hi DO 750 6.1 0.11 0.004 0.4 689.6 0.360 >83,024 1649 Hi DO 700 6.3 0.08 0.4 0.4 673.4 0.352 28,710 1652 Hi DO 700 6.1 0.09 0.4 0.4 638.1 0.328 56,923 1655 Hi DO 750 6.1 0.10 0.4 0.4 567.6 0.289 >1,673,954 a 01 = Deionized water and PWR = simulated PWR water with 2 ppm lithium and I 000 ppm boron. b Represent DO levels 1n effiuent water. c Tested with 5-min hold period at peak tensile strain. d Specimen preoxidized in water with 600 ppb DO for 100 hat 288°C. e Specimen preoxidized in water with 600 ppb DO for 30 h at 288°C.
A-3 NUREG/CR-6583
OAGI0000759 00118

TableA3. Fatigue test results for A302-Gr Blow-alloy steel at 288°C
Dissolved Conduct! Tensile Compres- Stress Strain Life Test Environ Oxygenb pH -vity Rate slve Rate Range Range N25
Number -menta (ppb) atRr (~S/cm) (%/s} (%/s) (MPa) (%) (Cycles)
1697 (R) Air 0.4 0.4 944.5 0.756 8,070 1701 (R) Air 0.004 0.4 1021.4 0.757 4,936 1712 (R) Air 0.0004c 0.4 1041.9 0.759 5,350 1789 (R) Air 0.4 0.4 859.5 0.505 46,405 1783 (R) Air 0.4 0.4 796.1 0.408 >1,050,000 1780 (T2) Air 0.4 0.4 908.6 0.756 1,598 1781 (1'2) Air 0.004 0.4 952.4 0.755 375 1782 (T2) Air 0.4 0.4 752.8 0.404 33,650 1787 (T2) Air 0.4 0.4 667.5 0.342 431,150
1702 {R) PWR 3 6.5 20.00 0.4 0.4 921.2 0.735 6,212 1704 (R) PWR 3 6.5 19.23 0.004 0.4 1022.6 0.745 3,860 1716 (R) PWR 5 6.5 19.23 0.0004C 0.4 1042.3 0.739 3,718 1777(11 PWR 1 6.4 19.23 0.4 0.4 913.8 0.765 4,366 1115m PWR 1 6.5 19.42 0.004 0.4 995.6 0.750 1.458 1776 (T2) PWR 1 6.4 18.40 0.4 0.4 887.1 0.765 1.244 1774 (1'2) PWR 2 6.4 19.42 0.004 0.4 949.7 0.758 348
1788 {R) Hi DO 650 5.9 0.10 0.004 0.4 957.0 0.754 317 1784 {T2) Hi DO 510 6.0 0.07 0.004 0.4 937.6 0.783 111 a Simulated PWR water with 2 ppm lithium and I 000 ppm boron. b Represent DO levels in effluent water. c Slow strain rate applied only during 1/8 cycle near peak tensile strain.
NUREG/CR-6583 A-4
OAGI0000759 00119
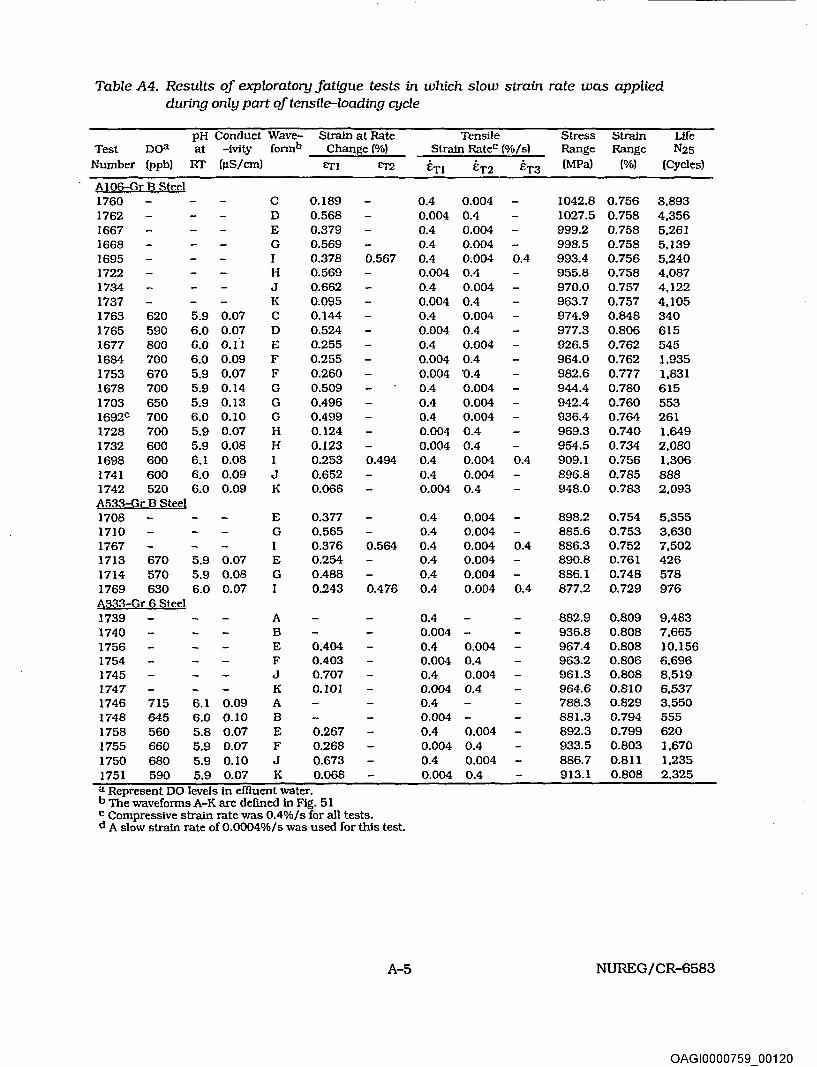
Table A4. Results of exploratory fatigue tests in which slow strain rate was applied during only part of tensile-loading cycle
pH Conduct Wave- Strain at Rate Tensile Stress Strain Life Test ooa at -lvity fonnb Chanse (%! Strain Ratec (%/s) Range Range N2s
Number (ppb) RT (JlS/cm) en £T2 En ET2 ET3 (MPa) (%) (Cycles)
A 106-Gr B Steel 1760 c 0.189 0.4 0.004 1042.8 0.756 3,893 1762 D 0.568 0.004 0.4 1027.5 0.758 4,356 1667 E 0.379 0.4 0.004 999.2 0.758 5,261 1668 G 0.569 0.4 0.004 998.5 0.758 5,139 1695 I 0.378 0.567 0.4 0.004 0.4 993.4 0.756 5,240 1722 H 0.569 0.004 0.4 955.8 0.758 4,087 1734 J 0.662 0.4 0.004 970.0 0.757 4,122 1737 K 0.095 0.004 0.4 963.7 0.757 4,105 1763 620 5.9 0.07 c 0.144 0.4 0.004 974.9 0.848 340 1765 590 6.0 0.07 D 0.524 0.004 0.4 977.3 0.806 615 1677 BOO 6.0 o.f1 E 0.255 0.4 0.004 926.5 0.762 545 1684 700 6.0 0.09 F 0.255 0.004 0.4 964.0 0.762 1.935 1753 670 5.9 0.07 F 0.260 0.004 "0.4 982.6 0.777 1,831 1678 700 5.9 0.14 G 0.509 0.4 0.004 944.4 0.780 615 1703 650 5.9 0.13 G 0.496 0.4 0.004 942.4 0.760 553 1692c 700 6.0 0.10 G 0.499 0.4 0.004 936.4 0.764 261 1728 700 5.9 0.07 H 0.124 0.004 0.4 969.3 0.740 1,649 1732 600 5.9 0.08 H 0.123 0.004 0.4 954.5 0.734 2,080 1698 600 6.1 0.08 I 0.253 0.494 0.4 0.004 0.4 909.1 0.756 1,306 1741 600 6.0 0.09 J 0.652 0.4 0.004 896.8 0.785 888 1742 520 6.0 0.09 K 0.066 0.004 0.4 948.0 0.783 2,093 A533-Gr B Steel 1708 E 0.377 0.4 0.004 898.2 0.754 5,355 1710 G 0.565 0.4 0.004 885.6 0.753 3,630 1767 I 0.376 0.564 0.4 0.004 0.4 886.3 0.752 7,502 1713 670 5.9 0.07 E 0.254 0.4 0.004 890.8 0.761 426 1714 570 5.9 0.08 G 0.488 0.4 0.004 886.1 0.748 578 1769 630 6.0 0.07 0.243 0.476 0.4 0.004 0.4 877.2 0.729 976 6333-Gr 6 ~teel 1739 A 0.4 882.9 0.809 9,483 1740 B 0.004 - 936.8 0.808 7,665 1756 E 0.404 0.4 0.004 967.4 0.808 10,156 1754 F 0.403 0.004 0.4 963.2 0.806 6,696 1745 J 0.707 0.4 0.004 961.3 0.808 8,519 1747 K 0.101 0.004 0.4 964.6 0.810 6,537 1746 715 6.1 0.09 A 0.4 788.3 0.829 3,550 1748 645 6.0 0.10 B 0.004 - 881.3 0.794 555 1758 560 5.8 0.07 E 0.267 0.4 0.004 892.3 0.799 620 1755 660 5.9 0.07 F 0.268 0.004 0.4 933.5 0.803 1,670 1750 680 5.9 0.10 J 0.673 0.4 0.004 886.7 0.811 1,235 1751 590 5.9 0.07 K 0.068 0.004 0.4 913.1 0.808 2,325 a Represent DO levels in effiuent water. b The waveforms A-K are defmed in Fig. 51 c Compressive strain rate was 0.4%/s for all tests. d A slow strain rate of 0.0004%/s was used for this test.
A-5 NUREG/CR-6583
OAGI0000759 00120

Appendix 8: Design Fatigue Curves for LWR Environments
B-1 NUREG/CR-6583
OAGI0000759 00121

-ca a.. ~ -Q)
"C ::s ::: c. E <( (/) (/) Q) '......
CJ)
-ca a.. :2: -(1)
"C ::s
:=: 0. E <( (/) (/) Q) ..... -(/)
Number of Cycles, N
1 Q1 1 os Number of Cycles, N
Figure B 1. Fatigue design curoes developed from statistical model for carbon and low-alloy steels under service conditions in which any one of the critical threshold values is not satisfted
NUREG/CR-6583 B-2
OAGI0000759_00122

<D "0 :::J
:::: 0. E <( (/) (/)
<D -----'--(/)
<D "0 :::3 :::: 0. E <( (/) en <D '--(/)
1'(>3 1 a4 1 as Number of Cycles, N
1 a 1 1 o2 1 a3 1 a4 1 as 1 as Number of Cycles, N,
Figure B2. Fatigue design curves developed from statistical model for carbon and loW-alloy steels at 200°C in water with ::::0.2 ppm dissolved oxygen
B-3 NUREG/CR-6583
OAGI0000759 _00123

Q) "'0 ::J ::: c. E <( en en Q) lo... .....
CJ)
-ca 0.. ~ -Q)
"'0 ::J ::: a. E <( en en Q) I>... .....
CJ)
1 Q2 1 Q3 1 Q4
Number of Cycles, N
1 o 1 1 02 1 o3 1 o4 1 05 1 as Number of Cycles, N
Figure B3. Fatigue design curves developed from statistical model for carbon and low-alloy steels at 250°C in water with ""'0:2 ppm dissolved oxygen
NUREG/CR-6583 B-4
OAGI0000759_00124

-cc D.. ~ -Q)
"0 ::J
.:::: 0.. E <( en en ~ -CJ)
-cc D.. ~ -
~
Q) "0 :::s ~ c. E <( en en ~ -CJ)
I . I ~ t d1'
·;~f~lf~ffill~l~lH~Ilr~li~;~~olljj ·-:····~·::t~t:··· --~··:···t· !· ~-: !t!-··-. t···-t···! ! ·:·:·:!!·········:·Sulfur ~0.015 wt. Yo ..
-------------
- - - - ASME co'd~'curve··:t::J:H~!+-·:.~·-~-~-r:!t!:Hl1·~·::::!=·~~:··n:+t+; - ····:·····:-··:·::;:r .. ··-u·-r·-·:u:• :· :·n:·-··· ..... :-;·:··:··: ·r:·rr· ··-·· .. :··-"!···r·:·: :::-·-·· · :···· r-:-·:·::: ..
1 Q1 1 Q4
Number of Cycles, N
1 Q1 1 Q3 1 o5 1 os Number of Cycles, N
Figure B4. Fatigue design curoes developed from statiStical modeljor carbon and low-alloy steels at 288°C in water with ...0.2 ppm dissolved oxygen
B-5 NUREG/CR-6583
OAGI0000759_00125

NRCFORM335 (2-e9) NRCM1102, 3201,3202
U 5 NUCLEAR REGULATORY COMMISSION
BIBLIOGRAPHIC DATA SHEET
1 REPORT NUMBER (Assigned by NRC. Add Vol, Supp, Rev., and Addendum Numbers, if any)
NUREG/CR-6583 ~------------------------~-oo--ms_~ ___ ·_s_oo __ ~_e_rew __ rs_~--------------------------------~~97/18
2. TITLE AND SUBTITLE
Effects ofLWR Coolant Environments on Fatigue Design Curves of Carbon and Low-Alloy Steels
5. AUTHOR(S)
0. K Chopra and W. J. Shack
3. DATE REPORT PUBUSHED
MONTH I YEAR
March 1998 4 FIN OR GRANT NUMBER
W6610 6. TYPE OF REPORT
Technical 7 PERIOD COVEI'lED {Inclusive Dates)
B. PERFORMING ORGANIZATION- NAME AND ADDRESS (If NRC, provide Division, Office or Region, U.S Nuclear Regulatory Commission, and maJ7ing address; If contractor, provide name and mailing address)
Argonne National Laboratory 9700 South Cass Avenue Argonne, IL 60439
9. SPONSORING ORGANIZATION-NAME AND ADDRESS (If NRC, type "Same as above": H contractor, provide NRC Division, Office or Region, U.S Nuclear Regulatory Commission, and mailing address}
Division of Engineering Technology Office of Nuclear Regulatory Research U.S. Nuclear Regulatory Commission Washington, DC 20555-0001
10 SUPPLEMENTARY NOTES
M. McNeil. NRC Project Manager
11. ABSTRACT (200 words or less)
The ASME Boller and Pressure Vessel Code provides rules for the construction of nuclear power plant components. Figures I-9.1 through 1-9.6 of Appendix I to Section III of the Code specify fatigue design curves for structural materials. While effects of reactor coolant environments are not explicitly addressed by the design curves. test data indicate that the Code fatigue curves may not always be adequate in coolant environments. This report summarizes work performed by Argonne National Laboratory on fatigue of carbon and low-alloy steels in light water reactor (LWR) _environments. The existing fatigue 5-N data have been evaluated to establish the effects of various material and loading variables such as steel type, dissolved oxygen level. strain range. strain rate, temperature, orientation, and sulfur content on the fatigue life of these steels. Statistical models have been developed for estimating the fatigue 5-N curves as a function of material, loading, and enVironmental variables. The results have been used to estimate the probability of fatigue cracking of reactor components. The different methods for incorporating the effects of LWR coolant environments on the ASME Code fatigue design curves are presented.
12 KEY WORDS/DESCRIPTORS (List words or phrases that will aSSist researchers in locating lflls report.}
Fatigue Strain-Ufe Curves Fatigue Design Curves LWR Environments Carbon Steels Low-Alloy Steels Fatigue Crack Initiation Probability of Crack Initiation
NRC FORM 335 (2-e9)
13 AVAILABILITY STATEMENT
Unlimited 14 SECURITY CLASSIACATION
(This Page)
Unclassified (This Report}
Unclassified 15. NUMBER OF PAGES
16 PRICE
OAGI0000759 00126