fatigue life of pultruded and hand lay-up gfrp exposed to
TRANSCRIPT

The University of MaineDigitalCommons@UMaine
Electronic Theses and Dissertations Fogler Library
2002
Fatigue Life of Pultruded and Hand Lay-Up GFRPExposed to Different Environmental Conditions.Mohammed Asif Iqbal
Follow this and additional works at: http://digitalcommons.library.umaine.edu/etd
Part of the Civil and Environmental Engineering Commons
This Open-Access Thesis is brought to you for free and open access by DigitalCommons@UMaine. It has been accepted for inclusion in ElectronicTheses and Dissertations by an authorized administrator of DigitalCommons@UMaine.
Recommended CitationIqbal, Mohammed Asif, "Fatigue Life of Pultruded and Hand Lay-Up GFRP Exposed to Different Environmental Conditions." (2002).Electronic Theses and Dissertations. 159.http://digitalcommons.library.umaine.edu/etd/159

FATIGUE LIFE OF PULTRUDED AND HAND LAY-UP
GFRP EXPOSED TO DIFFERENT ENVIRONMENTAL
CONDITIONS
BY
Mohammed Asif lqbal
B.S. Winona State University, Minnesota, 1997
A THESIS
Submitted in Partial Fulfillment of the
Requirements for the Degree of
Master of Science
(in Civil Engineering)
The Graduate School
The University Of Maine
May, 2001
Advisory Committee:
Habib J. Dagher, Professor of Civil Engineering, Advisor
Roberto Lopez-Anido, Assistant Professor of Civil Engineering
Beckry Abdet-Magid, Professor of Composite Materials Engineering,
Winona State University, Minnesota
FATIGUE LIFE OF PULTRUDED AND HAND LAY-UP
GFRP EXPOSED TO DIFFERENT ENVIRONMENTAL
CONDITIONS
By Mohammed Asif lqbal
Thesis Advisor: Dr. Habib Dagher
An Abstract of the Thesis Presented
in Partial Fulfillment of the Requirements for the
Degree of Master of Science
(in Civil Engineering)
May, 2001
The use of unidirectional Glass Fiber Reinforced Polymer (GFRP) composites to
reinforce glulam beams in tension has been proven by researchers at University
of Maine and others to improve both allowable strength and ductility. The addition
of 3% E-glass FRP has been shown to increase the allowable flexural strength
by as much as 100%. These promising findings can be used in practice only if
the GFRP will maintain a major proportion of its strengthfstiffness mechanical
properties over the life of the structure.
This study focuses on the fatigue life of two types of E-glasslphenolic
GFRP (hand lay-up and pultruded) with special emphasis on the effect of
environmental degradation on the fatigue life of pultruded GFRP. Fatigue life of

pultruded GFRP was evaluated after treatment in salt water, hot water, freeze-
thaw, and UV weathering.
Static tests indicate that hot water (45°C) causes the higher reduction in
tensile strength. The Young's modulus did not change significantly for any of the
exposed specimens. Fatigue tests were conducted at constant amplitude at a
frequency of 20H2, and S-N curves were developed for each exposure group.
The results show that except for UV weathering, the fatigue life of all the exposed
specimens exhibited slight statistically significant improvement for low stress
fatigue tests. Residual strength tests conducted at 10% of ultimate strength
exhibited no statistically significant (a=0.05) reduction in tensile strength or
modulus at 3 million cycles of fatigue.
The fatigue data was plotted using S-N diagrams and modeled using Log-
linear equations. From the models, allowable strength for design purposes was
recommended using statistical analysis. One-sided lower 95% tolerance limit for
95% of the population (5% LTL) were developed for pultruded control and hand
lay-up specimens.

ACKNOWLEDGEMENTS
The author would like to thank those who have strived to make this research a
success both in it's content and purpose. The author's advisor, Dr. Habib Dagher
is acknowledged for his continuous support and encouragements throughout the
research. The National Science Foundation is acknowledged for funding a good
portion of this research. The author would also like to thank the rest of his
committee members: Dr. Roberto Lopez-Anido who has helped with a number of
technical issues concerning FRP materials, and special thanks to Dr. Beckry
Abdel-Magid of Winona State University who has always extended help
professionally and personally. The author would like to thank Don Strong, Tom
Tripp, William Manion and Dr. Michael Peterson for their advice and help with
many of the equipment needed for this research. Doreen Parent and Marcy
Smith are acknowledged for their enduring task at assisting Habib in keeping
track with the author's research.
The author acknowledges the company of his colleagues who have been
a constant support morally and professionally: Cihat Tascioglu, Eoin Battles,
Shane O'Neil and Mustafa Palancioglu. The author's good friend and colleague
Keith Wood is acknowledged for his effort in editing a number of chapters of this
thesis. Most importantly, the author would like to thank his parents, Mohammed
Nurul Huq and Hasna Ara Begum for their continued loving support and
encouragements throughout this experience. He would also like to thank his wife
Zobaida for her blessed company and for giving them their first child, Numan.

iii
TABLE OF CONTENTS
ACKNOWLEDGEMENTS ................................................................................. ii
... LIST OF TABLES ................................................................................................ VIII
LIST OF FIGURES ............................................................................................... x
1 INTRODUCTION ........................................................................................ I
2 LITERATURE REVIEW ............................................................................. -6
2 . I Introduction to Fatigue ..................................................................... 6
2.2 AASHTO Fatigue Design Code for Steel ......................................... 9
2.3 Fatigue of FRP Materials ............................................................... 11
2.3.1 General Overview .............................................................. 1 1
2.3.2 Representation of Fatigue Life: S-N Curves ....................... 14
2.3.3 Standard Method for Fatigue Testing of FRP ..................... 18
2.3.4 Residual Strength Modeling of FRP Materials .................... 19
2.3.5 Fatigue of Phenolic Composites ......................................... 21
2.3.6 Design Methodology for Fatigue of Composite
Materials ............................................................................ -24
2.4 Environmental Degradation Of Composite Materials ..................... 26
2.5 Summary ....................................................................................... 27

. . .
IV
3 MATERIALS AND METHODOLOGY ....................................................... 29
................................................................................... Introduction -29
...................................................................................... Rationale -29
........................................................................................ Materials 30
................................................... 3.3.1 Pultruded Phenolic GFRP 30
3.3.2 Hand Lay-up GFRP ............................................................ 33
3.3.3 Glue-Laminated Beam (Glulam) ......................................... 34
Summary of Test Program ............................................................. 36
Exposure Methods ......................................................................... 38
................................................................... 3.5.1 Priming Method 39
............................................................ 3.5.2 Room Temperature -40
.......................................................... 3.5.3 Freeze-thaw Cycling -40
3.5.4 Hot Water Exposure at 45°C (1 15°F) .................................. 41
........................ 3.5.5 UV+Spray (Simulated Exterior Weathering) 42
............................................................ 3.5.6 Simulated Seawater 43
................................................................................. Test Methods 46
............................................................. 3.6.1 Physical Properties 46
.......... 3.6.1.1 Density by Volume Displacement Method 46
3.6.1.2 Fiber, Resin and Void Volume Fraction by
Ignition Loss Tests .............................................. 47
..................... 3.6.1.3 Glass Transition Temperature (Tg) 48

3.6.2 Mechanical Properties ........................................................ 51
3.6.2.1 Tensile Strength and Young's Modulus .............. 51
3.6.2.2 Apparent Interlaminar Shear Strength ................ 52
3.6.3 Fatigue Properties ............................................................... 53
3.6.3.1 Fatigue Life ......................................................... 53
3.6.3.2 Residual Strength ............................................... 56
3.6.4 Microscopy ......................................................................... -57
4 RESULTS OF PHYSICAL AND MECHANICAL TESTS ........................... 58
.................................................................................... Introduction 58
........................................................................ Physical Properties 58
4.2.1 Density. Volume Fraction and Void Content ....................... 58
4.2.2 Glass Transition Temperature ............................................. 65
................................................................... Mechanical Properties 68
................................................ 4.3.1 lnterlaminar Shear Strength 68
4.3.2 Longitudinal Tensile Properties ........................................... 69
...................................................................................... Summary -75
5 RESULTS OF FATIGUE TESTS .............................................................. 77
Introduction .................................................................................... 77
Fatigue Strength of Pultruded GFRP ............................................. 77
5.2.1 Failure at Grips ................................................................... 78
5.2.2 S-N Curves of Pultruded Specimens: Effect of
Environmental Exposure ..................................................... 79
Statistical Analysis of S-N Data ..................................................... 85
Fatigue Failure Mechanism in Pultruded GFRP ............................ 90
Fatigue Strength of Hand Lay-up GFRP ........................................ 97
......................................... Residual Strength of Pultruded GFRP 102
SEM Imaging of Fatigue Specimens ............................................ 103
Summary ..................................................................................... 106
6 CONCLUSIONS AND RECOMMENDATIONS ...................................... 109
.................................................................................. 6.1 Introduction 109
6.2 Literature Review ......................................................................... Ill
6.3 Effects of Environmental Exposure on Physical and
Mechanical Properties ................................................................. 112
................................. 6.4 Fatigue Life and Residual Strength Tests 118
............ 6.5 Recommendations for Fatigue Design of Pultruded FRP 122
............................................. 6.6 Recommendations for Future Work 124

.. .
vii
Appendix
Appendix
Appendix
Appendix
Appendix
US to Metric Conversions ............................................................ 134
Physical and Mechanical Test Data ............................................. 135
Fatigue Test Data ....................................................................... 1 4 5
DMTA Plots ................................................................................. 153
List of ASTM Standards. and Specifications
Used in this Study ....................................................................... 157
REFERENCES .................................................................................................. 125
BIOGRAPHY OF THE AUTHOR ....................................................................... 159

viii
LIST OF TABLES
.................. Table 2.1 : Typical Fatigue Strength of Unidirectional FRP Materials 18
Table 3.1 : Typical Properties of Uncured PRF Adhesive mix [GP PUB 1511 ...... 34
Table 3.2. Summary of Entire Test Plan ............................................................. 37
Table 3.3. Exposure Parameters for Pultruded GFRP ........................................ 39
.............. Table 3.4. Composition ~f Stock Solution Used in Preparing Seawater 44
TaMe 3.5: Chemical Constituents of Simulated Seawater
As per ASTM D 1 141 ........................................................................ -44
Table 3.6. DMTA Test Parameters ..................................................................... 50
Table 3.7. Fatigue Test Parameters for Pultruded and Hand Lay-up GFRP ....... 54
Table 3.8. Fatigue Waveform Settings for Pultruded GFRP ............................... 55
.............. Table 3.9. Residual Strength Testing Parameters for Pultruded GFRP 57
.............. Table 4.1 : Ignition Loss Results of Pultruded and Hand Lay-up GFRP 59
Table 4.2. Density of Pultruded and Hand lay-up GFRP ..................................... 59
..................... Table 4.3. Glass Transition Temperature (Tg) of Pultruded GFRP 67
............. Table 4.4. Interlaminar Shear Strength of Pultruded GFRP Specimens 68
Table 4.5: Longitudinal Tensile Strength of Pultruded
and Hand Lay-up GFRP ..................................................................... 72
Table 4.6: Longitudinal Young's Modulus of Pultruded
and Hand Lay-up GFRP .................................................................... 73
Table 5.1 : Fatigue Strength (% Mean UTS of Control) of Pultruded GFRP ........ 81
.............. Table 5.2. Statistical Analysis of Mean Life at 30%UTS Using ANOVA 82
Table 5.3. S-N Curve Parameters for Exposed and Control Pultruded GFRP .... 85
Table 5.4. Results of Residual Strength Tests of Control Pultruded GFRP ...... 102
Table 6.1 : Fatigue Lie Data of Pultruded and Hand Lay-up GFRP .................. 120
Table B-1: Tensile Strength and Modulus of Control Pultruded GFRP ............. 136
Table B-2: Tensile Strength of Control and Exposed Pultruded GFRP ............. 136
Table 8-3: Tensile Young's Modulus of Control and Exposed GFRP ............... 137
Table B4: Single Factor ANOVA-Tensile Strength of Control and exposed
Pultruded GFRP ........................................................................ 137
Table B-5: Tg of Control and Exposed Pultruded GFRP ................................... 140
Table B-6: Single Factor ANOVA . Tg from DBTA Data of Control and Exposed
Pultruded GFRP .......................................................................... 140
Table B-7: Ignition Loss Results of Hand Lay-up GFRP ................................... 143
Table B%: Ignition Loss Results of Pultruded GFRP ........................................ 144
Table C-1: Fatigue Data of Control and Exposed GFRP .................................. 145
Table C-2: Calculation of 5% LTL for Control Pultruded GFRP ........................ 147
Table C-3: calculation of 5% LTL values of Hand Lay-up GFRP ...................... 148
Table C-4 Mean Fatigue Data of PultNded GFRP at 30% UTS ....................... 148
Table C-5: Single Factor ANOVA . Fatigue Life at 30% UTS Control .............. 149
Table C-6: Calculation of 95% Confidence Bands for UV Weathering S-N Curve
Using Equation 9 of ASTM E 739 ................................................... 151

LIST OF FIGURES
Figure 2.1 : Delamination Crack-Termination on a Cross-ply Laminate ............... 14
Figure 2.2. Typical S-N Curve with 95% Confidence Bands ............................... 17
Figure 2.3. Typical Residual Strength Curve of an FRP Material ........................ 20
Figure 3.1 : Cross-Section of Pultruded GFRP Showing the Different Layers ..... 31
Figure 3.2. Schematic of a Pultrusion Method .................................................... 32
Figure 3.3. An FRP Glulam Cross-section Showing FRP Location ..................... 35
Figure 3.4. Freeze-thaw Conditioning Tank ........................................................ 41
Figure 3.5. Hot Water Conditioning Tank ............................................................ 42
Figure 3.6. UV Weathering Chamber Showing FRP Exposure Set-up ............... 43
Figure 3.7. Dual Cantilever Set-up for Tg Measurements ................................... 49
Figure 3.8. Specimen Cutting Configuration for Pultruded GFRP ....................... 51
Figure 3.9. Schematic of Interlaminar Shear Testing Fixture .............................. 52
Figure 3.10. Schematic of Fatigue Cycle Sinusoidal Waveform .......................... 56
Figure 4.1 : SEM Image of Pultruded GFRP Cross-section ................................. 60
Figure 4.2: SEM lmage of Unprimed(a) and Primed(b) Surface of
Pultruded GFRP ............................................................................... 61
Figure 4.3: (a) and (b), SEM lmage of Fractured Pultruded GFRP
Showing Voids in the Resin ............................................................. 62
Figure 4.4: Stereomicroscope lmage of Hand Lay-up GFRP Showing
the 5 Layers of Woven Glass Mats Along the Edge (thickness) ....... 62

Figure 4.5: SEM image (a) and (b) of hand lay-up GFRP Cross-section Showing
Poor Wetting of Fibers .................................................................... -64
Figure 4.6. DMTA Diagram of Pultruded GFRP-Hot Water Specimens .............. 67
Figure 4.7: Characteristic Explosive Failure of Pultruded GFRP
in Tensile Test .................................................................................. 70
Figure 4.8. Tensile Failure Mode of Control and Exposed Pultruded GFRP ....... 71
Figure 4.9. Hand lay-up GFRP Specimens Failed in Static Tensile Tests .......... 72
Figure 4.10: Longitudinal Tensile of Pultruded GFRP vs . Exposure
Error Bars Indicate One Standard Deviation .................................... 73
Figure 4.1 1: Tensile Young's Modulus of Pultruded GFRP vs . Exposure . Error
Bars Indicate One Standard Deviation ............................................. 74
Figure 5.1 : S-N Curve of Control Pultruded GFRP with 5% LTL ......................... 80
Figure 5.2. S-N diagram of Control and Exposed Pul t~ded GFRP .................... 83
Figure 5.3. S-N Curve of Pultruded GFRP with srn Percentile Line ..................... 88
Figure 5.4. S-N Curve of UV Weathered Specimens with 5% LTL ..................... 89
Figure 5.5. Common Fatigue Failure Modes in Control Pultruded GFRP ........... 90
Figure 5.6. Fatigue Failure Modes in Control Pultruded GFRP .......................... 92
Figure 5.7: Fatigue Failure Mode of Exposed Pultruded GFRP-Hot Water
and Simulated Seawater .................................................................. 93
Figure 5.8: Fatigue Failure Mode of Exposed Specimens: (a) UV
Weathered at 30%UTS Showing Edge Crack. (b) UV
Weathered at 40%UTS Showing Longitudinal Splitting.
(c) Freeze-Thaw at 40%UTS Showing Shear Delamination ............ 94

xii
Figure 5.9: Stereoscope Images of UV Weathered Specimens Showing
.................................................................................... Edge Cracks 95
Figure 5.10: Stereoscope lmages of UV Weathered Specimen Showing
......................................................................... Edge Delamination 96
Figure 5.1 1 : S-N Diagram of Hand Lay-up GFRP ............................................... 97
.......... Figure 5.12. S-N Diagram of Hand Lay-up GFRP with 5'h Percentile Line 98
Figure 5.13. Typical Fatigue Failure Mode of Hand-Lay-up GFRP ..................... 99
..................... Figure 5.14. S-N Diagram of Pultruded and Hand Lay-up GFRP 100
Figure 5.15: Hand Lay-up Fatigue Specimen Showing Edge Crack
Starting and Ending Points ............................................................ 101
Figure 5.16: SEM lmage of Freeze-thaw Specimens at 240X Tested at 30%
.................................................................................. UTS Control 103
Figure 5.17: SEM lmage (260X) of Control Pultruded GFRP Tested
40% UTS ....................................................................................... -104
Figure 5.18: SEM lmage (240X) of Hand Lay-up GFRP Tested at 40% UTS
..................................... Showing Resin Debris and Fiber Fracture 105
Figure 5.19: SEM lmage (1 20X) of Hand Lay-up GFRP Tested at
40%UTS Showing Fiber De-bonding and Fracture ....................... 105
Figure 6.1 : Property Retention in Pultruded GFRP ........................................... 117
Figure 6.2. S-N Curve of Pultruded GFRP with 5% LTL ................................... 118
Figure B-1 : Stress vs . Strain of Control K-1 Primed GFRP ............................... 135
Figure B-2: Stress vs . Strain plot of Control Hand Lay-up GFRP ..................... 135
xiii
Figure C-I: S-N Curve of UV Weathered Specimens With 95% Confidence
Bands ......................................................................................... 1 5 2
Figure D-I : DMTA Plot of Control Pultruded GFRP .......................................... 153
Figure 0-2: DMTA Plot of Hot Water (3000 hrs) Pultruded GFRP .................... 154
Figure 0-3: DMTA plot of UV Weathered Pultruded GFRP .............................. 155
Figure 0-4: DMTA Plot of Simulated Seawater Pultruded GFRP ..................... 156

1 INTRODUCTION
Two types of E-glasslphenolic FRP (Fiber Reinforced Plastic) materials were
developed at the Advanced Engineered Wood Composites Center, University of
Maine, for use as tension reinforcement in glulam beams. The FRPs were
designed to be compatible with hygrothermal properties of glulam beams and
conventional wood (PRF) adhesives. The first type of FRP is a pultruded product.
The second is a hand lay-up type produced by impregnating stitched glass fabric
with phenolic resin and curing under standard room temperature. FRPs can be
used to reinforce glulam beams just as steel is used to reinforce concrete beams.
The reasons for reinforcing glulam beams include higher flexural strength and
stiffness, better use of lower grade lumber, reduced beam size use of lumber.
FRP materials are a promising reinforcement for wood members because
they can be designed to match the hygrothermal properties of wood, their high
strength to weight ratio and high corrosion and creep resistance compared to
conventional constructional materials. Over the past twenty years fiber reinforced
plastics, have been used successfully in civil infrastructure applications such as
bridges, piers, walkways, pipelines, and building panels etc. (Gentry et al, 1998;
Liao et al, 1998). The common types of reinforcements are glass, carbon and
Aramid whereas vinylester, polyester and epoxy are used as common resin
matrix materials.
As with any new material, engineers need to have a good understanding
of the properties and performance of this material before they can design its use

in any application. When the FRP is used in bridge applications, it is subjected to
cyclic loads from vehicular traffic. This cyclic or fatigue loading can reduce the
strength and stiffness of most conventional construction materials such as steel
and aluminum. This weakening of a material is called fatigue and is mostly due to
the propagation of cracks within the material. Cyclic loading can reduce both
tensile strength and stiffness of a material. Fatigue damage is an important
concern because materials can thus fail at stresses or loads much below their
ultimate strengths. Although numerous research has been done on the fatigue of
FRP materials by the defense industry, and NASA in particular, the very fact that
composite materials behave differently depending on the composition, orientation
of reinforcement, and manufacturing method makes it difficult to apply the results
of one test to another. For design purposes it is always required that the exact
properties for the particular FRP used are well documented and understood.
Thus, this study was designed to evaluate the fatigue performance of the two
types of E-glass/phenolic FRP wood reinforcements developed at University of
Maine, under normal and environmentally aged conditions. It is intended that this
study will allow engineers to design wood structural members with the FRP
reinforcements with safe allowable limits.
The objectives of this study are:
1. To evaluate the fatigue performance of the two E-glass/phenolic FRP
wood reinforcements developed at the University of Maine under
control conditions.

3
2. To evaluate the fatigue life of the pultruded E-glasslphenolic FRP after
it has been subjected to accelerated environmental degradation.
3. To evaluate the feasibility of using the two FRP for bridge applications.
4. To recommend safe fatigue life design values.
The objectives were accomplished in four stages. The first stage included
literature review and organization of methodologies recommended by code
officials such as AASHTO, ICBO, BOCA, Caltrans, NIST and ASTM E 632
concerning the use of FRP materials for civil infrastructure applications and
measuring service life of building components. The use of FRP reinforced glulam
beams for bridge application is a new technology that is yet to be addressed by
AASHTO. However, there are other evaluation criteria and specifications
pertaining to the use of FRP in general. California Department of Transportation
(Caltrans) was among the first to specify tests for evaluating performance of FRP
materials used as concrete column wrappinglcasing for seismic retrofitting.
International Conference of Building Officials (ICBO) also specifies tests for
evaluating FRP materials for masonry reinforcement [ICBO AC 1251. These
specifications along with other general recommendations from ASTM and NIST,
and recent research in this field were used to design a suitable test program for
evaluating the fatigue and long-term durability of the two E-glasslphenolic FRPs.
Thus this stage included identifying degradation factors and mechanisms. Once
all the information was studied, an experimental plan was developed with proper
regard to statistical significance and required sample size.

The second stage involved conditioning the pultruded FRP material in
different environmental exposures, staggering the tests such that post-
conditioning tests could be conducted without much delay. The norm of
environmental exposure tests is to simulate accelerated environments that the
FRP is likely to be exposed to or come in contact with. Since the FRP was
designed for exterior applications, this includes freeze-thaw cycling, simulated
salt water, Ultra Violet (UV) radiation from sunlight, moisture, and hot water.
Thus, the degradation mechanisms considered are hygrothermal changes,
chemical attack such as hydrolysis, photo-oxidation, and moisture corrosion. The
third stage involved determination of physical and mechanical properties of the
FRPs afler pre-determined exposure periods. This was done to evaluate the
severity of the exposure factors. Physical properties tested were density, volume
fraction of fiber, resin and voids, and glass transition temperature (Tg).
Mechanical properties included static tensile strength and stiffness, and
interlaminar shear strength.
The fourth stage, which was the longest in this study, involved evaluation
of the fatigue strength, and statistical analysis for design recommendations.
Fatigue testing involved testing coupons in tension-tension set-up under constant
amplitude, stress ratio (R), and frequency. Specimens tested at low stresses
required considerable amount of time. A specimen tested at 20% UTS required
42 hours to undergo 3 million cycles of continuous fatigue. Residual strength
tests were also conducted at 10% UTS to study reduction in tensile strength and
stiffness due to fatigue loading. This was followed by recommendations using

statistical methods to evaluate safe design life based on tolerance limits of the
fatigue S-N curves.
This study consists of six chapters along with appendices. The first
chapter introduces the reader to the objectives and rationale of this study along
with a summary of the methodology. Chapter 2, Literature Review, summarizes
recent work on fatigue evaluation of FRP materials, environmental durability, and
long-term performance. Chapter 3, Materials and Methodology, gives description
of the materials studied including the manufacturing process. The methodology
followed for conditioning and testing the specimens is described and justified.
Chapter 4, Results of Physical and Mechanical Tests, describes the results of the
tests conducted to evaluate static physical and mechanical properties. These
properties were later used to develop fatigue parameters and baseline properties
to compare with that of conditioned specimens. Chapter 5 gives the results of
fatigue tests, including the S-N curves and residual strength findings. The
statistical bounds on the S-N curves are also included. Chapter 6, Conclusions
and Recommendations, summarizes all the findings and proposes design
allowable limits for fatigue. Recommendations for future work are also given.
Several appendices are included to provide further documentation for the
work. An appendix on SI unit conversion is also given.

2 LITERATURE REVIEW
2.1 Introduction to Fatigue
The concept of fatigue failure was discovered back in the 1800s when European
investigators observed that a number of railroad (axle) and bridge components
made of steel were cracking when subjected to repeated loading. It was in the
mid 1800s when A. Wohler proposed a method to mitigate or in some cases
eliminate fatigue failure. This method gave rise to the development of the 'Stress-
Life response diagram' approach to fatigue design. But it was not until the early
part of the 1900s that the physical basis of fatigue began to be understood
(Taylor, 1989).
Fatigue in general is the reduction or decay of mechanical properties of a
material subjected to cyclic loading. "Fatigue" is defined by ASTM E 1150 as:
"the process of progressive localized permanent structural change occurring in a
material subjected to fluctuating stresses and strains at some point or points and
that may culminate in cracks or complete fracture after a significant number of
fluctuations" (ASTM 1999). It is well known that when materials are subjected to
fluctuating loads above their fatigue limit, they may fail at stresses well below
their ultimate tensile strengths. This implies that cyclic loading can reduce the
strength of a material. In fact, it has been reported that 50-90% of the failure of
engineering components and structures are attributed to fatigue (Gao et all 1994;
Beynon et all 1995). This premature failure or damage is often catastrophic and
caused many injuries and financial losses in the past. To utilize structures

effectively and efficiently, the fatigue strength of the materials used must be well
understood.
Fatigue strength is a measure of the materials resistance to the formation
of cracks. It is a relative term and corresponds to a given number of cycles. For
example in Figure 2.0 we observe that the fatigue strength at one million cycles
is about 30%UTS. If cracks did not occur in materials, then fatigue would not be
an issue. Thus fatigue falls within the study of fracture mechanics. Cracks may
initiate from weak regions and points of high stress concentration. Cracks can
also arise from surface imperfections and defects such as voids which are
inherent in the material as a product of the manufacturing process (Beynon et al
1995).
Crack growth (damage mechanism) is much more complex in FRP
materials compared to metallic materials because of its non-homogeneous
content and anisotropic characteristics of its strength and stiffness (Whitworth et
al, 1998). Fatigue damage initiates as micro crack in the matrix material and
interfacial cracking between the matrix and fiber (Agarwal, 1990). As for steel,
K.J. Miller (Baynon et al (Eds), 1999) states that it is the development of a
specific dislocation structure, which leads to the formation of a crack.
Material failure occurs when the size of these cracks grows or propagates
to a critical size. The crack growth process has two distinct phases namely (1)
initiation and, (2) propagation. The initiation phase is said to be the time required
to form a crack. The propagation phase is marked by growth of these cracks.

With the advent of specialized techniques such as Ultrasonic C-Scanning
(best for observing delamination), Photomicrography, X-ray radiography (best for
observing in plane damage such as transverse crack), Scanning Electron
Microscopy (SEM), fluorescence and Non-destructive evaluation (NDE) methods,
it has become easier to study the quality, quantity and behavior of cracks. Many
theories of crack growth have been postulated to relate crack to the stress field. It
was A.A. Griffith who first proposed an energy balance equation for fracture back
in 1920 and to whom the origin of modern fracture mechanics for engineering
practice is attributed (ASM Hand Book, 1998).
Fatigue is an important issue for engineers because most engineering
materials such as steel, aluminum and Fiber Reinforced Plastics (FRP) are prone
to fatigue damage when subjected to cyclic loading while in service. Fatigue is of
particular interest to bridge engineers because bridges are continuously
subjected to cyclic loading. Since bridges have been made of steel for a long
time, a wealth of information, arising from the numerous fatigue researches
exists today for steel connections and details. Fatigue design of steel members
are described in the American Association of State Highway and Transportation
Officials (AASHTO) specifications. Fatigue data pertaining to FRP in bridge
applications is quite limited because it is still an emerging new technology. Data
on the combination of fatigue with environmental degradation of FRP is very
limited in open literature.

The growing use of composite materials in the transportation industry and
the demand for better long-term performance makes fatigue analysis an
important consideration.
2.2 AASHTO Fatigue Design Code for Steel
Fatigue design of steel members depends on the type of member being
considered. Reduction factors are based on the geometry of the member.
Fatigue strength of connections and joints are given special attention in AASHTO
specifications because this is where most failures occur. The fatigue limit states
are defined in terms of the accumulated cycles i.e. the maximum number of
cycles that can be endured by a given member geometry before fatigue fracture
occurs. Specification of load alone is not adequate and thus stress-range and
frequency (traffic) of the loading are considered. Since truckloads are the
heaviest, frequency is defined in terms of the truck loading in a given period.
Research has shown that the average daily traffic (ADT) per lane under normal
conditions, which includes all vehicles, is physically limited to 20,000 (AASHTO
Section C3.6.1.4.2). Some 15-20% of this traffic is due to trucks depending on
where the bridge is located. The fatigue limits for steel structures are calculated
as described below (AASHTO, 1994):
Average daily truck traffic on a single lane. (ADTT)sL = p x ADTT
where p depends on the number of lanes available to trucks. p=l (one
lane)
In urban areas ADTTsL = 0.15 x ADT (AASHTO Table 3.6.1.4.2.1)

10
In rural areas ADITsL = 0.20 x ADT
Eqn 2-1
Basic design:
y Af S (AF),
where,
y = load factor ( 0.75 for fatigue)
Af = live load stress range due to the passage of the fatigue load
AF = nominal fatigue resistance
n = 1 for fatigue
Equation 2-1 simply states that the applied fatigue load multiplied with the
load factor shall be less than the nominal fatigue resistance. Nominal fatigue
resistance is given by:
(AF), = (AIN)"~ 2 '/2 ( A F ) w Eqn 2-2
where,
(AF), is the nominal fatigue resistance (ksi).
N = (365) (75) n (ADTT)sL, where n is the number of stress range cycles
per truck taken from AASHTO Table 6.6.1.2.5-2.
A = detail category constant taken from AASHTO Table 6.6.1.2.5-1.
(AF)TH = constant amplitude fatigue threshold (ksi) taken from AASHTO
Table 6.6.1.2.5-3.
Equation 2-2 above states that the fatigue resistance must be equal to or
greater than half the constant amplitude fatigue threshold of the particular
geometry considered. If the fatigue stress range (load) is below the threshold, the

member is said to have infinite life. The design life is considered 75 years and
can be changed depending on the use of the bridge. The constant N
approximates the number of load cycles the bridge is expected to endure during
its service. Consider a single span steel girder bridge longer than 40 ft (n=l)
designed to last 75 years. Assuming we are designing a plain (detail category A)
section, the constant A is given as 250x10~ (AASHTO Table 6.6.1.2.5-1). The
constant amplitude fatigue threshold for this member is given as 24 ksi. The
fatigue resistance (AF), of this member would thus be 6.1 1 ksi. Since this
number is less than half the fatigue threshold, the design stress range of 12 ksi
will be used.
2.3 Fatigue of FRP (Polymer Composites) Materials
2.3.1 General Overview
Curtis et al (1989) reported that the increasing use of FRP in primary structures
is mainly because of their high strength and stiffness combined with low density
compared to steel. However, like steel, FRP materials also undergo fatigue
degradation when subjected to cyclic loading. Unidirectional FRP materials have
been shown to posses excellent fatigue resistance in the fiber direction. This is
because the load in the longitudinal direction is primarily carried by the fiber,
which exhibits excellent resistance to fatigue compared to the matrix material
(Agarwal, 1 990).

Exposure to fatigue leads to the formation of cracks first in the matrix and
then into the fiber. FRP materials can be made in a variety of laminate
combinations (laminates with different orientations) and shapes, and this makes
fatigue analysis rather difficult.
Fatigue failure is first seen in the most brittle component (lowest failure
strain). As a result, the matrix (resin) material is damaged first by the formation of
cracks. Fatigue failure in a FRP laminate may occur in many forms such as fiber
fracture, failure in fiber-matrix interface, delamination, matrix cracking and void
growth (Stinchcomb et al, 1995). Cracking results in the lowering of both stiffness
and strength of FRP materials. As a result the residual strength and stiffness
decrease with increasing crack density. Crack accumulation and density varies
depending on the orientation of the laminates.
In multidirectional laminates, cracking occurs in succession from the
weakest layer (off axis-90") to the strongest layer (0") (ASM Hand Book, 1998).
When the crack growth reaches a certain limit, stresses cannot be transferred
from the matrix to the fibers. At this stage only the fibers carry load and final
failure occurs due to fiber fracture.
In unidirectional FRP material, since fibers virtually carry the entire load,
the matrix shows extensive longitudinal splitting parallel to the fibers caused by
interfacial damage. This can result in brush-like failure characteristic of most
unidirectional materials (Curtis, 1989). Fabric based or woven FRP materials
offer greater versatility in producing complex shapes but are known to exhibit
lower static stiffness and strengths due to the distortion of fibers in the weave.

Curtis (1989) also reports that another reason for this is that high fiber volume
fraction (60-65) is usually not achievable in woven FRP. Fatigue strengths of
woven unidirectional FRP are also low compared to non-woven unidirectional
FRP mainly due to the effect of stress-concentrations near fiber tow crossover
points in the fabric, which induce premature damage in the fiberlmatrix interface.
The degradation process in the matrix in an FRP is primarily controlled by
the bulk strain in the matrix. Polymer composites or FRP made with carbon fibers
(typically with stiffness of 220-700 GPa and failure strains of 0.6-1.8%) exhibit
lower strains in the matrix (see section 2.3.2) and as a result have better fatigue
strengths (shallow S-N curve). Using glass-fiber reinforced plastics (GFRP),
which have lower stiffness (typically with stiffness of 70-80 GPa and strains of
2.5-3.5%) compared to carbon fibers leads to greater matrix strains and thus
comparatively lower fatigue strengths (steeper S-N curve) (Curtis, 1989, 1991).
Aramid fiber has stiffness between that of carbon and glass fibers (typically 120
GPa) and as a result is expected to show intermediate fatigue behavior. Aramid
fibers are sensitive to fatigue (may defibrillate) but carbon and glass fibers do not
show this effect.
A good composite must have strong and durable fiber-matrix interface to
reduce both crack initiation and propagation. During fatigue, the rise in
temperature caused due to viscoelastic energy dissipation may also contribute to
the weakening of the material and shortening of its fatigue life (Agarwal, 1990).

Unidirectional composites are not the optimum design for fatigue. This is
because of the splitting in the fiber direction resulting from low transverse
strength and imperfect gripping condition (Agawal, 1990). This problem may be
mitigated by providing a few plies in the 90" directions. The 90" plies help in
terminating crack growth as seen in Figure 2.1.
Figure 2.1 Delamination-Crack Terminations on a Cross -ply Laminate
(Aqawal. 1990)
2.3.2 Representation of Fatigue Life: S-N Curves
The most common method of presenting fatigue data is to plot the applied stress
(S) against the number of cycles (N) to failure. These plots are called S-N curves.
The ordinate is usually the maximum stress or stress range (AS = Smax-S,i,),
strain or the stress or strain amplitude that is usually plotted on a linear scale.

The abscissa of the plot is usually the number of cycles to failure for a fixed
stress or strain cycle and is usually plotted on a logarithmic scale. The stress
ratio (R), defined as the ratio of minimum to maximum stress and the test
frequency (Hz) are kept constant for all the specimens for which an S-N curve is
developed. All materials including metals and composites exhibit a negative
slope. This shows that for all materials, the number of cycles to failure increases
as the applied cyclic load decreases. As for the exact shape of the curve, it
depends on the material and testing variables. The S-N curve of composite
materials generally depend on factors such as:
Material variables:
1. Fiber material and volume fraction (Vf)
2. Matrix material (resin)
3. Ply orientation
4. Interface properties
Test variables:
1. Type of loading (tension-tension, tension-compression)
2. Mean stress
3. Frequency
4. Environment
The S-N curves of FRP materials are generally linear (Figure 2.2) for lives less
than one million cycles.

The S-N curve of a typical FRP material may be expressed using a linear
equation:
oaPd ustat = A + B log N Eqn 2-3
where A and B are material constants. Another model for S-N curve of
unidirectional FRP material is given by S. Subramanian, and K.L. Reifsnider
(Sridharan et al, 1998):
oapd ustat = An -& [ log (N) 1'" Eqn 2-4
where,
oapp - applied stress
oSbt - static strength
A , B , Pn are material constants.
At a very low stress, the S-N curve of most ferrous and non-ferrous
materials flattens indicating infinite life. Infinite life is said to exist when the
applied stress is below the fatigue threshold. Since fatigue involves cycling over
a range of stresses (between maximum and minimum stresses), it is more
appropriate to use the stress range term rather than stress alone. Although steel
and its alloys are known to exhibit distinct endurance limit it is generally not true
for non-ferrous materials. In FRP materials, the term endurance limit is better
explained by fatigue threshold, which is that stress or load below which a crack
does not form or grow.

- -- - - B
17
Fatigue threshold of FRP materials have been studied by a few authors
including Taylor (1989) and is reported to be dependent on many factors such as
type of reinforcements, matrix, curing method and fiber orientations.
~
S,,M = 212 MPa
R =0,1 freq = 10 Hz
run-ods mdlcated by squares
Figure 2.2 Typical S-N Curve with 95% Confidence Bands (Hayes et al, 1998)
Among the resins, Agarwal (1990) reports that epoxy exhibits the best
fatigue property because of their inherent toughness, durability, low shrinkage
during cure, and high mechanical strength. FRP made with high modulus fibers
such as graphite or carbon, aramid, and boron fibers show excellent fatigue
resistance when properties are fiber controlled in the testing direction. This is due
to the fact that these fibers are more environmentally stable compared to glass
fibers, and has low strain to failure, which induce low strains in the matrix
material.

As a result the S-N curves of FRP made with these fibers have smaller
slopes. Some examples of fatigue strength of different composites are given in
Table 2.1.
Table 2.1 Typical Fatigue Strength of Unidirectional FRP Materials
I Fatigue Strength (ksi)
Material systems
ks i
E-glass I Phenolic E-Glass I
Epoxy
Kevlar 49 I I ,,,
R -
1 o6 cycles
MPa
Graphite I Epoxy
10' cycles
30
30
Ksi
140
MPa
207
207
Epoxy E-Glass I vinyl
ester S2 Glass I
-
Boron I Epoxy
2024-T35 1 Aluminum
Reference
0
0.1
965
1 034
62
345
-I 3u
9
Steel
Branco et al, 1994
Agarwal, 1990
150
21 (threshold)
Agarwal, 1990 30
140
24 (threshold)
Agarwal, 1990
1034
145
Hayes et al, 1998
Hayes et al, 1998
207
965
166
Agarwal, 1990
0.1
0.1
0.1
0.1
140
0.1
Chatterjee et al, 1997
AASHTO, 1994
965
2.3.3 Standard Method for Fatigue Testing of FRP
Parameters for the fatigue testing are usually specified to closely approximate
real-life situation. Thus, specimens may be tested in tension-tension, tension-
compression or compression-compression fatigue. Testing can be done on both
life-size specimens and on coupon level.
0.1
0.1

Although there are no guidelines for testing life-size specimens in the
laboratory, researchers have followed AASHTO load specifications when testing
a bridge member (Lopez-Anido et al, 1999).
Coupon testing of FRP materials can be carried out according to ASTM
D3479 "Tension-Tension Fatigue of Polymer Matrix Composite Materials", which
is described in the methodology section (section 3.5.3.1). The coupons are
usually machined to a rectangular or dog-bone shape. The aforementioned
ASTM method suggests rectangular specimens. Gripping is a continuous and
irksome problem in fatigue testing because specimens are prone to failure at the
grips. However rectangular specimens have been used successfully when well-
machined and proper grips are used. It is also much easier to fabricate defect-
free rectangular specimens compared to dog-bone specimens, which require
specialized machinery such as CNC and water jet cutting systems.
Servo hydraulic machines such as those manufactured by INSTRON and
MTS are commonly used to apply fatigue loading. The loading pattern can be
sinusoidal, triangular or square and the amplitude may be constant or variable.
Constant amplitude sinusoidal loading is a common method used to test
composite materials (Branco et all 1996). Frequencies ranging from 5 to 20 Hz
have been used to study fatigue behavior of FRP materials (Branco et al, 1992).
A point on the S-N curve represents a specimen tested at a particular stress
range and the corresponding number of cycles at which it failed; stress ratio (R)
and frequency being the same for all specimens. If a specimen is tested for high
cycle life, a simple S-N curve may require many months to develop.
20
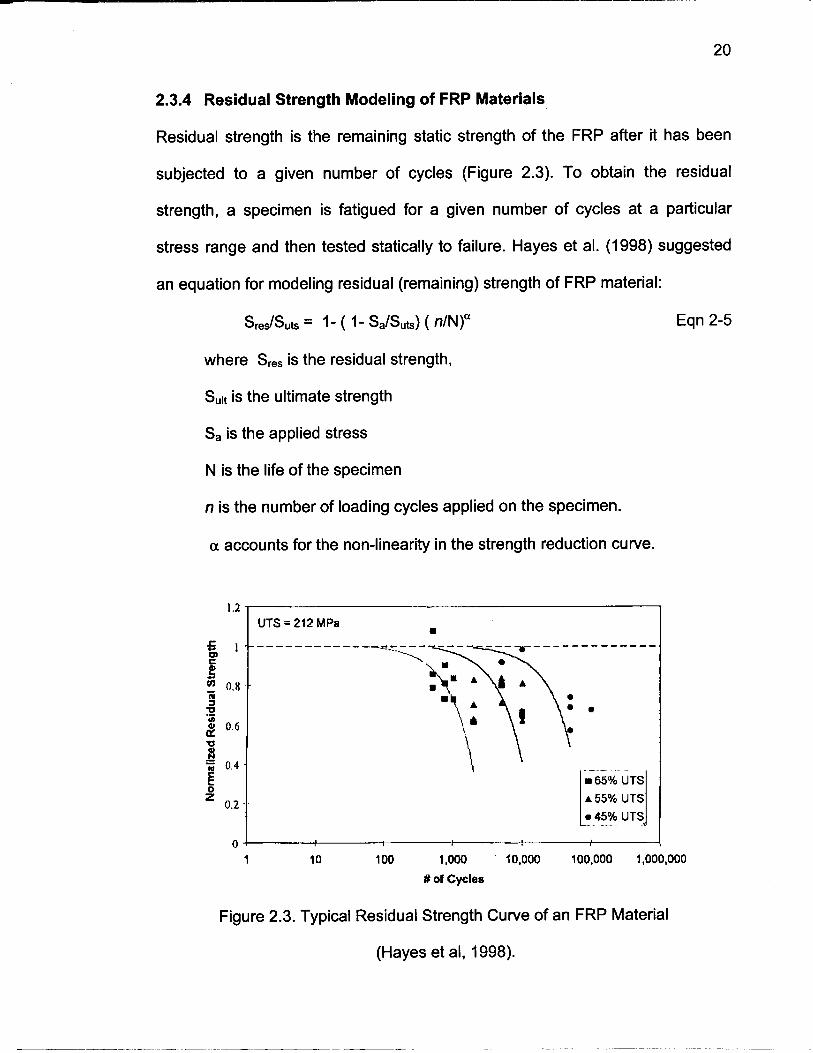
2.3.4 Residual Strength Modeling of FRP Materials
Residual strength is the remaining static strength of the FRP after it has been
subjected to a given number of cycles (Figure 2.3). To obtain the residual
strength, a specimen is fatigued for a given number of cycles at a particular
stress range and then tested statically to failure. Hayes et al. (1998) suggested
an equation for modeling residual (remaining) strength of FRP material:
S,$Sut, = 1 - ( 1 - S,/Sut,) ( nlN)*
where S,, is the residual strength,
Suit is the ultimate strength
S, is the applied stress
N is the life of the specimen
n is the number of loading cycles applied on the specimen.
a accounts for the non-linearity in the strength reduction curve.
Eqn 2-5
1 10 100 1,000 . f0,OOO 100,000 1,000,000
# of Cycles
Figure 2.3. Typical Residual Strength Curve of an FRP Material
(Hayes et all 1998).

Residual strength tests indicate the extent of damage in a material and
allow one to predict properties of a material after it has been subjected to cyclic
loading. This tool is very useful for estimating remaining service life of materials
used in structures such as bridges.
2.3.5 Fatigue of Phenolic Composites
Although today vinyl ester and polyester composites dominate the construction
industry for structural applications, the reasons for using phenolic resins are
many. In the construction industry fire hazards are a growing concern. Phenolic
resins are known to perform better at high temperatures compared to other
resins. Traditionally, phenolic materials were used in a variety of household
goods such as handles in cooking utensils, radio buttons, and counter-tops. This
is due to their excellent thermal and dimensional stability at elevated
temperatures, and due to superior chemical and corrosion resistance compared
to other thermosetting polymeric materials.
Phenolic compounds are also known to possess low toxicity and low
smoke emission at temperatures up to 200°C (Branco, 1996). These properties
have been advantageously used today in the making of Phenolic fiber-reinforced
polymers for structural applications. Among the fibers, glass fiber seems to be
the most attractive reinforcement for phenolic resins due to their high tensile
strength, corrosion resistance and low cost.

Phenolic composites reinforced with glass fibers have been well received
by the auto and aerospace industries, which uses them for interior molding and
body panels such as cockpit panels and seats in aircraft, pulleys, intake
manifolds, water pumps, and valve covers etc (Branco et all 1994). They have
also been successfully used as body frames in railway carriages and buses not
only because of high strengthlweight ratio and better creep resistance at high
temperature but also because of faster manufacturing processes available today.
Although phenolic composites are not yet widely used by the construction
industry, phenolic adhesive such as phenol resorcinol formaldehyde (PRF) is
widely used by the plywood industry for exterior application. This is due to its
ability to form excellent adhesive bond with wood. The chemical structure of
Phenolic compounds is also similar to that of Lignin present in wood species
(Bodig , 1 992).
Phenolic composites are thus an excellent choice for reinforcing wood and
wood composites. However as this concept is quite new, the data available in the
open scientific literature pertaining to phenolic GFRP is quite limited. Most
available data consists of thermal and tensile properties in the form of product
literature published by manufacturers. Most durability data of composites is
currently available from the use of FRP by the aerospace industries. This data is
mostly restricted to epoxy resins and carbon fibers. Very few articles in the open
literature pertain to durability of E-glass reinforced phenolic composites.

Branco and Ferreira (1 994, 1996) tested tension-tension fatigue properties
of pultruded and hand lay-up phenolic GFRP at varying temperatures,
frequencies, stress ratios and fiber lay-up. It was observed that the fatigue
strength of phenolic composites, like other composites, increases with the fiber
volume fraction. The Young's modulus and rupture stress were shown to
decrease as the temperature was increased from 20" C to 200°C. The authors
tested dog-bone coupons measuring 220mm in length, 22mm in width and 2mm
thick. The narrow part of the coupon (gauge length) was only 40mm long. A
silane-coupling agent was used to enhance bonding during manufacturing.
They have observed that the fatigue strength at room temperature of
pultruded unidirectional E-glass phenolic composites (700MPa UTS) was
40%UTS at 1 o4 cycles and 30%UTS at l o6 cycles for R=O and frequency of 10
Hz. Fatigue strength decreased by 10% when the frequency was reduced from
10Hz to 1.5Hz. All the different types of hand lay-up composites have shown
higher fatigue lives when the stress ratio was increased from R=O to R=0.4-0.5.
The pultruded specimens were tested at room temperature only, and their fatigue
strengths were shown to be lower (10%) than unidirectional hand lay-up
specimens at 2 million cycles. Woven pultruded composites gave the lowest
fatigue strength data of all the composites tested. From SEM scans, the authors
have concluded that the main failure mechanism was shear delamination
between the resin and the fiber.

The S-N curves were modeled using log-log linear regression analysis as
shown below.
Log(Ao) = a Log(N) + b Eqn 2-5
where A o is the applied stress range and N is the number of cycles to failure.
The constants a and b are material specific parameters. Hand lay-up
unidirectional composites were also tested for their fatigue strength at 1.5, 10
and 25Hz. Branco et al (1996) reported that at room temperature, the fatigue life
of a unidirectional pultruded GFRP (700 MPa UTS) was approximately 1 million
cycles at 21%UTS. They also reported that a woven pultruded E-glass phenolic
FRP with 305 MPa UTS had a fatigue life of 1 million cycles at 28% UTS.
It was concluded that fatigue strength increased when the testing
frequency was increased from 1.5Hz to 10Hz. Further increase to 25Hz had
negligible effect on fatigue life. It was observed that virtually no loss in stiffness
occurred up to 75% of the fatigue life. The modulus starts to reduce after 75% of
the fatigue life and the maximum reduction occurs when there is only about 15%
of the life remaining. The authors stated that the fatigue strength of phenolic
composites were lower than those of epoxy and polyester matrices.
2.3.6 Design Methodology for Fatigue of Composite Materials
To account for fatigue, composites are designed to carry stresses well below
their ultimate tensile strength. Typically these stresses are selected from the S-N
curves where the curve tends to flatten. The design is also very much dependent
on the application.

Composites are most sensitive to fatigue when they are subjected to high
frequency and stresses such as in high-speed cutting tools and machinery. As a
result, the life of such composites will be estimated differently from say a
structural member in a building subjected to wind loads.
The basic fatigue design method for any material is to ensure that the
particular member has infinite life when subjected to fluctuating loads. The
condition of infinite life is met when the maximum stress range induced is less
than the fatigue threshold stress range. The fatigue threshold stress range is that
stress range just sufficient to initiate and grow a short fatigue crack [58]. Since
below this threshold no cracks are expected to occur, a material is said to exhibit
infinite life. Fatigue limit and Endurance limit can be and often is used as
synonyms of fatigue threshold although fatigue threshold is specifically derived
from fracture mechanics concepts and the others are not.
Tolerance limits are also used to estimate safe design life of composites.
The tolerance limit method has been used for fatigue design of steel, wood and
polymer composites (Wirsching, 1983; Bond et al, 1998; Roland et al, 1996). The
most common method is to use the lower 95% tolerance (one-sided) for 95% of
the population. This tolerance is also called the 5% Lower Tolerance Limit (LTL).
This tolerance limit describes a lower limit to the data, above which one can say
that at least 95% of future observations (or sampled normal population) will have
a 95% survival probability.

The 5% LTL was used here because it provides a precise statistical lower
boundary which is not too stringent for widely scattered fatigue data (Bond et al,
1998). This method has been in use for a long time and has been used to study
fatigue of steel connections (Little (Ed), 1979).
2.4 Environmental Degradation of Composite Materials
The sources of degradation from the environment are many. Moisture is the most
common source and is known to affect both the fibers and the matrix. Ultraviolet
light from the sun, concrete pore water and salt water from de-icing salts cause
damage to both fiber and matrix. The synergistic effects of temperature and
fatigue have been studied by Branco et al. (1994) and Liao et al (1998). Strong
acids and bases are also known to cause significant damage to FRP material.
Fatigue testing of environmentally conditioned Phenolic composites is yet
to be found in literature. Since Vinyl Ester composites are widely used in the
construction industry, it is worthwhile mentioning some of the findings pertaining
to fatigue strength of these composites. Hayes et al (1998) studied the effects of
moisture on the fatigue strength of glasslvinyl ester composites. They have
stated that moisture acts as a plasticizer in the matrix and thus lowers the glass
transition temperature (Tg). The lowering of glass transition temperature causes
reduction in modulus, tensile strength, and fracture toughness. When the
composite is dried, the effect of plasticization is reduced, although permanent
damage such as matrix cracking, hydrolysis and fiber-matrix debonding can
occur due to the swelling stresses.

The combined effects of moisture, temperature and stress are difficult to
model and predict. In this study Hayes et al (1998) have used off-the-shelf
unidirectional pultruded composite plates with random-fiber continuous strand
mat layers. They fail to report the exact quantity of unidirectional and random mat
layers. The total fiber volume fraction was 50-55%. The coupons were 6" long, 1"
wide and 118" thick. Samples were tested in tension-tension fatigue at 10Hz and
stress ratio R=0.1. The authors have concluded that the results are dependent on
fiber and matrix lay-up, laminate lay-up, pre-conditioning methods, solution
contents and the environmental conditions during fatigue. The damage due to
moisture is fiber-dominated and is irreversible. The static tensile strength was
reduced by as much as 26% at a moisture concentration of 0.95% by weight.
This reduction in static strength causes a vertical shift in the S-N curve. Thus
moisture does not affect fatigue mechanism.
2.5 Summary
Fatigue has been a design consideration ever since engineers realized that
metals such as steel and aluminum might fail at stresses well below the UTS
when subjected to fluctuating loads. With the advent of high strength fibers such
as Carbon, Kevlar, Boron and Glass, metals are being replaced in some
application in favor of FRP materials mainly due to their high strength to weight
ratio. Glass fiber reinforced plastics (GFRP) composites are widely used because
of comparatively low unit cost. Like steel, FRP materials are also prone to fatigue
degradation due to crack initiation and propagation.

Fatigue behavior is commonly represented by an S-N curve, which plots
the number of load cycles it takes to fail a specimen when subjected to a
particular stress range. Unidirectional (0") FRP material in general performs
better in fatigue than multidirectional laminate FRP. Fatigue failure in
unidirectional FRP material initiates with matrix cracking or splitting parallel to
fiber direction. This results in fiber-matrix debonding and ineffective load
distribution, which leads to fracture of weaker fibers and consequently total
failure.
In multidirectional laminates failure occurs in succession from the 90" to
the 0" plies. For a given type of laminate and testing parameters FRP materials
with higher fiber volume fraction show higher fatigue performance. Carbon and
Epoxy show the best fatigue properties among fibers and matrix materials
respectively.
Moisture can cause significant damage to FRP materials by degrading the
fiber-matrix interface. Among the fibers mentioned above, carbon fibers are least
affected by moisture (Curtis, 1989). A strong interface ensures protection to the
fiber. Fatigue data of E-glass phenolic composites are scarce in literature and
some authors have stated that the fatigue strength of phenolic composites in
general is lower than those of epoxy and polyester matrices. The basic fatigue
design method for any composite is to limit the maximum stress range such that
it is lower than the constant amplitude fatigue threshold.

3 MATERIALS AND METHODOLOGY
3.1 Introduction
This chapter describes the materials used in the study; pultruded and hand lay-
up GFRP, the methods used to condition the specimens prior to testing, and the
testing methods followed to determine physical, mechanical and fatigue
properties. The pultruded GFRP was exposed to five different types of
environments, which include control (at RT air), freeze-thaw, hot water, UV
weathering, and simulated seawater. The exposed specimens were then tested
for the change in mechanical and fatigue properties at the end of the exposure
period. The hand lay-up GFRP was not exposed to any of the environments but
tested for static and fatigue control properties.
3.2 Rationale
The mechanical properties of GFRP are known to degrade when exposed to a
variety of environments including high temperature and humidity. Strong acids
and bases are also known to cause significant reduction in the mechanical
properties of GFRP. Thus, it becomes imperative to study the extent of damage
for design purposes. Other factors such as salt from deicing materials and
concrete pore water are studied because GFRP used in Glulam beams for bridge
application may be exposed to these chemicals. Since it is not always practical
to study long-term durability on in-service structures, accelerated tests are
performed in the laboratory on small-scale specimens such as coupons to
simulate real life conditions. In this study GFRP plates were conditioned in
different solutions and environmental exposures. After the conditioning period,
ASTM specified coupons were cut and promptly tested for physical and
mechanical properties. To maintain consistency in the testing methods, American
Standards for Testing and Materials (ASTM) specified methods were followed in
all cases. International Conference of Building Officials (ICBO), Acceptance
Criteria (AC) 125 in particular specifies evaluation tests for FRP materials for
reinforced and unreinforced masonry. This specification recommends tests to
evaluate FRP materials for exterior purposes. These methods were followed for
conditioning the specimens to the different exposure environments. ASTM E 632
was also reviewed to help with organizing the tests.
3.3 Materials
Pultruded and hand lay-up GFRP are the two types of glass fiber reinforced
polymers (GFRP) evaluated in this study. A brief description of a glulam beam is
also given since these GFRP materials were designed to be used as tension
reinforcement in glulam beams.
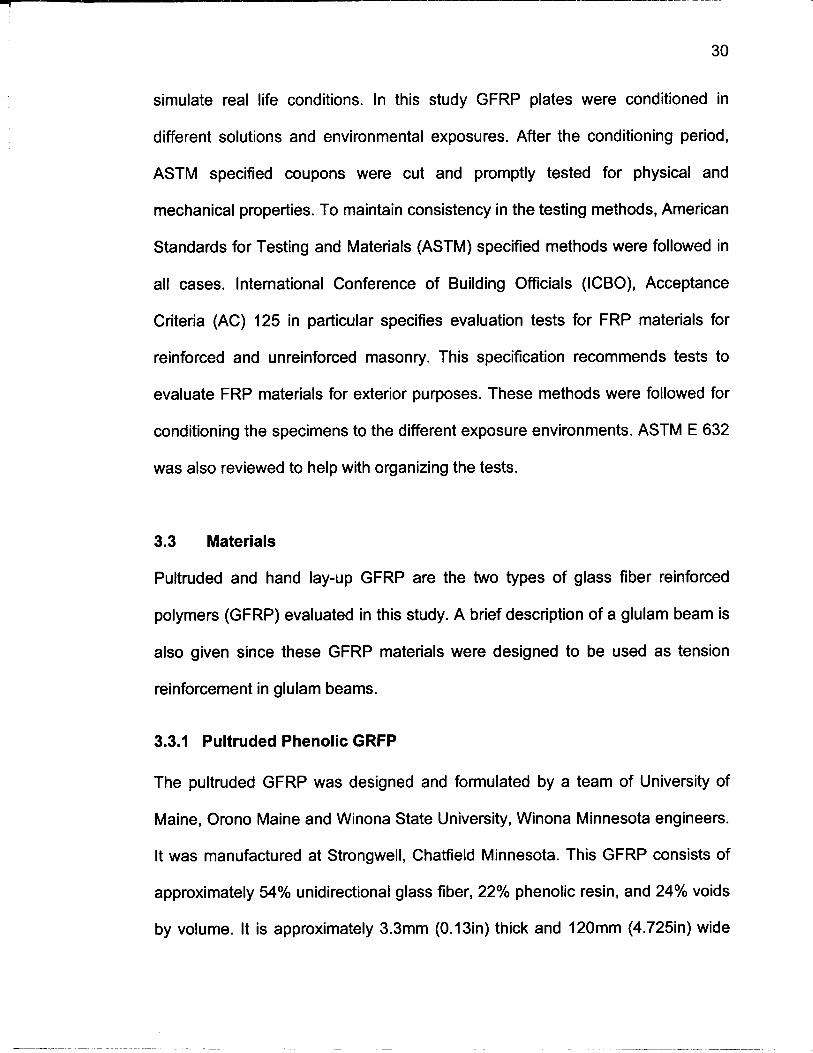
3.3.1 Pultruded Phenolic GRFP
The pultruded GFRP was designed and formulated by a team of University of
Maine, Orono Maine and Winona State University, Winona Minnesota engineers.
It was manufactured at Strongwell, Chatfield Minnesota. This GFRP consists of
approximately 54% unidirectional glass fiber, 22% phenolic resin, and 24% voids
by volume. It is approximately 3.3mm (0.13in) thick and 120mm (4.725in) wide
(Figure 3.1). The reinforcement used is made of E-glass fibers (10-20 microns),
which have high tensile strength (1.7 GPa, 250 ksi) and low density (2.54 g/cm3)
Unidirectional GFRP Pultruded
Mat layer
(random
glass fibers)
Figure 3.1 Cross Section of GFRP Showing the Different Layers
compared to mild steel; 0.640 GPa (92 Ksi) and 7.8 g/cm3 respectively (Agarwal,
1990). These fibers are also the least expensive ($0.6/1b) compared to other
common fibers (carbon- $8.0/lb) and most readily available. The fibers have also
been coated with a suitable sizing to enhance bonding with the phenolic resin.
The matrix used is a one-part phenolic resin supplied by Georgia Pacific. It is a
thermosetting resin and cures at high temperature. It is formulated to produce
maximum wetting of fibers. Good wetting ensures good bonding and better
protection of the fibers. Phenolic resin is used as the matrix because of its low
cost compared to epoxies as well as its fire resistance characteristics and good
bonding with wood.
The GFRP is encased on both faces by a thin mat layer. The surface mat
layers consist of randomly oriented short glass fibers, which constitute high
porosity. The porosity facilitates bonding of the GFRP with wood or other material
through mechanical interlocking. When bonded to wood laminations, the
unidirectional glass fibers are aligned parallel to the wood grain (longitudinal).
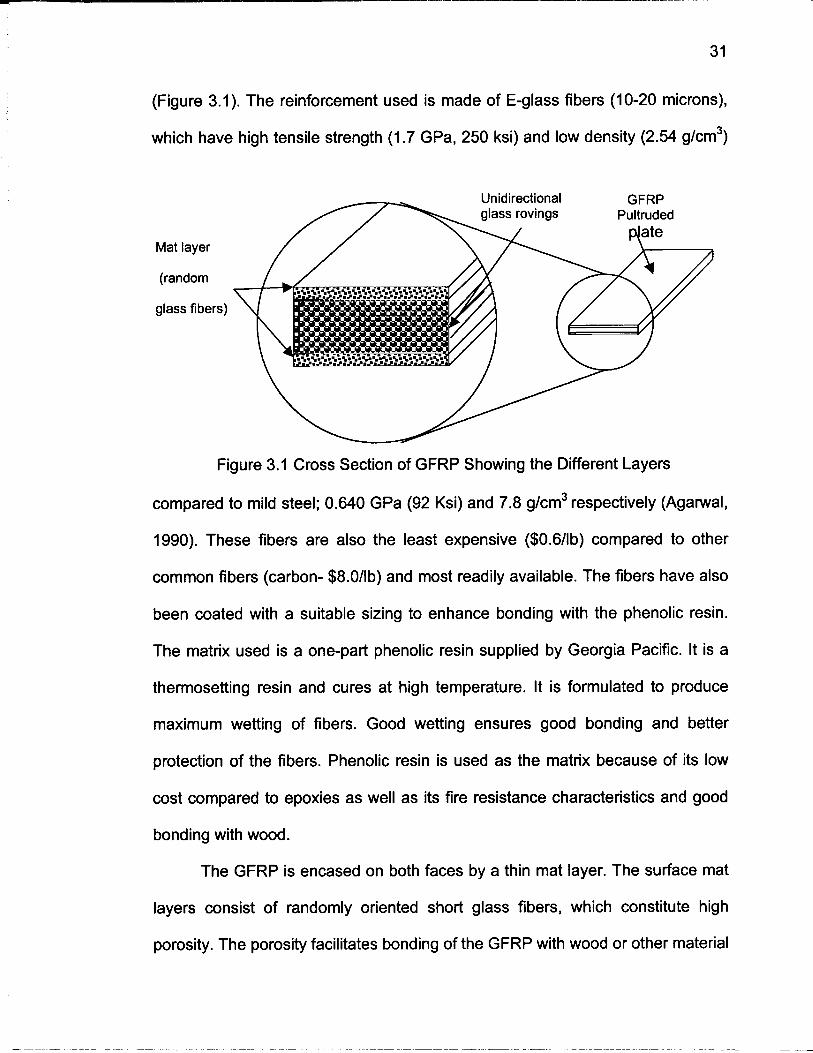
The GFRP was manufactured using the pultrusion method, which can only
produce constant cross-section composites. A schematic view of a pultrusion
process used to manufacture the pultruded GFRP is shown in Figure 3.2. The
process consists of pulling continuous rovings of glass fiberslmats through a
resin bath, and then through a preforming die where it is shaped and excess
resin is removed.
Fiber Prfaol
%t Layer HOII Cutter - . -.-
Y 1 --I Forming and Roller Preforming Die Curing Die Pullers Sander n
Figure 3.2 Schematic of the Pultrusion Method for Resin Starved Mat Layers
The unidirectional core is then surfaced with the mat layer, on top and
bottom faces. It then goes through a heated die where the section is cured
continuously. Special pullers are used at the front end of the pultrusion process
to pull the section continuously. Cut-off saws are used at the end of the
production line to section the composite as desired. The GFRP is passed through
a drum sander to remove the gloss from both faces, and then rolled for shipment.

Different types of GFRP were pultruded by varying the resin quality and
quantity. A letter and a number designated the different types of GFRP. The
ultimate GFRP manufactured was designated K-1 after several cyclic-
delamination tests were done on its predecessors, 1-2 and 1-3 to evaluate bond
compatibility with wood. The manufacturing parameters for this GFRP cannot be
disclosed due to pending patents. In this study only K-1 pultruded GFRP was
used.
3.3.2 Hand Lay-up GFRP
The hand Lay-up GFRP consists of unidirectional woven E-glass fibers in a
Phenol Resorcinol Formaldehyde (PRF) adhesive matrix. The glass fiber fabrics
were provided by Brunswick Technologies, Inc (BTI) of Brunswick, Maine. The
unidirectional glass fabrics weighed 26 oz/yd2. They were shipped in rolled mats
of varying widths. The resin (GP 4242) and hardener (GP 4554) were both
obtained from Georgia Pacific Resins, Inc.
The matrix is a three-part adhesive that was prepared by mixing water,
hardener and resin in an 18:12:70 ratio respectively. This ratio allowed a
workable time of only 45 minutes. The powdered hardener was first mixed with
water to form liquid slurry followed by the addition of resin. The mixture was
stirred for at least five minutes to ensure uniform consistency. A resin
impregnator was used to infuse the resin into the woven fiber mats. The gap
between the rollers was adjusted to obtain pre-cure 5050 ratio of fiber to resin.

Mats were cut to 280cm long and then after being impregnated with
adhesive they were folded to form five-layered 50cm long plates. Each plate was
then pressed between two steel plates and clamped at 550kPa (80 psi) for 24
hours at room temperature. They were allowed to dry for two weeks at room
temperature after unclamping. Tensile coupons were then cut from these plates
using a wet diamond saw. The typical properties of the adhesive mix are given in
Table 3.1.
Table 3.1 Typical Properties of PRF Uncured Adhesive Mix [GP PUB 1511
Appearance I Redlbrown-slurry
r Mix Ratio; parts by weight 1 70 resin : 30 hardener (water added)
I Gelation Time at 25 C I 1.58 - 2.25 hours
Wet Density , Ibs.lga1 (kgll). @ 25 C
Viscosity, cps @ 25 C
pH
Free Formaldehyde, %
3.3.3 Glue-Laminated Beam (Glulam)
The cross-sectional dimensions and length of sawn lumber are limited by the size
of the tress available to produce this type of lumber. Thus when span becomes
long, sawn lumber is impractical and glulam beams are used. Glulam beams
(Figure 3.3) are fabricated from thin laminations of solid wood, which can be end-
jointed and glued together to produce wood members of practically any size that
can be shipped.
9.5(1.13) - 9.7(1.16)
3000- 6000
8.7-9.0
< 1.0

The structural properties of glulam members in most cases exceed those
of sawn lumber (Breyer, 1993). A reason for this is that laminating wood
optimizes material by dispersing the strength reducing defects in the laminating
material throughout the member. Glulam beams also make efficient use of
available structural material by incorporating high-quality laminations in the
portions of the cross-section that are more highly stressed. Phenol Resorcinol
Formaldehyde (PRF) is the common adhesive used in glue-laminating plants.
Glulams also have a number of advantages. Large glulam have good fire
resistance because they are charred in a fire and not readily consumed.
Wood Laminations
- Figure 3.3 An FRP Glulam Showing Location of FRP Reinforcement
The outer charred layer acts as a thermal shield to the core. Glulam
beams exhibit good fatigue strength and are aesthetically pleasing. Another
advantage is that they do not rust or corrode and therefore are used in industrial
storage buildings for alumina, salt and potash, which corrode steel. Glulam
beams can be strengthened with fiber-reinforced plastics (FRP) just as concrete
is reinforced with steel. The FRP is usually laminated into the beam in the
tension zone. They are typically called FRP-Glulam (Figure 3.3). The GFRP
used in this study is intended as a tension lamination for glulam beams.
3.4 Summary of Test Program
To evaluate environmental durability, the pultruded GFRP was exposed to
different artificial environments. At the end of the exposure period, the specimens
were tested for both static and fatigue strength retentions. The wet-preg GFRP
was tested for static and fatigue control properties. The following section (section
3.4) describes how the exposure environments were prepared. Section 3.5
describes the testing methods followed to determine strength retention. The
entire test matrix is given in Table 3.2.

Table 3.2 Summary of Entire Test Plan
Number of Specimens
Hand Lay- up GFRP
Dry Control
Pultruded GFRP Test Type and
Method Total No. Of
Specimens
Simulated seawater
ASTM D 1141
ICBO AC 125
5
Freeze-
Hot Thaw
Water ICBO AC 125
uv Weathering
ASTM G 53
ICBO AC 125
5
Dry Control
Density
ASTM D 792
Vf, Voids
ASTM D 2584
TQ, DMTA
ASTM D 541 8 and ASTM E 1640
Longitudinal Tensile properties
ASTM D 3039
Interlaminar Shear Strength
ASTM D 2344
Fatigue Strength
ASTM D 3479
Residual Strength
ASTM D 3479
Microscopy STEREO t

3.5 Exposure Methods
Pultruded FRP was exposed to five different environments as shown in Table 3.2
in addition to room temperature and humidity. Hand lay-up FRP was not exposed
to any of the environments but conditioned to room temperature and humidity
only. These five exposure environments are known to degrade FRP material
properties. Pultruded specimens were exposed to the different environments as
per ASTM or ICBO AC 125 specifications.
To simulate actual conditions in glulam beams, all pultruded specimens
were primed with PRF and allowed to dry for two weeks before exposure. Instead
of exposing test coupons, 25.4cm (loin) long plates were exposed with the as
received width (12cm, 4.725in) to reduce edge effect and ensure uniform
diffusion. The exposed edges were sealed off with a durable epoxy adhesive.
The epoxy was cured at room temperature and not cured in an oven to avoid any
pre-exposure effects. Seven 12.7mm (0.5in) wide tensile coupons could be cut
from each plate. High-density Polyethylene (HDPE) tanks, which are known to be
inert to most solvents, were used to expose the specimens to different solutions.
Wherever applicable only TYPE I distilled water was used in preparing the
solutions. Each tank had a capacity of 20 liters (6 gal) and a separate tank was
used for each exposure setting. The tanks were also covered with a spill-proof lid
to minimize evaporation and spilling during handling. The exposure test matrix is
given in Table 3.3.
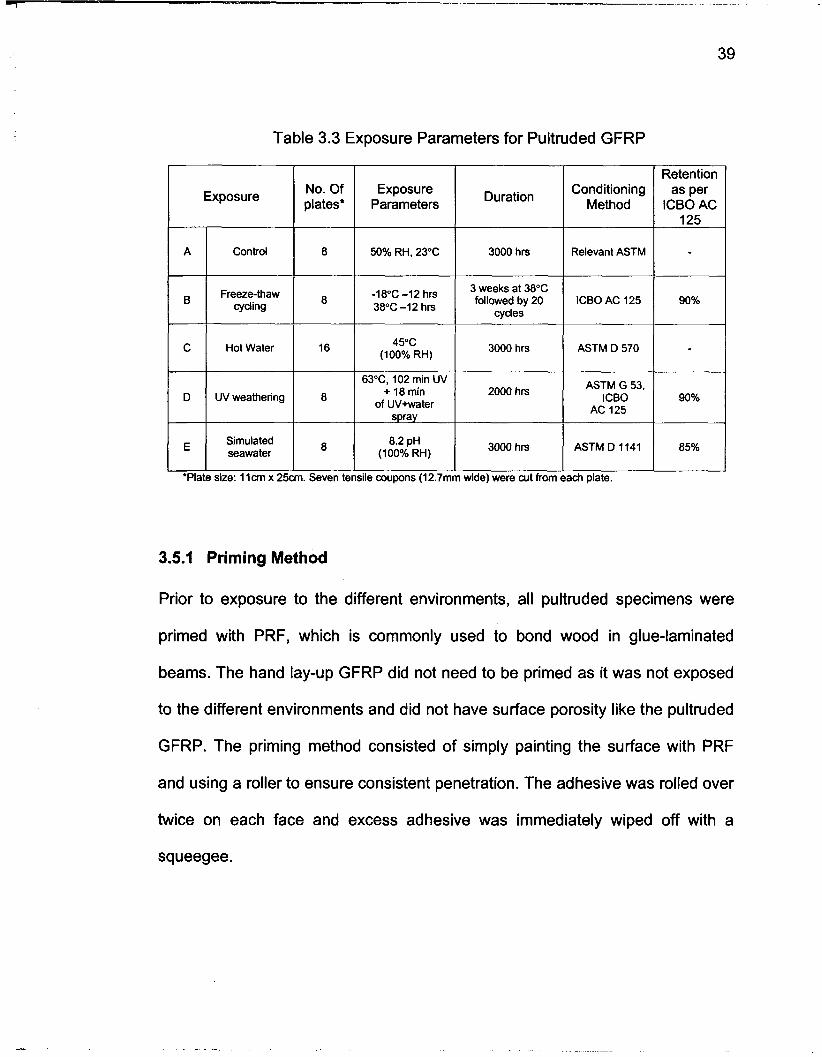
Table 3.3 Exposure Parameters for Pultruded GFRP
Exposure Parameters
Hot Water
tjzl++i Simulated I ( seawater 1 (
50% RH, 23°C
-18°C -12 hrs 38°C -1 2 hrs
45°C (100% RH)
63OC, 102 min UV + 18 min
of UV+water spray
8.2 pH (100% RH)
I 1 Retention
Duration I Conditioning I as per Method ICBO AC
3000 hrs I ReleMnt ASTM I 3 weeks at 38°C
3000 hrs I AsTM 570 I
I I I I L 'Plate size: I lm x 25cm. Seven tensile coupons (12.7mm wide) were art from each plate.
3000 h n
3.5.1 Priming Method
ASTM D 1141 1 85%
Prior to exposure to the different environments, all pultruded specimens were
primed with PRF, which is commonly used to bond wood in glue-laminated
beams. The hand lay-up GFRP did not need to be primed as it was not exposed
to the different environments and did not have surface porosity like the pultruded
GFRP. The priming method consisted of simply painting the surface with PRF
and using a roller to ensure consistent penetration. The adhesive was rolled over
twice on each face and excess adhesive was immediately wiped off with a
squeegee.

The specimens were kept upright in a rack and dried at room temperature
for three weeks. The rationale behind priming is that the GFRP will always be
primed with the adhesive just as any wood lamination in a glue-laminated beam
and this will simulate real-life conditions.
3.5.2 Room Temperature Conditioning (Control specimens)
Room temperature specimens, designated as control specimens were kept in a
humidity and temperature-controlled laboratory. The humidity and temperature
were maintained at 50 f 10% RH and 23.0 f 3" C (73" F) respectively. The
specimens were conditioned at the aforementioned humidity and temperature for
at least three weeks before testing. This period includes PRF primer cure time.
3.5.3 Freeze-thaw Cycling
ICBO AC-125 specified this exposure method. It is intended to measure the
damage caused by thermal shock due to sudden change in temperature and
humidity. Ten plates of pultruded FRP were exposed to this environment. A 300-
watt heater with a thermostat was used to maintain the temperature. A water
pump with a 4-literslmin capacity was used to circulate the water. The water was
TYPE I distilled. The first step of this method consisted of conditioning the
specimens in a heated bath (Figure 3.4) at 38°C (100°F) for three weeks.
The second part consisted of cycling the specimens between -18" C (0° F)
in a freezer for twelve hours and then in the heated bath at 38" C (100° F) for
another twelve hours. This cycling was done for twenty days.

Thus the complete conditioning period was about six weeks. The specimens
were then removed from the bath and stored in a sealed plastic bag at room
temperature until tested for static and fatigue properties.
Figure 3.4 Freeze-Thaw Conditioning Tank
3.5.4 Hot Water Exposure at 45" C (1 15" F)
This test was done to measure moisture adsorption according to ASTM D 570
and effect of moisture at high temperature. Since the GFRP will be bonded to
wood in a glue-laminated beam, it is expected to absorb a certain amount of
moisture from both faces. To accelerate the adsorption process specimens were
conditioned by submerging them in 45°C (1 15" F) distilled water. An HDPE tank
equipped with a 1000-watt water heater and a circulating pump was used to
maintain the desired environment (Figure 3.5). The plates were exposed to this
environment for 3000 hours (125 days) to allow uniform concentration of
moisture throughout the specimen.

Fresh distilled water was used to replace water lost due to evaporation. An
external digital thermometer with an alarm was used to monitor isothermal
conditions.
Figure 3.5 Hot Water Conditioning Tank
3.5.5 UV+Spray (Simulated Exterior Weathering)
ICBO AC 125 recommends this test and ASTM G 53 describes the testing
method. It is an accelerated simulation of exterior exposure. Eight plates were
exposed to a combination of UV light, high temperature, and water spray at cyclic
intervals. The UV light with an irradiance of 0.55 ~ /m* /nrn using UVA 340nm
(peak radiation) fluorescent bulbs and 63" C chamber temperature was used to
simulates sunlight during a hot day. Although sunlight radiation consists of
wavelengths greater than 315nm and beyond the infrared (>700nm), shorter
wavelength radiation (~300) penetrates FRP more and as a result causes more
damage than longer wavelengths (ASTM G53).

The normally distributed radiation wavelengths of UV-A bulbs range
between 31 5 and 400nm which is a better simulation of sunlight compared to UV-
B lamps which emit radiation of shorter wavelengths. Water spray represents
rain. All these factors are known to cause degradation in FRP materials. The
specimens were directly exposed in a weatherometer (QUV) for 2000 hours. All
eight plates were exposed on only one side for 102 minutes of UV followed by 18
minutes of UV and distilled water spray. The water was supplied and recycled
from a 190-liter (50-gal) reservoir, which was connected to the weatherometer
and replenished every 500 hours (Figure 3.6).
Figure 3.6 UV Weathering Chamber (b) Showing FRP Exposure Set-up (a)
3.5.6 Simulated Seawater (Salt Water Resistance)
Salt water was prepared in accordance with ASTM D 1141 (Substitute Ocean
Water) method. Only reagent grade chemicals were used. Three types of stock
solutions were prepared as shown in Table 3.4.

Table 3.4 Composition of Stock Solutions Used in Preparing Seawater.
I CaCh (anhydrous)
Stock Solution 3 (in 10 Liters) Stock Solution 1 Stock Solution 2
555.6 g/L
57.9 g/L
2.1 g/L
The simulated seawater was then prepared by combining common salt,
anhydrous sodium sulfate (NaS04), and the stock solutions 1,2 and 3 in 20 liters
(6 gal) of TYPE I water such that the resultant solution was composed of
chemicals in the concentration shown in Table 3.4.
--
Table 3.5 Chemical Constituents of Simulated Seawater as Per
KC1
NaHC03
KBr
H3B03
ASTM D 1141
NaF
69.5 glL
20.1 glL
10.0 g/L
2.7 g/L
0.3 g/L
Ba(N03k
Mn(NO3)2.6Hz0
Cu(N0&.3H~0
Zn(N03h.6H20
0.994 g
0.546 g
0.396 g
0.151 g
Pb(NO3h
ASNOS
0.066 g

Ten plates were stacked vertically on a HDPE rack and immersed in the
seawater for 3000 hours. The pH was maintained and adjusted to 8.2 with drops
of 0.1N sodium hydroxide (NaOH) solution. The tank was stirred every week to
maintain uniform concentration throughout the tank.

3.6 Test Methods
Physical, mechanical and fatigue properties were determined according to ASTM
specified methods. The laboratories in which the testing were conducted were
temperature and humidity controlled at 23.0 + 3" C (73°F) and 50% * 5% RH.
This section describes the methods used to determine physical, mechanical and
thermal properties of both exposed and unexposed pultruded, and hand lay-up
FRP. The testing matrix is shown in Table 3.2 (section 3.4).
3.6.1 Physical Properties
Physical properties evaluated in this study include density, volume fraction of
resin, reinforcement, and voids content. The glass transition temperature (Tg)
was also evaluated for both control and exposed specimens.
3.6.1 .I Density by Volume Displacement Method
Density was determined by the liquid displacement method using a laboratory
density determination kit and an analytical balance. ASTM D 792 was followed
while conducting this test. Five specimens with 2cm sides were cut from a plate
using a wet diamond saw. The specimens were then washed with tap water and
conditioned at room temperature (23OC, 73°F) and humidity (50 2 5 % RH) for 4
days. The specimens were weighed in air and then weighed again by completely
submerging them in distilled water (Specific gravity = 1 glcc).

3.6.1.2 Fiber, Resin, and Void Volume Fractions by Ignition Loss Test
This test method involves burning the specimens in a furnace such that only
glass fibers remain. The test method specified in ASTM D 2584 was followed. A
rule of thumb for a well-fabricated composite material is that the void content
should be less than 1 % (Agarwal 1990). Higher void content can adversely affect
the mechanical, and durability properties of FRP. Higher void content results in
poor fatigue strength (higher crack density), greater susceptibility to moisture
penetration and weathering, and increased variation in strength properties
(Agarwal, 1990).
Only the control pultruded and hand lay-up FRP were tested for void
content and fiber volume fraction. Five control specimens were prepared and cut
as described in section 3.6.1.1. The specimens were weighed and placed on
aluminum crucibles and then heated at 565°C in a muffled furnace for two hours.
At the said temperature all polymeric and volatile materials burned off and only
glass fibers remained. The remains were cooled to room temperature in
desiccators (to prevent moisture condensation) and weighed again. The
difference in weight constitutes the weight of resin in the composite sample. The
weight of the remains constitutes the weight of fibers. The volume fraction (Vf) of
fiber is determined by using the following equation (Agatwal, 1990):
Vr = (pcelpf) Wr Eqn 3.1
In the above equation, PCe is the experimental density of the composite material
obtained by the method described in the preceding section, pf is the density of the
glass fiber, taken as 2.54 glcc. Wf is the weight fraction of the glass fibers

(residue weight). The void content was calculated according to ASTM D2734.
The equation for void content is given by:
Eqn 3-2
where :
Md = measured composite density
r = resin, weight %
g = glass, weight %
d, = density of resin, and
d, = density of glass.
3.6.1.3 Glass Transition Temperature (T,)
Tg is the characteristic temperature at which glassy amorphous polymers
become flexible (soften) due of the onset of concurrent motion of large segments
of the polymer molecule. Tg is typically used to determine extent of cure and
evaluate effect of plasticization in the exposed specimens. A Dynamic
Mechanical Thermal Analyzer (DMTA) was used to determine the Tg of the two
GFRP used in this study. The tests were done according to ASTM El640 and D
5418 specifications. An increase in the Tg implies further curing (the resin has
become stiffer) whereas a decrease in the Tg implies softening of the resin
(plasticization). Five specimens from each exposure environment were tested
using a DMTA. A DTMA machine measures mechanical and viscoelastic
properties with change in temperature. It applies a dynamic load to measure the

difference in the viscous and elastic properties. A DMTA applies a temperature
ramp beyond the Tg temperature and measures the change in elastic modulus
(storage modulus) and viscous modulus (loss modulus). The force was applied in
a dual cantilever (Figure 3.7) fashion.
Figure 3.7 Dual Cantilever Set-up for Pultruded GFRP on a DMTA
Five specimens of the pultruded FRP from each conditioning were cut to
dimensions with a diamond saw and conditioned at room temperature and
humidity for 4 days prior to testing. The specimens were cut to 44.5mm long and
6.4mm wide from the pultruded plates. The DMTA test parameters were set in
accordance with ASTM D 5418 method. A Rheometric Scientific DMTA IV with
Nitrogen cooling capability was used to determine the Tg and flexural modulus
changes in the specimens. The testing parameters are given in Table 3.6. The
frequency and load application were adjusted to obtain clear and accurate DMTA
graphs.

Table 3.6 DMTA Test Parameters.
~eometrv T v ~ e I Dual Cantilever
DMTA Parameters
r Test t v ~ e I Dynamic Temperature Ramp
Value
r Frequency I 1 HZ
Frame size Center Clamp
Sam~le size (LxWxD)
Large (34mm) Small (2mm)
32.0 mm x 6.3rnrn x 3.3mm
lnitial-static force I
Temperature ramp
Temperature ramp rate Strain
23" C to 300" C 2" C 1 min 0.002 %

3.6.2 Mechanical Properties
The mechanical properties measured include longitudinal tensile strength,
Young's modulus, strain to failure, and interlaminar shear strength. The pultruded
specimens were cut from plates as shown in Figure 3.8. The hand lay-up
specimens were cut to 23cm long and 1.9cm wide. Straight edge coupons of
unidirectional FRP have been found to perform better in static tests than others
with varying widths (ex. Dog-bone) (Curtis, 1989).
3.6.2.1 Tensile Strength and Young's Modulus
The FRP coupons were tested for tensile strength using the method specified in
ASTM D 3039. The FRP cutting configuration is shown in Figure 3.8.
Static tensile testing was conducted before and after exposure to various
Figure 3.8 Specimen Cutting Configurations for Pultruded GFRP

52
environments to determine the ultimate tensile strength (UTS), strain to failure,
and the Young's modulus of elasticity. Seven coupons from each exposure
environment were tested using the lnstron 8801, 100 KN (22 kip) mechanical
testing machine. An extensometer was used to measure strain in the specimen.
The specimens were tested at a strain rate of 1.27mmlmin (0.05inlmin).
3.6.2.2 Apparent Interlaminar Shear Strength
This test was done to determine change in bond properties of the interface
between the fiber and the resin as well as resin properties. Rectangular
specimens measuring 22.86mm x 6.55mm x 3.3mm (L x W x D) were cut from a
Composite
Specimen
Span Length
6 in
plate using a water-cooled diamond saw.
Depth 3.3rnrn
X-section 4----- Length
22.86mm d Figure 3.9 Schematic of Interlaminar-Shear Testing Fixture and Sample

The dimensions were cut according to the lengthlthickness ratio (Lld) of
seven and spanlthickness ratio of five as specified by ASTM D2344. This test is
a simple three-point bend test. A schematic of the fixture is shown in Figure 3.9.
Seven specimens from each exposure environment were tested for interlaminar
shear strength.
3.6.3 Fatigue Properties
The fatigue properties evaluated are the fatigue life at different stress levels and
the residual strength at 10%UTS after 3 million cycles of fatigue. The fatigue life
is the number of cycles a specimen endured before failure, at a particular stress
level. The residual strength of only the pultruded GFRP was evaluated. The
procedure used to evaluate both fatigue life and residual strength is given below.
3.6.3.1 Fatigue Life
The fatigue life was determined in accordance with ASTM D 3479. Specimens
were cut from plates as shown in Figure 3.8. In addition to the control specimens,
the fatigue life of all the exposed specimens were also determined. The
parameters used for the fatigue test are given in Table 3.7. The applied stress is
reported as the percentage of ultimate tensile strength (UTS) of unexposed (dry
control) specimens, which is 703.26 MPa (102 ksi). The specimens were tested
for fatigue only in the longitudinal direction, as they will be used in practice.

Table 3.7 Fatigue Test Parameters for Pultruded and Hand Lay-up GFRP
I Fatigue Parameters I Calculationlcomment I Parameters
I Stress Ratio (R) I (min stresslmax stress) I 0.1
Attack time
I Frequency I # of cycles per second I 20 Hz
Initial time to gradually increase amplitude
A bridge girder such as an FRP-Glulam beam will always carry a constant
dead load. The fatigue test was designed in a similar manner where the
specimen is cycled between a minimum and a maximum load or stress, both
being in tension. The ratio of minimum to maximum stress applied is called the
stress ratio (R). In this study an R ratio of 0.1 was used. This test is also
commonly called a Tension-Tension fatigue test because both the minimum and
maximum stresses cause the specimen to be always in tension. The cyclic siess
applied to the specimens was a sinusoidal waveform with a frequency of 20Hz
(Figure 3.10). Specimens were tested at different stress levels and the S-N curve
was plotted on a logarithmic scale. The fatigue waveform settings for exposed
and unexposed pultruded GFRP are shown in Table 3.8. The hand lay-up
specimens were also tested at proportional stress levels.
20 seconds
Mean stress
Amplitude
(max stress + min stress)/2
(Max stress - mean stress) See Table 3.8

Table 3.8. Fatigue Waveform Settings for All Pultruded GFRP
Waveform settings I Stress level I Sample size I (l2.7mm wide by 3.3mm thick specimens)
I Amplitude I Control I Exposed I (MPa)
Five specimens were tested at each stress level for the control group and
four at each stress level for the exposed groups. A servo hydraulic mechanical
testing machine (INSTRON 8801 100 KN) was used to generate the waveform.
The INSTRON actuator was controlled by software from a PC provided by the
manufacturer. Running a fatigue test consisted of entering all the parameters
shown in Table 3.7 and Table 3.8, and setting the interrupts so that the machine
automatically stops when a specimen fails. Failure is said to occur when the
specimen could no longer maintain the minimum load applied. The trip limit was
set at 10% below the minimum load. For example if a specimen were cycled
between 9000 N (max) and 900 N (min), failure would occur if the minimum load
drops below 810 N. Since failures have been observed to be abrupt, these limits
were set to prevent the machine from completely separating the fractured pieces
and to allow visual examination of the fracture surface.
50 %
40 %
30 %
20 % UTS (control)= 703.26 MPa (102 Ksi)
5
5 5 5
4 4 4 4
352 281 21 1 141
197
155 116 76
155 126
95 65
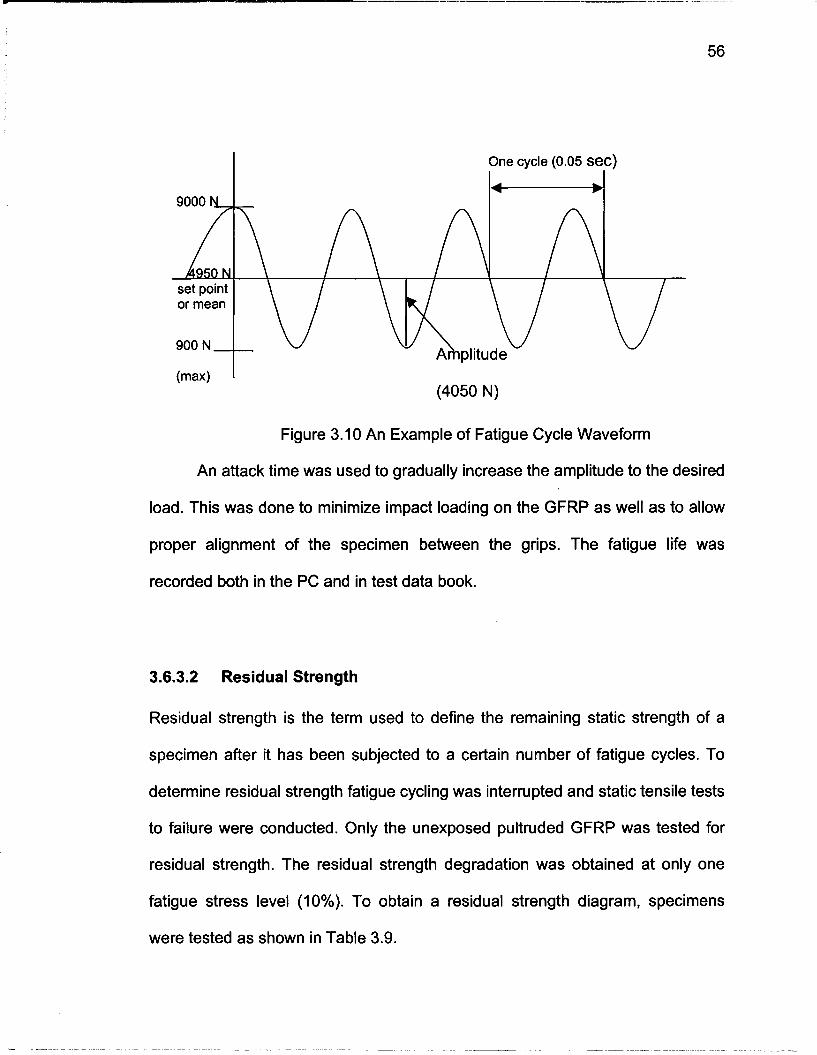
I One cycle (0.05 S ~ C )
Figure 3.10 An Example of Fatigue Cycle Waveform
An attack time was used to gradually increase the amplitude to the desired
load. This was done to minimize impact loading on the GFRP as well as to allow
proper alignment of the specimen between the grips. The fatigue life was
recorded both in the PC and in test data book.
3.6.3.2 Residual Strength
Residual strength is the term used to define the remaining static strength of a
specimen after it has been subjected to a certain number of fatigue cycles. To
determine residual strength fatigue cycling was interrupted and static tensile tests
to failure were conducted. Only the unexposed pultruded GFRP was tested for
residual strength. The residual strength degradation was obtained at only one
fatigue stress level (10%). To obtain a residual strength diagram, specimens
were tested as shown in Table 3.9.

Table 3.9 Residual Strength Testing Parameters for Pultruded GFRP
Maximum Stress (%UTS-Control)
3.6.4 Microscopy
I
A light microscope was used to examine failure samples for possible trends in
Cycles after which residual strength was determined
the failure mode. A stereomicroscope as well as a transmitted light microscope
No. of specimens for each number of
elapsed cycles
6 10 %
with polarized light was used to observe surface features. Both microscopes
0.5 million. 1 million and 3 million
were connected to a digital camera to allow pictures to be taken and stored. A
Scanning Electron Microscope (SEM) was used to examine fiber interface and
bond characteristics in the pultruded and hand lay-up failed specimens.

4 RESULTS OF PHYSICAL AND MECHANICAL TESTS
4.1 Introduction
The results of the physical and mechanical tests of the pultruded and hand lay-up
GFRP are presented in this chapter. This chapter is organized into two main
sections. The first section (section 4.2) presents the physical data and the next
section (section 4.3) covers the static mechanical properties of the two GFRP. All
tests were done according to ASTM specified methods. Statistical analysis was
done using Analysis of Variance (ANOVA) at the 5% significance level. A
summary of the findings is given at the end of the chapter. The results of fatigue
tests are given in Chapter 5.
4.2 Physical Properties
The results of the ignition loss tests are given in Table 4.1 and 4.2. The results
are explained in the following sections.
4.2.1 Density, Volume Fractions and Void Content
Pultruded GFRP
The density of the pultruded GFRP (unprimed) is approximately I .75 g/cc (Table
4.1). The fiber volume fraction, which includes unidirectional and randomly
oriented short fibers in the mat layer, is approximately 54%. However the fiber

volume fraction of the core alone, which consists of unidirectional fibers only, is
approximately 70%.
Table 4.1 Density and Ignition loss Results of Pultruded and Hand Lay-up GFRP
1 I Pultruded GFRP 1 Hand Lay-up GFRP
Fiber 1 6 1 54.19 1 1.31 1 65.1 fraction Vf
Sample size
Resin volume
Pultruded GFRP
Volume fraction %
Volume fraction %
fraction V, Void volume fraction V,
I Hand Lay-up 1 2.01 1 2.54
cov %
6
Resin glcc
6
cov %
21.07
Table 4.2 Density of Pultruded and Hand Lay-up GFRP
24.74
The SEM images (Figure 4.1), taken on smooth cross section of the
GFRP support the results of the ignition loss tests. The mat layer has high voids
content (45%) and low fiber volume fraction compared to the core. Each mat
layer is approximately 0.55mm thick and the core is approximately 2.2mm thick.
The thickness of the GFRP varies along the width because it was belt sanded
after pultrusion. SEM images also indicate that the wetting of fibers by the resin
is poor. The resin volume fraction (lost weight) of the entire GFRP is
approximately 21.7%.
2.89 27.02
1.87 8.06

Mat layers
Figure 4.1 SEM Image of Pultruded GFRP Cross-Section
The void content of the pultruded GFRP was approximately 24.7%, which
is considered very high compared to common FRP materials. This figure also
exceeds the ICBO AC 125 requirement of 6% or less. However, this void content
is primarily due to the mat layers, which are intended to allow adhesive
penetration and thus improve bonding with solid wood and other wood
composites. Priming the surface with PRF resin seals off most of the surface
voids, but not completely (see Figure 4.2). The phenolic resin also appeared to
be highly porous (see Figure 4.3). This porosity must have been formed during
the manufacturing process when the resin cured in the pultruder forming-die.
The curing process of phenolic resin is known to produce significant
amount of water from the condensation reaction (Tavakoli et al 1990). Branco et
al (1994) also stated that they observed internal voids in the phenolic composite
they were testing. They concluded that the voids were due to entrapped water
bubbles produced during composite manufacture.
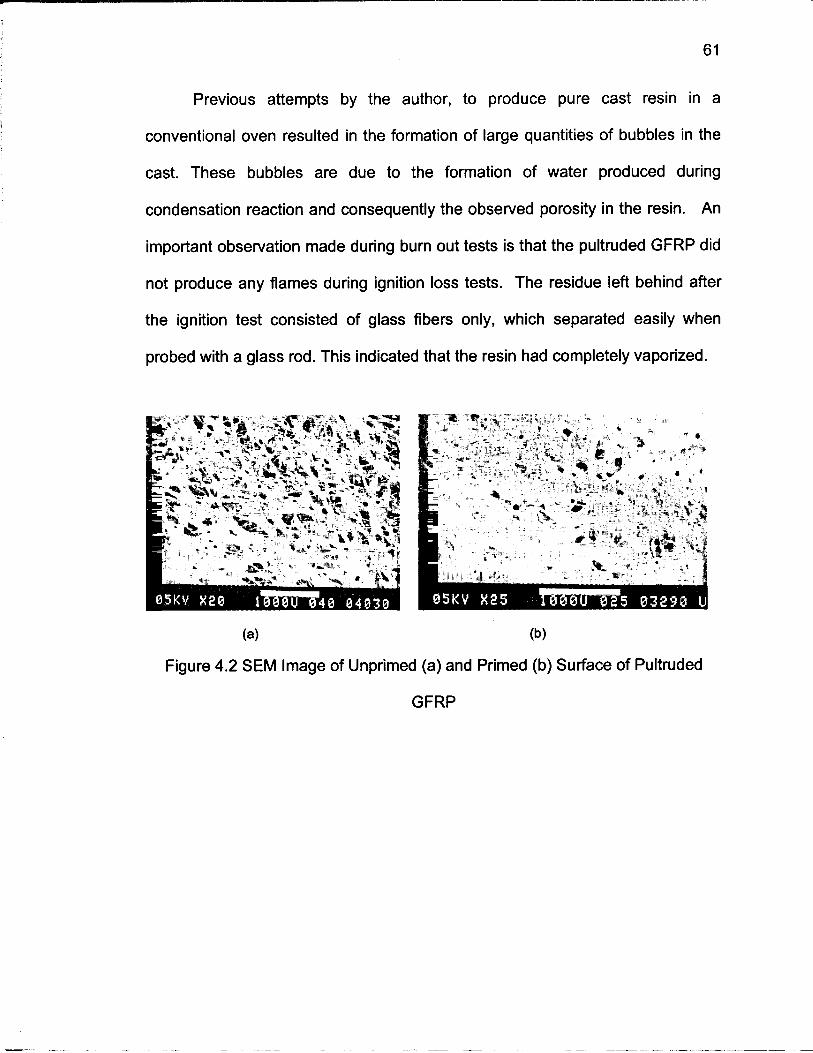
Previous attempts by the author, to produce pure cast resin in a
conventional oven resulted in the formation of large quantities of bubbles in the
cast. These bubbles are due to the formation of water produced during
condensation reaction and consequently the observed porosity in the resin. An
important observation made during burn out tests is that the pultruded GFRP did
not produce any flames during ignition loss tests. The residue left behind after
the ignition test consisted of glass fibers only, which separated easily when
probed with a glass rod. This indicated that the resin had completely vaporized.
(a) (b)
Figure 4.2 SEM Image of Unprimed (a) and Primed (b) Surface of Pultruded
GFRP

Figure 4.3. (a) and (b), SEM lmage of Fractured pultruded GFRP Showing Voids
in the Resin
Hand Lay-up GFRP
The hand lay-up GFRP was made of five layers of woven unidirectional glass
mats (Figure 4.4). The fiber, resin, and void volume fractions of this GFRP are
approximately 65%, 27.02% and 8% respectively.
Figure 4.4 Stereomicroscope lmage (16x) of Hand Lay-up GFRP Showing the 5
Glass Layers Along the Edge (thickness)
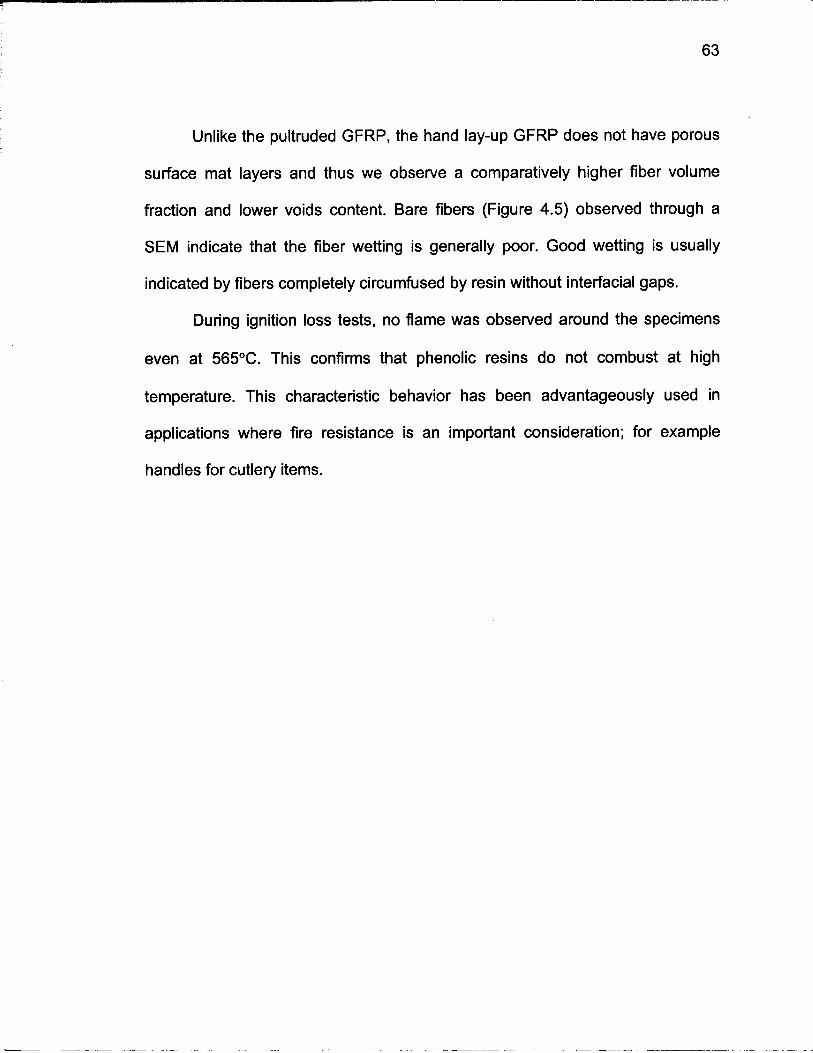
Unlike the pultruded GFRP, the hand lay-up GFRP does not have porous
surface mat layers and thus we observe a comparatively higher fiber volume
fraction and lower voids content. Bare fibers (Figure 4.5) observed through a
SEM indicate that the fiber wetting is generally poor. Good wetting is usually
indicated by fibers completely circumfused by resin without interfacial gaps.
During ignition loss tests, no flame was observed around the specimens
even at 565°C. This confirms that phenolic resins do not combust at high
temperature. This characteristic behavior has been advantageously used in
applications where fire resistance is an important consideration; for example
handles for cutlery items.
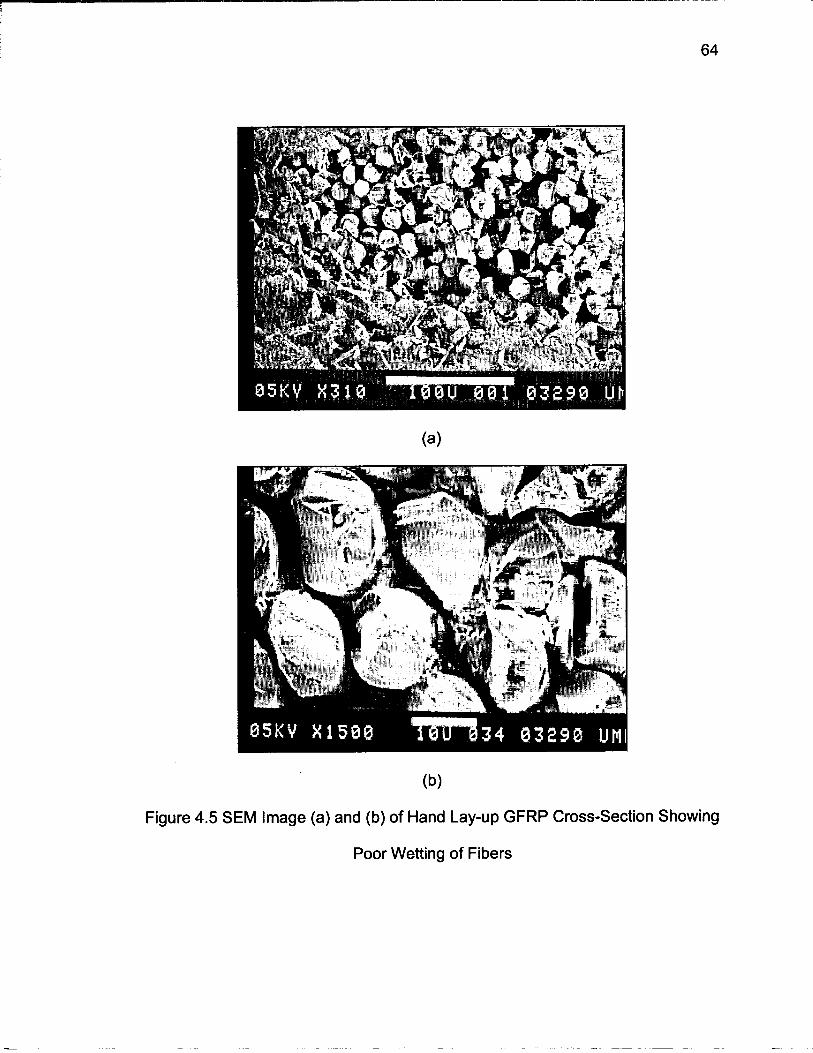
(b)
Figure 4.5 SEM Image (a) and (b) of Hand Lay-up GFRP Cross-Section Showing
Poor Wetting of Fibers

4.2.2 Glass Transition Temperature (Tg)
Dynamic mechanical thermal analysis (DMTA) tests were done on the exposed
and control pultruded specimens only. The results are given in Table 4.3. In
summary, the Tg following the various exposures ranged from 194°C to 207"C,
with simulated seawater specimens and UV weathered specimens exhibiting the
lowest and highest Tg respectively (see Appendix D). Analysis of Variance
(ANOVA) was used to verify the differences in the results. The Tg of control
specimens is 20I0C, which is high compared to common types of thermosetting
resins such as epoxies (60-175"C), polyesters (1 10°C), and vinyl esters (75-
105°C) (Bauccio, 1994). Statistical analysis (ANOVA) of the Tg using a
significance level of 0.05 (95% confidence) shows that, except for freeze-thaw
specimens, all other exposures had a significant change in the Tg. The DMTA
diagram of freeze-thaw specimens exhibited two loss modulus peaks. The first
peak, which was lower in magnitude, was observed at approximately 120°C and
the second occurred at the actual Tg. Since water boils at 100°C, it is possible
that the first peak represents water loss.
The possibility that this first peak is associated with the PRF primer has
been ruled out since preliminary tests with unprimed pultruded GFRP also
exhibited such peaks between 90 and 150°C. The water present is due to the
water immersion in freeze-thaw cycling. The second peak clearly represents the
glass transition temperature, Tg. Following the second peak, the viscous property
decreases without any recovery. The elastic modulus (storage modulus)
continuously decreases with increase in temperature and levels off after the Tg.

66
The maximum temperature was set to 300°C because it was known from
previous tests that the Tg of this particular phenolic GFRP would not exceed this
value.
The Tg of hot water specimens decreased by approximately 5.4"C. This
decrease may be due to plasticizing effects of water. Water tends to swell and
increase the free volume of the polymer thus decreasing Tg. Moisture is known
to significantly alter the viscoelastic property of polymeric thermosetting resins
(Dillard et al, 1991). The effect of matrix plasticization of thermosetting polymer
such as vinyl ester due to water ingression has been reported by Liao et al
(1998). Sridharan et al (1998) also claimed that moisture (water) acts as a
plasticizer to vinyl ester matrix systems, causing a fall in tensile properties. The
loss modulus curve of the hot water pultruded GFRP exhibited two peaks similar
to the freeze-thaw specimens (Figure 4.6).
UV weathered specimens exhibited the highest increase in Tg. The Tg
increased by approximately 5.2OC. An increase in Tg usually implies post curing.
This may have been the case with UV weathered specimens. The temperature
within the UV chamber was kept constant at 63°C with relatively short period of
water spray. High temperature along with UV radiation may have further cured
the resin. Since the water spray was only active for 18 minutes every 2 hours, it
is possible that this short duration coupled with the high temperature did not
allow sufficient time for water to be absorbed in the GFRP. Thus the effect of
moisture may have been rendered insignificant. The weathering effect inside the

UV chamber caused significant erosion of the mat layer. The dark PRF primer
turned into pale purple exposing the surface fibers.
The Tg of simulated seawater specimens decreased by approximately
7.6OC. The lowering of Tg can be attributed to plasticizing effects of water. These
specimens also exhibited two loss modulus peaks, but the first peak was very
small in magnitude compared to the second.
Table 4.3 Glass Transition Temperature (Tg) of Pultruded GFRP 7
Exposure
Control
Figure 4.6 DMTA Diagram of Pultruded GFRP - Hot Water Specimen
- Hot water
UV weathering
Simulated Seawater
Sample size
5
5
5
5
Tg ("C)
201.06
COV%
1.33
1 96.44
207.01
194.23
0.79
0.70
1 .OO

4.3 Mechanical Properties
4.3.1 lnterlaminar Shear Strength
The interlaminar shear strength (ILSS), also called short beam shear helps to
determine the change in the fiber-matrix interface bond strength. The ILSS of
pultruded control and exposed specimens are given in Table 4.4. Failure was
observed as a single horizontal shear crack that extended longitudinally in the
core of the specimens. Tension failure of mat layer or core did not occur in any
specimen. As a result all failures were considered valid. The average interlaminar
shear strength of the control pultruded specimens is 24.29 MPa (3523 Psi).
Table 4.4 lnterlaminar Shear Strength of Pultruded GFRP Specimens
Exposure
Hot Water
Simulated Seawater t UV weathered specimens had the lowest interlaminar shear strength. The
ILSS of UV weathered specimens decreased by 11%. Hot water exposure also
caused statistically significant decrease (6% reduction) in the ILSS. The ILSS
loss in hot water specimens may be attributed to damaging effects of moisture in
the interface. Several authors have reported this effect suggesting that the
damage mechanism is due to moisture corrosion caused by exchange of alkali
size
lnterlaminar Shear Strength
( M W
Standard Deviation
( M W COV % Reduction
(5%

metal ions (Na* and K') in the glass and hydrogen ions in the attacking fluid (H')
(Liao et al, 1998). The specimens in both these exposures were not only
exposed to 100% water immersion but also high temperature (45°C hot water
and 63°C UV). Thus it is difficult to ascertain which of the two factors caused
more damage.
4.3.2 Longitudinal Tensile Properties.
Pultruded GFRP
The average longitudinal tensile strength (see Table 4.5) of the pultruded control
GFRP is 703.22 MPa (102 ksi). The Young's modulus is 40.56 GPa (5.88 msi)
with a strain to failure of approximately 2.0%. The tensile failure of the control
pultruded specimens was characteristic of unidirectional composites. Failure
initiated with the outer mat layer fracture and a few longitudinal fiber rupture
along the edges. Close to the ultimate stress progressive fiber fracture along the
edges were observed. At ultimate stress, failure occurred abruptly with massive
fiber fracture (explosion) and longitudinal shear splitting (Figure 4.7).
The longitudinal tensile strength of freeze-thaw specimens decreased by
approximately 10%. Hot water specimens were affected the most. The tensile
strength of hot water specimens reduced to 480 MPa (31.74% reduction). This
result clearly indicates that the fibers have been damaged due to a combination
of moisture adsorption and high temperature.

Figure 4.7. Tensile Failure of Pultruded GFRP Seen Between lnstron Grips
UV weathered specimens, exhibited almost no significant change in
tensile strength. The standard deviation of these specimens was low indicating
uniform properties. The failure mode of these specimens was also different from
the control group. The characteristic explosion of fibers was not observed and
instead the coupon failed abruptly at ultimate stress with mostly longitudinal
shear splitting (Figure 4.8). The ultimate tensile strength of simulated seawater
specimens reduced by only 7%. However, the change is statistically insignificant
due to the large standard deviation.

Figure 4.8. Tensile Failure Mode of Pultruded GFRP at UTS
No change was observed in the Young's modulus of any of the exposed
specimens (see Table 4.6 and Figure 4.11). Any change observed was not
statistically significant at the 5% level.
Hand Lay-up GFRP
The longitudinal tensile strength of hand lay-up GFRP specimens is
approximately 422 MPa (61.29 ksi). The strength varies significantly as
observed from the high COV (18%) (see Table 4.5). The modulus of elasticity of
this GFRP is approximately 36 GPa (5.33 msi). Failure mode is characterized by
transverse tensile fracture in the gage length with some fraying of fibers as
shown in Figure 4.9. Transverse fracture tends to propagate along a region on
the surface where a cross-weave was present.

Figure 4.9 Hand Lay-up GFRP Specimens Failed in Static Tests
Table 4.5 Longitudinal Tensile Strength of Pultruded and Hand Lay-up GFRP
Pultruded GFRP
Samp'e l size 7 1 7 1 7 1 7 1 7
Control
Strength reduction 1 9.5% 1 31.7% 1 0.5% 1 7%
Hand Lay-up GFRP
Freeze- thaw Control Hot
Water UV 2000
hrs Simulated Seawater
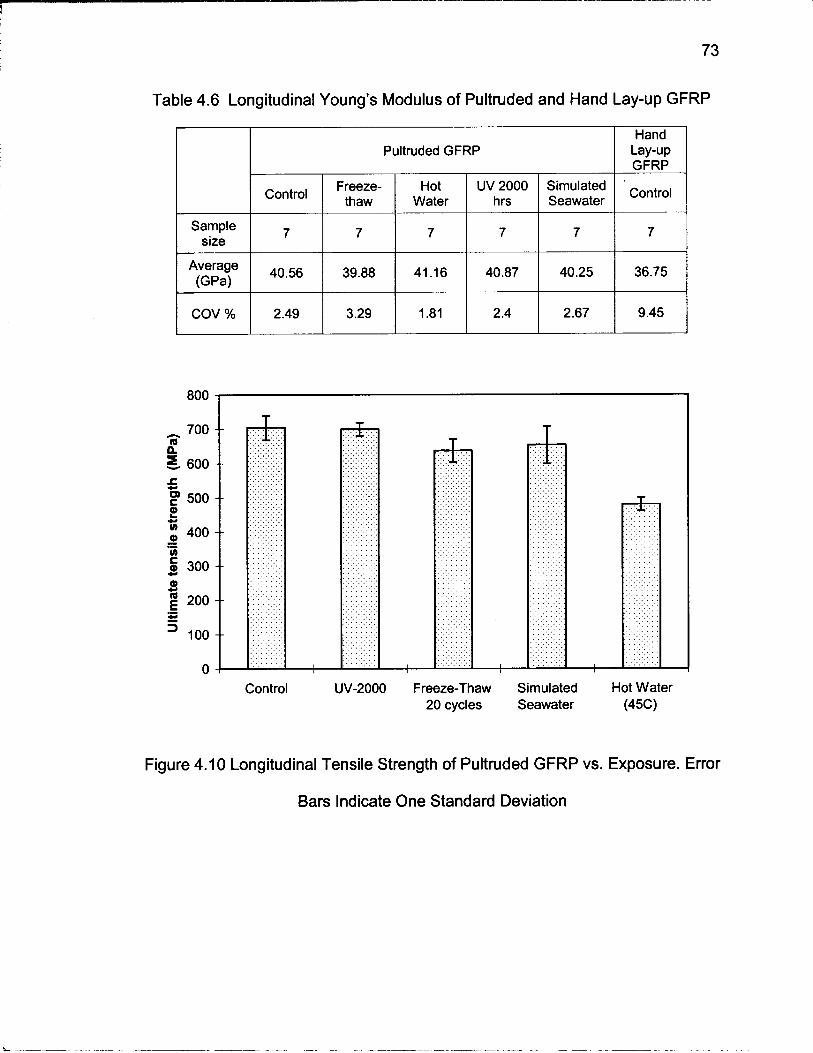
Table 4.6 Longitudinal Young's Modulus of Pultruded and Hand Lay-up GFRP
Sample size
Pultruded GFRP
I COV % 1 2.49
Hand Lay-up
Freeze- thaw
Hot UV 2000 Simulated I Control I Water I hrs I Seawater
Control UV-2000 Freeze-Thaw Simulated Hot Water 20 cycles Seawater (45c)
Figure 4.1 0 Longitudinal Tensile Strength of Pultruded GFRP vs. Exposure. Error
Bars Indicate One Standard Deviation

45
g 40 (I) 3 - t B (I) -cn 5 35
30 Control UV 2000 Freeze-Thaw Simulated Hot Water
Seawater (45C)
Figure 4.1 1 Tensile Young's Modulus of Pultruded GFRP vs. Exposure. Error
Bars Indicate One Standard Deviation

4.4 Summary
Two types of E-glass reinforced phenolic composites (pultruded and hand lay-up)
were tested for physical and mechanical properties. The pultruded GFRP was
exposed to different accelerated environments and after the exposure period, the
mechanical strength retentions were determined. The findings are summarized
below.
From ignition loss tests it was observed that the void volume fraction of
pultruded and hand lay-up GFRP were 24% and 8% respectively and
exceeds the recommended 6% or less by ICBO AC 125. SEM images
of pultruded GFRP revealed large number of pores in the resin. These
pores may have been formed due to condensation reaction during
curing of phenolic resin.
The pultruded control specimens had a Tg of 201°C. UV weathered
specimens showed an increase in Tg (207°C) whereas hot water
(197°C) and simulated seawater (194°C) specimens exhibited a
decrease in Tg. The increase in Tg can be attributed to post curing of
the resin and the decrease in the Tg is mostly due to plasticizing
(softening) effects of water.
The interlaminar shear strength of UV weathered specimens was
reduced by 11%. Although slight changes were observed in other
exposure environments, the changes were not statistically significant.
Hot water exposure caused the highest reduction in tensile strength.
The ultimate tensile strength of the hot water specimens was reduced

by as much as 31%. Hot water specimens also exhibited a reduction in
ILSS (6%). Thus, it may be concluded that hot water exposure
damaged both glass fibers and the interface. Freeze-thaw specimens
exhibited a 10% reduction in tensile strength. The damage can be
attributed to resin and fiber-resin interface deterioration caused by
moisture ingression. Salt water did not cause any statistically
significant change in the tensile strength.
None of the exposed specimens showed any statistically significant
change in Young's modulus.
UV weathered specimens indicate that high temperature can further
cure (post curing) the resin if polymerization was not complete in the
manufacturing process. If the cross-linking of polymer chains were
complete in the manufacturing process, no increase in the Tg would be
observed. Although UV showed no degradation in tensile strength, the
ILSS was reduced by 11%. This indicates that UV had some effect on
the interface. The difference in the thermal expansion coefficients of
the glass fiber and resin may be a possible explanation of the
reduction in ILSS.
Except for hot water exposure test, which was not specified by ICBO,
all the tests that were specified by ICBO AC 125 passed the minimum
strength retention.
5 RESULTS OF FATIGUE TESTS
5.1 Introduction
This chapter describes the results of all the fatigue tests conducted in this study.
The first section describes the results of fatigue tests conducted on exposed and
control pultruded GFRP followed by a discussion on fatigue failure mechanism.
The next section describes the results of the fatigue tests conducted on the hand
lay-up GFRP. The following section describes the results of residual strength
tests followed by a summary of the chapter.
5.2 Fatigue Strength of Pultruded GFRP
Fatigue tests were conducted using a servo hydraulic INSTRON machine at
constant amplitude with a stress ratio of R=0.1 and a frequency of 20 Hz.
Specimens were tested at different stress levels until failure, and the test was
stopped at 3 million cycles if no failure occurred. For the control type, five
specimens were tested at each of the seven stress levels (80%, 70%, 60%, 50%,
40%, 30% and 20% UTS). For the exposed types, four specimens were tested at
each stress level (50%, 40%, 30%, 20%). The control specimens were tested
first to observe material variability and to estimate failure boundaries. S-N
diagrams were developed for each exposure type and then compared with the
control to observe any change in fatigue behavior. Fatigue testing presented

many problems, which were solved earlier during dry runs to obtain maximum
number of valid results.
5.2.1 Failure at Grips
Failure at the grips was the most persistent problem in fatigue testing. Other
authors have recorded this problem also (Bronco et al, 1996; Lorenzo et al,
1986). Initially, it was thought that tabs were needed at the gripping area of the
pultruded GFRP to reduce failure at grip edges. Failure at the grip edge is mainly
due to high stress concentration. Rectangular specimens were tested with a
variety of tab types and adhesives. Glass fiber reinforced epoxy tabs with a 15"
machined tapered edge were used with little success. The tabs remained intact
but the mat layer sheared off at both high (>50% UTS) and low ( ~ 5 0 % UTS)
stresses. In the next attempt, thin aluminum strips were bonded to the coupons
with polyurethane (PU) adhesive. This type of tab was attempted due to the
success reported by few authors who tested similar FRP materials (Bronco et al,
1996). This time the mat layer was intact and well bonded to the core but the
adhesive bond failed before actual fatigue failure of the specimen. The PU
adhesive penetrated the mat layer very well, which was evident from the foaming
action observed during adhesive application. However, the PU adhesive did not
bond very well to the aluminum strips in spite of careful material cleaning and
preparation.
Two other adhesives, an epoxy and a methacrylate industrial strength
adhesive were used with the aluminum strips, but unfortunately failure at the

grips persisted. The grip pressure was also adjusted to find an optimum value.
The grip pressure had to be adjusted to prevent crushing and slippage in the grip
area. Finally coupons were tested with no tabs. The mat layer, although
damaged by the gripping, was beneficial in protecting the core from the rough
serrated faces of the grips. This produced very few failures at the grips for higher
stress fatigue tests and almost no failure at the grips for lower stresses. Thus, all
fatigue tests were conducted without tabs. Specimens that failed at the grips
were discarded and not used in the data analysis.
5.2.2 S-N Curves of Pultruded Specimens: Effect of Environmental
Exposure
The S-N curve of control pultruded specimens is presented in Figure 5.1. The
entire data set is given in Appendix C. The S-N curves were plotted and analyzed
using Microsoft Excel. The abscissa represents number of cycles to failure in the
logarithmic scale (base lo), while the ordinate represents the maximum tensile
strength applied on the specimens in percentage. The S-N curves were drawn
using a linear fit of the data (least squares method). The fatigue lives of exposed
specimens were compared to the control values at the same stresses.

UTS Contml = 703 MPa Stress Ratio = 0.1 Frequency = 20 Hz
- Mean S N Curve
- - - 5% Lower Tolerance Limit with 95% ConfMce
* Run Outs
0 1 2 3 4 5 6 7
Fatigue life (LOG N)
Figure 5.1 S-N Curve of Control Pultruded GFRP with 5% LTL with 95%
Confidence
The S-N curve has a negative slope, which is indicative of the fact that lower
applied stresses result in higher fatigue lives. The five control specimens that
were tested at 20% UTS exceeded 3 million cycles of fatigue (Run outs).
S-N Curves Of Exposed Specimens
The S-N curves of exposed specimens (see Figure 5.2) also exhibited the
general trend seen in control specimens. The entire data set is given in Appendix
C. In qualitatively comparing the S-N curves of the exposed specimens with that
of the control, three characteristic behaviors were observed. UV weathered
specimens stand out from other S-N curves and show a slight decrease in the
fatigue life as compared to the control at high and low stresses (the slope of the
S-N curve is approximately equal to the control specimens but the curve is

81
shifted down). The rest of the exposure types, which include hot water, simulated
seawater and freeze-thaw cause an increase in the fatigue life compared to the
control S-N curve for stresses lower than 45% UTS. As for stresses higher than
approximately 45% UTS, the fatigue life decreases compared to the control
specimens. In other words, the slopes of the S-N curves of these exposures
appear to be less steep than that of the control. Table 5.1 summarizes the fatigue
strength of the pultruded GFRP at different cycles.
An analysis of variance (ANOVA) show that the fatigue life of UV
weathered and hot water specimens are not statistically different from the control
specimens at a significance level of 0.05. This is indicated by the F-statistic
value, which is smaller than the Fdt in the corresponding exposures (Table 5.2).
Table 5.1 Fatigue Strength (% of Mean UTS Control) of Pultruded GFRP
I I % UTS Control (UTS Control = 703 MPa) Exposure
3 million
18.9
100000
A
B
C
D
E
39.0
41 .o
Control
Freeze-thaw
1 million
Hot water
UV weathering
Simulated seawater
2 million
25.5
31 .I
21.3
28.1
40.9
36.3
41.8
29.1
23.1
30.6
25.6
19.2
27.2

Table 5.2 Statistical Analysis of Mean Life at 30%UTS Using ANOVA
I D I UV Weathered 1 278,300 1 A-D 1 1.98 1 5.99 1 Not different
Significance a=0.05
A
6
C
I E I Salt water 1 1 . l7 lo6 1 A-E 1 10.82 1 5.99 1 Different
Freeze-thaw and salt-water exposures caused statistically significant
increase in the fatigue life over the control (Table 5.2) at 30%UTS. This is
detected by the F-statistic, which is higher than the F ~ t value. At 30% UTS-
control, the fatigue lives of freeze-thaw and salt water specimens increased by
166% and 139% respectively. At 40% and 50% UTS, the fatigue lives of exposed
specimens are not any different from the control. Fatigue strength of exposed
specimens was not tested at stress level higher than 50%UTS-control.
F Means compared Exposure
Control
Freeze-thaw
Hot water
Fcrit
Fatigue Life at
(Cycles)
490,600
1.3 lo6
805,900
A-B
A-C
8.33
1.55
5.59
5.99
Different
Not different

UTS Control = 703 MPa Frequency = 20 Hz R (stress ratio) = 0.1
Hot Water A Seawater X Freeze-thaw
Hot water
0 1 2 3 4 5 6 7
Fatigue Life (Log N)
Figure 5.2 S-N Diagrams of Exposed and Control Specimens

The S-N curves were modeled using the Log-normal linear equation given
below. It must be noted that the logarithm used in all the equations is the
logarithm to the base ten.
aa = - ALogN,,, + B Eqn 5-1
For mean S-N, A = 13.942, B = 108.06
Where: a, is the maximum applied stress,
N is the number of cycles to failure
A and B are constants.
For example if the desired mean fatigue life were 3 million cycles (Loglo N =
6.477) then the mean applied maximum stress would be 18%UTS (UTS Control
= 703 MPa, 18%UTS = 126 MPa). The parameters A and B for each exposure
are listed in Table 5.3. The parameter A represents the slope of the curve and B,
which is the intercept of the linear equation, represents the mean ultimate tensile
strength.
Since fatigue cycling was limited to 3 million cycles, no apparent fatigue
threshold or endurance limit were observed. However, it can be deduced from
the fatigue tests that the S-N curve behaves differently below 20%UTS. This can
be further substantiated by the fact that at 20% UTS, the strain is approximately
0.35%, which is below the strain to failure of the phenolic resin; 0.45%. Thus, at
stresses lower than 20%, the matrix damage mechanism is different and
consequently the fatigue behavior is expected to be different.

85
Table 5.3 S-N Curve Parameters For Exposed and Control Pultruded GFRP
Exposure I A B l Actual UTS (%UTS Control)
5.3 Statistical Analysis of S-N Data
A
C
D
E
Two methods are shown for providing upper and lower bounds for the fatigue
data: (1) 5% Lower Tolerance Limit (one sided) and, (2) 5m Percentile. The
tolerance limit method has been used for fatigue design of steel, wood and
polymer composites (Wirsching, 1983; Bond et al, 1998; Roland et al, 1996). The
tolerance used in this study is the one-sided lower 95% tolerance limit for 95% of
the population. Since we are interested in the lower limit for safe design, this
tolerance limit can also be called the 5% Lower Tolerance Limit (5%LTL) with
95% confidence. This tolerance limit describes a lower limit to the data, above
which one can say that at least 95% of future observations (or sampled normal
population) will have a 95% survival probability. The 5% LTL was used here
because it provides a precise statistical lower boundary which is not too stringent
for widely scattered fatigue data (Bond et al, 1998). The tolerance limit was
calculated according to a method described by Wirsching (1983). The method is
13.9 Control
Hot water
UV weathering
Simulated Seawater
108 loo
11.8
13.1
11 .i
loo
102
97.7
69.6
too
94.8

described in Appendix C. The equation used for calculating the tolerance limit is
given below:
Log N5%LTL = T - h Eqn 5-2
where , N5%LTL = Fatigue life with 95% survival probability
T = mean life calculated from the best-fit straight line at a
particular stress level,
k = tolerance coefficient (k2.126, n=40 for control)
corresponding to the total sample size and required
population (p=95%),
s = standard deviation of the mean S-N curve
The tolerance limit is parallel to the mean S-N curve (see Figure 5.1). The
equation of the tolerance limit in terms of stress level and fatigue life for the
control pultruded GFRP is given by:
0, = -13.95LogN5,,, + 105 Eqn 5-3
gh Percentile
The 5" perhentile line for the control pultruded GFRP is shown in Figure 5.3. It
was obtained by finding the 5" percentile values at each stress level. The line
was then drawn by fitting a linear regression line (least squares line) through all
the stress levels. At each stress level, 5 specimens were tested. Therefore the
student t distribution was used to obtain the 5th percentile.
T+ks Eqn 5-4
where: F is the mean fatigue life at each stress level
s is the sample standard deviation at each stress level
k is 2.01 5 for n=5 and a =0.05 (Hogg, 1987, p 449)
The equation of the 5" percentile line of control pultruded GFRP is given by:
0, = -14.5LogN5, + 107 Eqn 5-5
where: o, is the applied maximum stress in percentage
N5" is the 5" percentile value of the fatigue life
The 5th percentile line and the 5%LTL line would be very close to each other if
potted on the same graph. This is because the equations (Eqn 5-3 and 5-5) are
about the same. However, the 5%LTL is more sensitive to the number of
specimens and thus more statistically sound compared to the 5" percentile line.
The 5" percentile line is dependent on the standard deviation at each stress level
whereas the 5%LTL pools the entire data set and uses one standard deviation
which is constant at every stress level. Thus the 5%LTL is parallel to the mean S-
N curve unlike the 5" percentile line.

UTS Control = 703 MPa Stress Ratio R = 0.1 Frequency = 20 Hz
- Mean S-N Curve . - - - - 5th Percentile Line
0 1 2 3 4 5 6 7
Fatigue Life (LOG N)
Figure 5.3 S-N Curve of Control Pultruded FRP with 5'" Percentile Line
A 95% confidence interval on the mean is also sometimes used and many
authors have reported S-N curves with this statistical analysis (Little, 1979;
ASTM E 739). However, this interval only estimates the mean S-N curve with a
95% confidence and not the entire population. An example of this is given in
Appendix C.
Although UV weathering did not cause statistically significant change in
fatigue life compared to the control, it was the worst-case scenario for
combination of fatigue with environmental exposures used in this study. This is
merely because fatigue life of UV specimens were lower than those of all other
exposures, which caused some increase in fatigue life at 30%UTS control.

The mean S-N curve of UV weathered specimens with both the 5%LTL
with 95% confidence, and the 5' percentiles are given in Figure 5.4. The
equation for the 5%LTL tolerance limit of UV specimens is given by:
0, = -14.13LogN5,,, + 79.12 Eqn 5-6
\ \
\ \
\
UTS Contrd = 703 MPa UTS W = 699 MPa Stress Ratio R= 0.1 Frequency = 20 M (constant a r n p l i i )
- 5% LTL 5th Percenhile Mean S N Curve
- - - 5% Laww Tolerance Limit vrith 95% Confidence --- 5th Pecenti le line
0 1 0 1 2 3 4 5 6
Fatigue Life (Log N)
Figure 5.4 S-N Curve of UV Weathered Specimens with 5% LTL with 95%
Confidence and 5' Percentile Lines
Due to the small number of UV weathered specimens available for testing
fatigue life, tolerance limit coefficient k was large and hence the 5%LTL is much
further away (left) from the mean. Since the 5m percentile line is based on the
standard deviation at each stress level, this line is much closer to the mean S-N
curve compared to the 5%LTL. The author recommends testing at least 30
specimens total for future work.
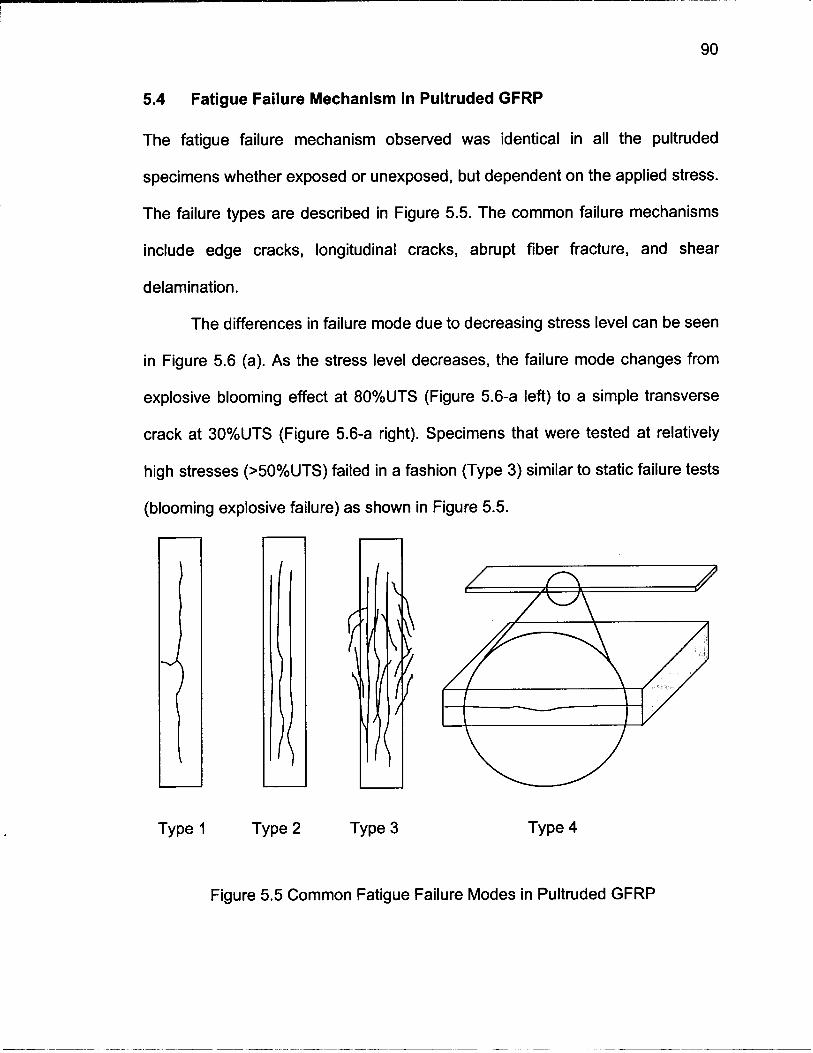
5.4 Fatigue Failure Mechanism in Pultruded GFRP
The fatigue failure mechanism observed was identical in all the pultruded
specimens whether exposed or unexposed, but dependent on the applied stress.
The failure types are described in Figure 5.5. The common failure mechanisms
include edge cracks, longitudinal cracks, abrupt fiber fracture, and shear
delamination.
The differences in failure mode due to decreasing stress level can be seen
in Figure 5.6 (a). As the stress level decreases, the failure mode changes from
explosive blooming effect at 80%UTS (Figure 5.6-a left) to a simple transverse
crack at 30%UTS (Figure 5.6-a right). Specimens that were tested at relatively
high stresses (>50%UTS) failed in a fashion (Type 3) similar to static failure tests
(blooming explosive failure) as shown in Figure 5.5.
Type 1 Type 2
Figure 5.5 Common Fatigue Failure Modes in Pultruded GFRP

At 50% UTS, hot water and simulated seawater specimens exhibited
numerous longitudinal cracks (Type 2) as shown in Figure 5.7 (a) and (b). At
40% UTS some specimens also exhibited Type 2 failures (see Figure 5.8-b). At
relatively low stress levels damage appeared to accumulate progressively (Type
1,2 and 4) and no specimens exhibited explosive blooming effect.
At lower stresses failure was mostly characterized by progression of a
single crack, which usually originates at one edge in the gauge length (see
Figure 5.9 a and b) and propagates perpendicular to the loading direction along
the width of the coupon. This type of crack is named as Type 1 in this study (see
Figure 5.8 a). The crack however never seemed to propagate along the entire
width but branched off parallel to the loading direction along the length of the
coupon, often terminating at the opposite edge or resulting in longitudinal
splitting. This type of failure has been observed by Curtis (1989) and Liao et al
(1998), and is characteristic of unidirectional materials. In some cases an edge
crack initiated with abrupt fiber fracture resulting in instant failure as seen in
Figure 5.6 (b). Another failure type is characterized by a shear crack (or
delamination), which runs along the edge through the thickness (Type 4) (see
Figure 5.8 c, and 5.10 a and b) and splits the coupon into two pieces. This type
of delamination often terminated at the grip edge. The specimens that were
tested at 20%UTS showed no cracks or delamination.
In almost all cases, the mat layer failed prematurely before any edge
crack or delamination occurred. However, a crack in the mat layer often indicated

where an edge crack initiated. Figure 5.7-b clearly shows a mat layer fracture
tracking the progress of a longitudinal or transverse split.
Figure 5.6 Fatigue Failure Mode in Control Pultruded GFRP, (a) Specimens
Tested From 80%UTS (left end) to 30%UTS (right end), (b) Edge Crack at
40%UTS

Figure 5.7 Fatigue Failure Mode of Exposed Specimens: (a) Hot Water at
5O%UTS, (b) Simulated Seawater at 50%UTS

(C)
Figure 5.8 Fatigue Failure of Exposed Specimens: (a) UV Weathered at 30%UTS
Showing Edge Crack, (b) UV Weathered at 40%UTS Showing Longitudinal
Splitting, (c) Freeze-Thaw at 40%UTS Showing Shear Delamination

(b)
Figure 5.9 Stereoscope Images (16X) of UV Weathered Specimens (30%UTS)
Showing Edge Cracks

Figure 5.10 Stereoscope Images (16X) of UV Weathered Specimens (40% UTS)
Showing Edge Delamination
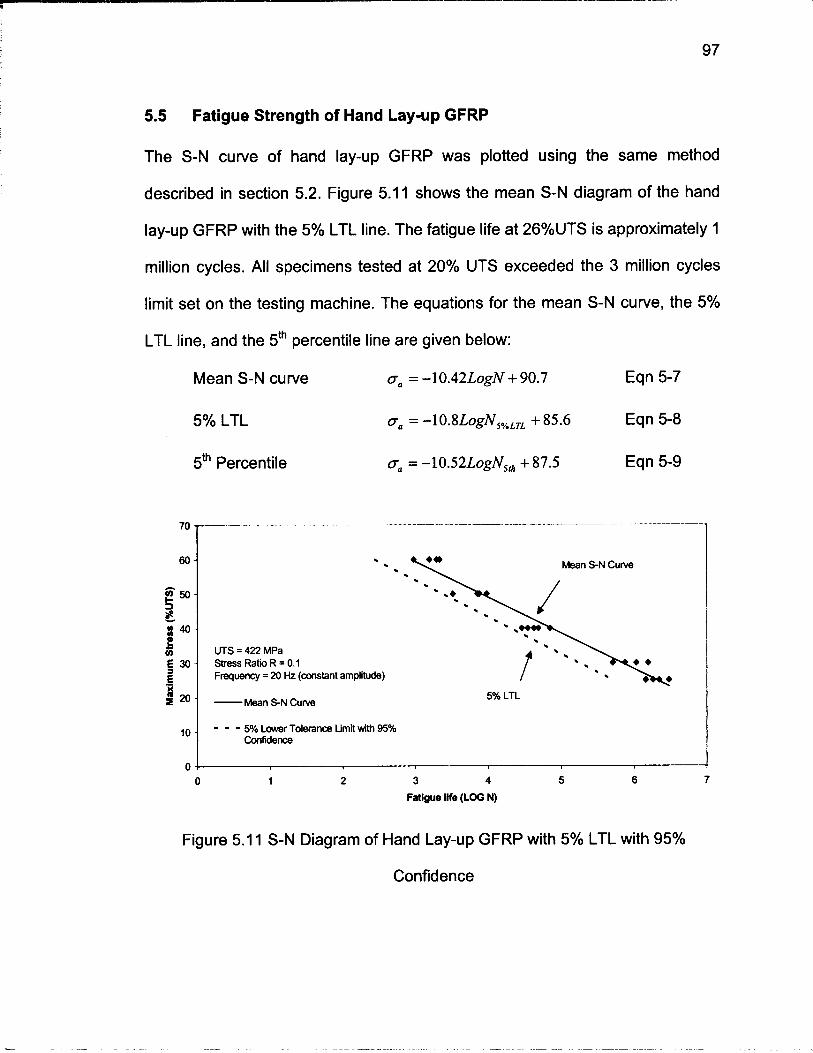
5.5 Fatigue Strength of Hand Lay-up GFRP
The S-N curve of hand lay-up GFRP was plotted using the same method
described in section 5.2. Figure 5.1 1 shows the mean S-N diagram of the hand
lay-up GFRP with the 5% LTL line. The fatigue life at 26%UTS is approximately 1
million cycles. All specimens tested at 20% UTS exceeded the 3 million cycles
limit set on the testing machine. The equations for the mean S-N curve, the 5%
LTL line, and the 5th percentile line are given below:
Mean S-N curve a, = -10.42LogN + 90.7 Eqn 5-7
5% LTL a, = -10.8L0gN,,~, + 85.6 Eqn 5-8
5' Percentile a, = -10.52LogN5, + 87.5 Eqn 5-9
Mean SN Curve
- - - 5% Lower Tderance Limit with 95% lo 1 m e m e
$ 40-
e: U) 5 30 - E - X
320-
0 1 2 3 4 5 6 7
Fatigue life (LOG N)
UTS = 422 MPa Sess Ratio R = 0.1 Frequency = 20 Hz (constant amplitude)
- Mean SN Curve
Figure 5.1 1 S-N Diagram of Hand Lay-up GFRP with 5% LTL with 95%
- ' ' '-1. 5% LTL
f
Confidence

5th Percentile Line
0 I 2 3 4 5 6 7
FaCjgue Life (WG N)
Figure 5.12 S-N Diagram of Hand Lay-up GFRP with the 5h Percentile Line
Failure Mechanism in Hand Lay-up GFRP
At higher stresses, most specimens failed with a combination of longitudinal
splitting and tensile failure at the grip edge. Failure was observed as matrix
cracking followed by fiber rapture and longitudinal splitting, which extended along
the length of the specimen and usually terminated at the grip edge as shown in
Figure 5.13. Grip failures although unavoidable, were not the primary source of
failure, and thus were considered as valid results. It must be noted that grip
failures seem to occur only after the coupons had developed a longitudinal or
edge crack. As for lower stresses, most failures initiated with a crack in the
narrow edge of the coupons like Type 1 mode. Most often these cracks
propagate along the entire width leading to complete failure as shown in Figure

5.13 and 5.15. Specimens that were tested at 20% UTS showed no cracks or
delamination.
Crack end
/ Longitudinal Crack
Edge crack initiated /
Figure 5.13 Typical Fatigue Failure of Hand Lay-up GFRP at High Stress
(6O%UTS)
It is quite evident from the S-N diagram (Figure 5.1 1) that the fatigue
strength of the hand lay-up GFRP exhibits high variability compared to the
pultruded type. This is mainly due to the hand lay-up process, which introduces
many variables such as temperature and humidity at impregnation, speed and
thickness of the impregnator, clamp pressure, and curing period.
In Figure 5.14, the S-N curve of hand lay-up and pultruded GFRP are
given in the same plot on a normalized scale for comparison purposes. The S-N
curve of pultruded GFRP is steeper than that of the hand lay-up type. This
indicates that at lower stresses, the hand lay-up GFRP would have relatively
higher fatigue lives compared to the pultruded GFRP on a %UTS basis.

Figure 5.14 S-N Diagram of Pultruded and Hand Lay-up GFRP

Figure 5.1 5 Hand Lay-up Fatigue Specimen Edge (thickness) (a) Edge Crack at
30%UTS, (b) Stereoscope Image (16X) of Edge Crack Starting and Ending
Points.
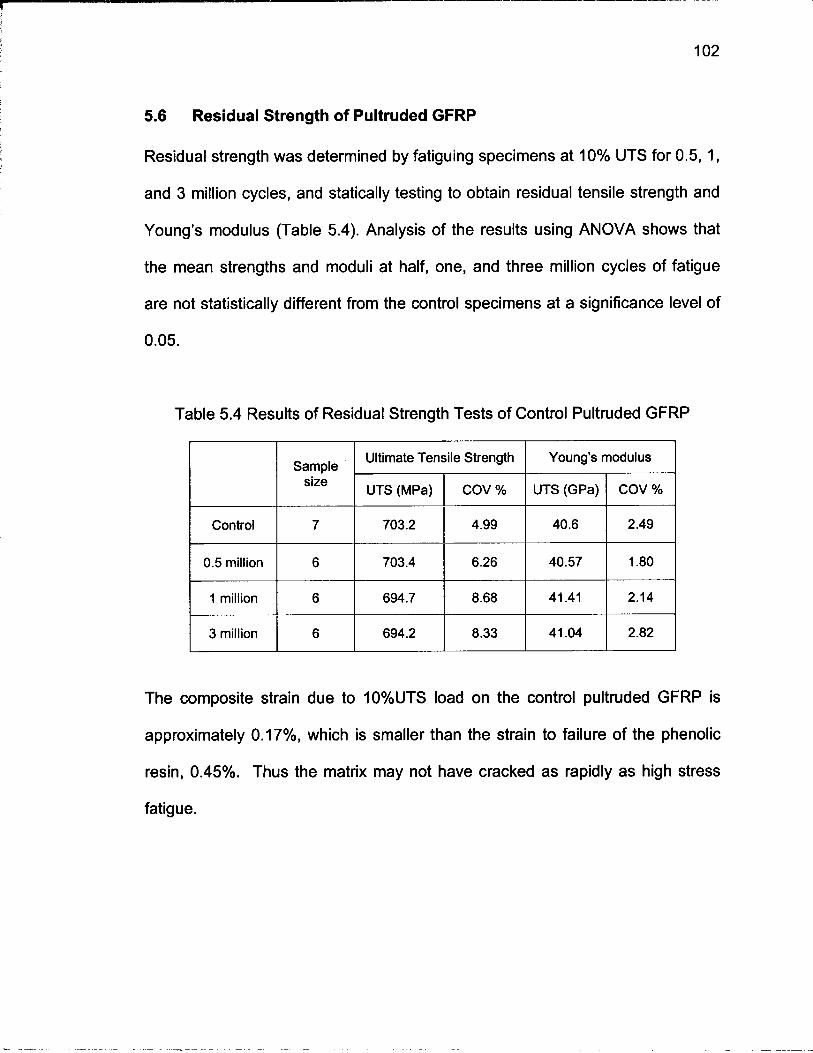
5.6 Residual Strength of Pultruded GFRP
Residual strength was determined by fatiguing specimens at 10% UTS for 0.5, 1,
and 3 million cycles, and statically testing to obtain residual tensile strength and
Young's modulus (Table 5.4). Analysis of the results using ANOVA shows that
the mean strengths and moduli at half, one, and three million cycles of fatigue
are not statistically different from the control specimens at a significance level of
Table 5.4 Results of Residual Strength Tests of Control Pultruded GFRP
The composite strain due to 10%UTS load on the control pultruded GFRP is
approximately 0.17%, which is smaller than the strain to failure of the phenolic
resin, 0.45%. Thus the matrix may not have cracked as rapidly as high stress
fatigue.
Control
0.5 million
1 million
3 million
Sample size
7
6
6
6
Ultimate Tensile Strength Young's modulus
UTS (MPa)
703.2
703.4
694.7
694.2
UTS (GPa)
40.6
40.57
41.41
41.04
COV %
4.99
6.26
8.68
8.33
COV %
2.49
1.80
2.14
2.82

5.7 SEM Imaging of Fatigue Specimens
Pultruded GFRP
SEM images were taken on both pultruded and hand lay-up GFRP near fracture
surfaces. Figure 5.16 shows fiber fracture and a large number of resin particles
on a freeze-thaw pultruded specimen tested at 30% UTS control. This type of
feature was also seen on other exposed pultruded specimens including control
type (see Figure 5.17).
Figure 5.16 SEM Image of Freeze-Thaw Specimen at 240X Tested at 30%UTS
Control
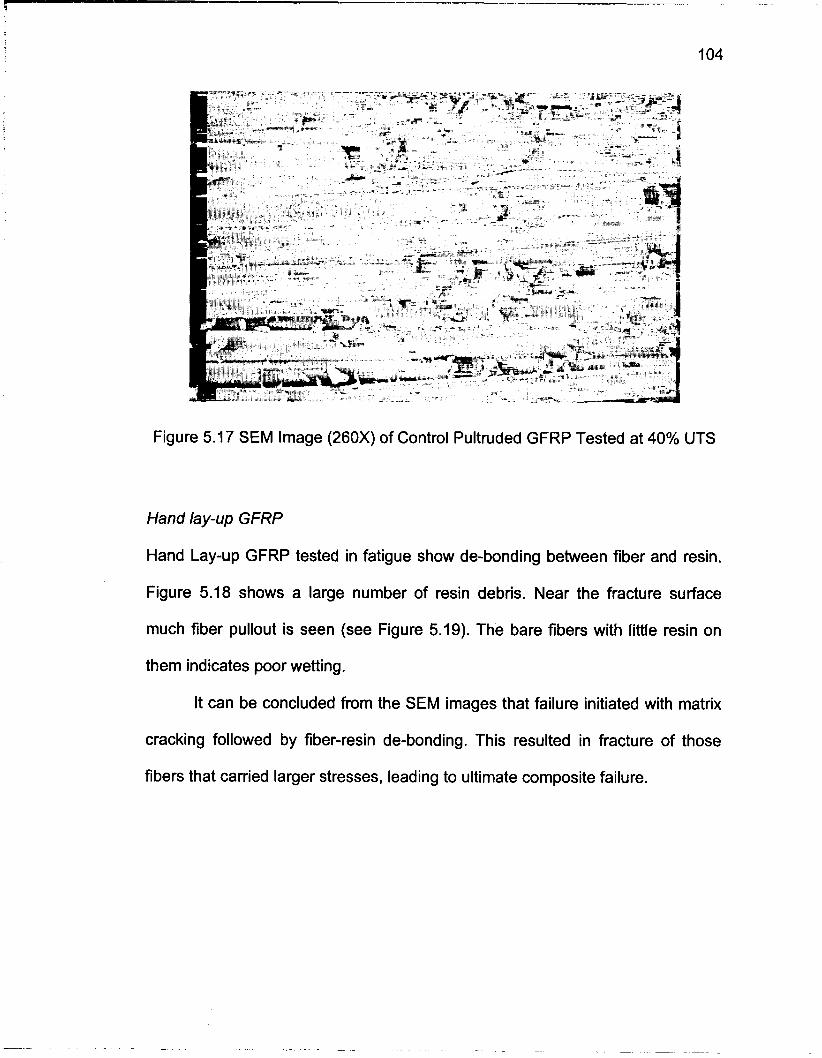
Figure 5.1 7 SEM Image (260X) of Control Pultruded GFRP Tested at 40% UTS
Hand lay-up GFRP
Hand Lay-up GFRP tested in fatigue show de-bonding between fiber and resin.
Figure 5.18 shows a large number of resin debris. Near the fracture surface
much fiber pullout is seen (see Figure 5.19). The bare fibers with little resin on
them indicates poor wetting.
It can be concluded from the SEM images that failure initiated with matrix
cracking followed by fiber-resin de-bonding. This resulted in fracture of those
fibers that carried larger stresses, leading to ultimate composite failure.
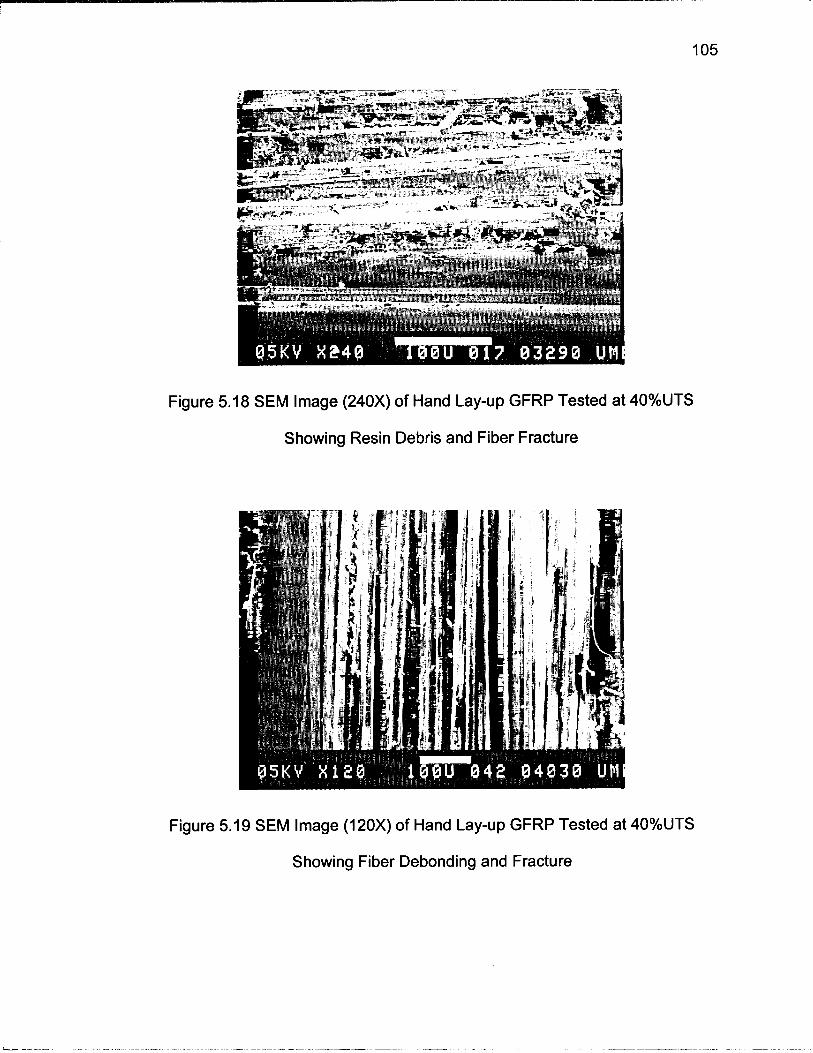
Figure 5.18 SEM lmage (240X) of Hand Lay-up GFRP Tested at 40%UTS
Showing Resin Debris and Fiber Fracture
Figure 5.19 SEM lmage (120X) of Hand Lay-up GFRP Tested at 40%UTS
Showing Fiber Debonding and Fracture
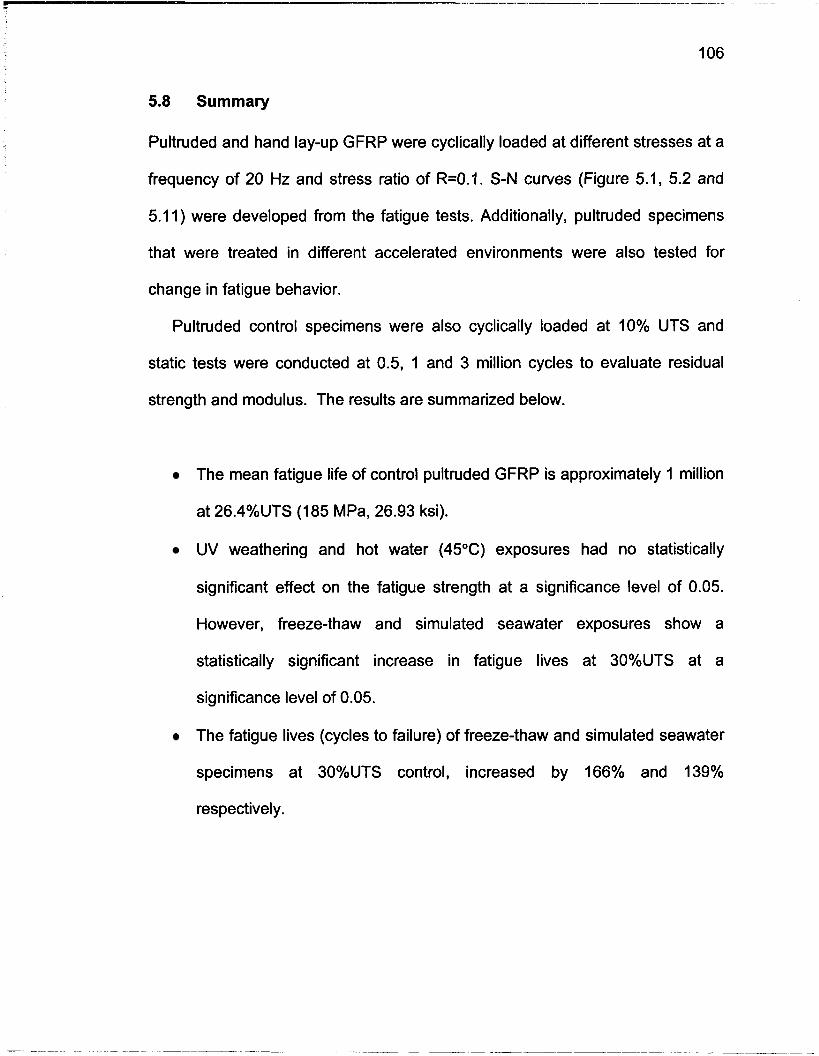
5.8 Summary
Pultruded and hand lay-up GFRP were cyclically loaded at different stresses at a
frequency of 20 Hz and stress ratio of R=0.1. S-N curves (Figure 5.1, 5.2 and
5.1 1) were developed from the fatigue tests. Additionally, pultruded specimens
that were treated in different accelerated environments were also tested for
change in fatigue behavior.
Pultruded control specimens were also cyclically loaded at 10% UTS and
static tests were conducted at 0.5, 1 and 3 million cycles to evaluate residual
strength and modulus. The results are summarized below.
The mean fatigue life of control pultruded GFRP is approximately 1 million
at 26.4%UTS (185 MPa, 26.93 ksi).
UV weathering and hot water (45°C) exposures had no statistically
significant effect on the fatigue strength at a significance level of 0.05.
However, freeze-thaw and simulated seawater exposures show a
statistically significant increase in fatigue lives at 30%UTS at a
significance level of 0.05.
The fatigue lives (cycles to failure) of freeze-thaw and simulated seawater
specimens at 30%UTS control, increased by 166% and 139%
respectively.

UV weathering is considered that worst-case scenario for a combination of
environmental exposure and fatigue. However, the difference between
the fatigue lives of UV weathered specimens and control is statistically
insignificant.
The fatigue lives of all specimens (exposed and control) tested at
20%UTS exceeded the 3 million cycles limit set on the fatigue-testing
machine.
Fatigue failure mechanism was quite identical in all the specimens
whether exposed or unexposed but dependent on the stress level. Failure
at high stresses was mostly due to longitudinal splitting. Failure at low
stresses was mostly due to the propagation of an edge crack, and shear
delamination.
Hand lay-up GFRP specimens had a fatigue life of 1 million cycles at
26%UTS (109 MPa, 15.83 ksi). Specimens tested at 20%UTS exceeded
the 3 million cycles limit. Failure was mostly due to crack that initiate at the
edge. The crack often propagates to the grip edge causing tensile failure.
The residual strength tests show that when the pultruded GFRP was
subjected to cyclic loading at 1 O%UTS, neither ultimate tensile strength
nor Young's modulus changed significantly (significance level of 0.05).
However, this conclusion can only be made for fatigue lives less than 3
million cycles at a stress level of 10%.

SEM images of both pultruded and hand lay-up GFRP show a large
amount of resin debris and fiber fracture near the cracks. The resin
particles indicate the brittle nature of phenolic resins. The bare fibers
indicate poor fiber-resin bonding. It seems failure initiated with matrix
cracking followed by fiber de-bonding, and eventually fiber fracture.

CONCLUSIONS AND RECOMMENDATIONS
6.1 Introduction
A composite material is defined as a material consisting of two or more distinct
components combined on a macroscopic scale (Jones, 1999). An FRP
composite primarily consist of continuous fibers, which provide strength and
stiffness, embedded in a resin system, which hold the fibers together and protect
them from degradation. If the reinforcement used is glass fibers, the composite is
referred to as "GFRP".
In this study two types (pultruded and hand lay-up) of phenolic GFRP
materials were tested for physical, mechanical and fatigue properties. These
GFRP materials were designed to be used as tension reinforcement for glulam
beams. The GFRP materials were also designed to be compatible with the
hygrothermal properties of wood.
To evaluate long-term durability, mechanical and fatigue properties were
determined after exposing the pultruded GFRP to different accelerated
environments. Some of the accelerated environments were designed according
to recommendations given in International Conference of Building Officials
(ICBO) Acceptance Criteria 125. American Society for Testing and materials
(ASTM) testing standards were followed in all cases where applicable. The entire
test matrix is given in Table 3.2.
The pultruded type was exposed to UV weathering, freeze-thaw,
simulated seawater, and hot water (45°C). Table 3.3 provides details on the
environmental exposures used. The hand lay-up GFRP was only tested under
control conditions (no weathering).
Fatigue life was evaluated at different stress levels using a servo hydraulic
testing machine. The fatigue cycle was a constant amplitude sinusoidal
waveform with a frequency of 20Hz. The stress ratio (R) used was 0.1. Residual
strength of the pultruded FRP was obtained at 3 million cycles for stress level of
lO%UTS.
The results of both mechanical and fatigue properties were analyzed using
single factor one-way ANOVA at a significance level of 0.05. For design
purposes, the S-N curves were analyzed to obtain (1) the 5% one-sided Lower
Tolerance limit with 95% confidence and, (2) the 5" Percentile line. These lines
give reasonable safe design values for fatigue design of the two GFRP examined
in this study.
This chapter summarizes the results of physical, mechanical and fatigue
tests. The results are discussed, and important findings are noted. This is
followed by recommendations for design purposes, and for future work.

6.2 Literature Review
The literature review pertaining to this study was drawn from 6 articles on fatigue
of phenolic composites, 31 articles on fatigue mechanisms and environmental
effects and durability, 15 articles on modeling and 9 articles on statistical analysis
of fatigue data. In summary, the following results were relevant to this work:
Fatigue in general can be defined as the progressive permanent
damage due to fluctuating load.
Fatigue has been a design consideration ever since engineers
realized that metals such as steel and aluminum might fail at
stresses much below their static ultimate tensile strength when
subjected to cyclic loading.
In the past twenty years, much of the research on fatigue of FRP
composites was conducted by the aerospace industry.
Phenolic materials are becoming viable replacements of metals due
to their high strength and creep resistance and dimensional stability
at relatively high temperatures. They also posses good chemical
and corrosion resistance (Branco et al, 1994).
It is possible to produce large scale phenolic GFRP components
with much superior fire and toxic fume emission characteristics
compared to polyester and epoxy matrices (Tavakoli et al, 1990).
Study on the fatigue of phenolic composites by Branco et al (1996)
show that the fatigue life is approximately 1 million cycles at

30%UTS. The authors concluded that main failure mechanism is
shear delamination between the resin and fibers.
Moisture is known to act as a plasticizer and reduces the Tg of a
GFRP.
The damage caused due to moisture is fiber dominated and
irreversible (Hayes et al 1998).
The fatigue performance of phenolic GFRP is lower than those of
epoxy and vinyl ester GFRP. This may be due to the brittles of the
phenolic resin.
The basic method for fatigue design is to limit the allowable stress
such that it is below the fatigue threshold, if the threshold value is
known. Another common method is to use the 5% one-sided Lower
Tolerance Limit (5%LTL) as the safe design S-N curve. Safety
factors may be used depending on the application.
6.3 Effects of Environmental Exposure on Physical and Mechanical
Properties
Physical properties tested include density, volume fraction of fiber, resin, and
voids. These properties were tested for unexposed (control) pultruded and hand
lay-up GFRP. Glass transition temperature (Tg) of pultruded specimens was
measured before and after each accelerated environmental exposure to
determine if moisture caused any plasticization in the resin matrix.

The hand lay-up GFRP was not tested for Tg in this study. The reader is
referred to reports written by Eoin Battles to obtain more information on the
environmental durability of hand lay-up GFRP. The work by E. Battles include
testing of Tg and Interlaminar shear strength of the hand lay-up GFRP.
Mechanical properties tested include interlaminar shear strength, ultimate
tensile strength and Young's modulus. These properties were measured before
and after exposure. All results were analyzed using ANOVA to check if the
differences were statistically significant. The results summarized below are
illustrated in Figure 6.1.
Physical Properties
The pultruded E-glass/phenolic FRP is made of a 2.2mm core of
unidirectional glass fiber rovings, encased between chopped strand mat
layers, which are 0.55mm thick (see Figure 3.1). The hand lay-up GFRP is
made of five layers of PRF impregnated unidirectional glass weave, which
cured to a thickness of 3.5mm.
The fiber volume fraction of the pultruded FRP is approximately 54%, with
22% resin volume fraction and 24% voids. The hand lay-up FRP consists
of 65% fiber, 27% resin and 8% voids. The densities of pultruded and
hand lay-up FRP are approximately 1.75gIcc and 2.0lgIcc respectively
(see Appendix B).

SEM images of pultruded GFRP (Figure 4.1 and 4.2) show that the
chopped glass fibers in the mat layers are randomly oriented and consist
of large void spaces. The core of the pultruded GFRP also exhibited large
number of voids as shown in Figure 4.3. This feature of phenolic
composites was also reported by Branco et al (1992).
Glass Transition Temperature: Tg
The glass transition temperature (Tg) of pultruded control GFRP is 201 &
2.7"C.
The Tg of exposed pultruded specimens ranged from 194°C to 207°C with
simulated seawater specimens showing the lowest Tg and UV weathered
specimens showing the highest Tg respectively (see Table 4.3). The Tg of
hot water and simulated seawater specimens, which were exposed to
3000 hours, reduced by 54°C and 7.6"C respectively. Freeze-thaw
specimens showed no statistically significant change in the Tg.
The lowering of Tg may be due to plasticization of the matrix caused by
moisture intake. Other authors who tested vinyl ester and epoxy GFRP
laminates have reported this phenomenon (Sridharan et al, 1998; Liao et
al, 1998). The Tg of UV weathered specimens in this study, which were
exposed to 2000 hours of UVA at 63°C with periodic water spray,
exhibited a 5.2OC increase. This may be due to post-curing of the phenolic
matrix material. Gentry et al (1998) also reported that the increase in Tg
indicates an increase in molecular weight due to post curing.

The surface color of the mat layer of the UV weathered specimens turned
from dark brown to pale purple exposing some of the surface chopped
glass fibers.
Hand lay-up specimens were not tested for Tg in this study.
Interlaminar Shear Strength
The mean interlaminar shear strength of control specimens is 24.3 MPa
with a COV of 4.76%. Statistical analysis show that the interlaminar shear
strength of hot water and UV weathered pultruded specimens reduced by
6% and 11% respectively. It is possible that the reduction in ILSS was
caused by degradation of the fiber-resin interface due to moisture. The
ILSS of simulated seawater and freeze-thaw specimens were not
statistically different from the control at a significance level of 0.05. The
hand lay-up FRP was not tested for ILSS.
Ultimate Tensile Strength and Young's Modulus
The mean ultimate tensile strength and modulus of control pultruded
GFRP is 703 MPa with a COV of 5.0% and, 40.6 GPa with a COV of 2.5%
respectively.
Hot water exposure caused the highest reduction (31.7%) in ultimate
tensile strength (UTS) of pultruded GFRP (see Table 4.5). This reduction
in tensile strength of the hot water specimens may be due to the
synergistic effect of high temperature (45°C) and 100% RH conditions.
UTS of Freeze-thaw and simulated seawater specimens reduced
significantly by 10% and 7% respectively. UV weathered specimens
showed no statistically significant change in ultimate tensile strength at the
5% significance level.
None of the exposed specimens showed any statistically significant
change in the Young's modulus at the 5% significance level. Liao et al
(1998a) tested pultruded vinyl ester E-glass composites in salt water and
plain water and reported that the flexural modulus did not chance at the
90% confidence level in spite of conditioning for 6 months (significance
level of 0.1). However, Sridharan et al (1 998) also tested E-glass vinyl
ester pultruded composites, at 50" C and 80" C in water for 52 days and
reported an 8% decrease in the flexural modulus for both temperatures.
The mean ultimate tensile strength and modulus of hand lay-up GFRP is
422 MPa with a COV of 18% and 36 GPa with a COV of 9.5%
respectively.

Freeeze- thaw Hot water . UV weathering
E4 Simulated Seawter
Ultimate tensile Interlaminar Shear Young's Modulus strength Strength
Property
Figure 6.1 Property Retention in Pultruded GFRP
Freeze-thaw cycling, UV weathering and simulated seawater tests were
specified by ICBO AC125, which required a retention value of 85% after
3000 hours for simulated seawater, 90% retention for 2000 hours of UV
weathering and 90% retention for 20 cycles of freeze-thaw. These
retention values were required for tensile strength, modulus, and
interlaminar shear strength. The residual mechanical properties of the
pultruded specimens exposed to these environments exceeded the
required retention values specified in ICBO AC 125 (see Figure 6.1). The
worst condition was hot water, which was not specified by ICBO.

6.4 Fatigue Life and Residual Strength Tests
The fatigue life of control pultruded GFRP and hand lay-up GFRP was evaluated
at every decade of UTS from 80% to 20%. The fatigue life of exposed pultruded
specimens was tested at 50%, 40%, 30% and 20%UTS-control only. S-N curves
were then developed for each exposure (see Figure 5.2). The stress ratio (R)
and frequency for both were 0.1 and 20 Hz respectively. All specimens were
fatigued in sinusoidal constant amplitude waveform using a servo-hydraulic
testing machine. A minimum of five specimens was tested at each stress level for
the control, and four for the exposed types. Equations for finding the lower 95%
tolerance limit (5% LTL) and 5m Percentile line were also developed (see Figure
6.2). The results of fatigue tests are summarized below.
"r -. -- .... -. ----
UTSContrd = 7 m m Sbess Ratio = 0.1 Freqvency=PHZ
0 1 2 3 4 5 6 7
Fa- life (LOG N)
Figure 6.2 S-N Curve of Pultruded GFRP with 5%LTL with 95% Confidence

Control Specimens
For control pultruded specimens, the mean fatigue life at 25%UTS is
approximately 1 million cycles. This result is in line with other fatigue
studies. Branco et al (1996) reported that at room temperature, the fatigue
life of a unidirectional pultruded GFRP (700 MPa UTS) was approximately
1 million cycles at 21%UTS. They also reported that a woven pultruded E-
glass phenolic FRP with 305 MPa UTS had a fatigue life of l million cycles
at 28% UTS.
All 5 specimens tested at 20% UTS exceeded the 3 million cycles limit.
Exposed Specimens
At 30%UTS, freeze-thaw and simulated seawater specimens showed a
statistically significant increase in fatigue lives at the 5% significance level.
The mean fatigue lives of freeze-thaw and simulated seawater specimens
at 30%UTS increased by 166% and 139% respectively. However, Liao et
al (1998) tested glasslvinyl ester composites in four-point bend
environmental fatigue (5 months) and reported that salt water (5% and
10% NaCI) has a significant detrimental effect on the fatigue life at
30%UTS. The four point bend fatigue test is much more severe than the
tension-tension fatigue done in this study. Liao conducted fatigue tests
simultaneous with the exposure. This is known to cause stress corrosion
which induces much more damage compared to tension-tension fatigue at
normal lab atmosphere as done in this study.
The mean fatigue lives of UV weathered and hot water specimens at
30%UTS are not statistically different from the control at a significance
level of 0.05. At 40% and 5O%UTS none of the exposures caused any
statistically significant change in the fatigue lives compared to the control
specimens. Liao et al (1998) also states that above 45%UTS, water and
salt water conditioning had very little effect on the fatigue life pultruded
vinyl ester GFRP.
In spite of the 31% reduction in tensile strength of hot water specimens,
the fatigue performance did not change (see Figure 5.2). Figure 5.2
indicates that hot water slightly improved fatigue life of pultruded GFRP.
However the change is not statistically significant at the 5% level. It is
known from literature that resins with higher strain to failure perform better
in fatigue. Hot water specimens exhibited a reduction in Tg, which is
indicative of plasticization, i.e. reduced brittleness.
UV weathered specimens exhibited the lowest fatigue life among all the
exposures. However the mean fatigue life of UV weathered specimens
was not statistically different from the control mean S-N curve at the 5%
level.
All 16 specimens (4 from each of 4 exposures) tested at 20% UTS
exceeded the 3 million cycles limit.

Hand Lay-up Specimens
Hand lay-up GFRP had fatigue life of 1 million cycles at 26%UTS. All
specimens tested at 20%UTS exceeded the 3 million cycles limit. Fatigue
failure mechanisms are shown in Figure 5.5. Branco et al (1996) found
that a particular unidirectional hand lay-up phenolic GFRP (462 MPa UTS,
Vf = 0.42) had a fatigue life of 1 million cycles at 44%UTS.
The hand lay-up specimens exhibited high variability at lower stress levels
(see Figure 5.1 1 ).
Fatigue Failure Mechanism
Failure mechanism of control pultruded specimens at high stresses
(>50%UTS) was similar to that of static failure, characterized by massive
fiber brooming near the middle of the gauge length (Figure 4.7, 5.6- 5.9).
At lower stresses, failure was characterized by cracks at the narrow edge,
and longitudinal splitting with no brooming (Figure 5.8). Failure seems to
initiate by matrix micro-cracks transverse to the loading direction. This
results in fiber breakage or interfacial failure (fiber-resin debonding)
followed by ultimate composite failure. This type of failure mechanism has
been observed by others and is extensively reported in literature (Liao et
al 1998a).

Residual Strength
Residual strength tests were conducted at 10%UTS. Six specimens were
fatigued at each of 0.5, 1 and 3 million cycles and tested for ultimate tensile
strength and modulus. The results show no statistically significant changes in
tensile strength or Young's modulus at a significance level of 0.05.
6.5 Recommendations for Fatigue Design of Pultruded GFRP
The fatigue strength of a material is an important factor that most design
engineers consider for structures subjected to cyclic loading. In fact 50-90% of
the failure of engineering components and structures are attributed to fatigue
(Gao, 1994; Beynon et al (Eds), 1999).
Advances in composite materials lead to the development of more efficient
FRP structures where the allowable strength has increased significantly. This
makes fatigue analysis an important part of design process because most often
fatigue tends to be the controlling factor in such designs. The fatigue data of the
pultruded E-glasslphenolic FRP and the hand lay-up FRP are given in S-N
curves from which one may estimate the service life of a component depending
on the number of cycles the structure is likely to endure during its service.
The design strength may be based on the lower 95% tolerance limit for
95% of the population. This tolerance limit has been called the 5% LTL (Lower
Tolerance Limit) with 95% confidence in this study (see Figure 6.2). It assures
that at least 95% of the specimens will have a 95% survival probability. It must be
noted here that a designer needs to incorporate a safety factor, the magnitude of
which will depend on the load uncertainty, frequency and service life.

In the following table, the mean S-N curves of control specimens are
tabulated because these specimens displayed the lowest fatigue life compared to
the exposed types at stresses around 30%UTS-Control. UV weathered
specimens exhibited the lowest fatigue life but the difference from the control was
not statistically significant at the 5% level.
The fatigue life of pultruded FRP at different stress levels is given in Table
6.1. It must be noted here that the fatigue strength at 3 million cycles is a
projected value. Since fatigue strength of the pultruded and hand lay-up GFRP
has not been tested at stress lower than 20%, the equations given in this study
should not be used to evaluate fatigue life for stresses below 20%UTS.
Table 6.1 Fatigue Life Data of Pultruded and Hand Lay-up GFRP
50 1 5% LTL 50 1 5% LTL* I Mean I I EEI I MPa I IUi I Mean I Percentile
Stress Level
30 397100 204300 236600 669300 290800 140800
25 906800 452000 539800 2 mill 869200 408500
20 > 3 mill 1 mill 1.2 mill >3 mill 2.6 mill 1 .18 mill I ,
* with 95% Confidence
Fatigue life (cycles)
The data from the above table can be used to estimate the minimum
fatigue life of both the pultruded and hand lay-up phenolic GFRP used in this
study. Designers may include addition safety factors based on the application of
the GFRP.
Control Pultruded GFRP Hand lay-up GFRP
6.6 Recommendations for Future Work
In this study the pultruded specimens were exposed in simulated seawater
and hot water for 3000 hours only, and then tested for mechanical and
fatigue properties. To get a better understanding of how the material
properties change, the author recommends testing at 1000, 2000, 6000,
and 10,000 hours of exposure. These tests would give a better
perspective of the rate of change of properties. The author recommends
similar tests for hand lay-up GFRP type
A good continuation of this project would be the study of fatigue strength
of glulam beams reinforced with GFRP. The parameters for such a test
would be much different from the coupon testing. It is recommended that
the fatigue loads exerted on the GFRP be 30%, 20% and 10% of UTS
because this is the typical load range that the GFRP is likely to see in real
life applications.
The fatigue strength of the pultruded GFRP exposed to acidic (HCI) and
highly basic solutions (NaOH) may help in better evaluating the FRP
material. Freeze-thaw, hot water and simulate seawater tests may also be
repeated in an environmental chamber such that the specimens are
continuously exposed while subjected to cyclic loading.
It is also recommended to test at least 10 specimens in each stress level
to obtain more accurate distribution of fatigue life.
Residual strength tests are also recommended at 30% and 20%UTS
control in addition to 10%UTS.

REFERENCES
AASHTO LRFD BRIDGE DESIGN SPECIFICATION (1994), American Association of State Highway and Transportation officials, First Edition, Section 6.6, Washington, D.C.
Abdel-Magid, B., Battles, E., Dagher, H., Iqbal. M. (1999). "Durability of FRP Reinforcement for Wood," ICC'99, Session 22-C.
Aboudi, J., (1989). "Micromechanics Prediction of Fatigue Failure of Composite Materials," Journal of Reinforced Plastics and Composites, vo1.8, March.
Aditya, P. K. and Sinha, P.K. (1992). "Diffusion Coefficients of Polymeric Composites Subjected to Periodic Hygrothermal Exposure," Journal of Reinforced Plastics and Composites, vol. 1 1, pp1035-1047.
Agarwal, B. D. (1990). Analysis and Performance of Fiber Composites, 2nd edition, New York: John Wiley & Sons.
Andersons, J. (1993). "Methods of Fatigue Prediction for Composite Laminates: A Review," Mechanics of Composite Materials, 29(6), pp545-554.
Annual Book of Standards, American Society for Testing and Materials. (1 999).
ASM HANDBOOK : Fatigue and Fracture. (1999) Vol. 19, ASM International, ISBN 0871 703858.
Augl, J. M. (1996). "Practical Guidelines for Moisture Diffusion Measurement in Composites," Technical Report, NSWCCARDIV-TR-961017, Naval Surface Warfare Center-Carderock Division, July, US Navy, MD.
Ayyub, B. M., Ed. (1998). Uncertainty Modeling and analysis in civil Engineering, Florida: CRC Press LLC.
Bareishis, I. P. (1996). "The Mechanism of Fatigue Failure of Plastics," Mechanics of Composite Materials, 32(2), pp192-196.
Bathias, C. (1991). "Fracture and Fatigue of High Performance Composite Materials: Mechanism and Prediction," Engineering Fracture Mechanics, 40(4-5), ~~757-783 .
Bauccio, Michael, Ed. (1994). Enaineering materials reference book, 2nd edition, Ohio: ASM International, Materials Park.

Beynon, J.H., Brown, M.W., Lindley, T.C., Smith, R.A., Tomkins, B. (1999). Enaineerinq Aqainst Fatigue, (Work of K.J Miller), Vermont: A.A. Balkema Publishers.
Bodig, Jozsef (1 992). Mechanics of Wood and Wood Composites, Florida: Krieger Publishing Company.
Bradley, W. L. and Grant, T. S. (1995). "The effect of the moisture absorption on the interfacial strength of polymeric matrix composites," Journal of Materials Science, vol. 30, Nov., pp5537-5542.
Brady, Clauser, Vaccari (1 997). Materials Handbook, 1 4 ~ Edition, New York: McGraw Hill.
Branco, C. M., Eichler, K., and Ferreira, J. M. (1994). "Fatigue behavior of E- glass fiber reinforced phenolic composites: Effect of temperature, mean stress and fiber surface treatment," Theoretical and Applied Fracture Mechanics, vol. 20, pp75-84.
Branco, C. M., Ferreira, J. M., Fael, P., and Richardson, M. 0. W. (1996). " A Comparative study of the fatigue behavior of GRP hand lay-up and pultruded phenolic composites," lnternational Journal of fatigue, 18(4) May, pp255-263.
Branco, C. M., Ferreira, J. M., Fael, P., and Richardson, M. 0. W. (1992). "Fatigue behavior of a phenolic matrix composite," lnternational Journal of Fatigue, l4(6) Nov., pp367-375.
Breyer, D.E. (1 993). Desiqn of wood structures, 3" edition, MacGraw Hill Inc.
Brondsted, P., Andersen, S.I. (1996). "Fatigue performance of Glass/Polyester Laminates and the Monitoring of Material Degradation," Mechanics of Composite Materials, 32(1), pp21-29.
Buck, S. E. (1997). "The combined effects of load, temperature, and moisture on the durability of E-glassNinyl ester composite material," 42nd lnternational SAMPE Symposium, pp444-453.
Caprino, C., DIAmore, A., and Facciolo, F. (1998). " Fatigue Sensitivity of Random Glass Fiber Reinforced Plastics," Journal of Composite Materials, 32(12).
Case, S. W., Lesko, J. J., Cousins, T. E. (1998). " Development of Life Prediction Scheme for the Assessment of Fatigue Performance of Composite Structures," Proceedings of the CDCC Durability of Fiber Reinforced Polymer (FRP) Composites for Construction, Quebec, Canada, p69-79.

Cetim, P. C. and Ifremer, L. L. (1995). "Effects of Water Absorption and Osmotic Degradation on Long-Term Behavior of Glass Fiber Reinforced Polyester," Polymer Composites, 16(5), pp349-355.
Chatterjee, S. N., Yen, C. F., and Oplinger, D. W. (1997). "On the Determination of Tensile and Compressive Strengths of Unidirectional Fiber Composites," Composite Materials: Fatigue and Fracture, 6" Vol., ASTM STP 1285, E.A. Armanois, Ed., American Society for Testing and Materials, pp.203-224.
Chawla, K. K. (1987), Composite Materials, New York: Springer-Verlag.
Chin, J. W., Aouadi, K., and Nguyen, T. (1997). "Effects of Environmental Exposure on Fiber-Reinforced Plastic (FRP) Materials Used in Construction, " Journal of Composites Technology & Research, JCTRER, 19(4) Oct., pp 205- 21 3.
Chin, J., J., Nguyen, T., and Aouadi, K. (1999). "Sorption and Diffusion of Water, Salt Water, and Concrete Pore Solution in Composite Matrices," Journal of Applied Polymer Science, vol. 71, pp483-492.
Coquill, Scott L. (1989). " Mechanical properties of several neat polymer matrix materials and unidirectional carbon-fiber reinforced composites," NASA contractor report, NASA CR-181805.
Curtis, P. T. (1991). "Tensile fatigue mechanism in unidirectional polymer matrix composite materials," International Journal of Fatigue, 13(5), pp377- 383.
Curtis, P.T. (1989). "The Fatigue Behavior of Fibrous Composite Materials," Journal of Strain Analysis, 24(4), pp235-244.
Dekker, M., (1997). The Engineer's Cost handbook: Tools for managing proiect costs, New York.
Demers, C. E. (1998). "Axial Fatigue Strength Degradation of Carbon FRp Composites and E-glass FRP Composites," Second International Conference on Composites In Infrastructure, Saadatmanesh, H., Ehsani, M. R., Eds., Tucson, AZ, pp86-91.
Demers, C. E. (1998). " Tension-tension axial fatigue of E-glass fiber- reinforced polymeric composites: Tension fatigue modulus," Construction and Building Materials, 12(1) Feb, pp51-58.

Diao, X., Ye, Lin, (1995). "A Statistical Model of Residual Strength And Fatigue life of Composite Laminates", Composite Science and Technology, VOI. 54, ~~329-336.
Diao, X., Ye, L., Mail Y. W. (1997). "Statistical Fatigue Life Prediction of Cross-Ply Composite Laminates," Journal of Composite Materials, 31(14), pp 1442- 1460.
Dillard, D. A, in Reifsnider, K. L. and Pipes, R. B. (Eds). (1991). Fatisue of Composite Materials, Vol. 4, New York: Elsevier, pp339-429.
Echtermeyer, Andreas T., Engh, B. and Buene, L. (1995). " Lifetime and Young's modulus changes of glass/phenolic and glasslpolyester composites under fatigue," Composites, 26(1) Jan., pp10-16.
El Kadi, H., Ellyin, F. (1994). "Effect of stress ratio on the fatigue of unidirectional glass fiberlepoxy composite laminates," Composites, 25(10), ~~917-924 .
Fawaz, Z. and Ellyin, F. (1994). "Fatigue Failure Model for Fiber-Reinforced Materials under General Loading Conditions," Journal of Composite Materials, 28(l5), pp1432-1451.
Fisher, John W. (1997). "Evaluation of Fatigue-Resistant Steel Bridges", Transportation Research Record No.1594. Bridges, other Structures, and hydraulics and Hydrology, pp5-17.
Foley, G. E., Roylance, M. E., and Houghton, W. W. (1983). "Life prediction of glasslepoxy composites under fatigue loading," ASME International Conference on Advances in Life Prediction Methods, Albany NY, pp301-305.
Gao, Z. (1994). "A Cumulative Damage Model for Fatigue Life of Composite Laminates," Journal of Reinforced Plastics and Composites, vol. 13 Feb., ~~128-141 .
Gauthier, M. (1995). Engineered Materials Handbook: Desk Edition, ASM International, Materials Park, OH.
Gentry, T. R., Bank, L. C., Barkatt, A., and Prian, L. (1998). " Accelerated Test Methods to Determine the Long-Term Behavior of Composite Highway Structures Subjected to Environmental Loading," Journal of Composites Technology & Research, JCTRER, 20(1) Jan., pp. 38-50.
Halverson, H. G., Curtin, W. A. and Reifsnider, K. L. (1997). "Fatigue life of Individual composite specimens based on intrinsic fatigue behavior," International Journal of Fatigue, 19(5), pp369-377.

Hancox, N. L. (1998). "Thermal effects on polymer matrix composites: Part 1. Thermal cycling," Materials and Design, vol. 19, pp85-91.
Harper, J. F. and Naeem, M. (1989). "The Moisture Absorption of Glass Fiber Reinforced Vinyl ester and Polyester Composites," Matehals & Design, 10(6), ~~297-300.
Hayes, M. D., Garcia, K., Verghese, N., Lesko, J.J. (1998). "The Effect of Moisture on the Fatigue Behavior of a GlassNinyl Ester Composite", Second lnternational Conference on Composites in Infrastructure, lCCl 98, USA.
Hayes, M. D., Lesko, J. J., Cousins, T. E., Ohanehi, D. Witcher, D., and Barefoot, G. (1999). Static and Fatigue performance of a Square Tube and plate Type Fiberglass Composite Bridge Deck System.
Hogg, V. R., and Ledolter, J., Eds. (1992). Applied Statistics for Enqineers and Physical Scientists. 2" Edition.
Hwang, W., Lee, C. S., Park, H. C., and Han, K. S. (1995). "Single-and Multi- Stress Level Fatigue Life Prediction of GlassIEpoxy Composites," Journal of Advanced Materials, 26(4), pp3-9.
Huston, R. J. (1994). Fatigue life prediction in composites. International Journal of Pressure Vessels and Piping, 59, pp131-140.
Jordan, A. R. (1996). Wetprea Reinforcement of Glulam Beams, Master's Thesis, University of Maine, Maine.
Kallmeyer, A. R. and Stephens, R. 1. (1995). "Constant and Variable Amplitude Fatigue Behavior and Modeling of an SRlM Polymer Matrix Composite," Journal of Composite Materials, 29(12), pp1621-1648.
Kedward, K.T. (1 992). "The treatment of fatigue and damage accumulation in composite design," lnternational Journal of Fatigue, 14(5), pp283-294.
Kenane, M. and Benzeggagh, M.L. (1997). " Mixed-mode delamination fracture toughness of unidirectional glasslepoxy composites under fatigue loading," Composites Science and Technology, 57(5), pp597-605.
Kimball, T.E. (1995). The feasibility of qlulam beams reinforced with fiber- reinfoirced plastic sheets, Master's thesis, University of Maine.
Kroschnite, J. (1990). Concise Encyclopedia of Polymer Science and Enqineerin~ New York: John Wiley and Sons.

Lee, J., Harris, B., Almond, D.P., Hammett, F. (1997). "Fiber composite fatigue-life determination," Composites, Part A, 28(4), pp5-15.
Liao, K., Schultheisz, C. R., Hunston, D. L., and Brinson, L. C. (1998a). "Environmental Fatigue of Pultruded Glass-Fiber Reinforced Composites," Composite Materials: Fatigue and Fracture, Seventh Symposium, ASTM STP 1330, R. B. Bucinell, Ed., American Society for Testing and Materials, pp. 21 7-234. Liao, K., Schultheisz, C. R., Hunston, D. L., and Brinson, L. C. (1998b). " Long-Term Durability of Fiber-Reinforced Polymer-Matrix Composite Materials for Infrastructure Applications: A Review," Journal of Advanced Materials, 30(4), pp3-40.
Little, R. E. and Ekvall, J. C., Eds. (1979). Statistical Analysis of Fatigue Data. ASTM STP 744, American Society For Testing and Materials.
Lopez-Anido, R., Howdyshell, P. A., Stephenson, L. D., and Gangarao, H. V. S. (1999). "Fatigue and Failure Evaluation of Modular FRP Composite Bridge Deck," ICC 1999. Session 4-B, ppl-6.
Lorenzo, L. H., and Thomas, H. (1986). "Fatigue Failure Mechanism in Unidirectional Composites," Composite Materials: Fatigue and Fracture, ASTM STP 907, Hahn, H. T., Ed., American Society for Testing and Materials, Philadelphia, pp210-232.
Lubin, G. (1981). Handbook of Composites, New York: Van Nostrand Rein hold.
Mandell, J. E. (1985). " Tensile fatigue of glass fibers and composites with conventional and surface compressed fibers," Technical sessions of the Fortieth Annual Conference, Reinforced Plastics/Composites institute, ppl-7.
Newby, G. B., and Theberge, J. E. (1984). "Fatigue Endurance and Creep Resistance of Thermoplastic Composites," 39' Annual Conference, Reinforced Plastics/Composites Institute, The Society of the Plastics Industry, Inc.
Newby, G. B., Theberge, J. E. (1984). "Fatigue Endurance creep resistance of Thermoplastic composites," 39' Annual Conference, Reinforced Plastic1 Composites Institute, The Society of the Plastics Industry, Inc. page1 secl6- D.
Nishioka, G. M. (1990). "Adsorption/ desorption of water on glass fiber surfaces," Journal of non-Crystalline Solids, Elsevier Science Publishers, vol. 1 20, pp34-39.

Nyman, T. (1996). Composite fatigue design methodology: a simplified approach. Composite Structures, vol. 35. 183-1 94.
OIBrian, T.K., Rigamonti, M., Zanotti, C. (1989). "Tension Fatigue analysis and life Prediction for Composite Laminates," International Journal of Fatigue, v l I, n6, pp379-393.
Oikawa, Y. (1980). " Fatigue Strength of Phenolic Molding Material," J Macromol Sci Phys US-Jpn Jt Semin on Crazing, Flow and Form of Polym., 19(4), ~~679-693 .
Ostle, B. (1 996). Enaineering Statistics - the industrial experience, Wadsworth Publishing Company.
Parvatareddy, H., Wang, J. Z., Dillard, D. A., Ward, T. C. (1995). "Environmental Aging of High-Performance Polymeric Composites: Effect on Durability," Composites Science and Technology, vol. 53, pp399-409.
Plumtree, A., Shen, G. (1994). " Prediction of Fatigue Damage Development in Unidirectional Long Fiber Composites," Polymers and Polymer Composites, 2(2), pp83-90.
Reinhart, Theodore J. Dostal, Cyril A., (1987). Engineered materials Handbook: Composites, ASM International, Materials Park, OH.
Roland, K.O., Echtermeyer, A.T. (1996). "Estimation of Fatigue curves for design of composite laminates," Composites, Part A, Elsevier Science Ltd, 27(6), pp485-491.
Shutte, L. C. (1994). "Environmental Durability of Glass Fiber Composites," Materials Science and Engineering, R13, pp265-324.
Skoog, D. A.; Holler, F. J.; Nieman T. A. (1992). Principles of Instrumental Analvsis, 5" edition, Saunders College Publishing.
Smets, B.M.J. (1985). "On the mechanism of the corrosion of glass by water," Philips Tech. Rev.42(2), pp59-64.
Sokolkin, Y. V. et al (1992). "Probabilistic Model of the Strength, Crack Resistance, and Fatigue Life of a Unidirectional Reinforced Fibrous Composite," Mechanics of Composite Material, 28(2), pp133-139.
Sorathia, U and Dapp, T. (1997). "Structural Performance of GlassNinylester Composites at Elevated Temperatures," 42nd lnternational SAMPE Symposium, May 4".

Sridharan, S., Zureick, A. H., Muzzy, J. D. (1998). " Effects of Hot-Wet Environment on E-glassNiny1 ester Composites," ANTEC'98, pp2255-2259.
Starr, T. (1993). Data book of Thermoset Resins for Composites, Somerset UK.
Stinchcomb, W. W., Subramanian, S. and Reifsnider, K. L. (1995). "A cumulative damage model to predict the fatigue life of composite laminates including the effect of a fiber-matrix interphase," International Journal of Fatigue, July 1, 17(5).
Stinchcomb, W.W. and Reifsnider, K.L. (1988). "The life-Limiting Process in Composite Laminates," Basic Questions in Fatigue: Volume II, ASTM STP 924, R. P. Wei and R. P. Gangloff, Ed., American Society for Testing and Materials, Philadelphia, pp. 294-303.
Subramanian, S., Elmore, J. S., Stinchcomb, W., and Reifsnider, K. L. (1996). "Influence of Fiber-matrix lnterphase on the Long-Term Behavior of GraphiteIEpoxy Composites," Composite Materials: Testing and Design (Twelvth Volume), ASTM STP 1274, R. B. Deo and C. R. Saff, Eds., American Society for Testing and Materials, pp69-87.
Suri, C., Perreux, D. (1995). "The Effects of Mechanical Damage in a Glass FiberIEpoxy Composite on the Absorption Rate," Composites Engineering, 5(4), pp415-424.
Tanaka, T., Nishijima, S., and Ichikawa, M. (1987). Statistical Research on Fatiaue and Fracture, The Society of Materials Science, Japan, Current Japanese Materials Research-Vol. 2, England: Elsevier Applied Science.
Tavakoli, S. M.; Avella, M.; Phillips, M. G. (1990). " FiberIResin Compatibility in GlassIPhenolic Laminating Systems," Composites Science and Technology VOI. 39, ~~127 -145 .
Taylor, David (1 989). Fatiaue Thresholds, ISBN: 040803921 3, Essex, England: Butterworth & Co. Publishers.
Tyberg, C. S. (1 999). "Tough, Void Free, Flame retardant Phenolic Networks," ICC'99, Session 18-D.
Ulcay, Yusuf. (1989). "The effect of surface treatment on the bonding properties of spectra fibers for use in composite structures," University of Maryland at College Park.
Whitworth, H. A. (1998). "A stiffness degradation model for composite laminates under fatigue loading," Composite Structures, 40(2), pp95-101.

Wirsching, P. H. (1983). "Statistical Summaries of Fatigue Data for Design Purposes," NASA Contract Report 3697.
Ye, Lin, (1989). "On Fatigue Damage Accumulation and Material Degradation in Composite Materials," Composite Science and Technology, vol. 36, pp339- 350.
Zimmerman, R. S. (1988). " Mechanical properties of neat polymer matrix materials and their unidirectional carbon fiber-reinforced composites," NASA contractor reports NASA CR-181631.

Appendix A: US to Metric Conversions
Unit To convert from
Length in
t?
Area in2
fe
Volume in3
Mass I b
Force I bf
Torque lbf in
Pressure 1 b/in3
psi
ksi
msi
Fluid pressure in Hg (32°C)
Temperature O F
"C
Speed mph
Power density w/in2
MPa
GPa
multiply by
2.54
3.0480 E - 1
6.451 6 E + 2
9.2903 E - 2
1.6387 E - 5
4.5359 E -1
4.4482
1.1298 E - 1
2.7679 E + 4
6894.7
6.8947
6.8947
3.3863 E + 3
519 (OF - 32)
OC+ 273.1 5
1.6093
1 .55OO E + 3

Appendix B: Physical and Mechanical Test Data
Figure B-1 Stress vs. Strain of Control K-1 Primed GFRP
- - - - -- -
0.01 Strain
0.015
Figure B-2 Stress vs. Strain plot of Control Hand Lay-up GFRP
400 - - """ - -- ------ - - - --- - -
0 0.002 0.004 0.006 0.008 0.01 0.012 0.014
Strain

Table B-1 Tensile Strength and Modulus of Control Pultruded GFRP
Sample
Average 29.555 703.350 40.512
Std dev 1.324 32.046 0.933
cov % 4.479 4.556 2.303
K-1 # I
K-1 #2
K-1 #3
K-I #4
K-1 #5
K-1 #6
K-1 #7
Most GFRP failures in the above table initiated in the middle (M) of the gauge
length area (G) and failed in an explosive (X) manner with much fiber fracture.
Max Load kN
Table 8-2 Tensile Strength of Control and Exposed Pultruded GFRP
30.749
27.712
27.933
30.923
29.555
29.380
30.632
Average 703.4 636.7 480.0 699.4 653.8
St Dev 32.0 32.9 19.4 17.8 54.8
cov % 4.56 5.17 4.05 2.54 8.39
Tensile Strength (MP4
733.255
658.465
664.748
735.921
704.1 70
697.675
729.213
Tensile modulus @Pa)
Failure mode
42.430
39.927
40.479
39.548
40.210
40.196
40.796
XGM
XGM
XGM, minor damage at grip edge. ,
XGM
XGM
XGM
XGM

Table 5 3 Tensile Young's Modulus of Control and Exposed Pultnrded GFRP.
Average 40.51 2 39.881 41.183 40.879 40.249
St DW 0.933 1.31 1 1.052 0.894 1.074
cov O h 2.303 3.287 2.954 2.187 2.669
Table 84 Single Fador ANOVA - Tensile Strength of Control and Exposed Pukruded GFRP
Sample #
1 2 3 4
5 6 7
1 Between exposures
Hot water
40.713
39.810
40.024
42.740
41.878
41 .575
SUMMARY
Control
42.430
39.927
40.479
39.548
40.210
40.196
40.796
Groups Count Sum Average? Vanance Control 7 4923.447 703.350 1026.954 Freeze-thaw 7 4457.128 636.733 1084.539 Hot water 7 3360.435 480.062 377.888 UV Weathering 7 4895.914 699.416 315.121 Simulated Seawater 7 4577.01 9 653.860 3008.1 59
Freeze-thaw
39.127
39.51 4
38.927
41.844
40.575
41 .a37
38.141
UV Weathering
38.658
42.051
40.927
40.355
42.023
40.844
ANOVA
Simulated Seawater
38.624
40.31 3 -
40.458
40.306
40.285
42.196
41.541 1 40.293
Source of Van'ation SS df MS F P-vaIw F crit Between Groups 232295.2 4 58073.81 1 3 49.954582 7.65E-13 2.689632 Wfiin Groups 34875.97 30 1162.53221
39.582
Total 267171.2 34
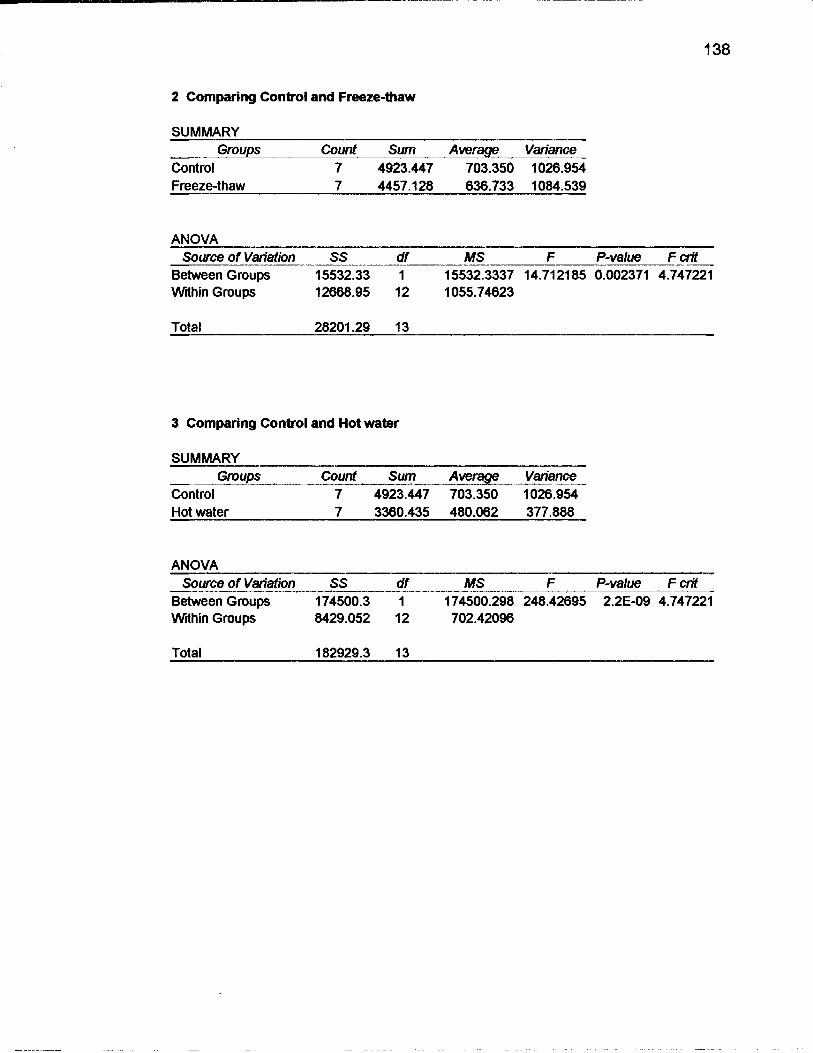
2 Comparing Control and Freeze-thaw
SUMMARY Groups Counf Sum Average Variance
Control 7 4923.447 703.350 1026.954 Freeze-thaw 7 4457.128 636.733 1084.539
ANOVA Source of Variation SS df MS F P-value F crit
Between Groups 15532.33 1 15532.3337 14.71 21 85 0.002371 4.747221 Within Groups 12668.95 12 1 055.74623
Total 28201.29 13
3 Comparing Control and Hot water
SUMMARY Groups Count Sum Average Variance
Control 7 4923.447 703.350 1026.954 Hot water 7 3360.435 480.062 377.888
ANOVA Source of Variation SS df MS F P-value , F crit
Between Groups 174500.3 1 174500.298 248.42695 2.2E-09 4.747221 Wdhin Groups 8429.052 12 702.42096
Total 182929.3 13

4 Comparing Control and UV weathering
SUMMARY Groups Count Sum Average Variance
Control 7 4923.447 703.350 1026.954 UV Weathering 7 4895.914 699.416 315.121
ANOVA Source of Variation SS df MS F P-value F crit
Between Groups 54.14603 1 54.1460262 0.08069 0.781206 4.747221 Wlthin Groups 8052.45 12 671.037532
Total 8106.596 13
5 Comparing Control and Simulated Seawater
SUMMARY Groups Count Sum Average Variance
Control 7 4923.447 703.350 1 026.954 Simulated Seawater 7 4577.01 9 653.860 3008.159
ANOVA Source of Variation SS df MS F P-value F crit - - - - - - - - -
Between Groups 8572.294 1 .OOO 8572.29399 4.2488503 0.061 632 4.747221 Wlthin Groups 24210.67 12.000 2017.55616
Total 32782.97 13.000

Table 5 5 Tg of Control and Exposed Pultruded GFRP
Isample #I Control I Simulated Seawater I Hot Water I UV IFreeze-thd
St Dev 2.694 1.940 1.553 1.443 4.795
1 2 3 4
5
cov % 1 335 0.999 0.W 0.697 2.354
Table 86 Single Factor ANOVA - Tg from DMTA Data of Control and Exposed Pultruded GFRP.
Average 201.81 6 194.236 196.442 201.01 6 203.66
203.8
204
202.5
201.4
197.38
1 Comparing all exposures
SUMMARY Groups Count Sum Average Vm-all~e
Control 5 1009.08 201.816 7.25628 Hot Water 5 982.21 196.442 2.41312 UV 5 1035.08 207.016 2.08268 Freeze-thaw 5 101 8.3 203.66 22.993 Simulated Seawater 5 971.1 8 194.236 3.76208
194.s
191.06
196.36
194.4
194.8
Source of Vananation SS df MS F P-value F ctit Between Groups 548.955 4 137.23874 17.81 9899 2.246E-06 2.866081 Wnhin Groups 154.0286 20 7.701432
Total 702.9836 24
194.28
197.82
197.44
(97.36
195.32
I-
208.9
205.6
203.6
XlO.5
X5.s 1 2085
207.8 1 208.2 -
207.22 197.5
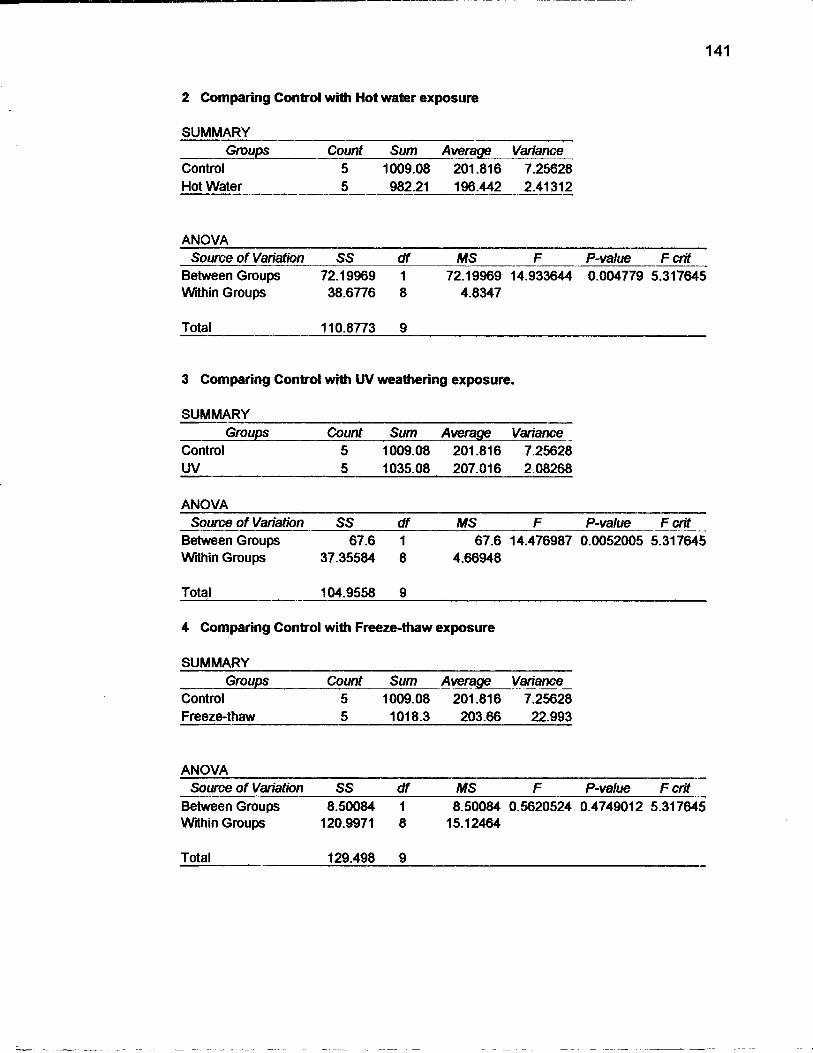
2 Comparing Control with Hot water exposure
SUMMARY Groups Count Sum Average Variance
Control 5 1009.08 201.816 7.25628 Hot Water 5 982.21 196.442 2.41 312
ANOVA Source of Variation SS df MS F P-value F crit
Between Groups 72.19969 1 72.19969 14.933644 0.004779 5.31 7645 Wlthin Groups 38.6776 8 4.8347
Total 110.8773 9
3 Comparing Control with UV weathering exposure.
SUMMARY Groups Count Sum Average Variance
Control 5 1009.08 201.816 7.25628
ANOVA Source of Variation SS df MS F P-value F crit
Between Groups 67.6 1 67.6 14.476987 0.0052005 5.31 7645 Wlthin Groups 37.35584 8 4.66948
Total 104.9558 9
4 Comparing Control with Freeze-thaw exposure
SUMMARY Groups Count Sum Average Vari'ance
Control 5 1009.08 201.816 7.25628 Freeze-thaw 5 101 8.3 203.66 22.993
ANOVA Sourceof Variation SS df MS F P-value F crit
Between Groups 8.50084 1 8.50084 0.5620524 0.474901 2 5.31 7645 Wdhin Groups 120.9971 8 15.12464
Total 129.498 9

5 Comparing Control with Simulated Seawater exposure
SUMMARY Groups Count Sum Avera V&ance
Control 5 1009.08 2 0 1 z 6 7.25628 Simulated Seawater 5 971.18 194.236 3.76208
ANOVA Source of Vanattion SS df MS F P-value F crif
Between Groups 143.641 1 143.641 26.073027 0.0009228 5.317645 Wdhin Groups 44.07344 8 5.50918
Total 187.7144 9

Table 0-7 lgnition Loss Results of Hand Lay-up GFRP.
Density of hand lay-up composite (experimental- liquid displacement method (LDM)) = 2.008 glcc
Density of PRF (Phenol Resorcinol Formaldehyde) = 1.33 glcc (manufacturer data verified by LDM)
Density of E-glass fiber = 2.54 glcc (Manufacturer data)
After lgnition
Sample #
Void Volume
fraction Vv (%)
lgnition loss (Resin)
(9)
Residue weight (glass fibers)
(9)
Average 82.29 65.05 17.71 26.74 2.57
St Dev 0.76 0.60 0.76 1.15 0.02
cov % 0.92 0.92 4.29 4.29 0.86
Fiber Weight fraction
Wf
Fiber Volume
fraction Vf (W
Resin Weight fraction
wm (%)
Resin volume
fraction Vm (%)
Theoretical density (glee)

Table B-8 Ignition Loss Results of Pultruded GFRP
Density of pultruded GFRP obtained through micrometer measurements of small specimens
~ v e r a ~ e 2.1 12 1.398 4.785 3.387 1.604 4.304 2.907 14.188 85.812 14.188 54.192 21.069 24.739
St Dev 0.013 0.008 0.021 0.021 0.014 0.033 0.033 0.483 0.483 0.483 0.710 0.608 0.463
Burnt Fiber Volume Crucible ","Lpz sample Experimental Sample + Residue weight volume volume lgnition
Matrix weight loss volume Sample #
(cm3) wt (g) (g) density Crucible fraction fraction fraction fraction wt (g) (wt%) (%) (%) % %
(%I
Fiber Matrix Void

Appendix C: Fatigue Data
Table C-1 Fatigue Data of Control and Exposed Pultruded GFRP

Method for calculating the 5% LTL with 95% Confidence
The method for calculating the 5%LTL with 95% confidence was according to a
NASA report published by Paul H. Wirsching (1983). The method is summarized
below:
The S-N curve is plotted with Log of life vs. Stress level. The fatigue life
(Log N) is called the Y axis (unlike conventional graphs). The stress level
is the X axis.
Using least squares method, the mean S-N curve is drawn with slop b and
intercept a.
The equation of the line is thus Yo = a + bx
n - C (xi - x ) (Y i - Y )
The term b is given by:
The standard deviation s is the standard deviation of the mean line. It is
given by:
The tolerance limit is then calculated by finding the k coefficient from a
one-sided tolerance table for 95% of the population and 95% confidence.
The equation for the tolerance line is given by:
Log N5%LTL = Y - k S. The calculation method is illustrated in Table C-2.

Table C-2 Calculation of 5% LTL for Control Pultruded GFRP
Xm Ym b a s
Alpha population
k(one sided)
Sum Sum Sum -695.753 9710 0.59727
Best Fit line: 5% LTL line : Y = a + b x Log(N)=Y-ks Where Y, a, and b are estimates where N is the fatigue life
Y is Log (N) Y is the mean fatigue life x is stress level k is the one sided lower tolerance limit
s is the standard deviation for the best fit line
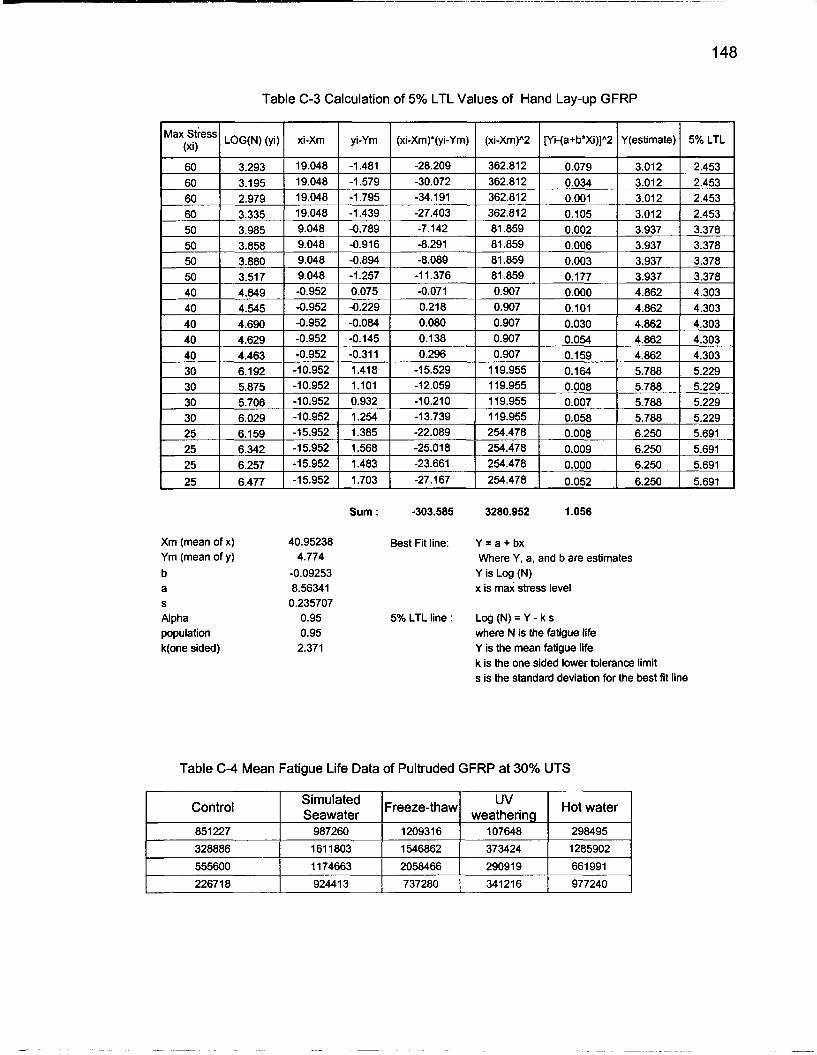
Table C-3 Calculation of 5% LTL Values of Hand Lay-up GFRP
Xm (mean of x) Ym (mean of y) b a S
Alpha population k(one sided)
Sum : -303.585 3280.952 1 .056
Best Fit line: Y = a + bx Where Y, a, and b are estimates Y is Log (N) x is max stress level
5% LTL line : Log (N) = Y - k s where N is the fatigue life Y is the mean fatigue life k is the one sided lower tolerance limit s is the standard deviation for the best fit line
Table C-4 Mean Fatigue Life Data of Pultruded GFRP at 30% UTS
Control uv I Seawater Ifreeze-thaw1 weatherin I Hot water

Table C-5 Single Factor ANOVA - Fatigue Life at 30% UTS Control.
1 Comparing Control and Freeze-thaw
SUMMARY Groups Count Sum Average Variance
Control 4 1962431 490607.75 76687320203
Freeze-thaw 4 5551 924 1387981 3.10042~+11
ANOVA
Source of Variation SS df MS F P-value F crit Between Groups 1.61~+12 1 1.61056~+12 8.3291 181 99 0.0278378 5.987374
Within Groups 1.16E+12 6 1.93365E+ll
Total 2.77~+12 7
2 Comparing Control and UV Weathering
SUMMARY Groups Count Sum Average Variance
Control 4 1962431 490607.75 76687320203
UV weathering 4 11 13207 278301.75 140961 14228
ANOVA Source of Variation SS df MS F P-value F crit
Between Groups 9.01E+lO 1 90147675272 1.985993939 0.2084228 5.987374
Within Groups 2.72E+11 6 45391717216
Total 3.62~+11 7
3 Comparing Control and Hot Water (45°C)
SUMMARY
Groups Count Sum Average Variance Control 4 1962431 490607.75 76687320203
Hot water 4 3223628 805907 1.7931~+11
ANOVA Source of Variation SS df MS F P-value F crit
Between Groups 1.99E+ll 1 1.98827~+11 1.5533561 51 0.2590937 5.987374
Within Groups 7.68E+11 6 1.27998E+11
Total 9.67~+11 7

4 Comparing Control and Simulated Seawater
SUMMARY Groups Count Sum Average Variance
Control 4 1962431 490607.75 76687320203
Simulated Seawater 4 46981 39 11 74534.75 96278753572
ANOVA Source of Variation SS df MS F P-value F crit
Between Groups 9.36E+11 1 9.35512~+11 10.81729223 0.0166353 5.987374
Within Groups 5.19~+11 6 86483036888
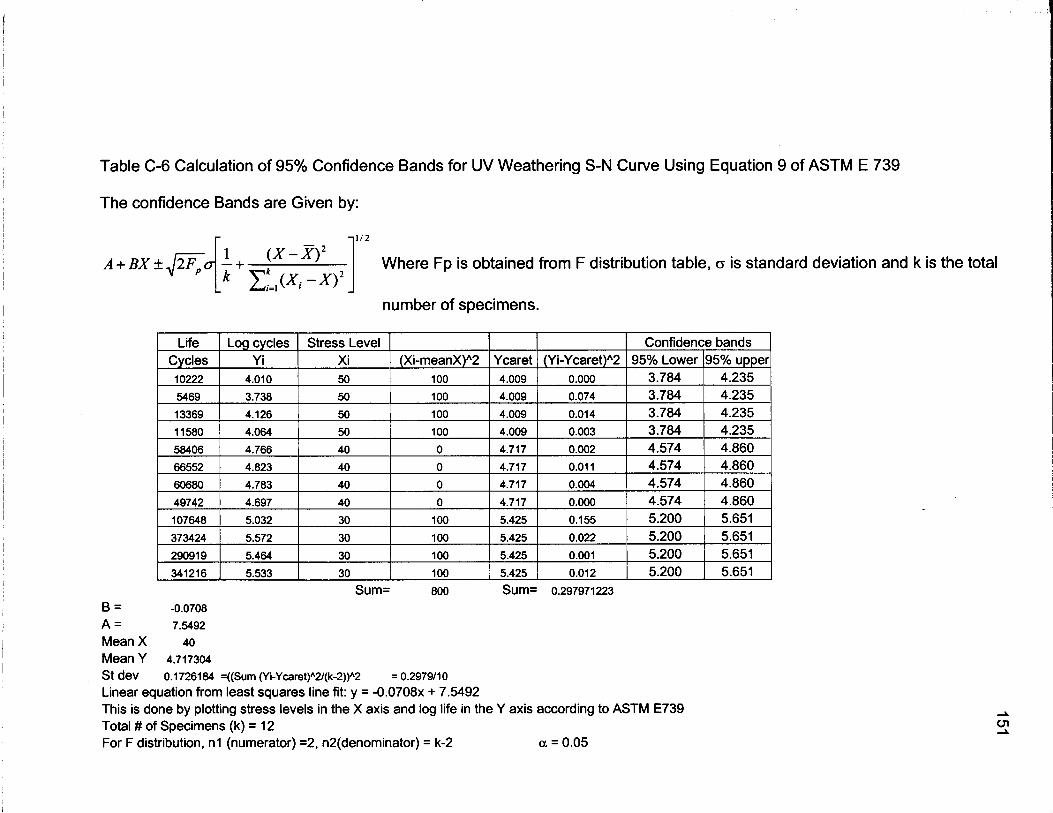
Table C-6 Calculation of 95% Confidence Bands for UV Weathering S-N Curve Using Equation 9 of ASTM E 739
The confidence Bands are Given by:
I 1 ( X - X ) ~ A+BX&=O -+ 1 Where Fp is obtained from F distribution table, o is standard deviation and k is the total
k Ck i=l ( x ~ - x ) ~ number of specimens.
Life Cycles 10222
5469
13369
49742
107648
373424
29091 9
, 341216
Log cycles Y i
4.010
3.738
4.126
sum= 800 sum= 0.297971223
B = -0.0708
A = 7.5492
Mean X 40
Mean Y 4.717304
St dev 0.1726184 =((Sum (Yi-Y~aret)~Z(k-2))~2 = 0.2979110
Linear equation from least squares line fit: y = -0.0708~ + 7.5492 This is done by plotting stress levels in the X axis and log life in the Y axis according to ASTM E739 Total # of Specimens (k) = 12 For F distribution, n l (numerator) =2, n2(denominator) = k-2 a = 0.05
4.697
5.032
5.572
5.464
5.533
Stress Level Xi 50
50
50
40
30
30
30
30
(Xi-meanX)Y 100
100
100
0
100
100
100
100
Ycaret 4.009
4.009
4.009
4.717
5.425
5.425
5.425
5.425
(Yi-Ycaret)Y 0.000
0.074
0.014
0.000
0.155
0.022
0.001
0.012
Confidence bands 95% Lower
3.784 3.784 3.784
4.574 5.200 5.200 5.200 5.200
95% upper 4.235 4.235 4.235
4.860 5.651 5.651 5.651 5.651

UTS Control = 703 Mpa UTS UV = 699 MPa Stress Ratio = 0.1 Frequency = 20 Hz
Linear (Mean S-N Cum)
-. - - - 95% Confidence Bands
'.. Mean S-N CUM y = -13.148~ + 102.02
Lower 95% Confidence band
4 5
Fatigue Life (Log N)
Figure C-1 S-N Curve of UV Weathered Specimens With 95% Confidence Bands

Appendix D: DMTA Plots


- -- -
157
Appendix E: List of ASTM Standards, and Specifications
Used in this Study.
ICBO Acceptance Criteria 125- Acceptance Criteria for Concrete and
Reinforced and Un-reinforced Masonry Strengthening using Fiber-
Reinforced Composite Systems.
Pre-qualification requirements 1124197- CALTRANS Pre-qualification
Requirements for Alternative Column Castings for Seismic Retrofit
(Composites).
ASTM D 3039- Tensile Properties of Polymer Matrix Composite
Materials.
ASTM D 3479- Tension-Tension Fatigue of Polymer Matrix Composite
Material.
ASTM E 739- Practice for Statistical Analysis of Linear or Linearized
Stress-Life (S-N) and Strain-Life (e-N) Fatigue Data.
ASTM D 2344- Apparent Interlaminar Shear Strength of Parallel Fiber
Composites by Short-Beam Method.
ASTM D 2584- Ignition Loss of Reinforced Composites.
ASTM E 1049- Practice for Cycle Counting in Fatigue Analysis.
ASTM D 2734- Void Content of Reinforced Plastics.
ASTM D 1141- Standard Specification for Ocean Water.
ASTM D 11 93- Standard S~ecification for Reaaent Water.

12. ASTM D 2247- Standard Practice for testing Water resistance of
Coatings in 100% Relative Humidity.
13. ASTM G 53- Standard practice for Operating Light-Exposure Apparatus
(Carbon-Arc type) With and Without Water for Exposure of Non-Metallic
Materials.
14. ASTM G 23- Standard Practice for Operating Light-and Water-Exposure
Apparatus (Fluorescent UV-Condensation Type) for Exposure of Non-
Metallic Materials.
15. ASTM D 570- Standard Test method for water absorption of plastics.
16. ASTM E 632 Developing Accelerated Tests to Aid Prediction of the
Service Life of Building Components and Materials.
17. ASTM D 792 Density and Specific Gravity (Relative Density) of Plastics
by Displacement.

BIOGRAPHY OF THE AUTHOR
Mohammed Asif lqbal was born in Joydepur, Bangladesh on December 1 4 ' ~ ~
1972. He moved to Kuwait with his family at the age of five. He completed the
metricular examination (loth Grade) from The New Indian School, Jabriyya,
Kuwait. After missing almost a year of education due to the Gulf War (1990-
I ggl), he completed the 1 1" and 1 2fh grade (High School) from Indian Schod,
Salmiya, Kuwait.
In pursuit of further education, he moved to the U.S. and completed his
bachelor's degree in Composite Materials Engineering from Winona State
University, Winona, Minnesota. His desire for a graduate degree and his interest
in composite materials took him to University of Maine, Orono, Maine. lqbal is a
member of the Society of Plastics Engineers (SPE) and the American Society of
Civil Engineers (ASCE). lqbal is a candidate for the Master of Science degree in
Civil Engineering from The University of Maine in May 2001.