fatigue properties of aluminum alloys … technical reort 52-307. part 1 si, fatigue properties of...
TRANSCRIPT

WADC TECHNICAL REORT 52-307.PART 1
SI,
FATIGUE PROPERTIES OF ALUMINUM ALLOYS AT VARIOUSDIRECT STRESS RATIOS
Part 1. Rolled Alloys
S. J. LA ZANA. A. BLATIriPWICK
UNIVEV ITY (h- MINNESOTA
SEP TEMBER 1953
Statement AApproved for Public Release
RIPGHT AIR DEVELOPMENT CENTER
I i

NOTICES
When Government drawings, specifications, or other data are usedfor any purpose other than in connection with a definitely related Govern-ment procurement operation, the United States Government thereby in-cursnoresponslbility nor any obligation whatsoever; and the fact thatthe Government may have formulated, furnished, or in any way suppliedthe said drawings, specifications, or other data, is not to be regardedby implication or otherwise as in any manner licensing the holder orany other person or corporation,or conveying any rights or permissionto manufacture, use, or sell any patented invention that may in anywaybe related thereto.
The information furnished herewith is made available for studyupon the understanding that the Government's proprietary interests inand relating thereto shall not be impaired. It Is desired that the JudgeAdvocate (WCJ), Wright Air Development Center, Wright-PattersonAir Force Base, Ohio, be promptly notified of any apparent conflict be-tween the Government's proprietary interests and those of others.
*ssueuzoeuuPC0C1

WADC TECHNICAL REPORT 52-307PART 1
FATIGUE PROPERTIES OF ALUMINUM ALLOYS AT VARIOUSDIRECT STRESS RATIOS
Part 1. Rolled Alloys
B. J. LazanA. A. Blatberwiek
University of Minnesota
September 1953 g
Materials LaboratoryContract No. AF 33(038)-20840
RDO No. 614-16
Wright Air Development CenterAir Research and Development Command
United States Air ForceWright-Patterson Air Force Rase, Ohio
McGregor & Werner, Inc., Dayton, 0.100 December, 1953

FOREWORD
This report was prepared by the University of Minnesota, under USAFContract No. AF 33(038)-20O•0. The contract was initiated under Researchand Development Order No. 611,-16, "Fatigue Properties of Structural Materials",and was administered under the direction of the Materials Laboratory,Directorate of Research, Wright Air Development Center, with Mr. W. J. Trappacting as project engineer.
WADOC TR 52-307 Pt 1

ABSTRACT
Newly developed equipment for axial stress fatigue testing in the
tension-compression range is described. Fatigue data on 14S-T6, 24S-T4,
and 75S-T6 aluminum alloys are presented as S - N curves and stress range
diagrams to illustrate and analyze the effects of: (a) stress ratios in the
range from static tension to reversed axial stress, (b) stress magnitude
which causes failure in the range from 103 to 107 cycles, and (c) severity of
circumferential notches having four different theoretical stress concentration
factors in the range between 1.0 and 3.4. The extreme flatness of the stress
range diagrams for severely notched specimens at long life is discussed in
terms of the large reduction in mean load carrying capacity resulting from
the addition of relatively small alternating stress. Unitless stress range
diagrams are presented which indicate how material, life, and specimen
type affect the combinations of alternating and mean stress which cause
failure in a specified number of cycles. Data on the reduction in fatigue
strength caused by notches are diagrammed to clarify the significance of
mean stress, alternating stress, stress ratio, and cycles to failure as fac-
tors in fatigue notch sensitivity. The fatigue properties determined in this
program are compared with prior work. The low fatigue strengths observed
for 75S-T6 are briefly discussed.
PUBLICATION REVIEW
This report has been reviewed and is approved.
FOR THE COMMANDER-
Che, Materials Laboratory
Directorate of Research
WADC TR 52-307, Part I iii

TABLE OF CONTENTS
Sections Page
1. Introduction . . . . . .. .... . . 1II. Prior Work . . . . . . . . . . . 1III. Test Program . . . . . . . . .* * .. 2IV. Test Materials . . . . . . ....... 2
4.1 Specifications ................ 24.2 Processing .. .. . . .. . . . .. .. . 24.3 Chemical Analysis. .o. . . . . . . . . . . . 34.4 Metallographic Structure. .o. o .. ..o. ... 3
V. Test Specimens... . .. .. . . .. .. . .. . . . . .. 45.1 Design of Specimens . . . . . . . . . . . . 45.2 Preparation of Specimens . . . o o . . . .. 4
VI. Testing Equipment and Procedures. . . . .o. o ... .. 76. 1 Fatigue-testing Machines o .. . ... . . 76.2 Grips. . . . o.. . o.. . . . . ... . . . . . 8
6.3 Calibration of Machines and Grips. .a. . . . 96.4 Test Procedure at High Mean Stress. . o . . 9
VII. Results and Discussion, . .*. o .. ..o. . . ... . . 107.1 Static Tensile and Hardness Properties . o o 107.2 Creep and Rupture Properties o . . . . . .o. 117.3 Effect of Stress Relief on Fatigue Properties of
Notched and Unnotched Specimens . . . . . . 127.4 Fatigue Properties of 14S-T6 ........ 137.5 Fatigue Properties of 24S-T4 . . . . . .. . 207.6 Fatigue Properties of 75S-T6 . . . .. .. . 21
VIII. Comparison and Analysis of Data. . . . .. .. ... 218.1 Fatigue Properties of Unnotched Specimens o 218.2 Notch Sensitivity Properties - . . - ..0. .. 23
IX. Summary and Conclusions .. . o . . . . . . .. . . . 24
Bibliography . . . . .. . . . . . . . . . . . . .. . . . . . .. 28
Appendix A. . . * ........................ .. . 29
Table s
I. Chemical Analyses of The Three Test MAaterials: .. . * . 31H. Static Properties of 14S-T6. . . . .. . .. . .. .. 31III. Static Properties of 243-T4 .. . . ... . .. . . 32IV. Static Properties of 753-T6. . .o. . . . . . 0 . * * 33V. Effect of Stress Relief on Hardness and Fatigue Properties 34VI. Fatigue Data for 143-T6 . . . . . . o o . . . .. . . . 35VII. Fatigue Data for 24S-T4 0 . . . . . . .0. . . 0 . .. . 36VIII. Fatigue Data for 75S-T6 . . . . . . . . . . . . . 37
WADC TR 52-307, Part I iv

Figure Page
1. Microstructure of l4S-T6, 24S-T4, & 75S-T6 AluminumAlloys in "As Received" Condition. . . . .. . .. .. . 38
2. Unnotched and Notched Fatigue Specimens TypesV, W, AB, and X ........ .. . . . . . . .. .. * * * 39
3. Specimen Notch Polishing Set-up . . . . . . . . . 404. Direct Stress Fatigue Machine LI . . . .. ....... . 405. Preload Amplifying Fixture For LI Machine . .. .. ... 416. Eight-To-One Force Amplifying Fixture* . . . . ...... 17. Direct Stress Grips for Room Temperature Tests . . .. 429. Variation of Static Ultimate Strength and Total
Elongation With Type of Specimen . 439. Stress-Strain Curve For 24S-T4 Aluminum Alloy, Under
Step Loading in the Inelastic Range . . . . . . . . ... 410. Creep-Time Curves For 24S-T4 at High Stresses ....... 14II. S-I Fatig'ue Diagrams at Various Stress Ratios for K1=l.O
Specimens of Aluminum Alloy 14S-T6 . . .- . . - . . * 4512. S-N Fatigue Diagrams at Various Stress Ratios for KY,=l. 6
Specimens of Aluminum Alloy l4S-T6 . . . . . . . . . . . 0 4513. S-N Fatigue Diagrams at Various Stress Ratios for Kt=2.4
Specimens of Aluminum Alloy lLS-T6 . . . . . a -. . . . . 4614. S-IT Fatigue Diagrams at Various Stress Ratios for Kt=35.
Specimens of Kluminum Alloy 14S-T6 o . . . . . . . . 0 . . 4615. Stress Range Fatigue Diagram for 4•=I.0 Specimens of
Aluminum Alloy 14S-T6. . . . . . . . . . . . . . . . . . 4716. Stress Range Fatigue Diagram for K-l.6 Specimens of
Aluminum Alloy 1lS-T6 ...... .. . . 4717. Stress Range Fatigue Diagram for KT=2.ý Specimens of
Aluminum Alloy lbS-T6 . . . . . . . . . . . . . . . . . 4818. Stress Range Fatigue Diagram for Kt=3.4 Specimens of
Aluminum Alloy 11S-T6. . . . . . . . . . . . . . . . . . 819. Stress Range Curves for Kq=l.0 Specimens of 14•-T6
Aluminum Alloy Using Dimensionless Ratios. . . . . . . . . 4920. Stress Range Curves for Kj=I.6 Specimens of 14S-T6
Aluminum Alloy Using Dimensionless Ratios. . . . . 0 . . 0 4921. Stress Range Curves for Kt=2.4 Specimens of 14S-T6
Alu~ninum Alloy Using Dimensionless Ratios. . . # . . . . 5022. Stress Range Curves for 4 =3.4 Speciments of 14S-T6
Aluminum Alloy Using Dimensionless Ratios. . . . . . . . . 5023a Profile Curves of K•vs Sa of Unnotched Specimen for
K-1=3.L Specimens of Aluminum Alloy ýS-T6. . . . . . . . . 5123b Contour Curves showing Ktas a Function of Sa & Sm of
Unnotched Specimen for K-3.24 Specimens of AluminumAlloy 14S-T6 .• 51
24. Fatigue Strength - Reduction "Contour" Curves for 'q=2.LiSpecimens of Aluminum Alloy I4S-T6 Showing K4as a v'unctionof S and S of the Unnotched Specimen . . . . . . . . . . 52
25. Fatigue Strength - Reduction "Contour" Curves for '4=l.6Specimens of Aluminum Alloy 114-T6 Showing Kjas a Function of
S. and S of the Unnotched Specimen ............ 52
WADC TR 52-307 Pt 1 v

Figures Page
26a Profile Curves of Kevs. N for Kt=3.4 Specimens ofAluminum 1l1S-T6 . . ." . * . . . . * . * . =. . . . 53
26b Profile Curves of K.vs. Stress Ration R For Kt3.L5Specimens of Aluminum Alloy lIs-T6 . . . . 0 . ... 53
26c Contour Curves Showing K#As a Function of Stress Ratioand Number of Cycles for K1 =3.4 Specimens of AluminumAlloy 14S-T6 .... . . ............................... . . 53
27. Fatigue Strength Reduction "Contour" Curves For Y4 =2.4Specimens of Aluminum Alloy lhS-T6 Showing • as a
Function of N and Stress Ratio R 5L. . • - . -. - - 526. Fatigue Strength - Reduction "Contoizr" Curves for'F =1.6
Specimens of Aluminum Alloy lLjS-T6 Showing Kt as a
Function of N and Stress Ratio R.. . . . .. . . ) 5*429. Notch Sensitivity Index Curves for Yt=1.6, 2.b, and 3,)-i
Specimens of Aluminum Alloy lSS-T6 Showing q as a
Punction of Sa and Sm of the Unnotched Specimen . .o. 5530. S-N Fatigue Diagrams at Various Stress Ratios for Kt=l.0
Specimens of Aluminum Alloy 2lS-TL . .. . .. .... 5631. S-N Fatigue Diagrams at Various Stress Ratios for Kt=I. 6
Specimens of Aluminumi Alloy 2iS-T4o . . . . . . . . . . 5632. S-N 1ratigue Diag-rams at V:-Jous Stress Ratios for'K+=2.)4
Specimens of Aluminum Alloy 2LS-TL . .. . .. .. o 57
33. S-N Fatigue Diagrams at Various Stress Ratios for Kt3=3J)4Specimens of Aluminum Alloy 21tS-T4 .... . ......... 57
3)4. Stress Raný'e Fatigue Diagram for K+=I.0 Specimens of
Aluminum Alloy 2t4S-TL. . * .. .. . ...... .. . 5835. Stress Range Fatigue Diagram for K+=.16 Specimens of
Aluminum Alloy 2LS-T4. .0. o o . . . ........ ....
36. Stress Range Fatigue Diagram for Kt=2.L Specimens of
Aluminum Alloy 2LS-TL4 . * e . . .......... .... ... 5937. Stress Range Fatigue Diagram for F4 =3.L•'Specimens of
Aluminum 4iloy 2L)S-TL. . o ... e e 5938. Stress Range Curves for ý1=l.0 Specimens or 2L4S-T
Aluminum Alloy Using Dimensionless Ratios. . . . . . . 6039. Stress Range Curves for Y+=1.6 Specimens of 2LS-T4
Aluminum Alloy Usin,; Dimensionless Ratios. . . # . . . 60
hO. Stress Range Curves for K4 =2.L Specimens of 2hS-TLAluminum Alloy Using Dimensionless Ratios. .. ......... 61
Ill. Stress Range Curves for K+=3.h Specimens of 2}tS-TbAluminum blloy Using Dimensionless Ratios. . * . . . . 61
L)2. Fatigue Strength - Reduction "Contour" Curves for
K+=l.6 Specimens of Aluminum Alloy 2hS-T4 Showing Kfas a runction of Sa and Sm of the Unnotched Specimen . . 62
143. Fatigue Strength - Reduction "Contour" Curves for
K, =2.4 Specimens of hluminum Alloy 2LS-TL Showing Y+as a Function of S and S of the Unnotched Specimen . . 62
Lh. Fatigue Strength - Reduction "Contour" Curves for Kf=3.bSpecimens of Aluminum Alloy 21IS-T4 Showing K+as a
.unction of S and Sm of the Unnotched Specimen. .o.. 63
WADC TR 52-307 Pt 1 vi
Figure Page
45. Fatigue Strength - Reduction "Contour" Curves for K1=1.6Specimens of Aluminum Alloy 24S-T4 Showing K+ as alFunctionof N and Stress Ratio Re . * & .* . . . .e .* * * . . 63
46. Fatigue Strength Reduction "Contour" Curves for Kt=2.4Specimens of Aluminum Alloy 24S-T4 Showing K+ as a functionof N and Stress Ratio R. . . .0. . . . . . . . f ' ' '. .0 64
47. Fatigue Strength - Reduction "Contour" Curves for K -3o4Specimens of Aluminum Alloy 2ýS-T% Showing y11 as a 1unctionof N and Stress Ratio R. .. .• . . .* . . . . . * 64
48. Notch Sensitivity Index Curves for K+=l.6, 2.4, and 3.4Specimens of Aluminum Alloy 24S-T4 Showing q as a Functionof S. and Sm of the Unnotched Specimen .... ._ . . 65
49. S-N Fatigue Diagrams at Various Stress Ratios'for'Kf*=l.0Specimens of Aluminum Alloy 75S-T6 . . . . o . . * . . . . 66
50. S-N Fatigue Diagrams at Various Stress Ratios for Ktl.6Speciimens of Aluminum Alloy 75S-T6 . . . o o . . . . . . . 66
51. S-N Fatigue Diagrams at Various Stress Ratios for'K=3.4Specimens of Aluminum Alloy 75S-T6 . o . . . .. . . . . . 67
52. Stress Range Fatigue Diagram for Kt=1 .O Specimens ofAluminum Alloy 75 S-T6 . . • & a . . & . * . . . .- .- - 67
53. Stress Range Fatigue Diagram for Kt=l. 6 Specimens ofAluminum Alloy 75S-T6 a ..... .... .... ..... 68
54. Stress Range Fatigue Diagram for =1.3"4 Specimens ofAluminum Alloy 75S-T6. . . .. .. . . . . . * . . . . . . 68
55. Stress Range Curves for Kf=l.0 Specimens of 75S-T6Aluminum Alloy Using Dimensionless Ratios. . . . .o .* o o 69
56. Stress Range Curves for Kt=1 . 6 Specimens of 758-T6Aluminum Alloy Using Dimensionless Ratios, . . . . ... . . 69
57- Stress Range Curves for Kt=5.4 Specimens of 75S-T6Aluminum Alley Using Dimensionless Ratios. . .o. .* . .-- 79
58. Fatigue Strength - Reduction "Contour" Curves for Kt=I.6Soecimens of Aluminum Alloy 75S-T6 Showing Kt as aFunction of Sa and Sm of the Unnotched Specimen...... 70
59. Fatigue Strength - Reduction "Contour" Curves for Ký-i.2Specimens of Aluminum Alloy 75S-T6 Showing Kpas aFunction of Sa and S of the Unnotched Specimen . .. . . 71
60. Fatigue Strength Reduction "Contour" Curves for K$=1.6Specimens of Aluminum Alloy 75S-T6 Showing KI as aFunction of N and Stress Ratio R . . . o . . . . . .. . 71
61. Fatigue Strength - Recution "Contour" Curves for F=3-"Specimens of Aluminum Alloy 75S-T6 Showing Kt as aFunction of N and Stress Ratio R . . 0 0 * a 0 . . .0. . . 72
62. Notch Sensitivity Index Curves for K4l=.6 and 3.4Specimens of Aluminum Alloy 75S-T6 Showing q as aFunction of Sa and Sm of the unnotched Specimen. . o o .. 72
63. Elongation in Fatigue Specimens at Various Stressesand Stress Ratios . . . . . . . . o . . . . . . . .9 . . 73
64. Comparisons From Various Sources of Fatigue Strengths ofUnnotched Specimens of Aluminum Alloy 14S-T6 .. .. .. . 74
WADC TR 52-307 Pt 1 vii

Figure Page
65. Comparisons from Various Sources of Fatigue Strengthsof Unnotched Specimens of 2LS-Th Aluminum Alloy. . .o. . 75
66. Comparisons From Various Sources of Fatigue Strengths ofUnnotched Specimens of 75S-T6 Aluminum Alloy . . . o . . 76
67. Stress Range Diagrams Showing Comparative FatigueStrengths of Aluminum Alloys lhS-T6, 2b5-TL, and75S-T6 ...... 0 0 . . • 77
68. Comparison Curves of For 24S-%T) and 75S-T6"forVarious Numbers of Cycles of Reversed Stress & o .. 78
WADC TR 52-307 Pt 1 viii

FATIGUE PROPERTIES OF UNNOTCHED AND NOTCHED
ALUMINUM ALLOYS AT VARIOUS DIRECT STRESS RATIOS
.I. INTRODUCTION
The inadequacy of fatigue data for structural aluminum alloys under
various stress ranges has necessitated the use of rather broad assumptions
in the design of aircraft structures. The strength data procured in this
program at various stress ratios from static tension to reversed stress
fatigue should help to alleviate this situation.
The strength potential of aircraft materials are frequently not fully
realized because of stress concentration effects. The notches generally
present in aircraft structures necessitate, in the absence of adequate data
and a basic understanding, a rather cautious approach and the inefficiency
of overdesign is frequently the result. Underdesign, even after large fac-
tors of safety have been applied, is also a serious threat. Notch sensitivity
data procured in this work extend the range of stress ratios and fatigue
lives covered in previous studies and provide improved prospective for
structural designers.
II. PRIOR WORK
Much of the prior work on fatigue properties of notched and un-
notched aluminum alloys has been under reversed bending conditions (1)*
(2) (3) (4) (5), in which the alternating to mean stress ratio A** is infinity.
The trend during recent years has been towards increased emphasis on
axial load fatigue tests and consideration of other stress ratios. Although
there have been several investigations on the unnotched and notched fatigue
strength of aluminum alloys (6) (2) (3) it was not until very recently (7) (8)
(9) that a reasonably wide range of stress ratios and notch effecis were
covered.
*Numbers in parenthesis refer to references in the bibliography.**See Appendix A for definition of terms and symbols.
WADC TR 52-307, Part I 1

III. TEST PROGRAM
All tests were conducted at room temperature under axial (tensile
or compressive) stress. Stress magnitudes which caused failure in from103 to 2 x 10⁷ cycles and in some cases to 108 cycles, were studied.
In order to cover as uniformly as possible the stress ratios rang-
ing from static tension to reversed stress fatigue, selected steps of alter-
nating to mean stress ratios (10) were used rather than selected steps of
mean stress. The alternating stress to static mean stress ratios A ori-
ginally selected for this work were A = 0 (static tension), 0. 37, 0. 89,
2. 16, and co (reversed stress). As the project progressed, it was observed
that in many cases small magnitude of alternating stress seriously de-
creased the allowable mean stress, and therefore in such cases additional
data were procured at stress ratios A of 0.15 and 0.08.
One single filleted unnotched type and three different notched types
of specimens, as described in Section V, were used in this program to pro-
vide a range of stress concentration effects of value in service analysis.
IV. TEST MATERIALS
4. 1 Specifications
The three aluminum alloys used in this program were: 14S-T6
(spec. QQ-A-266), 24S-T4 (spec. QQ-A-268), and 75S-T6 (spec. QQ-A-
282) in rolled bar stock form. The results of tests on rolled stock only
are given in this part. Data on extruded alloys are to be presented in
Part II of this report to be issued in the near future.
4.2 Processing
Each of the three test materials, furnished by the Aluminum Com-
pany of America in the final heat-treated form, was received as rolled bars
20 feet long by 1 1/8" in diameter.
WADC TR 52-307, Part I 2

All bars of each material were fabricated from one ingot, each in-
got was made into several blooms, and the identification of the blooms
from which bars were rolled was recorded. Each bar was stamped at the
Alcoa mill and each specimen was given a number to indicate its location
in the original rolled bar. This attention to location details was undertaken
so that if serious scatter in data were observed, the inhomogeneity of the
material and its association with location could be evaluated. This pre-
caution was apparently unnecessary since tests to date indicate the material
to be reasonably uniform.
Alcoa's fabrication procedures from bloom to final rod are indi-
cated below for each material.
14S-T6: Reheat 6" bloom, hot roll to 1. 812", anneal, draw to 1.25",
partially anneal, draw to 1. 13", solution heat treat (940°F), roll
straighten to 1. 125", and artificially age 18 hours at 320°F.
24S-T4: Reheat 6" x 6" bloom, hot roll to 1. 812", anneal, draw to
1. 375", partially anneal, draw to 1.13", solution heat treat
(915°F), and roll straighten to 1. 125".
75S-T6: Reheat 6" x 6" bloom, hot roll to 1.452", anneal, draw to
to 1. 129", solution heat treat (915°F), roll straighten to
1. 125", and artificially age 24 hours at 250 0 F.
4.3 Chemical Analysis
The chemical composition, as furnished by Alcoa for samples
taken from one rod from each bloom, is shown in Table I.
4.4 Metallographic Structure
The metallographic structure of the three tests materials are shown
in Fig. 1. Although the structure of the three test materials appears to be
reasonably normal, rather large insoluble constituents (see Fig. lh), which
are probably chromium bearing segregation, were found in the 75S-T6. Since
the fatigue properties of this batch of 75S-T6 were lower than average, the
Materials Laboratory of Wright Air Development Center and the Research
Laboratories of the Aluminum Company of America both examined the ma-
terial and reported (11) (18) the presence of chromium-bearing constitutents
WADC TR 52-307, Part I 3

larger than usually found in such rod. However, tests conducted by the
Douglas Aircraft Company (19) indicate that chromium-bearing segre-
gation of the type observed does not necessarily cause low fatigue strength.
V. TEST SPECIMENS
5. 1 Design of Specimens
The four types of specimens used to obtain a range of stress con-
centration, illustrated in Fig. 2, are described below. All specimens
tested have the same diameter (0. 400") at the test section.
Type V Unnotched Specimen has a single fillet which is large enough
to justify the assumption of zero concentration of stress (theoretical stress
concentration factor Kt is one). In some of the early tests on this speci-
men, failures were experienced in the thread instead of in the test section.
This difficulty was almost completely corrected by using a larger than
standard radius at the root of the thread (the "Unified" thread is now used)
and in some cases the thread root was also rolled. Also a stress reliev-
ing groove of 3/16" radius was machined near the inside edge of the thread
in some cases.
Type W Notched Specimen has a 0. 400" diameter test section at the
root of a semicircular circumferential notch of radius 0. 100". The theo-
retical stress concentration factor, as calculated from Neuber's charts (12),
is 1.6.
Type AB Notched Specimen has a circumferential 600 V notch with a
0.032" root radius. The theoretical stress concentration factor for this
specimen is 2.4.
Type X Notched Specimen has a 600 V notch with a 0. 010 inch root
radius. The theoretical stress concentration factor for this specimen is
3.4.
5.2 Preparation of Test Specimens
All fatigue specimens were prepared completely by the John Stulen
Company of Gibsonia, Pennsylvania (except for the polishing of type W and
WADC TR 52-307, Part I 4

AB specimens, which was done at Minnesota). Since machining and pol-
ishing techniques may greatly affect fatigue properties, the procedures used
in specimen preparation are described below in detail.
5.2. 1. Unnotched Specimens, Type V. The specimen was rough
machined, threaded and lathe turned with a 600 tool bit having a 1/32?t
radius at the nose. Initial cuts of 0. 050" were made at a speed of 1100
rpm and feed of . 010 per revolution until the diameter was 0. 050" larger
than the final size. The specimens were then finish machined to .005?? over
final size in three cuts having successive depths of . 010"?, . 005?, and . 002",
and feed of . 006" per revolution. The lathe tool-was always kept sharp
during final cuts, and sulphurized cutting oil was used on these finishing
cuts to produce freer cutting action.
During polishing the specimen was revolved at 600 rpm. An arm
containing a 150 foot roll of 1/2"? wide cloth abrasive tape was passed
around a rubber disc in contact with the specimen. This arm was recipro-
cated at 180 cycles per minute in a direction parallel to the axis of the
specimen. The abrasive tape passed around this rubber disc and over the
specimen at a rate of 6" per minute. A constant pressure of 3 lbs was
maintained between the tape and the specimen. The area of contact between
the tape and the specimen was about 1/2" x 1/4", or 1/8 square inch.
The first polishing operation was done with 180 mesh tape of alumi-
num oxide abrasive grain. Stock was removed at a rate of .004" per
minute. The tape was saturated with sperm oil to free the abrasive grain
of cuttings and give a faster cutting action. With the specimen revolving at
600 rpm and the tape reciprocating longitudinally across the specimen, a
cross hatching cutting action was produced at the center of the specimen.
This operation was continued until the specimen was within 0. 0005" of final
size. The second polishing operation was similar to the first except that a
400 mesh aluminum oxide abrasive tape was used for 30 seconds. This was
followed by 20 second polish with the specimen turning at 3 rpm to produce
a longitudinal finish. The final polish was performed in the same manner
with 900 mesh aluminum oxide abrasive grain tape. The surface finish thus
produced was better than 10 micro-inches.
WADC TR 52-307, Part I 5
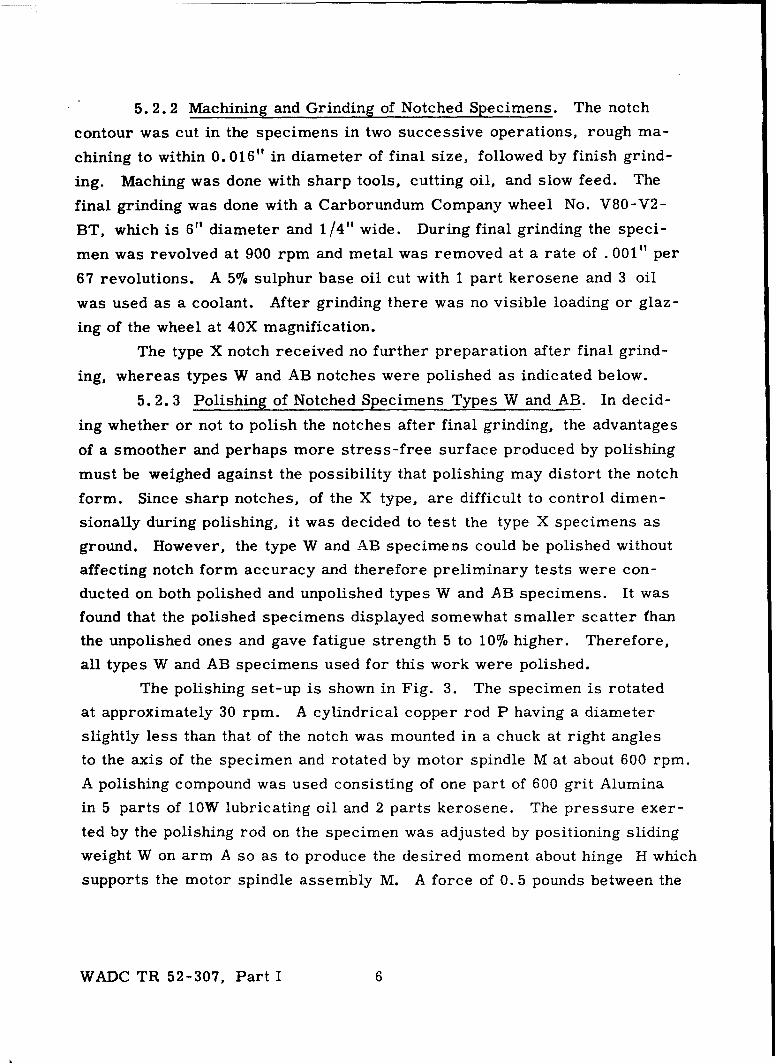
5. 2.2 Machining and Grinding of Notched Specimens. The notch
contour was cut in the specimens in two successive operations, rough ma-
chining to within 0. 016" in diameter of final size, followed by finish grind-
ing. Maching was done with sharp tools, cutting oil, and slow feed. The
final grinding was done with a Carborundum Company wheel No. V80-V2-
BT, which is 6" diameter and 1/4" wide. During final grinding the speci-
men was revolved at 900 rpm and metal was removed at a rate of . 001" per
67 revolutions. A 5% sulphur base oil cut with 1 part kerosene and 3 oil
was used as a coolant. After grinding there was no visible loading or glaz-
ing of the wheel at 40X magnification.
The type X notch received no further preparation after final grind-
ing, whereas types W and AB notches were polished as indicated below.
5.2.3 Polishing of Notched Specimens Types W and AB. In decid-
ing whether or not to polish the notches after final grinding, the advantages
of a smoother and perhaps more stress-free surface produced by polishing
must be weighed against the possibility that polishing may distort the notch
form. Since sharp notches, of the X type, are difficult to control dimen-
sionally during polishing, it was decided to test the type X specimens as
ground. However, the type W and AB specimens could be polished without
affecting notch form accuracy and therefore preliminary tests were con-
ducted on both polished and unpolished types W and AB specimens. It was
found that the polished specimens displayed somewhat smaller scatter fhan
the unpolished ones and gave fatigue strength 5 to 10% higher. Therefore,
all types W and AB specimens used for this work were polished.
The polishing set-up is shown in Fig. 3. The specimen is rotated
at approximately 30 rpm. A cylindrical copper rod P having a diameter
slightly less than that of the notch was mounted in a chuck at right angles
to the axis of the specimen and rotated by motor spindle M at about 600 rpm.
A polishing compound was used consisting of one part of 600 grit Alumina
in 5 parts of 1OW lubricating oil and 2 parts kerosene. The pressure exer-
ted by the polishing rod on the specimen was adjusted by positioning sliding
weight W on arm A so as to produce the desired moment about hinge H which
supports the motor spindle assembly M. A force of 0. 5 pounds between the
WADC TR 52-307, Part I 6
lap and specimen was used in all cases. The specimen was polished until
all circumferential scratches were removed (usually from 4 to 6 minutes)
with about 0. 0005" reduction in diameter. This operation produces a sur-
face finish of about 10 micro-inches, as measured by Brush surface ana-
lyser and Fax film procedures.
The final dimensions of all notched and unnotched specimens were
accurately determined in an optical comparator to an accuracy of 0. 0002".
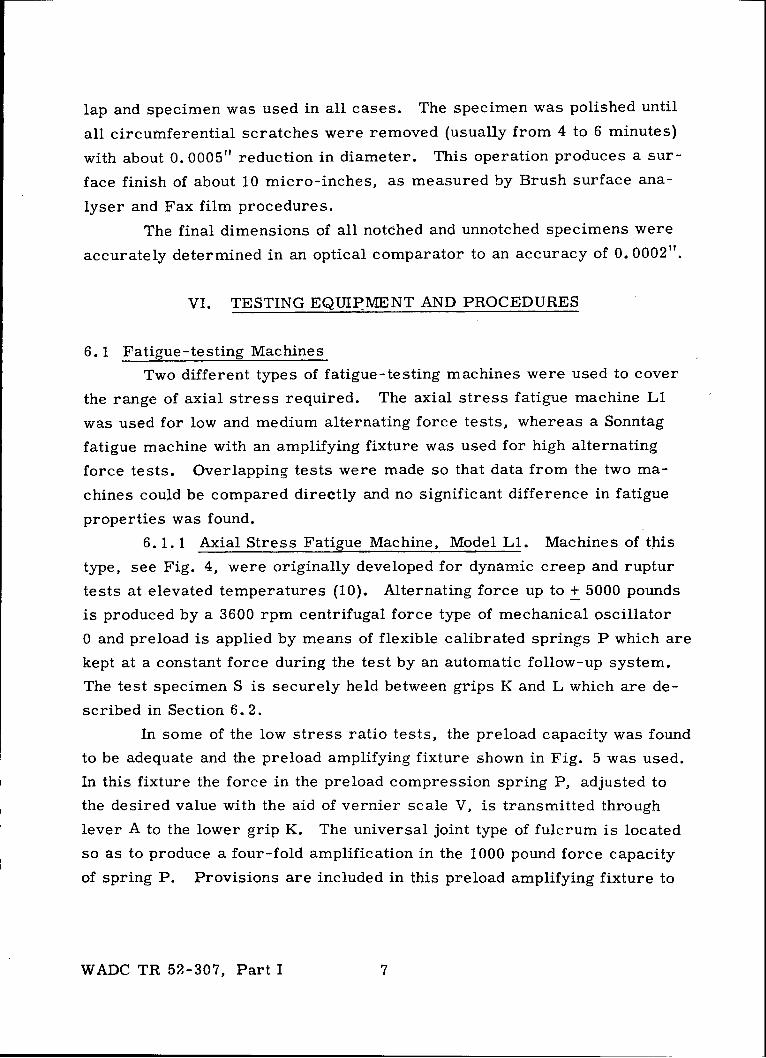
VI. TESTING EQUIPMENT AND PROCEDURES
6. 1 Fatigue-testing Machines
Two different types of fatigue-testing machines were used to cover
the range of axial stress required. The axial stress fatigue machine Li
was used for low and medium alternating force tests, whereas a Sonntag
fatigue machine with an amplifying fixture was used for high alternating
force tests. Overlapping tests were made so that data from the two ma-
chines could be compared directly and no significant difference in fatigue
properties was found.
6. 1. 1 Axial Stress Fatigue Machine, Model Ll. Machines of this
type, see Fig. 4, were originally developed for dynamic creep and ruptur
tests at elevated temperatures (10). Alternating force up to + 5000 pounds
is produced by a 3600 rpm centrifugal force type of mechanical oscillator
0 and preload is applied by means of flexible calibrated springs P which are
kept at a constant force during the test by an automatic follow-up system.
The test specimen S is securely held between grips K and L which are de-
scribed in Section 6.2.
In some of the low stress ratio tests, the preload capacity was found
to be adequate and the preload amplifying fixture shown in Fig. 5 was used.
In this fixture the force in the preload compression spring P, adjusted to
the desired value with the aid of vernier scale V, is transmitted through
lever A to the lower grip K. The universal joint type of fulcrum is located
so as to produce a four-fold amplification in the 1000 pound force capacity
of spring P. Provisions are included in this preload amplifying fixture to
WADC TR 52-307, Part I 7

manually maintain constant spring force, or constant preload, even though
the creep in the test specimen may be large.
6.1.2 Sonntag Fatigue Machine with Amplifying Fixture. The capa-
city of the Li machine described above, was not adequate for several of the
short-life, high stress ratios fatigue tests. Therefore, a special eight-to-
one amplifying fixture was constructed for use with the standard Sonntag
SF-lU fatigue machine (13) or any other similar machine. In this device,
shown in Fig. 6, the force produced by the fatigue machine is transmitted
from its oscillating head K through flex-plate B to amplifying arm A. The
arm is supported by flex-plates F and others not visible so as to increase
the fatigue machine force by a factor of eight and transmit this force to vi-
brating cage C. Additional flex-plates, not visible in the photograph, re-
strict the motion of cage C to a vertical direction only so as to avoid bend-
ing stress. The force is transmitted directly from cage C to test specimen
S gripped in the fixture as shown. The capacity of this machine is 8000 lbs.
preload and + 8000 lbs. alternating force. Although this machine operates
at 1800 rpm as compared to the 3600 rpm of the Li machines, this differ-
ence in fatigue stress frequency is not considered significant.
6.2 Grips
The production and maintenance of a uniform stress distribution in
direct stress fatigue specimens constitute a most important task. Very
small errors in alignment in the specimen-grip assembly may frequently
result in large extraneous bending stress, which may seriously reduce the
observed fatigue strengths. As a result of these observations, particular
emphasis was placed on procuring and maintaining uniform stress distri-
bution in the specimen during: (a) clamping of specimen-grip assembly in
fatigue machine, (b) application of preload, and (c) application of alternating
force.
Stress distribution in specimens held in commercially manufactured
grips was not satisfactory, so new types of grips were developed. Fig. 7
shows the assembled specimen-grip combination. In order to align the
grips, the specimen S, nuts J, plate H, cap K, and screws A are assembled
WADC TR 52-307, Part I 8

as shown and placed between centers. Screws A are then preferentially
tightened until the ground outer faces of H and K are perpendicular to the
axis of the specimen. The specimen assembly so aligned is then placed in
the machine and the bolts securing cap K to cage B are tightened. The three
positioning screws D, preloaded with springs to avoid backlash difficulties,
are then set with the aid of electrical contacts so that the plane of their
lower ends is parallel to plate H. Bolts C are then tightened uniformly
(using a torque wrench) and plate H is securely locked between ring R and
screws D.
Calibration tests briefly described below indicate that this method
of gripping effectively eliminated significant bending stress during both the
specimen gripping operation and the application of the static and alternating
loads.
6. 3 Calibration of Machines and Grips
A thorough calibration study of the average stress and stress dis-
tribution in the test specimen was undertaken at the outset of this testing
program. Since these calibration tests have been described in detail in
reference (14), details shall not be given in this report.
Dynamic calibration of the forces applied to the specimen of one ma-
chine was accomplished in three independent ways: (a) direct measurement
of strain using SR-4 strain gages cemented to the specimen, (b) measure-
ment of force on a proving ring inserted in place of the specimen, and (c)
calculation of force produced by the rotating eccentric. After taking into
account the inertial forces of the vibrating parts these three methods check-
ed each other within 1-1/2%. After this initial calibration, subsequent cali-
brations were made by the strain gage and theoretical methods only.
Bending stresses were measured with SR-4 gages cemented 1200
apart around the periphery of the specimen. With the gripping procedure
described in Section 6. 2, the bending stress was generally less than 3%.
6.4 Test Procedure at High Mean Stress
During fatigue tests at high mean stress (in which the crest stress
exceeds the yield strength of the material) the creep in the specimen was
WADC TR 52-307, Part I 9

found to be large in some cases. This creep may significantly reduce the
preload imposed by the springs before the follow-up system could respond
adequately. Since these tests were generally of short duration, and a re-
duced preload could not be tolerated for even a short period, some of the
early tests were in error. In all the tests reported herein, efforts were
made to impose full stress conditions as soon as possible after the start
of the test, and the stress-relaxation through creep is not considered
significant.
VII. RESULTS AND DISCUSSION
7. 1 Static Tensile and Hardness Properties
In order to evaluate the uniformity of the three materials and also to
determine how closely their properties compare with accepted values, a
series of tensile and hardness tests were undertaken. The tensile tests
were performed in accordance with ASTM standards (0. 505" specimen
diameter by 2" gage length) and the hardness tests were of the Rockwell
RA type. Data procured from specimens cut from the center and two ends
of each of the 20 foot bars used are listed in Tables II, III, and IV. Also
given in these tables are the moduli of elasticity determined from auto-
graphic load-deflection curves. The results of these tests agree closely
with published data on these materials (2).
Static tension tests were also undertaken on the unnotched and
notched type fatigue specimens used in this program. This was done notI
only to establish the general effects of the various types of notches on the
static tensile strength but also to determine the zero stress ratio points
for the stress range fatigue diagrams to be presented later. The results
of these tests, given in Tables II, III, and IV, indicate generally higher
static strengths for the fatigue type specimens than for the ASTM tension
specimens. Thig is shown graphically in the lower part of Fig. 8 in which
is plotted the tensile strength of the various types of fatigue specimens as a
function of the notch severity, specified in terms of the theoretical stress
concentration factor Kt.
WADC TR 52-307, Part I 10

The Kt values for all of the fatigue specimens are indicated alongthe abscissa. Also shown in this figure are the average tensile strengths
for the standard straight-sectioned ASTM test specimen.
Figure 8 shows that the tensile strength increases with increasing
notch severity, reaching a maximum at some intermediate Kt value, beyond
which it decreases. This general pattern has been observed previously.
Although such factors as stress gradient, plasticity properties, and the
state of stress (whether uniaxial, biaxial or triaxial) are important, this
effect is partially explainable on the basis that a fillet or notch has two
major effects:
a. Causes stress concentration which tends to reduce the strength
of the specimen, and
b. Restricts the reduction in area ("necking-down" prior to failure)
which tends to increase the strength.
Figure 8 shows that the strength of the type V specimen is larger in all
cases than the ASTM specimen, and this may be explainable on the basis
that factor (a) above is practically the same for both specimens whereas
factor (b) favors the type V specimen. The peaked strength curve may simi-
larly be explainable on the basis that factor (b) predominates up to a certainnotch severity beyond which factor (a) becomes 'the more critical. Thus, a
reduction in strength is observed for notch severities beyond that of type AB
specimen.
The elongation data for the various types of fatigue specimens are
plotted in the upper part of Fig. 8. Note that the peak in the strength curves
occur at the stress concentration factor at which the elongation curves reach
a horizontal asymptote. However, a quantitative analysis of the relationship
of the elongation data and related ductility factors to the strength trends
shown in Fig. 8 is beyond the scope of this paper.
7.2 Creep and Rupture Properties
In order to accurately establish the zero stress-ratio point forall lives in the stress range diagram to be discussed in the next section, a
few exploratory tests were made to determine if the time at load signifi-
cantly affects the static strength of the fatigue type specimens at room
WADC TR 52-307, Part I 11

temperature. The data for 24S-T6 are presented in Fig. 9 and 10. Refer-
ring first to the lower curve of Fig. 9, the load on a specimen having a
Kt = 1 was gradually increased in the steps shown and maintained at each
step for sufficient time to establish creep trends. At the lower stresses
no measurable creep was observed even for periods of time as large as
several days. However, at fairly high stresses, as for example region a-b
at 63, 700 psi, measurable creep was observed as shown in curve a-b of
Fig. 10. After approximately 100 hours at stress a-b the stress on this
specimen was increased to c-d (67, 000 psi) and again measurable creep
ensued. Since in practically all the fatigue tests reported in this paper
cycles to failure were not carried beyond 2 x 10⁷ cycles, which occurs in
less than 100 hours, these static stress-rupture tests were not carried be-
yond 100 hours. On this basis it was found that the long-term static strength
was not significantly lower than the short duration static strength as shown
by Fig. 9. Therefore, in the stress range diagrams-presented later, zero
stress ratio values are shown as one point for all lives.
The Kt = 3.4 specimen displayed a similar behavior as shown in the
upper part of Fig. 9 and the lower three curves of Fig. 10. Even though
significant creep occurred at stresses considerably below the ultimate
strength, nevertheless the 100 hour stress-rupture strength of the Kt ý 3.4
specimen was not significantly lower than the static tensile strength.
Based on these and a few other stress rupture tests not reported,
it may be concluded that the stress rupture diagram is so flat at room tem-
perature that the 100 hour stress-rupture value is practically the same as
the static strength of the material. Therefore, the zero stress ratio points
in all stress range diagrams are determined from the static tests on the
particular specimen type being diagrammed.
7. 3 Effect of Stress Relief on Fatigue Properties of Notched and Unnotched
Specimens
As indicated in Section 5. 2, considerable attention was devoted to
the details involved in specimen preparation so that, among other factors,
significant iriternal stress would not be induced. Since the introduction of
WADC TR 52-307, Part I 12
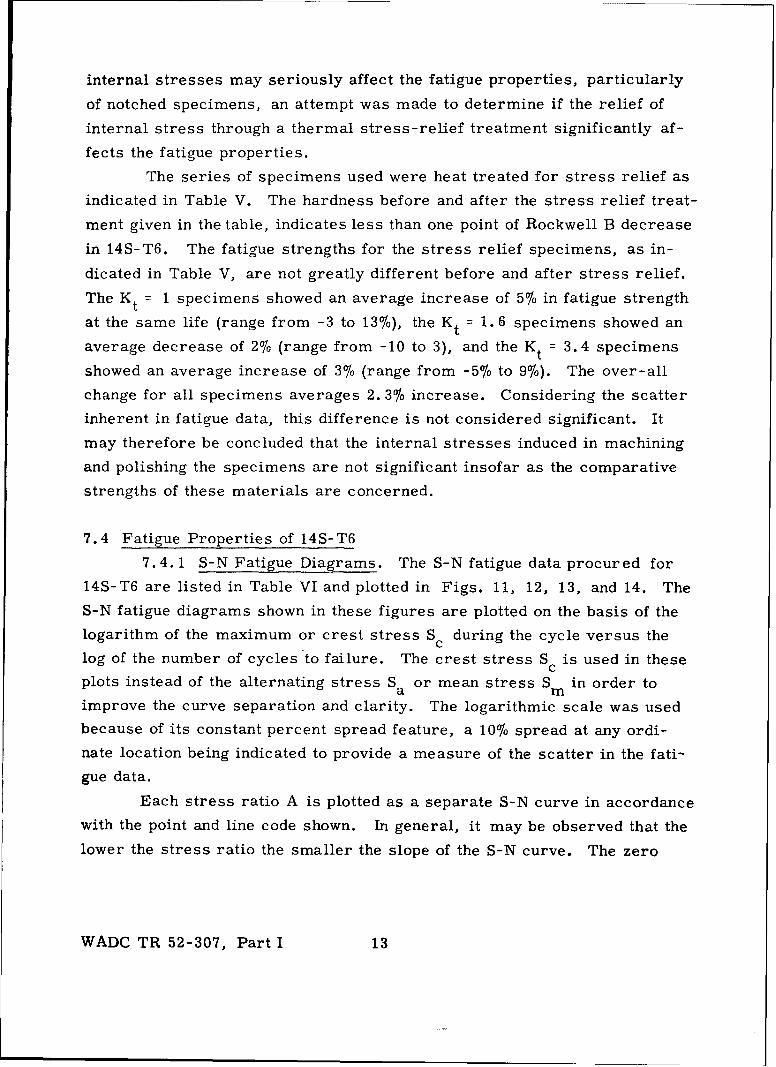
internal stresses may seriously affect the fatigue properties, particularly
of notched specimens, an attempt was made to determine if the relief of
internal stress through a thermal stress-relief treatment significantly af-
fects the fatigue properties.
The series of specimens used were heat treated for stress relief as
indicated in Table V. The hardness before and after the stress relief treat-
ment given in the table, indicates less than one point of Rockwell B decrease
in 14S-T6. The fatigue strengths for the stress relief specimens, as in-
dicated in Table V, are not greatly different before and after stress relief.
The Kt = 1 specimens showed an average increase of 5% in fatigue strength
at the same life (range from -3 to 13%), the Kt = 1.6 specimens showed an
average decrease of 2% (range from -10 to 3), and the Kt = 3.4 specimens
showed an average increase of 3% (range from -5% to 9%). The over-all
change for all specimens averages 2. 3% increase. Considering the scatter
inherent in fatigue data, this difference is not considered significant. It
may therefore be concluded that the internal stresses induced in machining
and polishing the specimens are not significant insofar as the comparative
strengths of these materials are concerned.
7.4 Fatigue Properties of 14S-T6
7.4.1 S-N Fatigue Diagrams. The S-N fatigue data procured for
14S-T6 are listed in Table VI and plotted in Figs. 11, 12, 13, and 14. The
S-N fatigue diagrams shown in these figures are plotted on the basis of the
logarithm of the maximum or crest stress Sc during the cycle versus the
log of the number of cycles to failure. The crest stress Sc is used in these
plots instead of the alternating stress Sa or mean stress S in order toa mimprove the curve separation and clarity. The logarithmic scale was used
because of its constant percent spread feature, a 10% spread at any ordi-
nate location being indicated to provide a measure of the scatter in the fati-
gue data.
Each stress ratio A is plotted as a separate S-N curve in accordance
with the point and line code shown. In general, it may be observed that the
lower the stress ratio the smaller the slope of the S-N curve. The zero
WADC TR 52-307, Part I 13

stress ratio curve is not shown but as discussed previously, the static
stress-rupture data indicates practically a horizontal line.
Referring to Fig. 11, and others to be discussed later, it may be
observed that the crest stress Sc may slightly exceed the static ultimate
strength, Su, for the same type specimen during a low stress-ratio fatigue
test. Since this difference is generally small (only about 5% above the
static ultimate strength) and since it occurs at high stress where the life
is quite short, the data cannot be considered conclusive. Nevertheless,
several tests have produced this same result on various materials and
specimen types. It is believed to be possible for the crest stress to exceed
the static ultimate strength, since strain rate and time at peak load may be
important variables.
Since the scatter in fatigue strength data at long life is generally
larger than at short life, it is generally rather difficult to establish the
existence or non-existence of a horizontal asymptote or fatigue limit. Al-
though the data presented in these figures and in subsequent diagrams do
not appear to approach the asymptote up to 10 cycles nothing conclusive
can be said on this matter.
In some cases the specimens which did not fail at a low stress
level were retested at a higher stress level. The S-N fatigue points pro-
cured on specimens with such a previous stress history are marked by an
asterisk in the S-N diagram. With only one or two exceptions the previous
stress history does not appear to significantly affect the fatigue strength at
a higher stress level. Since the effect of understressing is uncertain, these
data are presented merely as a matter of interest.
If the slopes of the S-N curves in Figs. 11, 12, 13, and 14 are com-
pared, it is seen that the higher the stress concentration factor the greater
is the steepness of the short life part of the curves. This observation is
as expected since the notched specimens display higher static strength, but
lower long term Tatigue strength, than do the unnotched specimens.
7.4.2 Stress Range Diagrams. The fatigue data diagrammed in
Figs. 11, 12, 13, and 14 are replotted on a stress range basis in Figs. 15,
16, 17, and 18. The left ordinate indicates the alternating stress and the
WADC TR 52-307, Part I 14

bottom abscissa the mean stress. Each curve indicates the combinations
of alternating and mean stress which results in failure in a definite number
of cycles in the range from 103 to 107 cycles. The series of inclined lines
which pass through zero indicate the stress ratios used. Also shown in this
diagram is a straight dot-dash line to indicate the combination of alternating
and mean stress whose total equals the ultimate strength, Su, of the mater-
ial for the specimen type under consideration. As pointed out previously,
and as shown in Fig. 15, Sa + S may exceed the ultimate strength of the
material Su at low stress ratios for short life. Figures 15, 16, 17, and 18
also include unitless scales in the upper abscissa and right hand ordinate.
The unitless abscissa scale is the ratio of the mean stress on the specimen
to the static ultimate strength of the material and the unitless ordinate is
the ratio of the alternating test stress to the alternating stress which will
cause failure in 107 cycles at a stress ratio of infinity.
Comparing Figs. 16, 17, and 18, it is apparent that the higher the
stress concentration factor in the specimen the flatter are the stress range
curves, particularly for long life. Also of significance is the observation
that although the curves for the unnotched and mildly notched specimens are
generally either concave downward or straight, the severely notched speci-
mens display curves which are concave upward. As a result of these trends,
relatively small alternating force may greatly reduce the allowable mean
stress. For example, referring to the curve in Fig. 18 for a life of 107
cycles, the addition of an alternating stress of only 8 per cent decreases the
allowable mean stress by 35% from 84, 000 to 54, 000, and an alternating
stress of 15% of the preload reduces the allowable mean stress 68% from
85, 000 psi to 27, 000 psi. This observation is of considerable design sig-
nificance since low magnitudes of alternating force are frequently encoun-
tered in service, and these are sometimes ignored on the assumption that
they are insignificant.
It is desirable to determine if the stress range relationship is suf-
ficiently consistent for all stress ratios to permit interpolation when only
the reversed stress fatigue strengths and static strengths are known. In
order to establish such a relationship, the stress range data of Figs. 15 to
WADC TR 52-307, Part I 15

18 are replotted on a completely unitless basis in Figs. 19 to 22. In these
unitless diagrams both the maximum ordinate and maximum abscissa are
arbitrarily made equal to one. This means that the ordinate scale is the
ratio of the alternating stress for a given life (the various lives plotted are
shown by the point and line code) to the alternating stress for the same life
under reversed stress conditions (A = co). Even though each of the three
families of curves fall within a band which can be approximated by a single
curve, the general shape of the bands are quire different, particularly for
the sharply notched specimens. Therefore, the stress range relationship
cannot be defined by one equation for all fatigue lives and specimen types.
7.4.3 Notch Sensitivity Diagrams. It is apparent from the study of
the foregoing stress range diagrams that the reduction in fatigue strength
caused by a notch is a function of not only dimensions but also stress ratios
and stress level or life. The relationship of the notch effect to these vari-
ables is clarified in the series of notch sensitivity diagrams shown in Figs.
23 to 28.
In these diagrams the harmful effect of the notch is specified in
terms of the fatigue strength reduction factor Kf, which is defined as the
ratio of the fatigue strength of the unnotched specimen to the fatigue strength
(based on nominal stress calculations) of the notched specimen for the same
life and same stress ratio. Since all data were procured and analysed on
the basis of a fixed stress ratio (rather than fixed alternating stress and
variable mean stress or fixed mean stress under variable alternating stress)
and the ratios of (S cunnotched to (S cnotched is the same as the correspond-
ing Sa and Sm ratios, thus it is not necessary in an analysis based on fixed
stress ratios to specify which stress (S , S , or S i) was used to compute
Kf.
The first of the notch sensitivity diagrams, shown in Fig. 23b, is
constructed by first drawing "profile" curves of the type shown in Fig. 23a.
Each of the profile curves covers a different stress ratio and each point
represents the ratio of the fatigue strength of the unnotched specimen for a
given life (determined from Fig. 11) to the fatigue strength of the notched
specimen for the same life and same stress ratio (determined from Fig. 14).
WADC TR 52-307, Part I 16

The resultant Kf values are plotted against the alternating stress in the
unnotched specimen.
The "profile" curves shown in Fig. 23a are projected to within theSa versus S coordinate system shown in Fig. 23b to establish the Kf con-tour curves shown. For example, to determine the location of the Kf 2.2
point for the ratio A of 0. 89, a dashed line is drawn vertically along the2.2 Kf value in Fig. 23a until it intersects the A = 0.89 curve, at which
alternating stress a horizontal projection line is constructed to intersectthe 0. 89 stress ratio line in Fig. 23b. Similarly, other contour line points
for A = 0. 89 and other stress ratios may be located and the contour curves
shown in Fig. 23b may be constructed to show the Kf surface.Because of the inherent scatter in fatigue data and in order to avoid
complicated contour curves which might be difficult to interpret, someliberties were taken in plotting the Kf surface in Fig. 23b. All the contourpoints are located according to the actual S-N curves shown in Figs. 11-14,but the contour lines do not always pass through these points. However, inno case does the contour line deviate by more than 10%* from the plotted
contour points, and only in a very few cases is the deviation this large.The regions of the contour curve shown in Fig. 23 in which the interpolation
or extrapolation are rather uncertain are shown in dashed lines.
Similar Kf data for the other notches, (Kt = 2.4 and 1.6) are dia-grammed in Fig. 24 and 25. For conciseness, the "profile" curves are
omitted in this and subsequent figures of this type.The following observations may be made from Figs. 23, 24 and 25.
If the fatigue reduction factor Kf were reasonably independent of mean stressand dependent only on alternating stress, then the contour lines would behorizontal; whereas if Kf were dependent on mean stress and not on alterna-
ting stress, these contour lines would be vertical. In general, these con-tour lines are inclined indicating the dependence of Kf on both alternating
and mean stress. However, in some regions the lines are essentially
*This limit of 10% deviation was established as follows: By inspection,the S-N point scatter may cause an error in the S-N curve of up to approxi-mately 5%. Thus, since the Kf values are based on the ratio of two curves,an error up to 10% is possible.
WADC TR 52-307, Part I 17
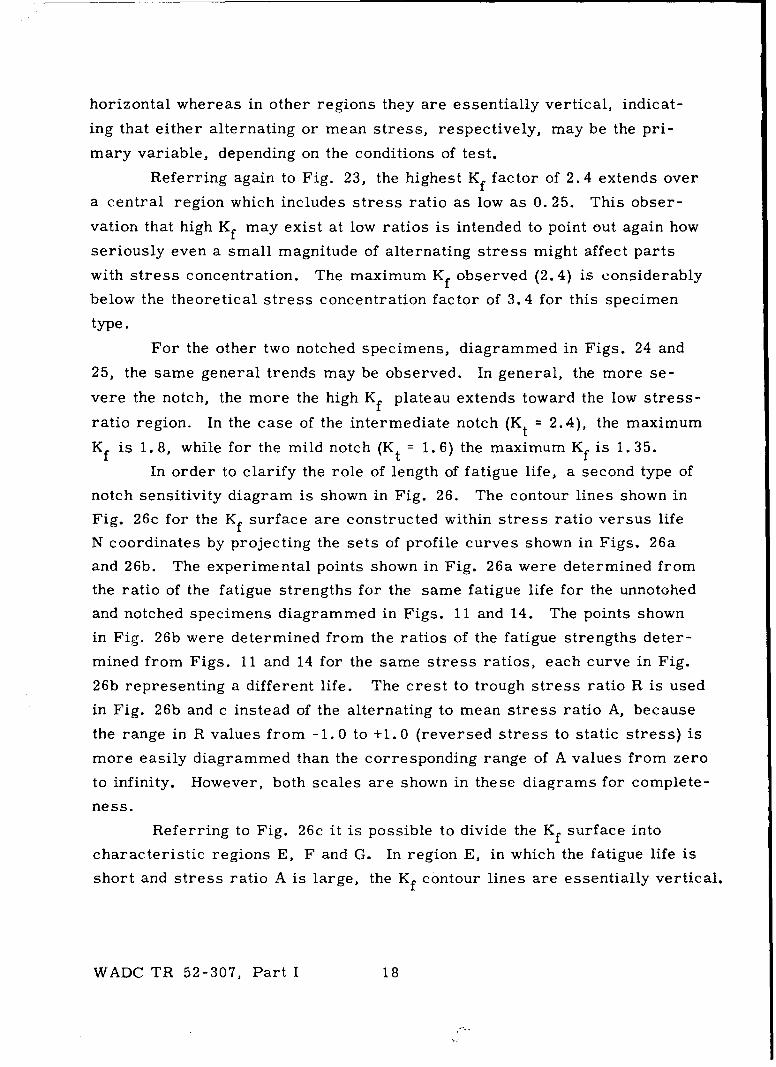
horizontal whereas in other regions they are essentially vertical, indicat-
ing that either alternating or mean stress, respectively, may be the pri-
mary variable, depending on the conditions of test.
Referring again to Fig. 23, the highest Kf factor of 2.4 extends over
a central region which includes stress ratio as low as 0. 25. This obser-
vation that high Kf may exist at low ratios is intended to point out again how
seriously even a small magnitude of alternating stress might affect parts
with stress concentration. The maximum Kf observed (2.4) is considerably
below the theoretical stress concentration factor of 3.4 for this specimen
type.
For the other two notched specimens, diagrammed in Figs. 24 and
25, the same general trends may be observed. In general, the more se-
vere the notch, the more the high Kf plateau extends toward the low stress-
ratio region. In the case of the intermediate notch (Kt = 2.4), the maximum
Kf is 1.8, while for the mild notch (Kt = 1.6) the maximum Kf is 1.35.
In order to clarify the role of length of fatigue life, a second type of
notch sensitivity diagram is shown in Fig. 26. The contour lines shown in
Fig. 26c for the Kf surface are constructed within stress ratio versus life
N coordinates by projecting the sets of profile curves shown in Figs. 26a
and 26b. The experimental points shown in Fig. 26a were determined from
the ratio of the fatigue strengths for the same fatigue life for the unnotohed
and notched specimens diagrammed in Figs. 11 and 14. The points shown
in Fig. 26b were determined from the ratios of the fatigue strengths deter-
mined from Figs. 11 and 14 for the same stress ratios, each curve in Fig.
26b representing a different life. The crest to trough stress ratio R is used
in Fig. 26b and c instead of the alternating to mean stress ratio A, because
the range in R values from -1.0 to +1.0 (reversed stress to static stress) is
more easily diagrammed than the corresponding range of A values from zero
to infinity. However, both scales are shown in these diagrams for complete-
ness.
Referring to Fig. 26c it is possible to divide the Kf surface into
characteristic regions E, F and G. In region E, in which the fatigue life is
short and stress ratio A is large, the Kf contour lines are essentially vertical.
WADC TR 52-307, Part I 18

This indicates that Kf is essentially independent of stress ratio and pri-
marily dependent on the fatigue life. In region G, however, where the fati-
gue life is comparatively long and the stress ratio A is small, the contour
lines are essentially horizontal, indicating that stress ratio rather than life
is most critical. Region F, the transition region between E and G, is one
in which both the stress ratio and fatigue life are important.
The large slope in the K surface in region G, as indicated by then fdensity of the Kf contour lines, again indicates that adding relatively littlealternating stress in a notched member may greatly decrease the allowable
preload.
Here again, there is a gradual transition in going from the severely
notched specimen (Fig. 26c) to the mildly notched specimens (Fig. 28), the
three regions discussed previously being least apparent in the case of the
mild notch. Also, the Kf peak occurs at higher stress ratio A and at some-
what shorter life in the case of the mild notch. It is therefore apparent that
K f varies significantly with both stress ratio and life and that the pattern of
variation is dependent on the severity of the notch.
Several attempts have been made in the past (15) (16) to analyse the
over-all fatigue reduction factor Kf in terms of two more basic quantities:
(a) the theoretical stress concentration factor Kt determined from the geo-
metry of the notch, and (b) a material factor. A quantity sometimes used
to represent the material fcctor is the dimensionless quantity q given by the
expression q Kf . On the basis of this definition q would normallyKt- 1
lie between 0 (for a material that is extremely notch insensitive) to 1 (for a
material which is extremely notch sensitive).
It is unlikely that a single material constant of the type q would ade-
quately define the behavior of material at all stress ratios since both the
static and fatigue properties may be involved to a varying degree. For si-
milar reasons q is likely to be dependent upon fatigue life. Past work (16)
indicates that q does vary considerably with factors other than material.
Nevertheless, in the absence of a better measure of the material factor the
values of q are diagrammed in Fig. 29 within alternating and mean stress
coordinates for the three type specimens Kt = 1.6, 2.4, and 3.4). Although
WADC TR 52-307, Part I 19

the general shapes of the q surfaces for these types of specimen are simi-
lar in some respects, the specific values for q are generally quite different
even under given stress conditions. In general, the sharp notch displays
the higher q factor over most of the stress range field.
7.4.4 Yield, Creep and Elongation During Fatigue Test. As dis-
cussed under Section VI, the test specimen yeilds and creeps during the
fatigue tests conducted above its yield strength. This yield, measured with
a micrometer, occurs almost entirely during the very early stages of the
test.
Total elongation was also determined by measuring the total length
of the specimen before and after the test, the broken specimens of course
being carefully matched at the fracture before measurement. Total elonga-
tion measured by this method compared favorably with the elongation meas-
ured by the micrometer method, although some difference due to elongation
during final separation was sometimes apparent.
The total elongation of the specimens as a function of maximum stress
and stress ratio is shown in Fig. 63. Also included for comparison purposes
is the elongation of an unnotched fatigue specimen of 24S-T4 broken under
static loading (the standard straight section static specimen has a percent
elongation of 21% per 2" gage). In general, elongation does not become sig-
nificant until the maximum stress exceeds the yield strength. Above this
limit elongation decreases with increasing stress ratio, becoming negligible
under reversed stress conditions.
7.4. 5 General Observations Concerning Damping Capacity of Test
Materials. No difficulty was experienced with specimen heating due to in-
ternal hysteresis damping. Even at the highest stress levels (frequency of
loading 1800 rpm) no artificial cooling was required to keep the specimens
at room temperature. This may be interpreted as a qualitative indication
of the low damping capacity of these test materials.
7.5 Fatigue Properties of 24S-T4
The fatigue data procured on 24S-T4 are listed in Table VII and
the corresponding S-N fatigue diagrams are shown in Figs. 30 to 33. The
stress range diagrams of Figs. 34 to 41 and the notch sensitivity diagrams
WADC TR 52-307, Part I 20

of Figs. 42 to 48 display characteristics similar to those of 14S-T6 dis-
cussed in the previous section. The maximum Kf values are 1. 35 for the
mild notch (Kt = 1. 6), 2. 2 for the intermediate notch (Kt = 2.4), and 2. 6
for the sharp notch (Kt = 3.4).
7. 6 Fatigue Properties of 75S-T6
The fatigue data procured on specimens of 75S -T6 having Kt values
of 1, 1. 6, and 3.4 are listed in Table VIII and the corresponding S-N fati-
gue diagrams are shown in Figs. 49 to 51. The maximum Kf values are
1.2 for the mild notch (Kt = 1.6) and 2.1 for the severe notch (Kt = 3.4).
The stress range diagrams shown in Figs. 52 to 54 (also see Figs.
55 to 57) are similar in many respects to those discussed previously except
that the unnotched specimen is abnormally flat.
COMPARISON AND ANALYSIS OF DATA
8.1 Fatigue Properties of Unnotched Specimens
A comparison of the stress range fatigue data obtained in this pro-
gram on 14S-T6 and 24S-T4 with those of other sources is shown in Figs.
64 and 65, respectively. Also shown at vertical ordinate locations are ro-
tating beam data (stress ratio of infinity) for these materials. * In general,
the agreement is good although the Minnesota stress range data at high
stress ratios is somewhat higher than the comparison data. Also, the ro-
tating beam fatigue strengths are somewhat higher, in general, than the re-
versed axial stress strength, which is in agreement with general expectation.
However, it should be noted from Fig. 65 that the Minnesota rotating beam
data checks almost exactly the Minnesota reversed axial stress data (same
batch of 24S-T4 used for both tests).
A comparison of 75S-T9 data from various sources, as shown inFig. 66, reveals rather serious divergence. The Minnesota data is as much
*The points marked "B" in Fig. 64 designate the rotating beam fatiguestrengths for a British alloy, B5562-1, having a chemical composition andstatic strength similar to 14S-T6.
WADC TR 52-307, Part I 21

as 50% below the comparison data at 105 cycles, and shows even a greater
discrepancy at 107 cycles. However, tests conducted at the Aluminum Re-
search Laboratories (18) on specimens from the same batch of material as
tested in this program yield fatigue strengths significantly below average
values. The ARL data, plotted as points "F" in Fig. 66, fall between Minne-
sota data and those from other sources. These comparative curves indicate
that, though the static strengths are reasonably uniform, there is a wider
variation in fatigue strengths of 75S-T6 than for the other aluminum alloys.
A determination of how widespread this condition has been in the past and
the probability of its occurrence in the future is beyond the scope of this
report.
Fig. 67 shows a comparison of the fatigue strengths of 14S-T6, 24S-
T4, and 75S-T6. In Fig. 67a, constant-life curves of 104 and 107 cycles
are shown for unnotched specimens of the three materials. At the two life-
times, the fatigue strengths for 14S-T6 and 24S-T4 are almost the same.
The fatigue strength of 75S-T6, however, is much lower, especially at 10
cycles. The curves for 75S-T6 are much flatter in the low stress-ratio re-
gion, for long life, a fact which emphasizes, again, the serious effect that
a small vibration stress may have on the allowable mean strength of this
material.
In Fig. 67b, constant-life curves for 14S-T6 and 24S-T4 are diagram-
med for specimens with an intermediate notch (Kt = 2.4). At 104 cycles,
the fatigue strength of 14S-T6 is slightly lower than that of 24S-T4. How-
ever, at 107 cycles the strengths are almost identical. Fig. 67c shows the
fatigue strengths of the three materials for the sharp notch (Kt = 3.4) speci-
mens. Here the strength of 24S-T4 is the highest with 14S-T6 and 75S-T6
following in that order. At 107 cycles, the fatigue strengths of all three
materials are practically the same. Since the fatigue strengths of the un-
notched specimens of 75S-T6 were so much lower than those of 14S-T6 and
24S-T4 and yet the strengths of the sharp-notched specimens are practically
the same, it seems reasonable to conclude that the stress concentration
effects of the inhomogeneities in the 75S-T6 contribute to the low fatigue of
this material.
WADC TR 52-307, Part I 22
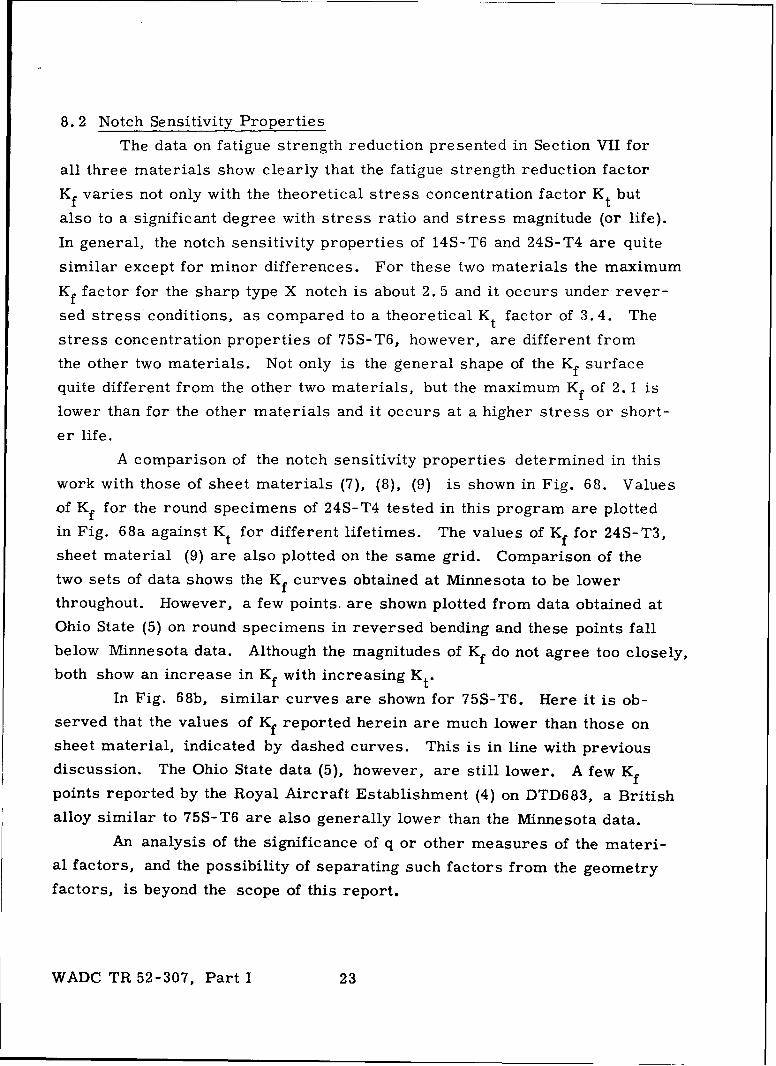
8. 2 Notch Sensitivity Properties
The data on fatigue strength reduction presented in Section VII for
all three materials show clearly that the fatigue strength reduction factor
Kf varies not only with the theoretical stress concentration factor Kt but
also to a significant degree with stress ratio and stress magnitude (or life).
In general, the notch sensitivity properties of 14S-T6 and 24S-T4 are quite
similar except for minor differences. For these two materials the maximum
Kf factor for the sharp type X notch is about 2. 5 and it occurs under rever-
sed stress conditions, as compared to a theoretical Kt factor of 3.4. The
stress concentration properties of 75S-T6, however, are different from
the other two materials. Not only is the general shape of the Kf surface
quite different from the other two materials, but the maximum Kf of 2. 1 is
lower than for the other materials and it occurs at a higher stress or short-
er life.
A comparison of the notch sensitivity properties determined in this
work with those of sheet materials (7), (8), (9) is shown in Fig. 68. Values
of Kf for the round specimens of 24S-T4 tested in this program are plotted
in Fig. 68a against Kt for different lifetimes. The values of Kf for 24S-T3,
sheet material (9) are also plotted on the same grid. Comparison of the
two sets of data shows the Kf curves obtained at Minnesota to be lower
throughout. However, a few points, are shown plotted from data obtained at
Ohio State (5) on round specimens in reversed bending and these points fall
below Minnesota data. Although the magnitudes of Kf do not agree too closely,
both show an increase in Kf with increasing Kt.
In Fig. 68b, similar curves are shown for 75S-T6. Here it is ob-
served that the values of Kf reported herein are much lower than those on
sheet material, indicated by dashed curves. This is in line with previous
discussion. The Ohio State data (5), however, are still lower. A few Kf
points reported by the Royal Aircraft Establishment (4) on DTD683, a British
alloy similar to 75S-T6 are also generally lower than the Minnesota data.
An analysis of the significance of q or other measures of the materi-
al factors, and the possibility of separating such factors from the geometry
factors, is beyond the scope of this report.
WADC TR 52-307, Part I 23

IX. SUMMARY AND CONCLUSIONS
A series of axial stress fatigue tests were undertaken on 14S-T6,
24S-T4 and 75S-T6 to determine the effect of various combinations of alter-
nating and mean stress on fatigue life. The stress range from reversed
stress (from tension to equal compression) to static tension was covered
in several stress ratios. Four types of specimens were studied, an un-
notched type and three circumferentially notched types having theoretical
stress concentration factors of 1. 6, 2.4, and 3.4. Stress combinations
were varied to produce fatigue failure in the range from 103 to 108 cycles.
The basic fatigue data are presented in a series of S-N curves and
stress range diagrams. Since the ratio of unnotched to notched fatigue
strengths varied considerably with stress ratio and stress magnitude (or
life), the fatigue strength reduction factor was plotted as a Kf surface within
two coordinate systems: (a) alternating stress versus mean stress, and (b)
stress ratio versus number of cycles to failure. Alsb the data was partially
analysed to determine the validity of the notch sensitivity index q as an in-
dication of the "material factor. "
The fatigue data procured in this program was compared with pub-
lished data on similar materials.
The following conclusions are based on the fatigue and notch sensi-
tivity data presented in this report.
(a) Static tension tests performed on two types of unnotched speci-
mens and three types of notched specimens indicate an approxi-
mately 25% increase in strength up to a theoretical notch severity
of 2. 5, beyond which a significant reduction occurs. This trend
may be partially explainable on the basis of two opposing factors
introduced by the notch: the weakening effect of stress concen-
trations versus the strengthening effect which the notch offers
in resisting the confinement of reduction in area preceding
fracture.
(b) Based on limited tests, the 100 hour stress-rupture strength of
all specimen types at room temperature are approximately the
same as the static tensile strength.
WADC TR 52-307, Part I 24
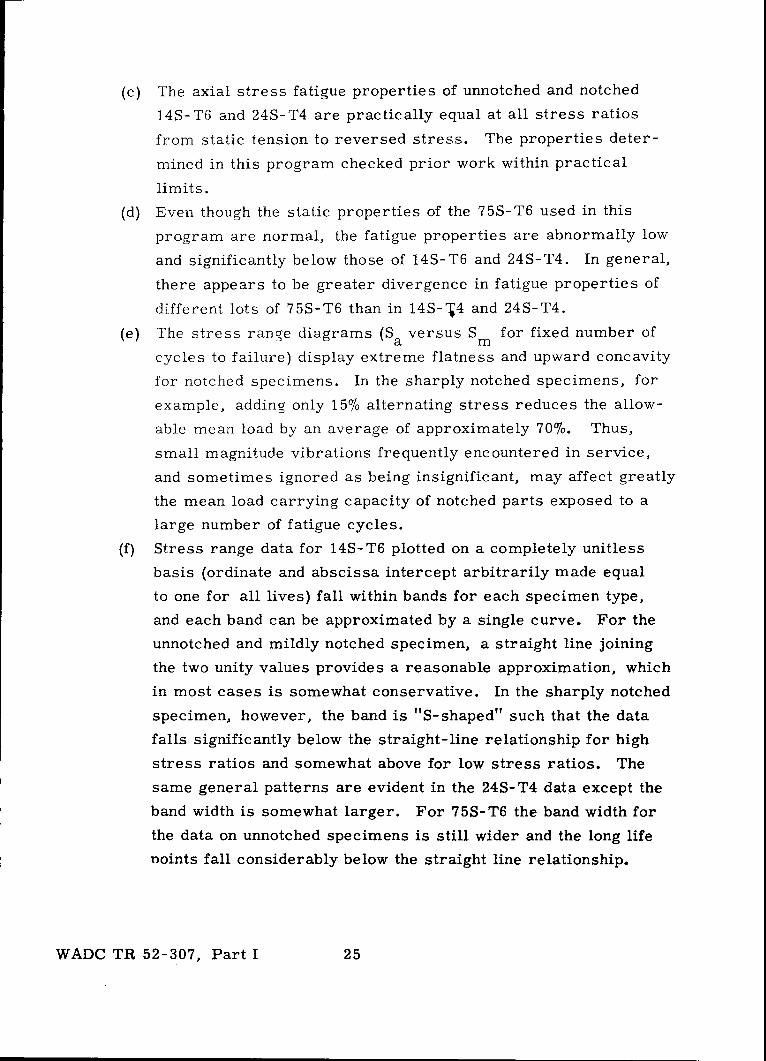
(c) The axial stress fatigue properties of unnotched and notched
14S-T6 and 24S-T4 are practically equal at all stress ratios
from static tension to reversed stress. The properties deter-
mined in this program checked prior work within practical
limits.
(d) Even though the static properties of the 75S-T6 used in this
program are normal, the fatigue properties are abnormally low
and significantly below those of 14S-T6 and 24S-T4. In general,
there appears to be greater divergence in fatigue properties of
different lots of 75S-T6 than in 14S-;4 and 24S-T4.
(e) The stress range diagrams (S aversus S for fixed number ofa mcycles to failure) display extreme flatness and upward concavity
for notched specimens. In the sharply notched specimens, for
example, adding only 15% alternating stress reduces the allow-
able mean load by an average of approximately 70%. Thus,
small magnitude vibrations frequently encountered in service,
and sometimes ignored as being insignificant, may affect greatly
the mean load carrying capacity of notched parts exposed to a
large number of fatigue cycles.
(f) Stress range data for 14S-T6 plotted on a completely unitless
basis (ordinate and abscissa intercept arbitrarily made equal
to one for all lives) fall within bands for each specimen type,
and each band can be approximated by a single curve. For the
unnotched and mildly notched specimen, a straight line joining
the two unity values provides a reasonable approximation, which
in most cases is somewhat conservative. In the sharply notched
specimen, however, the band is "S-shaped" such that the data
falls significantly below the straight-line relationship for high
stress ratios and somewhat above for low stress ratios. The
same general patterns are evident in the 24S-T4 data except the
band width is somewhat larger. For 75S-T6 the band width for
the data on unnotched specimens is still wider and the long life
noints fall considerably below the straight line relationship.
WADC TR 52-307, Part I 25

For all materials in a severely notched condition the data falls
significantly below the straight line relationship at high stress
ratios.
(g) The fatigue strength reduction factor Kf plotted as a surface
within an alternating stress versus mean stress coordinate
system reveals, in general, contour lines which are inclined.
This means that, in general, both alternating and mean stress
significantly affect Kf, although in some regions one type of
stress may be more critical than the other.
(h) For the severely notched specimens at high stress ratios (A
above 0. 25), contour lines are reasonably straight and have an
inclination with the horizontal between approximately 10 to 30
degrees. At low stress ratios in the fatigue failure region, the
slope of the Kf surface is extremely sharp (contour lines close
together), which indicates that adding relatively little alternating
stress to a high mean load greatly increases notch sensitivity.
The peak of the Kf surface extends over a narrow plateau, cover-
ing stress ratios from infinity to approximately 0. 25. The maxi-
mum Kf values observed are 2.4, 2.6, and 2.0 for 14S-T6,
24S-T4, and 75S-T6, respectively, compared with a theoretical
notch sensitivity factor for the severely notched specimens of
3.4.
(i) The specimens of 14S-T6 and 24S-T4 with the intermediate
notch (Kt = 2.4) display approximately the same characteristics
as those of the sharp notch, except that the effects are not so
pronounced. The maximum Kf occurs along a plateau in the Kf
surface extending from stress ratio mc toward a stress ratio of
.15 at low stress magnitude. Maximum values of Kf are 1. 8
for 14S-T6 and 2.2 for 24S-T4.
(j) The mildly notched specimens display approximately the same
type of Kf surface except that the peak is confined to stress
ratios near infinity. The maximum Kf values are 1.3 for both
14S-T6 and 24S-T4 and 1.2 for 75S-T6 compared to a theoretical
value of 1.6.
WADC TR 52-307, Part I 26

(k) In order to more clearly reveal the effects of specimen life,
the K f surfaces were also plotted for each material within a
stress ratio versus number of cycles to failure coordinate
system. Here again the slopes of the Kf contour lines indicate
that both stress ratio and life may be of critical importance,
depending on the region.
(1) In the sharply notched specimens of 14S-T6 and 24S-T4, a cir-
cularly-shaped plateau appears in the Kf surface in the region
of high stress ratio A and long life. For short fatigue lives
the contour lines are essentially horizontal, indicating thatC
stress ratio is considerably more critical than life. Thus, the
addition of small alternating stress to a high mean load criti-
cally affects the stress concentration effect only at long fatigue
life. For the sharply notched 75S-T6 specimens the Kf surface
is similar, in general, to that of the other two materials except
that the plateau is vertically oblong at a shorter life of 104
cycles.
(m) For the intermediate-notch specimens of 14S-T6, the contour
curves have the same general characteristics as for the sharp
notch, except that the effect of life in the short-life region is
not so pronounced, and the maximum Kf extends over a much
wider plateau. For 24S-T4, life has a greater effect on Kf in
the longer-life region, and no definite plateau of maximum
values occurs within the range of life covered by these data.
(n) The Kf surface for the mildly notched specimens of 14S-T6
and 24S-T4 reveals a small circularly-shape plateau at a stress
ratio of infinity, with a rather uniform surrounding slope. For
75S-T6 the maximum Kf is at a stress ratio of infinity, but at
a greater life than for 14S-T6 and 24S-T4.
(o) Plots were made of the notch sensitivity index "q" for the three
types of notch specimens within a mean stress versus alternating
stress coordinate system to determine if q is independent of notch
geometry. As has been established in the past, q is greatly de-
pendent on notch geometry and is not a true material factor even
at a fixed stress ratio.
WADC TR 52-307, Part I 27

(p) The elongation of fractured specimens at various stress ratios
plotted against maximum stress indicates that the elongation is
generally small at all stress ratios if the crest stress is below
the static yield strength. However, when the crest stress ex-
ceeds the yield strength, the elongation becomes increasingly
large with increasing crest stress and decreasing stress ratio.
BIBLIOGRAPHY
1. T. J. Dolan, "Effe~ts of Range of Stress and of Special Notches onFatigue Properties of Aluminum Alloys", NACA TN852, 1942.
2. "Alcoa Aluminum and its Alloys", The Aluminum Co. of America,1950.
3. "Strength of Metal Aircraft Elements", ANC-5, June, 1951.
4. W. J. Taylor and N. J. F. Gunn, "The Effect of Notches on theFatigue Strength of Three Light Alloys", Royal Aircraft EstablishmentReport No. Met. 42, Aug., 1950.
5. J. W. Spretnak, M. G. Fontana, and H. E. 3rooks, "Notched and Un-notched Tensile and Fatigue Properties of Two Engineering Alloys",Trans. ASM, v. 43, 1951.
6. W. C. Braeggeman, M. Mayer, Jr. and W. H. Smith, "Axial FatigueTests at Zero Mean Stress of 24S-T4 Aluminum Alloy Sheets With andWithout a Circular Hole", NACA TN 955, 1944.
7. H. J. Grover, S. M. Bishop, and L. R. Jackson, "Fatigue Strengthsof Aircraft Materials", NACA TN 2324, 1951.
8. H. J. Grover, S. M. Bishop, and L. R. Jackson, "Fatigue Strengthsof Aircraft Materials", NACA TN 2389, June, 1951.
9. H. J. Grover, W. S. Hyler, and L. R. Jackson, "Fatigue Strengthsof Aircraft Materials", NACA TN 2639, Feb., 1952.
10. B. J. Lazan, "Dynamic Creep and Rupture Properties of TemperatureResistant Materials Under Tensile Fatigue Stress", Proc. ASTM , v.49, 1949.
11. Wright-Patterson Air Development Center, "Examination of 75S-T6Rods", Report No. WCRTL-R52-1I, Project E-604-307, Feb. 4, 1952.
12. H. Neuber, "Theory of Notch Stresses", Edwards Brothers, Ann Arbor,Mich., 1946.
WADC TR 52-307, Part I 28

13. B. J. Lazan, "Fatigue Testing Machine", Machine Design, May, 1947.
14. University of Minnesota, "Annual Report on Dynamic Mechanical Pro-perties of Temperature Resistant Materials, Members, and Joints",Air Force Contract No. AF-33(038)-18903, March 1, 1952.
15. R. E. Peterson, "Stress Concentration Phenomena in the Fatigueof Metals", Trans. ASME, 1933.
16. C. S. Yen, T. J. Dolan, "A Critical Review of the Criteria for Notch-Sensitivity in Fatigue of Metals", Bul. No. 398, University of IllinoisEngineering Experiment Station, March, 1952.
17. ASTM "Manual on Fatigue Testing", 1949.
18. The Aluminum Company of America, "Fatigue Properties of 75S-T6Rolled-and-Drawn Rod Supplied to Professor Lazan', June 6, 1952.
19. The Douglas Aircraft Company, "Fatigue Strength of 75S-T, Effectof Chromium Segregation", August 20, 1952.
APPENDIX A
DEFINITIONS OF TERMS AND SYMBOLS
The terms and symbols used in this report are defined below. In
general, they are the same notation as used in the ASTM Manual on Fatigue
Testing (17) with a few minor deviations and some extensions.
S -- Static Ultimate Strength.
S -- Instantaneous Principal Stress (tensile stresses considered positive,compressive negative.)
S - Crest Stress - the highest algebraic value of stress in the stressc cycle = S + S .m a
St -- Trough Stress - the lowest algebraic stress in the stress cycle =S -Sm a Sc - St
S -- Alternating Stress - the amplitude of the cyclic stress - c
S - Mean Stress - the algebraic mean of the maximum and minimumm S +St
stresses = c t
A Alternating Stress Ratio - the ratio of the alternating to the meanstress = Sa/sm.
WADC TR 52-307, Part I 29

R Trough Stress Ratio - the ratio of the trough stress to the creststress = St/Sc.
N Fatigue Life - the number of cycles of stress which may be enduredwithout failure for a aiven test condition.
S Cn Crest Fatigue Strength - the highest crest stress that may be enduredcn for a specified number of alternating stress cycles at a given stress
ratio without failure.
S an -Alternating Fatigue Strength - the highest alternating stress that maybe endured for a specified number of cycles at a given stress ratiowithout failure.
Smn Mean Fatigue Strength - the highest mean stress that may be imposedat a given stress ratio for a specified number of alternating stresscycles without failure.
"K t Theoretical Stress Concentration Factor - the ratio of the true maxi-mum stress based on the geometry of a notch to the nominal stress.
"K f Fatigue Strength Reduction Factor - the ratio of the Fatigue Strengthof an unnotched specimen or member to that of a notched specimenor member at the same life and stress ratio.
q Notch Sensitivity Index - a measure of the degree of agreement be-tween Kf and K for a particular specimen or member of given sizeand material = Kf - 1/Kt - 1.
WADC TR 52-307, Part I 30

TABLE I. CHEMICAL ANALYSES OF THE THREE TEST MATERIALS
Alloy Sample Cu-% Fe-% Si-% Mn-% Mg-% Zn-% Cr-% Ti-%
14S-T6 Rod #1 4.20 .50 .83 .76 .40 .00 .00 .05Rod #6 4.19 .51 .81 .78 .40 .01 .00 .05Rod #11 4.22 .50 .83 .78 .41 .01 .00 .05
24S-T4 Rod #2 4.25 .30 .13 .63 1.42 .07 .01 .02Rod #7 4.20 .30 .14 .63 1.46 .07 .02 .02Rod #13 4.17 .30 .13 63 1.49 .07 .02 .02
75S-T6 Rod #1 *1.59 *.32 .15 .03 2.35 *5.60 .26 .05Rod#6 *1.55 *.32 .15 .03 2.40 *5.52 .26 .05Rod #11 *1.63 *34 .15 .03 2.32 *5.51 .26 .05
*Determinations made chemically. All others made spectrographically.
TABLE II. STATIC PROPERTIES OF 14S-T6
Specimen Tensile . 2% OffsetNo. and Hardness Mod. E Strength Yield Str.
Type RA 10 6 (psi) (ksi) (ksi) Elong.
H 1* 51.5 10.6 14 %/2"H 15* 50.0 10. 71.7 63.7 14 %/2"H 29* 51.5 10.5 71.9 64.4 14 %/2"I 1* 51.5 10.7 71.1 62.4 14 16/2"I 15* 51.5 10.6 71.9 63.5 14 %/2"
I 29* 51.0 10.5 72.2 63.6 13 %/2"J 1* 52.5 10.4 71.4 63.1 13 %/2"J 15* 52.0 10.6 71.6 63.6 13 %/2"-J 29* 51.5 10.5 72.4 63.7 13 %/2"K 1* 51.0 10.6 71.3 63.4 13 %/2"
K 15* 51.5 10.3 71.7 63.7 13 %/2"K 29* 52.0 10.7 71.8 63.4 14 0/2"L 1* 51.0 10.5 71.2 63.4 12 %/2"L 15* 51.5 10.5 71.6 63.4 12 c/2"L 29* 51.0 10.6 71.9 62.9 14 %/2"
M 1* 51.0 10.5 71.8 63.5 13 %/2"M 15* 52.0 10.5 71.8 63.0 14 %/2"M 29* 50.0 10.5 71.6 62.4 14 %/2"N 1* 51.5 11.0 70.6 63.1N 15* 51.0 10.8 71.7 63.4 12 16/2"N 29* 51.5 10.5 71.6 63.4 12 76/2"
Avg.* 51.3 10.5 71.6 63.5 13.6 %/2"
N23-V 73.9 68.3 0. 056"
I25-W** 87.2 0. 044"
Q1484AB 97.4 0. 024"Q1459AB 96.6 0. 020"Average for Type AB Specimens 97.0 0. 022"
M3-x 84.2 0. 016"NI0-X 84.8 0. 021"Average for Type X Specimens 84.5 0. 018"
*Standard ASTM specimen and test."**Previous stress history of 2. 5 x 10⁷ cycles at Sc = 30, 000 psi and A = 0. 89.
***This is based on an equivalent straight length for the type V specimen de-
termined by an integration method.
WADC TR 52_307, Part 1 31

TABLE III. STATIC PROPERTIES OF 24S-T4
Specimen Hardness Mod. E Tensile .2% OffsetNo. and R 6 Strength Yield Str.
Type A 10 (psi) (ksi) (ksi) Elong.
A 1* 47 73.6 48.5 22 %/2"A 15* 48 10.7 73. 1 48.8 21 %/2"A 29* 49.5 10.3 73.7 49.2 21 %/2"B 1* 47 10.7 72.9 48.6 22 %/2"B 15* 48.5 10.7 72.8 48.7 21 %/2"
B 29* 48 10.7 73.6 49.2 22 %/2"C 1* 48.5 10.5 72.4 49.1 21 %/2"C 15* 49 10.7 72.1 48.5 21 %/2"C 29* 49 10.6 73.0 49.2 22 %/2"D 1* 49 10.7 73.6 48.9 22 %/2"
D 5* 48.5 10.7 72.3 48.5 21 %/2"D 29* 49.5 10.6 73.1 49.2 21 %/2"E 1* 49 10.7 72.7 49.0 21 %/2"E 15* 48.5 10.5 72.2 48.3 22 %/2"E 29* 49.5 10.4 72.9 48.5 22 %/2 "
F 1* 47.5 10.8 72.3 47.7 20 %/2"F 15* 49 10.6 72.8 47.6 22 %/2"F 29* 49 10.7 72.3 48.1 22 %/2"G 1* 49 10.7 72.5 48.5 22 16/2"G 15* 48 10.7 72.5 48.5 22 %/2"G 29* 49 10.7 73.1 49.2 21 %/2"
Avg.* 48.5 10.6 72.8 48.6 21.4 %/2"
A9-V 74.6 53.6 0. 162"G5-V 74.4 51.3P475-V 73.8
Average for Type V Spec. 74.3 52.5
F3-W 76.3
P1425-AB 87.0 0. 028"P1439-AB 86.0 0. 024"
Average for Type AB Spec. 86.5 0.026"
B4-X 73.2F13-X 72.6D17-X 75.2AI0-X 74.8 0. 027"G17-X 75.0 0. 032"
Average for Type X Spec. 74.2 0. 029"
*Standard ASTM specimen and test, 0. 505" diameter, 2" gage length.
WADC TR 52-307, Part I 32

TABLE IV. STATIC PROPERTIES OF 75S-T6
Specimen Hardness Mod. E Tensile .22% OffsetNo. and R o Strength Yield Str.
Type A 10 (psi) (ksi) (ksi) Elong.
O 1* 55.5 10.5 82.8 72.1 16 %/2"O 15* 56.5 10.3 82.7 71.2 17 %/2"O 29* 56.0 10.3 82.3 70.5 16 %/2"P 1* 57.0 10.4 16 %/2"P 15* 55.5 10.4 82.3 70.3 16 %/2"
P 29* 57.5 10.3 81.7 70.3 16 %/2"Q 1* 56.0 10.3 82.1 70.1 17 %/2"Q 15* 56.0 10.5 82.3 70.5 16 %/2"Q 29* 56.0 10.4 82.1 71.6 17 %/2"R 1* 56.0 10.3 82.7 71.3 17 %/2"
R 15* 56.0 10.4 83.0 71.2 17 %/2"R 29* 56.0 10.4 82.2 71.0 17 %/2"S 1* 56.0 10.4 82.8 70.7 17 %/2"S 15* 56.5 10.3 82.9 71.0 16 %/2"S 29* 56.0 10.4 82.6 71.8 17 %/2"
T 1* 55.5 10.4 82.2 70.5 17 %/2"T 15* 55.5 10.4 82.6 70.3 17 %/2"T 29* 56.0 10.4 81.8 70.8 16 %/2"U 1* 56.0 9.7 82.3 70.8 16 %/2"U 15* 56.0 10.4 82.3 71.1 16.5 %/2"U 29* 56.0 10.5 81.8 70.8 16.5 %/2"
Avg.* 56.0 10.4 82.3 70.9 16.5 %/2"
Q12-V 85.2 75.2T23-V** 84.9 75.2
R28-W 99.2 0. 043"T4-W 98.9 0. 055"
Q24-X 96.5 0.023"Q21-X 96.4
*Standard ASTM specimen and test, 0. 505" diameter, 2" gage length.**Previous stress history of 3. 6 x 10 7 cycles at Sc 20, 300 psi and
A = 0.85.
WADC TR 52-307; Part I 33

TABLE V. EFFECT OF STRESS RELIEF ONHARDNESS AND FATIGUE PROPERTIES
Per Cent**Material Specimen Rockwell B Fatigue Test Change in Scand Heat No. and Before After Stress Sc N to Fail for Same NTreatment Type H. T. H.T. Ratio A (ksi) Kilocycles Due to H. T.
N16-V 83.5 84.4 1.11 68.0 31.6 + 13N12-V 84.0 83.5 2.16 31.0 77.8* 0
SJ16-V 84.1 85.3 00 36.0 158 + 3Sn : Average + 5
SK14-W 81.4 76.2 0.37 50.0 158 10S 1 L8 -W 81.3 81.4 0.89 67.0 7.75 - 4CIO K25-W 81.3 78.5 2.16 40.0 18.7 0
Average 5
L17-X 81.5 81.4 0.15 31.0 24,300* + 3SI10-X 81.9 83.4 0.37 49.0 13.6 + 9
H7 -X 81.5 80.8 0.89 21.0 140 + 8
Average 82.3 81.6 Average + 7
P495-V 77.5 74.5 0.89 70.0 13.6 + 6P494-V 77.3 75.1 0.89 39.0 11,700* + 3
SP481-V 77.5 74.5 OD 39.0 153 + 8Average + 6
n A14-W 75.6 75.6 0.37 48.0 440 0Sn B19-W 76.0 77.5 0.89 37.0 766 + 3
S- A19-W 75.9 75.0 00 39.0 12.5 0
Average + 1
w B7 -X 76.7 73.3 0.89 41.0 8.54 - 5G1O-X 76.4 75.5 4.04 10.0 24,700* 0-C21-X 76.4 77.0 0o 16.3 274 + 8Average 76.6 75.3 CD Average + 1
U5 -V 92.2 92.7 0.37 32.0 447 - 3R16-V 91.2 91.7 0.89 66.0 10.8 + 30
Z 44 S16 -V 93.7 93.7 2.16 26.0 300 + 13
rn Average + 4z I-
>, Q3 -V 89.9 91.4 0.37 44.0 10.9 0M U17-V 90.9 92.7 0.37 25.0 100 + 2
SU-... Q1O-V 91.0 92.6 2.16 13.0 210 - 4Average 91.3 92.5 Average - 1
OVERALL AVERAGE + 2.3*Test stopped before fracture.**This percentage represents the change in fatigue strength of the specimen
after heat treatment compared to the average fatigue strength at the same life N beforeheat treatment.
WADC TR 52-307, Part I 34
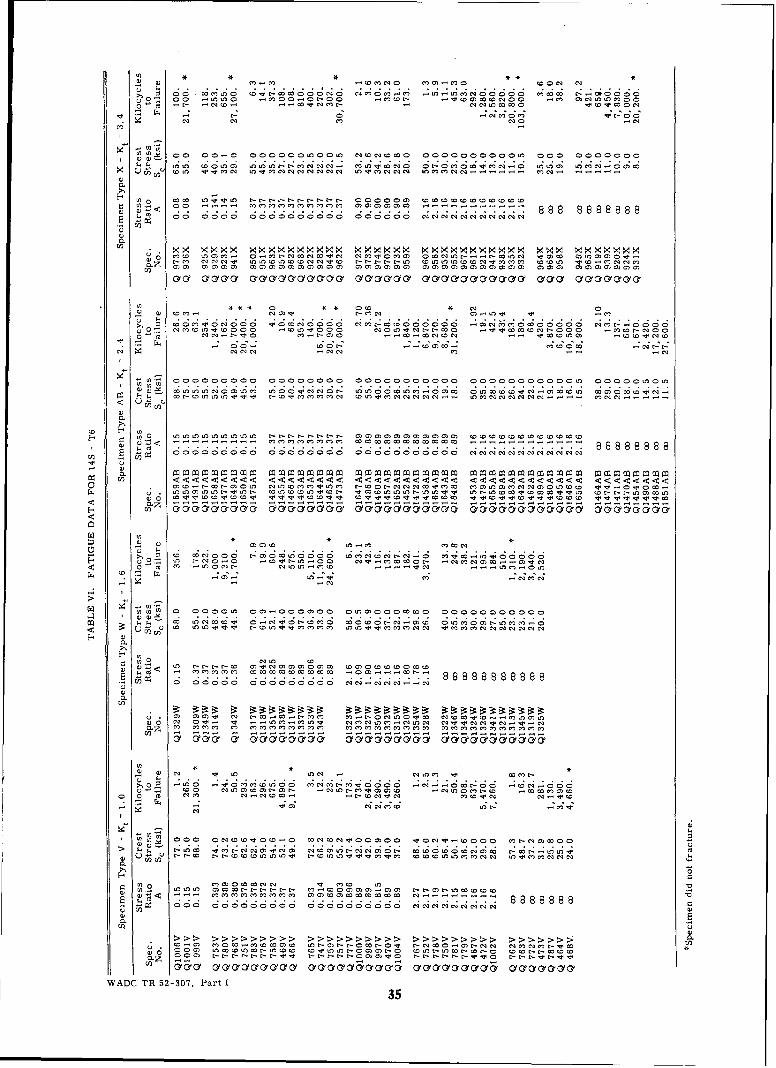
a a C! CC Ci 0
N .- C C) C L:OC06
00~~~~~~~~~~~ 00-0ý oo O o o a, cCý O o O ~~ 0 0 0 0
a cc)C co Cac 1C)OO'Coo'C)- 1CC'0 0ýC-09C! acC! 09C')0 999OC oc!aCOC')-ca
w Q) 60 0000 00000000060 000000C o ~'C')C")Co C Co C' C CoC4 , 888 8
to.xx xxxx xxxxxxxx xxxxxx xxxxxxxx xxx xxxxx
C,. a, a, cacacm acacao, 0m a caaaccc ca, a c caa, 0 )Cm (70 m m C)c
-6 " CD 0 ** ý oc *6ýC ;C ;C Cý 0 " ý 0 00 a)ý C0C C'Ca) C -'l~ 0C O~ m 00'l,
C') C'C'C 'CON' cCm 0*-;a- m w c 6c. 6m6o
C0'~~mm 00000000 0O00 0 00 0 0N0 00 00 00 00 C ---- OOC)----
Sa cn aOCC)ca)' O0''C0- CaOOOC,-~aO~Cc0~c)r-
E 0~S CW OOO)'') -OCCC)O' CO'o1'CO,1~CCCC)'CI' C COw c 8 8 8 8 8 8 8o ýc ý c ý c ý cý c 4 c ý c ýc
-- - -- - -
<
w a)mantn nnný 4ý 2n7:
E. caa--a-coa C'CCCc (COCkCy~ aa-COOe~ac 0, 0, 0, Ge 0, oy C0aCaaCCaC)atoCy ( "*0,(y orCy ,0,C
Ho " 0 0 ýw c ý
c) cO c o c, 0 Cmc o o owo o Co oC Qoo o C'o
.6 cýc - -rCCC 6.ýc
H )
u) 555: 555555 ýNa) W -woCa n ~ O v N
Vo ---- 2--2-2--m--------ý--2---
~~~~~. .-C~ .-C'C~oOC0 .OCCCCOC0 .- C .. O O -0 o C- O0 mo ca caaoca m -Ntoc-C oC ~ca o -c w )Oo -c; CCCcC
oCC o'CCCC Cd' -N -
.OO . . I .. . .
in v)
W .2 m c ~ wC-U2mýwm mm m 007soCCC'.C~a0 C'0CC'~O0 O-CcCO
mm m m .. mmmm oC o owc N----La.~ ~~~~~~~ ~~~~~~~~~~ 8~CC ao-'Cac~oc OSoao-OC)aC 8ocaoo~cC 8aa,~a 8~~~~~~~~c c~ ccC-C6 6 a--C C--OOOC)CL)C COOctCC'CCC eOOOCC)CCCCC cOCC'COCCCIC'OC
aEuH w
>> >> >> >> >>caO>>>CCCCC >>>>>>>>>c.-Cc >-a>ca>CO>t>C >
555c 5ý" "m888888"a)o~o 0am ~ m~ul
L vo
orC Y YYYY(((U ( r( (7~~ >» C? » >(7»» Ce aa) r ea aa a UO
WADC TR 52-307, Part I
35

-.I I ý "~t -~~' M n 0 ' 0ýM t~a-.0 Inc 0w ti v V
8 ~ coo coooo ON o o o o a o ~o omL oooooýo6 U, 66L ;6 ý ;; ý;m ý6 6ý 6L ýý, ý 66c ic, ;c
T-wa n- nvm" l m N0.
0 oo2
ww ooooo0 om2Ow O1C .C' mw C'Cý m w02 .~ .- 0O s -olo
0000 01O O 00)ý 00!0 -O -~0 -~ - ý1 !c
000000 00001 C0 00000 20 2 0 0 00 0 0 00 0 0
D4P U NQ .NN NNa 4N0 lN0 ý P 0 4 N4 . D . D .a .a .a .A
E- r-wocE-~o 0 mo N v m v
0000 0000000 00000 C1 ~ 88888
r n - - - m m m w w-w w
M7 . .o'J~ .* 8 8 8 8
0, 1
0.
co. N N c11.,c N 01 a NN D N 01 a P 4 P NND N D 0N INN 4N
E; z~ 000 00 00 00 00 Uý0 ;4c oCU r
>
0.U . . . . . . .U, 4o2ýE_~ v]'0-0a, v"MmmmmmmO0N~.1 mmmmm""00*m"N1 C013)
0 M7 mm w2.)01O 1'-C20'00 w010110C1C1 C!~-0--0 - (001.m666 66 666666666 1OC eqo 0CJc,'1. CNNO 1J0 0C4 C' C'JC11 0Cl . C' 0 2 cq8N(882C'881 88
o w
aýýmw mmm
00 -coo2 oN c2 -
- Q co D(Nr 0 o mv
w LýCý CýCa
ýj .mo ýý w o-.g n*ov-o awýn ý o m m
w va m C M 1-----!o l ý8888888888882 ý 6 6 6 6 6 6 6 6 6 6 ý"NNC 4ctn2
WADC TR 52-307, Part 1 36
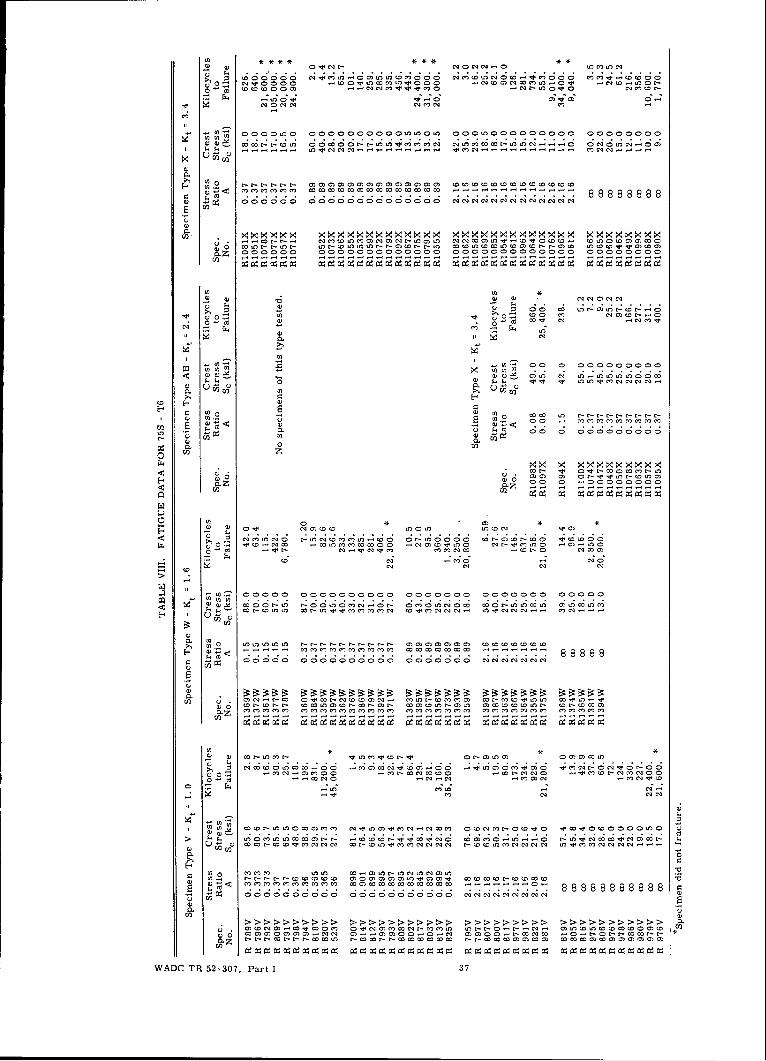
a) 4)
0 0 0 00 0 Loe80 m m 0 00 C1 m " 0-.)ý m)0
0 ý0w
00 0 0 00000U))000 O OC O OO O O 00000000
0)0) L6 6 ;.66C00 L:N ýL C.0C.ýC C.)0) C6 ýNU f0C 0.-.-.-.0 0C.O C ...
V)
w- Z.,4 NN -. tt ý ý2 0 C 0
0; C;C ;C ýC ýC ýr ýC 8 8 888 88 8
000000 00000000000000 xxxC.)C.x x xx x
06&.
0 ) d Cd
P) C)< Q)
0) . 0) 0 '
Q) C
CL M
C).0 M )) ~ )V) z
0x x
(n (n C4 84 w8 00 w-ým0ýwC
0D -W C.
o.C ý ý C ý t C t -:0;
El U
r C ; ;C;O CO ýC
0 n)
w) co) Lo C)CC mO U m CDm'm
Z C') C') C' C') 0 0
u0 0
'Ir 'IV ~ co 88888a vNm -
0 ~ 0000 000 0000 0 0 0000 0)CC)C)0)C)Cr
r0) L
CL
U2
C',CC0,C t- c )OOCCC - CC wfcO' w ý co m m m M)C.mmO
*2 *WM I~ l w w*lw ww
W D R5 307, Part-LC 1)LC')CC~ 37-C'f
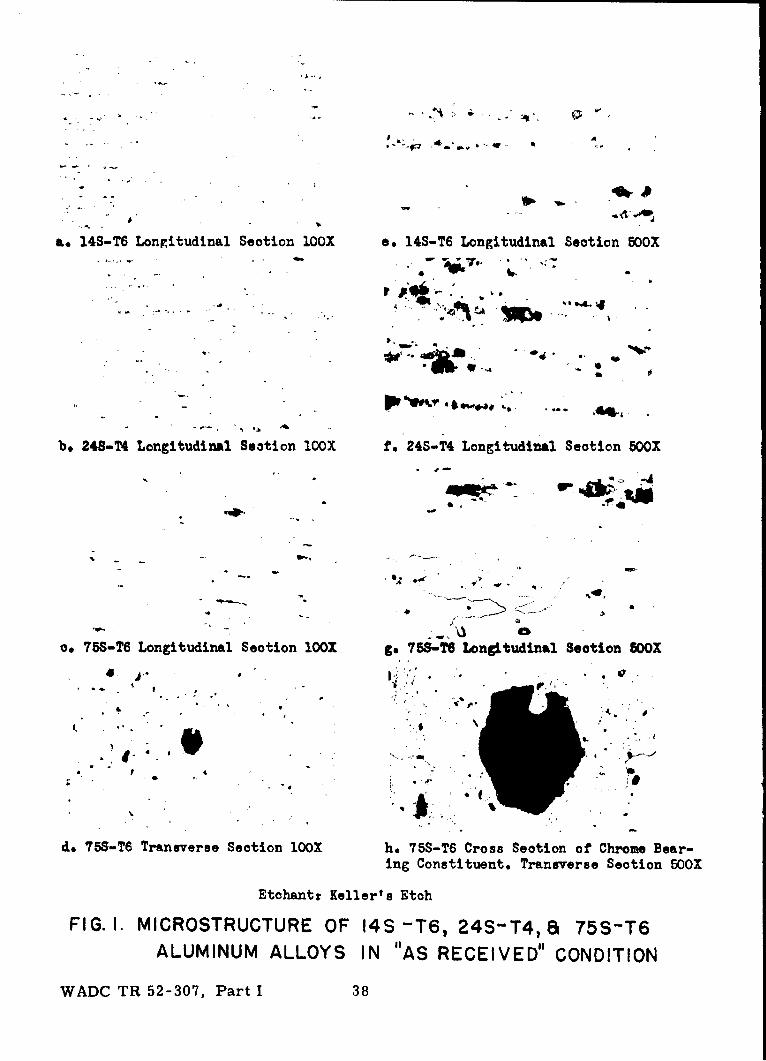
,* +
a. 14S-T6 Longitudinal Section 1OOX e. 14S-T6 Longitudinal Section 500X
q*4k
b. 248-T4 Longitudinal Seation 1OOX f. 24S-T4 Longitudinal Section 50OX
o. 75S-T6 Longitudinal Section 10OX g. 75S-T6 Longitudinal Section 5OOX
--• '. .N 0 . .
,, S
4 . S
d. 755-T6 Transverse Section 10OX h. 75S-T6 Cross Section of Chrome Bear-
ing Constituent. Transverse Section 500X
Etohant: Keller's Etch
FIG. I. MICROSTRUCTURE OF 14S-T6, 24S-T4,a 75S-T6ALUMINUM ALLOYS IN "AS RECEIVED" CONDITION
WADC TR 52-307, Part I 38

71
3U
R D, O. 400"±6 "1".00
HAMFER 45" x 1/16"THREAD 1*- 14 NF-3
LONGITUDINAL POLISHACCORDING TO FATIGUESPECIMEN STANDARDS R-.I 0
i/]SMOOTH MACHINE FINIASH
A (NO POLISHING) Ru .0320
--SMOOTH MAChINE FINISH R".000
DOUBLE SCALE~tt-NOTCHES TO BE CYL. GROUND WITH VERY LOW FINISHING SPEED,
ETCH IDENTIFICATION MARKS ON BOTH ENDS.
SMOOTH MACHINE FINISH ALL OVER.
DIAMETER MUST BE CONCENTRIC WITH THREAD END
WITHIN 0.002 P TOTAL INDICATOR READING.
FIG. 2. UNNOTCHED AND NOTCHED FATIGUE SPECIMENSTYPES V,TWYAB, ANDX.
WAC TR 52-307P Part I 39

W
A
FIG. 3. SPECIMEN NOTCH POLISHING SET-UP
L LK
FIG. 4. DIRECT STRESS FATIGUE MACHINE LI
WADC TR 52-307, Part I 40

FIG. 5. PRELOAD AMPLIFYING FIXTURE FOR LI MACHINE
LL
R
AX
4,4
-- •~ I•J• !
FIG.6. EIGHT-TO-ONE FORCE AMPLIFYING FIXTURE
WADC TR 52-307, Part 1 41

C C
D 1
-F-7
t F
FIG. 7 DIRECT STRESS GRIPS FOR
ROOM TEMPERATURE TESTSWADC TR 52-307, Part 1 42

I60 -1
ELONG. OFPOINT AND LINE CODE A.S.T.M. SPEC.•.!40 ASTM PG
-- O- - 14S-T6 - 12.6 %/2"
I .120 24S-T4 - 2L.4 %/2"z0 75S-T6 16.5 %/2"I- 0'
4 100<I0
z0 .oo \-J .080w
4.060
0_ _
.040f
.020 0.=
0(n
___75S-T6
I'-/
105
z
I74S-T6
U,,
- / 0
SPýEC. 75S-T6
A.ST. SPC.2 4S-T-A.S.T.M.SPEC. 14S-T TYPE V TYPE W TYPE AB TYPE X7 0 t v I i I I l II
1.0 1.5 2.0 2.5 3.0 :3.5
THEORETICAL STRESS CONCENTRATION FACTOR,Kt
FIG. 8. VARIATION OF STATIC ULTIMATE STRENGTH ANDTOTAL ELONGATION WITH TYPE OF SPECIMEN
WADC TR 52-307, Part I 43

so
/ S I OR PECMENSWIT K,3.4SPECIMEN FRACTURED
r c d f
-6 -0 U)
S..4
a - b,c - d ,e- -,
etc. INDICATES CREEP
40 UNDER CONSTANT
SUSTAINED LOAD.
301O 20 50 100 200 500 700
INELASTIC STRAIN - IN. x 10- (LOG SCALE)
F IG. 9. STRESS -STRAIN CURVE FOR 24S-T4 ALUMINUM ALLOY,
UNDER STEP LOADING IN THE INELASTIC RANGE.
5-71.3 1(51
'60 9S7.
50 f__e
201-
zFOR NOTCHED SPECIMEN WITH Kg=3.4
r S-954S
- --- e- S 66&2
5
n M_
4.01 .05 .1 .5 1.0 5 10 50 100 500 1000
TIME IN HOURS (LOG SCALE)
FIG.IO.CREEP-TIME CURVES FOR 24S-T4 AT HIGH STRESSES
WADC TR 52-307, Part 1 44

c, 90O 8O,--
o, g "" • -" --,- "- -,,(, 70 *__
60
-j
0
w
~.40
30
L10%
POINT AND LINE CODE
4 A = GODA = 2.16 --- &----
A = 0.89 -- 01I0 A 0.37 ---- * ...
A 0.15 ----- 0 "-..--A 0.08 ---- - .....-----
10 5 to 5 10 5 5 10 5 10 5 10
NUMBER OF CYCLES TO FAILURE (LOG SCALE)
FIG. II.S-N FATIGUE DIAGRAMS AT VARIOUS STRESS RATIOS FOR Kt. I0SPECIMENS OF ALUMINUM ALLOY 14S-T6
SI --- _-Su ... ... _ _ . . .. ..so_0 __'
. . . • .. 9
70 __--_,
Q. 40_
w 30
n
Io%
0•1P NI AND LINE C0OE ..
x4 0A - -W . .
A 216 -I;I..' IC I A 0 37 ..... -..... .
A 015 ---- 0--..--
9L A ;e ---- -----
1O 5 0 5 0 5 10 5 10 5 10
NUMBER OF CYCLES TO FAILURE (LOG SCALE)
FIG, 12.S-N FATIGUE DIAGRAMS AT VARIOUS STRESS RATIOS FOR Kt= 1.6
SPECIMENS OF ALUMINUM ALLOY 14S-T6.
WADC TR 52-307, Part I 45
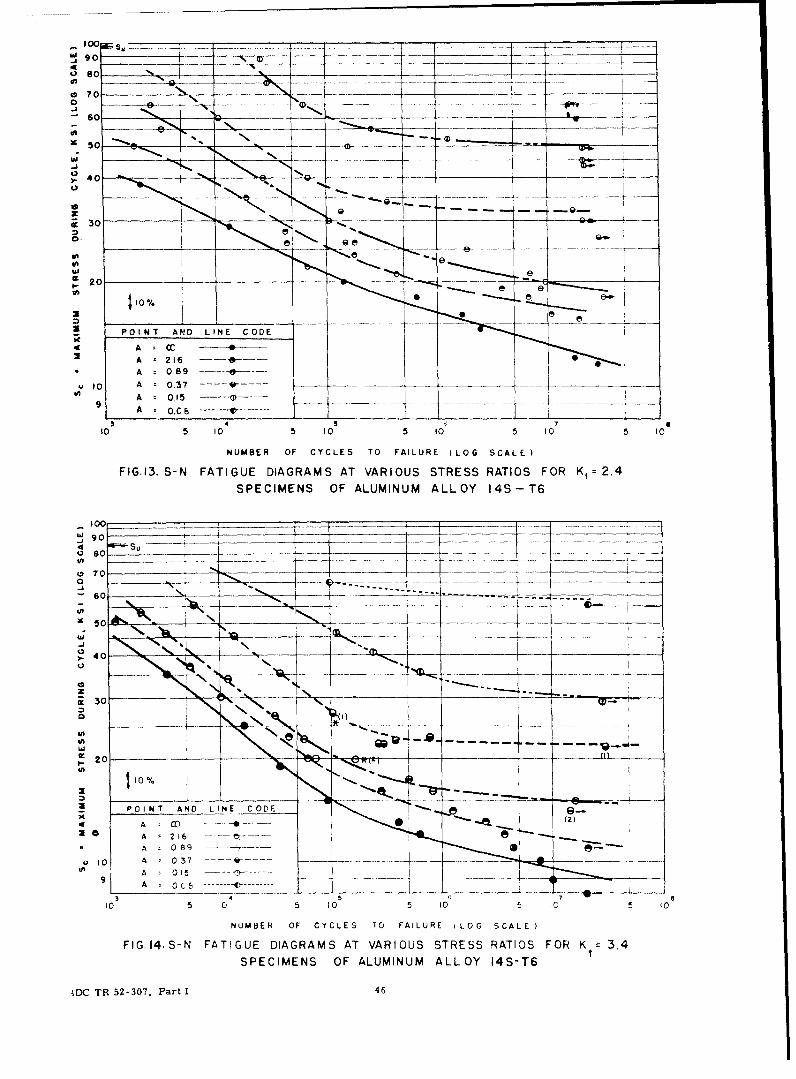
S90 _____ _ _ _ _
0 so
0 CD
20
Iný
A 089 -- 0---
10 A 017 --- ---- _____ ___
9 A 0.15 ------------
A o~c --------- v--------
4 5to 5 10 5 10 5 10 105 0
NUMBER OF CYCLES T0 FAILURE (LOG SCALEI
FIG.I3. S-N FATIGUE DIAGRAMS AT VARIOUS STRESS RATIOS FOR K, 2.4
SPECIMENS OF ALUMINUM ALLOY 14S-T6
4 vw-Su__ _ _ _ __ _ _ _ _ __ __ _ _ __ _ _ _ _ _ _ _a8 so --- -- -----
o70 V60 - --- --- -------- 7(_ _ _ _
_ 04
40
2
A 1
NUAE OF C8L9T ALUELGSAE
NUMBE TR 52-30E, Par FALR 46G SCL

SM/S -l RATIO OF MEAN STRESS TO STATIC ULTIMATE STRENGTH
0 0.1 0.2 0.3 0.4 0.5 0.6 0.7 0.8 0.91 1.0
60 - __FATIGUE STRENGTHS
cb AFTER 103104---.Iog 0-.- CYCLES IDENTIFIED
BY 3,4,---S8, RESP. c
-c-2I -- '~~~~7~a+Se Su I _ -- -....
U) Lu) 40 - - - - - -I
IJJ
VW
200
4.'
0 10 20 30 40 50 60 70 80 90 100
S.m MEAN STRESS KS I(F IG. 15. STRESS RANGE FATIGUE DIAGRAM FOR K 1.0
SPECIMENS OF ALUMINUM ALLOY 14S-T6t
SM/ Su - RATIO OF MEAN STRESS TO STATIC ULTIMATE STRENGTH
O 0.1 0.2 0.3 0.4 0.5 0.6 0.7 0.6 0.9 1.
60 - - -- -- FATIGUE STRENGTHSAFTER 103'104--- log
- -*. CYCLES IDENTIFIEDBY 3,4,---B8, RESP. V
500
IIL-0
4LV
+1U z-8
0 10 20 30 40 so 60 TO 80 90 100 L
S.m MEAN STRESS -KS IFIG. 16- STRESS RANGE FATIGUE DIAGRAM FOR Kim,1.6
SPECIMENS OF ALUMINUM ALLOY 14S-T6.
WADC TR 52-307, Part 1 47

SM uIRATIO OF MEAN STRESS TO STATIC ULTIMATE STRENGTH)
0.0 0.1 0.2 0.3 0.4 0.5 0.6 0.7 0.8 0.9 1.0
60 - -- - -FATIGUE STRENGTHSCV AFER 101,1104-- 10Q
- .... ~ *. CYCLES, IDENTIFIED 1
By 3,4,---B8, RESP. 0
I40w -S +S S
0 wf 1310I I .LfmCc 20t---I
w +mS
10-
00+(n
0 10 20 30 40 5C 60 70 so 90 100
-m MEAN STRESS -KSI
FIG. I7.T STRESS RANGE FATIGUE DIAGRAM FOR K 2.4SPECIMENS OF ALUMINUM ALLOY 14S-T6
s/u-RATIO OF MEAN STRESS TO STATIC ULTIMATE STRENGTH
0.0 0.1 0.2 0.3 0.4 0.5 0.6 0.7 0.8 0.9 1.0-7
60 f FATIGUE STREN~GTHS 8AFTER 103104--- IOD
* . . ICYCLES, IDENTIFIED .6
By 3,4,---8, RESP.
x50 T'-_4
.5
I . r4 .
-514 z
300
x. 20
+1
(.5
0 10 20 30 40 50 60 70 80 90 100 s
Sm~ MEAN STRESS K S I
FIG. 18. STRESS RANGE FATIGUE DIAGRAM FOR K,=3.4
SPECIMENS OF ALUMINUM ALLOY 14S-T6.
WADC TR 52-307, Part 1 48

9 VALUES OF LIFE n1.0
•[" 41)103
M -
w
"U) .8 - •- ---------------------- O
2 7 - - - - - -- ,o
I- Z .5j W
'q M
I-
I,- 4 i---- _ _
L.L .4
ow
P:~ .3 _ _ _ ---
LL ~STRAIGHT LINE RELATIONSHI,,
aD .2 -
0 0
0 .1 .2 3 .4 .5 .6 .7 .8 .9 1.0
S,/ Su (RATIO OF MEAN STRESS TO STATIC ULTIMATE STRENGTH)
FIG. 19.STRESS RANGE CURVES FOR KI=I.O SPECIMENS OF 14S-T6
ALUMINUM ALLOY USING DIMENSIONLESS RATIOS
VALUES OF LIFE n1.0 -...... .
< .9 104
w = .- ------- 106
_j .7 -- - - - - 0
o
I-U .6 7_.z 0
ZIj W-
oW
044
STRAIGHT LINE RELATIONSHIP6 .2 ___
C I0
0 .1 .2 3 4 .5 .6 7 8 .9 1.0
Sm, S, ( RATIO OF MEAN STRESS TO STATIC ULTIMATE STRENGTH)
FIG.20.STRESS RANGE CURVES FOR Kt=l.6 SPECIMENS OF 14S-T6
ALUMINUM ALLOY USING DIMENSIONLESS RATIOS
WADC TR 52-307, Part I 49
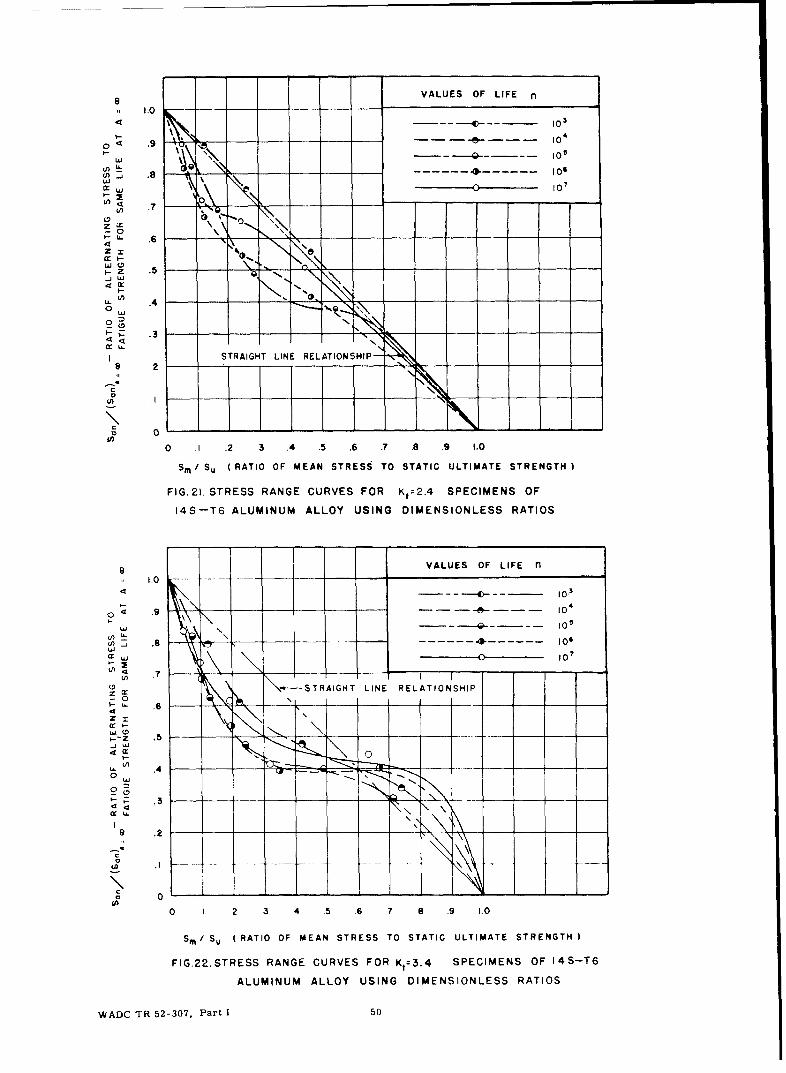
VALUES OF LIFE n
94,, 1.0
'• •,,40 103
0 < .9 .1 --e -4
u *" X Q•@ 105'n .L -s- - -_ - - -- -w-e- - -- -106U' -Z .8( w 0 1O0
L L .
_ .6 5
4i -,z .5
- .4 "--..-
N
.3.
STRAIGHT LINE RELATIONSHIP-a 2
0 .1 .2 3 .4 .5 .6 .7 .8 .9 1.0
Sm/ Su (RATIO OF MEAN STRESS TO STATIC ULTIMATE STRENGTH
FIG. 21. STRESS RANGE CURVES FOR Ktz2.4 SPECIMENS OF
14S-T6 ALUMINUM ALLOY USING DIMENSIONLESS RATIOS
VALUES OF LIFE n
S•C> 10,3
.9 . .. .4-e -- -0
w 105
-J " .8 ~ -- -,. 4----------0~LU 106
\- STRAIGHT LINE RELATIONSHIP-0
.6 _ __ _ _
Z m-
Z 5
0 -- __ ____ 6_9
0L
0 5 .6 7 8 .9 1.0
SI/ Su IRATIO OF MEAN STRESS TO STATIC ULTIMATE STRENGTH)
FIG.22.STRESS RANGE CURVES FOR Kt:3.4 SPECIMENS OF 14S-T6
ALUMINUM ALLOY USING DIMENSIONLESS RATIOS
WADC TR 52-307. Part 1 50

2- 0
6t. 2-0 beU.in
0G. A 2.21.- 0
0 0
CV CD W
0 CA zW-j -i I
4 0. 0
.0 OI 0 \ ýl/ mV 0
0 w > D0
10 I_ 0, x O
z M
z oE0
0,~9 I-L 00 0I, U- Irv0
0 o 00
0 f 0 0 0 00I 100
L !21 N wIF'W o01 ClO.CO)
U. -I
a. I...W>
__ ~ j0o02 zJ
4.
WADC TR 52-307, Part 1 51
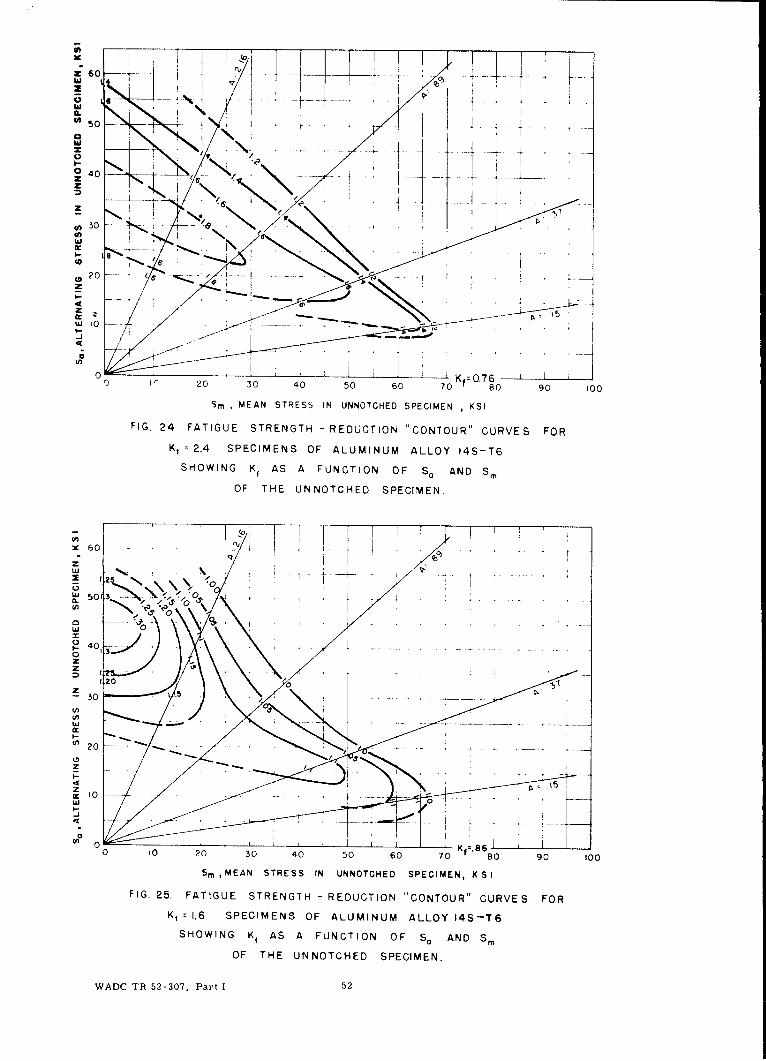
50
z0 40v~-4-
3D 0 "7 I- 41
w I
20
z
i 10 - - - - -
0) 1, 20 30 40 50 60 70 80 90 100
SmMEAN STRESS IN UNNOTCHED SPECIMEN , KSI
FIG. 24 FATIGUE STRENGTH - REDUCTION "CONTOUR" CURVES FOR
Kt 2.4 SPECIMENS OF ALUMINUM ALLOY 14S-T6
SHOWING K~ AS A FUNCTION O F S, AND S
OF THE UNNOTCHED S PE CIME N.
~60 - .
tw500~ N' 0
0
zz
;.20
z3 0
20
z
z~ 10 - - f-uJ
000 10 20 30 40 50 60 70 Kf.680 90 100
Sm MEAN STRESS IN UNNOTCHED SPECIMEN, KS I
FIG. 2-5. FATIGUE STRENGTH -REDUCTION "CONTOUR" CURVES FOR
K, 1.6 SPECIMENS OF ALUMINUM ALLOY 14S-T6
SHOWING K fAS A FUNCTION OF So AND S
OF THE UNNOTCHED SPECIMEN.
WADC TR 52-307, Part 1 52

y 3,V41 )d -lV S3I
z z _____ Ii
IF- 9 IF ' 0 'a - 9- 9,
a 0
oJ 0~
wi V > cr > cr L.> zi C1 0 Z -
: 2 0 L i 0 0 0LO tr o. ra
uJ LL - LA 0 01
o 0 0- Z 0 Oicr~ cr~ 0 U- %
z LL)(o .- I L) Li..
ID )-1 0 1) _J CD Lu (n~
N0 C\0J 2'< o 0Li.] LAD
:) j - 1U- ~~ L 0 L. ~ U) ~t.V~ S3~J. to
Iea.,
'IN 0- 0 0
V, -IV M li
WD TR 5237 Pat15

1,0
6 2
4
(n -4)
10 10 1010
1.0 1. .4 IJ17 . 6V
-6 40
01 o-8 g
-10 1 1 00
103 04 105f06l0
-8 ---------
2 64
10 0s 1.01 1
K,.~~~~~I 1.6 SPCMN FAUINM ALY1STSHWN ~A UCIN7FNADSRS AI
AD -,4 1237 Par 1-5

II z
cn0-
ml)
-j 4u' /
0~F CD wZ~CI M
w j/ > 0
A IIu
01
4/ I
00 0U)~U
to z E
00
0 LL.00
-o 0 0ISoNooooSU3O.NA IS-± N~N~±v 0
WADCTR 5-307 Par I 5
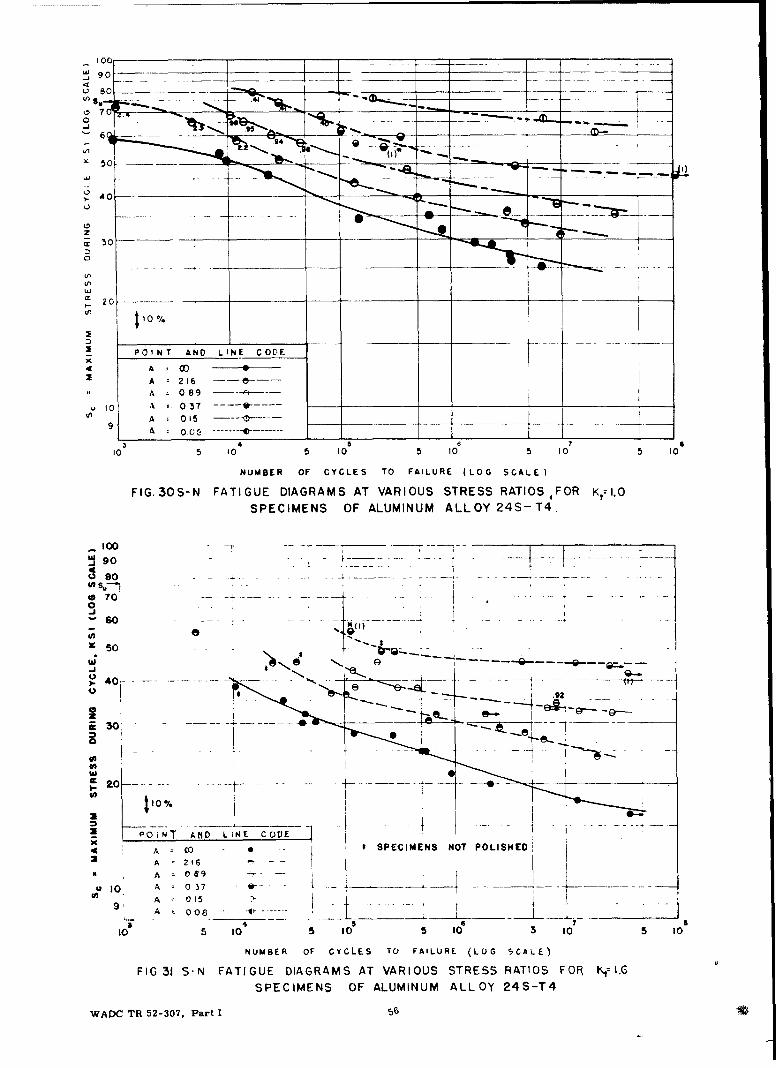
10c
go0__ ___ _ _
so
0
40,
20 ---- _
- POINT AND LINE C O(CF
4A CC)
A 2,16 -e---A 089
10 A 037 ---- W-----
A 015------
0,0c --- -------v----
4 56
10 5 10 5 10 5 10 5 10 5 10
NUMBER OF CYCLES TO0 FAILURE (LOG SCALE)I
FIG.30S-N FATIGUE DIAGRAMS AT VARIOUS STRESS RATIOS 4 FOR K,rI.O
SPECIMENS OF ALUMINUM ALLOY 24S- T4.
90so
0
30
10%
POINýT t.j LIC CVE1
4 A 00 - SPECIMENS NOT POLISHED 1A' 216-
R A 089 -
9' A z o 015_L __
5 4 56 7£
10 5 10 5 1o 5 10 t o 5 10
NUMBER OF CYCLES TO FAILURE (LOG SCALE)
FIG 31 S-N FATIGUE DIAGRAMS AT VARIOUS STRESS RATIOS FOR K,7I.G
SPECIMENS OF ALUMINUM ALLOY 24S-T4
WADC TR 52-307, Part 1 I

s9o_ __ - --i- -
70__ _
50-.
3 0
iu 210%
to A C15 IV
En 4105 1 5 1 105 105 1
NU BE OF C C E o AL R 1_ t L
SPECMNT AND LLUNNU CODE24 T
1 0 C '- _ - _
0 l003 40
505 105 0 05 105 0
NUMBR OFCYCLS ~O FAILNE (OG SALE
40 .2SNFTGEDAGASA AIU TES AISFRK-.
o 7020J
10
2 O T A D IE C L
x (3
91~ A105 _D
NUlM BE R OF -CYCLE S TO FAILURE (LOG SCALE)
FIG.33 S-N FATIGUE DIAGRAMS AT VARIOUS STRESS RATIOS FOR K,: 34SPECIMENS OF ALUMINUM ALLOY 24S-T4.
WADC TR 52-307, Part 1 I
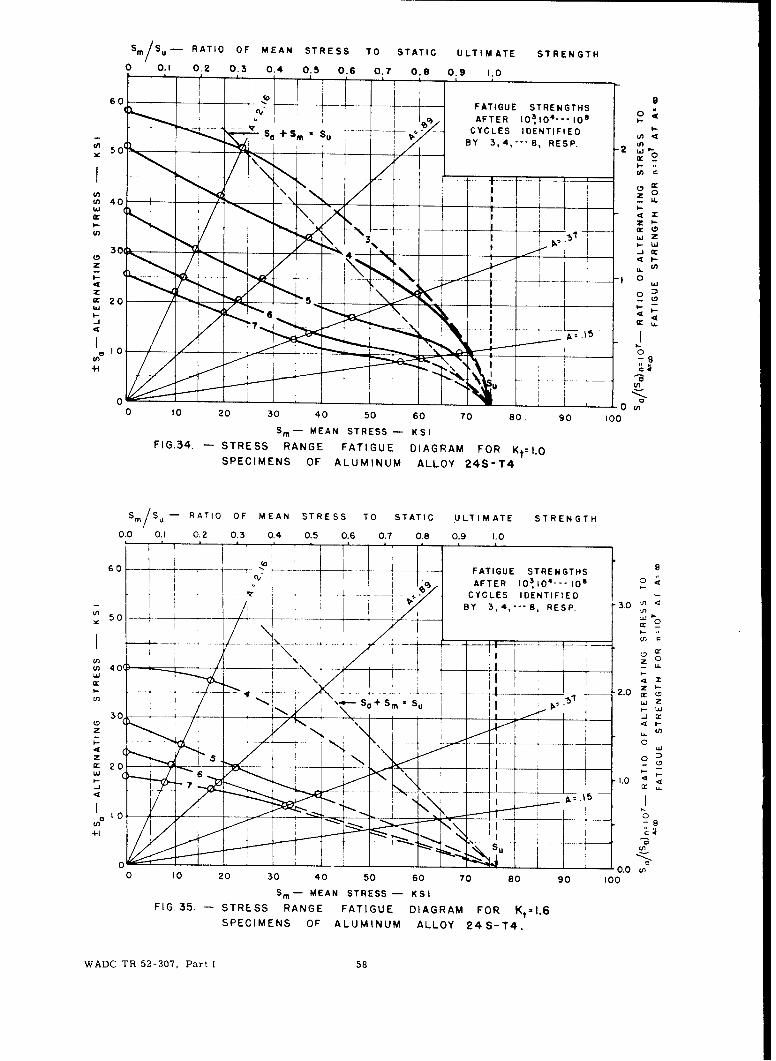
Sm/Su- RATIO OF MEAN STRESS TO STATIC ULTIMATE STRENGTHO 0.1 0.2 0.3 0.4 0.5 0.6 0.7 0.8 0.9 1.0
60 - -FATIGUE STRENGTHS
- AFTER 103104--- 108
so + -v-. S. CYCLES IDENTIFIEDBy 3 4 -- 8 ES .(
cI.-C2 , C
50,
XK II -W
CW
C, cz 0 1,,U,
+1ý
0 10 20 30 40 50 60 70 80. 90 100
m- -MEAN STRESS K S IFIG.34. -STRESS RANGE FATIGUE DIAGRAM FOR Kt~I.O
SPECIMENS OF ALUMINUM ALLOY 24S-T4
Sm/Su - RATIO OF MEAN STRESS TO STATIC UJLTIMATE STRENGTH
0.0 0.1 0.2 0.3 0.4 0.5 0.6 0.7 0.8 0.9 1.0
60 -j---- -FATIGUE STRENGTHSAFTER .1~04--0
____CYCLES IDENTIFIED-~ I Y 3, 4,-- 8, R E SP. 3.0 '
50 -r I
u, 40()- 4T ~ I
I - 2.0 c Lr
S, W
0
I- 15 .0
CA!,
+1
S 0C
00.00 10 20 30 40 50 60 70 80 90 100
S,- -MEAN STRESS -KSI
FIG. 35.- STRESS RANGE FATIGUE DIAGRAM FOR Kt.I.6SPECIMENS OF ALUMINUM ALLOY 24S-T4.
WADC TR 52-307, Part 1 58

Sm/Su ( RATIO OF MEAN STRESS TO STATIC ULTIMATE STRENGTH)
0.0G 0.1 0.2 0.3 0.4 0.5 0.6 0.7 0.8 0.9 1.0
60 FATIGUE STRENGTHSCVO ,104--- 1O8
ý,oý ý!b CYCLES, IDENTIFIED V
50 $1 BY 3,4,---S8, RESP.
5 0
zz
I-3
0 220
+1 "1 S__
0 10 20 30 40 50 60 70 80 90 100
S,- MEAN STRESS -KS I
FIG. 36. -STRESS RANGE FATIGUE DIAGRAM FOR Kt 2.4SPECIMENS OF ALUMINUM ALLOY 2 4S - T4
SSu RATIO OF MEAN STRESS TO STATIC ULTIMATE STRENGTH
0.0 0.1 Q.2 0.3 0.4 0.5 0.6 0.7 0.8 0.9 '.0
60 -]-s--.-- --- f.-- .FATIGUE STRENGTHS 6I - -AFTER 10 3' 1 0 4--- 10 8CYCLES IDENTIFIED L
- pBY 3,4,---B8, RESP.n
x50 J.5 70
=T + -
(n 40 4uc4 Z-\-~ __I ____
UrU) _6_ .. Z_
OM I'+ cm' _ Suu
4- 3 n
zI
_________ 20(__
At 15
O'3(4a.O
0 10 20 30 40 50 60 70 80 90 100
S- MEAN STRESS -KS I
FIG.37. -STRESS RANGE FATIGUE DIAGRAM FOR K t 3.4SPECIMENS OF ALUMINUM ALLOY 24S-T4
WADC TR 52-307, Part 1 59

VALUES OF LIFE n
2 , 1.0.- . - - ------__ __ __ __,o__ _
- -- -- -
S.9 ""0455
U)-
- o_
49 I .- - - - - 1.0
~ .6 - s o-. ,_,.o - ...-....
0 10
S< .7
.4N
9 .3 -~\ . - . - - -
- ~~STRAIGHT LINE RELATIONSHIP-. \
2 - ----r- _
LAl
0 - .2. 3 4 .5 .6 .7 .8 .9 1.0
sm Su RATIO OF MEAN STRESS TO STATIC ULTIMATE STRENGTH
FIG.38. STRESS RANGE CURVES FOR KtzI.O SPECIMENS OF 24S-T4
ALUMINUM ALLOY USING DIMENSIONLESS RATIOS
VALUES OF LIFE nl
I,- 4
En . - - - - - -TI L-I- - - 10
U)m10 0n-J . - -2 3 4 .- -.6-7- --.9-10
00
U, ~_
(0
w
0 U,D
9(D
I STRAIGHT LINE RELATIONSHIPe .2 -
NIN__
0 .2 3 4 .5 .6 7 8 .9 1.0
S,/ S, I RATIO OF MEAN STRESS TO STATIC ULTIMATE STRENGTH)
FIG.39.STRESS RANGE CURVES FOR K?--1.6 SPECIMENS OF 24S-T4
ALUMINUM ALLOY USING DIMENSIONLESS RATIOS
WADC TR 52-307. Part 160

VALUES OF LIFE n
-o 104
oI- 9 .• 0
in _5 ._ _ _ _ _ _ . _ - 1 0_
w- 0- 607
40
iz . .
Z n-
jW
i,icr
\w c
STRAIGHT LINE RELATIONSHIPI8 2 -- TR--GHT-
-
.1 oo 0
0 .1 .2 .3 .4 .5 .6 .7 .8 .9 1.0
S,/ Su IRATIO OF MEAN STRESS TO STATIC ULTIMATE STRENGTH)
FIG.40. STRESS RANGE CURVES FOR Kt= 2.4 SPECIMENS OF 24S-T4
ALUMINUM ALLOY USING DIMENSIONLESS RATIOS
1. VALUES OF LIFE nl
< • f)"1030 1.0 10-
o .10,-- -j .0- - - - IO s
~ 0 107w
z ' .- STRAIGHT LINE RELATIONSHIP-o .6 _
"Z
0- . - I .2 _ .4 .5 . . 8 9 .
F1 .1.T E S A G C R E S F R Kt44 S P C M E S O 2 S T
ow
ALMIU ALO UIN, IESOLESRTO
A .4.3.
9 .2
100 .1 .2 3 .4 .5 .6 .7 8 .9 1.0
S, / Su RATIO OF MEAN STRESS TO STATIC ULTIMATE STRENGTHI
FIG.41.STRESS RANGE CURVES FOR K t=3. 4 SPECIMENS OF 245-T4
ALUMINUM ALLOY USING DIMENSIONLESS RATIOS
WADC TR 52-307, Part 1 61
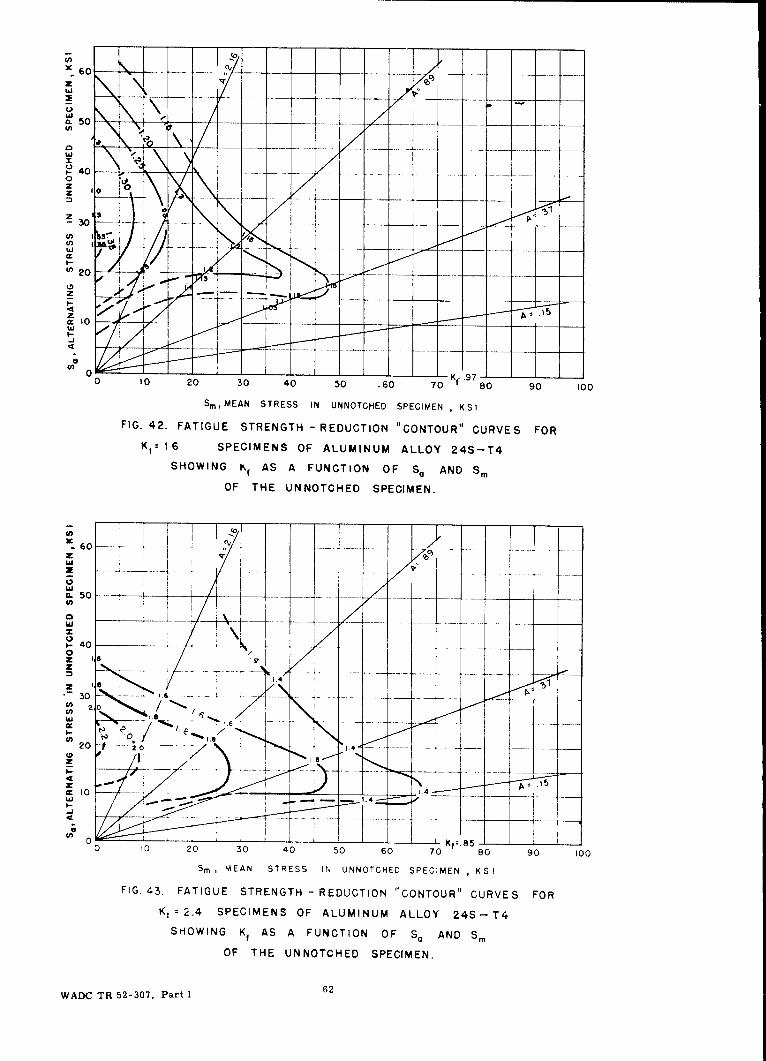
0(
z g
20
0 10 20 30 40 50 .60 70 K 807-- 90 100
Sm,MEAN STRESS IN UNN0TCH~ED SPECIMEN , KSI
FIG. 42. FATIGUE STRENGTH - REDUCTION "CONTOUR" CURVES FOR
KI1 I 6 SPECIMENS OF ALUMINUM ALLOY 24S-T4
SHOWING KfAS A FUNCTION OF S. AND S.
OF THE UNNOTCHED SPECIMEN.
.60
U)
w
z
1.
.0
w'
020 f-20 2 0 4 0 6 0 8 0 0
of EN SRS N UNOCE PCMN ,K
FI.4. F TG E S R N T ED CI N " O T U " C R E O
K1 24 SP CIME S OF ALU INUM ALLO 24S. T
OF, THNTESSI UNNOTCHED SPECIMEN. ,K
WADC TR 52-307, Part 1 62
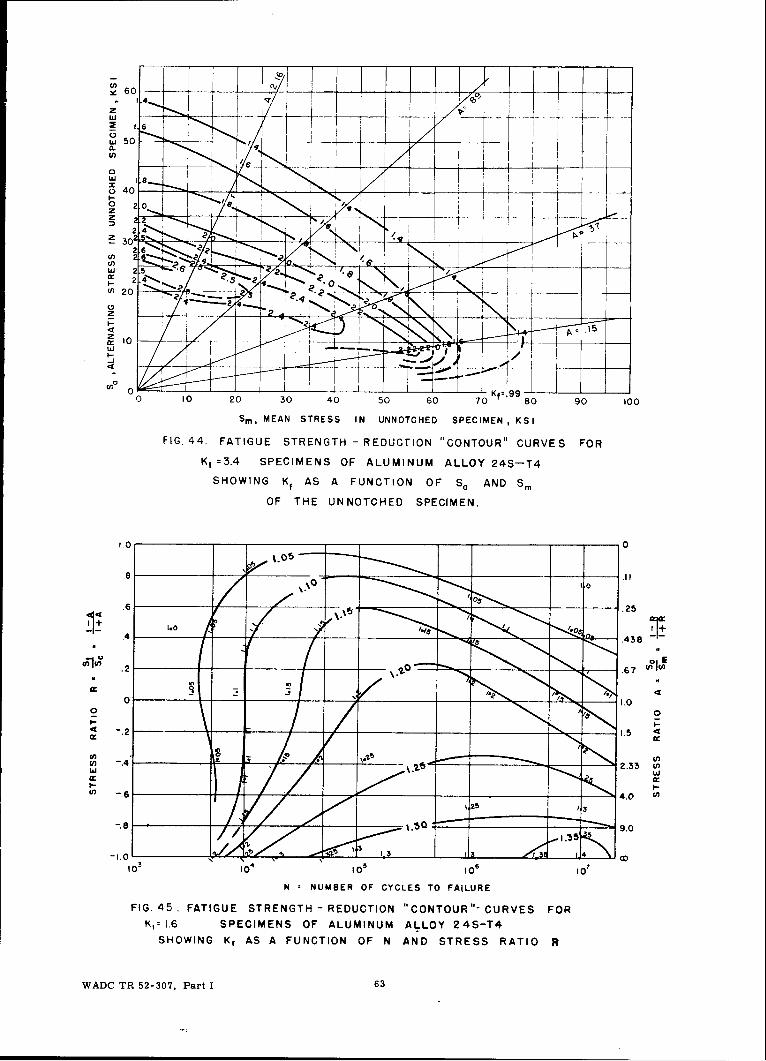
60
z
w8-
40
0 - .z
5,
w 25
-j-
0 10 20 30 40 50 60 70 80 90 100
Sm,, MEAN STRESS IN UNNOTCHED SPECIMEN, KS I
FIG, 44. FATIGUE STRENGTH - REDUCTION "CONTOUR" CURVES FOR
Kf =3.4 SPECIMENS OF ALUMINUM ALLOY 24S-T4
SHOWING K f AS A FUNCTION OF S. AND Sm,
OF THE UNNOTCHED SPECIMEN.
1.0 __ __ _ _ _ 0
.8 .11 _ _ _ __ _ _
.6.2
0 . __ _.0___ _
AN0
-i.0.2 1.5 0 0
Nn * UBROCCE T ALRFIG 45. FATIGU STEGHVRDCIN)CNOR-CRE O
w , 1. PCMN FAUMNMALY2STSHWN m~A UCINO NADSRS AI
WACT 5-0nPatI6

.0 __ _
83
4. - 1 43
.44
0 10
00
(A -4ul wX r
IC5
'~-6 - g. 40
ol 90
-1.0 c
1 104 0 106 0
N NUMBER OF CYCLES TO FAILURE
FIG 46. FATIGUE STRENGTH REDUCTION "CONTOUR" CURVES FOR
K, 2.4 SPECIMENS OF ALUMINUM ALLOY 24S -T4
SHOWING K, AS A FUNCTION OF N AND STRESS RATIO R
1.00
6. _ _ 1 1_
o:f A,0 0
.2 67___ __ _ _
-s1.5
o5
06 4.0
N NUMBER OF CYCLES TO FAILURE
FIG. 47. FATIGUE STRENGTH - REDUCTION "CONTOUR" CURVES FOR
K, = 3.4 SPECIMENS OF ALUMINUM ALLOY 24S -T4
SHOWING Kf AS A FUNCTION OF N AND STRESS RATIO R
WADC TR 52-307, Part 1 64

OD
- - ___ ____ ____- z
I. 4.'q
nIs Y. Z % 4Z
10 ./ 00
a. 0 wCl
Ch .
__ _ _ __0 Cfl l- x
N 0 C
0 0
L 00
uz
00 00ozL z E
IS>4~~~~~~~~~ WNIJOd co0LNr IS~1 N±N31 D
WADCLL TR) 5237zatI6

wj 90 -- _ ,.,._ __ _ _ _ - -- -_ I4 SO-~
o 70 ..-T-,-_--____,_
• o l N - . t
- e __ ____ __
010
40
zS30
1' ~(2e .6
P 0 1 NT AND LINE COCE.
A 216 -
A 089
t , 037 -- - - - - - - -_ _-
A 015------
, 9 t 0 C 8 --- ---- f7-
4 5 7 8;O 5 lo 5 10 5 10 5 10 5 10
NUMBER OF CYCLES TO FAILURE (LOG SCALE)
FIG.49. S-N FATIGUE DIAGRAMS AT VARIOUS STRESS RATICS FOR KI=I.O
SPECIMENS OF ALUMINUM ALLOY 75S-T6.
SI 0 0 _- - --......... -... .. ....... .. .... ... . .....
o 90
o 70 C-o_ _ _ _ --- -- .......
S40
-J-
30O
=i POINT AND LINE CODE
_ _A _ 2.16_-- - -
A 0 89 -- -
1 0 A 0.37 . . ". .A z 0.15 (D
9 A . O .. ... -- -- - v.........
I ,
20 5 10 5 I0 5 _ 0_ 5 _0 5 10
NUMBER OF CYCLES TO FAILURE I(LOG SCALE)
FIG.50. S-N FATIGUE DIAGRAMS AT VARIOUS STRESS RATIOS FOR K,= 1.6SPECIMENS OF ALUMINUM ALLOY 75S-T6
WADC TR 52-307, Part 1 66

o so__ __
o~ 70 -0 _
60 _
50
404
A .9 lac 3
A 0.10 -- D--
9 A 0.08 --- ------ ~--- __________
(0 35 10 45 10 55 106 5 (0 75 10
NUMBER OF CYCLES TO FAILURE (LOG SCALE)
FIG.51 .S-N FATIGUE DIAGRAMS AT VARIOUS STRESS RATIOS FOR Ke3.4SPECIMENS OF ALUMINUM ALLOY 75 S- T6.
Sm/Su - RAT 1 OF MEAN STRESS TO STATIC ULTIMATE STRENGTH
0 0.1 0.2 0.3 0.4 0.5 0.6 0.7 0.8 0.9q 1.0
60 - --- . . ~ - FATIGUE STRENGTHS81, AFTER I~I~-I
CYCLES IDENTFE 3. . - BY 3,4,---8, RESP. "
cn
w0
zz
u) 40
30 -1 c
U00DO 0 0 3 0 0 6 0 0 9 0
-r MENSTES0
0ACT 12-07 Par 30 675 0 0 8 9
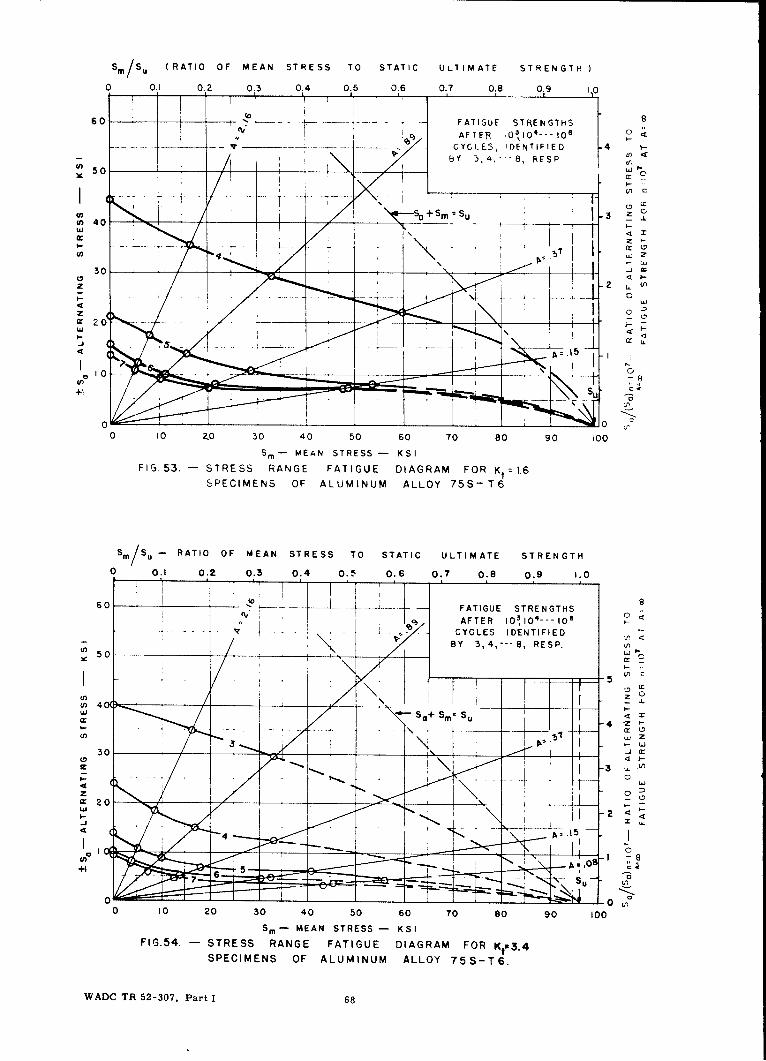
sm/ Su (RATIO OF MEAN STRESS TO0 STATIC ULTIIMATE STRENGTH)
0 0.1 0.2 0.3 0.4 0.5 0.6 0.7 0.8 0.9 I10
60 -t.- ~ . -.- +---FATIGUE STRE14GTHSAF TER 0I D4--- 100
CYCLES, IDENTIFIED -4I4 4 8 3, 4,- 8, R ES P F' <f
-SO+Sm SU I~
z -2 Ln
+1
0 10 2.0 30 40 50 60 70 80 90 100
Sm -MEAN STRESS K KSI
FIG 53. -STRESS RANGE FATIGUE DIAGRAM FOR K~ t1.6SPECIMENS OF ALUMINUM ALLOY 75S-7T6
S/u- RATIO OF MEAN STRESS TO STATIC ULTIMATE STRENGTH
0 0.1 0.2 0.3 0.4 0.5 0.6 0.7 0.8 0.9 1.0
60 7__ - FATIGUE STRENGTHSIb AFTER 0 3 1 0 4--- 10 8
,. CYCLES IDENTIFIED ý-BY 3,4,---B, RESP. V
50 __ _ _ _ _ _ c__
__*--.---4 .
. Lo
I cr
cn 40
30 --- - '
133 <0
0Ir 20
w -2 <
+1 - 5
0 10 20 30 40 50 60 TO 80 90 100
S,- MEAN STRESS -KS IFIG.54. -STRESS RANGE FATIGUE DIAGRAM FOR Kto 3.4
SPECIMENS OF ALUMINUM ALLOY 75S-T6.
WADC TR 52-307, Part 1 68
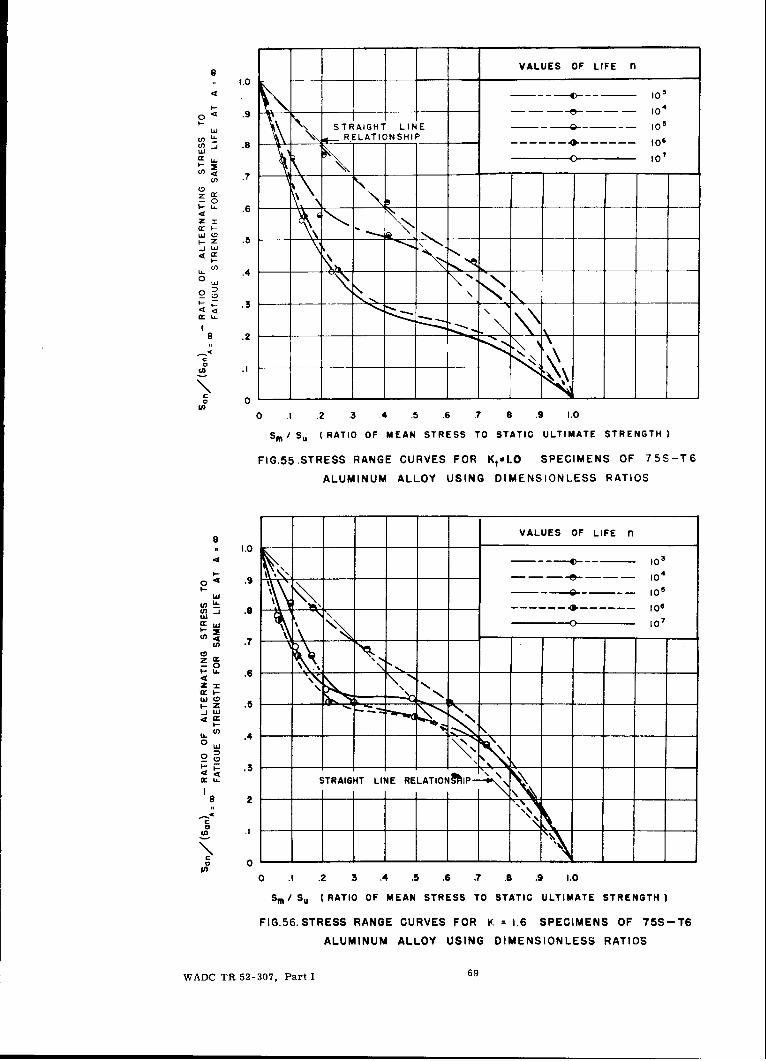
. VALUES OF LIFE nl
1.0-04
w STRAIGHT LINE ____ 105
u. \n RELATIONSHIP____n: .8 -- -_ -_ - --- - toe------0
00
(ng .7-- __b-L. .6 -_ __
u..,...4
o) o
.3.
9 .2 - __ __ _ _
0
0 .1 .2 3 4 .5 .6 .7 .8 .9 1.0
Sm, S, I RATIO OF MEAN STRESS TO STATIC ULTIMATE STRENGTH
FIG.55.STRESS RANGE CURVES FOR KtSLO SPECIMENS OF 75S-T6
ALUMINUM ALLOY USING DIMENSIONLESS RATIOS
1. VALUES OF LIFE nl
.1.0 _0
- - .1&- 10 4tu • • •'IO5o< .9
.8 -- - -- - -- ---- I- o
w _ _ __"_ _0 _IO ?
.7
Z .5
ow
0Lu
w L. STRAIGHT LINE RELATIONhIP
0 ...2
r 00 .1 .2 .3 .4 .5 .6 .7 .8 .9 1.0
S, / Su ( RATIO OF MEAN STRESS TO STATIC ULTIMATE STRENGTH)
FIG.56. STRESS RANGE CURVES FOR K = 1.6 SPECIMENS OF 75S-T6
ALUMINUM ALLOY USING DIMENSIONLESS RATIOS
WADC TR 52-307, Part I 69

1.0- -VALUES OF LIFE nl
- -- - - - 101
o 1 9
uj
'0
-6
z ' 4-STRAIGHT LINE' RELATIONSHIP
'z .5 -
.400
.a
0 1 2 3 4 5 6 7 8 9 10
Sm, Su I RATIO OF MEAN STRESS TO STATIC ULTIMATE STRENGTH)I
FIG 57.STRESS RANGE CURVES FOR K,.3.4 SPECIMENS OF 75S-T6
ALUMINUM ALLOY USING DIMENSIONLESS RATIOS
60
u501,-..-
U.140
40 0 . *~
z 1 2
z 30
.- 'I
1.0
S, MEA STES IN~~~ UN-'TCH- SPCME
FIG.58. FATIGUE STRENGTH - REDUCTION "CONTOUR" CURVES FOR
Kt = .6 SPECIMENS OF ALUMINUM ALLOY 75S-T6
SHOWING K IAS A FUNCTION OF So~ AND S
OF THE UNNOTCHED SPECIMEN
WADC TR 52-307, Part 1 70
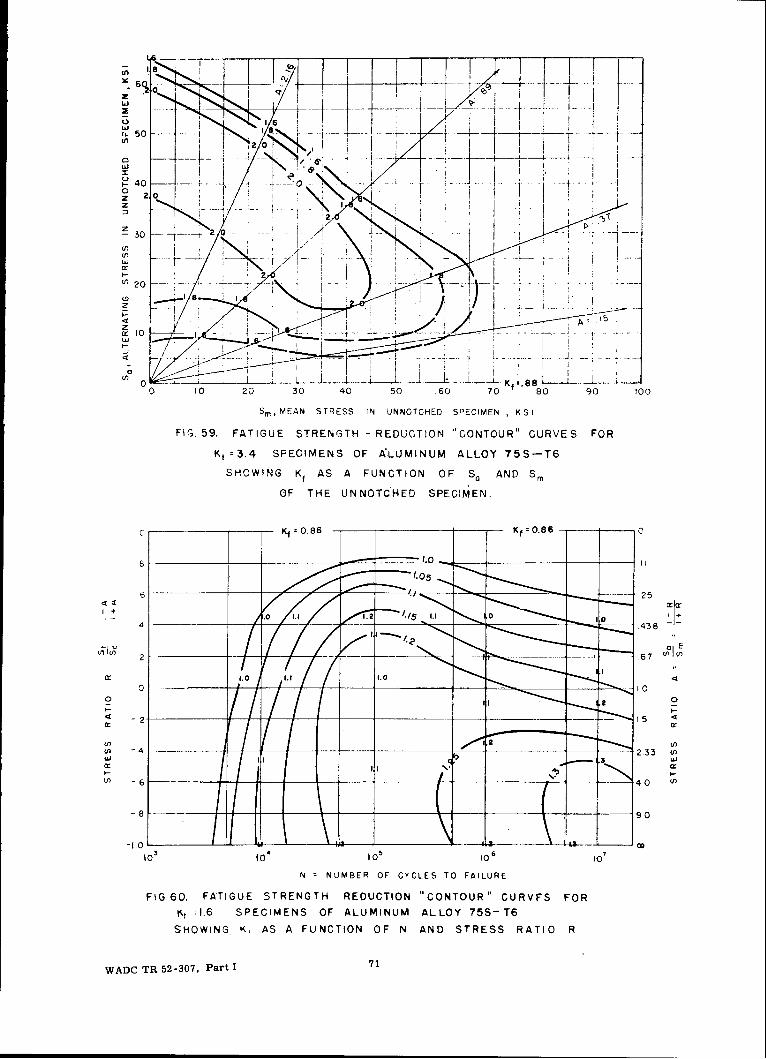
UJ
,a 0
40 0
z 2p
z
w
0 10 20 30 40 50 .60 70 80 90 100
Sm, MEAN STRESS IN UNNOTCHED SPECIMEN , KSI
FIG. 59. FATIGUE STRENGTH - REDUCTION "CONTOUR" CURVES FOR
Kt = 3.4 SPECIMENS OF ALUMiNUM ALLOY 75S-T6
SHOWING KfAS A FUNCTION OF S, AND Sm
OF THE UNNOTCHED SPECIMEN.
Co 5
___ 25
1++
4 43.81.
2' 67 m
o
4r -~ 2_ 15___
(n U(A -4__2____(n
-8 9i 0
N NUMBER OF CYCLES TO FAILURE
FIG 60. FATIGUE STRENGTH REDUCTION "CONTOUR" CURVFS FOR
Kt [I6 SPECIMENS OF ALUMINUM ALLOY 755- T6
SHOWING. K, AS A FUNCTION OF N AND STRESS RATIO R
WADC TR 52-307, Part 1 71
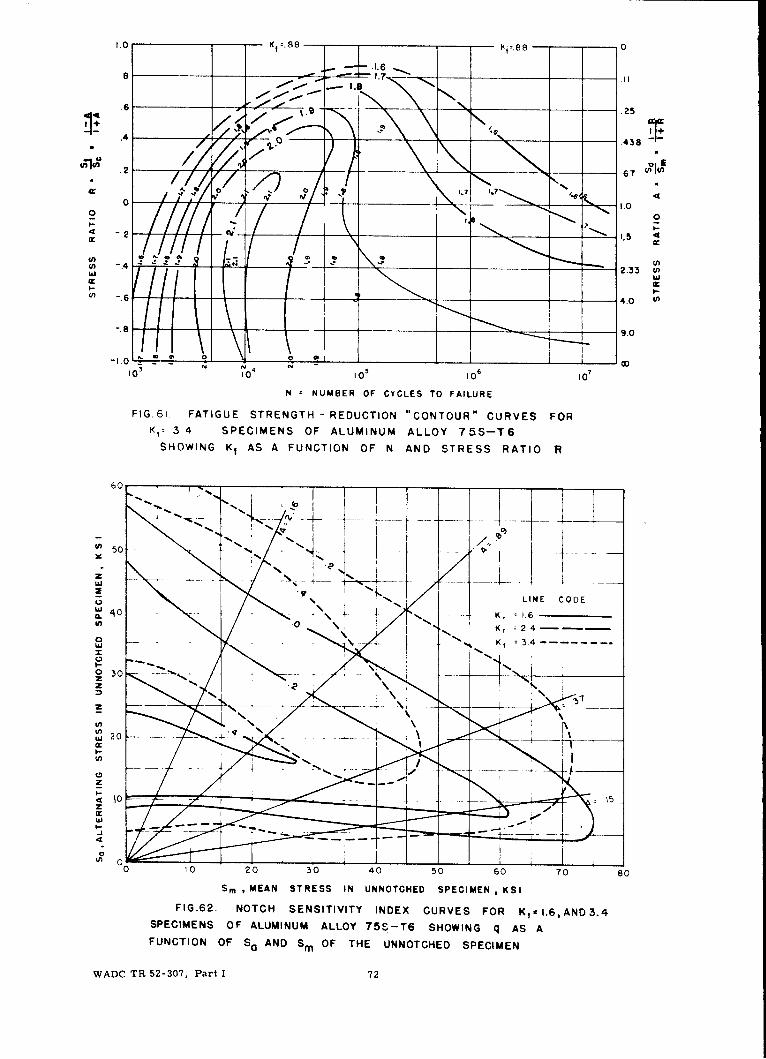
1.0 K f -. 88 0
8 .1.6
.4 .438
.2 / _ _ _ _67
04' ) ~ ___._ 1.0
U) -. 6 4.0
-1 . CID.
N NUMBER OF CYCLES TO FAILUREFIG. 61. FATIGUE STRENGTH - REDUCTION "CONTOUR" CURVES FOR
K,: 3 4 SPECIMENS OF ALUMINUM ALLOY 75S-T6SHOWING Ki AS A FUNCTION OF N AND STRESS RATIO R
60 . I -]
-+ e4
LIECODEW lo
C K, 1I.6U) ~~0 K, ~2 4-----
K 1 5
20
0
z
S0 ~ 10 20 30 40 50 60 70 80
SMEAN STRESS IN UNNOTCI4ED SPECIMEN , KSI
FIG.62. NOTCH SENSITIVITY INDEX CURVES FOR Kt 1~ .6,AND 3.4SPECIMENS OF ALUMINUM ALLOY 75S.-T6 SHOWING q AS AFUNCTION OF S a AND SmOF THE UNNOTCHED SPECIMEN
WADC TR 52-307, Part 1 72

6 -"-
75S-T6 w~4 - l-- -I-
0"
0 10 20 30 40 $0 60 70 80 90 100
18
POINT AND LINE CODE
16 A=2.16 - -- - -
14 A =0.89 -
o A =0.37 --z 12 /_
A =0.15z< O I t
0L 24S-T48 XTr / 1/
D 4 -m /2I-
0 0-
S0 10 20 30 40 50 60 70 80 90 100
z
Z "i"w 14S--T6 , 4
D 4 _ _ _
o
0 10 20 30 40 50 60 70 80 90 100
MAXIMUM STRESS K S I
FIG.63. ELONGATION IN FATIGUE SPECIMENS ATVARIOUS STRESSES AND STRESS RATIOS.
WADC TR 52-307, Part 1 73

POINT AND LINE CODE
0 0.4" ROUND - AXIAL LOAD--UNIV.OF MINN.
0.2" ROUND - AXIAL LOAD -ARL (3)
A 0.3" ROUND - ROTATING BEAM-ARL (3)
B 0.4" ROUND- BSS6L-I-ROTATING BEAM (4)
40 -
B
30 _ __ _ _ __ _ _
U,o•" L ATIGUE LIFE 105~ CYCLES
20to
w
z 0 1 1_ 1_ 1_ 1_ _
z
I,-
F-1 30
B FATIGUE LIFE = I07 CYCLES
10
0 10 20 30 40 50 60 70 80 90
Sm MEAN STRESS- KSI
FIG. 64. COMPARISONS FROM VARIOUS SOURCES OF
FATIGUE STRENGTHS OF UNNOTCHED SPECIMENS
OF ALUMINUM ALLOY 14S-T6.
WADC TR 52-307, Part I 74

POINT AND LINE CODE
60 0 0.4" ROUND-AXIAL LOAD-UNIV. OF MINN.
--- 0.2" ROUND-AXIAL LOAD-ARL (3)
-- -- 24S-T3 - 0.09" SHEET - BATTELLE (7)50 A - 0.3" ROUND-ROTATING BEAM -ARL (3)
C - 0.5" ROUND-REVERSED FLEXURE- OHIO STATE (5)
40 AC D - 0.064" SHEET- REVERSED FLEXURE - ARL (3)E E - 0.58" ROUND - ROTATING BEAM - UNIV. OF MINN.
30
40
20 FATIGUE LIFE
, IO CYCLES
10
30
D 107 CYCLES
10- -
oil,o 10 20 30 40 50 0o 70 8o 90
Sm MEAN STRESS - KSI
FIG.65. COMPARISONS FROM VARIOUS SOURCES OF FATIGUE
STRENGTHS OF UNNOTCHED SPECIMENS OF 24S-T4
ALUMINUM ALLOY
WADC TR 52-307, Part I 75

POINT AND LINE CODE
- -0 0.4" ROUND- AXIAL LOAD- UNIV. OF MINN.
--- 4-- O.2"ROUND--AXIAL LOAD- AR.L.(3)
--- 9 O.09"SHEET-AXIAL LOAD- BATTELLE (7)
A 0.3" ROUND-ROTATING BEAM- A.R L.(3)
C 0.5" ROUND-REVERSED FLEXURE-OHIO STATE(5)
D 0.64" SHEET--REVERSED FLEXURE- A R.L. (3)
F 0. 200" ROUND- FROM MINN. MATERIAL-ARL (18)-- C
A40
C
_ 30 -- __ - _ _30 ' FATIGUE LIFE
1 20U)
w
z 0 _ _ _ _ _
40z
J 30
A FATIGUE LIFE
20 10 CYGLES
00 10 20 30 40 50 60 70 80 90
Sm MEAN STRESS-KSI
FIG. 66. COMPARISONS FROM VARIOUS SOUPCES OF
FATIGUE STRENGTHS OF UNNOTCHED SPECIMENS
OF 7 5 S-T6 ALUMINUM ALLOV
VADC TR 52-307, Part I 76
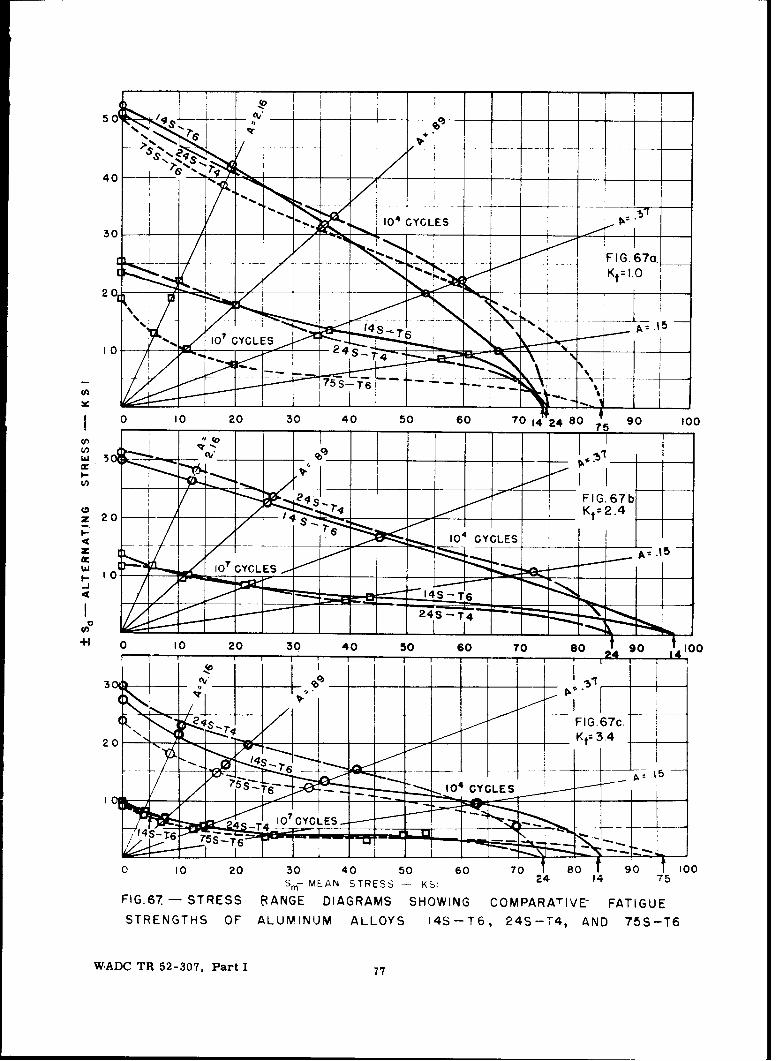
40
F I G.67a
t I3 c
0 90 20 3 40 0 60 70 8Sm MAN STES -. KS:.1
FIG.67 10 CYTESCLES DARMS SOIN OPAAIE AIUSTEGH1FAUINM ALY04-6 25TAD 75T
W~ADCTR 5-307 Par I 1

SI I I i i i i I |I4.0 --- 0- 24S-T4-ROUND-MINN......-71
---. 0---- 24S-T3-SHEET-BATTELLE (9)01"- A 24S-T4 R OUND- REVERSED BENDING
-3.5 -i OHIO STATE (5)
z I -. ,--- - - . -0 -",
P" 3.C - -f-- - - ~ - - - -°---
I I
1f --,_ -,,, - _"_,_________"
I.5
5. II II I 7 I~ _MINN - ___ _
_ '0,"
I -_ 5-_ p
0) 1.5 "". A5
L 4,0 FIGE 680 5 05 60
1.0 1.5 2.0 2.5 3.0 3.5 4.0 4.5 5.0 5.5 6.0
THEORETICAL STRESS CONCENTRATION FACTOR-Kt
S 75S-T6-ROUND-AXIAL STRESS-MINN. O f 275S-T6-SHEET-AXIAL STRESS-BATTERLLE (9)
4.5- 7 5S-T 6 -ROUND-REVERSED BENDING .
o 0 DTD 683-ROUND-ROTATING SENDING
Lo 4.0 - - ROYAL AIRCRAFT (4) -- _
4
04 3.5 - -
-D -b NUMBERS 4,5,6,8a 7Z 2.5-----,-f---- - REFER TO 10 , 10Ill Kt zKi-
cr 10" 8 10' CYCLES
(A RESPECTIVELYw2.0-7-----
IS-. 5--- 3 -.--- FI.68
1.0 1.5 2.0 2.5 3.0 3.5 4.0 4.5 5.0 5.5 6.0
THEORETICAL STRESS CONCENTRATION FACTOR -K 1
FIG. 68 COMPARISON CURVES OF Kf FOR 24S-T4 AND75S-T6 FOR VARIOUS NUMBERS OF CYCLES OF
REVERSED STRESS.
WADC TR 52-307, Part 1 78