fatty acid composition and shelf life of cricket flour
TRANSCRIPT

FATTY ACID COMPOSITION AND SHELF LIFE OF CRICKET FLOUR
Ville Kontio
Bachelor’s thesis April 2017
Degree programme in bioproduct- and process technology Option of process technology

ABSTRACT
Tampereen ammattikorkeakoulu Tampere University of Applied Sciences Degree Programme in Bioproduct- and Process technology Option of Process Technology KONTIO VILLE Fatty Acid Composition and Shelf Life of Cricket Flour Bachelor's thesis 98 pages, appendices 58 pages April 2017
This thesis was made for Finsect Oy to determine the fatty acid composition of their cricket flour product. In addition common packaging methods, use of food additives, and fat extraction were researched to find a prominent way of extending the current shelf life. In theoretical part of this thesis the nutritional content of crickets and the main causes of spoilage were researched to choose the correct procedures for determination of fatty acid composition. The shelf life prolongation methods were researched by investigating the packaging methods, commonly used preservatives and antioxidants in foods, and indus-trial fat extraction procedures that are used by food stuff industry currently. In the practical part the fat extracted from cricket flour was tested using a gas chromato-graph. From the results of the analysis could be acquired the fatty acid composition of cricket fat, early changes in fatty acid composition, and an approximate of fatty acid de-crease rate. Although, the shelf life could not be determined in this work some useful information for future tests was uncovered.
Key words: shelf life, spoilage, preservation

3
CONTENTS
1 INTRODUCTION ............................................................................................. 6
2 CONTENTS OF GROUND CRICKETS .......................................................... 7
2.1 Proteins and amino acids ........................................................................... 7
2.2 Carbohydrates ............................................................................................ 8
2.3 Fats ............................................................................................................. 9
2.3.1 Unsaturated fats ............................................................................. 10
2.3.2 Saturated fats ................................................................................. 10
2.3.3 Trans fats ....................................................................................... 11
2.4 Minerals ................................................................................................... 11
3 SPOILING OF CRICKET FLOUR ................................................................ 12
3.1 Hydrolytic spoilage .................................................................................. 12
3.2 Oxidative spoilage ................................................................................... 12
3.3 Microbial and enzymatic spoilage ........................................................... 14
4 POSSIBLE METHODS OF PRESERVATION ............................................. 15
4.1 Solvent extraction .................................................................................... 15
4.1.1 Extractor types .............................................................................. 15
4.1.2 Extraction solvents ........................................................................ 16
4.2 Use of food additives ............................................................................... 16
4.2.1 Preservatives ................................................................................. 17
4.2.2 Antioxidants .................................................................................. 18
4.3 Packaging ................................................................................................. 19
4.3.1 Vacuum packaging ........................................................................ 20
4.3.2 Modified atmosphere packaging (MAP) ....................................... 21
5 PROCEDURES TO DETERMINE SHELF LIFE .......................................... 22
5.1 Soxhlet extraction .................................................................................... 22
5.2 Acid value ................................................................................................ 23
5.3 Peroxide value .......................................................................................... 23
5.4 Anisidine and Totox value ....................................................................... 24
5.5 Iodine value .............................................................................................. 24
5.6 Gas chromatography mass spectrometry ................................................. 25
5.6.1 Gas chromatography ..................................................................... 25
5.6.2 Mass spectrometry ........................................................................ 25
6 SHELF LIFE DETERMINATION ................................................................. 27
6.1 Sample preparation .................................................................................. 27
6.2 Soxhlet extraction .................................................................................... 28
6.3 Acid, anisidine, iodine and peroxide values ............................................ 29

4
6.4 Gas chromatography-mass spectrometry ................................................. 29
6.4.1 Sample and standard preparation .................................................. 30
6.4.2 Gas chromatograph settings .......................................................... 30
7 RESULTS ........................................................................................................ 32
7.1 Fatty acid composition ............................................................................. 32
7.2 Decrease rate of fatty acids ...................................................................... 33
8 CONCLUSIONS ............................................................................................. 35
REFERENCES ...................................................................................................... 37
APPENDICES ...................................................................................................... 41
Appendix 1. Sample 1, 29.3.2017, GC Analysis ............................................. 41
Appendix 2. Sample 1, 29.3.2017, Integrated peak areas ............................... 42
Appendix 3. Sample 1, 29.3.2017, Library search report................................ 43
Appendix 4. Sample 1, 5.4.2017, GC Analysis ............................................... 53
Appendix 5. Sample 1, 5.4.2017, Integrated peak areas ................................. 54
Appendix 6. Sample 1, 5.4.2017, Library search report.................................. 55
Appendix 7. Sample 2, 5.4.2017, GC Analysis ............................................... 65
Appendix 8. Sample 2, 5.4.2017, Integrated peak areas ................................. 66
Appendix 9. Sample 2, 5.4.2017, Library search report.................................. 67
Appendix 10. Sample 1, 12.4.2017, GC Analysis ........................................... 77
Appendix 11. Sample 1, 12.4.2017, Integrated peak areas ............................. 78
Appendix 12. Sample 1, 12.4.2017, Library search report.............................. 79
Appendix 13. Sample 2, 12.4.2017, GC Analysis ........................................... 88
Appendix 14. Sample 2, 12.4.2017, Integrated peak areas ............................. 89
Appendix 15. Sample 2, 12.4.2017, Library search report.............................. 90

5
ABBREVIATIONS AND TERMS
Adepocytes Animal fat cells
Organoleptic Sensing through odor, flavor, sight, and touch
GC Gas Chromatograph
MS Mass Spectrometer

6
1 INTRODUCTION
It is estimated that by the year 2050 the earth’s population will rise up to over 9 billion
which also means that the need of food will rise also. At the moment 40 % of earth’s land
area is used for food production, therefore, new and more efficient methods of food pro-
duction are needed. Especially in production of protein based foods. (Huldén, 2015, 7)
One auspicious way to fulfill the growing need for protein is insects. Insects are in every
way more efficient source of food than their vertebrated counterparts. This efficiency
consists of 2 things: upholding body heat and the utilizable portion of the body. Insects
do not use energy to uphold their body heat since they are cold-blooded. Also 80 % of
e.g. a house crickets’ (Acheta domesticus) body can be used for food when the number
for cattle is 40 % and for chicken and pork 55 %. (Huldén, 2015, 167-170)
The use of insects in food industry is not yet allowed in the EU-area but it seems that laws
concerning the use of insects for nutritional purposes will be alleviated. The use of insects
in foods will fall under EUs regulation (EC) No 258/97 on novel foods and it will be
applicable for use from 1.1.2018. (European Parliament, 2016, 1)
Finsect Oy is one of the pioneering companies that has brought the cricket production to
Finland and the purpose of this thesis is to determine cricket flour’s current shelf life and
research some promising methods to prolong the shelf life. The greatest problem for shelf
life of ground crickets is fat spoilage, in other words rancidification.
In theoretical part of this thesis different kinds of shelf life prolongation methods are
examined by comparing the use of food additives and possible packaging methods. The
possibility of removing easily spoiling fat is also investigated. Practical part of thesis
consists of testing the current shelf life and determining the fatty acid composition of
house cricket flour.

7
2 CONTENTS OF GROUND CRICKETS
The nutritional content of house crickets varies depending on the source but generally it
is a food with high amounts of protein along with healthy fatty acids, carbohydrates and
essential minerals. A major factor determining the nutritional content is the given feed.
On average 100 g of house cricket flour contains 67.8 g of protein, 5.5 g of carbohydrates
and 5.6 g of fat which adds up to 350 kilocalories in energy. (European Journal of Clinical
Nutrition, 2016, 289; Finsect Oy, 2017)
2.1 Proteins and amino acids
Proteins are a cornerstone of nutrition. They are organic compounds that are comprised
of amino acids and their quality depends on the types of amino acids they consist of. Table
1 presents the 13 amino acids contained in house crickets of which seven are essential for
human metabolism. The essential amino acids for human metabolism are histidine, iso-
leucine, leucine, lysine, methionine, phenylalanine, threonine, tryptophan and valine. In
addition house crickets also contain arginine, cysteine and glutamine which are specified
as a conditionally essential amino acids which are needed during illness or stress. (The
Food and Agricultural Organization of the United Nations, 2013, 68; Nature Education,
2010; MedPlus, 2015)
TABLE 1. Amino acid composition of house crickets (Finke 2002)

8
Proteins are formed from amino acids by peptide bonds. Proteins have multiple purposes
in the cell which is determined by the sequence of different amino acids they comprise
of. In figure 1 is shown the synthesis of proteins from amino acids. (Solunetti, 2006, Pro-
teiinit)
FIGURE 1. Protein formation from amino acids (Jakubowski 2016)
From nutritional point of view proteins are necessary for growth, repair and maintenance
of body. It is estimated that a full grown adult’s need for protein in a day is 0.6- 0.75 g
per kilogram of bodyweight. The body can utilize excess protein intake as energy where
1 g of protein equals to 4 kcal of energy. (British Nutrition Foundation, 2016, Protein)
2.2 Carbohydrates
Carbohydrates in house crickets consist of glucose, in the form of glycogen which is a
multi-branched polysaccharide and it is stored in the adepocytes of house cricket and it
can easily be degraded to glycolytic fuel when needed. The 2 dimensional structure of
glycogen can be seen from figure 2. (Solunetti, 2006, Glykogeeni)

9
FIGURE 2. Structure of glycogen (PubChem 2009)
In animals carbohydrates are formed from sugars and starch to glycogen. It is a vital
source of energy for body’s tissues containing around 3.75 kcal of energy per 1 g. The
daily need of carbohydrates for an average adult is 252g for men and 198 for women.
This covers 47.5 % and 48.3 % of the required daily energy consumption. (British Nutri-
tion Foundation, 2016, Carbohydrates)
2.3 Fats
Fats in house crickets are found in the form of triglycerides (triacylglycerol). Triglycer-
ides are also stored in the adepocytes along with glycogen. They are the most common
form of lipids and act as the energy reserve of animals. (Solunetti, 2006, Asyyliglyserolit)
Triglycerides consist of a glycerol molecule that has esterified with three fatty acid mol-
ecules. The formation and structure of triglycerides is shown in figure 3. The fatty acids
found in house crickets are linoleic-, oleic-, palmitic-, stearic-, palmitoleic-, myristic- and
linolenic acids. Linoleic, oleic palmitic and stearic acids compose the majority of fatty
acids found in house crickets along with smaller amounts of palmitoleic, myristic and
linolenic acids. (Hutchins & Martin, 1968)

10
FIGURE 3. Formation and structure of triglycerides
In addition of being an energy reserve in the body, fats help in the absorption of certain
vitamins and minerals as well as playing a key part in a variety of different bodily func-
tions. Fats can be classified as monounsaturated-, polyunsaturated-, saturated- and trans
fats. Mono- and polyunsaturated fats are considered to be good fats while trans fats are
the most unhealthy option and saturated fats fall somewhere in-between. (Harvard Med-
ical School, 2015)
2.3.1 Unsaturated fats
Unsaturated fats consist of monounsaturated and polyunsaturated fats. They have the least
amount of hydrogen atoms bonded to carbon chains. Unsaturation refers to double bonds
between carbon atom, therefore, it is not saturated with hydrogen atoms. Unsaturated fats
are usually in liquid form at room temperature. Unsaturated fatty acids found in house
crickets are linoleic-, linolenic-, oleic- and palmitoleic acids. (Harvard Medical School,
2015; Chemra, 2016)
2.3.2 Saturated fats
Saturated fats are solid at room temperature. In saturated fats carbon atoms have bonded
to as many hydrogen atoms as possible which means that there are no double bonds be-
tween carbon atoms. Saturated fatty acids found in house crickets are palmitic-, stearic-
and myristic acids. (Harvard Medical School, 2015; Chemra, 2016)

11
2.3.3 Trans fats
Trans fats are an industrially manufactured type of fat through hydrogenation. Hydro-
genation process saturates the healthy unsaturated fats and oils with hydrogen atoms. This
process is used to prevent rancidity. Trans fats are linked to several life threatening con-
ditions such as heart disease and diabetes. Even 2 % daily calorie intake from trans fats
can raise the risk of heart disease by 23 %. (Harvard Medical School, 2015)
2.4 Minerals
Along with proteins, carbohydrates and fats house crickets also contain a variety of es-
sential minerals and fiber. Of house crickets’ body mass 7 % is comprised of crude fiber
and roughly 3 % consists of minerals such as phosphorus, potassium, calcium, magne-
sium and sulfur. Also in addition to these minerals, smaller amounts of zinc, manganese,
iron, copper, aluminum and sodium can be found. (Defoliart, Nagakagi & Sunde, 1986,
1368)

12
3 SPOILING OF CRICKET FLOUR
Cricket flour can spoil in various ways which are hydrolytic, oxidative, microbial and
enzymatic spoilage. The general spoiling of fats causing unwanted color, flavors and
odors, is commonly referred to as rancidity.
3.1 Hydrolytic spoilage
In hydrolytic spoiling the triglycerides go through hydrolyzation process where the tri-
glyceride molecule breaks, freeing the fatty acids from their ester bonds with the glycerol
molecule. This hydrolytic spoilage of triglycerides is represented in figure 4.
FIGURE 4. Hydrolysis of triglycerides (Nordic Food Lab 2016)
Especially short chained fatty acids can be easily detected in small quantities through foul
smell or taste. The presence of water acts as a catalyst to hydrolytic spoilage. (Mattila,
Piironen & Ollilainen, 2001, 115)
3.2 Oxidative spoilage
Oxidative spoilage results from exposure to oxygen in air. This is the most common type
of spoiling and it consists of three phases which are presented in figure 5. In the initiation
phase lipid free radicals are formed. These free radicals then react with the oxygen in air
forming peroxyl radicals. The peroxyl radicals react with surrounding lipid molecules to

13
form hydroperoxides in propagation phase. In termination phase the free radicals react
with each other to form a wide range of different non-radical compounds such as alde-
hydes and ketones that can be easily detected organoleptically. (World Food Logistics
Organization, 2008, 1-3; Dave & Ghaly, 2011, 490-491)
FIGURE 5. Process of oxidative spoilage (Nordic Food Lab 2016)
The oxidation process is affected by many factors. In the initiation phase light, heat, metal
ions or enzymes can work as a catalyst in the process. Also the fatty acid composition and

14
presence of antioxidants as well as prooxidants in the product have an effect on the oxi-
dation process. Oxidative spoilage affects the product’s flavor, odor, color, composition
and nutritional value and can even produce toxic compounds. . (World Food Logistics
Organization, 2008, 1-3; Dave & Ghaly, 2011, 490-491)
3.3 Microbial and enzymatic spoilage
Microbial spoilage is caused by microorganisms like bacteria, mold and yeasts and the
rapidity of spoilage depends greatly on initial shelf life, handling hygiene, storage tem-
perature, and initial amount of microorganisms found in the product. In addition to foul
odor and flavor caused by hydrolytic- and oxidative the bacteria, molds, and yeasts may
cause sliminess, discoloration, souring, and gases. (Garg, Lohani & Umesh, 2009)
Enzymatic spoilage is caused by enzymes that are produced by all living things. Enzymes
can work as a catalyst in spoiling process by speeding up the chemical reactions causing
rancidity. Enzymes can already be found in the product but bacterial growth can produce
enzymes as well. (Garg, Lohani & Umesh, 2009)
Microbial and enzymatic spoilage can be controlled through proper storaging and han-
dling. Low temperatures, lack of air, and hygienic handling of product may extend the
shelf life of product considerably. (Garg, Lohani & Umesh, 2009)

15
4 POSSIBLE METHODS OF PRESERVATION
Prolongation of shelf life of the product can be approached from three different angles
which are: removal of the spoiling ingredient, addition of preserving agent and removal
of external factors.
4.1 Solvent extraction
Different separation methods are widely used in food industry. The general aims of sep-
aration are to better the color or flavor, separate essential ingredients, prolong shelf life,
extract or separate aroma- and coloring agents, salvage byproducts for utilization or
wastewater cleansing. In the process an organic solvent is in liquid form or near its boiling
point so that it percolates through the solid phase dissolving desired compounds. The
solvent is then removed from the product through distillation or vacuum vaporization.
(Hyvönen… 2010, 317)
4.1.1 Extractor types
Extractors are usually categorized on the basis of the depth of the material bed. In figure
6 are presented the three most common types of extractors which are vertical loop extrac-
tor, straight line extractors and round extractors. (Anderson, 2011)
FIGURE 6. Three most common types of solvent extractors (Anderson 2011)

16
Vertical loop extractors have the shallowest bed (0.3-1 m). The shallowness of the bed is
compensated in length which is approximately 50 times as long as it is deep. Due to the
great length of vertical loop extractors they are curved into a loop to save space. In
straight-line extractors the depth of bed is 0.9-1.8m and the length of bed is usually about
15 times the depth of the bed. Round extractors have the deepest beds (1.6-2.9 m). The
round extractor is divided to cells where the material is placed for extraction. (Anderson,
2011)
The solvent extractors are expensive and large industrial machines that also require high
amounts of material and solvent for the process. Some extractors may have a daily ex-
traction capacity for 9000 tons of material which makes it beneficial only when the pro-
duction capacity reaches a certain point. (Anderson, 2011)
4.1.2 Extraction solvents
Extraction solvents used in processing of foodstuffs and food ingredients are highly reg-
ulated. The EU has allowed the use of various different chemicals in solvent extraction
some of which are allowed for all uses in compliance with good manufacturing practices
but the rest have specific conditions of use and maximum residue limits that can be found
in the extracted foodstuffs or food ingredients. Propane, butane, ethyl acetate, ethanol,
carbon dioxide, acetone and nitrous oxides are extraction solvents allowed for all uses.
Dimethyl ether’s condition of use is specified for preparation of defatted animal protein
products and it has a maximum residue limit of 0.009 mg/kg in the final product. (EUR-
Lex, 2009)
4.2 Use of food additives
In Europe food additives are known as E numbers. They have multiple purposes such as
adding or restoring color and prolonging the shelf life of products. The Scientific Com-
mittee on Food (SCF) and the European Food Safety Authority (EFSA) authorize all food
additives that are considered safe for consumption. (Evira, 2016; European Commission,
2017)

17
SCF determines an ADI-value (Acceptable Daily Intake) for all food additives in the EU
area. ADI-value expresses the acceptable amount of specific food additive that is safe to
consume daily through one’s whole life. ADI values are presented as milligrams of addi-
tive per kilogram of bodyweight daily (mg/kg/d). (Mattila, Piironen & Ollilainen, 2001,
184)
4.2.1 Preservatives
Preservatives are chemical agents added to foods that improve their shelf life by prevent-
ing the development and growth of microorganisms, like bacteria, molds and yeasts. Pre-
servatives also help to preserve the flavor and nutritional value of product. (Evira, 2009,
25)
Some common preservatives used in foods are sorbic acid, benzoic acid, propionic acid,
lactic acid, sodium nitrite and sulphurous acid and its salts. Most of the preservatives used
in foods are naturally occurring but they may be chemically produced. In table 2 are listed
all the currently EU allowed preservatives and their E numbers. For shelf life prolongation
of meat products sodium nitrate (E 251) and potassium nitrate (E 252) are commonly used
preservatives. (Louekari, Salminen & Von Wright, 1994, 61-63; Evira, 2009, 26-29)

18
TABLE 2. Currently EU approved preservatives and their E numbers (Food Standards
Agency 2016, edited)
4.2.2 Antioxidants
The food additives preventing the oxidation of fats are called antioxidants which disrupt
the oxidation process by working as an electron or a proton donor to free radicals. Free
radicals are bound to antioxidant creating an intermediate product which leads to stabile
compounds. The working principle of antioxidants is presented in figure 7. In addition to
fat preservation antioxidants also assist the preservation of A-, D-, E- and B2-vitamins.
(Louekari, Salminen & Von Wright, 1994, 66-67; Evira, 2009, 25, 30)
FIGURE 7. Working principle of antioxidants (Chemistry58, 2017)

19
There are 18 antioxidants that are currently EU approved for use in foods which are pre-
sented in table 3. Generally these antioxidants are naturally occurring in various fruits
and vegetables with some exceptions and they can generally be added to all foods where
use of food additives is allowed. Even though antioxidants are naturally occurring they
are usually chemically produced. Probably the most known and used antioxidants are
ascorbic acid and tocopherols, commonly known as C- and E-vitamins. (Evira, 2009, 30-
35; Food Standards Agency 2016)
TABLE 3. Currently EU approved antioxidants (Food Standards Agency 2016)
4.3 Packaging
Packaging prolongs the shelf life of products by removing the effect of external factors
such as oxygen, heat and light which can catalyze the spoiling process of fats. Oxygen
can be removed from the package or it can be replaced with an inert gas that diminishes

20
the oxidation process and growth of aerobic organisms. Effect of heat and light can be
minimized by use packaging materials that have light reflecting or insulating properties.
4.3.1 Vacuum packaging
The vacuum packaging procedure is fairly simple. The product is placed in the package
and then air is removed from the package via suction. Lack of air in the package mini-
mizes oxidative and microbial spoilage. All air cannot be removed from the package in
vacuum packaging which means that small amounts of oxygen is left in it that allows
minor spoilage of the product. (Modified Atmosphere Packaging, 2012)
The preservation effect of vacuum packaging depends highly on the products nutritional
content and storing temperature. For example vacuum packaging may extend the shelf-
life of beef stored in fridge from 2-3 days to 30-40 days. When stored in a freezer at a
temperature of -18 °C the shelf life of meat may be prolonged from 6 months to 24-36
months. (Vakuumikauppa, 2017)
There is a large variety of different vacuum packaging machines ranging from small scale
machines for personal use to large machines for industrial food packaging purposes. The
vacuum packaging machines for personal use are fairly cheap ranging from 50 € to 2000
€. The prices of industrial vacuum packaging machines, shown in picture 1, are upwards
from 500 €.
PICTURE 1. Double chamber vacuum packaging machine (Henkovac 2014)

21
4.3.2 Modified atmosphere packaging (MAP)
Modified atmosphere packaging bases on replacing air to an inert gas in the package. It
is also known as gas flushing, protective atmosphere packaging and reduced oxygen
packaging. (Bergslien…, 2002, 62)
Oxygen, nitrogen and carbon dioxide are the most commonly used gases in modified at-
mosphere packaging. The optimal mixture is comprised of these gases for a specific prod-
uct to enhance its shelf life. For oxygen sensitive foods a mixture of carbon dioxide and
nitrogen is common for their ability to inhibit growth of microorganisms. Oxygen is
added to gas mixture for preserving the red color for meats. (Bergslien…, 2002, 63)
MAP technology is already widely used in the food industry. Usually all meat products
and convenience foods are packed using MAP. In picture 2 is shown a common package
of minced meat packed using MAP technology.
PICTURE 2. Minced meat packed using MAP technology (Atria 2017)
Although MAP has many good qualities it does create some disadvantages such as added
expenses through needed equipment, training, product safety establishment and even
transport costs due to increased pack volume. However, when compared to vacuum pack-
aging MAP does give some liberty when choosing the packaging material and the shape
of the package. (Bergslien…, 2002, 63)

22
5 PROCEDURES TO DETERMINE SHELF LIFE
To determine the shelf life of cricket flour the fat had to be extracted from the product
using soxhlet method. Four different tests for determining oxidative and hydrolytic fat
spoilage were chosen and the decay rate of fatty acids was observed using gas chroma-
tography-mass spectrometry.
5.1 Soxhlet extraction
Soxhlet extraction is a method of solid-liquid extraction where solute is separated from
solid sample with the aid of solvent. In figure 8 is shown that soxhlet extraction apparatus
comprises of 4 main parts: round bottomed boiling flask, extraction chamber, reflux con-
denser and heating mantle. In addition rubber tubing for the reflux condenser and an ex-
traction thimble for the sample are needed. (SFS-EN 1528-2:1996; Royal Society of
Chemistry, 2017)
FIGURE 8. Soxhlet extraction apparatus (Oleoresins 2016)

23
The operational principle of soxhlet extraction is fairly simple. Solvent placed in the boil-
ing flask is heated with heating mantle to its boiling point. Solvent vapor travels to the
extraction chamber where it is condensed and accumulates slowly filling up the chamber.
Solvent dissolves part of the desired compound in the sample. When solvent level in the
extraction chamber reaches a critical point siphon arm empties it back to the boiling flask
and the process starts all over. (García-Ayuso & Luque de Castro, 1998; Royal Society
of Chemistry, 2017)
5.2 Acid value
Determination of acid value is a titrimetric method that allows the monitoring of hydro-
lytic spoilage in fats. Acid value determines the amount of free fatty acids present in the
sample. It is a neutralization titration where acid value implies the amount of potassium
hydroxide in milligrams required to neutralize the free fatty acids. The acid value for still
usable animal fats can be 2.5 at most. (SFS-EN 14104:2003; Nielsen, 2003, 235)
5.3 Peroxide value
Peroxide value defines the ongoing oxidative spoilage. Determination of peroxide value
is an iodometric titration that defines the milliequivalents of peroxide contained in a kil-
ogram of sample. Peroxides created by the oxidative spoiling process are a transient prod-
uct that will continue to react and create stable products. Due to this ephemerality a low
peroxide value may indicate the beginning of oxidation process or advanced oxidation so
it is recommended that peroxide value is determined over a specific time. A product that
hasn’t started to oxidize should have peroxide value of 0 and a peroxide value of over 20
correlates poor quality. (SFS-EN ISO 3960:2017; Mattila, Piironen & Ollilainen, 2001,
116-117; Nielsen, 2003, 237-238)

24
5.4 Anisidine and Totox value
Anisidine value measures the oxidative spoilage of sample. The method determines the
α- and β-unsaturated aldehydes, especially 2-alkenals and 2,4-dienals in the sample. Al-
dehydes react with anisidine producing a chromogen which is then measured with a spec-
trophotometer. The aldehydes measured by this method are the secondary oxidation prod-
ucts of hydroperoxides. For this reason anisidine value determination is a suitable deter-
mination that supplements the determination of peroxide value. (SFS-EN ISO 6885:2016;
Mattila, Piironen & Ollilainen, 2001, 118; Nielsen, 2003, 238)
Totox value predicates the combined amount of hydroperoxides and α- and β-unsaturated
aldehydes present in the sample. Totox value is calculated from the results of anisidine-
and peroxide values. The connection between anisidine-, peroxide-, and totox values is
presented in figure 9. (Nielsen, 2003, 238)
FIGURE 9. Visual presentation of connection between peroxide-, anisidine- and totox
values (Chris Masterjohn 2015)
5.5 Iodine value
Iodine value determines the unsaturation in the sample by measuring the ratio between
the amount of carbon-carbon double bonds and fat. It is defined by the amount of iodine
in grams absorbed by 100 grams of the sample. Iodine absorption increases simultane-
ously with the degree of unsaturation. (SFS-EN ISO 3961:2013; Mattila, Piironen & Ol-
lilainen, 2001, 114; Nielsen, 2003, 233-234)

25
5.6 Gas chromatography mass spectrometry
Gas chromatography mass spectrometry (GC/MS) is a combination of two techniques
which allows the separation, identification and quantification of complex of chemicals. It
is an optimal method for investigating the presence of organic compounds with a rela-
tively low molecular weight. (Bull, 2008; EAG Laboratories, 2017)
5.6.1 Gas chromatography
Figure 10 shows that gas chromatography consists of three parts: injector, column and
detector. Injector injects the sample solution into the inlet of gas chromatography where
it is vaporized. Inert carrier gas then sweeps the vaporized sample into the column which
is located in an oven that keeps it at a constant temperature. Different compounds are
identified according to their retention time which means the time it takes specific com-
pounds to make their way through the column to the detector. Identification occurs by
comparing the retention times of compounds in the sample to the existing database. (EAG
Laboratories, 2017; Opetushallitus, kaasukromatografia)
FIGURE 10. Schematics of a gas chromatograph (Kutztown University 2017)
5.6.2 Mass spectrometry
Mass spectrometry is an efficient method to identify and measure the concentration of
organic compounds. The working principle of MS is shown in figure 11 where the com-
pounds in the vaporized sample are fragmented or ionized with the help of an electron
beam. These ions are then accelerated, sorted according to their masses and directed
through a powerful magnetic field to a detector. The amount of effect the magnetic field

26
has on the ionized molecules course of direction depends on the molecules weight. The
detector can therefore determine the mass and quantity of these ions. (EAG Laboratories,
2017; Opetushallitus, 2017)
FIGURE 11. Working principle of mass spectrometry (Ian Hunt 2017)

27
6 SHELF LIFE DETERMINATION
The house crickets were boiled and dried between 15.3.2017-17.3.2017 and ground to
flour 22.3.2017. After sample preparation the cricket flour was left to be for two weeks
after which the fat was extracted on three different occasions with one week in-between
and the quality was tested.
6.1 Sample preparation
Approximately 200 g of house crickets were acquired for the testing of preservation. The
crickets were prepared by boiling, drying and vacuum packaging until they were ground
in to a fine flour with Kenwood Blend-X Pro blender. Cricket flour was then transferred
into an air-tight glass bottle and it was stored at room temperature in the dark. Glass bottle
was opened only to acquire samples for testing to minimize the cricket flours exposure to
oxygen.
PICTURE 3. Cricket flour prepared for fat extraction (Ville Kontio 2017)

28
6.2 Soxhlet extraction
Fat was extracted from ground house crickets by soxhlet extraction and the extraction
apparatus was constructed according to SFS-Standard. At first three concurrent extrac-
tions were performed to ensure the functionality of soxhlet extraction for this specific
process. When functionality was verified the amount of concurrent extractions could be
decreased. On second time two concurrent extractions were performed and on the third
time only one.
PICTURE 4. Soxhlet extraction apparatus (Ville Kontio 2017)
The apparatus was comprised of a heating mantle, 500 ml round-bottomed boiling flask,
200 ml extraction chamber and a reflux condenser with rubber tubing. 250 ml of diethyl
ether was used as a solvent per extraction. Diethyl ether is an efficient organic solvent
and its low boiling point minimized the negative effects of temperature on the sample.
In every extraction between 20 to 25 grams of sample was placed in the extraction thim-
ble. After the first three concurrent soxhlet extractions it was discovered that circa 60
grams of cricket flour sample yielded approximately 9 grams of fat for testing.

29
6.3 Acid, anisidine, iodine and peroxide values
Acid-, anisidine-, iodine-, and peroxide values were to be tested from the fat extracted
from cricket flour sample. Potassium hydroxide solution (0,1 M) for the acid value deter-
mination and potassium iodate solution needed in peroxide value determination were pre-
pared in advance to hasten the procedures.
However these tests could not be done due to the surprisingly low fat yield of 9 g from
the cricket flour fat extraction. The tests required altogether 45 g of fat sample in order to
be tested (acid value: 20 g, peroxide value: 5 g, anisidine value: 10 g, iodine value: 10 g).
Because of the low fat yield these tests were discarded.
6.4 Gas chromatography-mass spectrometry
To compensate for the discard of acid-, peroxide-, anisidine-, and iodine values GC/MS
(gas chromatography-mass spectrometry) was chosen for the testing of fat spoilage.
GC/MS was chosen for its low requirement of fat sample and accurate measurements to
determine different molecules and their quantity
The GC/MS used in this work was a 6890N Network GC System coupled with 5973Net-
work Mass Selective Detector from Agilent Technologies. GC/MS system was equipped
with an automatic injector.
PICTURE 5. Agilent Technologies GC/MS system (Ville Kontio 2017)

30
6.4.1 Sample and standard preparation
In order to analyze the fat sample acquired from ground house crickets the free fatty acids
were to be freed from triglycerides through hydrolyzation. The free fatty acids were then
esterified to improve the gas chromatographic properties. Standard curve was made by
creating methyl ester compounds from myristic-, palmitic-, stearic- and oleic acids.
On the first tests two different test series were produced to find the optimal way to prepare
the sample for GC/MS analyzation. The first test series was prepared by dissolving 0.1 g
of the sample and standard acids to 2 ml of heptane after which they were tansesterified
with 2 M methanolic solution of potassium hydroxide. The other test series was prepared
by dissolving the sample and standard acids to 2 ml of diethyl ether and esterifying them
with the same 2 M methanolic potassium hydroxide solution. After methylation the solu-
tions were centrifuged at 3000 rpm for 10 minutes to separate methyl esters from rest of
the sample matrix.
After the first GC/MS run it was discovered that in the series of heptane solutions the
standard acids had not been transesterified. In the series of diethyl ether solutions the fat
samples had not been transesterified. For the different solvents used in the test series’ the
results were not comparable.
The incomparability of these series’ meant that a standard curve could not be obtained
for the mass spectrometry to determine the quantity of different compounds found in the
sample. This meant that the decay of fats had to be calculated from the decline of relative
intensity of fatty acid methyl esters contained in the fat sample.
6.4.2 Gas chromatograph settings
The setpoint of oven of gas chromatograph was 40 °C where it was held for 2 minutes
and it was set to heat up 10 °C per minute until it reached the temperature of 260 °C. The
temperature of 260 °C was held for 2 minutes after which the heating rate grew to 50 °C
per minute until it reached the temperature of 300 °C where it was held for 1 minute. The
equilibration time was set at 0.50 min and maximum temperature at 325 °C.

31
The column used was DB-5ms and it was set to be at constant flow of helium. The volume
of helium flow was 1.0 ml per minute where its average flow velocity was 40 cm per
second.
The injector used was Agilent technologies 7683 Series Injector with the syringe size of
10 µl and injection volume was set at 1 µl. Pre injection process consisted of 3 sample
washes, 3 solvent washes with both A and B solvents and 6 sample pumps. After injection
the syringe was washed 3 times in both A and B solvents.
At the inlet of GC the temperature was set to 250 °C at a pressure of 16.4 psi and the total
flow of helium was at 53.7 ml per minute.

32
7 RESULTS
Acid-, peroxide-, anisidine,- and iodine values could not be determined due to low yield
of fat but two different results were acquired from the gas chromatographic-mass spec-
trometric analysis. The decrease rate of fatty acids and the fatty acid composition in
cricket flour. GC/MS analysis provided an explicit determination of fatty acid composi-
tion and the concentration of contents.
7.1 Fatty acid composition
Overall there were no major changes in the fatty acid composition but between 29.3.2017
and 5.4.2017 the amount of oleic acid started to decrease rapidly. Correspondingly elaidic
acid which is a trans isomer of oleic acid had started to occur in the analyses during this
time. Therefore, it could be concluded that oleic acid had started to isomerate into elaidic
acid. The transformation rate of oleic acid to elaidic acid is shown in figure 12.
FIGURE 12. Trans isomeration of oleic acid to elaidic acid
Fatty acid composition was calculated by comparing the average peak area of methylated
products of fatty acids in all GC/MS analyses to the total peak area. In table 4 the average
peak area for each fatty acid methyl ester was calculated from all GC/MS analyses. The
fatty acid composition can be x directly from the fatty acid methyl ester composition since
020000000400000006000000080000000
100000000120000000140000000160000000
29.3.2017 5.4.2017 12.4.2017
Peak
are
a
Date
Trans isomeration of oleic acid to elaidic acid
Oleic acid Elaidic acid

33
they are direct products of fatty acids in cricket fat. The combined values of elaidic and
oleic acid were used to calculate the amount of oleic acid.
TABLE 4. Estimated fatty acid distribution in house cricket fat
Fatty acid methyl esters Average peak area Fatty acid %
Methyl laurate 319070,8 Lauric acid 0,1 Methyl myristate 3820256,4 Myristic acid 0,9 Methyl palmitate 112862075,4 Palmitic acid 25,5 Methyl palmitoleate 7549766,8 Palmitoleic acid 1,7 Methyl linoleate 120526784,2 Linoleic acid 27,2 Methyl oleate 137723053,2 Oleic acid 31,1 Methyl stearate 58102507,8 Stearic acid 13,1 Methyl arachate 2023121,4 Arachic acid 0,5
Total 442926636 100,0
The calculations show that palmitic-, linoleic-, oleic- and stearic acids are the major fatty
acids of house cricket fat with smaller amounts of lauric-, myristic-, palmitoleic-, and
arachic acids. In addition traces of various fatty acids such as ricinoleic-, pentadecanoic-
7,10-hexadecadienoic-, and isoheptanedacoic acids could be found.
7.2 Decrease rate of fatty acids
Decrease of fatty acids presented in figure 12 was acquired from the results of GC/MS
analysis (appendices 1-15). In determining the decrease rate of fatty acids, four major
fatty acid methyl esters were investigated. Table 5 was composed from library report and
integrated peak area values of the four major fatty acids in the sample at three different
dates. The percentual decrease rate of fatty acids was calculated with the average peak
values between tests. Peak area means the concentration of certain compounds found in
the sample. The retention times of compounds remained consistent throughout all
GC/MS analyses.

34
TABLE 5. Peak values of fatty acids and calculated percentual decrease rate
Average integrated area Average 1 Average 2 Decrease rate
Compound 29.3.2017 5.4.2017 12.4.2017 (29.3-5.4) (5.4-12.4) (%/week) Palmitic acid 157147737 136673890 145418070 146910814 141045980 4,0 Linoleic acid 167560150 145851886 154933969 156706018 150392927 4,0 Stearic acid 63119237 54829126 58867525 58974182 56848325,5 3,6 Oleic/elaidic acid 148750700 131314088,5 138618195 140032394 134966142 3,6
Figure 12 is a visual presentation showing the decrease of fatty acids in the fat sample
from the information in table 5.
FIGURE 12. Decrease of fatty acid content over three weeks
0
20000000
40000000
60000000
80000000
100000000
120000000
140000000
160000000
180000000
25.3.2017 1.4.2017 8.4.2017 15.4.2017
Aver
age
peak
are
a
Date
Decrease rate of fatty acids
Palmitic acid
Linoleic acid
Stearic acid
Oleic/Elaidic acid

35
8 CONCLUSIONS
Although the shelf life of cricket flour could not be determined the work did reveal some
useful information on the rate of spoilage, fatty acid composition and quality of fats. The
timespan of 4 weeks was too short for shelf life determination. In the future if acid-, per-
oxide-, anisidine-, and iodine are to be tested at least 300 g of cricket product should be
reserved for a series of tests. Also the timespan for the tests should be extended to 6-12
months for proper results as fat spoilage is shown to be a fairly slow process.
The fat quality of crickets was found to be relatively healthy containing a large portion of
unsaturated linoleic- and oleic acids along with saturated palmitic- and stearic acids. It
can be seen that oleic acid starts to spoil first and quite fast, transforming to elaidic acid
which is a trans fat that causes negative effect on the product’s nutritional value. The
calculated decrease rates of major fatty acids present a momentary rate between second
and fourth week of shelf life.
Aldehyde and ketone compounds produced by oxidative spoilage could be detected ever
since the first test where olealdehyde and few different ketones were found. In later GC-
MS analyses a large variety of different aldehyde- and ketone compounds could be found
in small amounts. However, the reliability of identifying aldehyde- and ketone com-
pounds was too low to enable precise determination of compounds and their quantity.
For the prolongation of shelf life the most prominent methods are use of additives and
MAP (Modified Atmosphere Packaging). Vacuum packaging poses a problem when the
product is in flour form as it could be sucked into the equipment causing failure.
Food additives such as antioxidants could be used to decrease fat spoilage through oxida-
tion and if problems occur from microbial spoilage preservatives could be added. Food
additives are an inexpensive and easy method to extend shelf life. However, the right food
additives should be considered since food additives are usually seen having a negative
connotation. Some possible antioxidants used for preservation could be ascorbic acid and
tocopherols which are commonly known as C- and E-vitamin.

36
MAP is a prominent way to extend shelf life of the product by reducing oxidation and
microbial growth in the product and it does not have an effect on the products nutritional
value. MAP’s advantage over vacuum packaging is also the freedom in choosing the
shape and materials of the package. Nevertheless, MAP machines are industrial machines
which causes the initial costs of packaging to be high.
Fat extraction becomes an applicable method for shelf life prolongation only in great pro-
duction capacities. The cost of industrial extractors are high and they require large vol-
umes of organic solvents. Also the waste management and energy consumption add to a
considerable rises in costs.

37
REFERENCES
Bergslien, H., Rosnes, J.T., Sivertsvik, M. 1994. Modified atmosphere packaging. Mini-
mal Processing Technologies in the Food Industries. 2002. Edited by: Bengtsson, N.,
Ohlsson, T. 61-80
British Nutrition Foundation. 2016. Carbohydrates. Read 15.4.2017. https://www.nutri-
tion.org.uk/nutritionscience/nutrients-food-and-ingredients/carbohydrate.html
British Nutrition Foundation. 2016. Protein. Read 15.4.2017. https://www.nutri-
tion.org.uk/nutritionscience/nutrients-food-and-ingredients/protein.html?limit=1
Chemra. 2011-2016. Esterification: examples of unsaturated and saturated fatty acids.
Read 15.4.2017. http://www.chemra.com/catalysis/saturated-and-unsaturated-fatty-
acids.html
Dave,D., Ghaly, A.E. 2011. Meat Spoilage Mechanisms and Preservation Techniques:
A Critical Review. American Journal of Agricultural and Biological Sciences 6.
Defoliart, G.R., Nagakagi, B.J., Sunde, M.L. 1986. Protein Quality of the House
Cricket, Acheta domesticus, When Fed to Broiler Chicks.
EAG Laboratories. 2017. Gas Chromatography – Mass Spectrometry (GC-MS). Read
16.4.2017. http://www.eag.com/gas-chromatography-mass-spectrometry-gc-ms/
European Commission. 2017. Food Improvement Agents, Additives. Read 17.4.2017.
http://ec.europa.eu/food/safety/food_improvement_agents/additives_en
European Parliament. 2009. DIRECTIVE 2009/32/EC.
Evira. 2009. Lisäaineopas.
Evira. 2016. Elintarvikeparanteet, Lisäaineet. Read 17.4.2017. https://www.evira.fi/elin-
tarvikkeet/tietoa-elintarvikkeista/koostumus/elintarvikeparanteet/lisaaineet/

38
Finsect Oy. Introduction video. Bonafide creatives. http://www.finsect.fi/
Food Standards Agency. 2016. Current EU approved additives and their E numbers. Read
16.4.2017. https://www.food.gov.uk/science/additives/enumberlist
Garg, S.K., Lohani, Umesh, C. 2009. Food Spoilage and Control. Agropedia. Read
16.4.2017. http://agropedia.iitk.ac.in/content/food-spoilage-and-control
G.E. Anderson. 2011. Solvent Extraction. AOCS Lipid Library. Read 17.4.2017.
http://lipidlibrary.aocs.org/OilsFats/content.cfm?ItemNumber=40337
Harvard Medical School. 2015. The truth about fats: the good, the bad, and the in-be-
tween. Harvard Health Publications. Read 17.4.2017. http://www.health.har-
vard.edu/staying-healthy/the-truth-about-fats-bad-and-good
Huldén, L. 2015. Minikarjaa – Hyönteiset ruokana. Like.
Hutchins, RF., Martin, MM. 1968. The lipids of the common house cricket, Acheta do-
mesticus L.I. Lipid classes and fatty acid distribution.
Hyvönen, P., Määttälä, S., Saarela, A-M., von Wright, A. 2010. Elintarvikeprosessit.
Kuopio: Savonia-ammattikorkeakoulu.
Laaninen, T. 2016. Insects – soon to be regulated food? European Parliament. Read
13.4.2017. http://www.europarl.europa.eu/RegData/etu-
des/ATAG/2016/583830/EPRS_ATA(2016)583830_EN.pdf
Louekari, K., Salminen, S., von Wright, A. 1995. Elintarvikkeiden turvallisuus. Tam-
pere: Otatieto Oy.
Mattila, P., Piironen, V., Ollilainen, V. 2001. Elintarvikekemia- ja analytiikka. Helsinki:
Yliopistopaino.
MedlinePlus. 2017. Amino acids. Read 15.4.2017. https://medlineplus.gov/ency/arti-
cle/002222.htm

39
Modified Atmosphere Packaging. 2012. Vacuum Packaging. Read 16.4.2017. http://mo-
difiedatmospherepackaging.com/modified-atmosphere-packaging-resources/vacuum-
packaging
Nature Education. 2014. Protein structure. Read 15.4.2017. https://www.nature.com/sci-
table/topicpage/protein-structure-14122136
Nielsen, S.S. 2003. Food Analysis, Third Edition.
Nonaka, K., Payne, CLR., Rayner, M., Scarborough, P. 2016. A comparison using two
nutrient profiling models. European Journal of Clinical Nutrition 70. Macmillan pub-
lishers limited.
Oleoresins. 2016. Principle of Soxhlet extraction and Experimental Setup of Soxhlet
Extractor. Read 16.4.2017. http://oleoresins.melbia.com/principle-of-soxhlet-extraction-
and-experimental-setup.html
Opetushallitus. Kaasukromatografia. Laboratorioanalyysit. Read 16.4.2017.
http://www03.edu.fi/oppimateriaalit/laboratorio/analyysimenetelmat_2-5_kaasukroma-
tografia.html
Royal Society of Chemistry. 2017. Soxhlet extraction. Read 16.4.2017.
http://www.rsc.org/publishing/journals/prospect/onto-
logy.asp?id=CMO:0001609&MSID=B823001C
SFS-EN 14104. 2003. Fat and oil derivatives. Fatty Acid Methyl Esters (FAME). Deter-
mination of acid value. Helsinki: Suomen Standardisoimisliitto SFS.
SFS-EN 1528-2. 1997. FATTY FOOD. DETERMINATION OF PESTICIDES AND POLYCHLORINATED BIPHENYLS (PCBS). PART 2: EXTRACTION OF FAT, PESTICIDES AND PCBS, AND DETERMINATION OF FAT CONTENT. Helsinki: Suomen Standardisoimisliitto SFS.
SFS-EN ISO 3960:2017. 2017. Animal and vegetable fats and oils. Determination of
peroxide value. Iodometric (visual) endpoint determination. Helsinki: Suomen Stand-
ardisoimisliitto SFS.

40
SFS-EN ISO 3961. 2014. ANIMAL AND VEGETABLE FATS AND OILS. DETER-
MINATION OF IODINE VALUE. Helsinki: Suomen Standardisoimisliitto SFS.
SFS-EN ISO 6885. 2016. Animal and vegetable fats and oils. Determination of
anisidine value. Helsinki: Suomen Standardisoimisliitto SFS.
Solunetti. 2016. Asyyliglyserolit. Read 15.4.2017. http://www.solunetti.fi/fi/solubiolo-
gia/asyyliglyserolit/2/
Solunetti. 2016. Glykogeeni. Read 15.4.2017. http://www.solunetti.fi/fi/solubiolo-
gia/glykogeeni/2/
Solunetti. 2016. Proteiinit. Read 15.4.2017. http://www.solunetti.fi/fi/solubiologia/val-
kuaisaineet/2/
The Food and Agriculture Organization of the United Nations. 2013. Edible insects: fu-
ture prospects for food and feed security. 67-80.
University of Bristol. 2002-2017. Gas Chromatography Mass Spectrometry. Read
16.4.2017. http://www.bris.ac.uk/nerclsmsf/techniques/gcms.html
Vakuumikauppa. 2017. Elintarvikkeiden säilyvyys. Pohjolan Luonto ja Kala Oy. Read
16.4.2017. http://www.vakuumi.fi/pages.php?page=sailyvyys
World Food Logistics Organization. 2008. WFLO Commodity Storage Manual: Rancid-
ity and Antioxidants.

41
APPENDICES
Appendix 1. Sample 1, 29.3.2017, GC Analysis

42
Appendix 2. Sample 1, 29.3.2017, Integrated peak areas

43
Appendix 3. Sample 1, 29.3.2017, Library search report
1(10)

44
2(10)

45
3(10)

46
4(10)

47
5(10)

48
6(10)

49
7(10)

50
8(10)

51
9(10)

52
10(10)

53
Appendix 4. Sample 1, 5.4.2017, GC Analysis

54
Appendix 5. Sample 1, 5.4.2017, Integrated peak areas

55
Appendix 6. Sample 1, 5.4.2017, Library search report
1(10)

56
2(10)

57
3(10)

58
4(10)

59
5(10)

60
6(10)

61
7(10)

62
8(10)

63
9(10)

64
10(10)

65
Appendix 7. Sample 2, 5.4.2017, GC Analysis

66
Appendix 8. Sample 2, 5.4.2017, Integrated peak areas

67
Appendix 9. Sample 2, 5.4.2017, Library search report
1(10)

68
2(10)

69
3(10)

70
4(10)

71
5(10)

72
6(10)

73
7(10)

74
8(10)

75
9(10)

76
10(10)

77
Appendix 10. Sample 1, 12.4.2017, GC Analysis

78
Appendix 11. Sample 1, 12.4.2017, Integrated peak areas

79
Appendix 12. Sample 1, 12.4.2017, Library search report
1(9)

80
2(9)

81
3(9)

82
4(9)

83
5(9)

84
6(9)

85
7(9)

86
8(9)

87
9(9)

88
Appendix 13. Sample 2, 12.4.2017, GC Analysis

89
Appendix 14. Sample 2, 12.4.2017, Integrated peak areas

90
Appendix 15. Sample 2, 12.4.2017, Library search report
1(9)
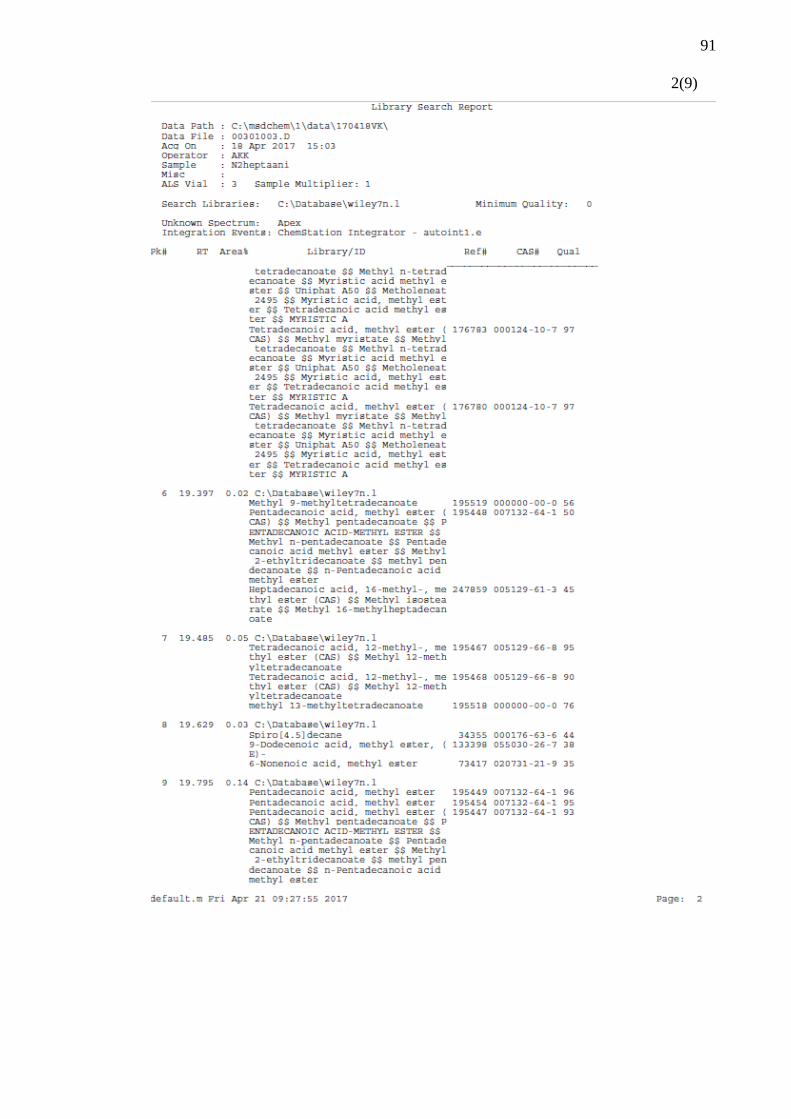
91
2(9)

92
3(9)

93
4(9)

94
5(9)

95
6(9)

96
7(9)

97
8(9)

98
9(9)