fault and performance management in multi-cloud based nfv …jain/talks/ftp/icccn17p.pdf · fault...
TRANSCRIPT

1 ©2017 Raj Jain http://www.cse.wustl.edu/~jain/talks/icccn17p.htm
Washington University in St. Louis
Fault and Performance Management in Multi-Cloud Based NFV using Shallow and Deep Predictive Structures
Lav Gupta, Mohammed Samaka, Raj Jain, Aiman Erbad, Deval Bhamare, and H. Anthony Chan
[email protected] Paper presentation at 7th Workshop on Industrial Internet of
Things Communication Networks – (IioTCom) at ICCCN 2017, Vancouver, Canada, August 3, 2017
These slides and a recording of this presentation are at: http://www.cse.wustl.edu/~jain/talks/icccn17p.htm
Trained Model for
Classification Stage 1
Trained Model for
Classification Stage 2
Markers Fault
No Fault
No Action
Manifest Fault
Impending Fault
Priority Localization
Elective Localization
2 ©2017 Raj Jain http://www.cse.wustl.edu/~jain/talks/icccn17p.htm
Washington University in St. Louis
Overview
1. Network Function Virtualization (NFV) 2. NFV on multiple clouds 3. Gaps in Fault, Configuration, Accounting,
Performance and Security (FCAPS) 4. Fault detection using Shallow Learning 5. Fault location using Deep Learning
3 ©2017 Raj Jain http://www.cse.wustl.edu/~jain/talks/icccn17p.htm
Washington University in St. Louis
MME RNC IMS
Hardware
Hardware
Set Top Box CGNAT
Residential Gateway
Hardware
MME RNC IMS
Residential Gateway CGNAT
Set Top Box
MME RNC IMS
MME RNC IMS
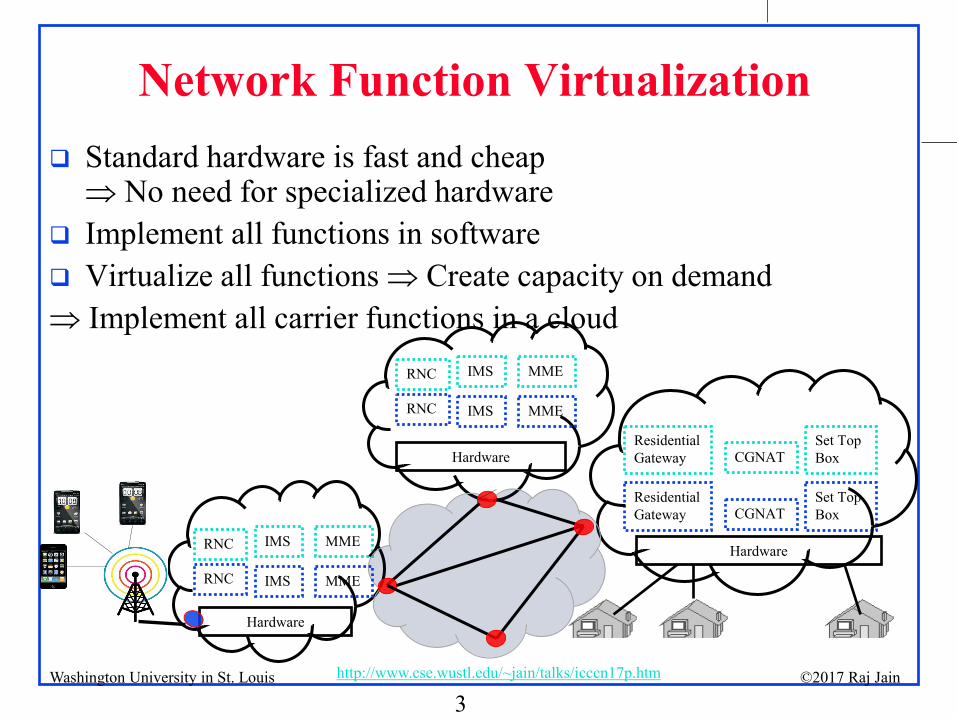
Network Function Virtualization Standard hardware is fast and cheap
⇒ No need for specialized hardware Implement all functions in software Virtualize all functions ⇒ Create capacity on demand ⇒ Implement all carrier functions in a cloud
4 ©2017 Raj Jain http://www.cse.wustl.edu/~jain/talks/icccn17p.htm
Washington University in St. Louis
Advantages of NFV
Reduces time to market new services Provides flexibility of scaling Lowers capital and operational costs
5 ©2017 Raj Jain http://www.cse.wustl.edu/~jain/talks/icccn17p.htm
Washington University in St. Louis
Users
Network
Micro-Clouds
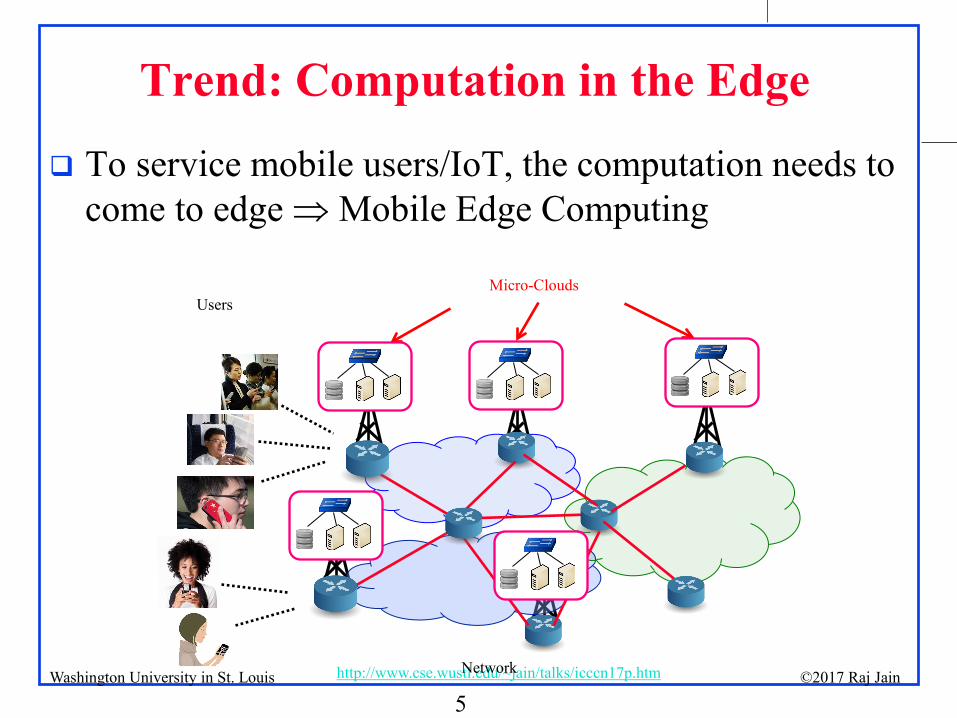
Trend: Computation in the Edge
To service mobile users/IoT, the computation needs to come to edge ⇒ Mobile Edge Computing
6 ©2017 Raj Jain http://www.cse.wustl.edu/~jain/talks/icccn17p.htm
Washington University in St. Louis
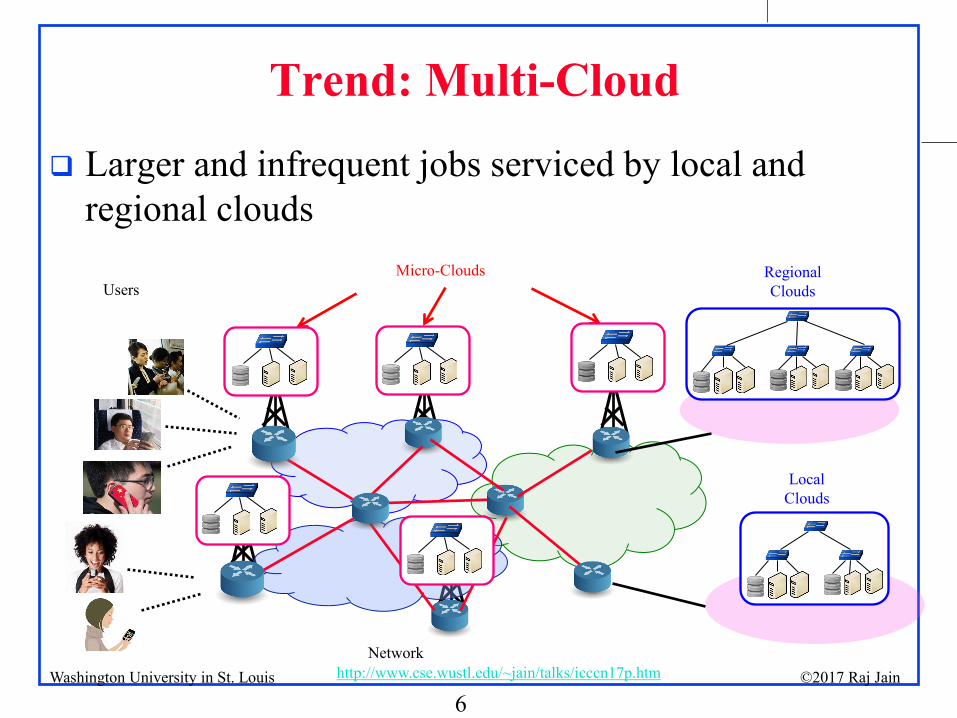
Trend: Multi-Cloud
Larger and infrequent jobs serviced by local and regional clouds
Users
Network
Micro-Clouds
Local Clouds
Regional Clouds

7 ©2017 Raj Jain http://www.cse.wustl.edu/~jain/talks/icccn17p.htm
Washington University in St. Louis
Advantages of NFV on Multi-Cloud
Wider footprint for distributed services. Lower risk of total failure.

8 ©2017 Raj Jain http://www.cse.wustl.edu/~jain/talks/icccn17p.htm
Washington University in St. Louis
Issues in Multi-Cloud NFV Deployments
Cloud downtime higher than five nines requirement of NFV (99.999% ⇒ 3 min 15sec downtime in 1yr).
Higher complexity of virtual environments FCAPS framework is weak compared to traditional
carrier networks. Not yet carrier grade In this paper we deal primarily with the FCP part of
FCAPS. From now on: Fault = Faults and Performance Issues

9 ©2017 Raj Jain http://www.cse.wustl.edu/~jain/talks/icccn17p.htm
Washington University in St. Louis
Cloud 3 Cloud 2
Network Services (NS)
Network Service: An ordered set of virtual network functions (VNFs), e.g., IMS, Mobility Management Entity (MME), …
VNFs are chained into service function chains (SFC) or VNF graphs
Multiple levels of management VNFs by NFV-MANO (Management and Orchestration) Virtual Machines (VMs) by Multi-cloud Management and
Control Platform (MMCP) Network services by BSS/OSS (Business and Operation
Support Systems) of the carrier.
Cloud 1
VNF 1 VNF 2
VNF 3 VNF 4 VNF 5
Terminal 1 Terminal 2
Domain 2 Domain 1 Domain 3

10 ©2017 Raj Jain http://www.cse.wustl.edu/~jain/talks/icccn17p.htm
Washington University in St. Louis
FCP Problem Description
1. Study of markers and metrics
2. Detection: of manifest and impending faults and that could cause performance degradation or failure.
3. Localization: of manifest and impending faults and performance issues.
4. Severity: In case of impending faults severity level should be predicted.

11 ©2017 Raj Jain http://www.cse.wustl.edu/~jain/talks/icccn17p.htm
Washington University in St. Louis
Markers and Metrics
Markers: Alarms, notifications, warning or error messages, measurements and counter values.
Metrics: Performance Measures CDR
(call drop rate) CSSR (call set up
success rate) SDCCH
congestion TCH
Congestion Packet loss
≤ 2% ≥95% ≤ 1% ≤2% ≤ 1% SDCCH: Standalone Dedicated Control Channel; TCH: Traffic Channel
Mobile Network Fixed Network Broadband
Radio Link Time Out No Dial Tone Intermittent Connection
Time Slot Shortage Line Cart Port Faulty Repeated Training
12 ©2017 Raj Jain http://www.cse.wustl.edu/~jain/talks/icccn17p.htm
Washington University in St. Louis
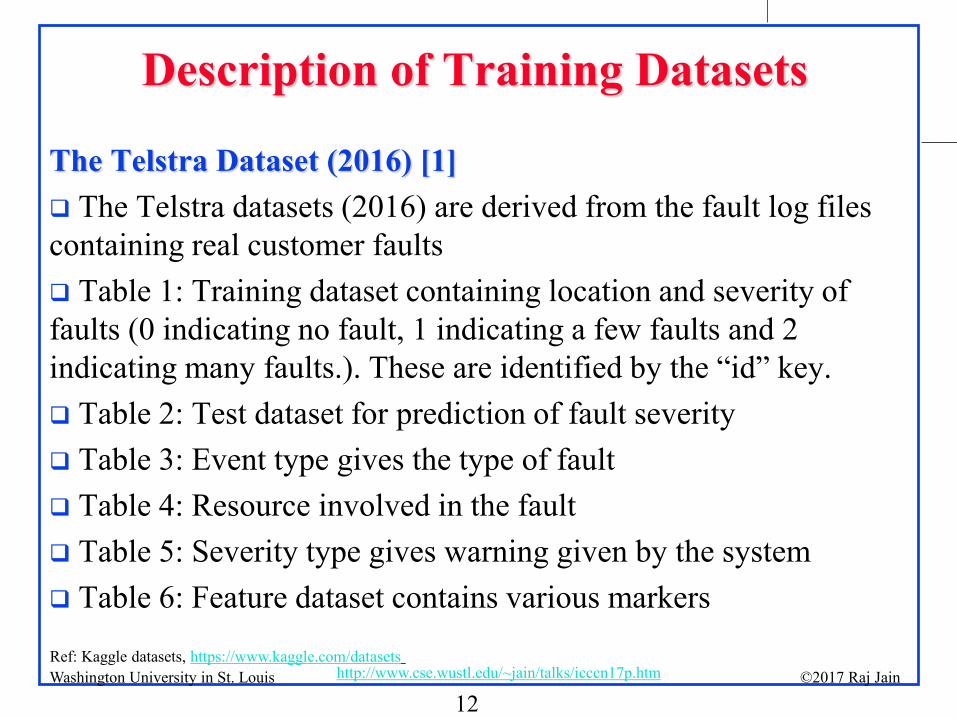
Description of Training Datasets
The Telstra Dataset (2016) [1] The Telstra datasets (2016) are derived from the fault log files containing real customer faults Table 1: Training dataset containing location and severity of faults (0 indicating no fault, 1 indicating a few faults and 2 indicating many faults.). These are identified by the “id” key. Table 2: Test dataset for prediction of fault severity Table 3: Event type gives the type of fault Table 4: Resource involved in the fault Table 5: Severity type gives warning given by the system Table 6: Feature dataset contains various markers
Ref: Kaggle datasets, https://www.kaggle.com/datasets

13 ©2017 Raj Jain http://www.cse.wustl.edu/~jain/talks/icccn17p.htm
Washington University in St. Louis
Telstra Dataset Samples Table 1 Training Dataset (7381 examples)
Table 2 Test dataset (11171 examples)
Table 3 Event type dataset (31170 records)
Table 4 Resource type dataset (21076 records)
Table 5 Severity type (18552 records)
Table 6 Feature dataset (58671 records)

14 ©2017 Raj Jain http://www.cse.wustl.edu/~jain/talks/icccn17p.htm
Washington University in St. Louis
KDE dataset
This is a synthetic dataset generated through multivariate kernel density estimation (KDE) technique [2]
Some of the features and classes are shown in the table
Features Classes 1 BTS hardware 1 Call drop
2 Radio link phase
2 Call setup
3 Antenna tilt 3 No Roaming 4 C/I ratio 4 Weak Signal 5 TCH
congestion 5 No registration
6 BCC fault 6 No outgoing 7 Time slot short 7 Data not working
8 Rx Noise
15 ©2017 Raj Jain http://www.cse.wustl.edu/~jain/talks/icccn17p.htm
Washington University in St. Louis
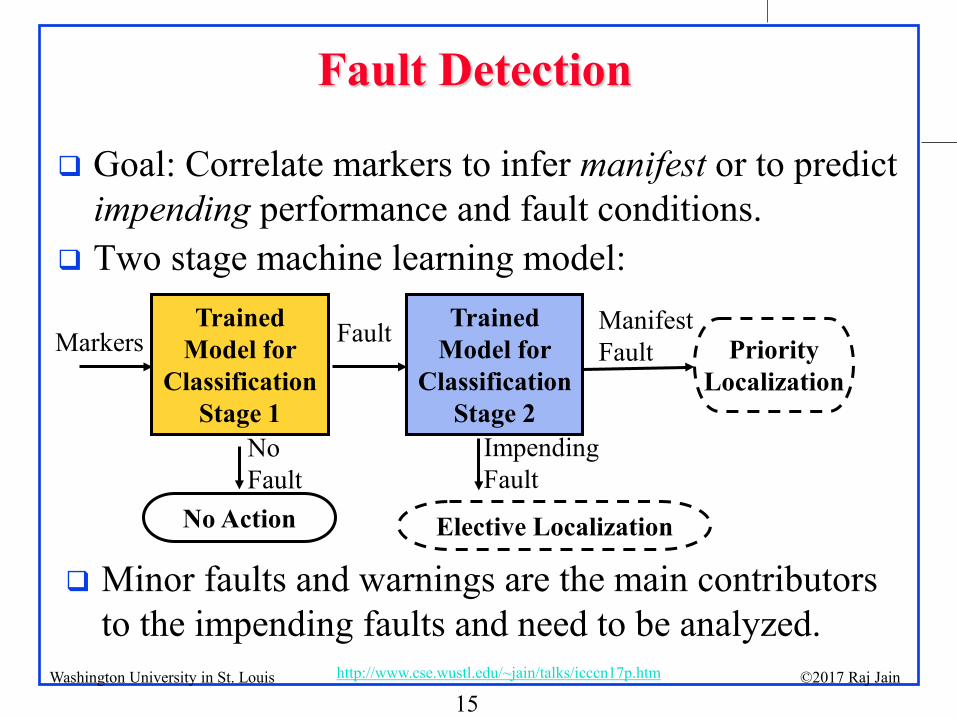
Fault Detection
Goal: Correlate markers to infer manifest or to predict impending performance and fault conditions.
Two stage machine learning model: Trained
Model for Classification
Stage 1
Trained Model for
Classification Stage 2
Markers Fault
No Fault
No Action
Manifest Fault
Impending Fault
Priority Localization
Elective Localization
Minor faults and warnings are the main contributors to the impending faults and need to be analyzed.

16 ©2017 Raj Jain http://www.cse.wustl.edu/~jain/talks/icccn17p.htm
Washington University in St. Louis
Detection of Faults and Performance Problems
SVM ADT Random Forests
Correctly classified instances
95.42% 95.00% 86.67%
Precision (Average) 95.7% 95.2% 86.9%
Mean absolute error 0.0458 0.0859 0.2509
True positive for class 1
97.6% 96.4% 69.9%
False positive for class 0
2.4% 3.6% 30.1%
‘Fault’, “No Fault’ binary classification tested with Support Vector Machine (SVM), Alternating Decision Trees (ADT) and Random Forests (RF)
Each of the models was trained with 240 examples and 10% cross-validation.
SVM had highest accuracy and precision, high true positive (TP) rate for class 1 (fault cases)
17 ©2017 Raj Jain http://www.cse.wustl.edu/~jain/talks/icccn17p.htm
Washington University in St. Louis
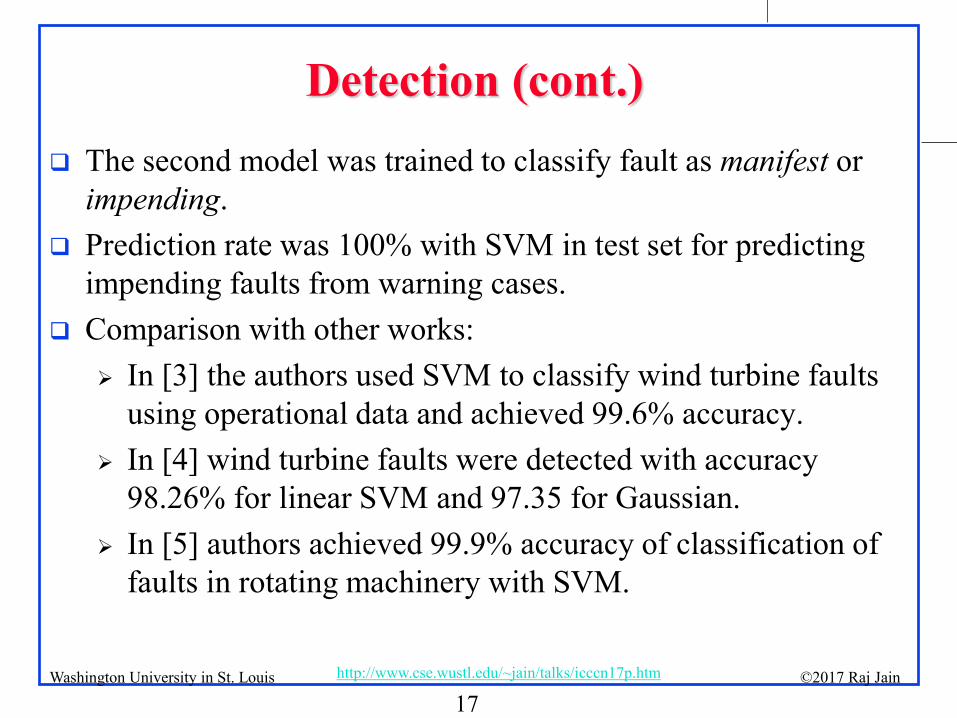
Detection (cont.) The second model was trained to classify fault as manifest or
impending. Prediction rate was 100% with SVM in test set for predicting
impending faults from warning cases. Comparison with other works:
In [3] the authors used SVM to classify wind turbine faults using operational data and achieved 99.6% accuracy.
In [4] wind turbine faults were detected with accuracy 98.26% for linear SVM and 97.35 for Gaussian.
In [5] authors achieved 99.9% accuracy of classification of faults in rotating machinery with SVM.
18 ©2017 Raj Jain http://www.cse.wustl.edu/~jain/talks/icccn17p.htm
Washington University in St. Louis
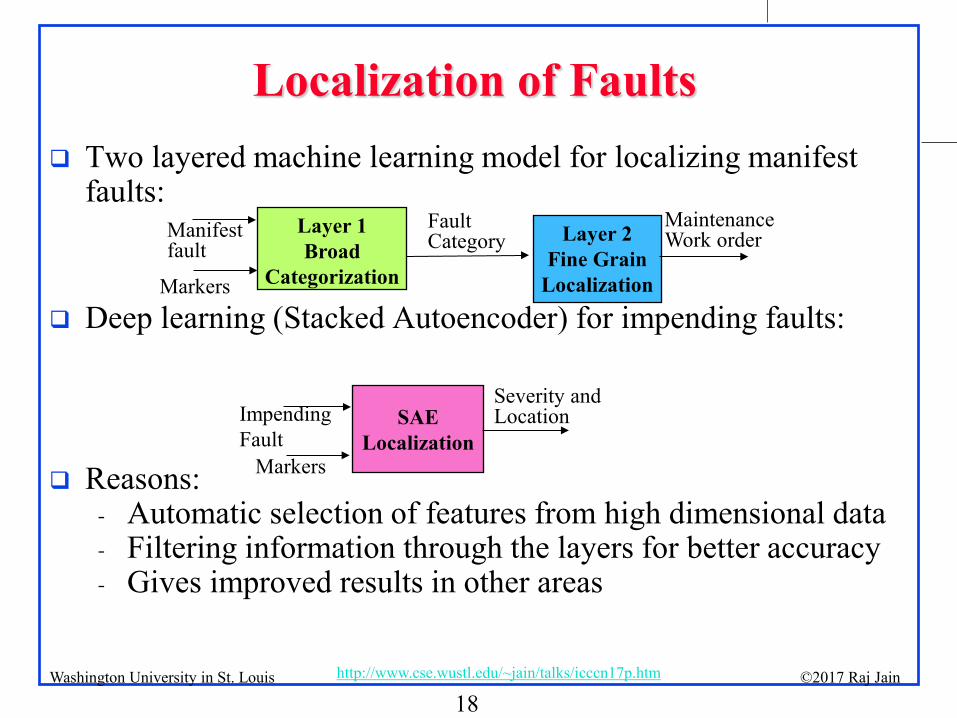
Localization of Faults Two layered machine learning model for localizing manifest
faults:
Deep learning (Stacked Autoencoder) for impending faults:
Reasons: - Automatic selection of features from high dimensional data - Filtering information through the layers for better accuracy - Gives improved results in other areas
Layer 1 Broad
Categorization
Layer 2 Fine Grain
Localization Markers
Fault Category Manifest
fault Maintenance Work order
Impending Fault
SAE Localization
Severity and Location
Markers
19 ©2017 Raj Jain http://www.cse.wustl.edu/~jain/talks/icccn17p.htm
Washington University in St. Louis
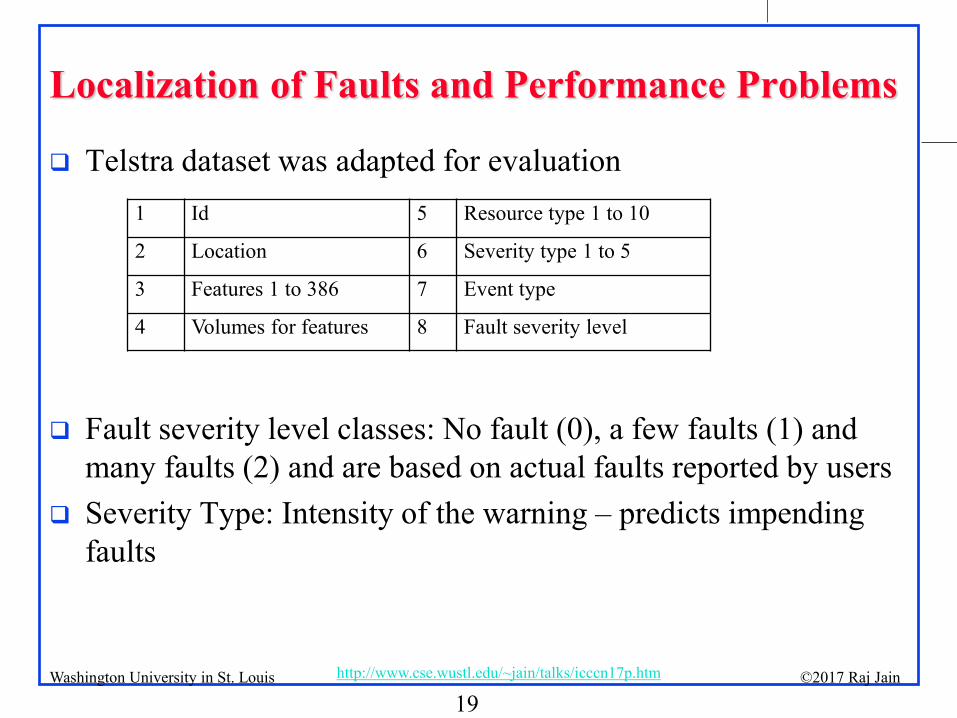
Localization of Faults and Performance Problems
Telstra dataset was adapted for evaluation
Fault severity level classes: No fault (0), a few faults (1) and
many faults (2) and are based on actual faults reported by users Severity Type: Intensity of the warning – predicts impending
faults
1 Id 5 Resource type 1 to 10
2 Location 6 Severity type 1 to 5
3 Features 1 to 386 7 Event type
4 Volumes for features 8 Fault severity level

20 ©2017 Raj Jain http://www.cse.wustl.edu/~jain/talks/icccn17p.htm
Washington University in St. Louis
Stacked Autoencoder
100 Hidden layers in the first encoder 50 Hidden layers in the 2nd encoder Softmax layer provides supervised back-propagation
improvement of the weights learned during unsupervised training.
21 ©2017 Raj Jain http://www.cse.wustl.edu/~jain/talks/icccn17p.htm
Washington University in St. Louis
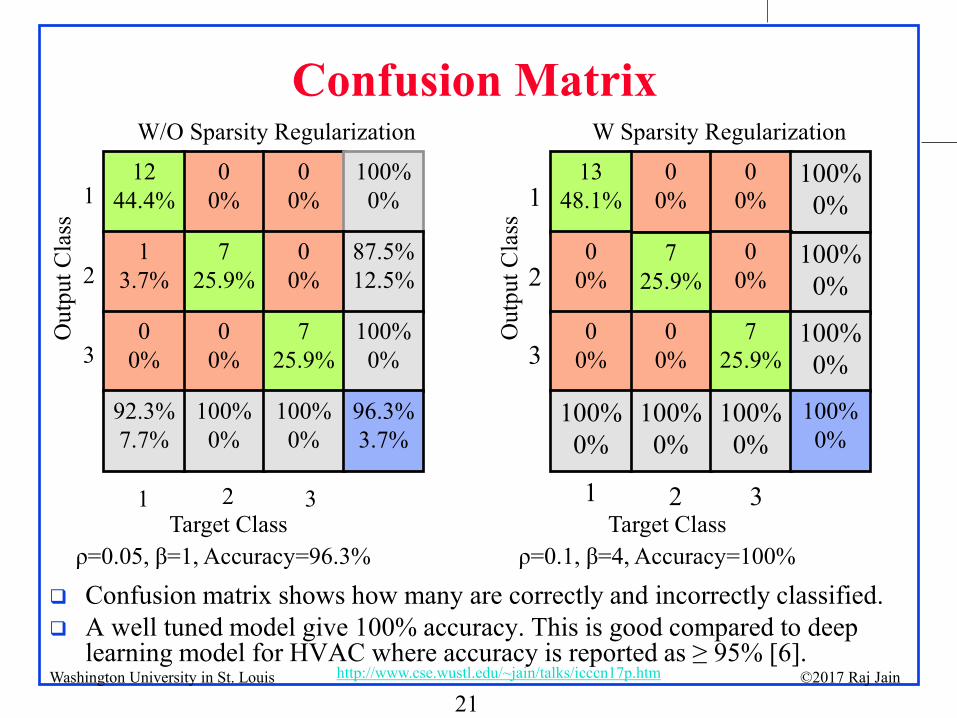
Confusion Matrix
Confusion matrix shows how many are correctly and incorrectly classified. A well tuned model give 100% accuracy. This is good compared to deep
learning model for HVAC where accuracy is reported as ≥ 95% [6].
0 0%
12 44.4%
0 0%
100% 0%
7 25.9%
1 3.7%
0 0%
87.5% 12.5%
0 0%
0 0%
7 25.9%
100% 0%
100% 0%
92.3% 7.7%
100% 0%
96.3% 3.7%
1
2
3
2 1 3
0 0%
13 48.1%
0 0%
100% 0%
7 25.9%
0 0%
0 0%
100% 0%
0 0%
0 0%
7 25.9%
100% 0%
100% 0%
100% 0%
100% 0%
100% 0%
1
2
3
2 1 3
Out
put C
lass
Out
put C
lass
Target Class Target Class
W/O Sparsity Regularization W Sparsity Regularization
ρ=0.05, β=1, Accuracy=96.3% ρ=0.1, β=4, Accuracy=100%

22 ©2017 Raj Jain http://www.cse.wustl.edu/~jain/talks/icccn17p.htm
Washington University in St. Louis
Effect of Relative Sizes of Hidden Layers
H1=Size of hidden layer 1, H2=Size of hidden layer 2 Accuracy and MSE are good for certain ranges of H1 and H2
0
20
40
60
80
100
120
0 20 40 60 80 100
Acc
urac
y
H1 Size
Prediction Accuracy For Varying Hidden Layer Sizes
H2=10
H2=5
0
5
10
15
0 50 100
MSE
x10E
-3
Hidden Layer 1
MSE For Varying Hidden Layer Sizes
H2=10
H2=5
H1 H1

23 ©2017 Raj Jain http://www.cse.wustl.edu/~jain/talks/icccn17p.htm
Washington University in St. Louis
Summary
Handling fault and performance anomalies is crucial for the success of NFV deployments over clouds.
A combination of shallow and deep learning structures works well for detection and localization of manifest and impending fault and performance issues.
Evaluation has been done using real and synthetic datasets and results are comparable to or better than fault detection and localization in other areas.

24 ©2017 Raj Jain http://www.cse.wustl.edu/~jain/talks/icccn17p.htm
Washington University in St. Louis
References 1. Kaggle datasets, https://www.kaggle.com/datasets 2. Z. Botev, “Fast multivariate kernel density estimation for high
dimensions,” 2016 3. K. Leahy, R. L. Hu, I. C. Konstantakopoulos, C. J. Spanos, A. M.
Agogino,”Diagnosing wind turbine faults using machine learning techniques applied to operational data,” International Conference on Prognostics and Health Management (ICPHM), 2016
4. P. Santos, L. F. Villa, A. Reñones, A. Bustillo, J. Maudes, “An SVM-Based Solution for Fault Detection in Wind Turbines,” Sensors, 2015
5. G. Nicchiotti, L. Fromaigeat, L. Etienne, “Machine Learning Strategy for Fault Classification Using Only Nominal Data,” European Conference Of The Prognostics And Health Management Society, 2016
6. D. Lee, B. Lee, J. W. Shin, “Fault Detection and Diagnosis with Modelica Language using Deep Belief Network,” Proceedings of the 11th International Modelica Conference, 2015

25 ©2017 Raj Jain http://www.cse.wustl.edu/~jain/talks/icccn17p.htm
Washington University in St. Louis
Scan This to Download These Slides
Raj Jain http://rajjain.com