fault detection in autonomous robots based on fault …ar.pdfauton robot (2008) 24: 49–67 doi...
TRANSCRIPT

Auton Robot (2008) 24: 49–67DOI 10.1007/s10514-007-9060-9
Fault detection in autonomous robots based on fault injectionand learning
Anders Lyhne Christensen · Rehan O’Grady ·Mauro Birattari · Marco Dorigo
Received: 23 January 2007 / Accepted: 27 September 2007 / Published online: 17 November 2007© Springer Science+Business Media, LLC 2007
Abstract In this paper, we study a new approach to fault de-tection for autonomous robots. Our hypothesis is that hard-ware faults change the flow of sensory data and the ac-tions performed by the control program. By detecting thesechanges, the presence of faults can be inferred. In order totest our hypothesis, we collect data from three different tasksperformed by real robots. During a number of training runs,we record sensory data from the robots while they are op-erating normally and after a fault has been injected. We useback-propagation neural networks to synthesize fault detec-tion components based on the data collected in the trainingruns. We evaluate the performance of the trained fault detec-tors in terms of number of false positives and time it takesto detect a fault. The results show that good fault detectorscan be obtained. We extend the set of possible faults and goon to show that a single fault detector can be trained to de-tect several faults in both a robot’s sensors and actuators. Weshow that fault detectors can be synthesized that are robustto variations in the task, and we show how a fault detectorcan be trained to allow one robot to detect faults that occurin another robot.
Keywords Fault detection · Fault injection · Learning ·Model-free · Mobile robots
A.L. Christensen (�) · R. O’Grady · M. Birattari · M. DorigoIRIDIA, CoDE, Université Libre de Bruxelles,50, Av. Franklin Roosevelt, CP 194/6, 1050 Brussels, Belgiume-mail: [email protected]
R. O’Gradye-mail: [email protected]
M. Birattarie-mail: [email protected]
M. Dorigoe-mail: [email protected]
1 Introduction
As more and more robots are introduced in space, industry,and private homes, fault detection is becoming an increas-ingly important issue to address. When a robot stops exhibit-ing its intended behavior, either due to an internal fault or toexternal factors, it can become a costly and/or a dangerousaffair. The problem is often exacerbated if the fault is notdetected in a timely manner. In a recent paper (Carlson andMurphy 2003), the reliability of seven mobile robots fromthree different manufacturers was tracked over a period oftwo years and the average mean time between failures wasfound to be 8 hours. The result suggests that faults in mobilerobots are quite frequent.
Technically, a fault is an unexpected change in systemfunction which hampers or disturbs normal operation, caus-ing unacceptable deterioration in performance (Isermannand Ballé 1997). A fault tolerant system is capable of con-tinued operation, possibly at a degraded performance, inthe event of faults in some of its parts. Fault tolerance isa sought-after property for critical systems due to economicand/or safety concerns. What we study in this paper is the ac-tivity known as fault detection in autonomous robots. Faultdetection is a binary decision process confirming whether ornot a fault has occurred in a system. Other aspects of faulttolerance include fault diagnosis, namely determining thetype and location of faults, and protection which comprisesany steps necessary to ensure continued safe operation of thesystem (Isermann and Ballé 1997).
Fault detection can be achieved by adding special-purpose hardware such as torque and position sensors (Terraand Tinos 2001). Adding additional hardware increases costand complexity, and it is, therefore, something that wewould like to avoid in many cases. Reducing cost and com-plexity would, for example, be crucial in projects such as the

50 Auton Robot (2008) 24: 49–67
National Aeronautics and Space Administration’s (NASA)swarm missions, in which cooperating swarms of hundredto thousands of small-scale autonomous robots explore thesolar system (Hinchey et al. 2004). Given the high numberof robots, simplicity and small size are high priorities. Simi-larly, for domestic adoption of service and leisure robots, thenumber and complexity of components have to be kept lowin order to reach a price point that allows for high marketpenetration (Kochan 2005).
In this study, we propose a method for performing faultdetection for autonomous robots. Our method requires nospecial fault detection hardware and relatively little compu-tational resource to run the fault detection software. It relieson recording sensory data, firstly over a period of time whena robot is operating as intended, and secondly over a periodof time when various types of hardware faults are present.Using knowledge of how the flow of information changesafter a fault has occurred, we are able to detect faults.
2 Related work
Fault detection is based on observations of a system’s behav-ior (for an introduction see Isermann 1997). Deviations fromnormal behavior can be interpreted as symptoms of a fault inthe system. A specific fault detection approach is a concretemethod for observation processing. A large body of researchin model-based fault detection approaches exists (Gertler1988; Isermann and Ballé 1997). In model-based fault de-tection some model of the system or of how it is supposed tobehave is constructed. The actual behavior is then comparedto the predicted behavior and deviations can be interpretedas symptoms of faults. A deviation is called a residual, thatis, the difference between the predicted and the observedvalue. In the domain of mobile autonomous robots, accurateanalytical models are often not feasible due to uncertain-ties in the environments, noisy sensors, and imperfect actu-ators. A number of methods have been studied to deal withthese uncertainties. Artificial neural networks and radial ba-sis function networks have been used for fault detection anddiagnosis based on residuals (Vemuri and Polycarpou 1997;Terra and Tinos 2001; Patton et al. 2000). In Skoundrianosand Tzafestas (2004), for instance, the authors train multi-ple local model neural networks to capture the input-outputrelationship for the components in a robot for which faultshould be detected. The authors focus on detecting faults inthe wheels of a robot, and the input and the output are thevoltage to the motor driving a wheel and the speed of thewheel, respectively. Supervised learning is used to train thelocal model neural networks. During operation, the speedspredicted by the local models are compared to the actualspeed and the residuals are computed.
Another popular approach to fault detection is to op-erate with multiple global models of the system concur-rently. Each model corresponds to the behavior of the sys-tem in a given fault state, for example a broken motor, aflat tire, and so on. The fault corresponding to a particu-lar model is considered to be detected when that model’spredictions are a sufficiently close match to the currentlyobserved behavior. Banks of Kalman filters have beenused for such state estimation (Roumeliotis et al. 1998;Goel et al. 2000). In their basic form, Kalman filters arebased on the assumption that the modeled system can beapproximated as a Markov chain built on linear opera-tors perturbed by Gaussian noise (Kalman 1960). Robot-ics systems are, like many other real-world systems, inher-ently nonlinear. Furthermore, discrete fault state changescan result in discontinuities in behavior. Extensions, suchas the extended Kalman filter (EKF) and the unscentedKalman filter (UKF), overcome some of these limita-tions. In EKFs the state transitions and the models canbe non-linear functions, but they must be differentiableso that the Jacobian matrix can be computed. In UKFs,a few sample points are picked and propagated throughthe model allowing the mean and covariance to be es-timated even for models comprised of highly non-linearfunctions (Julier and Uhlmann 1997). EKFs and UKFshave been extensively used for localization for mobile ro-bots (Smith and Cheeseman 1986; Leonard and Durrant-Whyte 1991; Ashokaraj et al. 2004), but in the domain offault detection and fault diagnosis for autonomous robotsthese techniques are often used in combination with othermethods.
Dynamic Bayesian networks represent another techniquethat does not require that the underlying phenomenon can bereasonably modeled as a linear system (Lerner et al. 2000).Recently, computationally efficient approaches for approxi-mating Bayesian belief using particle filters have been stud-ied as a means for fault detection and identification (Dear-den et al. 2004; Verma et al. 2004; Li and Kadirkamanathan2001). Particle filters are Monte Carlo methods capable oftracking hybrid state spaces of continuous noisy sensor dataand discrete operation states. The key idea is to approxi-mate the probability density function over fault states giventhe observed data by a swarm of points or particles. Oneof the main issues related to particle filters is tracking mul-tiple low-probability events (faults) simultaneously. A scal-able solution to this issue has recently been proposed (Vermaand Simmons 2006).
Artificial immune-systems (AIS) are a biologically in-spired approach to fault detection. An AIS is a classifier thatdistinguishes between self and non-self (Forrest et al. 1994).In fault detection, “self” corresponds to fault-free opera-tion while “non-self” refers to observations resulting froma faulty behavior. AIS have been applied to robotics, see for
Auton Robot (2008) 24: 49–67 51
example (Canham et al. 2003) in which fault detectors areobtained for a Khepera robot and for a control module of aBAE Systems Rascal robot. The two systems are first trainedduring fault-free operation and their capacity to detect faultsis then tested.
Marsland et al. have suggested using a novelty filter basedon a clustering neural network and habituation, for inspec-tion and fault detection (Marsland et al. 2005). Through un-supervised learning a novelty filter learns to ignore sensorydata similar to data previously perceived. The authors eval-uated the approach in various configurations using a Nomad200 robot placed in various environments and the robot cor-rectly detected environmental differences.
The approach that we propose in this study relies on ar-tificial neural networks that are trained to discriminate be-tween behaviors when a robot is operating normally and be-haviors when the presence of a fault is affecting the robot’sperformance. We rely on a single neural network, as opposedto the multiple local model neural networks and the multi-model approaches mentioned above. We do not use explicitor analytical modeling of the system (which can be com-plicated for all but the simplest systems). In contrast withthe studies on AIS and novelty detection, we use supervisedlearning. When an artificial neural network is trained, weinclude training data with both positive and negative exam-ples, which potentially allows the proposed method to beextended to fault diagnosis.
3 Methodology
Some methods for fault detection base classification on themost recent observations only. The approach presented inthis study allows classification based on both current andpast observations, since many faults can only be detected ifa system is observed over time. This is especially true formechanical faults in mobile robots; a fault causing a wheelto block, for instance, can only be detected once the robothas tried to move the wheel for a period of time long enoughfor the absence of movement to be detectable. This periodof time could be anywhere from a few milliseconds if, forexample, dedicated torque sensors in the wheels are used,to several seconds if the presence of a fault has to be in-ferred based on information from non-dedicated and impre-cise sensors.
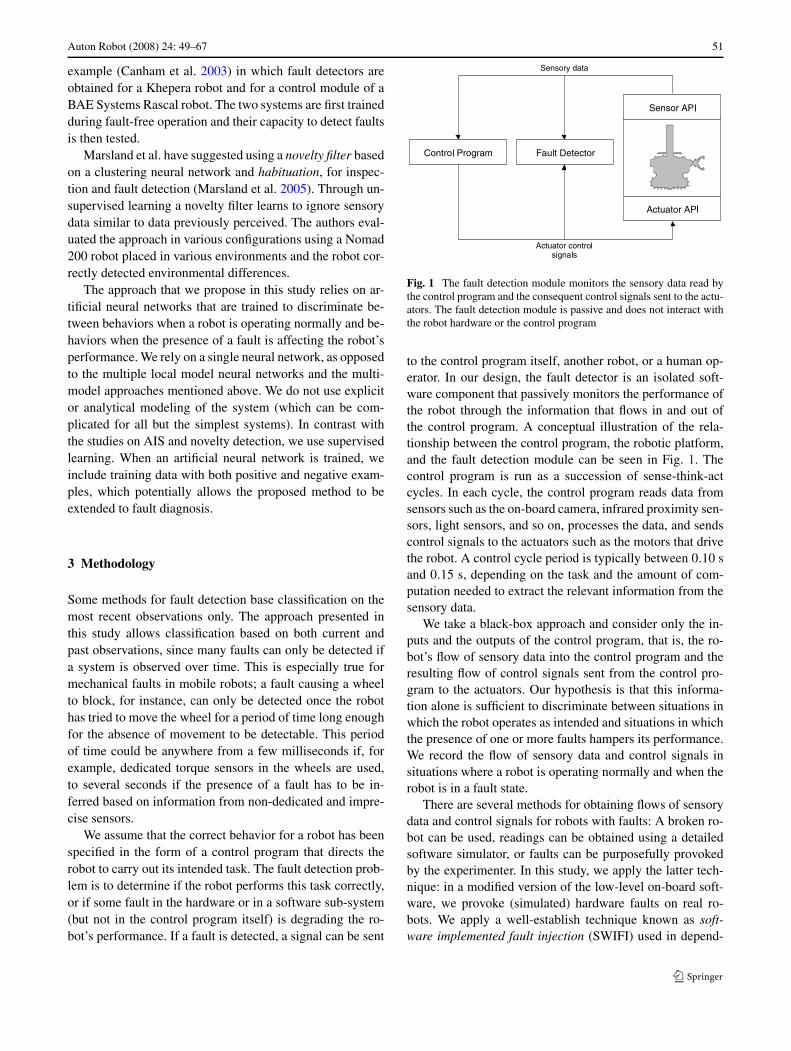
We assume that the correct behavior for a robot has beenspecified in the form of a control program that directs therobot to carry out its intended task. The fault detection prob-lem is to determine if the robot performs this task correctly,or if some fault in the hardware or in a software sub-system(but not in the control program itself) is degrading the ro-bot’s performance. If a fault is detected, a signal can be sent
Fig. 1 The fault detection module monitors the sensory data read bythe control program and the consequent control signals sent to the actu-ators. The fault detection module is passive and does not interact withthe robot hardware or the control program
to the control program itself, another robot, or a human op-erator. In our design, the fault detector is an isolated soft-ware component that passively monitors the performance ofthe robot through the information that flows in and out ofthe control program. A conceptual illustration of the rela-tionship between the control program, the robotic platform,and the fault detection module can be seen in Fig. 1. Thecontrol program is run as a succession of sense-think-actcycles. In each cycle, the control program reads data fromsensors such as the on-board camera, infrared proximity sen-sors, light sensors, and so on, processes the data, and sendscontrol signals to the actuators such as the motors that drivethe robot. A control cycle period is typically between 0.10 sand 0.15 s, depending on the task and the amount of com-putation needed to extract the relevant information from thesensory data.
We take a black-box approach and consider only the in-puts and the outputs of the control program, that is, the ro-bot’s flow of sensory data into the control program and theresulting flow of control signals sent from the control pro-gram to the actuators. Our hypothesis is that this informa-tion alone is sufficient to discriminate between situations inwhich the robot operates as intended and situations in whichthe presence of one or more faults hampers its performance.We record the flow of sensory data and control signals insituations where a robot is operating normally and when therobot is in a fault state.
There are several methods for obtaining flows of sensorydata and control signals for robots with faults: A broken ro-bot can be used, readings can be obtained using a detailedsoftware simulator, or faults can be purposefully provokedby the experimenter. In this study, we apply the latter tech-nique: in a modified version of the low-level on-board soft-ware, we provoke (simulated) hardware faults on real ro-bots. We apply a well-establish technique known as soft-ware implemented fault injection (SWIFI) used in depend-
52 Auton Robot (2008) 24: 49–67
able systems research. The technique is usually applied tomeasure the robustness and fault tolerance of software sys-tems (Hsueh et al. 1997; Arlat et al. 1990). In our case,we inject faults to discover how sensory data and the con-trol signals change when faults are present. The idea isthat by actively controlling the state of the robot (for in-stance by injecting faults or by using a broken robot) andrecording the flow of sensory data and control signals, wecan use supervised learning techniques and obtain a classi-fier that, based on that flow, can determine the state of thesystem.
We use time-delay neural networks (TDNNs) as classi-fiers (Waibel et al. 1989; Clouse et al. 1997). TDNNs arefeed-forward networks that allow reasoning based on time-varying inputs without the use of recurrent connections. Ina TDNN, the values for a group of neurons are assignedbased on a set of observations from a fixed distance intothe past. The TDNNs used in this study are normal multi-layer perceptrons for which the inputs are taken from mul-tiple, equally spaced points in a delay-line of past obser-vations. TDNNs have been extensively used for time-seriesprediction due to their ability to make predictions based ondata distributed in time. Unlike more elaborate, recurrentnetwork architectures, the properties of multilayer TDNNsare well-understood and supervised learning through back-propagation can be applied.
3.1 Formal definitions
Our aim is to obtain a function that maps from a set of cur-rent and past sensory data, S, and control signals, A, to either0 or 1 corresponding to no-fault and fault, respectively:
χ : S,A → {0,1}. (1)
We assume that such a function exists and we approximateit with a feed-forward neural network. We let I ⊆ (S ∪ A)
be the inputs to the network. We choose a network that hasa single output neuron whose output value is in the interval[0,1]. The output value is interpreted in a task-dependentway. For instance, a threshold-based classification schemecan be applied where an output value above a given thresh-old is interpreted as 1 (fault), whereas an output value belowthe threshold is interpreted as 0 (no-fault).
Sensory data, control signals and fault state We performa number of runs each consisting of a number of con-trol cycles (sense-compute-act loops). For each control cy-cle, c, we record the sensory data and control signals toand from the control program. We let irc denote a sin-gle set of control program inputs and outputs (CPIO), thatis, the CPIO for control cycle c in run r . We let s de-note the number of values in a single CPIO set, that iss = |irc |. We let I r be the ordered set of all CPIO sets
for r . Similarly, for each control cycle we let f rc denote
the fault state for control cycle c in run r , where f rc = 1 if
a fault has been injected and 0 otherwise. Hence, f rc = 0
when the robot is operating normally and f rc = 1 other-
wise.
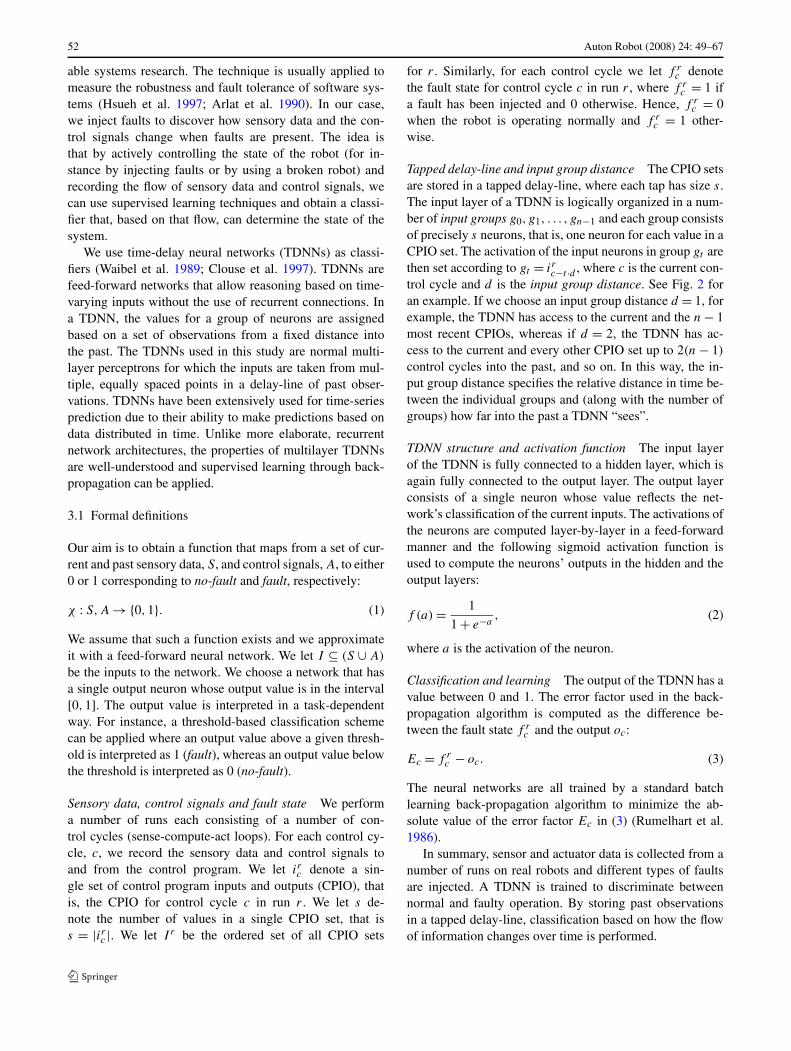
Tapped delay-line and input group distance The CPIO setsare stored in a tapped delay-line, where each tap has size s.The input layer of a TDNN is logically organized in a num-ber of input groups g0, g1, . . . , gn−1 and each group consistsof precisely s neurons, that is, one neuron for each value in aCPIO set. The activation of the input neurons in group gt arethen set according to gt = irc−t ·d , where c is the current con-trol cycle and d is the input group distance. See Fig. 2 foran example. If we choose an input group distance d = 1, forexample, the TDNN has access to the current and the n − 1most recent CPIOs, whereas if d = 2, the TDNN has ac-cess to the current and every other CPIO set up to 2(n − 1)
control cycles into the past, and so on. In this way, the in-put group distance specifies the relative distance in time be-tween the individual groups and (along with the number ofgroups) how far into the past a TDNN “sees”.
TDNN structure and activation function The input layerof the TDNN is fully connected to a hidden layer, which isagain fully connected to the output layer. The output layerconsists of a single neuron whose value reflects the net-work’s classification of the current inputs. The activations ofthe neurons are computed layer-by-layer in a feed-forwardmanner and the following sigmoid activation function isused to compute the neurons’ outputs in the hidden and theoutput layers:
f (a) = 1
1 + e−a, (2)
where a is the activation of the neuron.
Classification and learning The output of the TDNN has avalue between 0 and 1. The error factor used in the back-propagation algorithm is computed as the difference be-tween the fault state f r
c and the output oc:
Ec = f rc − oc. (3)
The neural networks are all trained by a standard batchlearning back-propagation algorithm to minimize the ab-solute value of the error factor Ec in (3) (Rumelhart et al.1986).
In summary, sensor and actuator data is collected from anumber of runs on real robots and different types of faultsare injected. A TDNN is trained to discriminate betweennormal and faulty operation. By storing past observationsin a tapped delay-line, classification based on how the flowof information changes over time is performed.
Auton Robot (2008) 24: 49–67 53
Fig. 2 An illustration of a fault detection module based on a TDNN.The current control program input and output (CPIO) is stored in thetapped delay-line and the activations of the neurons in the logical input
groups are set according to the current and past CPIOs. In the exam-ple illustrated, there are 3 input groups and the input group distance d
is 4
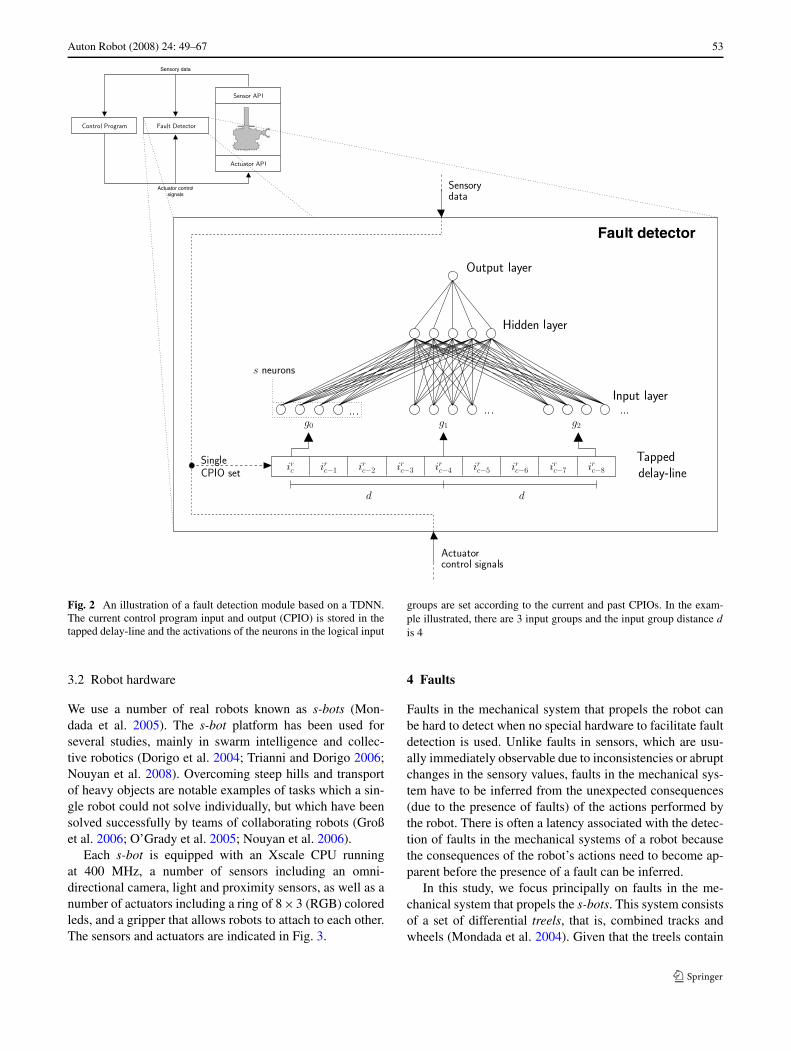
3.2 Robot hardware
We use a number of real robots known as s-bots (Mon-dada et al. 2005). The s-bot platform has been used forseveral studies, mainly in swarm intelligence and collec-tive robotics (Dorigo et al. 2004; Trianni and Dorigo 2006;Nouyan et al. 2008). Overcoming steep hills and transportof heavy objects are notable examples of tasks which a sin-gle robot could not solve individually, but which have beensolved successfully by teams of collaborating robots (Großet al. 2006; O’Grady et al. 2005; Nouyan et al. 2006).
Each s-bot is equipped with an Xscale CPU runningat 400 MHz, a number of sensors including an omni-directional camera, light and proximity sensors, as well as anumber of actuators including a ring of 8×3 (RGB) coloredleds, and a gripper that allows robots to attach to each other.The sensors and actuators are indicated in Fig. 3.
4 Faults
Faults in the mechanical system that propels the robot canbe hard to detect when no special hardware to facilitate faultdetection is used. Unlike faults in sensors, which are usu-ally immediately observable due to inconsistencies or abruptchanges in the sensory values, faults in the mechanical sys-tem have to be inferred from the unexpected consequences(due to the presence of faults) of the actions performed bythe robot. There is often a latency associated with the detec-tion of faults in the mechanical systems of a robot becausethe consequences of the robot’s actions need to become ap-parent before the presence of a fault can be inferred.
In this study, we focus principally on faults in the me-chanical system that propels the s-bots. This system consistsof a set of differential treels, that is, combined tracks andwheels (Mondada et al. 2004). Given that the treels contain

54 Auton Robot (2008) 24: 49–67
Fig. 3 The s-bot platform, sensors, and actuators
moving parts and that they are used continuously in mostexperiments, they are the components in which the majorityof faults occur.
We analyze two types of faults. Both types can either beisolated to the left or the right treel or they can affect bothtreels simultaneously. The first type of fault causes one orboth treels to stop moving. This usually happens if the strapthat transfers power from the electrical motors to the treelsbreaks or jumps out of place. Whenever this happens, thetreels stop moving. We denote this type of fault as stuck-at-zero. The second type of fault occurs when an s-bot’ssoftware sub-system crashes leaving one (or both) motor(s)driving the treels running at some undefined speed. The re-sult is that a treel no longer can be controlled by the on-board software. We refer to this type of fault as stuck-at-constant.
To collect training data, a number of runs are conducted.In each run the s-bot starts in a nominal state and duringthe run, a fault is injected. The fault is implemented in theon-board software by discarding the control program’s com-mands to the failed part and by substituting them accord-
ing to the type of fault injected. If, for instance, a stuck-at-constant fault is injected in the left treel, the speed of thattreel is set to a random value, and all future changes in speedrequested by the control program are discarded.
5 The three experimental setups
We have chosen three setups in which to study fault detec-tion based on fault injection and learning. The setups arecalled find perimeter, follow the leader, and connect to s-bot,respectively, and they are described in Fig. 4. In all setups,we use a 180 × 180 cm2 arena surrounded by walls.
In the find perimeter setup an s-bot follows the perimeterof a dark square drawn on the arena surface. In this setup,the four infrared ground sensors are used to discriminate be-tween the normal light-colored arena surface and the darksquare.
In the follow the leader setup, an s-bot (the leader) per-forms a random walk in the environment and another s-bot(the follower) follows. The two robots perceive one another

Auton Robot (2008) 24: 49–67 55
Find perimeter: An s-bot is situated in an arena with a dark colored square drawn on anotherwise light floor. A light source is placed in the center of the square. The task for thes-bot is to follow the perimeter of the square.
Sensors: IR ground (4 inputs), light (8 inputs)Control period: 100 ms
Follow the leader: Two s-bots are placed in a square environment bounded by walls. Oneof the s-bots has been preassigned the leader role, while the other has been preassigned thefollower role. The leader moves around in the environment. The follower tails the leaderand tries to stay at a distance of 35 cm. If the follower falls behind, the leader waits. Faultsare injected in the follower only.
Sensors: Camera (16 inputs), IR proximity (15 inputs)Control period: 150 ms
Connect to s-bot: One s-bot attempts to physically connect to a stationary s-bot using itsgripper. When a successful connection has been made, the s-bot waits for 10 seconds, dis-connects, moves back, and tries to connect again. Faults are injected in the connecting s-botonly.
Sensors: Camera (16 inputs), optical sensors in gripper (4 inputs)Control period: 150 ms
Fig. 4 Description of the three setups: find perimeter, follow theleader, and connect to s-bot. For each setup a list of sensors usedand the control cycle period for the controllers are shown. The num-
ber in brackets after each sensor listed corresponds to the number ofinput values the sensor provides to the fault detector at each controlcycle
using their omni-directional cameras. The infrared proxim-ity sensors are used to detect and avoid walls. Objects upto 50 cm away can be seen reliably through the camera. In-frared proximity sensors have a range from a few centime-ters up to 20 cm depending on the reflective properties of
the obstacle or object. Faults are injected in the followeronly.
In the connect to s-bot setup, one s-bot tries to connect toanother, stationary s-bot. The connection is made using thegripper. The connecting s-bot uses the camera to perceive
56 Auton Robot (2008) 24: 49–67
the location of the other robot. Faults are only injected inthe s-bot that is trying to form the connection.
Readings from sensors such as infrared ground sensorsare straightforward to normalize and feed to the input neu-rons of a neural network. The camera sensor, in contrast,captures 640 × 480 color images. For these more complexsensor readings to serve as input to a neural network, rel-evant information must be extracted and processed before-hand. The s-bots have sufficient on-board processing powerto scan the entire images and identify objects based on colorinformation. The image processor is configured to detectthe location of colored leds of the s-bots only, and discardany other information. The s-bot camera captures images ofthe robot’s surroundings reflected in a semi-spherical mir-ror. Since the robots operate on flat terrain, the distancein pixels from the center of an image to a perceived ob-ject corresponds to the physical distance between the ro-bot and the object. In order to make this information avail-able to a neural network, we divide the image into 16 non-overlapping slices of equal size in terms of the field of viewthey cover. Each slice corresponds to a single input value.The value is set depending on the distance to the closestobject perceived in the slice. If no object is perceived, thevalue for a slice is 0. Used in this way, the camera sensoreffectively becomes a range sensor for colored leds.
6 Data collection, training and performance evaluation
6.1 Data collection
A total of 60 runs on real s-bots are performed for each of thethree setups. In each run, the robot(s) start in a nominal state,and at some point during the run a fault is injected. The faultis injected at a random point in time after the first 5 secondsof the run and before the last 5 seconds of the run accordingto a uniform distribution. Hence, a robot spends on average50% of the time that a run lasts in a nominal state. When afault is injected, there is a 50% probability that a fault affectsboth treels instead of only one of the treels, and faults of thetype stuck-at-zero and stuck-at-constant are equally likelyto occur. Each run consists of 1000 control cycles and foreach control cycle the sensory data, control signals, and thecurrent fault state are recorded. In the find perimeter setup1000 cycles correspond to 100 seconds, while for the followthe leader and in the connect to s-bot setups 1000 cyclescorrespond to 150 seconds, due to the longer control cycleperiod.
6.2 Training and evaluation data
The data sets recorded in each setup are partitioned into twosubsets, one consisting of data from 40 runs, which is used
for training; and one consisting of the data from the remain-ing 20 runs, which is used for a final performance evalua-tion. The TDNNs all have a hidden layer of 5 neurons andan input layer with 10 input groups.
6.3 Performance evaluation
The performance of the trained neural networks is computedbased on the 20 runs in each setup reserved for evaluation.A network is evaluated on data from one run at a time, andthe output of the network is recorded and compared to thefault state.
The two main performance criteria for a fault detectionare reliability of detection and speed of detection. In our ap-proach, the interpretation of the output of the trained neuralnetwork has an important impact on both criteria. The sim-plest interpretation mechanism is to define a threshold. Anoutput value above this threshold is considered an indica-tion that a fault is present, whereas an output value belowthe threshold is considered an indication that the robot is ina nominal state. In the next section, we present results forfive such thresholds: 0.10, 0.25, 0.50, 0.75, and 0.90.
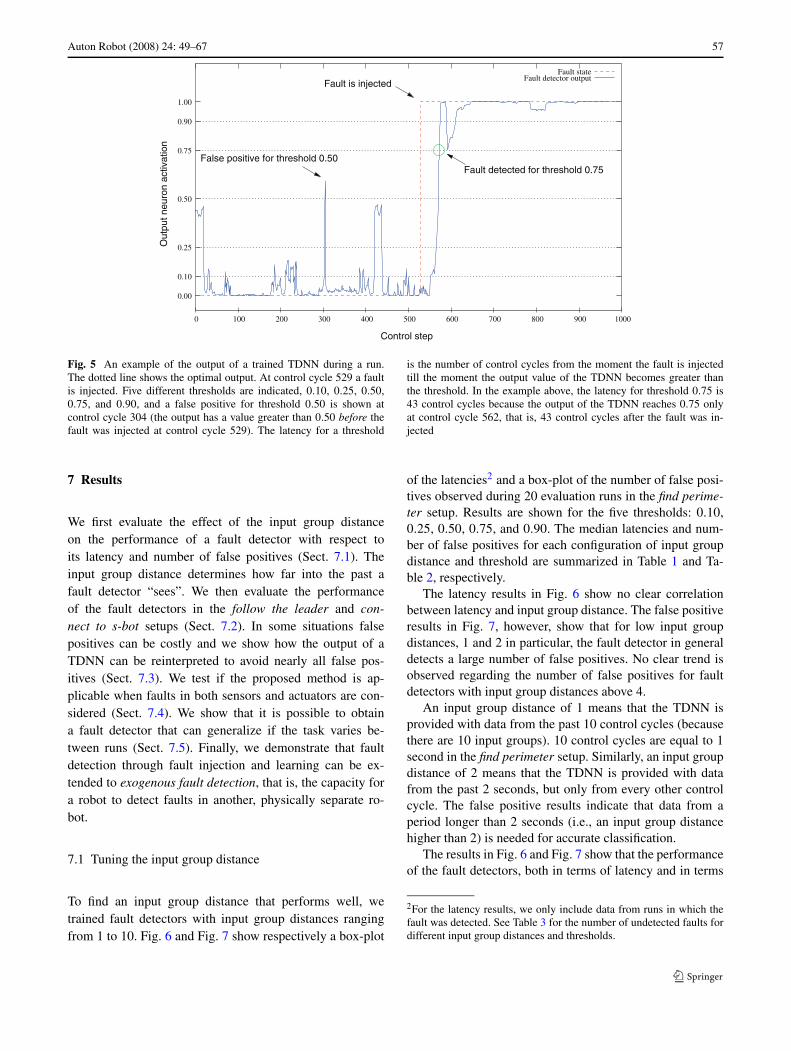
A graphical representation of TDNN’s output during anevaluation run is shown in Fig. 5. In the run shown, a faultwas injected at control cycle 529. The number of false pos-itives is the number of control cycles before a fault is in-jected for which the output of the TDNN exceeds the giventhreshold. Choosing a threshold of 0.50 would, for example,result in one false positive since the output of the networkis higher than 0.50 for one control cycle (cycle number 304)before the fault was injected. If we choose a higher thresh-old, either 0.75 or 0.90, false positives are avoided. How-ever, choosing a higher threshold has a negative impact onanother aspect of a fault detector’s performance, namely itslatency. Latency is the number of cycles between the occur-rence and detection of a fault. In the example in Fig. 5 thefault is detected at control cycle 553, 561, 570, 572, and 574for the thresholds 0.10, 0.25, 0.50, 0.75, and 0.90, yieldinglatencies of 24, 32, 41, 43, 45 control cycles, respectively.1
For some tasks, the recovery procedure is costly, andfewer false positives might be desirable even at the cost ofa higher latency. For other tasks, undetected faults can haveserious consequences and a low latency is more importantthan reducing the number of false positives. We can gainfine control over the balance between latency and number offalse positives by choosing an appropriate threshold.
1It is important to note that a latency of 24 control cycles may seemlong, but the faults that we are trying to detect do not always have animmediate impact on the performance of a robot. If, for instance, thefault injected causes a treel to block (a fault of the type stuck-at-zero),the fault can only be detected if the control program tries to set the treelto a non-zero speed. In particular, if the control program is setting lowspeeds (values close to zero) it might take a long time before a faultcan be detected.
Auton Robot (2008) 24: 49–67 57
Fig. 5 An example of the output of a trained TDNN during a run.The dotted line shows the optimal output. At control cycle 529 a faultis injected. Five different thresholds are indicated, 0.10, 0.25, 0.50,0.75, and 0.90, and a false positive for threshold 0.50 is shown atcontrol cycle 304 (the output has a value greater than 0.50 before thefault was injected at control cycle 529). The latency for a threshold
is the number of control cycles from the moment the fault is injectedtill the moment the output value of the TDNN becomes greater thanthe threshold. In the example above, the latency for threshold 0.75 is43 control cycles because the output of the TDNN reaches 0.75 onlyat control cycle 562, that is, 43 control cycles after the fault was in-jected
7 Results
We first evaluate the effect of the input group distanceon the performance of a fault detector with respect toits latency and number of false positives (Sect. 7.1). Theinput group distance determines how far into the past afault detector “sees”. We then evaluate the performanceof the fault detectors in the follow the leader and con-nect to s-bot setups (Sect. 7.2). In some situations falsepositives can be costly and we show how the output of aTDNN can be reinterpreted to avoid nearly all false pos-itives (Sect. 7.3). We test if the proposed method is ap-plicable when faults in both sensors and actuators are con-sidered (Sect. 7.4). We show that it is possible to obtaina fault detector that can generalize if the task varies be-tween runs (Sect. 7.5). Finally, we demonstrate that faultdetection through fault injection and learning can be ex-tended to exogenous fault detection, that is, the capacity fora robot to detect faults in another, physically separate ro-bot.
7.1 Tuning the input group distance
To find an input group distance that performs well, wetrained fault detectors with input group distances rangingfrom 1 to 10. Fig. 6 and Fig. 7 show respectively a box-plot
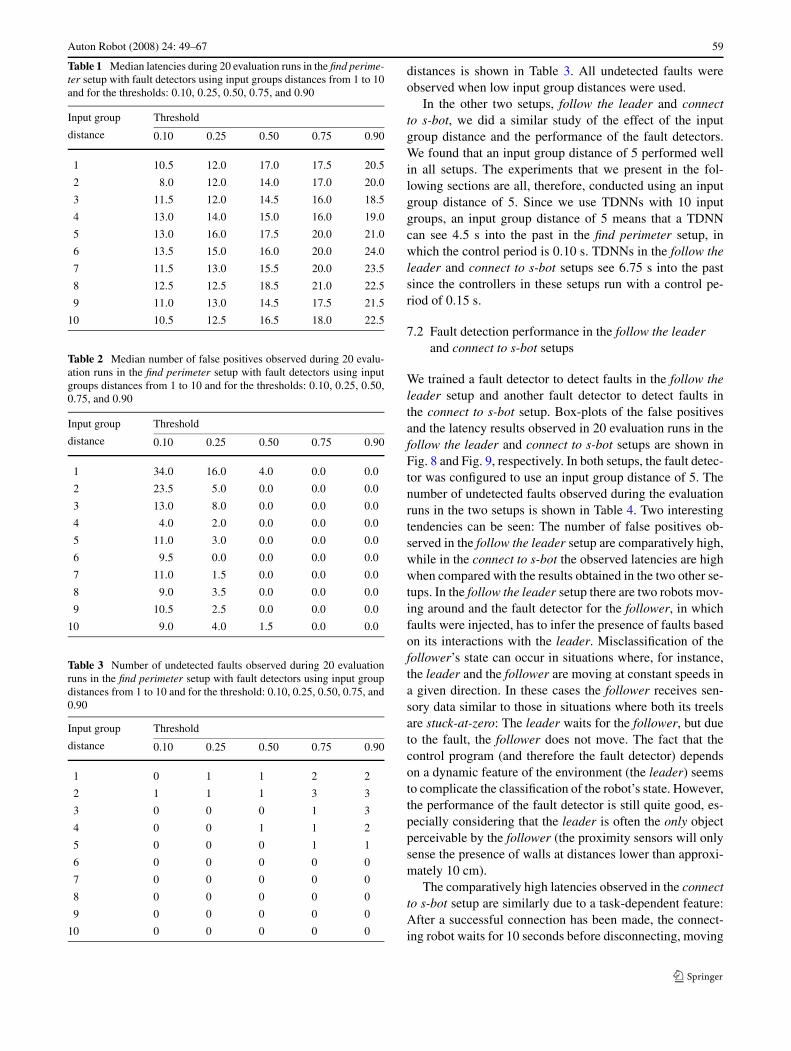
of the latencies2 and a box-plot of the number of false posi-tives observed during 20 evaluation runs in the find perime-ter setup. Results are shown for the five thresholds: 0.10,0.25, 0.50, 0.75, and 0.90. The median latencies and num-ber of false positives for each configuration of input groupdistance and threshold are summarized in Table 1 and Ta-ble 2, respectively.
The latency results in Fig. 6 show no clear correlationbetween latency and input group distance. The false positiveresults in Fig. 7, however, show that for low input groupdistances, 1 and 2 in particular, the fault detector in generaldetects a large number of false positives. No clear trend isobserved regarding the number of false positives for faultdetectors with input group distances above 4.
An input group distance of 1 means that the TDNN isprovided with data from the past 10 control cycles (becausethere are 10 input groups). 10 control cycles are equal to 1second in the find perimeter setup. Similarly, an input groupdistance of 2 means that the TDNN is provided with datafrom the past 2 seconds, but only from every other controlcycle. The false positive results indicate that data from aperiod longer than 2 seconds (i.e., an input group distancehigher than 2) is needed for accurate classification.
The results in Fig. 6 and Fig. 7 show that the performanceof the fault detectors, both in terms of latency and in terms
2For the latency results, we only include data from runs in which thefault was detected. See Table 3 for the number of undetected faults fordifferent input group distances and thresholds.

58 Auton Robot (2008) 24: 49–67
Fig. 6 Box-plot of the latenciesobserved in 20 evaluation runsin the find perimeter setup usingfault detectors with input groupdistances from 1 to 10. Resultsare shown for the thresholds0.10, 0.25, 0.50, 0.75, and 0.90.Each box comprisesobservations ranging from thefirst to the third quartile. Themedian is indicated by ahorizontal bar, dividing the boxinto the upper and lower part.The whiskers extend to thefarthest data points that arewithin 1.5 times the interquartilerange. Outliers are shown asdots. The results show that theinput group distance does nothave a major influence on thelatency of a fault detector, whilelarger thresholds yield longerlatencies
Fig. 7 Box-plot of the numberof false positives observed in 20evaluation runs in the findperimeter setup using faultdetectors with input groupdistances from 1 to 10. Resultsare shown for the thresholds0.10, 0.25, 0.50, 0.75, and 0.90.For low input group distances, 1and 2 in particular, the faultdetector in general detects alarge number of false positives,while no clear trend is observedfor fault detectors with inputgroup distances above 4. See thecaption of Fig. 6 for details onbox-plots
of the number of fault positives, is clearly affected by thechoice of the classification threshold: the lower the thresh-old, the lower the latency of the fault detector and the morefalse positives are observed. For the fault detector with aninput group distance of 5, for instance, the median latency is13 control cycles when a threshold of 0.10 is used, whereasthe median latency is 21 when a threshold of 0.90 is used.
For the same fault detector, the median number of false pos-itives is 11 if a threshold of 0.10 is used, while no false pos-itives are observed when a threshold of 0.90 is used.
In a few cases, a fault is never detected. Undetectedfault occur when a TDNNs output never exceeds the cho-sen threshold after a fault has been injected. The numberof undetected faults for different thresholds and input group
Auton Robot (2008) 24: 49–67 59
Table 1 Median latencies during 20 evaluation runs in the find perime-ter setup with fault detectors using input groups distances from 1 to 10and for the thresholds: 0.10, 0.25, 0.50, 0.75, and 0.90
Input group Threshold
distance 0.10 0.25 0.50 0.75 0.90
1 10.5 12.0 17.0 17.5 20.5
2 8.0 12.0 14.0 17.0 20.0
3 11.5 12.0 14.5 16.0 18.5
4 13.0 14.0 15.0 16.0 19.0
5 13.0 16.0 17.5 20.0 21.0
6 13.5 15.0 16.0 20.0 24.0
7 11.5 13.0 15.5 20.0 23.5
8 12.5 12.5 18.5 21.0 22.5
9 11.0 13.0 14.5 17.5 21.5
10 10.5 12.5 16.5 18.0 22.5
Table 2 Median number of false positives observed during 20 evalu-ation runs in the find perimeter setup with fault detectors using inputgroups distances from 1 to 10 and for the thresholds: 0.10, 0.25, 0.50,0.75, and 0.90
Input group Threshold
distance 0.10 0.25 0.50 0.75 0.90
1 34.0 16.0 4.0 0.0 0.0
2 23.5 5.0 0.0 0.0 0.0
3 13.0 8.0 0.0 0.0 0.0
4 4.0 2.0 0.0 0.0 0.0
5 11.0 3.0 0.0 0.0 0.0
6 9.5 0.0 0.0 0.0 0.0
7 11.0 1.5 0.0 0.0 0.0
8 9.0 3.5 0.0 0.0 0.0
9 10.5 2.5 0.0 0.0 0.0
10 9.0 4.0 1.5 0.0 0.0
Table 3 Number of undetected faults observed during 20 evaluationruns in the find perimeter setup with fault detectors using input groupdistances from 1 to 10 and for the threshold: 0.10, 0.25, 0.50, 0.75, and0.90
Input group Threshold
distance 0.10 0.25 0.50 0.75 0.90
1 0 1 1 2 2
2 1 1 1 3 3
3 0 0 0 1 3
4 0 0 1 1 2
5 0 0 0 1 1
6 0 0 0 0 0
7 0 0 0 0 0
8 0 0 0 0 0
9 0 0 0 0 0
10 0 0 0 0 0
distances is shown in Table 3. All undetected faults wereobserved when low input group distances were used.
In the other two setups, follow the leader and connectto s-bot, we did a similar study of the effect of the inputgroup distance and the performance of the fault detectors.We found that an input group distance of 5 performed wellin all setups. The experiments that we present in the fol-lowing sections are all, therefore, conducted using an inputgroup distance of 5. Since we use TDNNs with 10 inputgroups, an input group distance of 5 means that a TDNNcan see 4.5 s into the past in the find perimeter setup, inwhich the control period is 0.10 s. TDNNs in the follow theleader and connect to s-bot setups see 6.75 s into the pastsince the controllers in these setups run with a control pe-riod of 0.15 s.
7.2 Fault detection performance in the follow the leaderand connect to s-bot setups
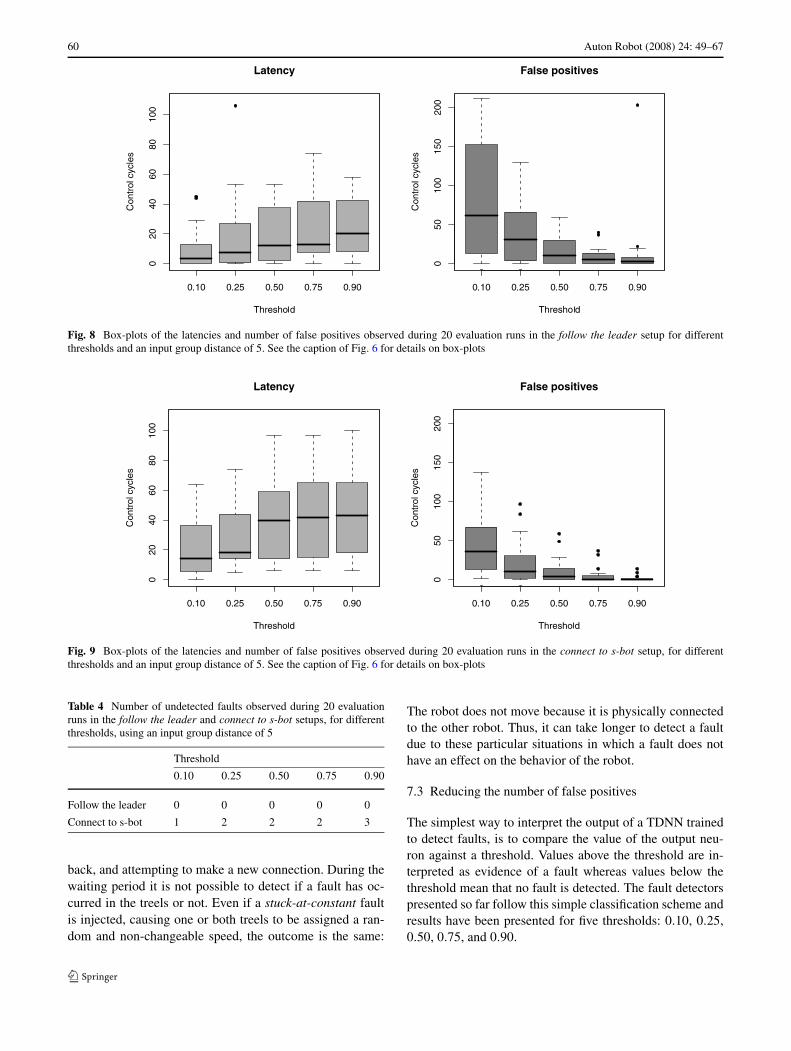
We trained a fault detector to detect faults in the follow theleader setup and another fault detector to detect faults inthe connect to s-bot setup. Box-plots of the false positivesand the latency results observed in 20 evaluation runs in thefollow the leader and connect to s-bot setups are shown inFig. 8 and Fig. 9, respectively. In both setups, the fault detec-tor was configured to use an input group distance of 5. Thenumber of undetected faults observed during the evaluationruns in the two setups is shown in Table 4. Two interestingtendencies can be seen: The number of false positives ob-served in the follow the leader setup are comparatively high,while in the connect to s-bot the observed latencies are highwhen compared with the results obtained in the two other se-tups. In the follow the leader setup there are two robots mov-ing around and the fault detector for the follower, in whichfaults were injected, has to infer the presence of faults basedon its interactions with the leader. Misclassification of thefollower’s state can occur in situations where, for instance,the leader and the follower are moving at constant speeds ina given direction. In these cases the follower receives sen-sory data similar to those in situations where both its treelsare stuck-at-zero: The leader waits for the follower, but dueto the fault, the follower does not move. The fact that thecontrol program (and therefore the fault detector) dependson a dynamic feature of the environment (the leader) seemsto complicate the classification of the robot’s state. However,the performance of the fault detector is still quite good, es-pecially considering that the leader is often the only objectperceivable by the follower (the proximity sensors will onlysense the presence of walls at distances lower than approxi-mately 10 cm).
The comparatively high latencies observed in the connectto s-bot setup are similarly due to a task-dependent feature:After a successful connection has been made, the connect-ing robot waits for 10 seconds before disconnecting, moving
60 Auton Robot (2008) 24: 49–67
Fig. 8 Box-plots of the latencies and number of false positives observed during 20 evaluation runs in the follow the leader setup for differentthresholds and an input group distance of 5. See the caption of Fig. 6 for details on box-plots
Fig. 9 Box-plots of the latencies and number of false positives observed during 20 evaluation runs in the connect to s-bot setup, for differentthresholds and an input group distance of 5. See the caption of Fig. 6 for details on box-plots
Table 4 Number of undetected faults observed during 20 evaluationruns in the follow the leader and connect to s-bot setups, for differentthresholds, using an input group distance of 5
Threshold
0.10 0.25 0.50 0.75 0.90
Follow the leader 0 0 0 0 0
Connect to s-bot 1 2 2 2 3
back, and attempting to make a new connection. During thewaiting period it is not possible to detect if a fault has oc-curred in the treels or not. Even if a stuck-at-constant faultis injected, causing one or both treels to be assigned a ran-dom and non-changeable speed, the outcome is the same:
The robot does not move because it is physically connectedto the other robot. Thus, it can take longer to detect a faultdue to these particular situations in which a fault does nothave an effect on the behavior of the robot.
7.3 Reducing the number of false positives
The simplest way to interpret the output of a TDNN trainedto detect faults, is to compare the value of the output neu-ron against a threshold. Values above the threshold are in-terpreted as evidence of a fault whereas values below thethreshold mean that no fault is detected. The fault detectorspresented so far follow this simple classification scheme andresults have been presented for five thresholds: 0.10, 0.25,0.50, 0.75, and 0.90.

Auton Robot (2008) 24: 49–67 61
Fig. 10 Box-plots of false positives results observed in 20 runs ineach of the three setups using fault detectors in which the output ofthe TDNN is used directly and fault detectors in which the output issmoothed by computing the moving average over 25 control cycles. Athreshold of 0.75 was used for all fault detectors. False positives wereonly observed during one run in the follow the leader setup when theTDNN’s output was smoothed. The run is not shown in the figure sinceit is out of scale (164 false positives were detected during this run). Seethe caption of Fig. 6 for details on box-plots
For many robotics tasks, a latency of a few seconds doesnot represent a risk: as long as a fault is eventually detected,the robot is able to communicate this to a human operatoror to other robots, who can then take the necessary steps toensure that the task is progressed. Accommodating a fault,on the other hand, is usually expensive, as other robots needto take action or a human operator needs to evaluate andsolve the situation. Frequent false positives, therefore, arelikely to have a negative impact on the performance.
One way of reducing the number of false positives isto choose a high threshold, e.g. 0.90, which results infewer false positives than lower thresholds (see for instanceFig. 9). Many of the false positives observed occur for a sin-gle or few consecutive control cycles only (like in the ex-ample in Fig. 5). This suggests an alternative way of re-ducing the number of false positives: to smooth the out-put of the trained neural networks. We do this by comput-ing the moving average of a trained TDNN’s output valueand basing the classification on this moving average ratherthan on the TDNN’s output directly. We configured thefault detectors to use a moving average over 25 control cy-cles of the TDNN’s output and a threshold of 0.75. Fig-ures 10 and 11 show respectively the number of false pos-itives and the latencies observed in 20 evaluation runs foreach task.
By computing the moving average and thereby smooth-ing the output of the TDNN, we almost completely elimi-nate false positives. As the results in Fig. 11 show, however,
Fig. 11 Box-plots of latency results observed in 20 runs in each of thethree setups using fault detectors in which the output of the TDNN isused directly and fault detectors in which the output is smoothed bycomputing the moving average over 25 control cycles. A threshold of0.75 was used for all fault detectors. See the caption of Fig. 6 for detailson box-plots
this is at the cost of a higher latency. Since the moving aver-age increases latency, it can result in more undetected faultsas more runs finish before faults are detected. In the findperimeter setup, 2 faults were not detected when averagingthe output over 25 control cycles, compared to only 1 whenaveraging was not used. Similarly, in the connect to s-botsetup, 5 faults were not detected when a moving averagewas used, compared to 2 when the output of the TDNN wasused directly. In the follow the leader setup all faults weredetected in both cases.
7.4 Faults in both sensors and actuators
Possible faults are not limited to the mechanical systems thatpropel robots; other hardware, such as sensors, can also fail.In this section, we demonstrate that our approach is equallyapplicable to faults in the sensors. We also show that a singleappropriately trained fault detector is capable of detectingfaults in both sensors and actuators. We first evaluate our ap-proach when only faults in sensors are considered. We thengo on to evaluate the approach when faults in both sensorsand the treels are considered. All experiments are conductedin the find perimeter setup.
We conducted a set of runs in which we injected faults inthe front infrared ground sensor, that is, the infrared groundsensor located closest to the gripper (see Fig. 3). We con-ducted another set of runs in which we injected faults inthe first and second light sensor counter-clockwise from the
62 Auton Robot (2008) 24: 49–67
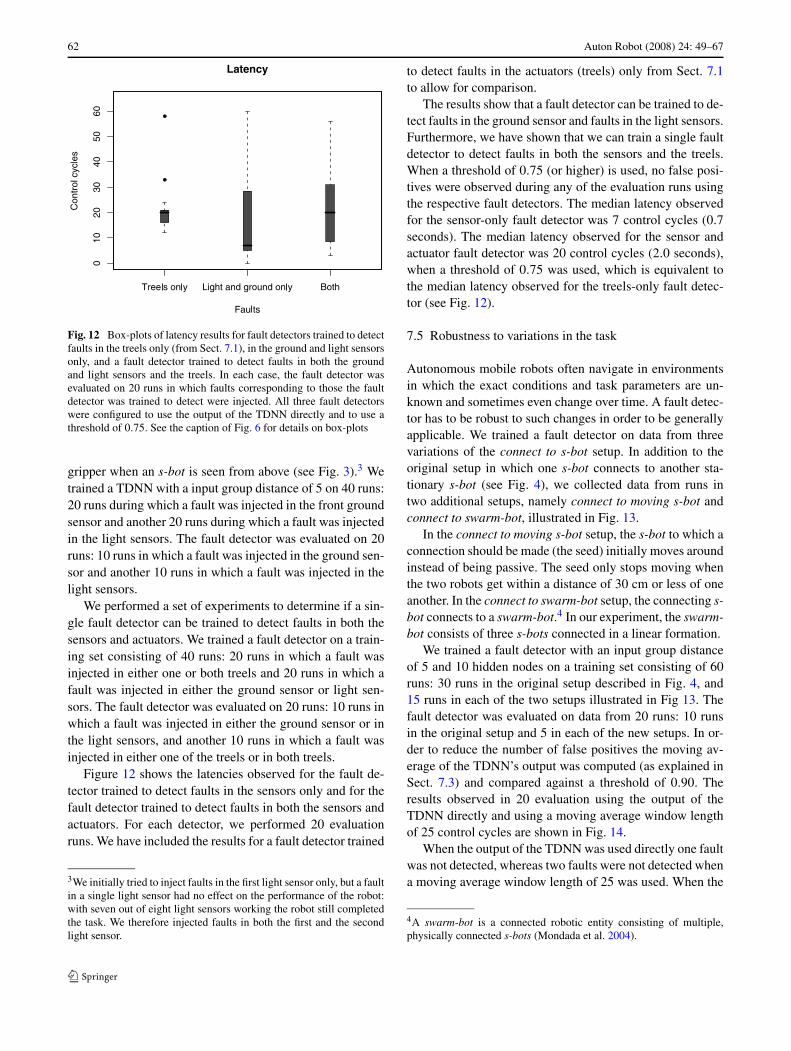
Fig. 12 Box-plots of latency results for fault detectors trained to detectfaults in the treels only (from Sect. 7.1), in the ground and light sensorsonly, and a fault detector trained to detect faults in both the groundand light sensors and the treels. In each case, the fault detector wasevaluated on 20 runs in which faults corresponding to those the faultdetector was trained to detect were injected. All three fault detectorswere configured to use the output of the TDNN directly and to use athreshold of 0.75. See the caption of Fig. 6 for details on box-plots
gripper when an s-bot is seen from above (see Fig. 3).3 Wetrained a TDNN with a input group distance of 5 on 40 runs:20 runs during which a fault was injected in the front groundsensor and another 20 runs during which a fault was injectedin the light sensors. The fault detector was evaluated on 20runs: 10 runs in which a fault was injected in the ground sen-sor and another 10 runs in which a fault was injected in thelight sensors.
We performed a set of experiments to determine if a sin-gle fault detector can be trained to detect faults in both thesensors and actuators. We trained a fault detector on a train-ing set consisting of 40 runs: 20 runs in which a fault wasinjected in either one or both treels and 20 runs in which afault was injected in either the ground sensor or light sen-sors. The fault detector was evaluated on 20 runs: 10 runs inwhich a fault was injected in either the ground sensor or inthe light sensors, and another 10 runs in which a fault wasinjected in either one of the treels or in both treels.
Figure 12 shows the latencies observed for the fault de-tector trained to detect faults in the sensors only and for thefault detector trained to detect faults in both the sensors andactuators. For each detector, we performed 20 evaluationruns. We have included the results for a fault detector trained
3We initially tried to inject faults in the first light sensor only, but a faultin a single light sensor had no effect on the performance of the robot:with seven out of eight light sensors working the robot still completedthe task. We therefore injected faults in both the first and the secondlight sensor.
to detect faults in the actuators (treels) only from Sect. 7.1to allow for comparison.
The results show that a fault detector can be trained to de-tect faults in the ground sensor and faults in the light sensors.Furthermore, we have shown that we can train a single faultdetector to detect faults in both the sensors and the treels.When a threshold of 0.75 (or higher) is used, no false posi-tives were observed during any of the evaluation runs usingthe respective fault detectors. The median latency observedfor the sensor-only fault detector was 7 control cycles (0.7seconds). The median latency observed for the sensor andactuator fault detector was 20 control cycles (2.0 seconds),when a threshold of 0.75 was used, which is equivalent tothe median latency observed for the treels-only fault detec-tor (see Fig. 12).
7.5 Robustness to variations in the task
Autonomous mobile robots often navigate in environmentsin which the exact conditions and task parameters are un-known and sometimes even change over time. A fault detec-tor has to be robust to such changes in order to be generallyapplicable. We trained a fault detector on data from threevariations of the connect to s-bot setup. In addition to theoriginal setup in which one s-bot connects to another sta-tionary s-bot (see Fig. 4), we collected data from runs intwo additional setups, namely connect to moving s-bot andconnect to swarm-bot, illustrated in Fig. 13.
In the connect to moving s-bot setup, the s-bot to which aconnection should be made (the seed) initially moves aroundinstead of being passive. The seed only stops moving whenthe two robots get within a distance of 30 cm or less of oneanother. In the connect to swarm-bot setup, the connecting s-bot connects to a swarm-bot.4 In our experiment, the swarm-bot consists of three s-bots connected in a linear formation.
We trained a fault detector with an input group distanceof 5 and 10 hidden nodes on a training set consisting of 60runs: 30 runs in the original setup described in Fig. 4, and15 runs in each of the two setups illustrated in Fig 13. Thefault detector was evaluated on data from 20 runs: 10 runsin the original setup and 5 in each of the new setups. In or-der to reduce the number of false positives the moving av-erage of the TDNN’s output was computed (as explained inSect. 7.3) and compared against a threshold of 0.90. Theresults observed in 20 evaluation using the output of theTDNN directly and using a moving average window lengthof 25 control cycles are shown in Fig. 14.
When the output of the TDNN was used directly one faultwas not detected, whereas two faults were not detected whena moving average window length of 25 was used. When the
4A swarm-bot is a connected robotic entity consisting of multiple,physically connected s-bots (Mondada et al. 2004).

Auton Robot (2008) 24: 49–67 63
Connect to moving s-bot: One s-bot attempts to physically connect to another s-bot (the seed)using its gripper. As long as the connecting s-bot is farther than 30 cm from the seed, theseed moves around. When the two robots get within 30 cm of one another, the seed stops.When a successful connection has been made, the connecting s-bot waits for 10 seconds,disconnects, moves back, and tries to connect again. Faults are injected in the connectings-bot only.
Connect to swarm-bot: One s-bot attempts to physically connect to a swarm-bot using itsgripper. In our experiment, the swarm-bot consists of three s-bots physically connected in alinear formation. When a successful connection has been made, the connecting s-bot waitsfor 10 seconds, disconnects, moves back, and tries to connect again. Faults are injected inthe connecting s-bot only.
Fig. 13 Two additional setups for the connect to s-bot controller used to evaluate if a fault detector can generalize over variations of the task
Fig. 14 Box-plots of the latencies and the number of false positivesobserved during 20 evaluation runs using a fault detector trained ondata from a total of 60 runs in all three variations of the connect to. . .
setup. Results are shown for moving average window lengths of 1(equivalent to using the output of the TDNN directly) and 25. A thresh-old of 0.90 was used. See the caption of Fig. 6 for details on box-plots
output of the TDNN is smoothed over 25 control cycles,false positives only occur in two out of the 20 evaluationruns. Hence, our results indicate that it is possible to trainfault detectors that are robust to variations in the task.
7.6 Exogenous fault detection
In robotics, exogenous fault detection is the activity in whichone robot detects faults that occur in other, physically sep-
64 Auton Robot (2008) 24: 49–67
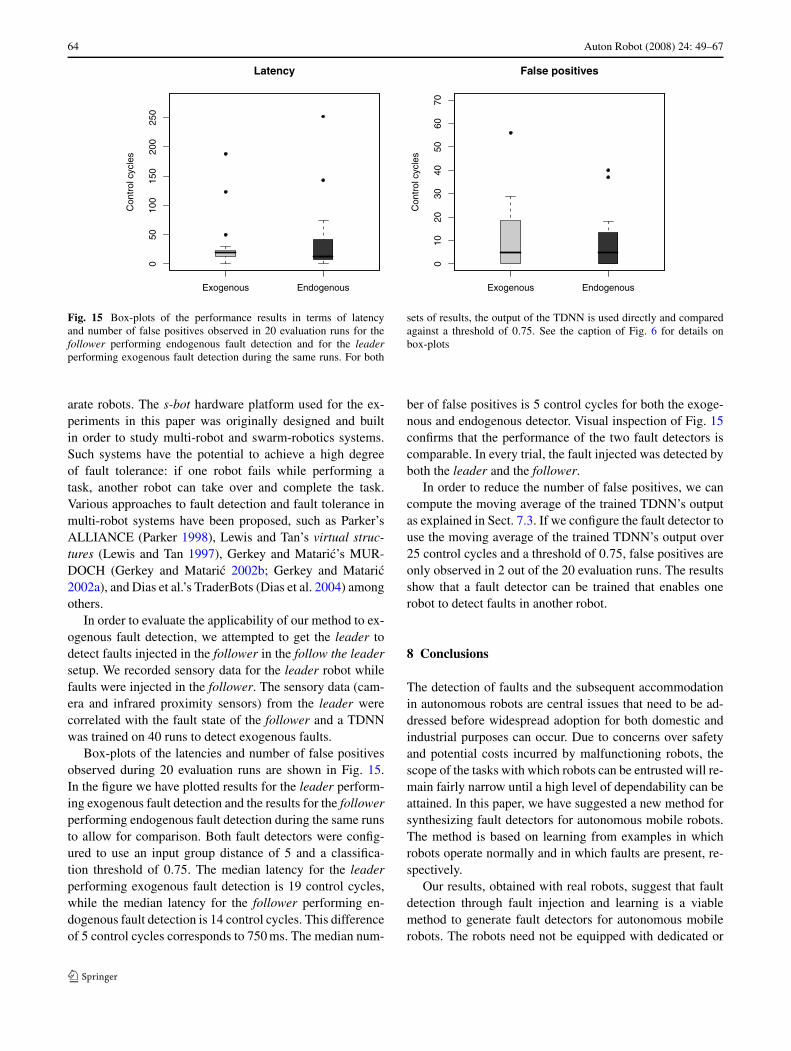
Fig. 15 Box-plots of the performance results in terms of latencyand number of false positives observed in 20 evaluation runs for thefollower performing endogenous fault detection and for the leaderperforming exogenous fault detection during the same runs. For both
sets of results, the output of the TDNN is used directly and comparedagainst a threshold of 0.75. See the caption of Fig. 6 for details onbox-plots
arate robots. The s-bot hardware platform used for the ex-periments in this paper was originally designed and builtin order to study multi-robot and swarm-robotics systems.Such systems have the potential to achieve a high degreeof fault tolerance: if one robot fails while performing atask, another robot can take over and complete the task.Various approaches to fault detection and fault tolerance inmulti-robot systems have been proposed, such as Parker’sALLIANCE (Parker 1998), Lewis and Tan’s virtual struc-tures (Lewis and Tan 1997), Gerkey and Mataric’s MUR-DOCH (Gerkey and Mataric 2002b; Gerkey and Mataric2002a), and Dias et al.’s TraderBots (Dias et al. 2004) amongothers.
In order to evaluate the applicability of our method to ex-ogenous fault detection, we attempted to get the leader todetect faults injected in the follower in the follow the leadersetup. We recorded sensory data for the leader robot whilefaults were injected in the follower. The sensory data (cam-era and infrared proximity sensors) from the leader werecorrelated with the fault state of the follower and a TDNNwas trained on 40 runs to detect exogenous faults.
Box-plots of the latencies and number of false positivesobserved during 20 evaluation runs are shown in Fig. 15.In the figure we have plotted results for the leader perform-ing exogenous fault detection and the results for the followerperforming endogenous fault detection during the same runsto allow for comparison. Both fault detectors were config-ured to use an input group distance of 5 and a classifica-tion threshold of 0.75. The median latency for the leaderperforming exogenous fault detection is 19 control cycles,while the median latency for the follower performing en-dogenous fault detection is 14 control cycles. This differenceof 5 control cycles corresponds to 750 ms. The median num-
ber of false positives is 5 control cycles for both the exoge-nous and endogenous detector. Visual inspection of Fig. 15confirms that the performance of the two fault detectors iscomparable. In every trial, the fault injected was detected byboth the leader and the follower.
In order to reduce the number of false positives, we cancompute the moving average of the trained TDNN’s outputas explained in Sect. 7.3. If we configure the fault detector touse the moving average of the trained TDNN’s output over25 control cycles and a threshold of 0.75, false positives areonly observed in 2 out of the 20 evaluation runs. The resultsshow that a fault detector can be trained that enables onerobot to detect faults in another robot.
8 Conclusions
The detection of faults and the subsequent accommodationin autonomous robots are central issues that need to be ad-dressed before widespread adoption for both domestic andindustrial purposes can occur. Due to concerns over safetyand potential costs incurred by malfunctioning robots, thescope of the tasks with which robots can be entrusted will re-main fairly narrow until a high level of dependability can beattained. In this paper, we have suggested a new method forsynthesizing fault detectors for autonomous mobile robots.The method is based on learning from examples in whichrobots operate normally and in which faults are present, re-spectively.
Our results, obtained with real robots, suggest that faultdetection through fault injection and learning is a viablemethod to generate fault detectors for autonomous mobilerobots. The robots need not be equipped with dedicated or

Auton Robot (2008) 24: 49–67 65
redundant sensors for the method to be applicable. For allthe results presented, only the information flowing betweenthe control program and the robots’ actuators and sensorsused for navigation was used. Although the performanceof fault detectors could probably be improved if data frommore (possibly dedicated) sensors were used, our resultsshow that a fairly small amount of key information is suf-ficient to obtain good fault detectors.
We applied the proposed method in three different tasksand we explored various aspects of the method: We showedthat it is possible to train fault detectors to detect faults inboth actuators and sensors. We demonstrated that a singlefault detector is capable of detecting faults of different typesand locations. We showed that we can train a fault detectorto be robust to variations in the task performed by a robot.Finally, we showed how the proposed method can be ex-tended to exogenous fault detection: In a follow the leadertask, we trained a fault detector for the leader robot to detectfaults that occurred in the follower robot.
In ongoing research, we are studying extensions to ourapproach that will allow for fault diagnosis. Our aim is toobtain neural networks that can not only detect the presenceof a fault but also the location of the fault. If the controlprogram is made aware that a component is broken, it coulddirect the robot to perform tasks for which the componentis not needed or only use behaviors not requiring the faultycomponent to be operational. For instance, in case a robot’sgripper breaks while the robot is pulling an object, the con-trol program could change the behavior from grasping andpulling to pushing the object, if made aware of the presenceand the location of the fault. One way of extending the pro-posed methodology to include fault diagnosis would be toadd more output neurons to the classifying neural network.Different output neurons would then correspond to differ-ent faults. Another approach could be to use multiple neuralnetworks, one for each component in which faults should bediagnosed.
Acknowledgements This work was supported by the SWARMA-NOID project, funded by the Future and Emerging Technologies pro-gramme (IST-FET) of the European Commission, under grant IST-022888. Anders Christensen acknowledges support from COMP2SYS,a Marie Curie Early Stage Research Training Site funded by the Eu-ropean Community’s Sixth Framework Programme (grant MEST-CT-2004-505079). The information provided is the sole responsibility ofthe authors and does not reflect the European Commission’s opinion.The European Commission is not responsible for any use that might bemade of data appearing in this publication. This work was supportedby the ANTS project, an Action de Recherche Concertée funded bythe Scientific Research Directorate of the French Community of Bel-gium. Mauro Birattari and Marco Dorigo acknowledge support fromthe Belgian F.R.S.-FNRS, of which they are a Research Associate anda Research Director, respectively.
References
Arlat, J., Aguera, M., Amat, L., Crouzet, Y., Fabre, J., Laprie, J., Mar-tins, E., & Powell, D. (1990). Fault injection for dependabilityvalidation: a methodology and some applications. IEEE Transac-tions on Software Engineering, 16(2), 166–182.
Ashokaraj, I., Tsourdos, A., Silson, P., & White, B. A. (2004). Sen-sor based robot localisation and navigation: using interval analy-sis and unscented Kalman filter. In Proceedings of the 2004IEEE/RSJ international conference on intelligent robots and sys-tems (IROS 2004) (Vol. 1, pp. 64–70). Las Vegas: IEEE Press.
Canham, R., Jackson, A., & Tyrrell, A. (2003). Robot error detectionusing an artificial immune system. In Proceedings of NASA/DoDconference on evolvable hardware (pp. 199–207). Washington:IEEE Computer Society.
Carlson, J., & Murphy, R. (2003). Reliability analysis of mobile robots.In Proceedings of IEEE international conference on robotics andautomation, ICRA’03 (Vol. 1, pp. 274–281). Los Alamitos: IEEEComputer Society Press.
Clouse, D., Giles, C., Horne, B., & Cottrell, G. (1997). Time-delayneural networks: representation and induction of finite-state ma-chines. IEEE Transactions on Neural Networks, 8, 1065–1070.
Dearden, R., Hutter, F., Simmons, R., Thrun, S., Verma, V., & Willeke,T. (2004). Real-time fault detection and situational awareness forrovers: report on the Mars technology program task. In Proceed-ings of IEEE aerospace conference (Vol. 2, pp. 826–840). LosAlamitos: IEEE Computer Society Press.
Dias, M. B., Zinck, M. B., Zlot, R. M., & Stentz, A. (2004). Robustmultirobot coordination in dynamic environments. In Proceedingsof IEEE conference on robotics and automation, ICRA’04 (Vol. 4,pp. 3435–3442). Piscataway: IEEE Press.
Dorigo, M., Trianni, V., Sahin, E., Groß, R., Labella, T. H., Baldassarre,G., Nolfi, S., Deneubourg, J.-L., Mondada, F., Floreano, D., &Gambardella, L. M. (2004). Evolving self-organizing behaviorsfor a swarm-bot. Autonomous Robots, 17(2–3), 223–245.
Forrest, S., Perelson, A., Allen, L., & Cherukuri, R. (1994). Self-nonself discrimination in a computer. In Proceedings of the 1994IEEE symposium on research in security and privacy (Vol. 212,pp. 202–212). Los Alamitos: IEEE Computer Society.
Gerkey, B., & Mataric, M. J. (2002a). Pusher-watcher: an approachto fault-tolerant tightly-coupled robot coordination. In Proceed-ings of IEEE international conference on robotics and automa-tion, ICRA’02 (pp. 464–469). Piscataway: IEEE Press.
Gerkey, B. P., & Mataric, M. J. (2002b). Sold!: Auction methods formultirobot coordination. IEEE Transactions on Robotics and Au-tomation, 18(5), 758–768.
Gertler, J. J. (1988). Survey of model-based failure detection and iso-lation in complex plants. IEEE Control Systems Magazine, 8,3–11.
Goel, P., Dedeoglu, G., Roumeliotis, S., & Sukhatme, G. (2000).Fault detection and identification in a mobile robot using multi-ple model estimation and neural network. In Proceedings of IEEEinternational conference on robotics and automation, ICRA’00(Vol. 3, pp. 2302–2309). Los Alamitos: IEEE Computer SocietyPress.
Groß, R., Bonani, M., Mondada, F., & Dorigo, M. (2006). Autonomousself-assembly in swarm-bots. IEEE Transactions on Robotics,22(6), 1115–1130.
Hinchey, M., Rash, J., Rouff, C., & Truszkowski, W. (2004). NASA’sswarm missions: the challenge of building autonomous software.IT Professional, 6, 47–52.
Hsueh, M., Tsai, T., & Iyer, R. (1997). Fault injection techniques andtools. Computer, 30(4), 75–82.

66 Auton Robot (2008) 24: 49–67
Isermann, R. (1997). Supervision, fault-detection and fault-diagnosismethods—an introduction. Control Engineering Practice, 5(5),639–652.
Isermann, R., & Ballé, P. (1997). Trends in the application of model-based fault detection and diagnosis of technical processes. ControlEngineering Practice, 5(5), 709–719.
Julier, S. J., & Uhlmann, J. K. (1997). A new extension of the Kalmanfilter to nonlinear systems. In Proceedings of the 11th interna-tional symposium on aerospace/defense sensing, simulation andcontrols (Vol. 3, pp. 182–193). Bellingham: SPIE.
Kalman, R. (1960). A new approach to linear filtering and predictionproblems. Journal of Basic Engineering, 82(1), 35–45.
Kochan, A. (2005). A bumper year for robots. Industrial Robot: AnInternational Journal, 32, 201–204.
Leonard, J. J., & Durrant-Whyte, H. F. (1991). Mobile robot localiza-tion by tracking geometric beacons. IEEE Transactions on Robot-ics and Automation, 7(3), 376–382.
Lerner, U., Parr, R., Koller, D., & Biswas, G. (2000). Bayesian faultdetection and diagnosis in dynamic systems. In Proceedings of the7th national conference on artificial intelligence (pp. 531–537).Cambridge: AAAI Press/MIT Press.
Lewis, M. A., & Tan, K. H. (1997). High precision formation control ofmobile robots using virtual structures. Autonomous Robots, 4(4),387–403.
Li, P., & Kadirkamanathan, V. (2001). Particle filtering based like-lihood ratio approach to fault diagnosis in nonlinear stochasticsystems. IEEE Transactions Systems, Man Cybernetics, Part C,31(3), 337–343.
Marsland, S., Nehmzow, U., & Shapiro, J. (2005). On-line novelty de-tection for autonomous mobile robots. Robotics and AutonomousSystems, 51(2–3), 191–206.
Mondada, F., Pettinaro, G. C., Guignard, A., Kwee, I., Floreano, D.,Deneubourg, J.-L., Nolfi, S., Gambardella, L., & Dorigo, M.(2004). Swarm-bot: a new distributed robotic concept. Au-tonomous Robots, 17(2–3), 193–221.
Mondada, F., Gambardella, L. M., Floreano, D., Nolfi, S., Deneubourg,J.-L., & Dorigo, M. (2005). The cooperation of swarm-bots: phys-ical interactions in collective robotics. IEEE Robots and Automa-tion Magazine, 12(2), 21–28.
Nouyan, S., Groß, R., Bonani, M., Mondada, F., & Dorigo, M. (2006).Group transport along a robot chain in a self-organised robotcolony. In T. Arai, R. Pfeifer, T. Balch, & H. Yokoi (Eds.), In-telligent autonomous systems (Vol. 9, pp. 433–442). Amsterdam:IOS Press.
Nouyan, S., Campo, A., & Dorigo, M. (2008). Path formation in a robotswarm: self-orgenized strategies to find your way home. SwarmIntelligence, 1(2).
O’Grady, R., Groß, R., Mondada, F., Bonani, M., & Dorigo, M. (2005).Self-assembly on demand in a group of physical autonomous mo-bile robots navigating rough terrain. In M. S. Capcarrere, A. A.Freitas, P. J. Bentley, C. G. Johnson, & J. Timmis (Eds.), Lecturenotes in artificial intelligence: Vol. 3630. Advances in artificiallife: 8th European conference, ECAL 2005 (pp. 272–281). Berlin:Springer.
Parker, L. E. (1998). ALLIANCE: an architecture for fault tolerantmultirobot cooperation. IEEE Transactions on Robotics and Au-tomation, 14(2), 220–240.
Patton, R., Uppal, F., & Lopez-Toribio, C. (2000). Soft computingapproaches to fault diagnosis for dynamic systems: a survey. InA. Edelmayer, C. Banyasz (Eds.), Proceedings of 4th IFAC sym-posium on fault detection supervision and safety for technicalprocesses (Vol. 1, pp. 298–311). Oxford: Elsevier.
Roumeliotis, S., Sukhatme, G., & Bekey, G. (1998). Sensor fault de-tection and identification in a mobile robot. In Proceedings of
IEEE/RSJ international conference on intelligent robots and sys-tems (Vol. 3, pp. 1383–1388). Los Alamitos: IEEE Computer So-ciety Press.
Rumelhart, D. E., Hinton, G. E., & Williams, R. J. (1986). Learninginternal representations by back-propagating errors. Nature, 323,533–536.
Skoundrianos, E. N., & Tzafestas, S. G. (2004). Finding fault—fault di-agnosis on the wheels of a mobile robot using local model neuralnetworks. IEEE Robotics and Automation Magazine, 11(3), 83–90.
Smith, R., & Cheeseman, P. (1986). On the representation and estima-tion of spatial uncertainty. The International Journal of RoboticsResearch, 5(4), 56.
Terra, M., & Tinos, R. (2001). Fault detection and isolation in roboticmanipulators via neural networks: a comparison among threearchitectures for residual analysis. Journal of Robotic Systems,18(7), 357–374.
Trianni, V., & Dorigo, M. (2006). Self-organisation and communica-tion in groups of simulated and physical robots. Biological Cy-bernetics, 95, 213–231.
Verma, V., & Simmons, R. (2006). Scalable robot fault detection andidentification. Robotics and Autonomous Systems, 54(2), 184–191.
Verma, V., Gordon, G., Simmons, R., & Thrun, S. (2004). Real-timefault diagnosis. IEEE Robotics and Automation Magazine, 11(2),56–66.
Vemuri, A., & Polycarpou, M. (1997). Neural-network-based robustfault diagnosis in robotic systems. IEEE Transactions on NeuralNetworks, 8(6), 1410–1420.
Waibel, A., Hanazawa, T., Hinton, G., Shikano, K., & Lang, K. (1989).Phoneme recognition using time-delay neural networks. IEEETransactions Acoustics, Speech, and Signal Processing, 37, 328–339.
Anders Lyhne Christensen is currently a re-searcher at IRIDIA, CoDE, Université Libre deBruxelles, Belgium. He has spent several yearsin the private sector and worked on softwareprojects ranging from 3D acoustics to high per-formance computing. In 2002, he obtained hisfirst master’s degree in computer science andbio-informatics from Aalborg University, Den-mark. Later that year, he received a Marie CurieFellowship hosted by the Dependable Systems
Group at the Universidade de Coimbra and Critical Software, Portu-gal. He completed his DEA at Université Libre de Bruxelles in 2005.He has published work in bio-informatics, high performance comput-ing, and autonomous robotics. His current research interests are in de-pendable swarm robotics, autonomous self-assembly, and evolutionaryrobotics.
Rehan O’Grady is a researcher at the IRIDIA,CoDE, Université Libre de Bruxelles, Belgium.He graduated in 1999 from Edinburgh Univer-sity with First Class Honors in mathematicsand computer science. He received the KevinClark memorial prize, awarded each year to thetop mathematics and computer science gradu-ate. He subsequently worked in the software in-dustry for several years. During his time at Mi-cromuse PLC he developed a system for mon-
itoring usage outages in Internet network services which was subse-quently patented. He received the DEA from the Université Libre deBruxelles in 2005. His current research interests are in swarm roboticsand self-assembling robotic systems.

Auton Robot (2008) 24: 49–67 67
Mauro Birattari received a master’s degree inelectrical and electronic engineering from thePolitecnico di Milano, Milan, Italy, in 1997, anda doctoral degree in Information Technologiesfrom the Faculty of Engineering of the Univer-sité Libre de Bruxelles, Brussels, Belgium, in2004. He is currently with IRIDIA, CoDE, Uni-versité Libre de Bruxelles, as a research asso-ciate of the fund for scientific research F.R.S.-FNRS of Belgium’s French Community. Dr. Bi-
rattari co-authored about 50 peer-reviewed scientific publications inthe field of computational intelligence. His research interests focus onswarm intelligence, ant colony optimization, machine learning, and onthe application of artificial intelligence techniques to the automatic de-sign of algorithms. Dr. Birattari is an Associate Editor for the journalSwarm Intelligence and has served in the organizing committee of thethird, fourth, and fifth edition of the International Workshop on AntColony Optimization and Swarm Intelligence.
Marco Dorigo received the master degree in in-dustrial technologies engineering in 1986 andthe doctoral degree in information and systemselectronic engineering in 1992 from Politecnicodi Milano, Milan, Italy, and the title of Agrégéde l’Enseignement Supérieur, from the Uni-versité Libre de Bruxelles, Belgium, in 1995.From 1992 to 1993 he was a research fellowat the International Computer Science Instituteof Berkeley, CA. In 1993 he was a NATO-CNR
fellow, and from 1994 to 1996 a Marie Curie fellow. Since 1996 he hasbeen a tenured researcher of the F.R.S.-FNRS, the fund for scientificresearch of Belgium’s French Community, and a research director ofIRIDIA, the artificial intelligence laboratory of the Université Libre deBruxelles. He is the inventor of the ant colony optimization metaheuris-tic. His current research interests include swarm intelligence, swarmrobotics, and metaheuristics for discrete optimization. Dr. Dorigo isthe Editor-in-Chief of the Swarm Intelligence journal, and an AssociateEditor or member of the editorial board for many journals in computa-tional intelligence and adaptive systems. In 1996 he was awarded theItalian Prize for Artificial Intelligence, in 2003 the Marie Curie Excel-lence Award, in 2005 the Dr A. De Leeuw-Damry-Bourlart award inapplied sciences and in 2007 the Cajastur International Prize for SoftComputing.