faults on skylab imagery of the salton trough area
TRANSCRIPT

V7c0
/' )rt flC 2 01 C
or•C ,
TECHNICAL REPORT 75-1
FAULTS ON 2S',YLAB IMAGERY OF THE SALTON
TROUGH AREA, SOUTHERN CALIFORNIA
June IL975
by
P . M: Merifield~ ,and D . L .' Lamar 1430"
California Earth ~c :Lence Corporation1318 Second Street, Suite 27
Santa Monica, California 90401Telephone : (213) 395-4528
for
David Amsbury, Technical MonitorNASA Lyndon B . Johnson Space Center
Houston, Texas
Sponsored by NASA Lyndon B . Johnson Space CenterContract NAS 2-7698
The views and conclusions contained in this document are thoseof the authors and should not be interpreted as necessarilyrepresenting the official policies, either expressed or implied,of the U .S . Government.
VI
PREFACE
The regional geologic structure displayed on Skylab photos of the
Salton Trough area was studied as a part of a broader investigation to
apply Skylab images to the analysis of fault tectonics and earthquake
hazards of southern California . This research was sponsored by the NASA
Lyndon B . Johnson Space Center . A portion of this report was presented
at the NASA Earth Resources Survey Symposium, June 8-13, 1975, Houston,
Texas and is in press in the Proceedings Volume .
ERRATA
Faults on Skylab Imagery of Salton Trough Area, Southern California,California Earth Science Corporation Technical Report 75-1
Caption to Fig . 8, p . 10 should read :
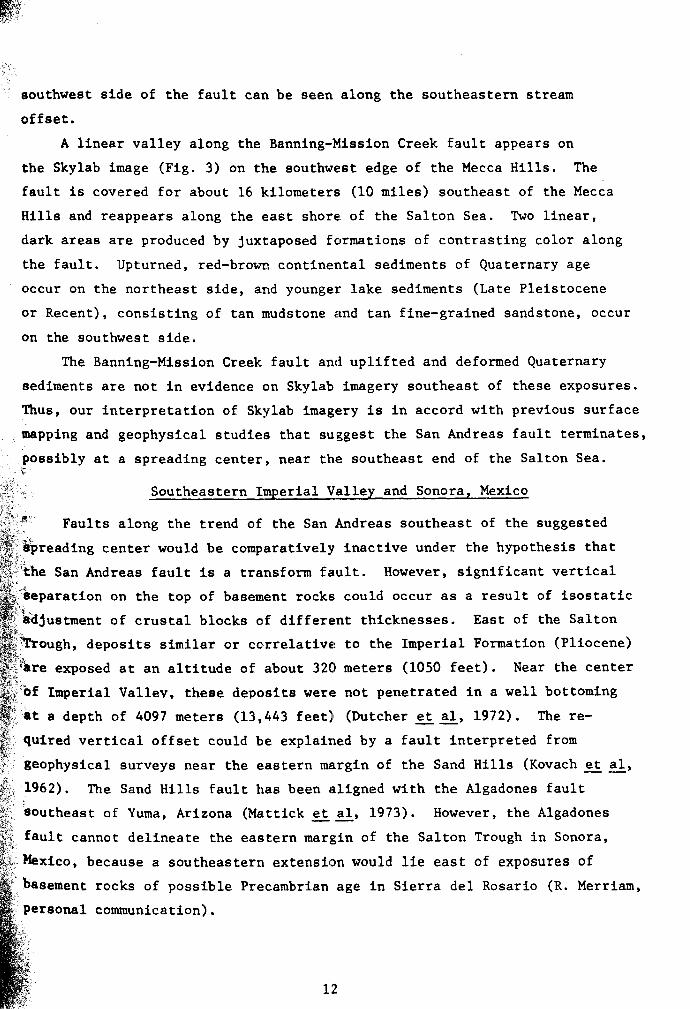
Fig. 8 - Low-altitude aerial view looking eastward along Blue Cut Fault . BlueCut is in middle view and Pleasant Valley is in the background .
ii

CONTENTS
PREFACE
ABSTRACT
INTRODUCTION
Orocopia Linear
OTHER FAULTS IN THE SALTON TROUGH AREA
Figure 1 Map showing major faults in southern Californiaand northern Mexico
Figure 2 Map of Salton Trough and vicinity showing faultsand linears seen on Skylab images
Figure 3 Skylab image of Salt:on Sea and vicinity . Portionof Skylab 4, 190A camera, Roll 76, Frame 82 . . . .
Figure 4 Skylab image of Salton Trough between Gulf ofCalifornia and Imperial Valley . Portion of Skylab2, 190A camera, Roll 4, Frame 134
Figure 5 Skylab image of Indio Hills and vicinity . Enlargedportion of Skylab 4, 190B camera, Roll 92, Frame352
Figure 6 Map of Indio Hills and vicinity showing featuresidentified on Skylab image (Fig . 5)
Figure 7 Low-altitude view looking northwestward alongBanning fault . . .. .
Figure 8 Low-altitude view looking eastward along Blue Cut
Page
ii
1
2
SAN ANDREAS FAULT 2
Coachella Valley area 8
Southeastern Imperial Valley and Sonora, Mexico12
SAN JACINTO FAULT ZONE 14
EAST TRENDING FAULTS 16
Blue Cut Fault 16
Porcupine Wash, Substation and Victory Pass Faults . . . . 17
18
19
CONCLUSIONS 19
ACKNOWLEDGEMENTS 20
REFERENCES 21
ILLUSTRATIONS
3
4
5
6
7
7
10
Fault 10
iii

ABSTRACT
Large segments of the major high-angle faults in the Salton Trough
area are readily identifiable in Skylab images . Along active faults,
distinctive topographic features such as scarps and offset drainage, and
vegetation differences due to ground water blockage in alluvium are visible .
Other fault-controlled features along inactive as well as active faults
visible in Skylab photography include straight mountain fronts, linear valleys
and lithologic differences producing contrasting tone, color or texture . A
northwestern extension of a fault in the San Andreas set, inferred by recent
geophysical work in northwest Sonora, is postulated by the regional align-
ment of possible fault-controlled features . The suspected fault is covered
by Holocene deposits, principally windblown sand ; subsurface exploration
would be necessary to verify its existence . A northwest trending tonal change
in cultivated fields across Mexicali Valley is visible on Skylab photos .
Surface evidence for faulting has not been observed ; however, the linear may
be caused by differences in soil conditions along an extension of a segment
of the San Jacinto fault zone . No evidence of faulting could be found along
linears which appear as possible extensions of the Substation and Victory
Pass faults, demonstrating that the interpretation of linears as faults in
small-scale photography must be corroborated by field investigations . The
principal advantage of Skylab images for regional fault studies is the synoptic
view which makes regional alignments of structural features apparent . The
high resolution is an additional advantage because distinctive fault-controlled
topographic features can be identified .
1
INTRODUCTION
The structure of the Salton Trough is of considerable interest because
of the region's geothermal resources and the controversy concerning south-
eastern extensions of the San Andreas fault zone beyond the southeast end
of the Salton Sea . This paper describes the application of Skylab imagery,
in conjunction with larger scale photography and field investigations, to
improved knowledge of the location and history of movement of faults in the
Salton Trough area . The Salton Trough extends from the upper Coachella Valley
north of the Salton Sea to the Gulf of California ; the regional structure is
dominated by the northwest trending San Andreas and San Jacinto fault zones
(Fig . 1) .
Photos of the Salton Trough taken from Skylab provide a remarkable over-
view which aids in the interpretation of the regional relationship between
structural features . A photo interpretation of faults and linears appearing
on Skylab images of the region between the north end of the Salton Trough and
he Gulf of California was accomplished . Features identified in this study,
and the areas covered by the Skylab images utilized, are shown in Fig . 2, and
the individual Skylab images are reproduced as Figs . 3, 4, and 5 . Detailed
nvestigations consisting of field studies and aircraft overflights of critical
ocations were concentrated in the area north of the Salton Sea covered by
;Pigs . 3 and 5 . South of the Salton Sea, reconnaissance studies were made of
linears which may represent previously unrecognized fault segments along the
trends of the San Andreas and San Jacinto fault zones .
SAN ANDREAS FAULT
The San Andreas fault, the major tectonic feature of California, extends
or nearly 1000 kilometers (600 miles) southeasterly from the Pacific Ocean
near Point Arena to at least a point approximately midway along the eastern
shore of the Salton Sea (Fig . 1) . The fault is the most recent surface
Upture within a zone of roughly parallel fractures that branch and interlace
ithin a zone as much as 10 kilometers (6 miles) wide (Crowell, 1962) . The
coup of major faults roughly parallel to the San Andreas fault in southern
2
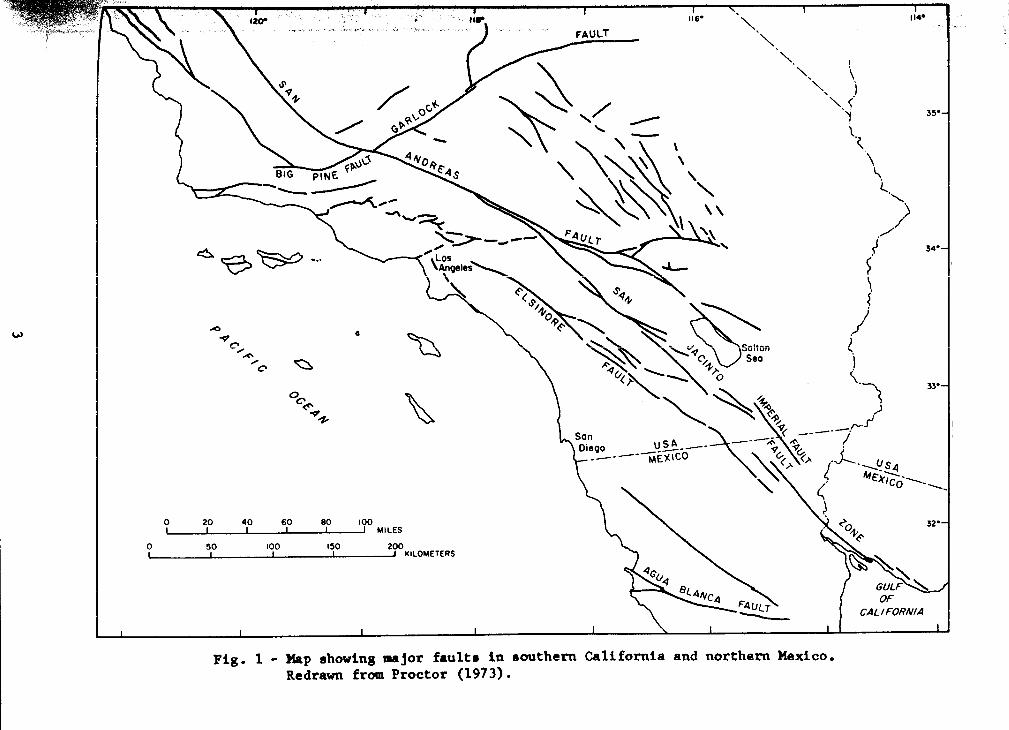
Fig . 1 - Map showing major faults in southern California and northern Mexico .Redrawn from Proctor (1973) .

Fig . 3
5
hS
!t p̀
,••
Jet./'(p
PB 'O412
0
Olbv~J6
01Q0 B
~pJ
PC v Op011p,
34°
LSBM
Q
GFig .5
'
-Q-0Mission~ kjr -*4.JP~
MnCF
ysA'
-'--~
MCFCOACHELLA VALLEY
/
MOG
~r4jNSVPF
33°
0
20
40
60 KMI1II
ROSARIO 3P°LAKE (LogunoPrieto )
Foul] • a~' • . . ,
114°,umner . .'*'k
33°
116° /\/ .
Fig . 2 - Map of Salton Trough and vicinity showing faults and linears seen on Skylab images or discussed
in text . The outlines of Skylab images included in this report are indicated . Explanation : solid
line : photo linear coincident with known fault or fault line scarp ; dashed line : photo linearrelated to possible surface expression of fault ; dotted line : covered fault ; xxx : photo linear
with no evidence of faulting . Abbreviations : BC : Blue Cut ; BF : Banning fault ; BV : Borrego Valley ;
04 : Coyote Mountain ; EDC : El Dorado Canyon ; HSF : Hidden Springs fault ; IF : Indio fault ; LSBM :
Little San Bernardino Mountains ; MCF : Mission Creek fault ; )H : Mecca Hills ; PB : Pinto Basin ;
PC , Pinkham Canyon ; PV : Pleasant Valley, PWF : Porcupine Wash fault ; SF : Substation fault ;
VPF : Victory Pass fault .
SIERRA DEL

Fig .3 - Salton Sea and vicinity . Portion of Skylab 4, 190A camera, Roll 76,Frame 82 (original in natural color) . See rig . 2 for features identified .
5
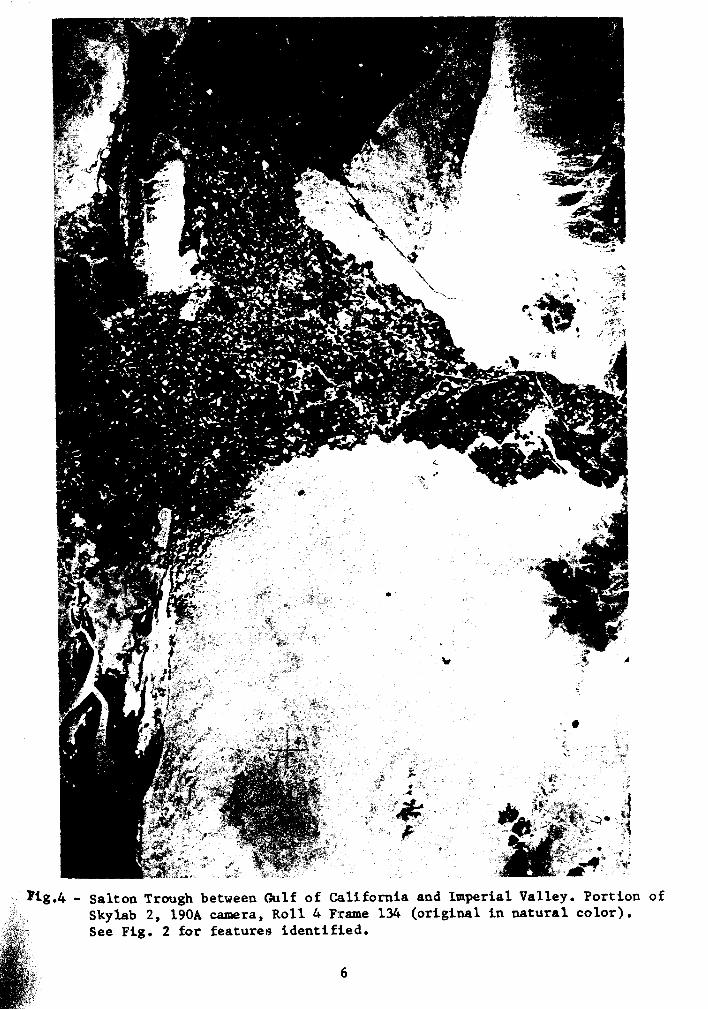
Fig .4 - Salton Trough between Gulf of California and Imperial Valley . Portion ofSkylab 2, 190A camera, Roll 4 Frame 134 (original in natural color) .See Fig . 2 for features identified .
6

Fig . S- Indio Hills and vicinity Enlargedcolor)portion
tSee Figs6y for featage .
e s identifiedas Roll 92,Frame 352 (original in naturalnatural
`` \/;d'o i /'.
Vegetation U /fFault
TPO
H I L L STBP
Mission
IN 010Vegetation
WPR
/ /S P
/Foult114.
'4 INEDOM H ILL .
•
~~OACNELLA 0 10 Km INDIO
Fig.6- Map of Indio Hills and vicinity showing features identified on Fig . S . Solid lines indicate
prominent linear features along faults discussed einn
text .. Hachure dTline 'staindicatePa
oundaries
of physiographic features . Abbreviations
TPO : Thousand Palms Oasis ; WP : Willis Palms .

California, such as the San Jacinto and Elsinore, are included in the San
Andreas fault system by Crowell (1962) and Dibblee (1968) and in the San
Andreas set by Hill (1965) .
Southeast of the Salton Sea, surface evidence of faulting in late
Quaternary sediments and seismic activity are lacking ; and on the basis of
subsurface investigations, Biehler et al (1964) conclude that a southeastern
extension of the San Andreas fault cannot be justified . Allen et al (1972)
have suggested that the San Anddreas fault is a right-lateral transform fault
and that activity at the southeast end may terminate at a spreading center .
The spreading center could lie between the San Andreas and San Jacinto faults
beneath Quaternary volcanic rocks and geothermal anomalies on the southeast
shore of the Salton Sea (Elders et al, 1972) . According to this hypothesis,
northwest trending faults southeast of the termination of the active San Andreas
fault would have little or no horizontal displacement but would bring crusts of
different age and character into juxtaposition . The eastern edge of the Salton
Trough sedimentary basin is possibly delineated by such faults, with abrupt
differences in depth to basement . The active San Andreas fault zone in
Coachella Valley northwest of the hypothetical spreading center and other
known and inferred faults with the same trend to the southeast are described
below .
Coachella Valley Area
At the northwest end of Coachella Valley, the Banning and Mission Creek
faults comprise the main branches of the San Andreas (Figs . 2 and 6) . East
oaf its juncture with the south branch of the San Andreas in San Gorgonio Pass,
on the south slope of the San Bernardino Mountains, the Banning fault is a
north-dipping thrust fault with basement rocks thrust over Tertiary sediments
and Pleistocene gravels (Allen, 1957) . To the southeast in Coachella Valley,
the Banning fault becomes a "high-angle fault characteristic of the San Andreas
with right-slip movements that involve Pleistocene and Recent alluvial sedi-
ments" (Dibblee, 1968) .
The Mission Creek fault dips steeply (62 0-900) to the northeast . Recent
movement is indicated by trenches and scarplets in alluvium, offset streams
and dammed ground water, which is hot and shallow on the northeast side of
the fault and cold and deep on the southwest side (Proctor, 1958) . The
8

Cabazon Fanglomerate (Holocene) shows a minimum of 330 meters (1100 feet)
of vertical separation (north side up), and right-lateral stream offsets
up to 240 meters (800 feet) are present in the Indio Hills . Proctor (1958)
has suggested that the 1948 Desert Hot Springs earthquake occurred on the
Mission Creek fault, but Wallace (1970) has questioned this interpretation .
The Banning fault and Mission Creek fault join directly north of Indio
(Fig . 6) ; from this point the San Andreas fault zone trends about S45 °E to
the possible spreading center southeast of the Salton Sea . A zone of tightly
folded and sheared Cenozoic sediments that form spectacular linear valleys
occurs along this portion of the fault (Allen et al, 1972) . Displacements
up to 1 .3 centimeters ( .5 inch) and creep along the San Andreas from the
Mecca Hills to its terminus east of the Salton Sea were apparently triggered
by the 1968 Borrego Mountain earthquake (Allen et al, 1972) . These breaks
coincide with recently active segments of the San Andreas fault zone mapped
by Hope (1969a) .
Fig . 5 is an enlarged portion of a Skylab image of the north end of
Coachella Valley which shows strands of the San Andreas fault zone and other
faults in greater detail . The locations of individual features on Fig . 5
are shown on the sketch map (Fig. 6) . Unless otherwise indicated, the faults
are most distinct in the aerial color photography ; of the black and white
bands, the red ( .6- .7 pm) is superior for topographic detail, and vegetated
areas are most apparent in the color IR .
The Banning fault is visible on Skylab imagery for most of the interval
from its convergence with the Mission Creek fault directly north of Indio,
to the north end of Coachella Valley . The fault is most prominently delineated
as an abrupt break in vegetation for 8 kilometers (5 miles) across the desert
surface directly northwest of the Indio Hills (Fig . 7) . This is one of the
best examples of surface evidence of a buried fault . Thick vegetation, con-
sisting mostly of mesquite but also large trees, is only present on the north-
east side of the fault . Southwest of the fault, the desert surface consists
mostly of light-colored medium to coarse-grained sand with occasional pebbles .
Brown sage bushes are spaced 3-6 meters (10-20 feet) apart . More vegetation
is present on the north side of the fault because the fault acts as a barrier
to ground water flowing from the north . Northeast of the fault, static water
9
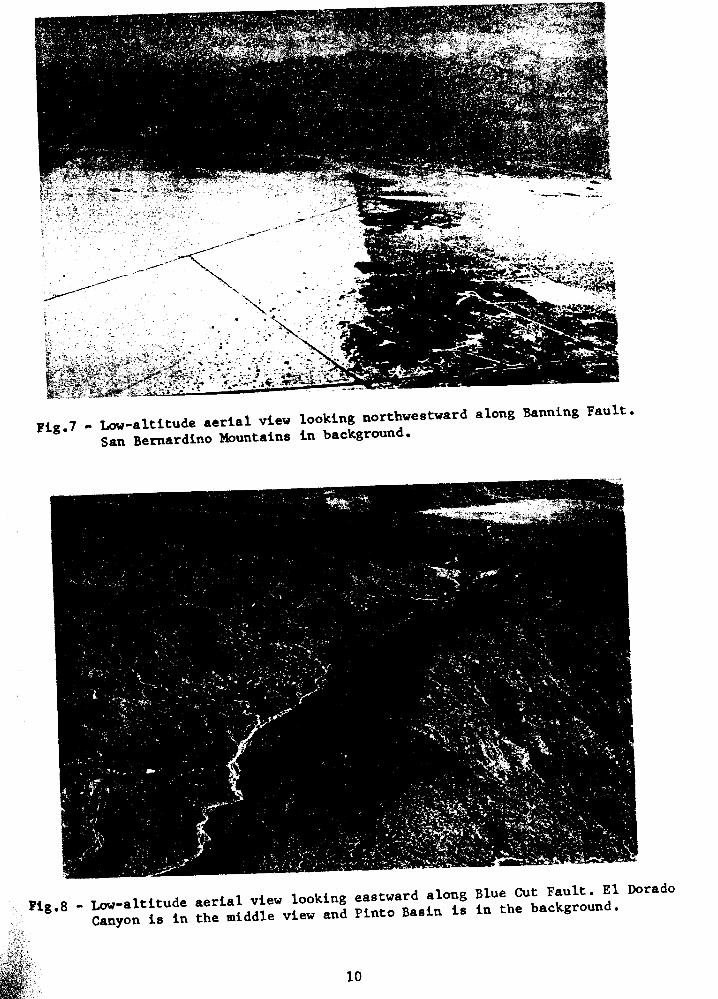
Fig .7 - Low-altitude aerial view looking northwestward along Banning Fault .
San Bernardino Mountains in background .
Cut Fault. Fig.8 - Low-altitude
viewviewlooking
and Pintoeastward
Basinalong
s inuthe background) DoradoCanyon is in the
1.0

levels are at depths averaging about 10 meters (30 feet) ; south of the
fault the water level is around 100 meters (300 feet) below the surface
(Tyley, 1971) . Artesian springs are present north of the fault at Seven
Palms Ranch .
To the southeast between Edom Hill and the Indio Hills, the trace of
the Banning fault is marked by faint differences in tone and a prominent
linear valley . The trace along the southwest edge of the Indio Hills isevidenced by the tonal contrast between the desert surface, described above,
on the southwest and tan colored Ocotillo Conglomerates of Quaternary age
uplifted along the northeast side of the fault . The southwest edge of the
Indio Hills is relatively straight, however, no direct physiographic evidence
of faulting can be seen on Skylab images of this area . Willis Palms, an
oasis along the southwest edge of the Indio Hills, is visible in the Skylab
images as a small dark area of vegetation . This is another locality of near-
surface ground water caused by subsurface blockage of ground water flow by
the Banning fault .
The Mission Creek fault can be traced on the enlarged Skylab image
(Fig. 5) over most of its length from Two Bunch Palms to the southeast end
of the Indio Hills . Similar to the Banning fault, the Mission Creek fault
dams ground water and creates a high water table on the northeast side of
the fault . The most prominent areas of vegetation along the fault are located
at Two Bunch Palms and Thousand Palms Oasis . The water table is located within
5 meters (16 feet) of the surface at Two Bunch Palms (Proctor, 1958) . Several
other oases supporting palm trees and mesquite appear along the fault as small
dots on the imagery . An alignment of cultivated plots, owing to the avail-
ability of near-surface ground water, can be seen along the north side of the
fault between Two Bunch Palms and the northwest end of the Indio Hills .To the southeast, the fault can be traced to Thousand Palms Oasis as an
almost continuous alignment of:' linear valleys and ridges along the straight
northeast edge of the Indio Hills . Within the Indio Hills, stream courses
at three locations along the fault southeast of Thousand Palms Oasis appear
to be deflected to the right an average of about 2 kilometers (1 .2 miles) .
A straight break in slope appears along the middle stream offset, and a
prominent linear valley with a parallel linear ridge uplifted along the
].1
southwest side of the fault can be seen along the southeastern stream
offset .
A linear valley along the Banning-Mission Creek fault appears on
the Skylab image (Fig . 3) on the southwest edge of the Mecca Hills . The
fault is covered for about 16 kilometers (10 miles) southeast of the Mecca
Hills and reappears along the east shore of the Salton Sea . Two linear,
dark areas are produced by juxtaposed formations of contrasting color along
the fault . Upturned, red-brown continental sediments of Quaternary age
occur on the northeast side, and younger lake sediments (Late Pleistocene
or Recent), consisting of tan mudstone and tan fine-grained sandstone, occur
on the southwest side .
The Banning-Mission Creek fault and uplifted and deformed Quaternary
sediments are not in evidence on Skylab imagery southeast of these exposures .
Thus, our interpretation of Skylab imagery is in accord with previous surface
mapping and geophysical studies that suggest the San Andreas fault terminates,
possibly at a spreading center, near the southeast end of the Salton Sea .
Southeastern Imperial Valley and Sonora, Mexico
Faults along the trend of the San Andreas southeast of the suggested
spreading center would be comparatively inactive under the hypothesis that
the San Andreas fault is a transform fault . However, significant vertical
separation on the top of basement rocks could occur as a result of isostatic
adjustment of crustal blocks of different thicknesses . East of the Salton
Trough, deposits similar or correlative to the Imperial Formation (Pliocene)
are exposed at an altitude of about 320 meters (1050 feet) . Near the center
of Imperial Valley, these deposits were not penetrated in a well bottoming
at a depth of 4097 meters (13,443 feet) (Dutcher et al, 1972) . The re-
quired vertical offset could be explained by a fault interpreted from
geophysical surveys near the eastern margin of the Sand Hills (Kovach et al,
1962) . The Sand Hills fault has been aligned with the Algadones fault
southeast of Yuma, Arizona (Mattick et al, 1973) . However, the Algadones
fault cannot delineate the eastern margin of the Salton Trough in Sonora,
Mexico, because a southeastern extension would lie east of exposures of
basement rocks of possible Precambrian age in Sierra del Rosario (R . Merriam,
personal communication) .
12
Gravity and aeromagnetic data suggest 3 kilometers (2 miles) vertical
separation at the top of basement rocks along a fault between sediments of
the Salton Trough and basement rock exposed to the northeast in Sierra del
Rosario (Sumner, 1972) . Between the Salton Sea and Gulf of California,
shifting sands and river flood plain deposits obscure any direct surface
indications of faulting along the northeast edge of the Salton Trough .
However, physiographic features appearing on Skylab imagery may be indicative
of faulting along this trend . A prominent dark spot appears on the Skylab
image (Fig . 4) on the approximate surface trace of the fault identified by
Sumner . The dark spot is a lake (R . Merriam, personal communication) which,
in this arid region, could be due to impoundage of ground water on the north-
east side of a fault .
To the northwest, a remarkably straight tonal difference is located
near the southwestern edge of the Sand Hills . The slightly darker tone on
the northeast side is the result of denser vegetation . The depth to the
water table is 35 to 45 feet (10 to 14 meters) in six wells along the edge
of the Sand Hills (Loeltz et al., 1975) . There is no evidence that the water
table is displaced along the tonal change, but well control is poor in this
rea (J . H . Robison, personal communication, 1975) . Vegetation consists of
shallow-rooted bushes, so it is doubtful. that the vegetation change could be
due to blockage of ground water . Loeltz et al (1975) have suggested that the
une sand may have been supplied by beaches along a fault-controlled shore-
line at the southwest edge of the dune field . The straight vegetation break
may be the result of soil differences along the fault-controlled shoreline .
A fault is also suspected on the basis of a well drilled on the southwest
margin of the dune field (S . L . Werner, personal communication) . The well was
drilled on a geothermal anomaly by the California Department of Water Resources,
nd silicifed recent basin deposits were encountered (Werner and Olson, 1970) .
Approximately half-way along the western edge of the Sand Hills, the
dune field overlaps the line of vegetation and surficial evidence of faulting
is obscured by cultivated fields and leakage along the Coachella Branch of
the All American Canal . The overview provided by the Skylab images aided in
the interpretation of this possible fault in the San Andreas set by showing
the regional. alignment of fault indicators at an appropriate scale .
13
SAN JACINTO FAULT ZONE
The San Jacinto fault zone extends from near the San Andreas fault in
the San Gabriel Mountains southeast 500 kilometers (300 miles) to the Gulf
of California . In contrast to the continuous trace of the San Andreas
fault, the continuity of any one fault trace cannot be proven over the
length of the San Jacinto fault zone . Maps prepared by Dibblee (1954),
Sharp (1967, 1972), Bartholomew (1970) and others, show different locations,
extensions, and names for some of the principal faults within a zone of sub-
parallel and branching faults up to 20 kilometers (12 miles) wide . A micro-
earthquake study of the San Jacinto fault zone in San Jacinto Valley by
Cheatum and Combs (1973) also indicates a complex fault pattern in a zone
20 kilometers (12 miles) wide .
The San Jacinto fault zone is characterized by high seismic activity ;
thirteen large earthquakes have occurred along the fault zone north of the
Mexican border since 1890 (Lamar, Merifield, and Proctor, 1973) . Surface
faulting for a distance of about 31 kilometers (19 miles) with displacements
of up to 38 centimeters (15 inches) occurred on the Coyote Creek fault during
the 1968 Borrego Mountain earthquake (Clark, 1972) . Surface rupture during
an earthquake was also observed on the Imperial fault in 1940 and may have
occurred in 1934 along faults in the San Jacinto fault zone in the Colorado
River Delta . Sharp (1972) has compiled a map showing recently active breaks
along the San Jacinto fault zone . According to Sharp (1967), fresh scarps
and offset stream channels along the San Jacinto fault north of Anza indicate
730 meters (2400 feet) of recent right-lateral displacement, and the total
right-slip on the San Jacinto fault zone amounts to about 24 kilometers (15
miles) . This displacement was initiated during the Pliocene .
Two prominent linearsppear on the Skylab images of the Colorado Delta
area (Fig . 4) . The western\linear in recent deltaic deposits corresponds
to the segment of the San Jacinto fault believed to have been active in 1934
(Allen et al, 1965) . The eastern linear appears as a straight, sharp boundary
between deltaic deposits on the west and dune sand on the east . Merriam (1965)
states that the southeast end of this linear is a fault and describes ex-
tensions of the San Jacinto fault zone to the southeast in Sonora .
To the northwest in Mexicali Valley, the fault traces are obscured by
Cultivated fields . However, an inferred northwest extension of the western
inear passes through the Cerro Prieto geothermal field (De Anda and Parides,
964) ; the geothermal activity may be related to the fault zone . Northwest
14
of the geothermal area, faint differences in the tone of cultivated fields
south of Mexicali can be seen across a line along the same trend (Figs . 2
and 4) . No additional evidence concerning the origin of this linear was
found during a field reconnaissance, but variations in the tone of the
cultivated fields could be related to subtle differences in the soil . The
lake sediments beneath Mexicali Valley are primarily interbedded silt and
clay . Because of its better drainage qualities, silt is preferable for
crops . Silt and clay juxtaposed along a fault could be reflected in differ-
ent crops or land use . Because the subtle differences in tone along this
possible strand within the San Jacinto fault zone occur over a wide area,
the overview provided by the small-scale Skylab images was required for
recognition of the strand .
The tonal difference cannot be traced northwest of a point 6 kilometers
(4 miles) south of the international border, but a continuation of the same
trend lines up with a fairly straight segment of the New River . Exposures
along the New River north of the border were examined, but no evidence of
faulting was observed . If a fault along this trend curves slightly and is
situated west of the New River, it would be aligned with a queried fault in
he San Jacinto fault zone shown by Jennings (1973) .
The Coyote Creek fault is a major strand of the San Jacinto fault zone
exposed in Coyote Canyon (Sharp, 1967) . Southeast of exposures of the fault
in bedrock, an abrupt linear contact between dark and light earth materials
appears on Skylab imagery along the southwest edge of Coyote Mountain . This
contact was field checked in a search for previously unrecognized evidence
of faulting from the south end of Coyote Mountain to the north end of Borrego
Valley . Bedrock and individual clasts in the alluvial fan deposits and talus
on Coyote Mountain are stained dark brown to dark gray by desert varnish . In
contrast, the younger windblown sand and alluvium in Borrego Valley are not
varnished and are light gray to glistening white . Occasional floods and wind
transport sediments from the outlet of Coyote Creek at the north end of
Borrego Valley to the southeast along the edge of Coyote Mountain . The
alluvium and windblown sand form a sharp, fairly straight contact with the
older, varnished rocks primarily because the older, dark rocks in the canyons
along the mountain front are shielded from the windblown sand and alluvium
15
moving down the valley . This has the effect of straightening irregularities
in the contact between light and dark rocks .
The field investigation revealed no evidence of recent fault movement
along the southwest side of Coyote Mountain ; however, the general straight-
ness of the mountain front may be in part the result of erosional retreat
parallel to a straight fault scarp . In this well-mapped area, Skylab images
provided no new information . In an unmapped area, the straight trace of the
mountain front would have quickly directed attention to the possibility of
a major fault along this trend .
EAST TRENDING FAULTS
The Transverse Ranges east of the San Andreas fault are characterized
y a number of east trending faults . Left-slip of up to several kilometers
s demonstrable on some of these faults, and displacements in older alluvium
and terrace deposits attest to movements in Quaternary time (Hope, 1966) .
gments of these faults appear as linears on the Skylab image (Figs . 2 and
Blue Cut Fault
The Blue Cut fault is one of the major east trending faults of the
*astern Transverse Ranges . Correlation of lithologic units across the fault
4icates left-slip of up to 5-6 kilometers (3-4 miles) on the western por-
on of the fault since Jurassic (Hope, 1966, 1969b) . The western end of
Blue Cut fault curves northward and merges with the northwest trending
tllon fault (Rogers, 1965) . Discontinuous fault zone exposures and physio-
aphic evidence suggest that the Blue Cut fault may continue east for 80
ilometers (50 miles) and terminate against a northwest trending fault near
he western edge of the Coxcomb Mountains . Because the evidence of faulting
8`` discontinuous and separated by considerable distances, the alignment of
fault indicators cannot be appreciated on the ground, from low flying air-
raft, or in RB-57 photos . A view eastward along the fault trend from a
w-flying aircraft is shown in Fig . 'B . The overview provided by small-scale
kylab imagery (Fig . 3) is ideal for recognizing the regional alignment of
16
the physiographic features described by Hope (1966) over the length of the
fault .
Good exposures in the Blue Cut, an east-west canyon in the Little
San Bernardino Mountains, reveal a near-vertical fault zone several hundred
feet wide . East of the Blue Cut, the fault is buried beneath recent alluvium
in Pleasant Valley, and reappears in El Dorado Canyon . The alignment of
straight canyon segments eroded along the fault in the Blue Cut, the east
end of Pleasant Valley, and along El Dorado Canyon, is quite apparent on the
Skylab imagery (Fig . 3) . A fault is located along the straight northeast
edge of Pleasant Valley seen on Skylab imagery . The sharp linear at the east
end of Pleasant Valley is formed by shadows on the north side of a ridge of
fanglomerate uplifted on the south block of the Blue Cut fault (Hope, 1969b) .
The cluster of low hills in the western Pinto Basin outlines a north-northwest
trending anticline in Tertiary or Quaternary sedimentary rocks . This anti-
cline may be a drag fold formed as a result of left-slip along the proposed
eastern extension of the Blue Cut fault beneath Pinto Basin (Hope, 1969b) .
At the east end of the Pinto Basin, a southern branch of the fault may be
located at the gently curving, abrupt north edge of the Eagle Mountains which
is prominent on Skylab imagery .
Porcupine Wash, Substation and Victory Pass Faults
The Porcupine Wash fault can be traced from Pinto Basin westward into
the Little San Bernardino Mountains where the trace ramifies and apparently
ends . Left-separation of 2 .4 kilometers (1 .5 miles) on a near-vertical
contact between granodiorite and gneiss is demonstrable, and scarps in older
alluvium indicate Quaternary activity (Hope, 1966) . To the east, the Sub-
Station and Victory Pass faults have been mapped in the Eagle Mountains . The
Substation fault appears to offset a swarm of rhyolite dikes about 3 kilo-
meters (2 miles) in a left-lateral sense . Displacement on the Victory Pass
fault has not been determined (Hope, 1966) .
Physiographic indicators along these faults are prominent on Skylab
imagery (Fig . 3) . Two straight canyons are aligned along the trace of the
Porcupine Wash fault . To the east a straight canyon and a fairly straight
break in slope can be seen along the trace of the Substation fault . The
regional alignment of the Porcupine Wash and Substation faults can be seen
1.7
on Skylab imagery . However, physiographic evidence of a connection between
the faults cannot be found and we were unable to trace the Substation fault
west of the termination shown on existing maps (Hope, 1966 : Jennings, 1967) .
A straight canyon and linear breaks in slope appear on Skylab imagery
(Fig . 3) along the mapped trace of the Victory Pass fault . A western con-
tinuation of the fault is suggested by an east-west trending low-lying area
within the Eagle Mountains . To the west, across the southern Pinto Basin,
the photo linear is aligned with the east-west trending Pinkham Canyon .
However, the fault could only be traced in the field about 1 .5 kilometers
(one mile) west of the termination shown by Jennings (1967) and 3 kilometers
(2 miles) west of the termination shown by Hope (1966) . The westernmost
fault exposure is in a mine at the southwest corner of Sec . 36, T4S, R13E .
At this location, the fault diverges from the photo linear and turns south-
westward across Big Wash ; the attitude of the fault is N68 °W, 42° S parallel
to foliation in metamorphic rocks . Three kilometers (2 miles) further west,
almost continuous outcrops of metamorphic rock with a persistant north-south
-strike and east dip of foliation cross the photo linear ; it is unlikely that
western continuation of the fault can pass through this location . Further
est, alluvium in the low-lying area along the photo linear would obscure
any evidence of faulting .
Orocopia Linear
Jennings (1967) shows the Orocopia linear as a concealed fault extend-
ing parallel to Interstate Highway 10 for about 32 kilometers (20 miles)
within the broad east-northeast trending valley between the Eagle Mountains
on the north and the Orocopia Mountains on the south . A fault along this
physiographi.c feature was first suggested by Hill (1928) . Biehler et al
(1964) describe a gravity low which may be the result of a fault-bounded,
sediment-filled trough along the linear . Individual rock units and fault
trends do not match across the linear (Jennings, 1967) which also suggests
the presence of a fault . The overview provided by Skylab imagery shows that
the Orocopia linear is the most prominent east-west trending, low-lying
topographic feature in the region ; based on parallelism with known left-
slip faults to the north displayed on Skylab imagery, it is suggested that
the Orocopia linear may have formed as a result of erosion of shattered
rocks along a left-slip fault zone .
18

OTHER FAULTS IN THE SALTON TROUGH AREA
The Palm Canyon fault appears as a distinct but irregular line for
about 16 kilometers (10 miles) along the axis of Palm Canyon . The irregular
trace probably results from erosion along a thrust surface which dips 20 0
to 400 east (R . V . Sharp, personal communication, 1973) . Faulting involves
pre-Cretaceous metamorphic rocks only, and there is no evidence of displace-
ment of Quaternary alluvium at the mouth of the canyon .
The Indio fault appears as a prominent, straight topographic break for
10 kilometers (6 miles) in Quaternary sediments along the northeast edge of
the Indio Hills (Fig . 5) . Prominent scarps can be seen on the ground along
the fault but are not apparent on the Skylab images .
The Hidden Hills fault can be seen as a 20 kilometer (12 mile) long,
north-northwest trending, prominent, straight tonal change on Skylab imagery
northeast of the Salton Sea . The origin of the tonal change is not known .
The Pattern of linears in the Sierra de los Cucapas (Fig . 2) seen from
Skylab (Fig . 4) is similar to the fault pattern shown by Gastil et al (1971) .
The linears identified southeast of Yuma (Figs . 2 and 4) have locations
similar to faults shown on an unpublished map prepared by Richard Merriam
(scale : 1 :250,000) . Extensions of these linears shown on Fig . 2 southeast
of the Fig . 4 Skylab image can be seen on the Skylab 2, Roll 4, Frame 136
image.
With the exception of the Palm Canyon fault, the faults identified on
the Skylab images are high-angle faults with straight traces . Other low-
angle thrust faults in the region are not recognizable because they have
sinuous traces and lack diagnostic fault-controlled features which would
allow their differentiation from geologic contacts of other origin .
CONCLUSIONS
The following indicators of faulting have been recognized in Skylab
imagery of the Salton Trough area : (1) topographic features such as scarps,
fault-line scarps, offset drainage, linear valleys and straight mountain
fronts, (2) vegetation differences due to ground water blockage, and (3)
ithologic differences across the fault. producing contrasting tone, color
r texture . High-angle, strike-slip faults are most apparent ; low-angle
19

faults are generally not identifiable . The scale and perspective of the
Skylab imagery is advantageous for observing the regional alignment of
faults tens of kilometers in length . For example, surface evidences of
the Blue Cut fault are discontinuous and separated by as much as 10 kilo-
meters (6 miles) . The alignment of exposed segments of the Blue Cut fault
is readily apparent in Skylab photos but cannot be appreciated in larger
scale photos .. Utilizing this perspective, the following alignment of north-
west trending linear features, which may reveal previously unrecognized
segments of faults in the San Andreas set, were identified : (1) a tonal
change across cultivated fields of the Mexicali Valley which is aligned
with strands of the San Jacinto fault zone to the northwest and southeast,
and (2) a straight break in vegetation and a lake in Sonora, Mexico,
aligned with the active San Andreas fault zone to the northwest and a fault
to the southeast previously inferred from geophysical evidence .
This same perspective, however, can prompt incorrect interpretation
of disconnected linear features which may have unrelated origins . Possible
extensions of the Substation and Victory Pass faults, suggested by study of
Skylab photos, could not be identified on the ground . The overview provided
by Skylab images can greatly increase the efficiency of regional fault in-
vestigations ; analysis of Skylab images should precede the study of larger
scale imagery and detailed field investigations .
ACKNOWLEDGEMENTS
The work reported herein was accomplished under NASA Contract NAS 2-7698 .
We wish to acknowledge valuable discussions with Mason Hill, Richard Merriam,
Shawn Biehler, Robert V . Sharp, G . A . Davis, S . L . Werner and James H . Robison .
Richard Merriam kindly provided us with unpublished maps of Sonora, Mexico,
and Morlin Childers accompanied us on a reconnaissance of Mexicali and
Imperial Valleys .

REFERENCES
Allen, C . R., 1957, San Andreas fault zone in San Gorgonio Pass, southernCalifornia : Geol . Soc . Amer . Bull ., v . 69, p . 315-350 .
Allen, C . R., St . Amend, P ., Richter, C . F ., and Nordquist, J . M., 1965,Relationship between seismicity and geologic structure in the southernCalifornia region : Seis . Soc . Amer . Bull, v . 55, p . 753-797 .
Allen, C. R., Wyss, M., Brune, J . N ., Grantz, A ., and Wallace, R . E ., 1972,Displacements on the Imperial, Superstition Hills, and San Andreas faultstriggered by the Borrego Mountain earthquakes : in The Borrego Mountainearthquake of April 9, 1968 ; U .S . Geol . Survey Prof . Paper 787, p . 87-104 .
Bartholomew, M .J ., 1970, San Jacinto fault zone in the northern ImperialValley, California : Geol . Soc . Amer . Bull ., v . 81, p . 3161-3166 .
Biehler, S ., Kovach, R. L., and Allen, C . R., 1964, Geophysical framework ofnorthern end of Gulf of California structural province : Amer . Assoc .Petrol . Geol ., Mem . 3, p . 126-143 .
Cheatum, C . and Combs, J ., 1973, Microearthquake study of the San JacintoValley, Riverside County, California : in Proc . Conf . on TectonicProblems of the San Andreas Fault System, Stanford Univ . Publ ., Geol . Sci .,v . XIII ;, p . 1-10 .
Clark, M . M ., 1972, Surface rupture along the Coyote Creek fault : U .S . Geol .Survey, Prof . Paper 787, p . 55-86 .
Crowell, J . C ., 1962, Displacement along the San Andreas Fault, California :Geol . Soc . Amer ., Spec . Paper 71, 61 p .
De Anda, L . 'P . and Parides, E ., 1964, La falls de San Jacinto y su influenciasobre la actividad geothermica en el valle de Mexicali, B .C., Mexico :Boletin de la Association Mexicans de Geologos Petroleros, v . XVI, No .7-8, p . 179-181 .
Dibbles, T . W., Jr ., 1954, Geology of the Imperial Valley region, California :Calif . 'Div . Mines and Geol ., Bull . 170, contr . 2, Chapter II, p . 21-28 .
Dibble., T . W ., Jr ., 1968, Displacements on the San Andreas fault system inthe San Gabriel, San Bernardino, and San Jacinto Mountains, SouthernCalifornia : in Proc . Conf . on Geologic Problems of San Andreas faultsystem ; Stanford Univ . Publ . Geol . Sci ., v . XI, p . 260-278 .
Dutcher, L . C ., Hardt, W. F. and Moyle, W . R ., Jr ., 1972, Preliminary appraisalof ground water in storage with references to geothermal resources inthe Imperial Valley area, California : U .S . Geol . Survey Circular 649,59 p .
21

Elders, W. A., Rex, R. W., Meidev, T ., Robinson, P . T . and Biehler, S.,1972, Crustal spreading in southern California : Science, v . 178,p . 15-24 .
Gastil, R. G., Phillips, R. P ., and Allison, E. C ., 1971, ReconnaissanceGeologic. Map of the State of Baja California : Geol . Soc . Amer . scale1:250,000 .
Hill, M . L., 1965, The San Andreas rift system, California and Mexico ; inThe world rift system: Canada Geol . Survey Paper 66-14 .
Hill, R . T., 1928, Southern California geology and Los Angeles earthquakes :Southern California Academy of Sciences, 232 p .
Hope, R. A., 1966, Geology and structural setting of the eastern TransverseRanges, southern California : Ph .D . thesis, Univ. Calif ., Los Angeles,201 p .
Hope, R . A., 1969a, Map showing recently active breaks along the San Andreasand related faults between Cajon Pass and Salton Sea, California :U .S . Geol . Survey, Open File Report .
Hope, R. A., 1969b, The Blue Cut fault, southeastern California, GeologicalSurvey Research, 1969 : U .S . Geol .-Survey Prof . Paper 650-D, p . D116-D121 .
Jennings, C . W., 1967, Geologic map of California, Salton Sea sheet : Calif .Div . Mines and Geol .
Jennings, C . W., 1973, State of California, preliminary fault and geologicmap, scale 1 :750,000 : Calif . Div . Mines and Geol ., Preliminary Report 13 .
Kovach, R. L., Allen, C . R ., and Press, F., 1962, Geophysical investigationsin the Colorado Delta Region : J. Geophys . Res ., v . 67, p . 2845-2871 .
Lamar, D . L ., Merifield, P . M., and Proctor, R . J., 1973, Earthquakerecurrence intervals on major faults in southern California : inGeology, Seismicity and Environmental Impact, Assoc . Eng . Geol ., Spec .Publ ., p . 265-276 .
Loaltz, 0. J., Irelan, B ., Robison, J . H . and Olmsted, F . H., 1975, Geo-hydrologic reconnaissance of the Imperial Valley, California : U .S .Gaol . Survey Prof . Paper 486-K, 54 p .
Mattick, R. E ., Olmstead, F . H ., and Zohdy, A. A. R ., 1973, Geophysicalstudies in the Yuma area, Arizona and California : U .S . Geol . SurveyProf . Paper 726-D, 36 p .
Merriam, R ., 1965, San Jacinto fault in northwestern Sonora, Mexico : Geol .Soc . Amer ., Bull ., v . 76, p . 1051-4054-
22

Proctor, R. J ., 1958, Geology of the Desert Hot Springs area, Little SanBernardino Mountains, California : M.A. thesis, Univ . Calif ., Los
Angeles .
Proctor, R. J ., 1973, Map showing major earthquakes and recently activefaults in the southern California region : in Geology, Seismicity andEnvironmental Impact, Assoc . Eng . Geol . Spec . Publ .
Rogers, T . H .,, 1965, Geologic map of California, Santa Ana Sheet : Calif .
Div . Mines and Geol .
Sharp, R . V ., 1967, San Jacinto fault zone in the Peninsular Ranges ofsouthern California : Geol . Soc . Amer . Bull ., v . 78, p . 705-730 .
Sharp, R. V., 1972, Map showing recently active breaks along the San Jacintofault zone between the San Bernardino area and Borrego Valley, California :
U.S . Geol . Survey Map 1-675 .
Sumner, J . R., 1972, Tectonic significance of gravity and aeromagneticinvestigations at the head of the Gulf of California : Geol . Soc . Amer .
Bull ., v. 83, p . 3103-3120 .
Tyley, S . J., 1971, Analog model study of the ground water basin of theUpper Coachella Valley, California : Water Resources Division, U .S .
Geol . Survey, open-file report, 89 p .
Wallace, R. E., 1970, Earthquake recurrence intervals on the San Andreasfault : Geol. Soc . Amer . Bull ., v 81, p . 2875-2890 .
erner, S . L . and Olson, L. J., 1970, Geothermal wastes and the water resourcesof the Salton Sea area: Calif . Dept . of Water Resources Bull . No . 143-7,
123 p .
23