fbn holdings plc. consolidated financial statements …€¦ · additionally, the group’s...
TRANSCRIPT

FBN Holdings Plc.
Consolidated Financial Statements
for the year ended 31 December 2017

FBN Holdings Plc.
Index to the consolidated financial statements
for the year ended 31 December 2017
Note Page Note Page
Directors and advisors 1 7 Interest income 90
Corporate Governance Report 2 8 Interest expense 90
Director's report 14 9 Impairment charge for credit losses 90
Responsibility for annual financial statements 17 10 Insurance premium revenue 90
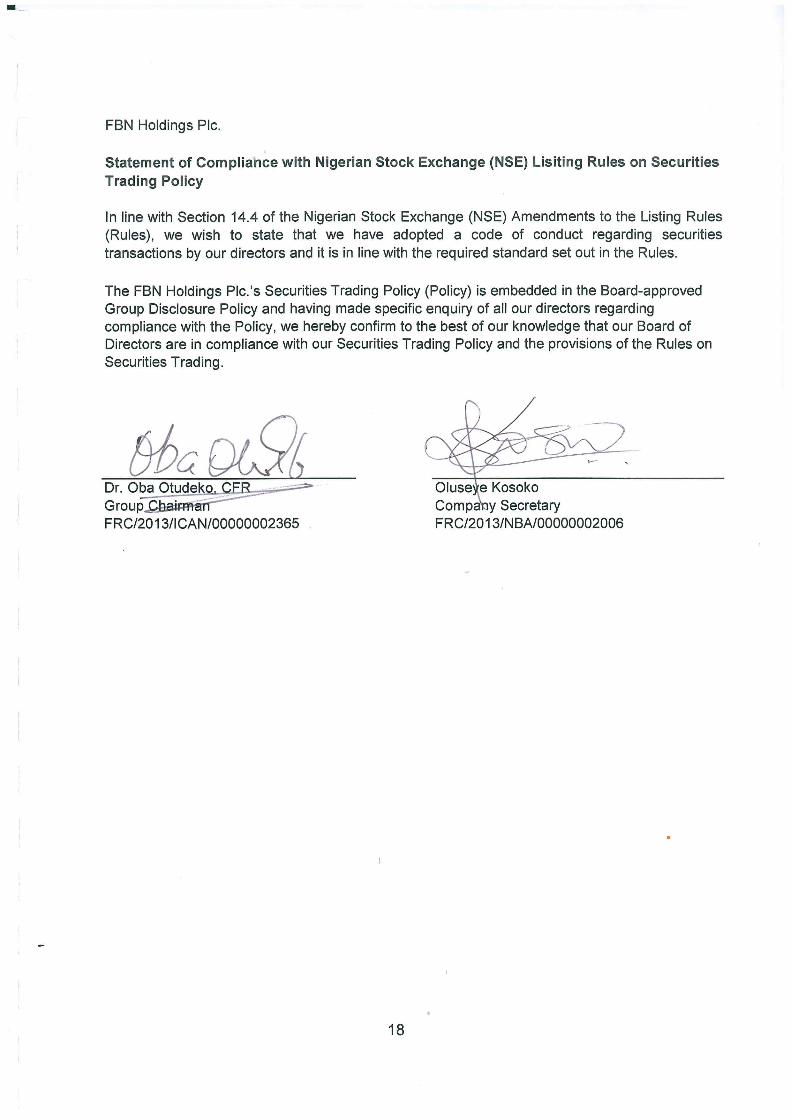
Statement of compliance with NSE listing rule on
Securities Trading Policy18
11 Fee and commission 90
Report of the Audit Committee 19 12 Net gains on foreign exchange 91
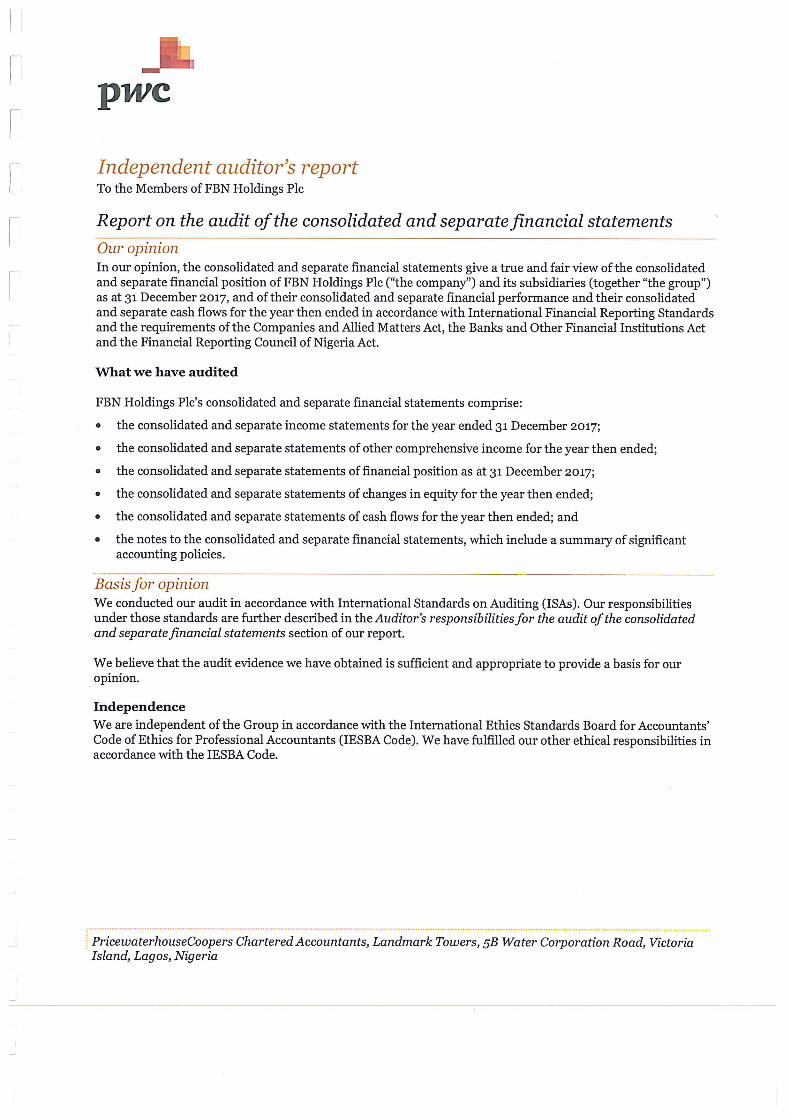
Report of the Independent Auditors 20 13 Net gains/(losses) on investment securities 91
Income statement 26
14 Net (losses)/gains from financial instruments at fair
value through profit or loss 91
Statement of total comprehensive income 27
15 Dividend income 91
Statement of financial position 28 16 Other operating income 91
Consolidated statement of changes in equity 29 17 Personnel expenses 92
Company statement of changes in equity 30 18 Operating expenses 92
Statement of cash flows 31 19 Taxation - income tax expense and liability 93Notes to the consolidated financial statements 20 Cash and balances with central banks 94
1 General information 32 21 Cash and cash equivalents 94
2 Summary of significant accounting policies 32 22 Loans and advances to banks 94
2.1 Basis of preparation 32 23 Loans and advances to customers 94
2.2 Changes in accounting policy and dislosures 3224 Financial assets and liabilities at fair value through
profit or loss97
2.3 Consolidation 34 25 Investment securities 98
2.4 Segment reporting 35 26 Asset pledged as collateral 98
2.5 Common control transactions 35 27 Other assets 99
2.6 Foreign currency translation 35 29 Investment properties 100
2.7 Income taxation 36 30 Investment in associates 100
2.8 Inventories 36 31 Investment in subsidiaries 100
2.9 Financial assets and liabilities 36 32 Asset Held for Sale: Discontinued operations 104
2.10 Offsetting financial instruments 39 34 Property, plant and equipment 106
2.11 Revenue recognition 39 35 Intangible assets 108
2.12 Impairment of financial assets 40 36 Deferred tax assets and liabilities 109
2.13 Impairment of non-financial assets 40 37 Deposits from banks 110
2.14 Collateral 41 38 Deposits from customers 111
2.15 Discontinued operations 41 39 Other liabilities 111
2.16 Leases 41 40 Liability on investment contracts 111
2.17 Investment properties 42 41 Liability on insurance contracts 111
2.18 Property, plant and equipment 42 42 Borrowings 112
2.19 Intangible assets 43 43 Retirement benefit obligations 113
2.20 Investment contracts 43 44 Share capital 115
2.21 Cash and cash equivalents 43 45 Share premium and reserves 115
2.22 Employee benefits 4446 Reconcilliation of profit before tax to cash generated
from operations116
2.23 Provisions 44 47 Commitments and contingencies 117
2.24 Insurance contracts 44 48 Offsetting financial assets and financial liabilities 118
2.25 Fiduciary activities 46 49 Related party transactions 119
2.26 Issued debt and equity securities 46 50 Directors' emoluments 119
2.27 Share capital 46 51 Compliance with regulations 119
2.28 Financial guarantees 47 52 Events after statement of financial position date 120
3 Financial risk management 53 Dividends per share 120
3.1 Introduction and overview 48 54 Earnings per share 120
3.2 Credit risk 48 Other National Disclosures
3.3 Liquidity risk 62 Statement of value added 121
3.4 Market risk 66 Five year financial summary 123
3.5 Management of insurance risk 71
3.6 Equity risk 79
3.7 Fair value of financial assets and liabilities 79
4 Capital management 84
5 Significant accounting judgements, estimates and
assumptions86
6 Segment information 88

FBN Holdings Plc.
DIRECTORS AND ADVISORS
DIRECTORS
Dr. Oba A. Otudeko, CFR Non-Executive Director (Group Chairman)
U. K. Eke, MFR Group Managing Director
Oye Hassan-Odukale, MFR Non-Executive Director
Chidi Anya Non-Executive Director
Dr. Sule Hamza Wuro Bokki Non-Executive Director
Debola Osibogun Non-Executive Director
Omatseyin Ayida Non-Executive Director
Dr. Adesola Adeduntan Non-Executive Director
Cecilia Akintomide, OON Non-Executive Director
Oluwande Muoyo Non-Executive Director
COMPANY SECRETARY:
REGISTERED OFFICE: Samuel Asabia House
35 Marina
Lagos
AUDITOR:
REGISTRAR:
Lagos
BANKERS: First Bank of Nigeria Limited
35 Marina
Lagos
FBNQuest Merchant Bank Limited
10 Keffi Street, Ikoyi
Lagos
Iganmu
First Registrars & Investor Services Limited
Plot 2 Abebe Village Road
Oniru, Lagos
Oluseye Kosoko
PricewaterhouseCoopers
(Chartered Accountants)
Landmark Towers, Plot 5B, Water Corporation Road
1
FBN Holdings Plc.
2
CORPORATE GOVERNANCE
Introduction This section gives a summary of the Board’s approach to governance for the 2017 financial year. As with recent years, 2017 was intensely challenging for all businesses in the country, as the economy had to deal with recession arising from low oil prices globally. The negative trends witnessed in 2016 abated in 2017. Notwithstanding macroeconomic volatility, the Board and Management of FBN Holdings Plc remain steadfast in the unified belief that good corporate governance practice remains the best tool to deliver increased shareholder value. In the preceding year’s report, we had discussed the peculiar challenges faced by the Group beyond the general macroeconomic difficulties relating to the significant drop in oil prices and its effect on the macroeconomic indices of Nigeria and other emerging economies were acknowledged. The high impairment charges on the loan book in the Commercial Banking business, which had sustained negative impact on performance, as well as efforts being made to address these challenges, have been extensively addressed. Positively, the structures put in place to ensure reduced impairment charges and strengthen the Group’s Risk Management practices have started yielding results as may be gleaned in the financial results and the rising share price of the Company. The focus of the Board in the incoming year is to further deepen these practices to ensure an effective credit risk management system. The Board, as well as Management, are committed to continually raise the bar on best governance practices and ethical dealings which will ultimately increase shareholder value in the institution. The Group’s oversight function has also been intensified in ensuring the extraction of synergy inherent in our diversified operations across markets and geographies, with over 13million active customers’ accounts and within its extensive banking infrastructure. Considerable successes have been achieved in strengthening the structures of other non-banking operating entities, thereby diversifying our earnings base to minimise our reliance on the commercial banking business. Additionally, the Group’s cross-border Commercial Banking operations, led by FBNBank (UK) Limited, serves to substantially cushion against country-specific risks. The culmination of all these strategic objectives is the realisation of the Group’s aspiration to become the foremost financial institution in Middle Africa. Governance Structure The following governance bodies are in place; A. The Board of Directors
The FBNHoldings Board is a considered blend of diversity, experience and knowledge. The Board continuously seeks to review and refresh its composition to ensure that new ideas and experience are added to its decision-making processes. Since the last Annual General Meeting of FBNHoldings, there have been no changes to the Board’s composition. The Board is comprised of the following members:
FBN Holdings Plc.
3
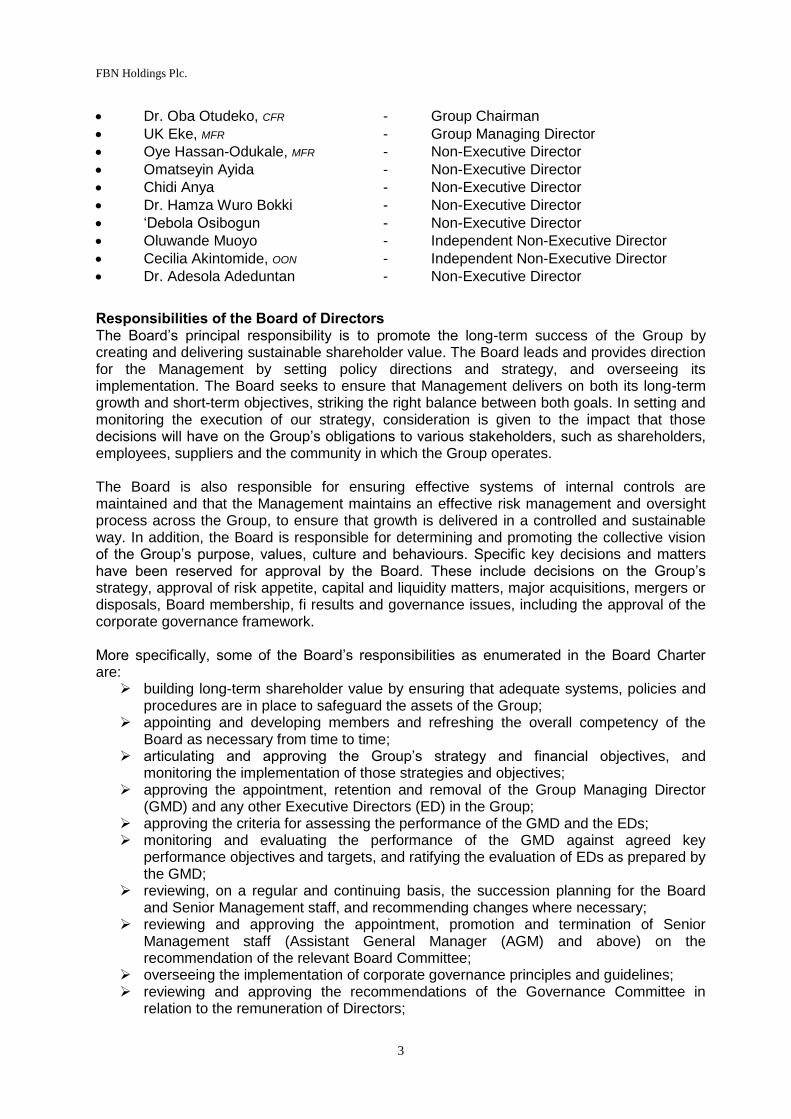
Dr. Oba Otudeko, CFR - Group Chairman
UK Eke, MFR - Group Managing Director
Oye Hassan-Odukale, MFR - Non-Executive Director
Omatseyin Ayida - Non-Executive Director
Chidi Anya - Non-Executive Director
Dr. Hamza Wuro Bokki - Non-Executive Director
‘Debola Osibogun - Non-Executive Director
Oluwande Muoyo - Independent Non-Executive Director
Cecilia Akintomide, OON - Independent Non-Executive Director
Dr. Adesola Adeduntan - Non-Executive Director
Responsibilities of the Board of Directors The Board’s principal responsibility is to promote the long-term success of the Group by creating and delivering sustainable shareholder value. The Board leads and provides direction for the Management by setting policy directions and strategy, and overseeing its implementation. The Board seeks to ensure that Management delivers on both its long-term growth and short-term objectives, striking the right balance between both goals. In setting and monitoring the execution of our strategy, consideration is given to the impact that those decisions will have on the Group’s obligations to various stakeholders, such as shareholders, employees, suppliers and the community in which the Group operates. The Board is also responsible for ensuring effective systems of internal controls are maintained and that the Management maintains an effective risk management and oversight process across the Group, to ensure that growth is delivered in a controlled and sustainable way. In addition, the Board is responsible for determining and promoting the collective vision of the Group’s purpose, values, culture and behaviours. Specific key decisions and matters have been reserved for approval by the Board. These include decisions on the Group’s strategy, approval of risk appetite, capital and liquidity matters, major acquisitions, mergers or disposals, Board membership, fi results and governance issues, including the approval of the corporate governance framework. More specifically, some of the Board’s responsibilities as enumerated in the Board Charter are:
building long-term shareholder value by ensuring that adequate systems, policies and procedures are in place to safeguard the assets of the Group;
appointing and developing members and refreshing the overall competency of the Board as necessary from time to time;
articulating and approving the Group’s strategy and financial objectives, and monitoring the implementation of those strategies and objectives;
approving the appointment, retention and removal of the Group Managing Director (GMD) and any other Executive Directors (ED) in the Group;
approving the criteria for assessing the performance of the GMD and the EDs; monitoring and evaluating the performance of the GMD against agreed key
performance objectives and targets, and ratifying the evaluation of EDs as prepared by the GMD;
reviewing, on a regular and continuing basis, the succession planning for the Board and Senior Management staff, and recommending changes where necessary;
reviewing and approving the appointment, promotion and termination of Senior Management staff (Assistant General Manager (AGM) and above) on the recommendation of the relevant Board Committee;
overseeing the implementation of corporate governance principles and guidelines; reviewing and approving the recommendations of the Governance Committee in
relation to the remuneration of Directors;
FBN Holdings Plc.
4
overseeing the establishment, implementation and monitoring of a Group-wide risk management framework to identify, assess and manage business risks facing the Group;
articulating and approving the Group’s risk management strategies, philosophy, risk appetite and initiatives;
maintaining a sound system of internal controls to safeguard shareholders’ investment and the assets of the Group; and
overseeing the Group’s corporate sustainability practices with regards to its economic, social and environmental obligations.
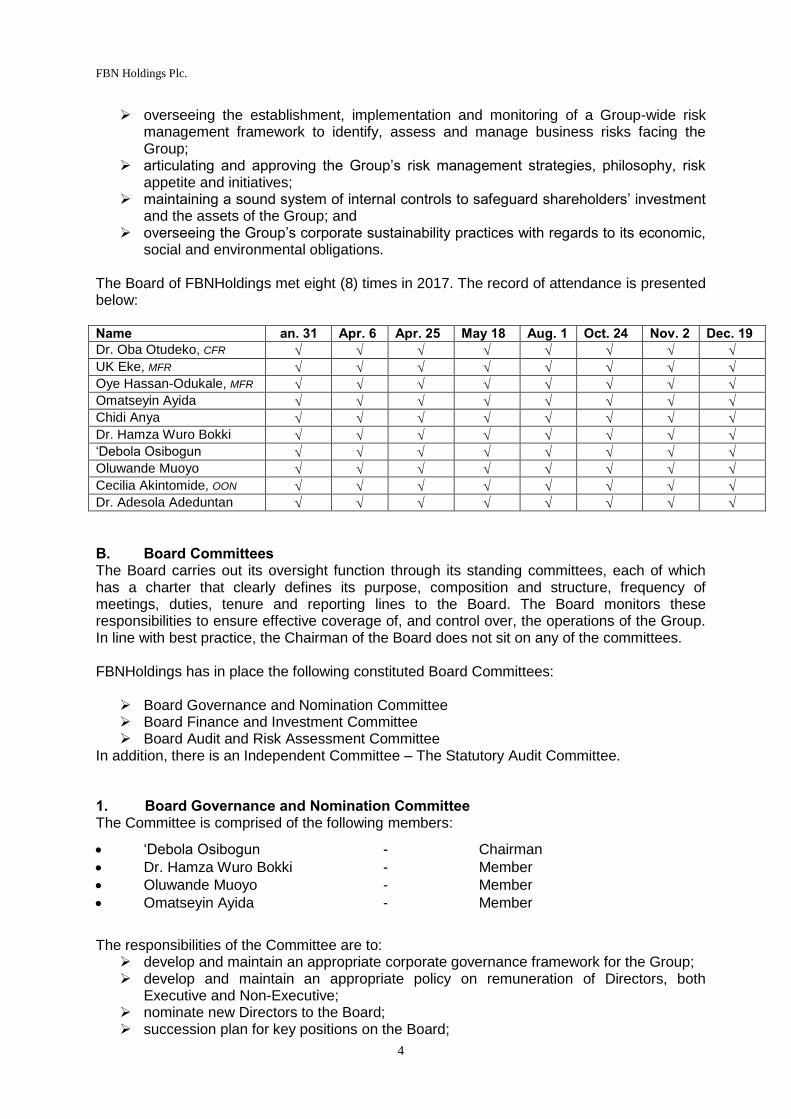
The Board of FBNHoldings met eight (8) times in 2017. The record of attendance is presented below: Name Jan. 31 Apr. 6 Apr. 25 May 18 Aug. 1 Oct. 24 Nov. 2 Dec. 19
Dr. Oba Otudeko, CFR
UK Eke, MFR
Oye Hassan-Odukale, MFR
Omatseyin Ayida
Chidi Anya
Dr. Hamza Wuro Bokki
‘Debola Osibogun
Oluwande Muoyo
Cecilia Akintomide, OON
Dr. Adesola Adeduntan
B. Board Committees The Board carries out its oversight function through its standing committees, each of which has a charter that clearly defines its purpose, composition and structure, frequency of meetings, duties, tenure and reporting lines to the Board. The Board monitors these responsibilities to ensure effective coverage of, and control over, the operations of the Group. In line with best practice, the Chairman of the Board does not sit on any of the committees. FBNHoldings has in place the following constituted Board Committees:
Board Governance and Nomination Committee Board Finance and Investment Committee Board Audit and Risk Assessment Committee
In addition, there is an Independent Committee – The Statutory Audit Committee. 1. Board Governance and Nomination Committee The Committee is comprised of the following members:
‘Debola Osibogun - Chairman
Dr. Hamza Wuro Bokki - Member
Oluwande Muoyo - Member
Omatseyin Ayida - Member
The responsibilities of the Committee are to:
develop and maintain an appropriate corporate governance framework for the Group; develop and maintain an appropriate policy on remuneration of Directors, both
Executive and Non-Executive; nominate new Directors to the Board; succession plan for key positions on the Board;

FBN Holdings Plc.
5
nominate and endorse Board appointments for subsidiary companies; recommend Directors’ remuneration for the Group; oversee Board performance and evaluation within the Group; at the request of the Board, identify individuals for consideration for Board appointment
and present to the Board for ratification; recommend potential appointment and re-election of Directors (including the GMD) to
the Board, in line with FBNHoldings approved Director selection criteria; ensure the Board composition includes at least two independent Directors who meet
the independence criteria as defined in CBN circular; ensure adequate succession planning for Board of Directors and key Management
staff across the Group; recommend candidates for directorship position in subsidiary companies to the Board
for endorsement; make recommendations on the amount and structure of the remuneration of the
Chairman and other Non-Executive Directors to the Board for ratification review and make recommendations to the Board on all retirement and termination
payment plans to the Executive Directors; ensure proper disclosure of Directors’ remuneration to stakeholders; ensure compliance with regulatory requirements and other international best practices
in corporate governance; review and approve amendments to the Group’s Corporate Governance framework; review and approve the corporate governance disclosures to be included in the annual
report; ensure the performance evaluation of the GMD is performed by the Board on an
annual basis and formal feedback provided to the GMD; nominate independent consultants to conduct an annual review/appraisal of the
performance of the Board and make recommendations to the Board in this regard. This review/appraisal should cover all aspects of the Board’s structure, composition, responsibilities, individual competencies, operations, role in strategy setting, oversight over corporate culture, monitoring role and evaluation of Management performance and stewardship towards shareholders;
evaluate the performance of the Board Committees and boards of subsidiary companies on an annual basis. The Committee may utilise the service of the independent consultant approved by the Board for the annual board appraisal as it deems fit. The evaluation process will be in line with the Groups Evaluation policy;
perform such other matters relating to the operations of the Group as may be specifically delegated to the Committee by the Board;
evaluate the role of the Board Committees and Boards of subsidiary companies, and ratify the performance appraisals of the Executive Directors as presented by the GMD;
ensure proper succession planning for the Group; and ensure compliance with the SEC Code of Corporate Governance and other global best
practices on corporate governance. The Committee met six (6) times in 2017. The record of attendance is presented below: Name Jan. 30 Feb. 17 Mar. 28 Apr. 24 May 18 Dec. 18
‘Debola Osibogun
Dr. Hamza Wuro Bokki
Oluwande Muoyo
Omatseyin Ayida

FBN Holdings Plc.
6
2. Board Finance and Investment Committee The Committee is comprised of the following members:
Oye Hassan-Odukale, MFR - Chairman
Dr. Hamza Wuro Bokki - Member
Cecilia Akintomide, OON - Member
UK Eke, MFR - Member
Its responsibilities include the following amongst others:
understand, identify and discuss with Management the key issues, assumptions, risks and opportunities relating to the development and implementation of the Group’s strategy;
participate in an annual strategy retreat for the Board and Management, ensuring that the Board retains sufficient knowledge of the Group’s business and the industries in which it operates to provide strategic input and identify any critical strategic discontinuities in Management’s assumptions and planning premises;
critically evaluate and make recommendations to the Board for approval of the Group’s business strategy, at least annually;
periodically engage Management on informal dialogue and act as a sounding board on strategic issues;
regularly review the effectiveness of the Group’s strategic planning and implementation monitoring process;
review and make recommendations to the Board regarding the Group’s investment strategy, policy and guidelines, its implementation and compliance with those policies and guidelines, and the performance of the Group’s investments portfolios;
oversee the Group’s investment planning, execution and monitoring process; oversee the long-term financing options for the Group; review the Group’s financial projections, as well as capital and operating budgets, and
review on a quarterly basis with management, the progress of key initiatives, including actual financial results against targets and projections;
review and recommend for Board approval the Group’s capital structure, which should not be limited to mergers, acquisitions, business expansions, allotment of new capital, debt limits and any changes to the existing capital structure;
recommend for Board approval the Group’s dividend policy, including nature and timing;
ensure that an effective tax policy is implemented. The Committee met four (4) times in 2017. The record of attendance is presented below: Name Jan. 24 Feb. 17 Aug. 1 Dec. 13
Oye Hassan-Odukale, MFR
Cecilia Akintomide, OON
Dr. Hamza Wuro Bokki
UK Eke, MFR
3. Board Audit and Risk Assessment Committee The Committee is comprised of the following members:
Oluwande Muoyo - Chairman
‘Debola Osibogun - Member
Omatseyin Ayida - Member
Chidi Anya - Member

FBN Holdings Plc.
7
Its responsibilities include the following amongst others: ensure there is an efficient risk management framework for the identification,
quantification and management of business risks facing the Group; evaluate the Group’s risk profile and the action plans in place to manage the risk; ensure the development of a comprehensive internal control framework for the Group; review the Group’s system of internal control to ascertain its adequacy and
effectiveness; evaluate internal processes for identifying, assessing, monitoring and managing key
risk areas, particularly: market, liquidity and operational risks; the exposures in each category, significant concentrations within those risk categories, the metrics used to monitor the exposures and Management’s views on the acceptable and appropriate levels of those risk exposures;
review the independence and authority of the Risk Management function; review the Group’s legal representation letter presented to the external auditors and
discuss significant items, if any, with the Company Secretary; receive the decisions of the Statutory Audit Committee on the statutory audit report
from the Company Secretary and ensure its full implementation; and assess and confirm the independence of the statutory auditor annually. The report of
this assessment should be submitted to the Board and the Statutory Audit Committee. The Committee met six (6) times in 2017. The record of attendance is presented below: Name Jan. 24 Feb. 17 Apr. 3 Apr. 12 Jul. 25 Oct. 17
Oluwande Muoyo
‘Debola Osibogun
Omatseyin Ayida
Chidi Anya
4. Statutory Audit Committee Section 359 (3) of the Companies and Allied Matters Act) requires every public company to establish a statutory audit committee composed of an equal number of directors and representatives of its shareholders, provided there a maximum of six members of the SAC. It is comprised of the following members:
Ayodeji Shonubi - Chairman
Ismail Adamu - Member
Christopher Okereke - Member
Oye Hassan-Odukale, MFR - Member
Chidi Anya - Member
Cecilia Akintomide, OON - Member The statutory duties and role of the SAC are clearly encapsulated in Section 359 (3) and (4) of CAMA. In addition, the various Codes of Corporate Governance – the CBN, SEC and NAICOM Codes – set out the corporate governance role and responsibilities of the SAC to include the following:
ascertain whether the accounting and reporting policies of the Company are in accordance with legal requirements and agreed ethical practices;
review the scope and planning of audit requirements; review the findings on Management matters in conjunction with the external auditor
and departmental responses thereon (Management letter); keep under review the effectiveness of the Company’s system of accounting and
internal control;
FBN Holdings Plc.
8
make recommendations to the Board regarding the appointment, removal and remuneration of the external auditors of the Company, ensuring the independence and objectivity of the external auditors and that there is no conflict of interest which could impair the independent judgement of the external auditors;
authorise the internal auditor to carry out investigations into any activity of the Company which may be of interest or concern to the committee; and
assist in the oversight of the integrity of the Company’s fi statements and establish and develop the internal audit function.
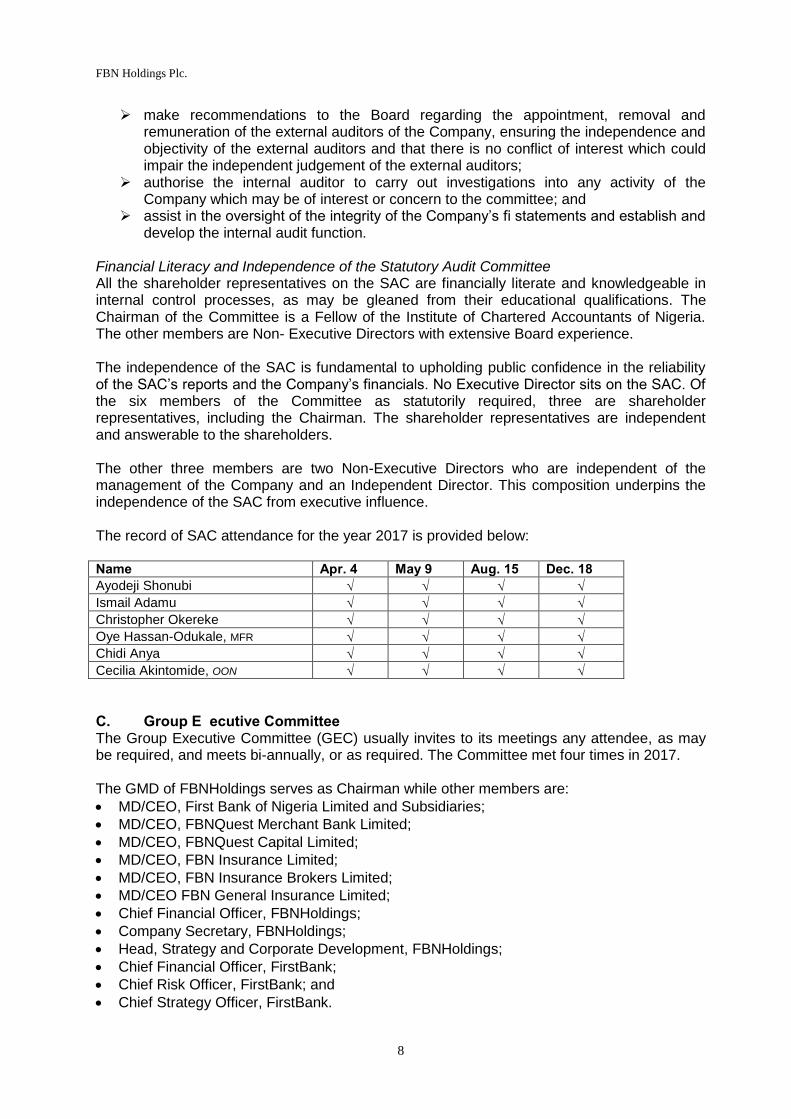
Financial Literacy and Independence of the Statutory Audit Committee All the shareholder representatives on the SAC are financially literate and knowledgeable in internal control processes, as may be gleaned from their educational qualifications. The Chairman of the Committee is a Fellow of the Institute of Chartered Accountants of Nigeria. The other members are Non- Executive Directors with extensive Board experience. The independence of the SAC is fundamental to upholding public confidence in the reliability of the SAC’s reports and the Company’s financials. No Executive Director sits on the SAC. Of the six members of the Committee as statutorily required, three are shareholder representatives, including the Chairman. The shareholder representatives are independent and answerable to the shareholders. The other three members are two Non-Executive Directors who are independent of the management of the Company and an Independent Director. This composition underpins the independence of the SAC from executive influence. The record of SAC attendance for the year 2017 is provided below: Name Apr. 4 May 9 Aug. 15 Dec. 18
Ayodeji Shonubi
Ismail Adamu
Christopher Okereke
Oye Hassan-Odukale, MFR
Chidi Anya
Cecilia Akintomide, OON
C. Group Executive Committee The Group Executive Committee (GEC) usually invites to its meetings any attendee, as may be required, and meets bi-annually, or as required. The Committee met four times in 2017. The GMD of FBNHoldings serves as Chairman while other members are:
MD/CEO, First Bank of Nigeria Limited and Subsidiaries;
MD/CEO, FBNQuest Merchant Bank Limited;
MD/CEO, FBNQuest Capital Limited;
MD/CEO, FBN Insurance Limited;
MD/CEO, FBN Insurance Brokers Limited;
MD/CEO FBN General Insurance Limited;
Chief Financial Officer, FBNHoldings;
Company Secretary, FBNHoldings;
Head, Strategy and Corporate Development, FBNHoldings;
Chief Financial Officer, FirstBank;
Chief Risk Officer, FirstBank; and
Chief Strategy Officer, FirstBank.
FBN Holdings Plc.
9
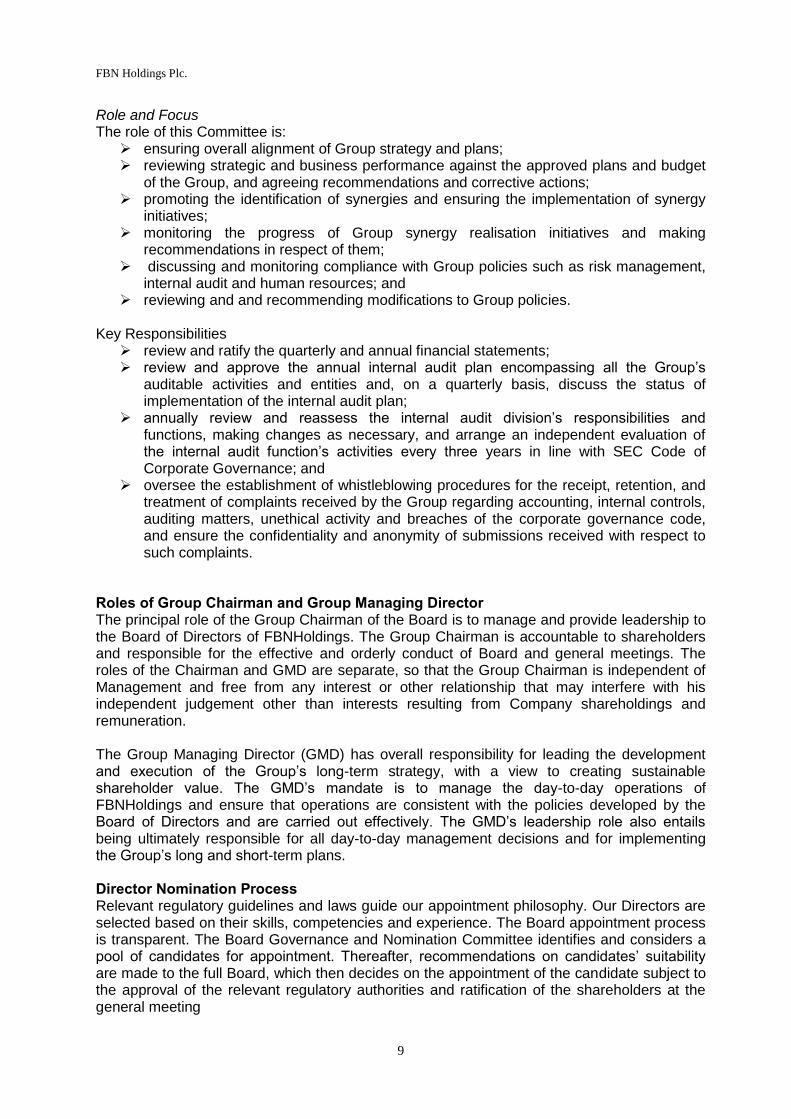
Role and Focus The role of this Committee is:
ensuring overall alignment of Group strategy and plans; reviewing strategic and business performance against the approved plans and budget
of the Group, and agreeing recommendations and corrective actions; promoting the identification of synergies and ensuring the implementation of synergy
initiatives; monitoring the progress of Group synergy realisation initiatives and making
recommendations in respect of them; discussing and monitoring compliance with Group policies such as risk management,
internal audit and human resources; and reviewing and and recommending modifications to Group policies.
Key Responsibilities
review and ratify the quarterly and annual financial statements; review and approve the annual internal audit plan encompassing all the Group’s
auditable activities and entities and, on a quarterly basis, discuss the status of implementation of the internal audit plan;
annually review and reassess the internal audit division’s responsibilities and functions, making changes as necessary, and arrange an independent evaluation of the internal audit function’s activities every three years in line with SEC Code of Corporate Governance; and
oversee the establishment of whistleblowing procedures for the receipt, retention, and treatment of complaints received by the Group regarding accounting, internal controls, auditing matters, unethical activity and breaches of the corporate governance code, and ensure the confidentiality and anonymity of submissions received with respect to such complaints.
Roles of Group Chairman and Group Managing Director The principal role of the Group Chairman of the Board is to manage and provide leadership to the Board of Directors of FBNHoldings. The Group Chairman is accountable to shareholders and responsible for the effective and orderly conduct of Board and general meetings. The roles of the Chairman and GMD are separate, so that the Group Chairman is independent of Management and free from any interest or other relationship that may interfere with his independent judgement other than interests resulting from Company shareholdings and remuneration. The Group Managing Director (GMD) has overall responsibility for leading the development and execution of the Group’s long-term strategy, with a view to creating sustainable shareholder value. The GMD’s mandate is to manage the day-to-day operations of FBNHoldings and ensure that operations are consistent with the policies developed by the Board of Directors and are carried out effectively. The GMD’s leadership role also entails being ultimately responsible for all day-to-day management decisions and for implementing the Group’s long and short-term plans. Director Nomination Process Relevant regulatory guidelines and laws guide our appointment philosophy. Our Directors are selected based on their skills, competencies and experience. The Board appointment process is transparent. The Board Governance and Nomination Committee identifies and considers a pool of candidates for appointment. Thereafter, recommendations on candidates’ suitability are made to the full Board, which then decides on the appointment of the candidate subject to the approval of the relevant regulatory authorities and ratification of the shareholders at the general meeting

FBN Holdings Plc.
10
Tenure of Directors Non-Executive Directors Non-Executive Directors are appointed for an initial term of four years and can be re-elected for a maximum of two subsequent terms of four years each, subject to satisfactory performance and approval of the members. Executive Directors Executive Directors are appointed for an initial term of three years and their tenure can be renewed for another three years, subject to a satisfactory annual performance evaluation. Hence, the maximum tenure of an Executive Director is six years. The Board may grant a waiver of the tenure limit in the case of an Executive Director whose performance is deemed exceptional. This will, however, require formal justification and unanimous approval of the Board. Executive Directors are discouraged from holding directorships external to the Group. Board Training Regardless of the expected depth of knowledge and experience of those appointed to the Board, we ensure regular domestic and international training programmes are organised for Board members to improve their decision-making capacity, thereby contributing to the effectiveness of the Board. A training plan is usually agreed by the Board with the Company Secretariat tasked with ensuring implementation of the plan. In some cases, in-planted programmes are organised to train Directors as a group, where it is considered that the training may be beneficial to all the members of the Board. The Board ensures that its knowledge base is constantly refreshed through continuous training and development programmes. Board Compensation Non-Executive Directors In line with the CBN and SEC Codes, Non-Executive Directors receive fi annual fees and sitting allowances for their services on Boards and Board Committee meetings. There are no contractual arrangements for compensation for loss of office. Non-Executive Directors do not receive short-term incentives, nor do they participate in any long-term incentive schemes. Executive Directors Remuneration for Executive Directors is performance-driven and restricted to base salaries, allowances, performance bonuses and share options. Executive Directors are not entitled to sitting allowances. The Group continually ensures that its remuneration policies and practices remain competitive, and are in line with its core values to incentivise and drive performance. Board Appraisal In compliance with the Securities and Exchange Commission (SEC) Code of Corporate Governance (the Code) and in consonance with our commitment to strengthening the Group’s corporate governance practices while enhancing the capacity of the Board in the effective discharge of its responsibilities, the Board engaged the services of an independent consultant, KPMG Professional Services, to conduct an appraisal of the Board of Directors and individual Director peer appraisal for the year ending 31 December 2017. The Board appraisal covered the Board’s structure and composition, processes, relationships, competencies, roles and responsibilities.

FBN Holdings Plc.
11
Succession Planning The Board Governance and Nomination Committee is tasked with the responsibility for the Group’s succession planning process. The Committee identifies critical positions on the Board and Executive Management level, deemed important to the achievement of the Company’s business objectives and strategies, and have a significant impact on the operations of the Group. These critical positions include the following: ● Board Chairman ● Non-Executive Directors ● Executive Management ● Subsidiary Managing Directors ● Subsidiary Board Chairmen Thereafter, Committee shall define the competency requirements for the key positions. The competency requirements provide a blueprint of what is required to succeed at each position and includes the required knowledge, skills, attitudes, as well as ethics, values and code of conduct. The competency requirement is identified and defined in line with the future needs and strategic objectives of the Group and provide the basis to assess potential successors for the identified key positions and to identify skills gaps and developmental needs. On conclusion of this phase, the Committee thereafter identifies a Talent Pool, following which the Committee determines the Skills and Competency Gaps. For the Chairman’s Position, the existing Chairman of the Board will articulate developmental needs of each individual Non-Executive Director on the Board to develop a plan to bridge that gap and position them as potential successors. For Non-Executive Directors, the Governance Committee will periodically undertake a careful analysis of the existing Board’s strengths and weaknesses, skills and experience gaps based on the exit of Directors from the Board and current deficiencies while noting the Company’s long-term business strategy and plans. Based on this assessment, the Governance Committee shall define the skills and competency profile that reflect the need of the Board. For Executive Management positions, the Governance Committee in conjunction with the GMD shall note and review the skills gap of the possible successors against expected competency requirements. Whistleblowing in FBN Holdings Plc The Board recognises that there may be instances where set ethical guidelines may be violated. To ensure that such violations receive attention from the appropriate office, the Whistleblowing Policy (“Policy”) was adopted by the Group. The Policy provides a channel for the Group’s employees and other relevant stakeholders to raise concerns about workplace malpractices confidentially to enable the relevant authorities investigate and deal with such in a manner consistent with the Group’s policies and relevant regulations. This Policy complies with the requirements of various regulatory authorities with oversight on the activities of the Group, including the CBN ‘Guidelines for Whistleblowing for Banks and other Financial Institutions in Nigeria’. The Policy The Policy applies to both internal whistleblowers (staff, contract employees, Management, or Directors) and external whistleblowers (customers, service providers, applicants, auditors, consultants, regulators and other stakeholders) and is intended to encourage staff and other relevant stakeholders to report perceived unethical or illegal conduct of employees, Management, Directors and other stakeholders across the Group to appropriate authorities

FBN Holdings Plc.
12
without any fear of harassment, intimidation, victimisation or reprisal of anyone for raising concern(s) under the Policy. Subsidiaries in the Group have a localised version of the whistleblowing policy and provide channels through which whistleblowers can report a perceived act of impropriety, unethical or illegal conduct. Such reports should not be based on mere speculation, rumours and gossip, but on factual knowledge. The full version of the Group’s Whistleblowing Policy can be viewed on our website: www.fbnholdings.com. The culture of whistleblowing To entrench the culture of whistleblowing among staff, emails and flyers on the advantages of whistleblowing, and the channels through which the whistleblower can report a perceived act of impropriety, unethical or illegal conduct, are publicised to them. The provisions of the Whistleblowing Policy, and the Group’s core values, encourage staff to speak up without fear and with the assurance that Management will investigate thoroughly and communicate findings to the parties involved. Internal whistleblowing procedure Internal whistleblowing involves staff members across the Group raising concerns about unethical conduct. An internal whistleblower can report perceived act of impropriety, unethical or illegal conduct through any of the following either by declaration or in confidence/anonymously:
Formal letter to the Group Managing Director (GMD) FBN Holdings Plc or the Head, Internal Audit FBN Holdings Plc.
Call or text a dedicated phone number 0812 716 6777; 0817 597 8505. Internal instant messaging platform. Dedicated email address ([email protected]). Via FBNHoldings website: www.fbnholdings.com.
Where the concern is received by staff other than the GMD or the Head, Internal Audit, the recipient is required to immediately pass same to the Head, Internal Audit and copy to the GMD, FBNHoldings. If the concerns affect the Head, Internal Audit, the GMD is notified and when a Director is involved, such concern shall be directed to the Chairman of the Board Audit and Risk Assessment Committee. The concern(s) shall be presented in the following format:
Background of the concerns (with relevant dates). Reason(s) why the whistleblower is particularly concerned about the situation.
Disciplinary measures in line with the staff handbook shall be taken against any employee that receives a whistleblowing report and fails to escalate or an internal whistleblower that acts out of malice. External whistleblowing procedure External whistleblowers are non-staff members of the Group such as contractors, service providers, shareholders, depositors, analysts, consultant, job applicants or members of the public. An external whistleblower may raise concern through any of the following either by declaration or in confidence/anonymously:

FBN Holdings Plc.
13
By a formal letter to the Group Managing Director, FBN Holdings Plc and/or Head, Internal Audit FBN Holdings Plc;
Dedicated phone number as contained on the website; www.fbnholdings.com; 0817 597 8505;
Dedicated email address; [email protected]; Electronically log onto www.fbnholdings.com; Directly to the Group Managing Director, FBNHoldings; and Directly to the Head, Internal Audit, FBNHoldings.
Protection and compensation for whistleblowers The policy of the Group is to protect whistleblowers who disclose concerns, provided the disclosure is made:
In the reasonable belief that it is intended to show malpractice or impropriety; To an appropriate person or authority; and In good faith without malice or mischief.
The Group will not subject a whistleblower to any harm and where necessary, compensation of whistleblowers, whether internal or external that have suffered loss shall be at the discretion of Management taking into consideration regulatory guidance on the compensation of whistleblower to be issued from time to time.

14
FBN HOLDINGS PLC
Directors' Report
For the year ended 31 December 2017
The Directors present their report on the affairs of FBN Holdings Plc (“the Company”) together with the
financial statements and auditors' report for the period ended 31 December 2017.
a. Legal Form
The Company was incorporated as a private limited liability company in Nigeria in 2010 and was
converted to a public company in September 2012, when it commenced operations. The Company’s
shares were listed on the floor of the Nigerian Stock Exchange on November 26, 2012 after the shares of
First Bank of Nigeria Plc were delisted on November 23, 2012.
b. Principal Activity and Business Review
The principal activity of the Company is the raising and allocation of capital and resources.
The Company is also responsible for coordinating group-wide financial reporting to shareholders and
managing shareholder, investor and external relations to the Group and the task of developing and
coordinating implementation of Group strategies.
The Company consists of three groups namely:
• Commercial Banking Group comprising First Bank of Nigeria Limited, FBNBank (UK) Limited,
First Pension Custodian Nigeria Limited, and FBNBank DR Congo (formerly Banque
Internationale de Credit), FBNBank Ghana, FBNBank Sierra Leone, FBNBank Guinea,
FBNBank, Gambia and FBNBank Senegal.
• Merchant Banking and Assets Management Group comprising FBNQuest Merchant Bank
Limited, FBNQuest Capital Limited, FBNQuest Securities Limited, FBNQuest Funds Limited
and FBNQuest Trustees Limited.
• Insurance Group comprising FBN Insurance Limited, FBN General Insurance Limited and FBN
Insurance Brokers Limited.
The Company prepares separate and consolidated financial statements.
c. Directors’ Shareholding
The direct and indirect interests of Directors in the issued share capital of the Company as recorded in the
register of Directors’ shareholding and/or as notified by the Directors for the purposes of Sections 275
and 276 of the Companies and Allied Matters Act and the listing requirements of the Nigerian Stock
Exchange are noted as follows:
DIRECTORS’ SHAREHOLDING
S/N Name Direct holding Indirect holding
1. Dr Oba Otudeko, CFR 5,895,264 532,075,839
2. Mr. Oye Hassan-Odukale, MFR 1,854,003 299,176,554
3. Mr. Chidi Anya - 52,168
4. Dr. Hamza Sule Wuro Bokki 3,389,061 -
5. Otunba (Mrs.) Adebola Osibogun 1,171,612 -
6. Mr. Omatseyin Akene Ayida 1,100,000 -
7. Mr. Urum Kalu Eke, MFR 1,080,558 -
8. Dr. Adesola Kazeem Adeduntan 52,189 -
9. Mrs. Oluwande Muoyo 674,043 798,596
10. Ms. Cecilia Akintomide, OON 5,500 -
15
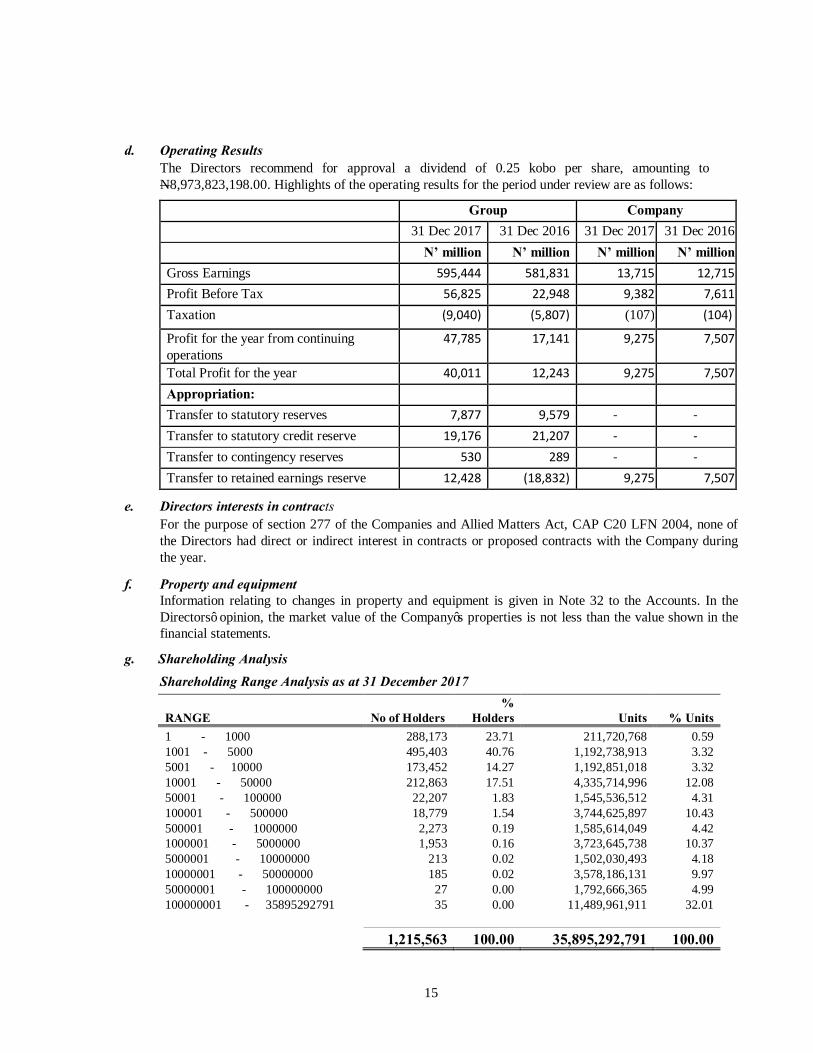
d. Operating Results
The Directors recommend for approval a dividend of 0.25 kobo per share, amounting to
N8,973,823,198.00. Highlights of the operating results for the period under review are as follows:
Group Company 31 Dec 2017 31 Dec 2016 31 Dec 2017 31 Dec 2016
N’ million N’ million N’ million N’ million
Gross Earnings 595,444 581,831 13,715 12,715Profit Before Tax 56,825 22,948 9,382 7,611Taxation (9,040) (5,807) (107) (104)
Profit for the year from continuing
operations 47,785 17,141 9,275 7,507
Total Profit for the year 40,011 12,243 9,275 7,507Appropriation:
Transfer to statutory reserves 7,877 9,579 - - Transfer to statutory credit reserve 19,176 21,207 - - Transfer to contingency reserves 530 289 - - Transfer to retained earnings reserve 12,428 (18,832) 9,275 7,507
e. Directors interests in contracts
For the purpose of section 277 of the Companies and Allied Matters Act, CAP C20 LFN 2004, none of
the Directors had direct or indirect interest in contracts or proposed contracts with the Company during
the year.
f. Property and equipment Information relating to changes in property and equipment is given in Note 32 to the Accounts. In the
Directors’ opinion, the market value of the Company’s properties is not less than the value shown in the
financial statements.
g. Shareholding Analysis
Shareholding Range Analysis as at 31 December 2017
RANGE No of Holders
%
Holders Units % Units
1 - 1000 288,173 23.71 211,720,768 0.59
1001 - 5000 495,403 40.76 1,192,738,913 3.32
5001 - 10000 173,452 14.27 1,192,851,018 3.32
10001 - 50000 212,863 17.51 4,335,714,996 12.08
50001 - 100000 22,207 1.83 1,545,536,512 4.31
100001 - 500000 18,779 1.54 3,744,625,897 10.43
500001 - 1000000 2,273 0.19 1,585,614,049 4.42
1000001 - 5000000 1,953 0.16 3,723,645,738 10.37
5000001 - 10000000 213 0.02 1,502,030,493 4.18
10000001 - 50000000 185 0.02 3,578,186,131 9.97
50000001 - 100000000 27 0.00 1,792,666,365 4.99
100000001 - 35895292791 35 0.00 11,489,961,911 32.01
1,215,563 100.00 35,895,292,791 100.00


FBN Holdings Plc.
INCOME STATEMENT
31 December 31 December 31 December 31 December
Note 2017 2016 2017 2016
N 'million N 'million N 'million N 'million
Continuing operations
Interest income 7 469,586 405,281 2,215 885
Interest expense 8 (138,064) (100,839) - -
Net interest income 331,522 304,442 2,215 885
Impairment charge for credit losses 9 (150,424) (226,037) - -
Net interest income after impairment charge for credit losses 181,098 78,405 2,215 885
Insurance premium revenue 10 12,973 9,606 - -
Insurance premium revenue ceded to reinsurers (2,739) (1,175) - -
Net insurance premium revenue 10,234 8,431 - -
Fee and commission income 11 74,453 71,360 - -
Fee and commission expense 11b (12,117) (11,073) - -
Net gains on foreign exchange 12 21,062 89,077 8 105
Net gains/(losses) on investment securities 13 2,610 3,930 16 (12)
Net gains/(losses) from financial instruments at fair value through profit or loss 14 11,117 (6) - -
Loss from disposal of subsidiary (8) - -
Gain from disposal of investment in associates - - - 144
Dividend income 15 2,053 897 11,437 11,559
Other operating income 16 3,901 2,868 38 34
Insurance claims (4,041) (2,190) - -
Personnel expenses 17 (85,678) (83,805) (982) (702)
Depreciation of property, plant and equipment 32 (11,600) (11,584) (398) (381)
Amortisation of intangible assets 33 (4,201) (3,324) - -
Impairment loss on investment - - - (1,700)
Operating expenses 18 (132,496) (120,030) (2,952) (2,321)
Operating profit 56,395 22,948 9,382 7,611
Share of profit of associates 430 - - -
Profit before tax 56,825 22,948 9,382 7,611
Income tax expense 19a (9,040) (5,807) (107) (104)
PROFIT FOR THE YEAR FROM CONTINUING OPERATIONS 47,785 17,141 9,275 7,507
Discontinued operations
Loss for the year from discontinued operations 31 (7,774) (4,898) - -
PROFIT FOR THE YEAR 40,011 12,243 9,275 7,507
Profit/(loss) attributable to:
Owners of the parent 43,631 14,122 9,275 7,507
Non-controlling interests (3,620) (1,879) - -
40,011 12,243 9,275 7,507
Earnings per share for profit attributable to owners of the parent
Basic/diluted earnings/ loss per share (in Naira): 52
From continuing operations 1.43 0.53 0.26 0.21
From discontinued operations (0.22) (0.14) - -
From profit for the year 1.21 0.39 0.26 0.21
GROUP COMPANY
26
FBN Holdings Plc.
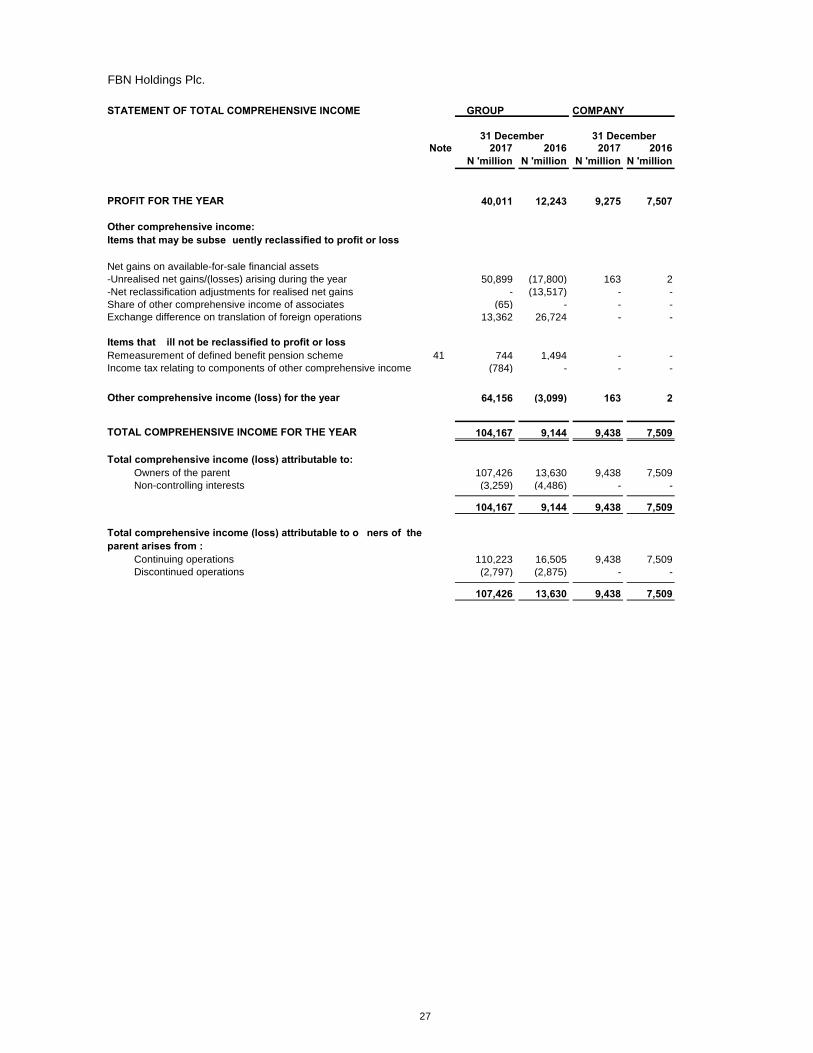
STATEMENT OF TOTAL COMPREHENSIVE INCOME GROUP COMPANY
Note 2017 2016 2017 2016
N 'million N 'million N 'million N 'million
PROFIT FOR THE YEAR 40,011 12,243 9,275 7,507
Other comprehensive income:
Items that may be subsequently reclassified to profit or loss
Net gains on available-for-sale financial assets
-Unrealised net gains/(losses) arising during the year 50,899 (17,800) 163 2
-Net reclassification adjustments for realised net gains - (13,517) - -
Share of other comprehensive income of associates (65) - - -
Exchange difference on translation of foreign operations 13,362 26,724 - -
Items that will not be reclassified to profit or loss
Remeasurement of defined benefit pension scheme 41 744 1,494 - -
Income tax relating to components of other comprehensive income (784) - - -
Other comprehensive income/(loss) for the year 64,156 (3,099) 163 2
TOTAL COMPREHENSIVE INCOME FOR THE YEAR 104,167 9,144 9,438 7,509
Total comprehensive income/(loss) attributable to:
Owners of the parent 107,426 13,630 9,438 7,509
Non-controlling interests (3,259) (4,486) - -
104,167 9,144 9,438 7,509
Total comprehensive income/(loss) attributable to owners of the
parent arises from :
Continuing operations 110,223 16,505 9,438 7,509
Discontinued operations (2,797) (2,875) - -
107,426 13,630 9,438 7,509
31 December 31 December
27
FBN Holdings Plc.
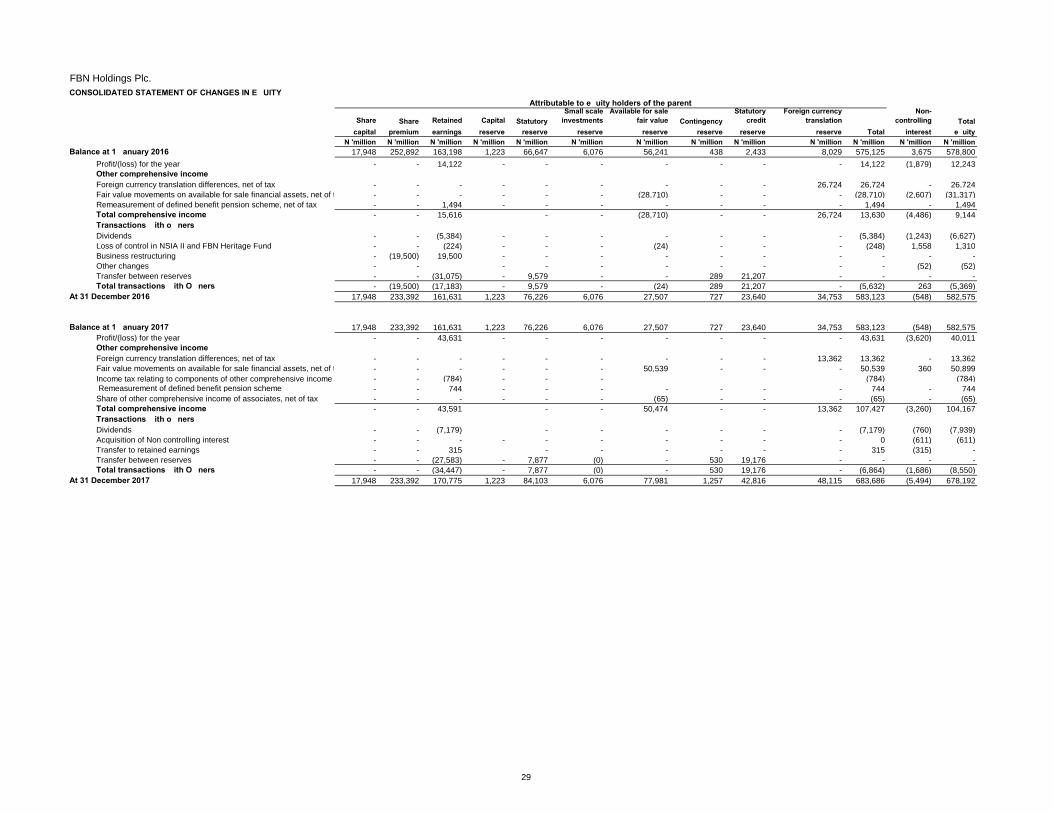
CONSOLIDATED STATEMENT OF CHANGES IN EQUITY
Share Share Retained Capital Statutory
Small scale
investments
Available for sale
fair value Contingency
Statutory
credit
Foreign currency
translation
Non-
controlling Total
capital premium earnings reserve reserve reserve reserve reserve reserve reserve Total interest equity
N 'million N 'million N 'million N 'million N 'million N 'million N 'million N 'million N 'million N 'million N 'million N 'million N 'million
Balance at 1 January 2016 17,948 252,892 163,198 1,223 66,647 6,076 56,241 438 2,433 8,029 575,125 3,675 578,800
Profit/(loss) for the year - - 14,122 - - - - - - - 14,122 (1,879) 12,243
Other comprehensive income
Foreign currency translation differences, net of tax - - - - - - - - - 26,724 26,724 - 26,724
Fair value movements on available for sale financial assets, net of tax - - - - - - (28,710) - - - (28,710) (2,607) (31,317)
Remeasurement of defined benefit pension scheme, net of tax - - 1,494 - - - - - - - 1,494 - 1,494
Total comprehensive income - - 15,616 - - (28,710) - - 26,724 13,630 (4,486) 9,144
Transactions with owners
Dividends - - (5,384) - - - - - - - (5,384) (1,243) (6,627)
Loss of control in NSIA II and FBN Heritage Fund - - (224) - - - (24) - - - (248) 1,558 1,310
Business restructuring - (19,500) 19,500 - - - - - - - - - -
Other changes - - - - - - - - - - (52) (52)
Transfer between reserves - - (31,075) - 9,579 - - 289 21,207 - - - -
Total transactions with Owners - (19,500) (17,183) - 9,579 - (24) 289 21,207 - (5,632) 263 (5,369)
At 31 December 2016 17,948 233,392 161,631 1,223 76,226 6,076 27,507 727 23,640 34,753 583,123 (548) 582,575
Balance at 1 January 2017 17,948 233,392 161,631 1,223 76,226 6,076 27,507 727 23,640 34,753 583,123 (548) 582,575
Profit/(loss) for the year - - 43,631 - - - - - - - 43,631 (3,620) 40,011
Other comprehensive income
Foreign currency translation differences, net of tax - - - - - - - - - 13,362 13,362 - 13,362
Fair value movements on available for sale financial assets, net of tax - - - - - - 50,539 - - - 50,539 360 50,899
Income tax relating to components of other comprehensive income - - (784) - - - (784) (784)
Remeasurement of defined benefit pension scheme - - 744 - - - - - - - 744 - 744
Share of other comprehensive income of associates, net of tax - - - - - - (65) - - - (65) - (65)
Total comprehensive income - - 43,591 - - 50,474 - - 13,362 107,427 (3,260) 104,167
Transactions with owners
Dividends - - (7,179) - - - - - - (7,179) (760) (7,939)
Acquisition of Non controlling interest - - - - - - - - - - 0 (611) (611)
Transfer to retained earnings - - 315 - - - - - - 315 (315) -
Transfer between reserves - - (27,583) - 7,877 (0) - 530 19,176 - - - -
Total transactions with Owners - - (34,447) - 7,877 (0) - 530 19,176 - (6,864) (1,686) (8,550)
At 31 December 2017 17,948 233,392 170,775 1,223 84,103 6,076 77,981 1,257 42,816 48,115 683,686 (5,494) 678,192
Attributable to equity holders of the parent
29

FBN Holdings Plc.
COMPANY STATEMENT OF CHANGES IN EQUITY
Share Share Retained Capital Available for sale
capital premium earnings reserve fair value reserve Total
N 'million N 'million N 'million N 'million N 'million N 'million
Balance at 1 January 2016 17,948 252,892 5,885 10 345 277,080
Profit for the year - - 7,507 - - 7,507
Other comprehensive income
Fair value movements on equity financial assets - - - - 2 2
Total comprehensive income - - 7,507 - 2 7,509
Transactions with owners
Dividends - - (5,384) - - (5,384)
Business restructuring - (19,500) - - - (19,500)
Total transactions with Owners - (19,500) (5,384) - - (24,884)
At 31 December 2016 17,948 233,392 8,008 10 347 259,705
Balance at 1 January 2017 17,948 233,392 8,008 10 347 259,705
Profit for the year - - 9,275 - - 9,275
Other comprehensive income
Fair value movements on equity financial assets - - - - 163 163
Total comprehensive income - - 9,275 - 163 9,438
Transactions with owners
Dividends - - (7,179) - - (7,179)
- - - - - -
Total transactions with Owners 0 0 (7,179) - - (7,179)
At 31 December 2017 17,948 233,392 10,104 10 510 261,964
Attributable to equity holders
of the parent
30

FBN Holdings Plc.
STATEMENT OF CASH FLOWS
Note 31 December 31 December 31 December 31 December
2017 2016 2017 2016
N 'million N 'million N 'million N 'million
Operating activities
Cash flow (used in)/generated from operations 44 116,302 (64,780) (3,609) (1,728)
Income taxes paid 19 (6,761) (7,889) (87) (20)
Interest received 459,401 388,128 2,110 538
Interest paid (138,939) (84,173) - -
Net cash flow generated from/(used in) operating activities 430,003 231,285 (1,586) (1,209)
Investing activities
Disposal of subsidiaries, net of cash disposed - 801 - 3,420
Disposal of associates - 1,644 - 1,644
Purchase of investment securities (1,036,882) (1,536,213) (13,142) (16,441)
Proceeds from the sale of investment securities 895,237 1,339,055 15,934 11,439
Dividends received 2,054 897 13,139 2,319
Purchase of investment properties - (12) - -
Proceeds from the disposal of investment property - 265
Purchase of property, plant and equipment 32 (12,816) (12,844) (235) (39)
Purchase of intangible assets 33 (6,114) (6,161) - -
Proceeds on disposal of property, plant and equipment 576 857 1 -
Proceeds on disposal of intangible assets - 55 - -
Net cash flow (used in)/generated from investing activities (157,945) (211,656) 15,697 2,341
Financing activities
Dividend paid (7,939) (5,986) (7,179) (5,384)
Proceeds from new borrowings 40 92,800 34,516 - -
Repayment of borrowings 40 (17,596) (59,306) - -
Interest paid on borrowings 40 (23,416) (15,879) - -
Acquisition of NCI/(disposal) by NCI (611) (52) - -
Net cash flow used in financing activities 43,238 (46,707) (7,179) (5,384)
Increase/(decrease) in cash and cash equivalents 315,296 (27,078) 6,932 (4,252)
Cash and cash equivalents at start of year 746,231 666,368 645 4,792
Effect of exchange rate fluctuations on cash held 104,920 106,941 8 105
Cash and cash equivalents at end of year 21 1,166,447 746,231 7,585 645
GROUP COMPANY
31

FBN Holdings Plc.
NOTES TO THE CONSOLIDATED FINANCIAL STATEMENTS
At 31 December 2017
1 General information
2 Summary of significant accounting policies
2.1 Basis of preparation
2.1.1 Basis of measurement
2.2 Changes in accounting policy and disclosures
2.2.1 New and amended standards adopted by the Group
(i)
(ii)
- Loans and receivables are measured at amortised cost.
These financial statements have been prepared on the historical cost basis except for the following:
- Derivative financial instruments which are measured at fair value.
- Non-derivative financial instruments, carried at fair value through profit or loss, are measured at fair value.
- Available for sale financial assets are measured at fair value through equity.
- The liability for defined benefit obligations is recognized as the present value of the defined benefit obligation less the fair value of
the plan assets.
- The plan assets for defined benefit obligations are measured at fair value.
- Assets and liabilities held to maturity are measured at amortised cost.
The Group has applied the following standards and amendment for the first time for their annual reporting period commencing 1
January 2017.
These financial statements are the consolidated financial statements of FBN Holdings Plc. (the Company), and its subsidiaries
(hereafter referred to as 'the Group'). The Registered office address of the Company is at 35 Marina, Samuel Asabia House, Lagos,
Nigeria.
The principal activities of the Group are mainly the provision of commercial banking services, investment banking services, insurance
business services and provision of other financial servises and corporate banking.
The consolidated financial statements for the year ended 31 December 2017 were approved and authorised for issue by the Board of
Directors on 23 March 2018.
The principal accounting policies adopted in the preparation of separate and consolidated financial statements of the parent and the
Group are set out below. These policies have been consistently applied to all the years presented, unless otherwise stated.
Amendments to IAS 12 - Income Taxes (effective 1 January 2017)
The amendment to IAS 12 sheds more light on the position regarding unrealized loss on debt instruments measured at fair value and
the recognition of deferred tax assets for such items. Unrealized losses on debt instruments measured at fair value in the financial
statements but measured at cost for tax purposes give rise to a deductible temporary difference regardless of whether the holder
expects to recover the carrying amount of the debt by sale or by use. Further clarification was made that the carrying amount of an
asset does not limit the estimation of probable future taxable profits. Also, when comparing deductible taxable difference with future
taxable profits, the future taxable profits should exclude tax deductions resulting from the reversal of those deductible temporary
differences. Moreover, an entity is required to assess a deferred tax asset in combination with other deferred tax assets. Where tax law
restricts the utilization of tax losses, an entity would assess a deferred tax asset in combination with other deferred tax assets of the
same type.
The amendments clarify that the existence of a deductible temporary difference depends solely on a comparison of the carrying
amount of an asset and its tax base at the end of the reporting period, and is not affected by possible future changes in the carrying
amount or expected manner of recovery of the asset. Therefore, as long as the tax base remains at the original cost of the asset, there
is a temporary difference. This now makes it possible for an entity to recognize deferred tax asset on debt instruments carried at fair
value, where the carrying amount is less than the nominal value because of market changes but where the entity expects to collect all
contractual cash flows. Also, deferred tax asset can be recognized on items of property, plant and equipment measured at cost and
where the entity expects to generate benefits exceeding that cost. However, there must be sufficient evidence to show that it is
probable that the entity will recover an asset for more than its carrying amount.
The amendments did not have a significant impact on the consolidated financial statement for the Group.
The Group’s consolidated financial statements for the year 2017 have been prepared in accordance with International Financial
Reporting Standards (IFRS) as issued by the International Accounting Standards Board (IASB), and with the applicable interpretations
– International Financial Reporting Interpretations Committee (IFRIC) and Standard Interpretation Committee (SIC) as issued by IFRS
Interpretation Committee. Additional information required by national regulations is included where appropriate.
The consolidated financial statements comprise the income statement, statement of comprehensive income, statement of financial
position, the statement of changes in equity, statement of cash flows and the related notes for the Group and the Company.
The consolidated financial statements have been prepared in accordance with the going concern principle under the historical cost
convention, modified to include fair valuation of particular financial instruments, to the extent required or permitted under IFRS as set
out in the relevant accounting policies.
The preparation of the consolidated financial statements in conformity with IFRS requires the use of certain critical accounting
estimates. It also requires directors to exercise judgement in the process of applying the accounting policies. Changes in assumptions
may have a significant impact on the consolidated financial statements in the period the assumptions changed.
The Directors believe that the underlying assumptions are appropriate and that the Group’s consolidated financial statements therefore
present the financial position and results fairly. The areas involving a higher degree of judgement or complexity, or areas where
assumptions and estimates are significant to the consolidated financial statements, are disclosed in Note 5.
Amendments to IFRS 12 - Disclosure of Interest in Other Entities (effective 1 January 2017)
The amendments to this standard clarify that all disclosure requirement of IFRS 12 other than summarised financial information as
contained in paragraphs B10-B16, also apply to any interests that are classified as held for sale, held for distribution to owners or
discontinued operations in accordance with IFRS 15.
The amendments did not have any impact on the consolidated financial statements of the Group, as the Group did not acquire any
interest in joint operations.
32
FBN Holdings Plc.
NOTES TO THE CONSOLIDATED FINANCIAL STATEMENTS
At 31 December 2017
(iii)
2.2.2
(i)
(ii)
(iii)
The Group will apply the IFRSs that are yet to be effective in the preparation of its consolidated financial statements on the effective
dates as stipulated by the respective accounting standards.
IFRS 16 – Leases (effective 1 January 2019)
IFRS 16 has been issued to replace IAS 17.
IFRS 16 provides a single lessee accounting model, requiring lessees to recognise assets and liabilities for all leases unless term is
12 months or less or the underlying asset has a low value. Lessors continue to classify leases as operating or finance, with IFRS 16's
approach to lessor accounting substantially unchanged from IAS 17.
The Group is currently assessing the potential impact on its consolidated financial statements resulting from the application of IFRS
16.
A number of new standards, interpretations and amendments thereto, had been issued by IASB which are not yet effective, and have
not been applied in preparing these consolidated financial statements.
IFRS 9 - Financial instruments (effective 1 January 2018)
IFRS 9 is part of the IASB’s project to replace IAS 39. It addresses classification, measurement and impairment of financial assets as
well as hedge accounting.
IFRS 9 replaces the multiple classification and measurement models in IAS 39 with a single model that has only three classification
categories: amortised cost, fair value through OCI and fair value through profit or loss. It includes the guidance on accounting for and
presentation of financial liabilities and derecognition of financial instruments which was previously in IAS 39. Furthermore for non-
derivative financial liabilities designated at fair value through profit or loss, it requires that the credit risk component of fair value gains
and losses be separated and included in OCI rather than in the income statement.
IFRS 9 also requires that credit losses expected at the balance sheet date (rather than only losses incurred in the year) on loans, debt
securities and loan commitments not held at fair value through profit or loss be reflected in impairment allowances. This requirement of
IFRS 9 is expected to significantly impact the banking businesses in the Group.
Furthermore, the IASB has amended IFRS 9 to align hedge accounting more closely with an entity’s risk management. The revised
standard establishes a more principles-based approach to hedge accounting and addresses inconsistencies and weaknesses in the
current model in IAS 39.
FBN Limited has grouped its loans and debt securities into 3 stages, based on the applied impairment methodology, as described
• Stage 1 - No significant changes in credit quality of exposure since initial recognition. The Bank recognises an allowance based on
12-month expected credit losses.
• Stage 2 - The credit risk of the exposure has increased significantly since initial recognition. The Bank records an allowance for the
lifetime expected credit loss.
• Stage 3 - The credit risk of the exposure has increased significantly since initial recognition and there is objective evidence of
impairment. The Bank recognises the lifetime expected credit losses for these loans.
New standards, interpretations and amendments to existing standards that are not yet effective
In comparison to IAS 39, FBN Limited expects the impairment charge under IFRS 9 to be more volatile than under IAS 39 and to result
in an increase in the total level of current impairment allowances of approximately N49.8billion.
The Group is still assessing the impact of IFRS 9 on the entire Group. However FBN Limited which is the most material entity in the
Group accounts for a significant portion of the Group's financial instruments has completed its initial assessment.
Having completed its initial assessment, FBN Limited has made the following decisions:
IFRS 15 - Revenue from Contracts with Customers (effective 1 January 2018)
IFRS 15 specifies how and when an IFRS reporter will recognise revenue as well as requiring such entities to provide users of financial
statements with more informative, relevant disclosures. The standard provides a single, principles based five-step model to be applied
to all contracts with customers. The Group will adopt IFRS 15 with effect from the accounting period beginning on 1 January 2018.
The Group is currently evaluating the impact of this new Standard on its Financial Statements.
Amendments to IAS 7 - Statement of Cash Flows (effective 1 January 2017)
The aim of the amendment is to provide disclosures that enable users of financial statements to evaluate changes in liabilities arising
from financing activities. As such, entities are required to provide further information on changes in liabilities and/or assets arising from
financing activities such as changes from financing cash flows; changes arising from obtaining or losing control of subsidiaries or other
businesses; effect of changes in foreign exchange rates; changes in fair values; and other changes. Entities are also not required to
provide comparatives in the first year of adoption
Amendments to IAS 12 - Income Taxes (effective 1 January 2017)
The amendment to IAS 12 sheds more light on the position regarding unrealized loss on debt instruments measured at fair value and
the recognition of deferred tax assets for such items. Unrealized losses on debt instruments measured at fair value in the financial
statements but measured at cost for tax purposes give rise to a deductible temporary difference regardless of whether the holder
expects to recover the carrying amount of the debt by sale or by use. Further clarification was made that the carrying amount of an
asset does not limit the estimation of probable future taxable profits. Also, when comparing deductible taxable difference with future
taxable profits, the future taxable profits should exclude tax deductions resulting from the reversal of those deductible temporary
differences. Moreover, an entity is required to assess a deferred tax asset in combination with other deferred tax assets. Where tax law
restricts the utilization of tax losses, an entity would assess a deferred tax asset in combination with other deferred tax assets of the
same type.
The amendments clarify that the existence of a deductible temporary difference depends solely on a comparison of the carrying
amount of an asset and its tax base at the end of the reporting period, and is not affected by possible future changes in the carrying
amount or expected manner of recovery of the asset. Therefore, as long as the tax base remains at the original cost of the asset, there
is a temporary difference. This now makes it possible for an entity to recognize deferred tax asset on debt instruments carried at fair
value, where the carrying amount is less than the nominal value because of market changes but where the entity expects to collect all
contractual cash flows. Also, deferred tax asset can be recognized on items of property, plant and equipment measured at cost and
where the entity expects to generate benefits exceeding that cost. However, there must be sufficient evidence to show that it is
probable that the entity will recover an asset for more than its carrying amount.
The amendments did not have a significant impact on the consolidated financial statement for the Group.
33

FBN Holdings Plc.
NOTES TO THE CONSOLIDATED FINANCIAL STATEMENTS
At 31 December 2017
2.3 Consolidation
a. Subsidiaries
The financial statements of the consolidated subsidiaries used to prepare the consolidated financial statements were prepared as of
the parent company’s reporting date.
Subsidiaries are all entities (including structured entities) over which the group has control. The group controls an entity when the
group is exposed to, or has rights to, variable returns from its involvement with the entity and has the ability to affect those returns
through its power over the entity. Subsidiaries are fully consolidated from the date on which control is transferred to the group. They
are deconsolidated from the date that control ceases.
The assessment of control is based on the consideration of all facts and circumstances. The Group reassesses whether or not it
controls an investee if fact and circumstances indicate that there are changes to one or more of the elements of control.
Investment in subsidiaries is measured at cost in the separate financial statements of the parent.
The group applies the acquisition method to account for business combinations. The consideration transferred for the acquisition of a
subsidiary is the fair values of the assets transferred, the liabilities incurred to the former owners of the acquiree and the equity
interests issued by the group.
The consideration transferred includes the fair value of any asset or liability resulting from a contingent consideration arrangement.
Identifiable assets acquired and liabilities and contingent liabilities assumed in a business combination are measured initially at their
fair values at the acquisition date. The group recognises any non-controlling interest in the acquiree on an acquisition-by-acquisition
basis, either at fair value or at the non-controlling interest’s proportionate share of the recognised amounts of acquiree’s identifiable net
assets.
Acquisition-related costs are expensed as incurred. If the business combination is achieved in stages, the acquisition date carrying
value of the acquirer’s previously held equity interest in the acquiree is re-measured to fair value at the acquisition date; any gains or
losses arising from such re-measurement are recognised in profit or loss.
Any contingent consideration to be transferred by the group is recognised at fair value at the acquisition date. Subsequent changes to
the fair value of the contingent consideration that is deemed to be an asset or liability is recognised in accordance with IAS 39 either in
profit or loss or as a change to other comprehensive income.
Contingent consideration that is classified as equity is not re-measured, and its subsequent settlement is accounted for within equity.
The excess of the consideration transferred, the amount of any non-controlling interest in the acquiree and the acquisition-date fair
value of any previous equity interest in the acquiree over the fair value of the identifiable net assets acquired is recorded as goodwill. If
the total of consideration transferred, non-controlling interest recognised and previously held interest measured is less than the fair
value of the net assets of the subsidiary acquired in the case of a bargain purchase, the difference is recognised directly in the income
statement.
Inter-company transactions, balances and unrealised gains on transactions between group companies are eliminated. Unrealised
losses are also eliminated. Where necessary, amounts reported by subsidiaries have been adjusted to conform with the group’s
accounting policies.
34
FBN Holdings Plc.
NOTES TO THE CONSOLIDATED FINANCIAL STATEMENTS
At 31 December 2017
b.
c. Disposal of subsidiaries
d. Associates
e. Investment entities
2.4 Segment reporting
2.5 Common control transactions
2.6 Foreign currency translation
a. Functional and presentation currency
b. Transactions and balances
Foreign currency transactions are translated into the functional currency using the exchange rates prevailing at the dates of the
transactions or valuation where items are re- measured. Foreign exchange gains and losses resulting from the settlement of such
transactions and from the translation at year-end exchange rates of monetary assets and liabilities denominated in foreign currencies
are recognised in the income statement.
Some of the entities within the Group are investment entities. Equity investments held by these entities in the investee companies are
carried in the balance sheet at fair value through profit or loss even though the Group may have significant influence over those
companies. This treatment is permitted by IAS 28, `Investment in associates', which allows investments that are held by Investment
Entities to be recognised and measured as at fair value through profit or loss and accounted for in accordance with IAS 39 and IFRS
13, with changes in fair value recognised in the income statement in the period of the change.
Directors also consider the most recent pronouncements of other standard setting bodies that use a similar conceptual framework to
develop accounting standards, to the extent that these do not conflict with the IFRS Framework or any other IFRS or interpretation.
Accordingly, the Group's policy is that the assets and liabilities of the business transferred are measured at their existing book value in
the consolidated financial statements of the parent, as measured under IFRS. The Company incorporates the results of the acquired
businesses only from the date on which the business combination occurs.
Transactions with non-controlling interests that do not result in loss of control are accounted for as equity transactions – that is, as
transactions with the owners in their capacity as owners. The difference between fair value of any consideration paid and the relevant
share acquired of the carrying value of net assets of the subsidiary is recorded in equity. Gains or losses on disposals to non-
controlling interests are also recorded in equity.
When the group ceases to have control, any retained interest in the entity is re-measured to its fair value at the date when control is
lost, with the change in carrying amount recognised in profit or loss. The fair value is the initial carrying amount for the purposes of
subsequently accounting for the retained interest as an associate, joint venture or financial asset. In addition, any amounts previously
recognised in other comprehensive income in respect of that entity are accounted for as if the group had directly disposed of the
related assets or liabilities. This may mean that amounts previously recognised in other comprehensive income are reclassified to
profit or loss.
A business combination involving entities or businesses under common control is excluded from the scope of IFRS 3: Business
Combinations. The exemption is applicable where the combining entities or businesses are controlled by the same party both before
and after the combination. Where such transactions occur, the Group, in accordance with IAS 8, uses its judgment in developing and
applying an accounting policy that is relevant and reliable. In making this judgment, directors consider the requirements of IFRS
dealing with similar and related issues and the definitions, recognition criteria and measurement concepts for assets, liabilities, income
and expenses in the framework.
Changes in ownership interests in subsidiaries without change of control.
Associates are all entities over which the group has significant influence but not control, generally accompanying a shareholding of
between 20% and 50% of the voting rights. Investment in associates is measured at cost in the separate financial statements of the
investor. Investments in associates are accounted for using the equity method of accounting in the Consolidated Financial Statements
of the Group. Under the equity method, the investment is initially recognised at cost, and the carrying amount is increased or
decreased to recognise the investor’s share of the profit or loss of the investee after the date of acquisition.
The group’s investment in associates includes goodwill identified on acquisition.
If the ownership interest in an associate is reduced but significant influence is retained, only a proportionate share of the amounts
previously recognised in other comprehensive income is reclassified to profit or loss where appropriate.
The group’s share of post-acquisition profit or loss is recognised in the income statement, and its share of post-acquisition movements
in other comprehensive income is recognised in other comprehensive income with a corresponding adjustment to the carrying amount
of the investment. When the Group’s share of losses in an associate equals or exceeds its interest in the associate, including any other
unsecured receivables, the Group does not recognise further losses, unless it has incurred legal or constructive obligations or made
payments on behalf of the associate.
The group determines at each reporting date whether there is any objective evidence that the investment in an associate is impaired. If
this is the case, the Group calculates the amount of impairment as the difference between the recoverable amount of the associate and
its carrying value and recognises the amount adjacent to share of profit/(loss) of associates in the income statement.
Items included in the financial statements of each of the Group’s entities are measured using the currency of the primary economic
environment in which the entity operates (‘the functional currency’).
The consolidated financial statements are presented in Nigerian Naira which is the group's presentation currency.
Operating segments are reported in a manner consistent with the internal reporting provided to the chief operating decision-maker. The
chief operating decision-maker, who is responsible for allocating resources and assessing performance of the operating segments, has
been identified as the Group Executive Committee.
All transactions between business segments are conducted at arm’s length, with inter-segment revenue and expenditure eliminated at
the Group. Income and expenses directly associated with each segment is included in determining the segment’s performance.
35

FBN Holdings Plc.
NOTES TO THE CONSOLIDATED FINANCIAL STATEMENTS
At 31 December 2017
c. Group companies
2.7 Income taxation
a. Current income tax
b. Deferred tax
2.8 Inventories
2.9 Financial assets and liabilities
The results and financial position of all the group entities which have functional currency different from the Group’s presentation
currency, are translated into the Group’s presentation currency as follows:
• assets and liabilities of each foreign operation are translated at the rates of exchange ruling at the reporting date;
• income and expenses of each foreign operation are translated at the average exchange rate for the period, unless this average is not
a reasonable approximation of the rate prevailing on transaction date, in which case income and expenses are translated at the
exchange rate ruling at transaction date; and
• all resulting exchange differences are recognised in other comprehensive income.
Changes in the fair value of monetary securities denominated in foreign currency classified as available for sale are analysed between
translation differences resulting from changes in the amortised cost of the security and other changes in the carrying amount of the
security. Translation differences related to changes in amortised cost are recognised in profit or loss, and other changes in carrying
amount are recognised in other comprehensive income.
Translation differences on non-monetary financial assets and liabilities such as equities held at fair value through profit or loss are
recognised in profit or loss as part of the fair value gain or loss. Translation differences on non-monetary financial assets, such as
equities classified as available for sale, are included in other comprehensive income.
The Group purchases and constructs properties for resale.
The Group recognises Property as inventory under the following circumstances:
i. property purchased for the specific purpose of resale
ii. property constructed for the specific purpose of resale (work in progress under the scope of IAS 18, ‘Revenue’)
iii. property transferred from investment property to inventories. This is permitted when the Group commences the property's
development with a view to sale.
They are valued at the lower of cost and net realisable value. Cost comprises direct materials and, where appropriate, labour and
production overheads which have been incurred in bringing the inventories and work in progress to their present location and condition.
Cost is determined using weighted average cost. Net realisable value represents the estimated selling price less estimated costs to
completion and costs to be incurred in marketing, selling and distribution.
Deferred tax is recognised on temporary differences arising between the tax bases of assets and liabilities and their carrying amounts
in the consolidated financial statements. However, deferred tax liabilities are not recognised if they arise from the initial recognition of
goodwill; deferred tax is not accounted for if it arises from initial recognition of an asset or liability in a transaction other than a
business combination that at the time of the transaction affects neither accounting nor taxable profit or loss.
Deferred tax is determined using tax rates (and laws) that have been enacted or substantively enacted by the balance sheet date and
are expected to apply when the related deferred tax asset is realised or the deferred tax liability is settled.
Deferred tax assets are recognised only to the extent that it is probable that future taxable profit will be available against which the
temporary differences can be utilised.
Deferred tax liabilities are provided on taxable temporary differences arising from investments in subsidiaries, associates and joint
arrangements, except for deferred tax liability where the timing of the reversal of the temporary difference is controlled by the group
and it is probable that the temporary difference will not reverse in the foreseeable future.
Deferred tax assets are recognised on deductible temporary differences arising from investments in subsidiaries, associates and joint
arrangements only to the extent that it is probable the temporary difference will reverse in the future and there is sufficient taxable profit
available against which the temporary difference can be utilised.
Deferred tax assets and liabilities are offset when there is a legally enforceable right to offset current tax assets against current tax
liabilities and when the deferred taxes assets and liabilities relate to income taxes levied by the same taxation authority on either the
same taxable entity or different taxable entities where there is an intention to settle the balances on a net basis.
Deferred tax assets and liabilities are only offset when they arise in the same tax reporting group and where there is both the legal right
and the intention to settle on a net basis or to realise the asset and settle the liability simultaneously.
In accordance with IAS 39, all financial assets and liabilities – which include derivative financial instruments – have to be recognised in
the statement of financial position and measured in accordance with their assigned category.
Goodwill and fair value adjustments arising on the acquisition of a foreign entity are treated as assets and liabilities of the foreign entity
and translated at the closing rate . Exchange differences arising are recognised in other comprehensive income.
Income tax payable is calculated on the basis of the applicable tax law in the respective jurisdiction and is recognised as an expense
(income) for the period except to the extent that current tax related to items that are charged or credited in other comprehensive
income or directly to equity. In these circumstances, current tax is charged or credited to other comprehensive income or to equity (for
example, current tax on equity instruments for which the entity has elected to present gains and losses in other comprehensive
income).
36
FBN Holdings Plc.
NOTES TO THE CONSOLIDATED FINANCIAL STATEMENTS
At 31 December 2017
2.9.1 Financial assets
a. Financial assets at fair value through profit or loss
b. Loans and receivables
c. Held-to-maturity financial assets
d. Available-for-sale financial assets
Financial assets at fair value through profit or loss are financial assets held for trading.
A financial asset is classified as held for trading if it is acquired or incurred principally for the purpose of selling or repurchasing it in the
near term or if it is part of a portfolio of identified financial instruments that are managed together and for which there is evidence of a
recent actual pattern of short-term profit-taking. Derivatives are also categorised as held for trading unless they are designated and
effective as hedging instruments. Financial assets held for trading consist of debt instruments, including money-market paper, traded
corporate and bank loans, and equity instruments, as well as financial assets with embedded derivatives.
Financial instruments included in this category are recognised initially at fair value; transaction costs are taken directly to profit or loss.
Gains and losses arising from changes in fair value are included directly in the income statement and are reported as ‘Net
gains/(losses) on financial instruments at fair value through profit or loss’. Interest income and expense and dividend income on
financial assets held for trading are included in ‘Net interest income’ or ‘Dividend income’ respectively.
The instruments are derecognised when the rights to receive cash flows have expired or the Group has transferred substantially all the
risks and rewards of ownership and the transfer qualifies for derecognising.
Available-for-sale investments are financial assets that are intended to be held for an indefinite period of time, which may be sold in
response to needs for liquidity or changes in interest rates, exchange rates or equity prices or that are not classified as loans and
receivables, held-to-maturity investments or financial assets at fair value through profit or loss.
Available-for-sale financial assets are initially recognised at fair value, which is the cash consideration including any transaction costs,
and measured subsequently at fair value with gains and losses being recognised in other comprehensive income, except for
impairment losses and foreign exchange gains and losses, until the financial asset is derecognised. If an available-for-sale financial
asset is determined to be impaired, the cumulative gain or loss previously recognised in other omprehensive income is recognised in
the income statement.
However, interest is calculated using the effective interest method, and foreign currency gains and losses on non-monetary assets
classified as available for sale are recognised in other comprehensive income. Dividends on available-for-sale equity instruments are
recognised in the income statement in ‘dividend income’ when the Group’s right to receive payment is established.
Loans and receivables are non-derivative financial assets with fixed or determinable payments that are not quoted in an active market,
other than:
i. those that the Group intends to sell immediately or in the short term, which are classified as held for trading, and those that the entity
upon initial recognition designates as at fair value through profit or loss;
ii. those that the Group upon initial recognition designates as available for sale; or
iii. those for which the holder may not recover substantially all of its initial investment, other than because of credit deterioration.
Loans and receivables are initially recognised at fair value – which is the cash consideration to originate or purchase the loan including
any transaction costs – and measured subsequently at amortised cost using the effective interest method. Loans and receivables are
reported in the statement of financial position as loans and advances to banks or customers or other assets and cash balances.
Interest on loans is included in the profit or loss and is reported as ‘Interest income’.
In the case of an impairment, the impairment loss is reported as a deduction from the carrying value of the loan and recognised in the
profit or loss as ‘impairment charge for credit losses’.
Held-to-maturity investments are non-derivative financial assets with fixed or determinable payments and fixed maturities that the
Group’s management has the positive intention and ability to hold to maturity, other than:
i. those that the Group upon initial recognition designates as at fair value through profit or loss;
ii. those that the Group designates as available for sale; and
iii. those that meet the definition of loans and receivables.
These are initially recognised at fair value including direct and incremental transaction costs and measured subsequently at amortised
cost, using the effective interest method.
Interest on held-to-maturity investments is included in the income statement and reported as ‘Interest income’. In the case of an
impairment, the impairment loss has been reported as a deduction from the carrying value of the investment and recognised in the
income statement as ‘Net gains/(losses) on investment securities’.
The Group allocates financial assets to the following IAS 39 categories: financial assets at fair value through profit or loss; loans and
receivables; held-to-maturity investments; and available-for-sale financial assets. Directors determine the classification of its financial
instruments at initial recognition.
37

FBN Holdings Plc.
NOTES TO THE CONSOLIDATED FINANCIAL STATEMENTS
At 31 December 2017
e. Recognition
2.9.2 Financial liabilities
a. Financial liabilities at fair value through profit or loss
b. Other liabilities measured at amortised cost
2.9.3 Derivative financial instruments
2.9.4 Embedded derivatives
2.9.5 Determination of fair value
The Group uses settlement date accounting for regular way contracts when recording financial asset transactions. Financial assets that
are transferred to a third party but do not qualify for derecognition are presented in the statement of financial position as ‘Assets
pledged as collateral’, if the transferee has the right to sell or repledge them.
The Group’s holding in financial liabilities is in financial liabilities at fair value through profit or loss and financial liabilities at amortised
cost. Financial liabilities are derecognised when extinguished.
Financial liabilities at fair value through profit or loss are financial liabilities held for trading.
A financial liability is classified as held for trading if it is acquired or incurred principally for the purpose of selling or repurchasing it in
the near term or if it is part of a portfolio of identified financial instruments that are managed together and for which there is evidence of
a recent actual pattern of short-term profit-taking.
Derivatives are also categorised as held for trading unless they are designated and effective as hedging instruments. Financial
liabilities held for trading also include obligations to deliver financial assets borrowed by a short seller.
Gains and losses arising from changes in fair value of financial liabilities classified held for trading are included in the income
statement and are reported as ‘Net gains/ (losses) on financial instruments classified as held for trading’. Interest expenses on financial
liabilities held for trading are included in ‘Net interest income’.
Financial liabilities that are not classified at fair value through profit or loss fall into this category and are measured at amortised cost.
Financial liabilities measured at amortised cost are deposits from banks or customers, debt securities in issue for which the fair value
option is not applied, convertible bonds and subordinated debts.
Fair value is defined as the price that would be received to sell an asset or paid to transfer a liability in an orderly transaction between
market participants at the measurement date.
For financial instruments traded in active markets, the determination of fair values of financial assets and financial liabilities is based
on quoted market prices or dealer price quotations. This includes listed equity securities and quoted debt instruments on major
exchanges (for example, the Nigerian Stock Exchange (NSE)) and broker quotes from Bloomberg and Reuters.
A financial instrument is regarded as quoted in an active market if quoted prices are readily and regularly available from an exchange,
dealer, broker, industry group, pricing service or regulatory agency, and those prices represent actual and regularly occurring market
transactions on an arm’s length basis.
If the above criteria are not met, the market is regarded as being inactive. Indications that a market is inactive are when there is a wide
bid-offer spread or significant increase in the bid-offer spread or there are few recent transactions.
For all other financial instruments, fair value is determined using valuation techniques. In these techniques, fair values are estimated
from observable data in respect of similar financial instruments, using models to estimate the present value of expected future cash
flows or other valuation techniques, using inputs (for example, LIBOR yield curve, FX rates, volatilities and counterparty spreads)
existing at the dates of the statement of financial position.
The Group uses widely recognised valuation models for determining fair values of non standardised financial instruments of lower
complexity, such as options or interest rate and currency swaps. For these financial instruments, inputs into models are generally
market-observable.
Derivatives are classified as assets when their fair value is positive or as liabilities when their fair value is negative. Derivative assets
and liabilities arising from different transactions are only offset where there is a legal right of offset of the recognised amounts and the
parties intend to settle the cash flows on a net basis, or realise the asset and settle the liability simultaneously.
Hybrid contracts contain both a derivative and a non-derivative component. In such cases, the derivative component is termed an
embedded derivative. Where the economic characteristics and risks of the embedded derivatives are not closely related to those of the
host contract, and the host contract itself is not carried at fair value through profit or loss, the embedded derivative is bifurcated and
measured at fair value with gains and losses being recognised in the income statement.
Derivative financial instruments include swaps, forward rate agreements, futures, options and combinations of these instruments, and
they primarily affect the Group’s net interest income, net trading income, net fee and commission income and derivative assets and
liabilities. Notional amounts of the contracts are not recorded on the balance sheet. All derivative financial instruments are held at fair
value through profit or loss.
38
FBN Holdings Plc.
NOTES TO THE CONSOLIDATED FINANCIAL STATEMENTS
At 31 December 2017
2.9.6 De-recognition of financial instruments
2.9.7 Reclassification of financial assets
2.10 Offsetting financial instruments
2.11 Revenue recognition
a. Interest income and expense
The Group derecognises a financial asset only when the contractual rights to the cash flows from the asset expire or it transfers the
financial asset and substantially all the risks and rewards of ownership of the asset to another entity. If the Group neither transfers nor
retains substantially all the risks and rewards of ownership and continues to control the transferred asset, the Group recognises its
retained interest in the asset and an associated liability for amounts it may have to pay. If the Group retains substantially all the risks
and rewards of ownership of a transferred financial asset, the Group continues to recognise the financial asset and also recognises a
collateralised borrowing for the proceeds received.
For more complex instruments, the Group uses internally developed models, which are usually based on valuation methods and
techniques generally recognised as standard within the industry. Valuation models are used primarily to value derivatives transacted in
the over-the-counter market, unlisted securities (including those with embedded derivatives) and other instruments for which markets
were or have become illiquid. Some of the inputs to these models may not be market observable and are therefore estimated based on
assumptions.
The impact on other comprehensive income of financial instrument valuations reflecting non-market observable inputs (level 3
valuations) is disclosed in Note 3.7.
The output of a model is always an estimate or approximation of a value that cannot be determined with certainty, and valuation
techniques employed may not fully reflect all factors relevant to the positions the Group holds. Valuations are therefore adjusted,
where appropriate, to allow for additional factors including model risks, liquidity risk and counterparty credit risk.
Based on the established fair value model governance policies, and related controls and procedures applied, management believes
that these valuation adjustments are necessary and appropriate to fairly state the values of financial instruments carried at fair value in
the statement of financial position. Price data and parameters used in the measurement procedures applied are generally reviewed
carefully and adjusted, if necessary – particularly in view of the current market developments.
The estimated fair value of loans and advances represents an estimation of the value of the loans using average benchmarked lending
rates which were adjusted for specific entity risks based on history of losses.
Master agreements provide that, if an event of default occurs, all outstanding transactions with the counterparty will fall due and all
amounts outstanding will be settled on a net basis.
Financial assets and liabilities are offset and the net amount reported in the statement of financial position when there is a currently
legally enforceable right to offset the recognised amounts and there is an intention to settle on a net basis or realise the asset and
settle the liability simultaneously. The legally enforceable right must not be contingent on future events and must be enforceable in the
normal course of business and in event of default, insolvency or bankruptcy of the company or the counterparty.
Reclassifications are made at fair value as of the reclassification date. Fair value becomes the new cost or amortised cost as
applicable, and no reversals of fair value gains or losses recorded before reclassification date are subsequently made. Effective
interest rates for financial assets reclassified to loans and receivables and held-to-maturity categories are determined at the
reclassification date. Further increases in estimates of cash flows adjust effective interest rates prospectively.
The group may reclassify a financial instrument when its intentions and the characteristics of the financial instrument changes.
Interest income and expense for all interest-bearing financial instruments are recognised within ‘interest income’ and ‘interest expense’
in profit or loss using the effective interest method.
The effective interest method is a method of calculating the amortised cost of a financial asset or liability (or group of assets and
liabilities) and of allocating the interest income or interest expense over the relevant period. The effective interest rate is the rate that
exactly discounts the expected future cash payments or receipts through the expected life of the financial instrument, or when
appropriate, a shorter period, to the net carrying amount of the instrument.
The application of the method has the effect of recognising income (and expense) receivable (or payable) on the instrument evenly in
proportion to the amount outstanding over the period to maturity or repayment. In calculating effective interest, the Group estimates
cash flows considering all contractual terms of the financial instrument but excluding future credit losses.
Fees, including those for early redemption, are included in the calculation to the extent that they can be measured and are considered
to be an integral part of the effective interest rate. Cash flows arising from the direct and incremental costs of issuing financial
instruments are also taken into account in the calculation. Where it is not possible to otherwise estimate reliably the cash flows or the
expected life of a financial instrument, effective interest is calculated by reference to the payments or receipts specified in the contract,
and the full contractual term.
Once a financial asset or a group of similar financial assets has been written down as a result of an impairment loss, interest income is
recognised using the rate of interest used to discount the future cash flows for the purpose of measuring the impairment loss.
39

FBN Holdings Plc.
NOTES TO THE CONSOLIDATED FINANCIAL STATEMENTS
At 31 December 2017
b. Fees and commission income
c. Dividend income
2.12 Impairment of financial assets
(a) Assets carried at amortised cost
(b) Assets classified as available for sale
2.13 Impairment of non-financial assets
Dividend income is recognised when the right to receive income is established.
The group assesses at the end of each reporting period whether there is objective evidence that a financial asset or a group of
financial assets is impaired. For debt securities, the group uses the criteria referred to (a) above. In the case of equity investments
classified as available for sale, a significant or prolonged decline in the fair value of the security below its cost is also evidence that the
assets are impaired. If any such evidence exists for available-for-sale financial assets, the cumulative loss measured as the difference
between the acquisition cost and the current fair value, less any impairment loss on that financial asset previously recognised in profit
or loss is removed from equity and recognised in profit or loss. Impairment losses recognised in the consolidated income statement on
equity instruments are not reversed through the consolidated income statement. If, in a subsequent period, the fair value of a debt
instrument classified as available for sale increases and increase can be objectively related to an event occurring after the impairment
loss was recognised in profit or loss,the impairment loss is reversed through the consolidated income statement.
Assets are reviewed for impairment whenever events or changes in circumstances indicate that the carrying amount may not be
recoverable. Additionally, assets that have an indefinite useful life are not subject to amortisation and are tested annually for
impairment.
An impairment loss is recognised for the amount by which the asset’s carrying amount exceeds its recoverable amount. The
recoverable amount is the higher of an asset’s fair value less costs to sell and value in use. For the purposes of assessing impairment,
assets are grouped at the lowest levels for which there are separately identifiable cash inflows (cash-generating units). The impairment
test also can be performed on a single asset when the fair value less cost to sell or the value in use can be determined reliably. Non-
financial assets other than goodwill that suffered impairment are reviewed for possible reversal of the impairment at each reporting
date.
Impairment losses recognised in prior periods are assessed at each reporting date for any indications that the loss has decreased or
no longer exists. An impairment loss is reversed if there has been a change in the estimates used to determine the recoverable
amount. An impairment loss is reversed only to the extent that the asset’s carrying amount does not exceed the carrying amount that
would have been determined, net of depreciation or amortisation, if no impairment loss had been recognised. An impairment loss in
respect of goodwill is not reversed.
The Group assesses at the end of each reporting period whether there is objective evidence that a financial asset or a group of
financial assets is impaired. A financial asset or group of financial assets is impaired and impairment losses are incurred only if there
is objective evidence of impairment as a result of one or more events that occurred after the initial recognition of the asset (a 'loss
event') and that loss event (or events) has an impact on the estimated future cash flows of the financial asset or group of financial
assets that can be reliably estimated.
Evidence of impairment may include indications that the debtors or a group of debtors is experiencing significant financial difficulty,
default or delinquency in interest or principal payments, the probability that they will enter bankruptcy or other financial reorganisation,
and where observable data indicate that there is a measurable decrease in the estimated future cash flows, such as changes in arrears
or economic conditions that correlate with defaults.
For loans and receivables category, the amount of the loss is measured as the difference between the asset's carrying amount and the
present value of estimated future cash flows (excluding future credit losses that have not been incurred) discounted at the financial
asset's original effective interest rate. The carrying amount of the asset is reduced and the amount of the loss is recognised in the
consolidated income statement. If a loan or held-to-maturity investment has a variable interest rate,the discount rate for measuring any
impairment loss is the current effective interest rate determined under the contract.
If, in a subsequent period, the amount of the impairment loss decreases and the decrease can be related objectively to an event
occurring after the impairment was recognised (such as an improvement in the debtor's credit rating), the reversal of the previously
recognised impairment loss is recognised in the consolidated income statement.
Unless included in the effective interest calculation, fees and commissions are recognised on an accruals basis as the service is
provided. Fees and commissions not integral to effective interest arising from negotiating, or participating in the negotiation of a
transaction from a third party, such as the acquisition of loans, shares or other securities or the purchase or sale of businesses, are
recognised on completion of the underlying transaction. Portfolio and other management advisory and service fees are recognised
based on the applicable service contracts.
The same principle is applied to the recognition of income from wealth management, financial planning and custody services that are
continuously provided over an extended period of time.
40
FBN Holdings Plc.
NOTES TO THE CONSOLIDATED FINANCIAL STATEMENTS
At 31 December 2017
2.14 Collateral
2.15 Discontinued operations
2.16 Leases
a. The group is the lessee
(i) Operating lease
(ii) Finance lease
(ii) Finance lease
b The group is the lessor
(i) Operating lease
(ii) Finance lease
The Group obtains collateral where appropriate, from customers to manage their credit risk exposure to the customer. The collateral
normally takes the form of a lien over the customer’s assets and gives the Group a claim on these assets for both existing and future
customer in the event that the customer defaults.
The Group may also use other credit instruments, such as stock borrowing contracts, and derivative contracts in order to reduce their
credit risk.
Collateral received in the form of securities is not recorded on the statement of financial position. Collateral received in the form of
cash is recorded on the statement of financial position with a corresponding liability. These items are assigned to deposits received
from bank or other counterparties. Any interest payable or receivable arising is recorded as interest expense or interest income
respectively.
The interest element of the finance cost is charged to the income statement over the lease period so as to produce a constant periodic
rate of interest on the remaining balance of the liability for each period.
Leases of assets where the Group has substantially all the risks and rewards of ownership are classified as finance leases. Finance
leases are capitalised at the lease’s commencement at the lower of the fair value of the leased property and the present value of the
minimum lease payments. Each lease payment is allocated between the liability and finance charges so as to achieve a constant rate
on the finance balance outstanding. The corresponding rental obligations, net of finance charges, are included in deposits from banks
or deposits from customers depending on the counter party.
The Group presents discontinued operations in a separate line in the income statement if an entity or a component of an entity has
been disposed or is classified as held for sale and:
i. represents a separate major line of business or geographical area of operations;
ii. is a part of a single co-ordinated plan to dispose of a separate major line of business or geographical area of operations; or
iii. is a subsidiary aquired exlusively with a view to resale.
Classification as a discontinued operation occurs on disposal or when the operation meets the criteria to be classified as held for sale.
When an operation is classified as a discontinued operation, the comparative income statement is re-presented as if the operation had
been discontinued from the start of the comparative year.
Non-current assets (or disposal groups) are classified as assets held for sale when their carrying amount is to be recovered principally
through a sale transaction and a sale is considered highly probable. They are stated at the lower of carrying amount and fair value less
cost to sell.
Leases are divided into finance leases and operating leases.
Leases in which a significant portion of the risks and rewards of ownership are retained by another party, the lessor, are classified as
operating leases.
Payments, including prepayments, made under operating leases (net of any incentives received from the lessor) are charged to the
income statement on a straight-line basis over the period of the lease. When an operating lease is terminated before the lease period
has expired, any payment required to be made to the lessor by way of penalty is recognised as an expense in the period in which
termination takes place.
When assets are subject to an operating lease, the assets continue to be recognised as property and equipment based on the nature
of the asset. Lease income is recognised on a straight line basis.
When assets are held subject to a finance lease, the related asset is derecognised and the present value of the lease payments
(discounted at the interest rate implicit in the lease) is recognised as a receivable. The difference between the gross receivable and
the present value of the receivable is recognised as unearned finance income. Lease income is recognised over the term of the lease
using the net investment method which allocates rentals between finance income and repayment of capital in each accounting period
in such a way that finance income will emerge as a constant rate of return on the lessor's net investment in the lease.
41

FBN Holdings Plc.
NOTES TO THE CONSOLIDATED FINANCIAL STATEMENTS
At 31 December 2017
2.17 Investment Properties
i. commencement of owner-occupation (transfer from
ii. commencement of development with the view to sale
iii. end of owner-occupation (transfer from owner-occupied
iv. commencement of an operating lease to another party
v. end of construction or development (transfer from property
2.18 Property, Plant and Equipment
An item of property, plant and equipment is derecognised on disposal or when no future economic benefits are expected from its use
or disposal. Any gain/ loss arising on de-recognition of the asset (calculated as the difference between the net disposal proceeds and
the carrying amount of the asset) is included in income statementin the year the asset is derecognised.
Depreciation rates, methods and the residual values underlying the calculation of depreciation of items of property, plant and
equipment are kept under review on an annual basis to take account of any change in circumstances.
When deciding on depreciation rates and methods, the principal factors the Group takes into account are the expected rate of
technological developments and expected market requirements for, and the expected pattern of usage of, the assets.
When reviewing residual values, the Group estimates the amount that it would currently obtain for the disposal of the asset after
deducting the estimated cost of disposal if the asset were already of the age and condition expected at the end of its useful economic
life.
No depreciation is provided on freehold land, although, in common with all long-lived assets, it is subject to impairment testing, if
deemed appropriate.
Construction cost and improvements in respect of offices is carried at cost as capital work in progress. On completion of construction
or improvements, the related amounts are transferred to the appropriate category of property and equipment.
All property, plant and equipment used by the parent or its subsidiaries is stated at historical cost less depreciation. Historical cost
includes expenditure that is directly attributable to the acquisition of the items.
Subsequent expenditures are included in the asset’s carrying amount or are recognised as a separate asset, as appropriate, only when
it is probable that future economic benefits associated with the item will flow to the Group and the cost of the item can be measured
reliably. The carrying amount of the replaced part is derecognised. All other repair and maintenance costs are charged to other
operating expenses during the financial period in which they are incurred.
Depreciation is calculated using the straight-line method to allocate their cost to their residual values over their estimated useful lives,
as follows:
Subsequent expenditure is included in the asset’s carrying amount only when it is probable that future economic benefits associated
with the item will flow to the Group and the cost of the item can be measured reliably. All other repairs and maintenance costs are
charged to the income statement during the financial period in which they are incurred.
Gains and losses on disposals are determined by comparing proceeds with carrying amount and are included in other operating
income in the income statement.
Transfer to, or from, investment property is recognized only when there is a change in use, evidenced by one or more of the following:
Investment properties are derecognized on disposal or when the investment properties are permanently withdrawn from use and no
future economic benefits are expected from its disposal.
Properties that are held for long-term rental yields or for capital appreciation or both, and that are not occupied by the entities in the
consolidated group, are classified as investment properties. Investment properties comprise residential buildings constructed with the
aim of leasing out to tenants or for selling. Recognition of investment properties takes place only when it is probable that the future
economic benefits that are associated with the investment property will flow to the entity and the cost can be measured reliably. This is
usually the day when all risks are transferred.
Investment properties are measured initially at cost, including transaction costs. The carrying amount includes the cost of replacing
parts of an existing investment property at the time the cost was incurred if the recognition criteria are met; and excludes the costs of
day-to-day servicing of an investment property. Subsequent to initial recognition, investment properties are stated at fair value.
The fair value reflects market conditions at the date of the statement of financial position and is obtained from professional third party
valuators contracted to perform valuations on behalf of the Group. The fair value does not reflect future capital expenditure that will
improve or enhance the property.
42
FBN Holdings Plc.
NOTES TO THE CONSOLIDATED FINANCIAL STATEMENTS
At 31 December 2017
2.19 Intangible assets
a. Goodwill
b. Computer software
c. Brand, customer deposits and customer relationships
2.20 Investment contracts
2.21 Cash and cash equivalents
Goodwill on acquisitions of associates is included in the amount of the investment.
Gains and losses on the disposal of an entity include the carrying amount of the goodwill relating to the entity sold.
Brand, customer deposits and customer relationships acquired in a business combination are recognised at fair value at the acquisition
date. They have finite useful lives and are subsequently carried at cost less accumulated amortisation and accumulated impairment
losses.These costs are amortised to profit or loss using straightline method over 3 years, 5 years and 2 years respectively.
Goodwill arises on the acquisition of subsidiary and associates, and represents the excess of the cost of acquisition, over the fair value
of the Group’s share of the assets acquired, and the liabilities and contingent liabilities assumed on the date of the acquisition. For the
purpose of calculating goodwill, fair values of acquired assets, liabilities and contingent liabilities are determined by reference to
market values or by discounting expected future cash flows to present value. This discounting is either performed using market rates or
by using risk-free rates and risk-adjusted expected future cash flows. Goodwill is initially recognised as an asset at cost and
subsequently measured at cost less accumulated impairment losses, if any. Goodwill which is recognised as an asset is reviewed at
least annually for impairment. Any impairment loss is immediately recognised in profit or loss.
For the purpose of impairment testing, goodwill is allocated to each cash-generating unit that is expected to derive benefit from the
synergies of the combination. Cash-generating units to which goodwill has been allocated are tested for impairment annually, or more
frequently when there is an indication that the unit may be impaired. If the recoverable amount of the cash generating unit is less than
the carrying amount of the unit, the impairment loss is allocated first to reduce the carrying amount of any goodwill allocated to the unit
and then to the other assets of the unit pro-rata on the basis of the carrying amount of each asset in the unit. Any impairment loss
recognised for goodwill is not reversed in a subsequent period.
The Group offers wealth management, term assurance, annuity, property and payment protection insurance products to customers that
take the form of long‐term insurance contracts. The Group classifies its wealth management and other products as insurance contracts
where these transfer significant insurance risk, generally where the benefits payable on the occurrence of an insured event are more
significant than the benefits that would be payable if the insured event does not occur. Contracts that do not contain significant
insurance risk or discretionary participation features are classified as investment contracts. Financial assets and liabilities relating to
investment contracts are measured at amortised cost.
Cash and cash equivalents comprise balances with less than three months’ maturity from the date of acquisition, including cash in
hand, deposits held at call with banks and other short-term highly liquid investments with original maturities of three months or less.
For the purposes of the statement of cash flows, cash and cash equivalents excludes restricted balances with central banks.
Costs associated with maintaining computer software programmes are recognised as an expense as incurred. Development costs that
are directly attributable to the design and testing of identifiable and unique software products controlled by the Group, are recognised
as intangible assets when the following criteria are met:
i. It is technically feasible to complete the software product so that it will be available for use;
ii. Management intends to complete the software product and use or sell it;
iii. There is an ability to use or sell the software product;
iv. It can be demonstrated how the software product will generate probable future economic benefits;
v. Adequate technical, financial and other resources to complete the development and to use or sell the software product are available;
and
vi. The expenditure attributable to the software product during its development can be reliably measured.
Subsequent expenditure on computer software is capitalised only when it increases the future economic benefits embodied in the
specific asset to which it relates.
Direct computer software development costs recognised as intangible assets are amortised on the straight-line basis over 3 years and
are carried at cost less any accumulated amortisation and any accumulated impairment losses. The carrying amount of capitalised
computer software is reviewed annually and is written down when the carrying amount exceeds its recoverable amount.
43
FBN Holdings Plc.
NOTES TO THE CONSOLIDATED FINANCIAL STATEMENTS
At 31 December 2017
2.22 Employee benefits
(i) Post-employment benefits
The Group has both defined benefit and defined contribution
a. Defined contribution plan
b. Defined benefit plan
(ii) Short-term benefits
2.23 Provisions
2.24 Insurance contracts
A defined benefit plan is a pension plan that defines an amount of pension benefit that an employee will receive on retirement, usually
dependent on one or more factors, such as age, years of service and compensation.
The liability recognised in the statement of financial position in respect of defined benefit pension plans is the present value of the
defined benefit obligation at the date of the statement of financial position less the fair value of plan assets.
The defined benefit obligation is calculated annually by independent actuaries using the projected unit credit method. The present
value of the defined benefit obligation is determined by discounting the Estimated future cash outflows using interest rates of Federal
government bonds that are denominated in the currency in which the benefits will be paid, and that have terms to maturity
approximating the terms of the related pension liability.
Remeasurement gains and losses are charged or credited to equity in other comprehensive income in the period in which they arise.
Past service costs are recognised immediately in income.
Provisions are recognised for present obligations arising as consequences of past events where it is probable that a transfer of
economic benefit will be necessary to settle the obligation, and it can be reliably estimated.
When a leasehold property ceases to be used in the business or a demonstrable commitment has been made to cease to use a
property where the costs exceed the benefits of the property, provision is made, where the unavoidable costs of the future obligations
relating to the lease are expected to exceed anticipated rental income and other benefits. The net costs are discounted using market
rates of interest to reflect the long-term nature of the cash flows.
Provision is made for the anticipated cost of restructuring, including redundancy costs when an obligation exists. An obligation exists
when the Group has a detailed formal plan for restructuring a business and has raised valid expectations in those affected by the
restructuring by starting to implement the plan or announcing its main features. The provision raised is normally utilised within nine
months.
Provision is made for undrawn loan commitments and similar facilities if it is probable that the facility will be drawn and result in the
recognition of an asset at an amount less than the amount advanced.
Contingent liabilities are possible obligations whose existence will be confirmed only by uncertain future events or present obligations
where the transfer of economic benefit is uncertain or cannot be reliably measured. Contingent liabilities are not recognised but are
disclosed unless they are remote.
The Group issues contracts that transfer insurance risk or financial risk or both. Insurance contracts are those contracts that transfer
significant insurance risk. Such contracts may also transfer financial risk.
Investment contracts are those contracts that transfer financial risk with no significant insurance risk. The reserve has been calculated
as the amount standing to the credit of the policyholders (account balance) at the valuation date. The life cover element (and
corresponding premiums) have been reported as part of the insurance contract liabilities and valued similar to other risk business as
described above.
A defined contribution plan is a pension plan under which the Group pays fixed contributions into a separate entity. The Group has no
legal or constructive obligations to pay further contributions if the fund does not hold sufficient assets to pay all employees the benefits
relating to employee service in the current and prior periods.
The Group pays contributions to publicly or privately administered pension insurance plans on a mandatory, contractual or voluntary
basis. The Group has no further payment obligations once the contributions have been paid. The contributions are recognised as
employee benefit expense when they are due. Prepaid contributions are recognised as an asset to the extent that a cash refund or a
reduction in the future payments is available.
The company and all entities within the Group make contributions in line with relevant pension laws in their jurisdiction. In Nigeria, the
company contributes 16.5% of each employee’s monthly emoluments (as defined by the Pension Act 2014) to the employee’s
Retirement Savings Account. The Act stipulates a minimum contribution of 10%.
Short-term benefits consists of salaries, accumulated leave allowances, bonuses and other non-monetary benefits. Short-term benefits
are measured on an undiscounted basis and are expensed as the related services provided.
A liability is recognised for the amount expected to be paid under short-term cash benefits such as accumulated leave and leave
allowances if the Group has a present legal or constructive obligation to pay this amount as a result of past services provided by the
employee and the obligation can be measured reliably.
44

FBN Holdings Plc.
NOTES TO THE CONSOLIDATED FINANCIAL STATEMENTS
At 31 December 2017
a. Classification of contracts
b. Recognition and measurement
(i) Short-term insurance contracts
(ii)
Long-term insurance contracts with fixed and guaranteed
terms
Individual insurance contracts
Individual savings contracts
The reserve has been calculated using the gross premium valuation approach. This reserving methodology adopts a cash flow
approach taking into account all expected future cash flows including premiums, expenses and benefit payments to satisfy the liability
adequacy test. The test also considers current estimates of all contractual cash flows, and of related cash flows such as claims
handling costs, as well as cash flows resulting from embedded options and guarantees (where applicable).
The reserve has been calculated as the amount standing to the credit of the policyholders (account balance) at the valuation date. The
life cover element (and corresponding premiums) have been reported as part of the insurance contract liabilities and valued similar to
other risk business as described above.
Short-duration life insurance contracts protect the Group’s customers from the consequences of events (such as death or disability)
that would affect the ability of the customer or his/her dependents to maintain their current level of income. They are usually short-
duration life insurance contracts ranging between 12 to 24 months period of coverage. Guaranteed benefits paid on occurrence of the
specified insurance event are either fixed or linked to the extent of the economic loss suffered by the policyholder. There are no
maturity or surrender benefits.
For all these contracts, premiums are recognised as revenue (earned premiums) proportionally over the period of coverage. The
portion of premium received on in-force contracts that relates to unexpired risks at the balance sheet date is reported as the unearned
premium liability. Premiums are shown before deduction of commission and are gross of any taxes or duties levied on premiums.
Claims and loss adjustment expenses are charged to income as incurred based on the estimated liability for compensation owed to
contract holders or third parties damaged by the contract holders. They include direct and indirect claims settlement costs and arise
from events that have occurred up to the end of the reporting period even if they have not yet been reported to the Group. The Group
does not discount its liabilities for unpaid claims. Liabilities for unpaid claims are estimated using the input of assessments for
individual cases reported to the Group and statistical analyses for the claims incurred but not reported (IBNR), and to estimate the
expected ultimate cost of more complex claims that may be affected by external factors.
A liability for contractual benefits that are expected to be incurred in the future is recorded when the premiums are recognised. The
liability is determined as the sum of the expected discounted value of the benefit payments and the future administration expenses that
are directly related to the contract, less the expected discounted value of the theoretical premiums that would be required to meet the
benefits and administration expenses based on the valuation assumptions used (the valuation premiums). The liability is based on
assumptions as to mortality, persistency, maintenance expenses and investment income that are established at the time the contract is
issued. A margin for adverse deviations is included in the assumptions.
Where insurance contracts have a single premium or a limited number of premium payments due over a significantly shorter period
than the period during which benefits are provided, the excess of the premiums payable over the valuation premiums is deferred and
recognised as income in line with the decrease of unexpired insurance risk of the contracts in force or, for annuities in force, in line with
the decrease of the amount of future benefits expected to be paid. The liabilities are recalculated at each end of the reporting period
using the assumptions established at inception of the contracts.
The Long term insurance contracts insure events associated with human life. They include the following:
These contracts insure events associated with human life (for example, death or survival) over a long duration. Premiums are
recognised as revenue when they become payable by the contract holder. Premiums are shown before deduction of commission.
Benefits are recorded as an expense when they are incurred.
The liability reserve on short term insurance contract is made up of an unexpired premium reserve (UPR) and reserve for ‘Incurred but
not reported’ claims (IBNR). The UPR represent premium received in advance on short term contracts and is released through the
income statement over the life of the insurance contract period after adjusting for acquisition expenses. IBNR reserves are required to
take account of the delay in reporting claims. These are determined by considering ultimate claims ratios for the life schemes on the
Group’s books. The ratios differ by industry and have been determined following a historical analysis of portfolio claims experience.
The IBNR reserves are calculated by adjusting the ultimate claims amounts to allow for claims already paid and those outstanding for
payment, and again adjusted to allow for the holding of a separate UPR reserve. As the short term insurance contract experience of
FBN builds up we will be able to adjust for company-specific claims settlement patterns.
A contract is classified as an insurance contract where the Group accepts significant insurance risk by agreeing with the policyholder to
pay benefits if a specified uncertain future event (the insured event) adversely affects the policyholder or other beneficiary. Significant
insurance risk exists where it is expected that for the duration of the policy or part thereof, policy benefits payable on the occurrence of
the insured event will exceed the amount payable on early termination, before allowance for expense deductions at early termination.
Once a contract has been classified as an insurance contract, the classification remains unchanged for the remainder of its lifetime,
even if the insurance risk reduces significantly during this period.
45

FBN Holdings Plc.
NOTES TO THE CONSOLIDATED FINANCIAL STATEMENTS
At 31 December 2017
c. Insurance contract liabilities
2.25 Fiduciary activities
2.26 Issued debt and equity securities
2.27 Share capital
a. Share issue costs
b. Dividends on ordinary shares
c. Earnings per share
c. Treasury shares
Incremental costs directly attributable to the issue of new shares or options or to the acquisition of a business are shown in equity as a
deduction, net of tax, from the proceeds.
Dividends on ordinary shares are recognised in equity in the period in which they are approved by the shareholders.
Dividends for the year that are declared after the reporting date are dealt with in the subsequent events note.
Dividends proposed by the Directors but not yet approved by members are disclosed in the financial statements in accordance with the
requirements of the Company and Allied Matters Act.
Where the Company or other members of the Group purchase the Company’s equity share capital, the consideration paid is deducted
from total shareholders’ equity as treasury shares until they are cancelled. Where such shares are subsequently sold or reissued, any
consideration received is included in shareholders’ equity.
The Group presents basic and diluted earnings per share (EPS) for its ordinary shares. Basic EPS is calculated by dividing the profit
and loss attributable to ordinary shareholders of the Group by the weighted average number of ordinary shares outstanding during the
period. Diluted EPS is determined by adjusting the profit or loss attributable to ordinary shareholders and the weighted average
number of ordinary shares outstanding for the effects of all dilutive potential ordinary shares.
Life insurance policy claims received up to the last day of each financial period and claims incurred but not reported (IBNR) are
provided for and included in the policy liabilities. Past claims experience is used as the basis for determining the extent of the IBNR
claims.
Income from reinsurance policies is recognised concurrently with the recognition of the related policy benefit. Insurance liabilities are
presented without offsetting them against related reinsurance assets.
Insurance liabilities are retained in the statement of financial position until they are discharged or cancelled and/or expire. The
company performs a liability adequacy test to determine the recognised insurance liabilities and an impairment test for reinsurance
assets held at each reporting date.
The Group acts as trustees and in other fiduciary capacities that result in the holding or placing of assets on behalf of individuals,
trusts, retirement benefit plans and other institutions. These assets and income arising thereon are excluded from these financial
statements, as they are not assets of the Group.
Issued financial instruments or their components are classified as liabilities where the contractual arrangement results in the Group
having a present obligation to either deliver cash or another financial asset to the holder, to exchange financial instruments on terms
that are potentially unfavourable or to satisfy the obligation otherwise than by the exchange of a fixed amount of cash or another
financial asset for a fixed number of equity shares. Issued financial instruments, or their components, are classified as equity where
they meet the definition of equity and confer on the holder a residual interest in the assets of the Group. The components of issued
financial instruments that contain both liability and equity elements are accounted for separately with the equity component being
assigned the residual amount after deducting from the instrument as a whole the amount separately determined as the fair value of the
liability component.
46

FBN Holdings Plc.
NOTES TO THE CONSOLIDATED FINANCIAL STATEMENTS
At 31 December 2017
d. Statutory credit reserve
2.28 Financial guarantees
Financial guarantees are contracts that require the Group to make specific payments to reimburse the holder of a loss it incurs
because a specific debtor fails to make payment when due in accordance with the terms of a debt instrument. Financial guarantee
liabilities are initially recognised at the fair value, and the initial fair value is amortised over the life of the financial guarantee. The
guaranteee liability is subsequently carried at the higher of this amortised amount and the present value of any expected payment
(when a payment under the guaranteee has become probable).
The results of the application of Prudential Guidelines and the impairment determined for these assets under IAS 39 are compared.
The IAS 39 determined impairment charge is always included in the income statement.
Where the Prudential Guidelines provision is greater, the difference is appropriated from Retained Earnings and included in a non-
distributable reserve "Statutory credit reserve". Where the IAS 39 impairment is greater, no appropriation is made and the amount of
the IAS 39 impairment is recognised in income statement.
Following an examination, the regulator may also require more amounts be set aside on risk and other assets. Such additional
amounts are recognised as an appropriation from retained earnings to statutory risk reserve.
In compliance with the Prudential Guidelines for licensed Banks, the Group assesses qualifying financial assets using the guidance
under the Prudential Guidelines. The guidelines apply objective and subjective criteria towards providing for losses in risk assets.
Assets are classed as performing or non-performing. Non-performing assets are further classed as Substandard, Doubtful or Lost with
attendants provision as per the table below based on objective criteria.
A more accelerated provision may be done using the subjective criteria. A 2% provision is taken on all risk assets that are not
specifically provisioned.
47

FBN Holdings Plc.
NOTES TO THE CONSOLIDATED FINANCIAL STATEMENTS
At 31 December 2017
3. Financial risk management
3.1 Introduction and overview
3.2 Credit risk
3.2.1 Credit risk measurement
The Group defines risk as the possibility of losses or profits foregone, which may be caused by internal or external factors.
The Group’s aim is to achieve an appropriate balance between risk and return and minimise potential adverse effects on the Group’s financial
performance.
Risk management is carried out by the Group's risk management directorate (the Directorate) under policies approved by the Board of Directors. The
Risk Management Directorate provides central oversight of risk management across the company and its subsidiaries to ensure that the full spectrum
of risks facing the company and the group are properly identified, measured, monitored and controlled to minimise adverse outcomes. The Board
provides written principles for overall risk management, as well as written policies covering specific areas, such as foreign exchange risk, interest rate
risk, credit risk, use of derivative financial instruments and non-derivative financial instruments. In addition, internal control is responsible for the
independent review of risk management and the control environment, while internal audit has the responsibility of auditing the risk management
function to ensure that all units charged with risk management perform their roles effectively on a continuous basis. Internal audit also tests the
adequacy of the internal controls and make appropriate recommendations where weaknesses are identified with the view of strengthening the Group's
risk management framework.
The risks arising from financial instruments to which the Group is exposed are financial risks, which includes credit risk, liquidity risk and market risk
(discussed in subsequent sections)
The key elements of the risk management philosophy are the following:
• The Group considers sound risk management to be the foundation of a long-lasting financial institution.
• The Group continues to adopt a holistic and integrated approach to risk management and, therefore, brings all risks together under one or a limited
number of oversight functions.
• Risk officers are empowered to perform their duties professionally and independently without undue interference.
• Risk management is governed by well-defined policies that are clearly communicated across the Group.
• Risk management is a shared responsibility. Therefore, the Group aims to build a shared perspective on risks that is grounded in consensus.
• The Group’s risk management governance structure is clearly defined.
• There is a clear segregation of duties between market-facing business units and risk management functions.
• Risk-related issues are taken into consideration in all business decisions. The Group shall continue to strive to maintain a conservative balance
between risk and revenue considerations.
*Risk officers work as allies and thought partners to other stakeholders within and outside the Group and are guided in the exercise of their powers by
a deep sense of responsibility, professionalism and respect for other parties; and
• Risks are reported openly and fully to the appropriate levels once they are identified.
• Risk officers work as allies and thought partners to other stakeholders within and outside the Group, and are guided in the exercise of their powers
by a deep sense of responsibility, professionalism and respect for other parties.
• All subsidiaries are guided by the principles enshrined in the risk management policies of the Group.
Credit risk is the risk of suffering financial loss, should any of the Group’s customers, clients or market counterparties fail to fulfil their contractual
obligations to the Group. Credit risk is the single largest risk for the Group arising mainly from the activities of the Commercial Banking segment and
to a much lesser extent in the other segments within the Group. These activities include the commercial and consumer loans and advances and loan
commitments arising from lending activities, and can also arise from credit enhancement provided, such as financial guarantees, letters of credit,
endorsements and acceptances.
The credit risk management and control are centralised in a credit risk management team, which reports to the Commercial Banking business's Chief
Risk Officer (CRO) regularly.
In measuring credit risk of loan and advances to customers and to banks at a counterparty level, the Group reflects the following components:
• the character and capacity to pay of the client or counterparty on its contractual obligations;
• current exposures to the counterparty and its likely future development;
• credit history of the counterparty; and
• the likely recovery ratio in case of default obligations – value of collateral and other ways out. The Group’s rating scale, which is shown below,
reflects the range of default probabilities defined for each rating class. This means that, in principle, exposures migrate between classes as the
assessment of their probability of default changes. The rating tools are reviewed and upgraded when necessary. The Group regularly validates the
performance of the rating and their predictive power with regard to default events.
48
FBN Holdings Plc.
NOTES TO THE CONSOLIDATED FINANCIAL STATEMENTS
At 31 December 2017
3.2.1 Credit risk measurement continued
(a)
Description Range of scores Grade
Large
Corporate
Mid Corporate SME
Extremely low risk AAA 1 100%-94.44% 0.01
Very low risk AA 2 100%-83.33% 0.01 0.01
Low risk A 3 100%-72.22% 0.02 0.02 0.02
Low risk BBB 4 72.21%-66.67% 0.02 0.02 0.02
Acceptable - moderately high risk BB 5 66.66%-55.56% 0.04 0.04 0.04
High risk B 6 55.55%-44.44% 0.06 0.06 0.06
Very high risk CCC 7 44.43%-33.33% 0.09 0.09 0.09
Extremely high risk CC 8 33.32%-16.67% 0.13 0.13 0.13
High likelihood of default C 9 16.65%-5.56% 0.15 0.15 0.15
Default risk D 10 5.55%-0.00% 1.00 1.00 1.00 Default
(b)
CRR (rating bucket)
1
2
3
4
4
4
4
5
5
6
6
6
7
8
3.2.2 Risk limit control and mitigation policies
(a) Portfolio limits
In line with the Group's credit policy, a detailed portfolio plan is prepared annually and provides a framework for creation of credits and risk appetite
development. In drawing up the plan, the Group reviews macro-economic, regulatory and political factors, identifies sectors/industries with
opportunity as well as the Group's business targets to determine appropriate portfolio and sub-portfolio limits.
The Group's Portfolio limit includes:
• Maintain aggregate large exposure of not more than 400% of Bank’s shareholders’ funds.
• Maintain minimum weighted average obligor risk rating (obligor-WARR) of ‘BB’
• Maintain minimum weighted average facility risk rating (facility-WARR) of ‘BB’
Domiciliation of receivables from acceptable Corporates
Enforceable lien on fast moving inventory in bonded warehouses
Obligor Risk Rating (ORR system)
The obligor risk rating grids have a minimum of ten (10) risk buckets to provide a pre-set, objective basis for making credit decisions, with one
additional bucket specifically included to categorise obligor in default. Accounts showing objective evidence of impairment are specifically noted in the
default rating bucket of the obligor risk rating grid with impairment allowance calculated for losses that has been incurred. Each risk bucket may be
denoted alphabetically and by range of scores as follows:
Rating bucket
The Group manages, limits and controls concentrations of credit risk wherever they are identified − in particular, to individual counterparties and
groups, and to industries and countries.
The Group structures the levels of credit risk it undertakes by placing limits on the amount of risk accepted in relation to one borrower, or groups of
borrowers, and to geographical and industry segments. Such risks are monitored on a revolving basis and subject to an annual or more frequent
review, when considered necessary. Limits on the level of credit risk by product, industry sector and counterparty are set by the Board of Directors on
the recommendation of the Chief Risk Officer.
Guarantee/receivables of investment grade banks
Equitable Mortgages on real estates in any location
Collateral Risk Rating (CRR)/Facility Risk Rating (FRR)
• The Commercial Banking subgroup does not lend to non investment grade obligors, on an unsecured basis, except as specified under a product
programme. The Facility Risk Rating (FRR) is different from the Obligor Risk Rating (ORR) to the extent of the perceived value of
collateral/enhancement provided.
The Facility Risk Rating approximates a ‘loss norm’ for each facility, and is the product of two components:
- The Default Probability of the Obligor, i.e. the ORR
- The Loss Given Default i.e. a measure of the expected economic loss if the obligor defaults, and includes write offs, recoveries, interest income, and
legal costs.
• The Collateral Risk Rating (CRR) grid indicates the acceptable collateral types rated 1–8 from best to worst in order of liquidity.
Collateral type
Cash
Investment
Non -
investment
Probability of Default
Letters Of Comfort Or Awareness, Guarantee Of Non - Investment Grade Banks And Corporates
Letter Of Hypothecation, Personal Guarantee
Treasury Bills/Govt Securities
Legal And Equitable Mortgage
Debenture Trust Deed/Fixed Debenture & Mortgage Debenture
Legal Mortgage on residential business real estate in prime locations A & B
Domiciliation of other receivables
Legal Mortgage or debenture on business premises, factory assets or commercial real estates in locations A &
B
Negative Pledge/Clean lending
49
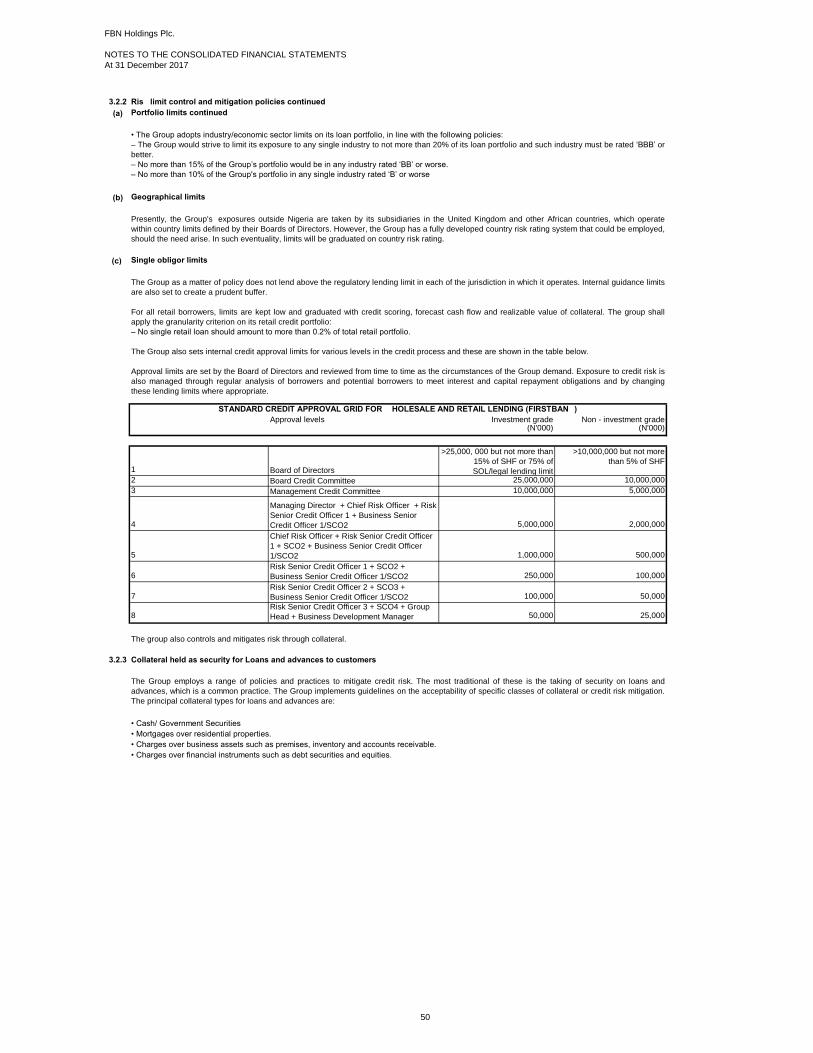
FBN Holdings Plc.
NOTES TO THE CONSOLIDATED FINANCIAL STATEMENTS
At 31 December 2017
3.2.2 Risk limit control and mitigation policies continued
(a) Portfolio limits continued
(b) Geographical limits
(c) Single obligor limits
(N'000) (N'000)
1
2 25,000,000 10,000,000
3 10,000,000 5,000,000
4 5,000,000 2,000,000
5 1,000,000 500,000
6 250,000 100,000
7 100,000 50,000
8 50,000 25,000
3.2.3 Collateral held as security for Loans and advances to customers
• The Group adopts industry/economic sector limits on its loan portfolio, in line with the following policies:
– The Group would strive to limit its exposure to any single industry to not more than 20% of its loan portfolio and such industry must be rated ‘BBB’ or
better.
– No more than 15% of the Group’s portfolio would be in any industry rated ‘BB’ or worse.
– No more than 10% of the Group's portfolio in any single industry rated ‘B’ or worse
The group also controls and mitigates risk through collateral.
Managing Director + Chief Risk Officer + Risk
Senior Credit Officer 1 + Business Senior
Credit Officer 1/SCO2
Chief Risk Officer + Risk Senior Credit Officer
1 + SCO2 + Business Senior Credit Officer
1/SCO2
Risk Senior Credit Officer 1 + SCO2 +
Business Senior Credit Officer 1/SCO2
Risk Senior Credit Officer 2 + SCO3 +
Business Senior Credit Officer 1/SCO2
STANDARD CREDIT APPROVAL GRID FOR WHOLESALE AND RETAIL LENDING (FIRSTBANK)
Approval levels Investment grade Non - investment grade
Board of Directors
Board Credit Committee
>25,000, 000 but not more than
15% of SHF or 75% of
SOL/legal lending limit
>10,000,000 but not more
than 5% of SHF
• Mortgages over residential properties.
• Charges over business assets such as premises, inventory and accounts receivable.
The Group as a matter of policy does not lend above the regulatory lending limit in each of the jurisdiction in which it operates. Internal guidance limits
are also set to create a prudent buffer.
For all retail borrowers, limits are kept low and graduated with credit scoring, forecast cash flow and realizable value of collateral. The group shall
apply the granularity criterion on its retail credit portfolio:
– No single retail loan should amount to more than 0.2% of total retail portfolio.
The Group also sets internal credit approval limits for various levels in the credit process and these are shown in the table below.
Approval limits are set by the Board of Directors and reviewed from time to time as the circumstances of the Group demand. Exposure to credit risk is
also managed through regular analysis of borrowers and potential borrowers to meet interest and capital repayment obligations and by changing
these lending limits where appropriate.
Management Credit Committee
The Group employs a range of policies and practices to mitigate credit risk. The most traditional of these is the taking of security on loans and
advances, which is a common practice. The Group implements guidelines on the acceptability of specific classes of collateral or credit risk mitigation.
The principal collateral types for loans and advances are:
Presently, the Group's exposures outside Nigeria are taken by its subsidiaries in the United Kingdom and other African countries, which operate
within country limits defined by their Boards of Directors. However, the Group has a fully developed country risk rating system that could be employed,
should the need arise. In such eventuality, limits will be graduated on country risk rating.
• Cash/ Government Securities
• Charges over financial instruments such as debt securities and equities.
Risk Senior Credit Officer 3 + SCO4 + Group
Head + Business Development Manager
50
FBN Holdings Plc.
NOTES TO THE CONSOLIDATED FINANCIAL STATEMENTS
At 31 December 2017
3.2.3 Collateral held as security for Loans and advances to customers continued
3.2.4 Exposure Management
3.2.5
3.2.6 Credit Recovery
3.2.7
3.2.8 Impairment and provisioning policies
The Group manages limits and controls concentrations of credit risk to individual counterparties, groups, industries and countries.
The Group defines levels of concentration risk it is wiling to take by placing limits on credit exposure to a single borrower, groups of borrowers and
geographic and industry segments. Such concentration risk limits approved by the Board of Directors on the recommendation of the Executive
Director/Chief Risk Officer and monitored on a regular basis. The concentration risk limits may be reviewed from time to time to reflect changing
macroeconomic and regulatory conditions as well as the Group's business thrust.
Impairment allowances are recognised for financial reporting purposes only for losses that have been incurred at the reporting date based on
objective evidence of impairment.
The Group takes physical possession of properties or other assets held as collateral and uses external agents to realise the value as soon as
practicable to settle indebtedness. Any surplus funds realised from such disposal are returned to the borrower or are otherwise dealt with in
accordance with appropriate regulations. The assets in such cases are not carried on the Group's balance sheet.
A record of all repossessed collateral is maintained centrally to ensure an orderly disposal and appropriate monitoring of the sales proceeds realized.
The repossessed assets are sold as soon as practicable, with proceeds realised from the sale used to reduce the outstanding indebtedness of the
customers.
Delinquency Management/Loan Workout
In the event of continued delinquency and failure of remediation, full credit recovery action is initiated to recover on such exposures and minimise the
overall credit loss to the Group. Recovery action may include appointment of a receiver manager, external recovery agent and/or sale of pledged
assets.
Management of concentration risk
To minimise the risk and occurrence of loss as a result of decline in quality and non-performance of risk assets, clear requirements and guidelines for
on-going management of the risk asset portfolio and individual risk exposures are defined. On-going exposure management entails collateral
management, facility performance monitoring, exposure quality reviews prompt and timely identification of decline in quality and risk portfolio
reporting.
Lending decisions are usually based on an obligor's ability to repay from normal business operations rather than on proceeds from the sale of any
security provided. Collateral values are assessed by a professional at the time of loan origination and are thereafter monitored in accordance with the
provisions of the credit policy. The types of collateral acceptable and the frequency with which they are required at origination is dependent on the
size and structure of the borrower. For exposures to corporate and large institutions, the Group will often require the collateral to include a first charge
over land and buildings owned and occupied by the business, a mortgage debenture over the company's undertaking on one or more of its assets and
keyman insurance. The decision as to whether or not collateral is required is based upon the nature of the transaction, the credit worthiness of the
customer and obligor risk rating. Other than for project finance, object finance and income producing real estate where charges over the subject
assets are a basic requirement, the provision of collateral will not determine the outcome of a credit application. The fundamental business
proposition must evidence the ability of the business to generate funds from normal business sources to repay the debt.
The extent to which collateral values are actively managed will depend on the credit quality and other circumstances of the obligor. Although lending
decisions are predominantly based on expected cashflows, any collateral provided may impact other terms of a loan or facility granted. This will have
a financial impact on the amount of net interest income recognised and on internal loss-given-default estimates that contribute to the determination of
asset quality. The Group credit risk disclosures for unimpaired lending report assets gross of collateral and therefore disclose the maximum loss
exposure. The Group believes this approach is appropriate as collateral values at origination and during a period of good performance may not be
representative of the value of collateral if the obligor enters a distressed state. For impaired lending, the value of collateral is re-evaluated and its
legal soundness re-assessed if there is observable evidence of distress of the borrower, this evaluation is used to determine potential loss allowances
and management's strategy to try to either repair the business or recover the debt. Unimpaired lending, including any associated collateral, is
managed on a customer-by-customer basis rather than a portfolio basis. No aggregated collateral information for the unimpaired secured lending
portfolio is provided to key management personnel.
The Group's delinquency management process involves effective and timely management of accounts showing signs of delinquency to reduce the
crystallisation of impairment loss. In line with the Group's delinquency management process, all activities are geared towards resuscitating delinquent
loans and includes restructuring and loan work-out arrangements.
Collateral held as security for financial assets other than loans and advances depends on the nature of the instrument. Debt securities, treasury and
other eligible bills are generally unsecured, with the exception of asset-backed securities and similar instruments, which are secured by portfolios of
financial instruments.
51
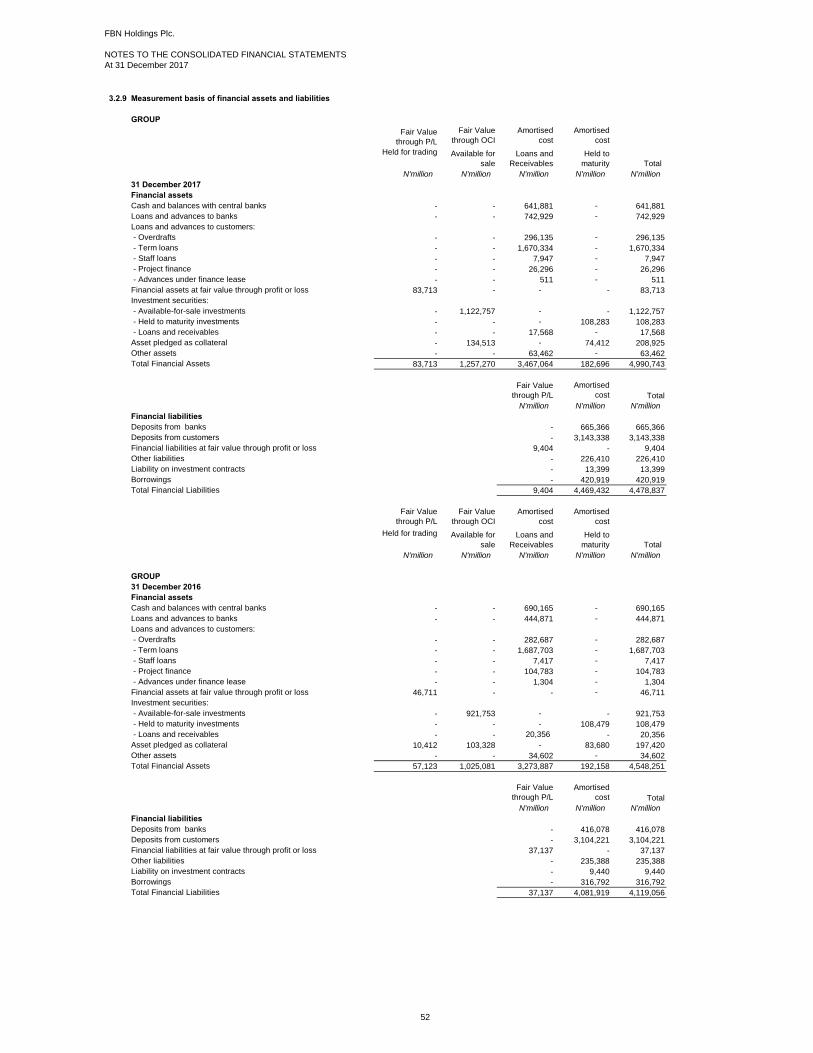
FBN Holdings Plc.
NOTES TO THE CONSOLIDATED FINANCIAL STATEMENTS
At 31 December 2017
3.2.9 Measurement basis of financial assets and liabilities
GROUP
Held for trading
N'million N'million N'million N'million N'million
31 December 2017
Financial assets
Cash and balances with central banks - - 641,881 - 641,881
Loans and advances to banks - - 742,929 - 742,929
Loans and advances to customers:
- Overdrafts - - 296,135 - 296,135
- Term loans - - 1,670,334 - 1,670,334
- Staff loans - - 7,947 - 7,947
- Project finance - - 26,296 - 26,296
- Advances under finance lease - - 511 - 511
Financial assets at fair value through profit or loss 83,713 - - - 83,713
Investment securities:
- Available-for-sale investments - 1,122,757 - - 1,122,757
- Held to maturity investments - - - 108,283 108,283
- Loans and receivables - - 17,568 - 17,568
Asset pledged as collateral - 134,513 - 74,412 208,925
Other assets - - 63,462 - 63,462
Total Financial Assets 83,713 1,257,270 3,467,064 182,696 4,990,743
Total
N'million N'million N'million
Financial liabilities
Deposits from banks - 665,366 665,366
Deposits from customers - 3,143,338 3,143,338
Financial liabilities at fair value through profit or loss 9,404 - 9,404
Other liabilities - 226,410 226,410
Liability on investment contracts - 13,399 13,399
Borrowings - 420,919 420,919
Total Financial Liabilities 9,404 4,469,432 4,478,837
Held for trading
N'million N'million N'million N'million N'million
GROUP
31 December 2016
Financial assets
Cash and balances with central banks - - 690,165 - 690,165
Loans and advances to banks - - 444,871 - 444,871
Loans and advances to customers:
- Overdrafts - - 282,687 - 282,687
- Term loans - - 1,687,703 - 1,687,703
- Staff loans - - 7,417 - 7,417
- Project finance - - 104,783 - 104,783
- Advances under finance lease - - 1,304 - 1,304
Financial assets at fair value through profit or loss 46,711 - - - 46,711
Investment securities:
- Available-for-sale investments - 921,753 - - 921,753
- Held to maturity investments - - - 108,479 108,479
- Loans and receivables - - 20,356 - 20,356
Asset pledged as collateral 10,412 103,328 - 83,680 197,420
Other assets - - 34,602 - 34,602
Total Financial Assets 57,123 1,025,081 3,273,887 192,158 4,548,251
Total
N'million N'million N'million
Financial liabilities
Deposits from banks - 416,078 416,078
Deposits from customers - 3,104,221 3,104,221
Financial liabilities at fair value through profit or loss 37,137 - 37,137
Other liabilities - 235,388 235,388
Liability on investment contracts - 9,440 9,440
Borrowings - 316,792 316,792
Total Financial Liabilities 37,137 4,081,919 4,119,056
Loans and
Receivables
Held to
maturity
Fair Value
through P/L
Amortised
cost
Total
Fair Value
through P/L
Fair Value
through P/L
Fair Value
through OCI
Available for
sale Total
Fair Value
through OCI
Amortised
cost
Loans and
Receivables
Amortised
cost
Held to
maturity
Amortised
cost
Fair Value
through P/L
Amortised
cost
Amortised
cost
Available for
sale
52
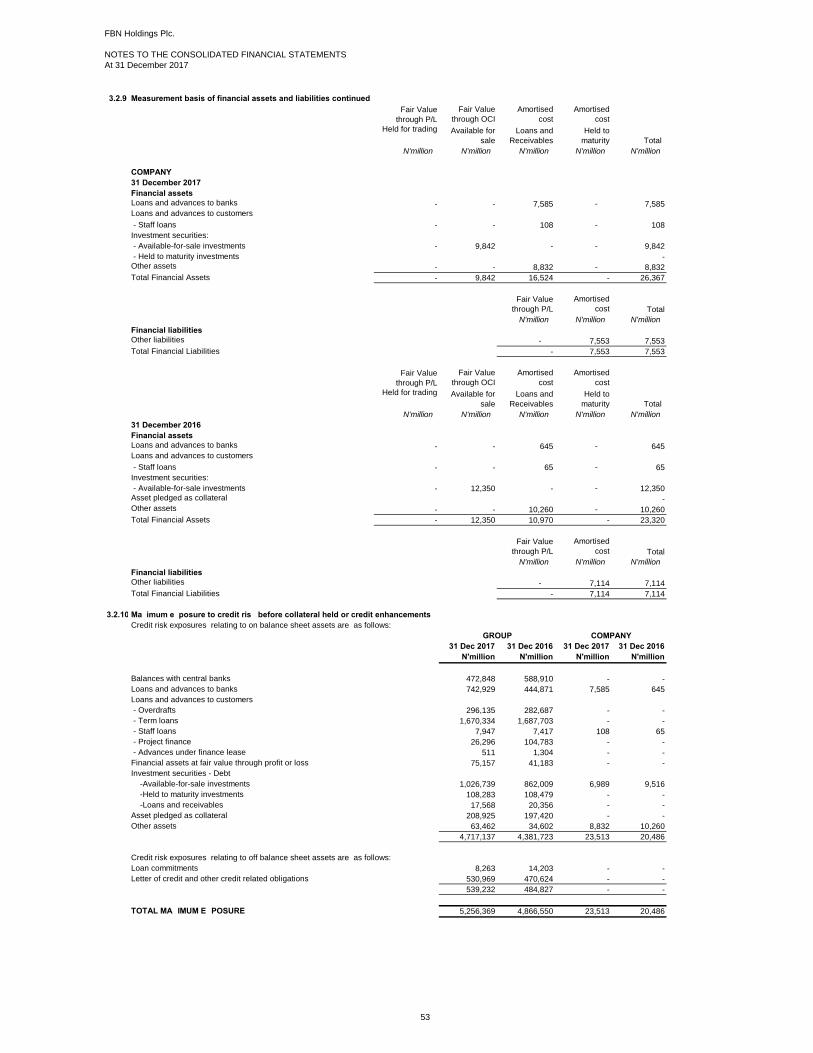
FBN Holdings Plc.
NOTES TO THE CONSOLIDATED FINANCIAL STATEMENTS
At 31 December 2017
3.2.9 Measurement basis of financial assets and liabilities continued
Held for trading
N'million N'million N'million N'million N'million
COMPANY
31 December 2017
Financial assets
Loans and advances to banks - - 7,585 - 7,585 Loans and advances to customers
- Staff loans - - 108 - 108
Investment securities:
- Available-for-sale investments - 9,842 - - 9,842
- Held to maturity investments - Other assets - - 8,832 - 8,832
Total Financial Assets - 9,842 16,524 - 26,367
Total
N'million N'million N'million
Financial liabilities
Other liabilities - 7,553 7,553
Total Financial Liabilities - 7,553 7,553
Held for trading
N'million N'million N'million N'million N'million
31 December 2016
Financial assets
Loans and advances to banks - - 645 - 645 Loans and advances to customers
- Staff loans - - 65 - 65
Investment securities:
- Available-for-sale investments - 12,350 - - 12,350 Asset pledged as collateral - Other assets - - 10,260 - 10,260
Total Financial Assets - 12,350 10,970 - 23,320
Total
N'million N'million N'million
Financial liabilities
Other liabilities - 7,114 7,114
Total Financial Liabilities - 7,114 7,114
3.2.10 Maximum exposure to credit risk before collateral held or credit enhancements
Credit risk exposures relating to on balance sheet assets are as follows:
31 Dec 2017 31 Dec 2016 31 Dec 2017 31 Dec 2016
N'million N'million N'million N'million
Balances with central banks 472,848 588,910 - -
Loans and advances to banks 742,929 444,871 7,585 645
Loans and advances to customers
- Overdrafts 296,135 282,687 - -
- Term loans 1,670,334 1,687,703 - -
- Staff loans 7,947 7,417 108 65
- Project finance 26,296 104,783 - -
- Advances under finance lease 511 1,304 - -
Financial assets at fair value through profit or loss 75,157 41,183 - -
Investment securities - Debt
-Available-for-sale investments 1,026,739 862,009 6,989 9,516
-Held to maturity investments 108,283 108,479 - -
-Loans and receivables 17,568 20,356 - -
Asset pledged as collateral 208,925 197,420 - -
Other assets 63,462 34,602 8,832 10,260
4,717,137 4,381,723 23,513 20,486
Credit risk exposures relating to off balance sheet assets are as follows:
Loan commitments 8,263 14,203 - -
Letter of credit and other credit related obligations 530,969 470,624 - -
539,232 484,827 - -
TOTAL MAXIMUM EXPOSURE 5,256,369 4,866,550 23,513 20,486
Total
Amortised
cost
Amortised
cost
Loans and
Receivables
Held to
maturity
Fair Value
through P/L
Amortised
cost
Fair Value
through P/L
Amortised
cost
Fair Value
through P/L
Fair Value
through P/L
Fair Value
through OCI
Amortised
cost
Amortised
cost
Available for
sale
Loans and
Receivables
Held to
maturity
Fair Value
through OCI
GROUP COMPANY
Available for
sale Total
53

FBN Holdings Plc.
NOTES TO THE CONSOLIDATED FINANCIAL STATEMENTS
At 31 December 2017
3.2.11 Concentration of risks of financial assets with credit risk exposure
GROUP
Lagos
Southern
Nigeria Northern Nigeria Africa Europe America Total
N 'million N 'million N 'million N 'million N 'million N 'million N 'million
Balances with central bank 458,273 - - 14,377 198 - 472,848
Loans and advances to banks 236,597 - - 48,582 308,276 149,474 742,929
Loans and advances to customers
- Overdrafts 159,842 44,437 12,936 43,495 28,154 7,271 296,135
- Term loans 1,220,248 201,162 54,942 83,451 47,813 62,718 1,670,334
- Staff loans 6,049 - 20 1,837 41 - 7,947
- Project finance 6,092 5,503 14,700 - - - 26,296
- Advances under finance lease 233 275 3 - - - 511
Financial assets at fair value through profit or loss68,753 - - 2,238 4,166 - 75,157
Investment securities
- Available-for-sale investments 593,590 3,233 1,933 17,131 56,263 354,589 1,026,739
- Held to maturity investments 65,661 2,016 - 40,606 - - 108,283
- Loans and receivables 17,568 - - - - - 17,568
Asset pledged as collateral 203,825 - - 5,100 - - 208,925
Other assets 49,757 6,693 318 5,961 732 - 63,462
31 December 2017 3,086,492 263,319 84,852 262,778 445,643 574,052 4,717,137
Loan commitments 4,962 1,073 - 2,228 - - 8,263
Letters of credit and other credit
related obligations
303,807 45,271 32,858 2,354 143,417 3,262 530,969
31 December 2017 308,769 46,344 32,858 4,582 143,417 3,262 539,232
Lagos
Southern
Nigeria Northern Nigeria Africa Europe America Total
N 'million N 'million N 'million N 'million N 'million N 'million N 'million
Balances with central bank 573,072 - - 15,526 312 - 588,910
Loans and advances to banks 178,607 0.08 0 40,494 168,388 57,382 444,871
Loans and advances to customers
- Overdrafts 153,687 67,650 19,408 40,457 620 865 282,687
- Term loans 1,212,318 190,685 57,318 102,969 13,180 111,233 1,687,703
- Staff loans 5,324 - 20 2,030 43 - 7,417
- Project finance 57,572 - 15,859 25,108 6,244 - 104,783
- Advances under finance lease 678 607 19 - - - 1,304
Financial assets at fair value through
profit or loss39,148 - - 449 1,586 - 41,183
Investment securities
- Available-for-sale investments 592,323 3,953 1,950 16,170 18,486 229,127 862,009
- Held to maturity investments 87,479 3,184 - 17,816 - - 108,479
- Loans and receivables 20,356 - - - - - 20,356
Asset pledged as collateral 187,377 - - 10,043 - - 197,420
Other assets 21,303 3,746 919 5,100 3,534 - 34,602
31 December 2016 3,129,242 269,825 95,493 276,162 212,393 398,607 4,381,722
Loan commitments 8,116 2,939 6 3,142 - - 14,203
Letters of credit and other credit
related obligations
300,439 122,341 15,410 6,931 11,736 13,767.00 470,624
31 December 2016 308,555 125,280 15,416 10,073 11,736 13,767 484,827
(a) Geographical sectors
The following table breaks down the Group’s credit exposure at their carrying amounts (without taking into account any collateral held or other credit
support), as categorised by geographical region as of 31 December 2017 and 31 December 2016. For this table, the Group has allocated exposures
to regions based on the country of domicile of its counterparties. Investment securities and financial assetsat fair value through profit or loss analysed
below excludes investments in equity instruments.
Credit risk exposure relating to off balance sheet items are as follows
Credit risk exposure relating to off balance sheet items are as follows
54

FBN Holdings Plc.
NOTES TO THE CONSOLIDATED FINANCIAL STATEMENTS
At 31 December 2017
3.2.11 Concentration of risks of financial assets with credit risk exposure continued
COMPANY
Lagos
Southern
Nigeria Northern Nigeria Africa Europe America Total
N 'million N 'million N 'million N 'million N 'million N 'million N 'million
Loans and advances to banks 7,585 - - - - - 7,585
Loans and advances to customers
- Staff loans 108 - - - - - 108
Investment securities
- Available-for-sale investments 6,989 - - - - - 6,989
Other assets 8,832 - - - - - 8,832
31 December 2017 23,513 - - - - - 23,513
Lagos
Southern
Nigeria Northern Nigeria Africa Europe America Total
N 'million N 'million N 'million N 'million N 'million N 'million N 'million
Loans and advances to banks 645 - - - - - 645
Loans and advances to customers
- Staff loans 65 - - - - - 65
Investment securities
- Available-for-sale investments 9,516 - - - - - 9,516
Other assets 10,260 - - - - - 10,260
31 December 2016 20,486 - - - - - 20,486
b) Industry sectors
GROUP
N 'million N 'million N 'million N 'million N 'million N 'million N 'million
Agriculture - - - - - - -
Oil and gas - - 10,266 - - - -
Consumer credit - - - - - - -
Manufacturing - - 981 4,859 3,903 - -
Real estate - - - - - - -
Construction - - - - - - -
Finance and insurance 472,850 742,903 11,772 435,659 16,718 - 12,250
Transportation - - - - - - -
Communication - - - - - - -
General commerce - - - - - - -
Utilities - - - - - - -
Retail services - - - - - - -
Public sector (2) 26 52,137 586,221 87,662 17,568 196,675
Total at 31 December 2017 472,848 742,929 75,157 1,026,739 108,283 17,568 208,925
The following table breaks down the Group’s credit exposure at carrying amounts (without taking into account any collateral held or other credit
support), as categorised by the industry sectors of the Group’s counterparties. Investment securities and financial assets at fair value through profit or
loss analysed below excludes investments in equity instruments.
Balances
with central
bank
Loans and
advances to
banks
Financial assets
at fair value
through profit or
loss
Investment
Securities
(Debt) -
Available for
sale
Investment
Securities -
Held to
maturity
Asset pledged
as collateral
Investment
Securities -
Loans and
receivables
55
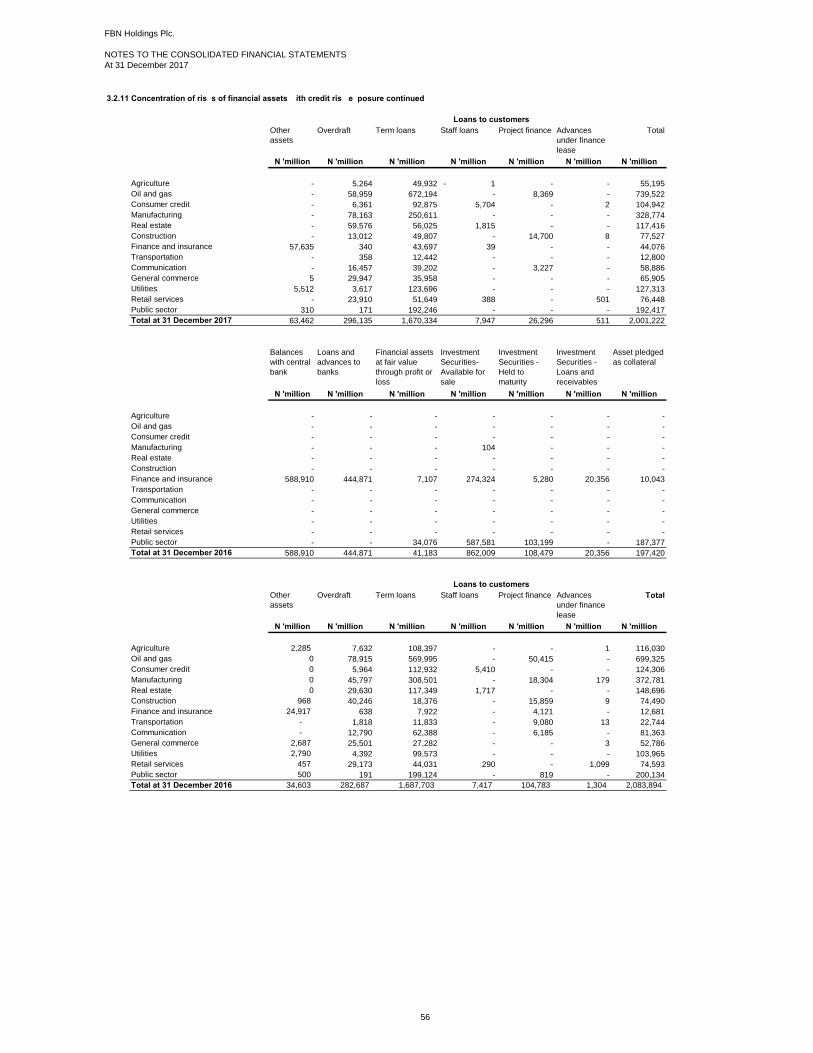
FBN Holdings Plc.
NOTES TO THE CONSOLIDATED FINANCIAL STATEMENTS
At 31 December 2017
3.2.11 Concentration of risks of financial assets with credit risk exposure continued
N 'million N 'million N 'million N 'million N 'million N 'million N 'million
Agriculture - 5,264 49,932 - 1 - - 55,195
Oil and gas - 58,959 672,194 - 8,369 - 739,522
Consumer credit - 6,361 92,875 5,704 - 2 104,942
Manufacturing - 78,163 250,611 - - - 328,774
Real estate - 59,576 56,025 1,815 - - 117,416
Construction - 13,012 49,807 - 14,700 8 77,527
Finance and insurance 57,635 340 43,697 39 - - 44,076
Transportation - 358 12,442 - - - 12,800
Communication - 16,457 39,202 - 3,227 - 58,886
General commerce 5 29,947 35,958 - - - 65,905
Utilities 5,512 3,617 123,696 - - - 127,313
Retail services - 23,910 51,649 388 - 501 76,448
Public sector 310 171 192,246 - - - 192,417
Total at 31 December 2017 63,462 296,135 1,670,334 7,947 26,296 511 2,001,222
N 'million N 'million N 'million N 'million N 'million N 'million N 'million
Agriculture - - - - - - -
Oil and gas - - - - - - -
Consumer credit - - - - - - -
Manufacturing - - - 104 - - -
Real estate - - - - - - -
Construction - - - - - - -
Finance and insurance 588,910 444,871 7,107 274,324 5,280 20,356 10,043
Transportation - - - - - - -
Communication - - - - - - -
General commerce - - - - - - -
Utilities - - - - - - -
Retail services - - - - - - -
Public sector - - 34,076 587,581 103,199 - 187,377
Total at 31 December 2016 588,910 444,871 41,183 862,009 108,479 20,356 197,420
N 'million N 'million N 'million N 'million N 'million N 'million N 'million
Agriculture 2,285 7,632 108,397 - - 1 116,030
Oil and gas 0 78,915 569,995 - 50,415 - 699,325
Consumer credit 0 5,964 112,932 5,410 - - 124,306
Manufacturing 0 45,797 308,501 - 18,304 179 372,781
Real estate 0 29,630 117,349 1,717 - - 148,696
Construction 968 40,246 18,376 - 15,859 9 74,490
Finance and insurance 24,917 638 7,922 - 4,121 - 12,681
Transportation - 1,818 11,833 - 9,080 13 22,744
Communication - 12,790 62,388 - 6,185 - 81,363
General commerce 2,687 25,501 27,282 - - 3 52,786
Utilities 2,790 4,392 99,573 - - - 103,965
Retail services 457 29,173 44,031 290 - 1,099 74,593
Public sector 500 191 199,124 - 819 - 200,134
Total at 31 December 2016 34,603 282,687 1,687,703 7,417 104,783 1,304 2,083,894
Balances
with central
bank
Loans and
advances to
banks
Financial assets
at fair value
through profit or
loss
Investment
Securities-
Available for
sale
Investment
Securities -
Held to
maturity
Investment
Securities -
Loans and
receivables
Other
assets
Loans to customers
Overdraft Term loans Staff loans Project finance Advances
under finance
lease
Total
Asset pledged
as collateral
Loans to customers
Overdraft Term loans Staff loans Project finance Advances
under finance
lease
TotalOther
assets
56
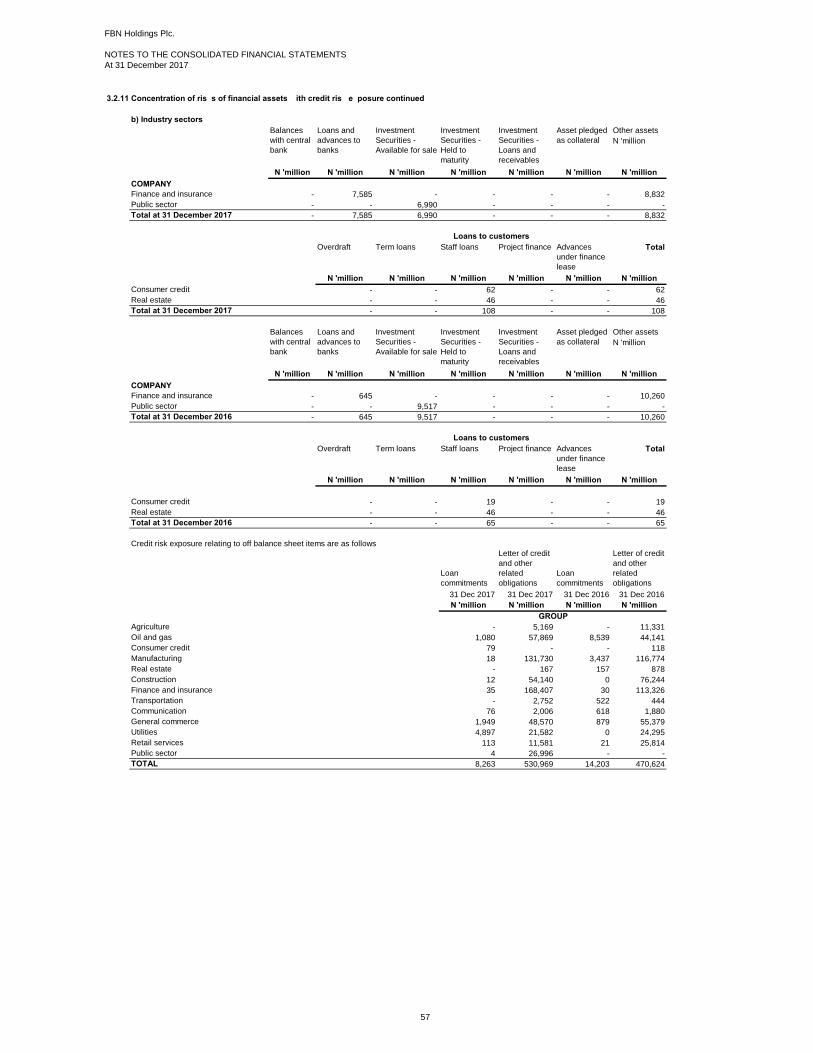
FBN Holdings Plc.
NOTES TO THE CONSOLIDATED FINANCIAL STATEMENTS
At 31 December 2017
3.2.11 Concentration of risks of financial assets with credit risk exposure continued
b) Industry sectors
Other assets
N 'million
N 'million N 'million N 'million N 'million N 'million N 'million N 'million
COMPANY
Finance and insurance - 7,585 - - - - 8,832
Public sector - - 6,990 - - - -
Total at 31 December 2017 - 7,585 6,990 - - - 8,832
N 'million N 'million N 'million N 'million N 'million N 'million
Consumer credit - - 62 - - 62
Real estate - - 46 - - 46
Total at 31 December 2017 - - 108 - - 108
Other assets
N 'million
N 'million N 'million N 'million N 'million N 'million N 'million N 'million
COMPANY
Finance and insurance - 645 - - - - 10,260
Public sector - - 9,517 - - - -
Total at 31 December 2016 - 645 9,517 - - - 10,260
N 'million N 'million N 'million N 'million N 'million N 'million
Consumer credit - - 19 - - 19
Real estate - - 46 - - 46
Total at 31 December 2016 - - 65 - - 65
Loan
commitments
Letter of credit
and other
related
obligations
Loan
commitments
Letter of credit
and other
related
obligations
31 Dec 2017 31 Dec 2017 31 Dec 2016 31 Dec 2016
N 'million N 'million N 'million N 'million
Agriculture - 5,169 - 11,331
Oil and gas 1,080 57,869 8,539 44,141
Consumer credit 79 - - 118
Manufacturing 18 131,730 3,437 116,774
Real estate - 167 157 878
Construction 12 54,140 0 76,244
Finance and insurance 35 168,407 30 113,326
Transportation - 2,752 522 444
Communication 76 2,006 618 1,880
General commerce 1,949 48,570 879 55,379
Utilities 4,897 21,582 0 24,295
Retail services 113 11,581 21 25,814
Public sector 4 26,996 - -
TOTAL 8,263 530,969 14,203 470,624
Credit risk exposure relating to off balance sheet items are as follows
GROUP
Overdraft Term loans Staff loans Project finance Advances
under finance
lease
Investment
Securities -
Held to
maturity
Investment
Securities -
Loans and
receivables
Asset pledged
as collateral
Balances
with central
bank
Loans and
advances to
banks
Investment
Securities -
Available for sale
Investment
Securities -
Held to
maturity
Investment
Securities -
Loans and
receivables
Asset pledged
as collateral
Loans to customers
Overdraft Term loans Staff loans Project finance Advances
under finance
lease
Total
Balances
with central
bank
Loans and
advances to
banks
Investment
Securities -
Available for sale
Loans to customers
Total
57

FBN Holdings Plc.
NOTES TO THE CONSOLIDATED FINANCIAL STATEMENTS
At 31 December 2017
3.2.12 Loans and advances to customers
Credit quality of Loans and advances to customers is summarised as follows:
N 'million N 'million N 'million N 'million N 'million N 'million
GROUP
December 2017
Neither past due nor impaired 241,404 1,340,167 8,223 26,775 375 1,616,946
Past due but not impaired 34,281 109,016 14 - 110 143,421
Individually impaired 67,565 422,698 6 - 533 490,802
Collectively impaired 2,378 26,794 - - 54 29,226
Gross 345,628 1,898,675 8,243 26,775 1,072 2,280,395
Less: allowance for impairment (note 23) (49,493) (228,341) (296) (479) (561) (279,170)
Net 296,135 1,670,334 7,947 26,296 511 2,001,225
Individually impaired 44,205 185,326 4 - 533 230,068
Portfolio allowance 5,288 43,015 292 479 28 49,102
Total 49,493 228,341 296 479 561 279,170
N 'million N 'million N 'million N 'million N 'million N 'million
December 2016
Neither past due nor impaired 201,193 1,278,563 7,436 83,040 1,059 1,571,291
Past due but not impaired 38,489 191,541 6 8,998 256 239,290
Individually impaired 152,773 393,568 15 23,885 497 570,738
Collectively impaired 1,415 11,972 45 - 27 13,459
Gross 393,870 1,875,644 7,502 115,923 1,839 2,394,778
Less: allowance for impairment (note 23) (111,183) (187,941) (85) (11,140) (535) (310,884)
Net 282,687 1,687,703 7,417 104,783 1,304 2,083,894
Individually impaired 106,323 156,756 3 10,837 497 274,416
Portfolio allowance 4,860 31,185 82 303 38 36,468
Total 111,183 187,941 85 11,140 535 310,884
COMPANY
December 2017
Neither past due nor impaired - - 108 - - 108
Net - - 108 - - 108
December 2016
Neither past due nor impaired - - 65 - - 65
Net - - 65 - - 65
GROUP
December 2017(a) Loans and advances to customers - neither past due nor impaired
N 'million N 'million N 'million N 'million N 'million N 'million
Grades:
AAA 257 10,888 482 1 1 11,629
AA 994 51,303 - - - 52,297
A 16,174 57,603 3 - - 73,780
BBB 39,264 249,526 1,615 - - 290,405
BB 68,379 329,896 1,865 18,109 203 418,452
B 55,972 426,890 4,060 8,665 171 495,757
CCC 29 387 - - - 416
CC 56 1,424 138 - - 1,618
C 60,279 212,249 59 - - 272,587
241,404 1,340,167 8,223 26,775 375 1,616,946
Loans to customers
Overdraft Term loans Staff loans Project finance Advances
under finance
lease
Total
Loans to customers
Overdraft Term loans Staff loans Project finance Advances
under finance
lease
Total
Overdraft Term loans Staff loans Project finance Advances
under finance
lease
Total
The credit quality of the portfolio of loans and advances to customers that were neither past due nor impaired can be assessed by reference to the
internal rating system adopted by the Group (See section 3.2.1 for an explanation of the internal rating system).
58

FBN Holdings Plc.
NOTES TO THE CONSOLIDATED FINANCIAL STATEMENTS
At 31 December 2017
3.2.12 Loans and advances to customers continued
N 'million N 'million N 'million N 'million N 'million N 'million
(b) Loans and advances past due but not impaired
Past due up to 30 days 21,881 61,599 9 - 110 83,599
Past due by 30 - 60 days 11,313 20,852 5 - - 32,170
Past due 60-90 days 1,087 26,565 - - - 27,652
Gross amount 34,281 109,016 14 0 110 143,421
(c) Collectively impaired loans
2,378 26,794 - - 54 29,226
(d) Loans and advances individually impaired
Gross amount 67,565 422,698 6 - 533 490,802
Specific impairment (44,205) (185,326) (4) - (533) (230,068)
Net amount 23,360 237,372 2 - - 260,734
December 2016(a) Loans and advances to customers - neither past due nor impaired
a) Grades:
AAA 860 5,241 587 - - 6,688
AA 2,227 59,787 80 - - 62,094
A 3 59,359 41 - - 59,403
BBB 8,919 102,409 131 - - 111,459
BB 71,884 501,917 2,145 16,840 679 593,465
B 83,832 259,627 2,855 4,429 380 351,123
CCC 11,982 25,902 1,554 - - 39,438
CC - 1,700 - - - 1,700
C 21,486 262,621 43 61,771 - 345,921
201,193 1,278,563 7,436 83,040 1,059 1,571,291
(b) Loans and advances past due but not impaired
Past due up to 30 days 16,112 143,171 4 8,581 186 168,054
Past due by 30 - 60 days 18,175 25,850 2 - 70 44,097
Past due 60-90 days 4,202 22,520 - 417 - 27,139
Gross amount 38,489 191,541 6 8,998 256 239,290
(c) Collectively impaired loans
These represent insignificant impaired loans which are assessed on a collective basis.
1,415 11,972 45 - 27 13,459
(d) Loans and advances individually impaired
Gross amount 152,773 393,568 15 23,885 497 570,738
Specific impairment (106,323) (156,756) (3) (10,837) (497) (274,416)
Net amount 46,450 236,812 12 13,048 0 296,322
Term loans Staff loans Project finance Advances
under finance
lease
TotalOverdraft
59

FBN Holdings Plc.
NOTES TO THE CONSOLIDATED FINANCIAL STATEMENTS
At 31 December 2017
3.2.12 Loans and advances to customers continued
(e) Sensitivity analysis on impairment
Approach to sensitivity analysis
Scenario 1
Scenario 2
Current year Scenario 1 Scenario 2
N'million N'million N'million
31 December 2017
- Overdrafts 10,259 11,033 11,105
- Term loans 121,411 128,290 129,658
- Staff loans 11 11 11
- Project finance (1,189) (1,078) (1,078)
- Advances under finance lease 26 28 31
Total 130,518 138,284 139,727
31 December 2016
- Overdrafts 80,694 81,375 81,424
- Term loans 76,945 82,956 83,502
- Staff loans 0 12 12
- Project finance 1,531 1,591 1,591
- Advances under finance lease 181 188 189
Total 159,351 166,122 166,718
3.2.13 Loans and advances to banks
Credit quality of loans to banks is summarised as follows:
Group
31 December 2017
Loans to
banks
N'million
A+ to A- 158,919
B+ to B- 238,042
Unrated 345,968
742,929
31 December 2016
A+ to A- 112,514
B+ to B- 69,709
Unrated 262,646
444,871
The loan portfolio of First Bank Nigeria ('the Bank') the most significant entity of the commercial banking group has been adopted for this sensitivity
test; this is based on the premise that the outcome of this stress test on the Bank is reflective of the entire portfolio of the group. The credit factors
considered for this sensitivity are highlighted below:
Probability of Default (PD): This represents the probability that a currently performing account will decline in credit quality. The probability of default
model is designed to provide a measurement of obligor quality by estimating the likelihood default over a short term horizon (usually 12 months). A
low probability of default indicates a borrower with good credit quality while a high probability of default indicates a borrower with low credit quality
and a high likelihood of default.
Loss Given Default (LGD): The Loss Given Default estimates the expected loss on a default account after all recoveries have being exhausted. In
estimating the LGD for the credit portfolio, recoveries made on historic loan loss data by way of loan repayment, recovery efforts and/or sale of
collateral was applied.
In performing the sensitivity analysis, two scenarios were considered as detailed below.
All loans to banks are neither past due nor impaired.
The PD of the performing book was flexed by 20% while LGD was held constant. This is based on the assumption that obligor quality will deteriorate
and this will lead to an increase in default.
The LGD of the performing book and insignificant non-performing loans were flexed by 20% respectively while the PD was held constant. This is
premised on deterioration in obligor quality, increase in rate of default as well as difficulty in realizing collaterals pledged.
Outcome of the sensitivity analysis is shown below as well as the impact on profit or loss
Impairment charge in profit or loss
The credit quality has been assessed by reference to Moody's rating, Agusto & Agusto's rating (credit rating agency) and the internal rating system
at 31 December 2017 and 31 December 2016.
60

FBN Holdings Plc.
NOTES TO THE CONSOLIDATED FINANCIAL STATEMENTS
At 31 December 2017
3.2.14 Credit quality of investment in debt securities and other assets is summarised as follows:
Group
31 December 2017
Treasury bills
as reported in
the AFS
portfolio
Bonds as
reported in the
AFS portfolio
Treasury bills
as reported in
the HTM
portfolio
Bonds as
reported in
the HTM
portfolio
Loans and
receivables Other assets
N'million N'million N'million N'million N'million N'million
A+ to A- 275,050 203,397 1,302 3,390 - 34,675
B+ to B- 504,203 164,630 11,240 123,955 - 4,792
Unrated 8,125 5,848 40,847 1,961 17,568 23,995
787,378 373,875 53,389 129,305 17,568 63,462
31 December 2016
A+ to A- 257,808 69,976 - 16,994 - 10,952
B+ to B- 513,163 122,326 - 138,545 - 715
Unrated 2,064 - 31,387 5,233 20,356 22,936
773,035 192,302 31,387 160,772 20,356 34,602
Company
Treasury bills
as reported in
the AFS
portfolio
Bonds as
reported in the
AFS portfolio
Treasury bills
as reported in
the HTM
portfolio
Bonds as
reported in
the HTM
portfolio
Loans and
receivables Other assets
31 December 2017 N'million N'million N'million N'million N'million N'million
A+ to A- 6,297 693 - - - -
Unrated - - - - - 8,832
6,297 693 - - - 8,832
31 December 2016
A+ to A- 8,862 654 - - - -
Unrated - - - - - 10,260
8,862 654 - - - 10,260
3.2.15 Collaterized Assets
GROUP Over-collaterised assets Under-collaterised assets
31 December 2017
Carrying value
of the assets
Fair value of
collateral held
Carrying value
of the assets
Fair value of
collateral held
Financial assets
Loans and advances to banks - - 742,929 5,426
Financial assets at fair value through profit or loss - - 83,713 2,452
Total Financial Assets - - 826,642 7,878
GROUP Over-collaterised assets Under-collaterised assets
31 December 2016
Carrying value
of the assets
Fair value of
collateral held
Carrying value
of the assets
Fair value of
collateral held
Financial assets
Loans and advances to banks - - 444,871 24,552
Financial assets at fair value through profit or loss - - 46,711 1,596
Total Financial Assets - - 491,582 26,148
The underlisted financial assets are not collaterised:
Cash and balances with Central Banks
Investment securities:
- Available-for-sale investments
- Held to maturity investments
Asset pledged as collateral
Other assets
The financial effect of collateral is presented by disclosing collateral values separately for (i) those assets where collateral and other credit
enhancements are equal to or exceed carrying value of the asset ("over-collateralised assets") and (ii) those assets where collateral and other credit
enhancements are less than the carrying value of the asset. The effect of collateral at 31 December 2017 and 31 December 2016 are as shown below
All investments in debt instruments are neither past due nor impaired.
The credit quality of investments in debt securities (including assets pledged for collateral) that were neither past due nor impaired can be assessed
by reference to Agusto & Agusto's rating (credit rating agency) at 31 December 2017 and 31 December 2016.
Loans and advances to customers have been excluded from the tables above, as no aggregated collateral information for the unimpaired secured
lending portfolio is provided to key management personnel. See further details on collateral management for the loan book in note 3.2.3
The Group's investment in risk-free government securities and its Cash and balances with Central Banks are not considered to require collaterals
given their sovereign nature.
61

FBN Holdings Plc.
NOTES TO THE CONSOLIDATED FINANCIAL STATEMENTS
At 31 December 2017
3.3 Liquidity risk
3.3.1 Management of liquidity risk
3.3.2 Funding approach
3.3.3 Non-derivative financial liabilities and assets held for managing liquidity risk
The table below presents the cash flows payable by the Group under non-derivative financial liabilities and assets held for managing liquidity risk by
remaining contractual maturities at the date of the consolidated statement of financial position. The amounts disclosed in table A below are the
contractual undiscounted cash flow, whereas the Group manages the liquidity risk on a behavioural basis which is shown in table B below.
Liquidity risk is the risk that the Group does not have sufficient financial resources to meet its obligation as they fall due or will have to meet the
obligations at excessive costs. This risk could arise from mismatches in the timing of cash flows.
Funding risk is a form of liquidity risk that arises when the liquidity needed to fund illiquid asset positions cannot be obtained at the expected terms
and when required.
The objective of the Group’s liquidity risk management is to ensure that all anticipated funding commitments can be met when due and that access to
funding sources is coordinated and cost effective.
The Group is funded primarily by a well diversified mix of retail, corporate and public sector deposits. This funding base ensures stability and low
funding cost with minimal reliance on more expensive tenured deposit and interbank takings as significant sources of funding.
The Group’s liquidity management process includes:
• Maintaining a portfolio of highly marketable assets that can easily be liquidated as protection against any unforeseen interruption to cash flow;
• Day-to-day funding, managed by monitoring future cash flows to ensure that requirements can be met. This includes replenishment of funds as they
mature or are borrowed by customers.
• Active monitoring of the timing of cashflows and maturity profiles of assets and liabilities to ensure mismatches are within stipulated limits;
• Monitoring the liquidity ratios against internal and regulatory requirements; and
• Managing the concentration and profile of debt maturities.
Monitoring and reporting take the form of cash flow measurement and projections for the next day, week and month respectively, as these are key
periods for liquidity management. The starting point for those projections is an analysis of the contractual maturity of the financial liabilities and the
expected collection date of the financial assets
Particular attention is also paid to the level and type of undrawn lending commitments, the usage of overdraft facilities and the impact of contingent
liabilities such as standby letters of credit and guarantees.
Liquidity risk on derivatives is managed using the same source of funding as for the non derivative liabilities.
62
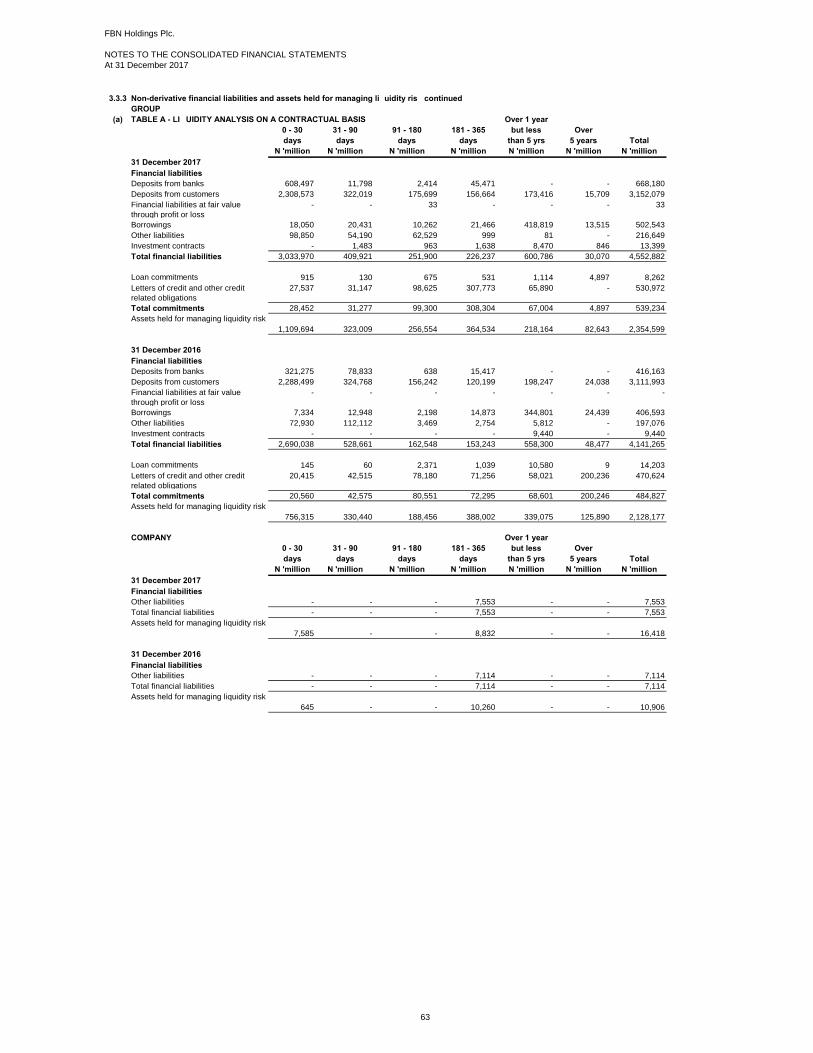
FBN Holdings Plc.
NOTES TO THE CONSOLIDATED FINANCIAL STATEMENTS
At 31 December 2017
3.3.3 Non-derivative financial liabilities and assets held for managing liquidity risk continued
GROUP
(a) TABLE A - LIQUIDITY ANALYSIS ON A CONTRACTUAL BASIS Over 1 year
0 - 30 31 - 90 91 - 180 181 - 365 but less Over
days days days days than 5 yrs 5 years Total
N 'million N 'million N 'million N 'million N 'million N 'million N 'million
31 December 2017
Financial liabilities
Deposits from banks 608,497 11,798 2,414 45,471 - - 668,180
Deposits from customers 2,308,573 322,019 175,699 156,664 173,416 15,709 3,152,079
Financial liabilities at fair value
through profit or loss
- - 33 - - - 33
Borrowings 18,050 20,431 10,262 21,466 418,819 13,515 502,543
Other liabilities 98,850 54,190 62,529 999 81 - 216,649
Investment contracts - 1,483 963 1,638 8,470 846 13,399
Total financial liabilities 3,033,970 409,921 251,900 226,237 600,786 30,070 4,552,882
Loan commitments 915 130 675 531 1,114 4,897 8,262
Letters of credit and other credit
related obligations
27,537 31,147 98,625 307,773 65,890 - 530,972
Total commitments 28,452 31,277 99,300 308,304 67,004 4,897 539,234
1,109,694 323,009 256,554 364,534 218,164 82,643 2,354,599
31 December 2016
Financial liabilities
Deposits from banks 321,275 78,833 638 15,417 - - 416,163
Deposits from customers 2,288,499 324,768 156,242 120,199 198,247 24,038 3,111,993
Financial liabilities at fair value
through profit or loss
- - - - - - -
Borrowings 7,334 12,948 2,198 14,873 344,801 24,439 406,593
Other liabilities 72,930 112,112 3,469 2,754 5,812 - 197,076
Investment contracts - - - - 9,440 - 9,440
Total financial liabilities 2,690,038 528,661 162,548 153,243 558,300 48,477 4,141,265
Loan commitments 145 60 2,371 1,039 10,580 9 14,203
Letters of credit and other credit
related obligations
20,415 42,515 78,180 71,256 58,021 200,236 470,624
Total commitments 20,560 42,575 80,551 72,295 68,601 200,246 484,827
756,315 330,440 188,456 388,002 339,075 125,890 2,128,177
COMPANY Over 1 year
0 - 30 31 - 90 91 - 180 181 - 365 but less Over
days days days days than 5 yrs 5 years Total
N 'million N 'million N 'million N 'million N 'million N 'million N 'million
31 December 2017
Financial liabilities
Other liabilities - - - 7,553 - - 7,553
Total financial liabilities - - - 7,553 - - 7,553
7,585 - - 8,832 - - 16,418
31 December 2016
Financial liabilities
Other liabilities - - - 7,114 - - 7,114
Total financial liabilities - - - 7,114 - - 7,114
645 - - 10,260 - - 10,906
Assets held for managing liquidity risk
Assets held for managing liquidity risk
Assets held for managing liquidity risk
Assets held for managing liquidity risk
63

FBN Holdings Plc.
NOTES TO THE CONSOLIDATED FINANCIAL STATEMENTS
At 31 December 2017
3.3 Liquidity risk continued
3.3.3 Non-derivative financial liabilities and assets held for managing liquidity risk continued
(b)
TABLE B - LIQUIDITY ANALYSIS ON A BEHAVIOURAL BASIS
GROUP
Over 1 year
0 - 30 31 - 90 91 - 180 181 - 365 but less Over
days days days days than 5 yrs 5 years Total
N 'million N 'million N 'million N 'million N 'million N 'million N 'million
31 December 2017
Financial liabilities
Deposits from banks 608,497 11,798 2,414 45,471 - - 668,180
Deposits from customers 359,473 340,645 303,117 323,176 500,877 1,324,790 3,152,077
Borrowings 18,050 20,431 10,262 21,466 418,819 13,515 502,543
Other liabilities 98,850 54,190 62,529 999 81 - 216,649
Investment contracts - 1,483 963 1,638 8,470 846 13,399
Total financial liabilities 1,084,870 428,547 379,284 392,749 928,247 1,339,151 4,552,847
Loan commitments 915 130 675 531 1,114 4,897 8,262
Letters of credit and other credit
related obligations
27,539 31,147 98,625 307,773 65,888 - 530,972
Total commitments 28,454 31,276 99,300 308,304 67,002 4,897 539,234
1,109,694 323,009 256,554 364,534 218,164 82,643 2,354,599
Over 1 year
0 - 30 31 - 90 91 - 180 181 - 365 but less Over
days days days days than 5 yrs 5 years Total
N 'million N 'million N 'million N 'million N 'million N 'million N 'million
31 December 2016
Financial liabilities
Deposits from banks 256,830 78,838 65,078 15,417 - - 416,163
Deposits from customers 304,971 379,190 265,423 289,409 578,608 1,276,844 3,094,445
Borrowings 7,334 12,948 2,198 14,873 344,801 24,439 406,593
Other liabilities 72,930 109,269 7,874 2,754 5,812 - 198,638
Investment contracts 9,440 - - - - - 9,440
Total financial liabilities 651,505 580,245 340,573 322,453 929,221 1,301,283 4,125,279
Loan commitments 145 60 2,371 1,039 10,580 9 14,203
Letters of credit and other credit
related obligations
20,419 42,515 78,180 71,256 58,017 200,236 470,624
Total commitments 20,564 42,575 80,551 72,295 68,597 200,246 484,827
756,315 330,440 188,456 388,002 339,075 125,890 2,128,177
3.3.4
Table B below presents the undiscounted cashflows payable by the Group based on their behavioral patterns. In managing its liquidity risk, the Group
profiles its cashflows statistically using historical observations, to ensure that projections are in tune with demonstrated behavioral trends. The Group
adopts a Behavioral run-off model in estimating Core and Volatile components of its non-maturing liabilities, complemented by qualitative factors e.g.
changes in collection sweep cycles, effect of new fiscal or monetary policies etc. The objective is to determine the proportion of the non-contractual
balances to be spread across the Group’s maturity bands.
Assets held for managing liquidity risk
The Group holds a diversified portfolio of liquid assets - largely cash and government securities to support payment and funding obligations in normal
and stressed market conditions across foreign and local currencies. The Group’s liquid assets comprise
- Cash and balances with the central bank comprising reverse repos and Overnight deposits
- Short term and overnight placements in the interbank market
- Government bonds and T-bills that are readily accepted in repurchase agreements with the Central bank and other market participants
- Secondary sources of liquidity in the form of highly liquid instruments in the Group’s trading portfolios.
- The ability to access incremental short term funding by interbank borrowing from the interbank market
First Bank of Nigeria Limited, the commercial banking segment of the group, is most exposed to liquidity risk. The bank is largely deposit funded and
thus, as is typical amongst Nigerian banks, has significant funding mismatches on a contractual basis, given that the deposits are largely demand and
short tenured, whilst lending is longer term.On an actuarial basis, the bank's demand deposits exhibit much longer duration, with 75.53% of the bank's
current account balances and 67.48% of savings account balances being deemed core.
To manage liquidity shocks in either foreign or local currency, largely as a result of episodic movements, the bank typically holds significant short term
liquidity in currency placements or taps the repo markets to raise short term funding as is required. To grow local currency liquidity, the bank has also
systematically worked towards reducing the duration of our securities portfolio in the last year, shifting the emphasis to holding more liquid shorter
dated treasury bills over longer term bonds, to allow more flexibility in managing liquidity. Whilst on the foreign currency side, the bank has built up
placement balances with our offshore correspondents.
Assets held for managing liquidity
risk
Assets held for managing liquidity
risk
64

FBN Holdings Plc.
NOTES TO THE CONSOLIDATED FINANCIAL STATEMENTS
At 31 December 2017
3.3.5 Derivative liabilities
(a) Derivatives settled on a net basis
The put options and the accumulator forex contract will be settled on a net basis.
GROUP Up to 1
month
1-3
months
3-6
months
6 - 12 months 1-5
years
Over 5 years Total
N 'million N 'million N 'million N 'million N 'million N 'million N 'million
At 31 December 2017
Derivative liabilities
Put Options (346) 2,275 3,244 5,680 6,932 - 17,785
(313) 2,434 3,248 5,699 6,932 - 17,999
Derivative assets
Forward Contract 371 2,320 3,939 7,087 7,848 - 21,565
403 2,466 3,943 7,106 7,848 - 21,766
90 4,900 7,190 12,805 14,780 - 39,764
At 31 December 2016
Derivative liabilities
Put Options (295) (364) (468) (917) (1,458) - (3,502)
(295) (364) (468) (917) (1,458) 0 (3,502)
Derivative assets
Cross-Currency Swap - - - - - - -
Forward Contract 286 350 436 865 1,457 - 3,394
286 350 436 865 1,457 - 3,394
(9) (14) (32) (52) (1) - (108)
(b) Derivatives settled on a gross basis.
Up to 1
month
1-3 months 3-6 months 6 - 12 months 1-5 years Over 5 years Total
GROUP
At 31 December 2017 (N' million)
Liabilities held for trading
FX Swap - Payable 28,353 14,672 12,265 - - - 55,290
FX Swap - Receivable 33,102 16,501 13,480 - - - 63,083
Forward Contract - Payment 369 - - - - - 369
Forward Contract - Receipt 92,212 42,600 40,312 8,062 - - 183,186
154,036 73,773 66,057 8,062 - - 301,928
At 31 December 2016
Liabilities held for trading
FX Swap - Payable (10,675) (4,575) (21,350) - - - (36,600)
FX Swap - Receivable 11,177 4,995 23,182 - - - 39,354
Forward Contract - Payment (120,887) (115,327) (103,918) (120,978) - - (461,111)
Forward Contract - Receipt - 28,640 2,211 - - - 30,851
Put option - - - - - - -
(120,385) (86,267) (99,875) (120,978) - - (427,506)
The Group’s derivatives that will be settled on a gross basis are foreign exchange derivatives. The table below analyses the Group’s derivative
financial instruments that will be settled on a gross basis into relevant maturity groupings based on the remaining period at the date of the
consolidated statement of financial position to the contractual maturity date. Contractual maturities are assessed to be essential for an understanding
of the timing of the cashflows on all derivatives including derivatives classified as ‘liabilities held for trading’. The amounts disclosed in the table are
the contractual undiscounted cash flows.
The table below analyses the Group’s derivative financial liabilities that will be settled on a net basis into relevant maturity groupings based on the
remaining period at the date of the consolidated statement of financial position to the contractual maturity date. The amounts disclosed in the table are
the contractual undiscounted cash flows.
65

FBN Holdings Plc.
NOTES TO THE CONSOLIDATED FINANCIAL STATEMENTS
At 31 December 2017
3.4 Market risk
3.4.1 Management of market risk
3.4.2 Market risk measurement techniques
(a) Value at risk (VAR)
VAR summary
Average High Low
Foreign exchange risk 58 280 4
Interest rate risk 1,493 5,870 34
Total VAR 1,551 6,150 38
Average High Low
Foreign exchange risk 32 118 -
Interest rate risk 943 3,241 219
Total VAR 975 3,359 219
Market risk is the potential for adverse changes in the value of a trading or an investment portfolio due to changes in market risk variables such as
equity and commodity prices, interest rates, and foreign exchange rates.
Market risk arises from positions in currencies, interest rate and securities held in our trading portfolio and from our retail banking business,
investment portfolio, and other non-trading activities. The movement in market risk variables may have a negative impact on the balance sheet and or
income statement.
Through the financial year, the Bank was exposed to market risk in its trading, and non-trading activities mainly as a result of:
• interest rate movements in reaction to monetary policy changes by the Central Bank of Nigeria, fiscal policies changes, and market forces;
• foreign exchange fluctuations arising from demand and supply as well as government policies; and
• equity price movements in response to market forces and changing market dynamics, such as market making on the Nigerian Stock Exchange.
12 months to 31 December 2017
The assets included in the VAR analaysis are the held for trading assets.
The treasury bill trading VaR is NGN787 million as at 31st December 2017 and reflects the potential loss given assumptions of a 10-day holding
period, volatility computed using 500-day return data, and a 99% statistical confidence level.
The foreign exchange trading VaR was N27 million as at 31st December 2017, reflecting the new regulatory Trading Open Position of 0.5% of
Shareholders' Fund stipulated by the CBN.
12 months to 31 December 2016
First Bank of Nigeria Limited's market risk management process applies disciplined risk-taking within a framework of well-defined risk appetite that
enables the group to boost shareholders value while maintaining competitive advantage through effective utilisation of risk capital. Thus, FirstBank’s
Group market risk management policy ensures:
• formal definition of market risk management governance – recognised individual roles and committees, segregation of duties, avoidance of conflicts,
etc.;
• management is responsible for the establishment of appropriate procedures and processes in implementing the Board-approved market risk policy
and strategy. The procedures are documented in a periodically reviewed market risk procedural manual that spells out the procedures for executing
relevant market risk controls.;
• an independent market risk management function reporting directly to the Bank’s Chief Risk Officer;
• a Group-wide market risk management process to which all risk-taking units are subjected;
• alignment of market risk management standards with international best practice. Risk measurements are progressively based on modern techniques
such as sensitivity, value-at-risk methodology (VaR), stress testing and scenario analysis;
• a robust market risk management infrastructure reinforced by a strong management information system (MIS) for controlling, monitoring and
reporting market risk, including transactions between the Bank and the subsidiaries;
• continual evaluation of risk appetite, communicated through risk limits and overall effectiveness of the market risk management process;
• the Group does not undertake any risk that cannot be managed, or risks that are not fully understood especially in new products and;
• where the Group takes on any risk, full consideration is given to product maturity, financial market sophistication and regulatory pronouncement,
guidelines or policies. The risk taken must be adequately compensated by the anticipated reward.
VaR measures potential loss in fair value of financial instruments due to adverse market movements over a defined time horizon at a specified
confidence level.
VaR is calculated for expected movements over a minimum of one business day and to a confidence level of 99% and a 10-day holding period. The
confidence level suggests that potential daily losses, in excess of the VaR measure, are likely to be experienced three times per year in every 250
days. Only First Bank of Nigeria (the bank) is subject to the VaR methodology. The interest rate exposure of the other subsidiaries is considered
insignificant to the Group. Thus, the VAR of the bank is deemed to be fairly representative of the Group.
The Bank continues to use VaR to estimate the potential losses that could occur on its positions as a result of movements in market factors.
The Bank uses the parametric method as its VaR methodology with an observation period of two years obtained from published data from pre-
approved sources. VaR is calculated on the Bank’s positions at close of business daily.
The table below shows the trading VaR of the Bank. The major contributors to the trading VaR are Treasury Bills and Foreign Exchange due to
volatility in those instruments impacting positions held by the Bank during the period.
The major measurement techniques used to measure and control market risk are outlined below:
GROUP
66

FBN Holdings Plc.
NOTES TO THE CONSOLIDATED FINANCIAL STATEMENTS
At 31 December 2017
3.4.2 Market risk measurement techniques continued
(b) Stress tests
Non-trading portfolio
Hedged non-trading market risk exposures
3.4.3 Foreign exchange risk
GROUP
Naira USD GBP Euro Others Total
N 'million N 'million N 'million N 'million N 'million N 'million
31 December 2017
Financial assets
Cash and balances with Central
Banks 514,992 99,284 1,759 7,565 18,281 641,881
Loans and advances to banks 186,112 260,089 268,516 19,729 8,483 742,929 Loans and advances - - - -
- Overdrafts 154,324 96,780 12,932 27,799 4,300 296,135
- Term loans 576,675 1,017,184 48,950 16,771 10,755 1,670,334
- Staff loans 6,069 1,416 41 1 420 7,947
- Project finance 17,566 8,730 - - - 26,296
- Advances under finance lease 511 - - - - 511 Investment securities - - - -
- Available-for-sale investments 646,143 476,614 - - - 1,122,757
- Held to maturity investments 67,688 - - - 40,595 108,283
- Loans and receivables - 458 18,026 - - - 17,568 Asset pledged as collateral 203,825 - - - 5,100 208,925
Financial assets at fair value through
profit or loss 60,570 23,143 - - - 83,713
Other assets 55,143 4,843 356 336 2,784 63,462
2,489,162 2,006,109 332,554 72,201 90,718 4,990,743
Financial liabilities
Customer deposits 2,193,814 473,512 384,477 26,510 65,025 3,143,338 Deposits from banks 6,140 623,893 19,031 9,843 6,459 665,366
Financial liabilities at fair value
through profit or loss 20 9,375 - 10 - 9,404
Borrowings 58,324 359,541 6 386 2,662 420,919 Other liabilities 100,752 109,276 946 14,095 1,341 226,410
Investment contracts 13,399 - - - - 13,399
2,372,449 1,575,596 404,460 50,844 75,487 4,478,837
Based on the reality of unpredictable market environment and the frequency of regulations that have had significant effect on market rates and prices,
the Bank augments other risk measures with stress testing to evaluate the potential impact of possible extreme movements in financial variables on
portfolio values.
Stress testing is an integral part of the market risk management framework and considers both historical market events and forward-looking scenarios.
A consistent stress-testing methodology is applied to trading and non-trading books. Stress scenarios are regularly updated to reflect changes in risk
profile and economic events.
The Asset and Liability Committee (ALCO) is responsible for reviewing stress exposures and where necessary, enforcing reductions in overall market
risk exposure. The stress-testing methodology assumes that scope for management action would be limited during a stress event, reflecting the
decrease in market liquidity that often occurs. Regular stress-test scenarios are applied to interest rates, exchange rates and equity prices. This
covers all asset classes in the financial markets banking and trading books. Ad hoc scenarios are also prepared reflecting specific market conditions
and for particular concentrations of risk that arise within the businesses.
The Group is exposed to foreign exchange risks due to fluctuations in foreign currency exchange rates on its financial position and cash flows. The
Board sets limits on the level of exposure by currency and in aggregate for both overnight and intra-day positions, which are monitored daily. The
table below summarises the Group’s exposure to foreign currency exchange rate risk at 31 December 2016 and 31 December 2015. Included in the
table are the Group’s financial instruments at carrying amounts, categorised by currency.
The principal objective of market risk management of non-trading portfolios is to optimise net interest income. Due to the size of the Bank’s holdings in
rate-sensitive assets and liabilities the Bank is exposed to interest rate risk.
Non-trading interest rate risk results mainly from differences in the mismatches or re-pricing dates of assets and liabilities, both on- and off-balance
sheet as interest rate changes.
The Bank uses a variety of tools to measure non-tradable interest rate risk such as:
• interest rate gap analysis (which allows the Bank to maintain a positive or negative gap depending on the perceived interest rate direction). The size
of the gap is then adjusted to either hedge net interest income against changing interest rates or to speculatively increase net interest income;
• forecasting and simulating interest rate margins;
• market value sensitivity;
• calculating earnings at risk (EaR) using various interest rate forecasts; and
• re-pricing risk in various portfolios and yield curve analysis.
See note 3.4.5 for interest rate sensitivity disclosures.
The Group’s books have some key market risk exposures, which have been identified and are being managed using swaps and options.
67
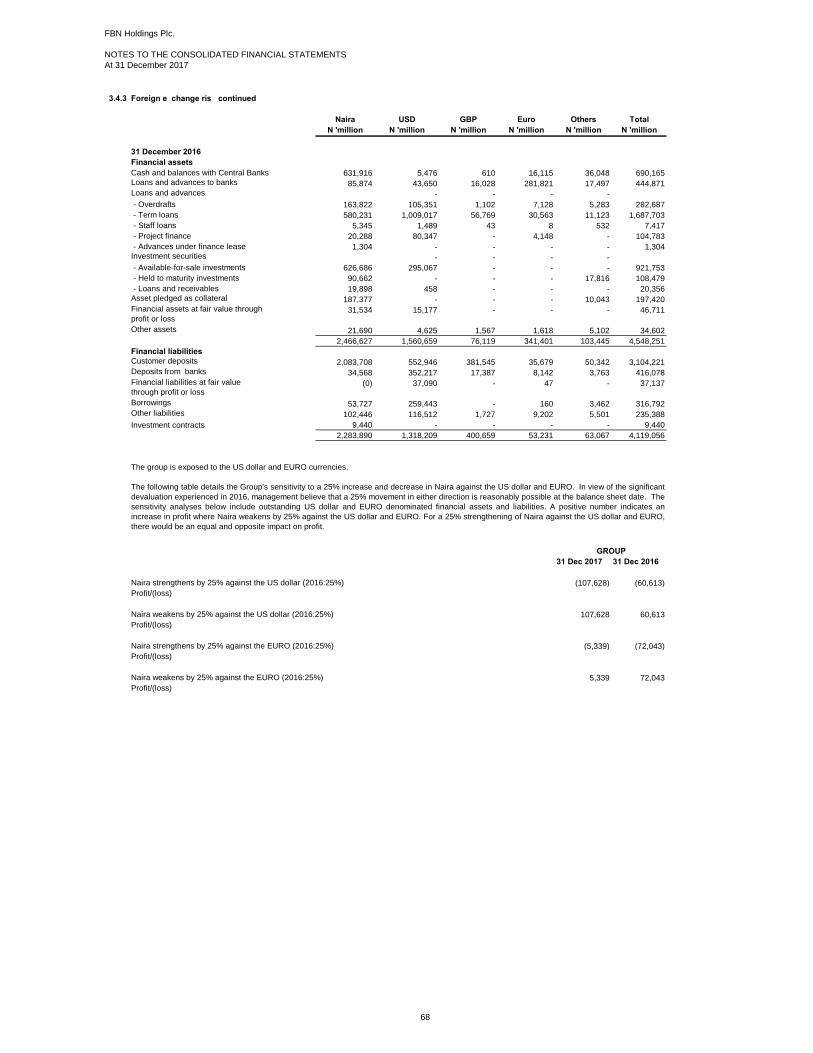
FBN Holdings Plc.
NOTES TO THE CONSOLIDATED FINANCIAL STATEMENTS
At 31 December 2017
3.4.3 Foreign exchange risk continued
Naira USD GBP Euro Others Total
N 'million N 'million N 'million N 'million N 'million N 'million
31 December 2016
Financial assets
Cash and balances with Central Banks 631,916 5,476 610 16,115 36,048 690,165 Loans and advances to banks 85,874 43,650 16,028 281,821 17,497 444,871 Loans and advances - - - -
- Overdrafts 163,822 105,351 1,102 7,128 5,283 282,687
- Term loans 580,231 1,009,017 56,769 30,563 11,123 1,687,703
- Staff loans 5,345 1,489 43 8 532 7,417
- Project finance 20,288 80,347 - 4,148 - 104,783
- Advances under finance lease 1,304 - - - - 1,304 Investment securities - - - -
- Available-for-sale investments 626,686 295,067 - - - 921,753
- Held to maturity investments 90,662 - - - 17,816 108,479
- Loans and receivables 19,898 458 - - - 20,356 Asset pledged as collateral 187,377 - - - 10,043 197,420
Financial assets at fair value through
profit or loss 31,534 15,177 - - - 46,711
Other assets 21,690 4,625 1,567 1,618 5,102 34,602
2,466,627 1,560,659 76,119 341,401 103,445 4,548,251
Financial liabilities
Customer deposits 2,083,708 552,946 381,545 35,679 50,342 3,104,221 Deposits from banks 34,568 352,217 17,387 8,142 3,763 416,078
Financial liabilities at fair value
through profit or loss (0) 37,090 - 47 - 37,137
Borrowings 53,727 259,443 - 160 3,462 316,792 Other liabilities 102,446 116,512 1,727 9,202 5,501 235,388
Investment contracts 9,440 - - - - 9,440
2,283,890 1,318,209 400,659 53,231 63,067 4,119,056
31 Dec 2017 31 Dec 2016
Naira strengthens by 25% against the US dollar (2016:25%) (107,628) (60,613)
Profit/(loss)
Naira weakens by 25% against the US dollar (2016:25%) 107,628 60,613
Profit/(loss)
Naira strengthens by 25% against the EURO (2016:25%) (5,339) (72,043)
Profit/(loss)
Naira weakens by 25% against the EURO (2016:25%) 5,339 72,043
Profit/(loss)
The group is exposed to the US dollar and EURO currencies.
The following table details the Group's sensitivity to a 25% increase and decrease in Naira against the US dollar and EURO. In view of the significant
devaluation experienced in 2016, management believe that a 25% movement in either direction is reasonably possible at the balance sheet date. The
sensitivity analyses below include outstanding US dollar and EURO denominated financial assets and liabilities. A positive number indicates an
increase in profit where Naira weakens by 25% against the US dollar and EURO. For a 25% strengthening of Naira against the US dollar and EURO,
there would be an equal and opposite impact on profit.
GROUP
68
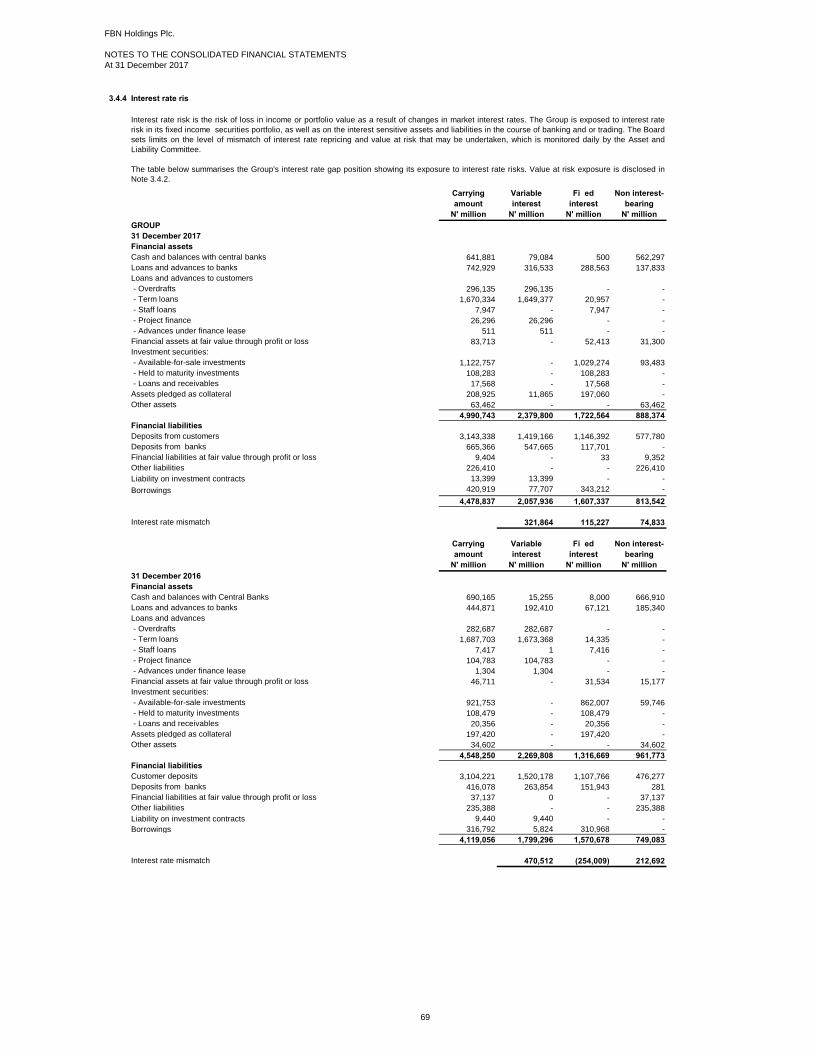
FBN Holdings Plc.
NOTES TO THE CONSOLIDATED FINANCIAL STATEMENTS
At 31 December 2017
3.4.4 Interest rate risk
Carrying Variable Fixed Non interest-
amount interest interest bearing
N' million N' million N' million N' million
GROUP
31 December 2017
Financial assets
Cash and balances with central banks 641,881 79,084 500 562,297
Loans and advances to banks 742,929 316,533 288,563 137,833
Loans and advances to customers
- Overdrafts 296,135 296,135 - -
- Term loans 1,670,334 1,649,377 20,957 -
- Staff loans 7,947 - 7,947 -
- Project finance 26,296 26,296 - -
- Advances under finance lease 511 511 - -
Financial assets at fair value through profit or loss 83,713 - 52,413 31,300
Investment securities:
- Available-for-sale investments 1,122,757 - 1,029,274 93,483
- Held to maturity investments 108,283 - 108,283 -
- Loans and receivables 17,568 - 17,568 -
Assets pledged as collateral 208,925 11,865 197,060 -
Other assets 63,462 - - 63,462
4,990,743 2,379,800 1,722,564 888,374
Financial liabilities
Deposits from customers 3,143,338 1,419,166 1,146,392 577,780
Deposits from banks 665,366 547,665 117,701 -
Financial liabilities at fair value through profit or loss 9,404 - 33 9,352
Other liabilities 226,410 - - 226,410
Liability on investment contracts 13,399 13,399 - -
Borrowings 420,919 77,707 343,212 -
4,478,837 2,057,936 1,607,337 813,542
Interest rate mismatch 321,864 115,227 74,833
Carrying Variable Fixed Non interest-
amount interest interest bearing
N' million N' million N' million N' million
31 December 2016
Financial assets
Cash and balances with Central Banks 690,165 15,255 8,000 666,910
Loans and advances to banks 444,871 192,410 67,121 185,340
Loans and advances
- Overdrafts 282,687 282,687 - -
- Term loans 1,687,703 1,673,368 14,335 -
- Staff loans 7,417 1 7,416 -
- Project finance 104,783 104,783 - -
- Advances under finance lease 1,304 1,304 - -
Financial assets at fair value through profit or loss 46,711 - 31,534 15,177
Investment securities:
- Available-for-sale investments 921,753 - 862,007 59,746
- Held to maturity investments 108,479 - 108,479 -
- Loans and receivables 20,356 - 20,356 -
Assets pledged as collateral 197,420 - 197,420 -
Other assets 34,602 - - 34,602
4,548,250 2,269,808 1,316,669 961,773
Financial liabilities
Customer deposits 3,104,221 1,520,178 1,107,766 476,277
Deposits from banks 416,078 263,854 151,943 281
Financial liabilities at fair value through profit or loss 37,137 0 - 37,137
Other liabilities 235,388 - - 235,388
Liability on investment contracts 9,440 9,440 - -
Borrowings 316,792 5,824 310,968 -
4,119,056 1,799,296 1,570,678 749,083
Interest rate mismatch 470,512 (254,009) 212,692
Interest rate risk is the risk of loss in income or portfolio value as a result of changes in market interest rates. The Group is exposed to interest rate
risk in its fixed income securities portfolio, as well as on the interest sensitive assets and liabilities in the course of banking and or trading. The Board
sets limits on the level of mismatch of interest rate repricing and value at risk that may be undertaken, which is monitored daily by the Asset and
Liability Committee.
The table below summarises the Group's interest rate gap position showing its exposure to interest rate risks. Value at risk exposure is disclosed in
Note 3.4.2.
69

FBN Holdings Plc.
NOTES TO THE CONSOLIDATED FINANCIAL STATEMENTS
At 31 December 2017
3.4.5 Interest rate sensitivity gap analysis
Figures in N'bn<=30 DAYS 31 - 90 DAYS 91 - 180 DAYS
181 - 365
DAYS1 - 2 YEARS
2 YEARS &
ABOVE
Rate
Sensitive
Treasury Bills 38 53 136 203 - - 431
Government Bonds - - 9 - 15 80 103
Corporate Bonds - - - - - 1 1
Loans and advances to banks - 21 - - - - 21
Project Finance - - 15 - - 12 26
Term Loans 57 5 6 54 100 1,206 1,428
Overdraft 1 - 182 16 - - 199
Equipment on Lease - - - - - - -
Staff Loans - - - - - 5 5
TOTAL ASSETS 95 80 348 273 115 1,303 2,215
Deposits from customers 306 227 152 218 328 537 1,767
Deposits from banks 13 4 - 42 - - 59
Medium term loan 9 21 - - - - 30
TOTAL LIABILITIES 328 252 152 260 328 537 1,856
(232) (172) 196 13 (213) 766 360
Interest rate sensitivity gap analysis
Reasonable possible movement
31 Dec 2017 31 Dec 2016
Nibor Increase by 7%
Profit/(loss) 38,753 52,357
Nibor decrease by 7%
Profit/(loss) (24,331) (37,566)
USD Libor increases by 3%
Profit/(loss) (11,722) 11,649
USD Libor decreases by 3%
Profit/(loss) 8,802 (13,825)
EURIBOR increases by 3%
Profit/(loss) 621 (47)
EURIBOR decreases by 3%
Profit/(loss) 680 (16)
Statement of financial position interest rate sensitivity (fair value and cash flow interest rate risk)
31 Dec 2017 31 Dec 2016 31 Dec 2017 31 Dec 2016
N 'millions N 'millions N 'millions N 'millions
Decrease
Asset 23,044 16,705 14,464 11,388
Liability - - - -
Increase
Asset (22,099) (16,328) (13,519) (11,011)
Liability - - - -
Financial assets held for trading
Treasury bills 7,352 7,623 7,352 7,623
Government bonds 2,732 694 2,732 694
Total 10,084 8,317 10,084 8,317
The sensitivity analyses below for FirstBank Nigeria Limited has been determined based on the exposure to interest rates for both derivatives and non-
derivative instruments at the balance sheet date. For floating rate liabilities, the analysis is prepared assuming the amount of liability outstanding at
the balance sheet date was outstanding for the whole year. A 7% increase or decrease is used when reporting interest rate risk for Nibor and 3% is
used when reporting interest rate risk for USD Libor or EURIBOR. The interest rate exposure of the other subsidiaries is considered insignificant to
the Group. Thus, the repricing profile of the bank is deemed to be fairly representative of the Group.
Management believe that the following movements in either direction (per currency) are reasonably possible at the balance sheet date
GROUP COMPANY
The table below summarises the repricing profile of FirstBank's non-trading book as at 31st December 2017. Carrying amounts of items are allocated
to time bands by reference to the earlier of the next contractual interest rate repricing date and the maturity date. The interest rate exposure of the
other subsidiaries' is considered insignificant to the Group. Thus, the repricing profile of the bank is deemed to be fairly representative of the Group.
Current and Savings deposits, which are included within customer deposits, are repayable on demand on a contractual basis. In practice however,
these deposits form a stable base for the bank’s operations and liquidity needs because of the broad customer base – both numerically and by
depositor type. From the bank's experience, about 49% of these demand deposits are non-rate sensitive. These classes of deposits have been
allocated into maturity buckets based on historical maturity patterns.
The aggregate figures presented above are further segregated into their various components as shown below:
70

FBN Holdings Plc.
NOTES TO THE CONSOLIDATED FINANCIAL STATEMENTS
At 31 December 2017
Impact on income statement:
Unfavourable change @ 2% reduction in interest rates 311 78 311 78
Favourable change @ 2% increase in interest rates (281) (72) (281) (72)
Available-for-sale investment securities:
Treasury bills 663,357 633,145 503,159 512,927
Government bonds 300,462 168,139 152,171 98,622
Total 963,819 801,284 655,330 611,549
Impact on other comprehensive income statement:
Unfavourable change @ 2% reduction in interest rates 22,733 16,627 14,153 11,310
Favourable change @ 2% increase in interest rates (21,818) (16,256) (13,238) (10,939)
3.5 Management of insurance risk
3.5.1 Underwriting risk
Underwriting risk relates mainly to the uncertainty that the insured event will occur. The nature of an insurance contract is that the timing and size of
claims are uncertain and therefore unpredictable. The principal underwriting risk is the risk that the actual outcome of mortality, morbidity and medical
claims will result in volatile profits from one year to the next. Such volatility may result from large concentrations of risk or from charging inadequate
premiums relative to the severity or incidence of the risk accepted. Inadequate policy wording may fail to protect the insurer from claims that were not
envisaged when the product was priced.
Insurance events are random and the actual number and amount of underwriting benefits will vary from the best estimates established from statistical
techniques and taking cognisance of past experience. The Group manages these risks through its underwriting strategy, reinsurance arrangements
and claims handling processes.
The Group, through its primary insurance business - FBN Insurance Limited, issues contracts that transfer insurance risk. This section summarises
the nature and management of these risks.
The risk under any insurance contract is the possibility that the insured event occurs and the uncertainty of the amount of the resulting claim. By the
very nature of an insurance contract, this risk is random and therefore unpredictable.
For a portfolio of insurance contracts where the theory of probability is applied to pricing and provisioning, the principal risk that the Group faces
under its insurance contracts is that the actual claims and benefit payments exceed the carrying amount of the insurance liabilities. This could occur
because the frequency or severity of claims and benefits are greater than estimated. Insurance events are random, and the actual number and
amount of claims and benefits will vary from year to year from the level established using statistical techniques.
Experience shows that the larger the portfolio of similar insurance contracts, the smaller the relative variability about the expected outcome will be. In
addition, a more diversified portfolio is less likely to be affected by a change in any subset of the portfolio. The Group has developed its insurance
underwriting strategy to diversify the type of insurance risks accepted and within each of these categories to achieve a sufficiently large population of
risks to reduce the variability of the expected outcome.
Factors that aggravate insurance risk include lack of risk diversification in terms of type and amount of risk. The Group issues contracts that transfer
insurance and/or financial risk. This section summarises the nature and management of these risks.
71
FBN Holdings Plc.
NOTES TO THE CONSOLIDATED FINANCIAL STATEMENTS
At 31 December 2017
3.5 Management of insurance risk continued
3.5.1 Underwriting risk continued
3.5.2 Frequency and severity of claims
The Group's reinsurance arrangements include risk premium treaties for a high life cover, hospital cover product and critical illness products. The
decision on the proportion of risk to be ceded follows mainly from the Group’s desire to maintain its relationship with the reinsurers and is based on
the level of assistance received from the reinsurers. Exceptions to this are reinsurance cessions that are intended to limit the Group’s exposure to
large sums assured.
Claims risk is represented by the fact that the Group may incur unexpectedly high mortality and morbidity losses on any group of policies. Client
service staffs are trained to identify and investigate fraudulent claims timeously. The legitimacy of claims is verified by internal, financial and operating
controls that are designed to contain and monitor claims risks. The forensic investigation team also investigates and advises on improvements to
internal control systems.
The frequency and severity of claims can be affected by several factors. The most significant are the increasing level of death, job loss and level of
awards for the damages suffered as a result of road accidents. Estimated inflation is also a significant factor due to the long period typically required
to settle cases where information are not readily available.
The Group manages these risks through its underwriting strategy, adequate reinsurance arrangements and proactive claims handling.
The underwriting strategy attempts to ensure that the underwritten risks are well diversified in terms of type and amount of risk.
Underwriting limits are in place to enforce appropriate risk selection criteria. For example, the Group has the right not to renew policies and it has the
right to reject the payment of a fraudulent claim.
The reinsurance arrangements include surplus and quota - share. The effect of such reinsurance arrangements is that the Group should not suffer
total net insurance losses of more than N10 million on any policy. In addition to the overall Group reinsurance programme, individual business units
are permitted to purchase additional reinsurance protection.
The Group has specialised claims units dealing with the mitigation of risks surrounding claims. This unit investigates and adjusts all claims. The
claims are reviewed individually on a quarterly basis and adjusted to reflect the latest information on the underlying facts, contractual terms and
conditions, and other factors. The Group actively manages and pursues early settlements of claims to reduce its exposure to unpredictable
developments.
The concentration of insurance risk before and after reinsurance by class of business in relation to the type of insurance risk accepted is summarised
in the next table, with reference to the carrying amount of the estimated insurance liabilities (gross and net of reinsurance) arising from all life and non-
life insurance contracts:
The following policies and practices are used by the Group as part of its underwriting strategy to mitigate underwriting risk:
• All long-term insurance product additions and alterations, both within and outside of agreed business definitions, are required to pass through the
approvals framework that forms part of the governance process. The contracted actuary approves the financial soundness of new and revised
products.
• The Group's underwriting strategy aims to ensure that the underwriting risks are well diversified in terms of type (medical, occupational, financial)
and amount of risk covered. Whilst this is difficult to measure at underwriting stage, the success or failure of the strategy may be measured by the
historical stability of profits emerging from the book of business.
• Product pricing and reserving policies also include specific allowance for the risk of HIV/AIDS.
• The contracted actuary reports annually on the profitability of the business taking into consideration the reasonable benefit expectation of
policyholders. All new rate tables are approved and authorised by the statutory actuary prior to being issued.
• The right to re-rate premiums is retained as far as possible, although this is limited by competitive pressure.
• Investigations into mortality and morbidity experience are conducted at least half yearly to ensure that corrective action is taken where necessary.
The Group’s core funeral product offering is characterised by low sums assured which negates the need for underwriting at policy inception. The
policy conditions enable the Group to repudiate death claims arising from non-accidental causes during an initial waiting period after policy inception.
72
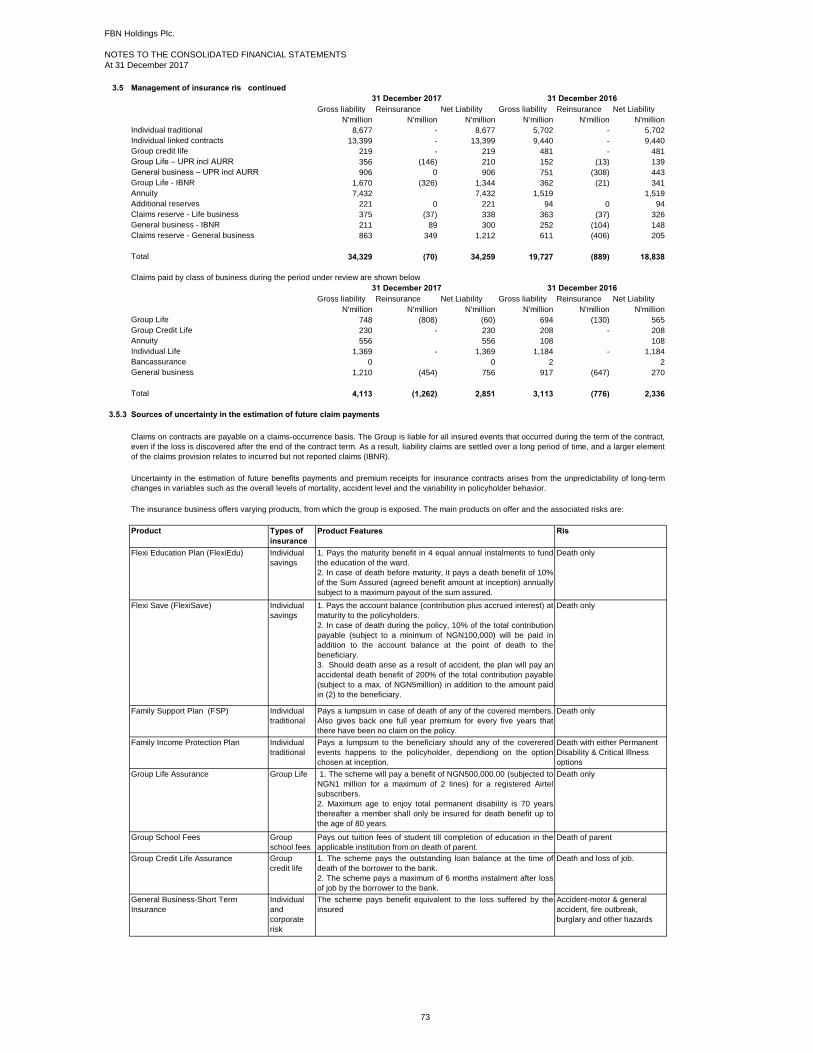
FBN Holdings Plc.
NOTES TO THE CONSOLIDATED FINANCIAL STATEMENTS
At 31 December 2017
3.5 Management of insurance risk continued
Gross liability Reinsurance Net Liability Gross liability Reinsurance Net Liability
N'million N'million N'million N'million N'million N'million
Individual traditional 8,677 - 8,677 5,702 - 5,702
Individual linked contracts 13,399 - 13,399 9,440 - 9,440
Group credit life 219 - 219 481 - 481
Group Life – UPR incl AURR 356 (146) 210 152 (13) 139
General business – UPR incl AURR 906 0 906 751 (308) 443
Group Life - IBNR 1,670 (326) 1,344 362 (21) 341
Annuity 7,432 7,432 1,519 1,519
Additional reserves 221 0 221 94 0 94
Claims reserve - Life business 375 (37) 338 363 (37) 326
General business - IBNR 211 89 300 252 (104) 148
Claims reserve - General business 863 349 1,212 611 (406) 205
Total 34,329 (70) 34,259 19,727 (889) 18,838
Claims paid by class of business during the period under review are shown below
Gross liability Reinsurance Net Liability Gross liability Reinsurance Net Liability
N'million N'million N'million N'million N'million N'million
Group Life 748 (808) (60) 694 (130) 565
Group Credit Life 230 - 230 208 - 208
Annuity 556 556 108 108
Individual Life 1,369 - 1,369 1,184 - 1,184
Bancassurance 0 0 2 2
General business 1,210 (454) 756 917 (647) 270
Total 4,113 (1,262) 2,851 3,113 (776) 2,336
3.5.3 Sources of uncertainty in the estimation of future claim payments
Product Types of
insurance
risk
General Business-Short Term
Insurance
Flexi Save (FlexiSave)
1. The scheme pays the outstanding loan balance at the time of
death of the borrower to the bank.
2. The scheme pays a maximum of 6 months instalment after loss
of job by the borrower to the bank.
The insurance business offers varying products, from which the group is exposed. The main products on offer and the associated risks are:
31 December 2017
31 December 2017
Family Support Plan (FSP)
Family Income Protection Plan
Group School Fees
Group Life Assurance
Flexi Education Plan (FlexiEdu)
Uncertainty in the estimation of future benefits payments and premium receipts for insurance contracts arises from the unpredictability of long-term
changes in variables such as the overall levels of mortality, accident level and the variability in policyholder behavior.
Claims on contracts are payable on a claims-occurrence basis. The Group is liable for all insured events that occurred during the term of the contract,
even if the loss is discovered after the end of the contract term. As a result, liability claims are settled over a long period of time, and a larger element
of the claims provision relates to incurred but not reported claims (IBNR).
The scheme pays benefit equivalent to the loss suffered by the
insured
Individual
and
corporate
risk
31 December 2016
Individual
savings
Individual
traditional
Individual
traditional
Group Life
Group
school fees
Group
credit life
Death only
Death only
Death with either Permanent
Disability & Critical Illness
options
Death only
Death of parent
Death and loss of job.
Accident-motor & general
accident, fire outbreak,
burglary and other hazards
Group Credit Life Assurance
1. Pays the account balance (contribution plus accrued interest) at
maturity to the policyholders.
2. In case of death during the policy, 10% of the total contribution
payable (subject to a minimum of NGN100,000) will be paid in
addition to the account balance at the point of death to the
beneficiary.
3. Should death arise as a result of accident, the plan will pay an
accidental death benefit of 200% of the total contribution payable
(subject to a max. of NGN5million) in addition to the amount paid
in (2) to the beneficiary.
Pays a lumpsum in case of death of any of the covered members.
Also gives back one full year premium for every five years that
there have been no claim on the policy.
Pays a lumpsum to the beneficiary should any of the coverered
events happens to the policyholder, dependiong on the option
chosen at inception.
1. The scheme will pay a benefit of NGN500,000.00 (subjected to
NGN1 million for a maximum of 2 lines) for a registered Airtel
subscribers.
2. Maximum age to enjoy total permanent disability is 70 years
thereafter a member shall only be insured for death benefit up to
the age of 80 years.
Individual
savings
Death only
RiskProduct Features
1. Pays the maturity benefit in 4 equal annual instalments to fund
the education of the ward.
2. In case of death before maturity, it pays a death benefit of 10%
of the Sum Assured (agreed benefit amount at inception) annually
subject to a maximum payout of the sum assured.
31 December 2016
Pays out tuition fees of student till completion of education in the
applicable institution from on death of parent.
73
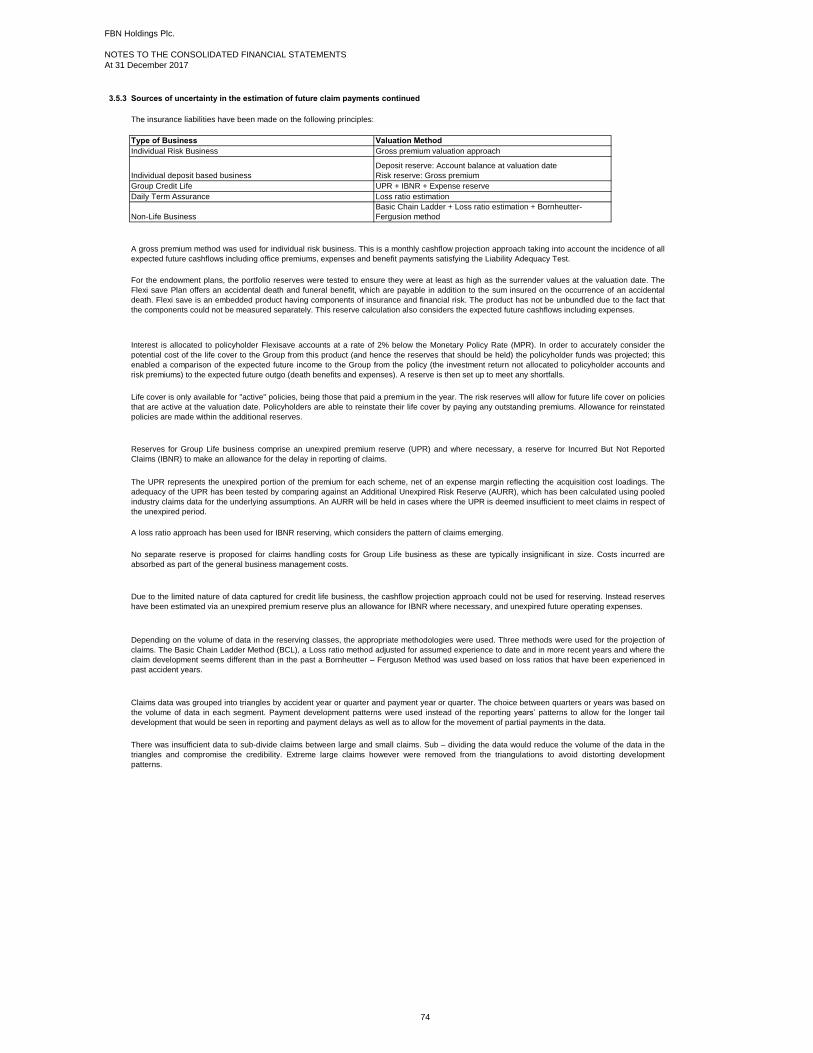
FBN Holdings Plc.
NOTES TO THE CONSOLIDATED FINANCIAL STATEMENTS
At 31 December 2017
3.5.3 Sources of uncertainty in the estimation of future claim payments continued
Individual business
Group business
Non-life business
Individual Risk Business
Non-Life Business
Basic Chain Ladder + Loss ratio estimation + Bornheutter-
Fergusion method
Due to the limited nature of data captured for credit life business, the cashflow projection approach could not be used for reserving. Instead reserves
have been estimated via an unexpired premium reserve plus an allowance for IBNR where necessary, and unexpired future operating expenses.
Life cover is only available for "active" policies, being those that paid a premium in the year. The risk reserves will allow for future life cover on policies
that are active at the valuation date. Policyholders are able to reinstate their life cover by paying any outstanding premiums. Allowance for reinstated
policies are made within the additional reserves.
Reserves for Group Life business comprise an unexpired premium reserve (UPR) and where necessary, a reserve for Incurred But Not Reported
Claims (IBNR) to make an allowance for the delay in reporting of claims.
The UPR represents the unexpired portion of the premium for each scheme, net of an expense margin reflecting the acquisition cost loadings. The
adequacy of the UPR has been tested by comparing against an Additional Unexpired Risk Reserve (AURR), which has been calculated using pooled
industry claims data for the underlying assumptions. An AURR will be held in cases where the UPR is deemed insufficient to meet claims in respect of
the unexpired period.
A loss ratio approach has been used for IBNR reserving, which considers the pattern of claims emerging.
Gross premium valuation approach
Group Credit Life
A gross premium method was used for individual risk business. This is a monthly cashflow projection approach taking into account the incidence of all
expected future cashflows including office premiums, expenses and benefit payments satisfying the Liability Adequacy Test.
UPR + IBNR + Expense reserve
Daily Term Assurance
Individual deposit based business
Deposit reserve: Account balance at valuation date
Risk reserve: Gross premium
The insurance liabilities have been made on the following principles:
Type of Business Valuation Method
Loss ratio estimation
For the endowment plans, the portfolio reserves were tested to ensure they were at least as high as the surrender values at the valuation date. The
Flexi save Plan offers an accidental death and funeral benefit, which are payable in addition to the sum insured on the occurrence of an accidental
death. Flexi save is an embedded product having components of insurance and financial risk. The product has not be unbundled due to the fact that
the components could not be measured separately. This reserve calculation also considers the expected future cashflows including expenses.
Interest is allocated to policyholder Flexisave accounts at a rate of 2% below the Monetary Policy Rate (MPR). In order to accurately consider the
potential cost of the life cover to the Group from this product (and hence the reserves that should be held) the policyholder funds was projected; this
enabled a comparison of the expected future income to the Group from the policy (the investment return not allocated to policyholder accounts and
risk premiums) to the expected future outgo (death benefits and expenses). A reserve is then set up to meet any shortfalls.
Depending on the volume of data in the reserving classes, the appropriate methodologies were used. Three methods were used for the projection of
claims. The Basic Chain Ladder Method (BCL), a Loss ratio method adjusted for assumed experience to date and in more recent years and where the
claim development seems different than in the past a Bornheutter – Ferguson Method was used based on loss ratios that have been experienced in
past accident years.
Claims data was grouped into triangles by accident year or quarter and payment year or quarter. The choice between quarters or years was based on
the volume of data in each segment. Payment development patterns were used instead of the reporting years’ patterns to allow for the longer tail
development that would be seen in reporting and payment delays as well as to allow for the movement of partial payments in the data.
There was insufficient data to sub-divide claims between large and small claims. Sub – dividing the data would reduce the volume of the data in the
triangles and compromise the credibility. Extreme large claims however were removed from the triangulations to avoid distorting development
patterns.
No separate reserve is proposed for claims handling costs for Group Life business as these are typically insignificant in size. Costs incurred are
absorbed as part of the general business management costs.
74
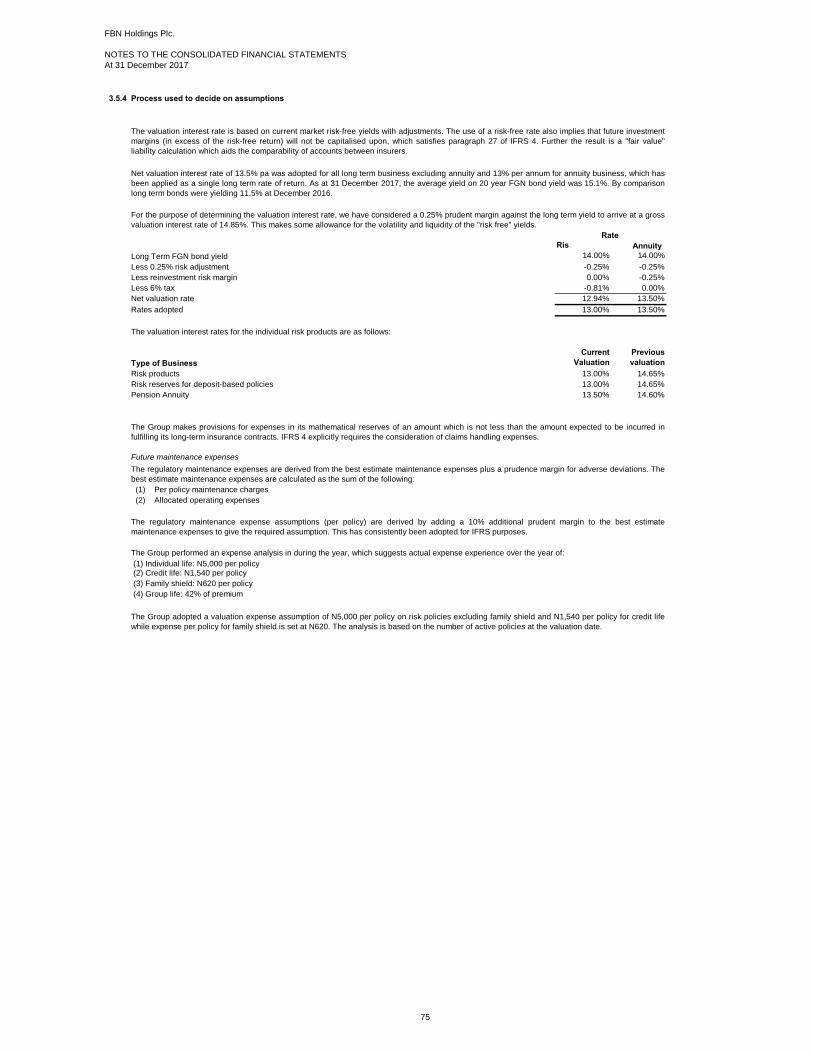
FBN Holdings Plc.
NOTES TO THE CONSOLIDATED FINANCIAL STATEMENTS
At 31 December 2017
3.5.4 Process used to decide on assumptions
Valuation interest rates
Risk Annuity
Long Term FGN bond yield 14.00% 14.00%
Less 0.25% risk adjustment -0.25% -0.25%
Less reinvestment risk margin 0.00% -0.25%
Less 6% tax -0.81% 0.00%
Net valuation rate 12.94% 13.50%
Rates adopted 13.00% 13.50%
Type of Business
Current
Valuation
Previous
valuation
Risk products 13.00% 14.65%
Risk reserves for deposit-based policies 13.00% 14.65%
Pension Annuity 13.50% 14.60%
Expenses
Future maintenance expenses
(1) Individual life: N5,000 per policy (2) Credit life: N1,540 per policy
(3) Family shield: N620 per policy
(4) Group life: 42% of premium
The valuation interest rate is based on current market risk-free yields with adjustments. The use of a risk-free rate also implies that future investment
margins (in excess of the risk-free return) will not be capitalised upon, which satisfies paragraph 27 of IFRS 4. Further the result is a "fair value"
liability calculation which aids the comparability of accounts between insurers.
Net valuation interest rate of 13.5% pa was adopted for all long term business excluding annuity and 13% per annum for annuity business, which has
been applied as a single long term rate of return. As at 31 December 2017, the average yield on 20 year FGN bond yield was 15.1%. By comparison
long term bonds were yielding 11.5% at December 2016.
For the purpose of determining the valuation interest rate, we have considered a 0.25% prudent margin against the long term yield to arrive at a gross
valuation interest rate of 14.85%. This makes some allowance for the volatility and liquidity of the "risk free" yields.
The valuation interest rates for the individual risk products are as follows:
Rate
(1) Per policy maintenance charges
(2) Allocated operating expenses
The regulatory maintenance expense assumptions (per policy) are derived by adding a 10% additional prudent margin to the best estimate
maintenance expenses to give the required assumption. This has consistently been adopted for IFRS purposes.
The Group performed an expense analysis in during the year, which suggests actual expense experience over the year of:
The regulatory maintenance expenses are derived from the best estimate maintenance expenses plus a prudence margin for adverse deviations. The
best estimate maintenance expenses are calculated as the sum of the following:
The Group makes provisions for expenses in its mathematical reserves of an amount which is not less than the amount expected to be incurred in
fulfilling its long-term insurance contracts. IFRS 4 explicitly requires the consideration of claims handling expenses.
The Group adopted a valuation expense assumption of N5,000 per policy on risk policies excluding family shield and N1,540 per policy for credit life
while expense per policy for family shield is set at N620. The analysis is based on the number of active policies at the valuation date.
75

FBN Holdings Plc.
NOTES TO THE CONSOLIDATED FINANCIAL STATEMENTS
At 31 December 2017
3.5.4 Process used to decide on assumptions continued
Expenses continued
Type of Business
Current
valuation
Previous
valuation
Individual Life N5,000 pp N4,200 pp
Credit Life N1,540 pp N550 pp
Family Shield N620 pp N770 pp
Expense Inflation
Mortality
Withdrawals
Lapses
Education and Cashflow
Year 1 25.0% -
Year 2 - 10.0%
Year 3 - 3.5%
Year 4 - 3.5%
Year 5+ - 3.5%
Bonuses
Group and Credit life businesses
An appropriate base table of standard mortality is chosen depending on the type of contract. An investigation into Group‟s experience over the most
recent three years is performed, and statistical methods are used to adjust the rates reflected in the table to a best estimate of mortality for that year.
The A67/70 (Assured Lives 1967-70) mortality table without adjustment was adopted in the valuation. A mortality study was conducted in 2011 using
industry mortality experience data which demonstrated a good fit to the A67/70 table.
For annuity, we have adopted the UK Pensioner table PA (90) with age rating of -1.
Withdrawals comprise both surrenders (voluntary) and lapses (involuntary). Surrenders are acceptable under the Cashflow and Flexisave Plans, after
policies have been in force for a pre-defined length of time (at which policies become eligible to receive a surrender value payout). Where eligible the
Flexisave surrender values are apportioned on the basis of sum insured.
Surrender rate was not applied in the current valuation however the reserves for the Cashflow Plans will be subjected to a minimum floor of the
surrender value at the valuation date.
Unexpired premium reserves (UPR) are reduced by a margin representing acquisition expenses, as these have been loaded into rates yet they have
already been incurred.
Acquisition expense ratio of 20% of gross premium was adopted. Group Life commission was paid at 9% of premium and a NAICOM (regulatory) fee
is payable at 1% of premium, stamp duty of 0.15% and management expenses.
Annuity valuation and Future mortality improvements
The valuation expense assumptions are as follows:
The above expenses are subject to inflation at 11% pa. Consumer Price Inflation at 31 December 2017 was 15.37%. We do not expect the current
high inflation levels to persist, moreso, we expect internal efficiencies to be put in place - hence our assumed low inflation rate.
We will make a full allowance for the accrual of future bonuses at the guaranteed (simple) bonus rate of 2% pa for the Cashflow Endowment.
iv. No specific adjustment has been made for expenses after premiums have ceased in the case of limited payment policies i.e. they have been
allocated the same level of expenses as premium paying policies.
vi. For all protection business any negative reserves were set to zero to prevent policies being treated as assets. Negatives reserves were permitted
for endowment plans for policies with no surrender value at the valuation date.
We have made an allowance for future lapses (being an exit without payment, before a surrender value becomes payable) and surrenders under the
endowment plans at the rates:
i. For individual policies the valuation age has been taken as Age Last Birthday at the valuation date. The period to maturity has been taken as the
full term of the policy less the expired term. Full credit has been taken for premiums due between the valuation date and the end of the premium
paying term.
ii. The valuation of the liabilities was made on the assumption that premiums have been credited to the accounts as they fall due, according to the
frequency of the particular payment.
iii. No specific adjustment has been made for immediate payment of claims.
vii. Any policies subject to substandard terms were valued using the same basis as standard policies.
Lapse Rate p.a Surrender Rate p.a
76

FBN Holdings Plc.
NOTES TO THE CONSOLIDATED FINANCIAL STATEMENTS
At 31 December 2017
3.5.4 Process used to decide on assumptions continued
Group and Credit life businesses continued
Reinsurance agreements
Changes in assumptions
3.5.5 Insurance and Market risk sensitivities
a) Valuation interest (discount) rate +/-1%
b) Expenses +/- 10%
c) Expense inflation +/-2%
d) Mortality +/-5% (including Group Life)
2017 Base
N'million 1% -1% 10% -10% 2% -2%
Individual Risk Reserves 9,341 7,526 11,617 9,736 8,953 9,706 9,058
PRA Regulated Annuities 7,431 7,028 7,885 7,446 7,418 7,469 7,405
Investment linked contracts 13,399 13,399 13,399 13,399 13,399 13,399 13,399 General business – UPR incl AURR 1,182 1,182 1,182 1,182 1,182 1,182 1,182 Group life – UPR incl AURR 554 554 554 554 554 554 554 Group Life - IBNR 21 21 21 21 21 21 21 Additional reserves 1,670 1,670 1,670 1,670 1,670 1,670 1,670 Reinsurance 222 222 222 222 222 222 222
Net Liability 33,820 31,602 36,550 34,230 33,419 34,223 33,511
% change in Net Liability -6.6% 8.1% 1.2% -1.2% 1.2% -0.9%
Assets 7,620 7,620 7,620 7,620 7,620 7,620 7,620
Surplus (26,200) (23,982) (28,930) (26,609) (25,798) (26,602) (25,891)
2016
10%Expense overrun
Worsening of mortality experience
0%
The following assumptions were adopted for the credit life valuation:
(i) Where no effective (start) date has been provided, we assumed the credit date.
(ii) Where no end date or tenor has been provided we assumed a tenor of 30 months; this is in line with the average policy term where data has been
provided
2017
No additional contingency reserves was made in addition to those provided for long term business to be held. Other liabilities such as expense and
data contingencies reserves has been estimated as necessary using the information available and reported in the main valuation. Assumptions used
for these estimates are summarised in the table below:
(iii) The UPR was based on the net premiums, where net premiums are reported after the deduction of commission. Commission is currently payable
at 40% of premium.
VIR
(iv) The IBNR was estimated based on an average claims notification delay period of 3 months, which was derived from the claims experience data.
0% 10%
All Business Group
Reinsurance is allowed for in the valuation by having gross and reinsurance ceded records in the policy files. All reserves has been reported gross of
reinsurance, with the value of the reinsurance asset reported separately.
The Company did not change its assumptions for the insurance contracts.
The sensitivity analysis of insurance and market risk is used as it provides a detailed understanding of the risks inherent in the business and to help
develop a risk monitoring and management framework to ensure the risks remain within limits, taking into account the available capital and
shareholder risk tolerance levels.
The "Assumption Changes" component of the analysis of change in the table below shows the impact on liabilities of the actual assumption changes
made over the year.
Expenses Expense inflation
The sensitivity analysis was performed using the under-listed variables:
77

FBN Holdings Plc.
NOTES TO THE CONSOLIDATED FINANCIAL STATEMENTS
At 31 December 2017
3.5.5 Insurance and Market risk sensitivities continued
2017 Base
N'million 5% -5%
Individual Risk Reserves 9,341 9,420 9,262
PRA Regulated Annuities 7,431 7,457 7,408 Investment linked contracts 13,399 13,399 13,399 General business – UPR incl AURR 1,182 1,182 1,182 Group life – UPR incl AURR 554 554 554 Group Life - IBNR 21 21 21 Additional reserves 1,670 1,670 1,670 Reinsurance 222 222 222
Net Liability 33,819 33,925 33,719
% change in Net Liability 0.3% -0.3%
Assets 7,620 7,620 7,620
Surplus (26,200) (26,305) (26,098)
2016 Base
N'million 1% -1% 10% -10% 2% -2%
Individual Risk Reserves 6,207 5,147 7,700 6,494 5,860 7,007 5,864
PRA Regulated Annuities 1,519 1,441 1,607 1,522 1,517 1,526 1,515
Investment linked contracts 9,440 9,440 9,440 9,440 9,440 9,440 9,440
General business – UPR incl AURR 1,003 1,003 1,003 1,003 1,003 1,003 1,003
Group life – UPR incl AURR 152 152 152 152 152 152 152
Group Life - IBNR 362 362 362 362 362 0 362
Additional reserves 0 0 0 0 0 0 0
Reinsurance 35 35 35 35 35 35 35
Net Liability 18,719 17,580 20,299 19,008 18,368 19,163 18,371
% change in Net Liability -6.4% 8.9% 1.6% -2.0% 4.6% -2.0%
Assets 26,769 26,773 26,773 26,773 26,773 26,773 26,773
Surplus 8,051 9,193 6,474 7,765 8,405 7,611 8,402
2016 Base
N'million 5% -5%
Individual Risk Reserves 6,207 6,282 6,134
PRA Regulated Annuities 1,519 1,524 1,515
Investment linked contracts 9,440 9,440 9,440
General business – UPR incl AURR 1,003 1,003 1,003
Group life – UPR incl AURR 152 152 152
Group Life - IBNR 362 362 362
Additional reserves 0 0 0
Reinsurance 35 35 35
Net Liability 18,718 18,798 18,642
% change in Net Liability 0.4% -0.4%
Assets 26,769 26,773 26,773
Surplus 8,051 7,975 8,132
Mortality
Mortality
VIR Expenses Expense inflation
The expense sensitivity result shows the impact of reducing and increasing maintenance & acquisition expenses rates to 90% and 110% respectively
of the base rates. Valuation interest rate sensitivity result shows the impact of reducing and increasing valuation interest rate to 99% and 101%
respectively of the base rates.
78
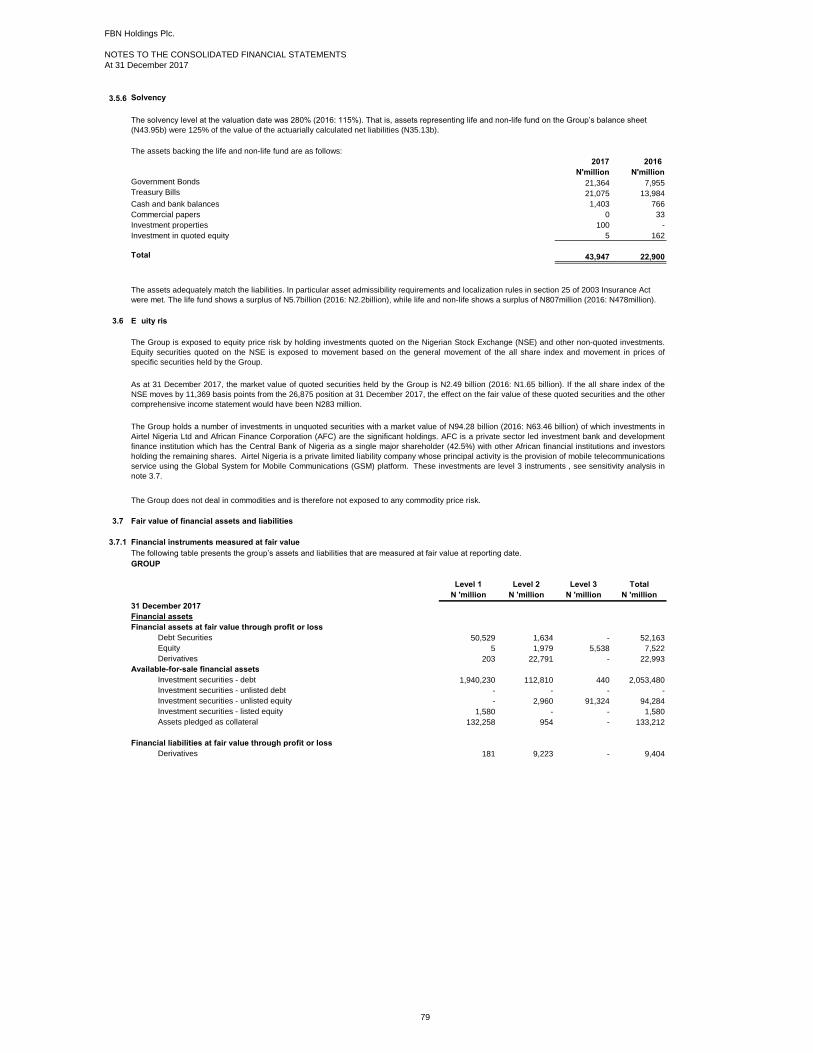
FBN Holdings Plc.
NOTES TO THE CONSOLIDATED FINANCIAL STATEMENTS
At 31 December 2017
3.5.6 Solvency
2017 2016
N'million N'million
Government Bonds 21,364 7,955Treasury Bills 21,075 13,984
1,403 766
Commercial papers 0 33
Investment properties 100 -
Investment in quoted equity 5 162
Total 43,947 22,900
3.6 Equity risk
3.7 Fair value of financial assets and liabilities
3.7.1 Financial instruments measured at fair value
GROUP
Level 1 Level 2 Level 3 Total
N 'million N 'million N 'million N 'million
31 December 2017
Financial assets
Financial assets at fair value through profit or loss
Debt Securities 50,529 1,634 - 52,163
Equity 5 1,979 5,538 7,522
Derivatives 203 22,791 - 22,993
Available-for-sale financial assets
Investment securities - debt 1,940,230 112,810 440 2,053,480
Investment securities - unlisted debt - - - -
Investment securities - unlisted equity - 2,960 91,324 94,284
Investment securities - listed equity 1,580 - - 1,580
Assets pledged as collateral 132,258 954 - 133,212
Financial liabilities at fair value through profit or loss
Derivatives 181 9,223 - 9,404
The Group is exposed to equity price risk by holding investments quoted on the Nigerian Stock Exchange (NSE) and other non-quoted investments.
Equity securities quoted on the NSE is exposed to movement based on the general movement of the all share index and movement in prices of
specific securities held by the Group.
As at 31 December 2017, the market value of quoted securities held by the Group is N2.49 billion (2016: N1.65 billion). If the all share index of the
NSE moves by 11,369 basis points from the 26,875 position at 31 December 2017, the effect on the fair value of these quoted securities and the other
comprehensive income statement would have been N283 million.
The Group holds a number of investments in unquoted securities with a market value of N94.28 billion (2016: N63.46 billion) of which investments in
Airtel Nigeria Ltd and African Finance Corporation (AFC) are the significant holdings. AFC is a private sector led investment bank and development
finance institution which has the Central Bank of Nigeria as a single major shareholder (42.5%) with other African financial institutions and investors
holding the remaining shares. Airtel Nigeria is a private limited liability company whose principal activity is the provision of mobile telecommunications
service using the Global System for Mobile Communications (GSM) platform. These investments are level 3 instruments , see sensitivity analysis in
note 3.7.
The Group does not deal in commodities and is therefore not exposed to any commodity price risk.
The following table presents the group’s assets and liabilities that are measured at fair value at reporting date.
The assets backing the life and non-life fund are as follows:
Cash and bank balances
The assets adequately match the liabilities. In particular asset admissibility requirements and localization rules in section 25 of 2003 Insurance Act
were met. The life fund shows a surplus of N5.7billion (2016: N2.2billion), while life and non-life shows a surplus of N807million (2016: N478million).
The solvency level at the valuation date was 280% (2016: 115%). That is, assets representing life and non-life fund on the Group’s balance sheet
(N43.95b) were 125% of the value of the actuarially calculated net liabilities (N35.13b).
79

FBN Holdings Plc.
NOTES TO THE CONSOLIDATED FINANCIAL STATEMENTS
At 31 December 2017
3.7.1 Financial instruments measured at fair value continued
Level 1 Level 2 Level 3 Total
N 'million N 'million N 'million N 'million
31 December 2016
Financial assets at fair value through profit or loss
Debt Securities 24,522 1,484 - 26,006
Equity 286 1,761 3,481 5,528
Derivatives - 15,177 - 15,177
Available-for-sale financial assets
Investment securities - debt 813,286 48,195 527 862,008
Investment securities - unlisted debt 776,754 24,530 - 801,284
Investment securities - unlisted equity - 3,262 55,120 58,382
Investment securities - listed equity 1,362 - - 1,362
Assets pledged as collateral 103,329 - - 103,329
Financial liabilities at fair value through profit or loss
Derivatives - 37,137 - 37,137
COMPANY
31 December 2017
Financial assets
Available-for-sale financial assets
Investment securities - debt 6,990 - - 6,990
Investment securities - unlisted equity - 2,852 - 2,852
31 December 2016
Financial assets
Available-for-sale financial assets
Investment securities - debt 9,517 - - 9,517
Investment securities - unlisted equity - 2,834 - 2,834
(a) Financial instruments in level 1
(b) Financial instruments in level 2
(c) Financial instruments in level 3
The following table presents changes in level 3 instruments
GROUP
At 1 January 2016 49,217
Acquisitions 1,026
Total Gains/(losses) recognised through profit/loss 653
Total Gains/(losses) recognised through OCI 8,199
Transfer into Level 3 due to change in observability of market data 33
At 31 December 2016 59,128
Acquisitions 2,118
Total Gains/(losses) recognised through profit/loss - 94
Total Gains/(losses) recognised through OCI 33,648
Transfer into Level 3 due to change in observability of market data 2,503
At 31 December 2017 97,302
During the year ended 31 December 2017, there was no transfers between level 1 and 2 fair value measurements. There were no material transfers
from/to level 3.
Transfers in and out of level 3 instruments are recognised on the date of the event or change in circumstances that caused the transfer.
The fair value of financial instruments traded in active markets is based on quoted market prices at the balance sheet date. A market is regarded as
active if quoted prices are readily and regularly available from an exchange, dealer, broker, industry group, pricing service, or regulatory agency, and
those prices represent actual and regularly occurring market transactions on an arm’s length basis. The quoted market price used for financial assets
held by the group is the current bid price. These instruments are included in Level 1. Instruments included in Level 1 comprise primarily bonds and
equity investments classified as trading securities or available for sale.
The fair value of financial instruments that are not traded in an active market (for example, over-the-counter derivatives) is determined by using
valuation techniques. These valuation techniques maximise the use of observable market data where it is available and rely as little as possible on
entity specific estimates. If all significant inputs required to fair value an instrument are observable, the instrument is included in level 2.
If one or more of the significant inputs is not based on observable market data, the instrument is included in Level 3.
Specific valuation techniques used to value financial instruments include:
a) Quoted market prices or dealer quotes for similar instruments;
b) The fair value of forward foreign exchange contracts is determined using forward exchange rates at the balance sheet date, with the resulting value
discounted back to present value;
c) Other techniques, such as discounted cash flow analysis, sales prices of comparable properties in close proximity , are used to determine fair
value for the remaining financial instruments.
Note that all of the resulting fair value estimates are included in Level 2 except for certain unquoted equities and equity derivatives explained below.
Total gains or losses for the period included in profit or loss are presented in 'Net gains/(losses) from investment securities.
Inputs for the asset or liability in this fair value hierarchy are not based on observable market data (unobservable inputs). This level includes equity
investments with significant unobservable components.
80

FBN Holdings Plc.
NOTES TO THE CONSOLIDATED FINANCIAL STATEMENTS
At 31 December 2017
3.7.1 Financial instruments measured at fair value continued
Information about the fair value measurements using significant unobservable Inputs (Level 3)
Valuation
technique
Fair Values
33,016
34,005
32,026
3,576
3,666
3,487
585
600
570
46,901
48,074
45,729
778
798
759
1,865
1,912
1,818
524
537
511
3,242
3,323
3,160
1,784
1,829
1,739
3.7.2 Group's valuation process
Assumption
AIRTEL NIGERIA
The equity sensitivity measures the impact of a +/- 250bps movements in the comparative companies. The sensitivity of the fair values of investment
in unlisted equites to changes in the P/E multiples and /or EBITDA of the comparative companies as at 31st December, 2017 is as shown in the below
table:
Range of Unobservable
Input(probability-weighted
average)
AVERY ROW CAPITAL GP NET ASSET
VALUATION
Investment Valuation Base
Sensitivity of +2.5%
Sensitivity of -2.5%
EV/EBITDA, P/B valuation or P/E valuation multiple - the group determines appropriate comparable public company/ies based on industry, size,
developmental stage, revenue generation and strategy. The group then calculates a trading multiple for each comparable company identified. The
multiple is calculated by either dividing the enterprise value of the comparable company by its earning before interest, tax, depreciation and
amortisation (EBITDA), or dividing the quoted price of the comparable company by its net income (P/E). The trading multiple is then adjusted for
discounts/premiums with regards to such consideration as illiquidity and other differences, advantages and disadvantages between the group's
investee company and the comparable public companies based on company-specific facts and circumstances.
Income approach (discounted cashflow) - the group determines the free cash flow of the investee company, and discounts these cashflows using the
relevant cost of equity. The cost of equity is derived by adjusting the yield on the risk free securites (FGN Bonds) with the equity risk premium and
company/sector specific premium. The present value derived from the calculation represents the investee company's enterprise value.
A sensitivity of +/-2.5% results in changes in fair value of unlisted equities and this will impact on other comprehensive income.
The Group's asset liability management (ALM) unit performs the valuation of financial assets required for financial reporting purposes. This team also
engages external specialist valuers when the need arises, and reports directly to the Chief Risk Officer. Discussions on the valuation process and
results are held between the ALM team and the Chief Risk Officer on a monthly basis in line with the group's management reporting dates.
P/E multiples Base
Sensitivity of +2.5%
Sensitivity of -2.5%
Base
Sensitivity of +2.5%
Sensitivity of -2.5%
CAPE II & CAPE III EV/EBITDA,
DCF
EV/EBITDA
Cash flows
Exit proceeds
Base
Sensitivity of +2.5%
Sensitivity of -2.5%
19.2% illiquidity discount EV/EBITDA Base
Sensitivity of +2.5%
Sensitivity of -2.5%
Market
Approach
ANCHORAGE LEISURES (RADISSON BLU)
RESOURCERY PLC (Ordinary shares) NASD price Base
Sensitivity of +2.5%
Sensitivity of -2.5%
Description
UNIFIED PAYMENT SYSTEMS Base
Sensitivity of +2.5%
Sensitivity of -2.5%
20% illiquidity discount
25% illiquidity discount
15% illiquidity discount
10% illiquidity discount
Sensitivity of +2.5%
Sensitivity of -2.5%
P/B multiples
P/E multiples
NIBSS PLC
AFREXIM BANK LTD
AFRICA FINANCE CORPORATION Base
Sensitivity of +2.5%
Sensitivity of -2.5%
EV/EBITDA Base
81
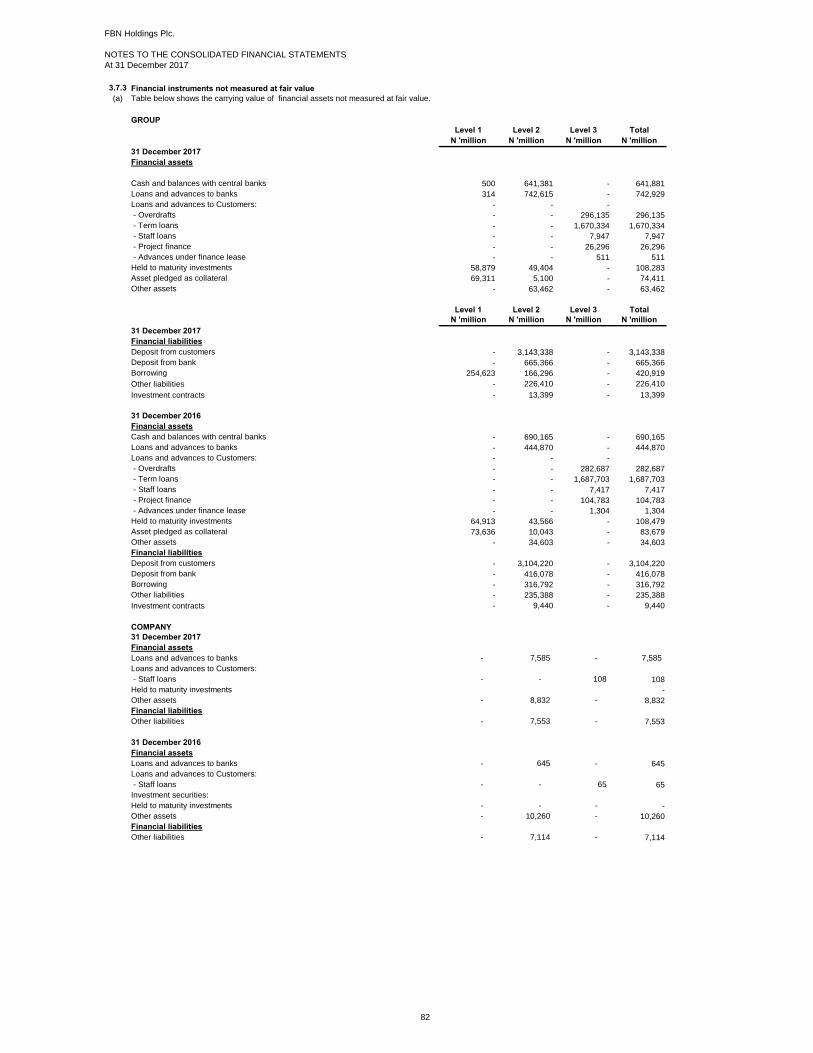
FBN Holdings Plc.
NOTES TO THE CONSOLIDATED FINANCIAL STATEMENTS
At 31 December 2017
3.7.3 Financial instruments not measured at fair value
(a) Table below shows the carrying value of financial assets not measured at fair value.
GROUP
Level 1 Level 2 Level 3 Total
N 'million N 'million N 'million N 'million
31 December 2017
Financial assets
Cash and balances with central banks 500 641,381 - 641,881
Loans and advances to banks 314 742,615 - 742,929
Loans and advances to Customers: - - -
- Overdrafts - - 296,135 296,135
- Term loans - - 1,670,334 1,670,334
- Staff loans - - 7,947 7,947
- Project finance - - 26,296 26,296
- Advances under finance lease - - 511 511
Held to maturity investments 58,879 49,404 - 108,283
Asset pledged as collateral 69,311 5,100 - 74,411
Other assets - 63,462 - 63,462
Level 1 Level 2 Level 3 Total
N 'million N 'million N 'million N 'million
31 December 2017
Financial liabilities
Deposit from customers - 3,143,338 - 3,143,338
Deposit from bank - 665,366 - 665,366
Borrowing 254,623 166,296 - 420,919
Other liabilities - 226,410 - 226,410
Investment contracts - 13,399 - 13,399
31 December 2016
Financial assets
Cash and balances with central banks - 690,165 - 690,165
Loans and advances to banks - 444,870 - 444,870
Loans and advances to Customers: - - -
- Overdrafts - - 282,687 282,687
- Term loans - - 1,687,703 1,687,703
- Staff loans - - 7,417 7,417
- Project finance - - 104,783 104,783
- Advances under finance lease - - 1,304 1,304
Held to maturity investments 64,913 43,566 - 108,479
Asset pledged as collateral 73,636 10,043 - 83,679
Other assets - 34,603 - 34,603
Financial liabilities
Deposit from customers - 3,104,220 - 3,104,220
Deposit from bank - 416,078 - 416,078
Borrowing - 316,792 - 316,792
Other liabilities - 235,388 - 235,388
Investment contracts - 9,440 - 9,440
COMPANY
31 December 2017
Financial assets
Loans and advances to banks - 7,585 - 7,585
Loans and advances to Customers:
- Staff loans - - 108 108
Held to maturity investments -
Other assets - 8,832 - 8,832
Financial liabilities
Other liabilities - 7,553 - 7,553
31 December 2016
Financial assets
Loans and advances to banks - 645 - 645
Loans and advances to Customers:
- Staff loans - - 65 65
Investment securities:
Held to maturity investments - - - -
Other assets - 10,260 - 10,260
Financial liabilities
Other liabilities - 7,114 - 7,114
82

FBN Holdings Plc.
NOTES TO THE CONSOLIDATED FINANCIAL STATEMENTS
At 31 December 2017
(b)
Carrying Fair Carrying Fair
value value value value
N 'million N 'million N 'million N 'million
GROUP
Financial assets
Loans and advances to customers
Fixed rate loans 46,668 44,833 48,597 44,525
Variable rate loans 1,954,555 2,018,818 2,035,297 2,035,298
Investment securities (held to maturity) 108,284 96,875 108,479 93,472
Asset pledged as collateral 74,411 53,036 83,679 60,582
Loan commitments 8,262 8,262 14,203 14,203
Financial liability
Borrowings 420,919 418,062 316,792 272,774
Cash and balances with Central banks
Loans and advances to banks
Other assets (excluding prepayments)
Deposits from banks
Deposits from customers
Liability on investment contracts
Other liabilities (excluding provisions and accruals)
The carrying value of the following financial assets and liabilities for both the company and group approximate their fair values:
The fair value of loans and advances to customers (including loan commitments) and investment securities are as follows:
At 31st December 2017 At 31st December 2016
Investment securities have been fair valued using the market prices and is within level 1 of the fair value hierarchy.
Loans and advances to customers have been fair valued using average benchmarked lending rates which are adjusted to specific entity risks based
on history of losses.
Borrowings which are listed on stock exchange are fair valued using market prices and are within level 1 of the fair value heirarchy while other
borrowings are fair valued using valuation techniques and are within level 2 of the fair value heirarchy.
83
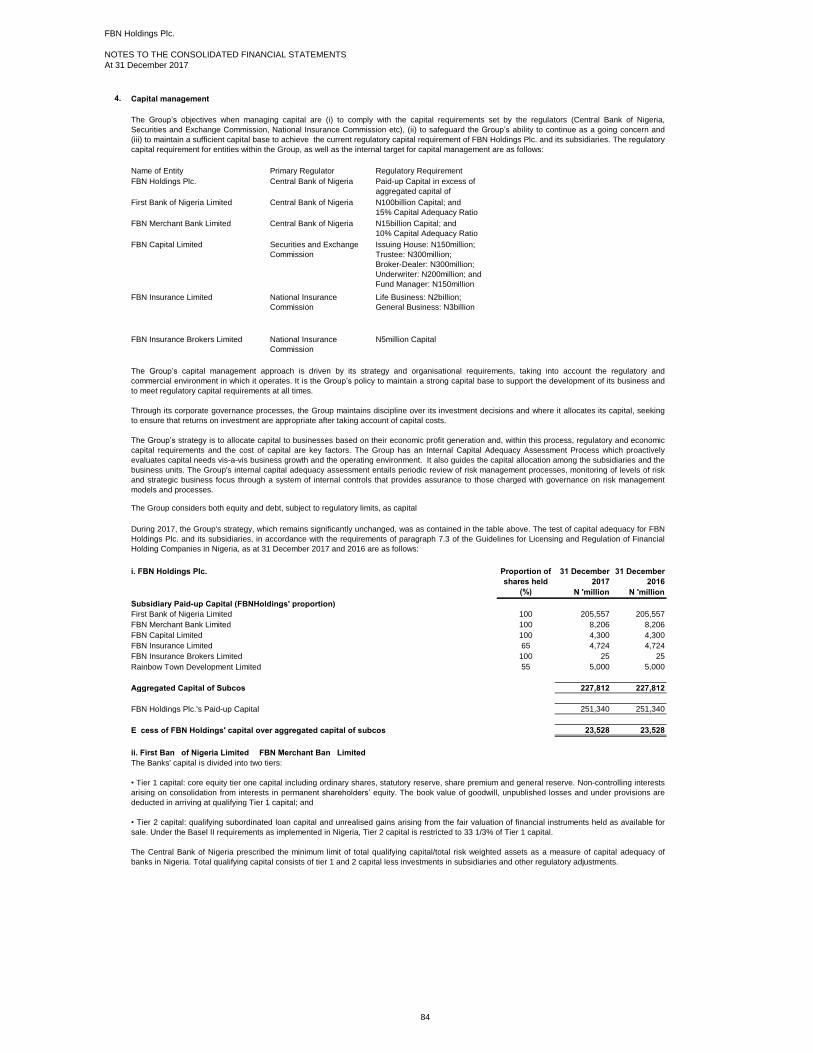
FBN Holdings Plc.
NOTES TO THE CONSOLIDATED FINANCIAL STATEMENTS
At 31 December 2017
4.
Name of Entity
FBN Holdings Plc.
First Bank of Nigeria Limited
FBN Merchant Bank Limited
FBN Capital Limited
FBN Insurance Limited
FBN Insurance Brokers Limited
i. FBN Holdings Plc. 31 December
2017
31 December
2016
N 'million N 'million
Subsidiary Paid-up Capital (FBNHoldings' proportion)
First Bank of Nigeria Limited 100 205,557 205,557
FBN Merchant Bank Limited 100 8,206 8,206
FBN Capital Limited 100 4,300 4,300
FBN Insurance Limited 65 4,724 4,724
FBN Insurance Brokers Limited 100 25 25
Rainbow Town Development Limited 55 5,000 5,000
Aggregated Capital of Subcos 227,812 227,812
FBN Holdings Plc.'s Paid-up Capital 251,340 251,340
Excess of FBN Holdings' capital over aggregated capital of subcos 23,528 23,528
ii. First Bank of Nigeria Limited & FBN Merchant Bank Limited
The Group’s objectives when managing capital are (i) to comply with the capital requirements set by the regulators (Central Bank of Nigeria,
Securities and Exchange Commission, National Insurance Commission etc), (ii) to safeguard the Group’s ability to continue as a going concern and
(iii) to maintain a sufficient capital base to achieve the current regulatory capital requirement of FBN Holdings Plc. and its subsidiaries. The regulatory
capital requirement for entities within the Group, as well as the internal target for capital management are as follows:
The Group’s capital management approach is driven by its strategy and organisational requirements, taking into account the regulatory and
commercial environment in which it operates. It is the Group’s policy to maintain a strong capital base to support the development of its business and
to meet regulatory capital requirements at all times.
Through its corporate governance processes, the Group maintains discipline over its investment decisions and where it allocates its capital, seeking
to ensure that returns on investment are appropriate after taking account of capital costs.
The Group’s strategy is to allocate capital to businesses based on their economic profit generation and, within this process, regulatory and economic
capital requirements and the cost of capital are key factors. The Group has an Internal Capital Adequacy Assessment Process which proactively
evaluates capital needs vis-a-vis business growth and the operating environment. It also guides the capital allocation among the subsidiaries and the
business units. The Group's internal capital adequacy assessment entails periodic review of risk management processes, monitoring of levels of risk
and strategic business focus through a system of internal controls that provides assurance to those charged with governance on risk management
models and processes.
Primary Regulator
Capital management
Central Bank of Nigeria
During 2017, the Group's strategy, which remains significantly unchanged, was as contained in the table above. The test of capital adequacy for FBN
Holdings Plc. and its subsidiaries, in accordance with the requirements of paragraph 7.3 of the Guidelines for Licensing and Regulation of Financial
Holding Companies in Nigeria, as at 31 December 2017 and 2016 are as follows:
The Banks' capital is divided into two tiers:
• Tier 1 capital: core equity tier one capital including ordinary shares, statutory reserve, share premium and general reserve. Non-controlling interests
arising on consolidation from interests in permanent shareholders’ equity. The book value of goodwill, unpublished losses and under provisions are
deducted in arriving at qualifying Tier 1 capital; and
• Tier 2 capital: qualifying subordinated loan capital and unrealised gains arising from the fair valuation of financial instruments held as available for
sale. Under the Basel II requirements as implemented in Nigeria, Tier 2 capital is restricted to 33 1/3% of Tier 1 capital.
The Central Bank of Nigeria prescribed the minimum limit of total qualifying capital/total risk weighted assets as a measure of capital adequacy of
banks in Nigeria. Total qualifying capital consists of tier 1 and 2 capital less investments in subsidiaries and other regulatory adjustments.
The Group considers both equity and debt, subject to regulatory limits, as capital
Securities and Exchange
Commission
Proportion of
shares held
(%)
National Insurance
Commission
National Insurance
Commission
Regulatory Requirement
Paid-up Capital in excess of
aggregated capital of
N100billion Capital; and
15% Capital Adequacy Ratio
N15billion Capital; and
10% Capital Adequacy Ratio
N5million Capital
Life Business: N2billion;
General Business: N3billion
Issuing House: N150million;
Trustee: N300million;
Broker-Dealer: N300million;
Underwriter: N200million; and
Fund Manager: N150million
Central Bank of Nigeria
Central Bank of Nigeria
84

FBN Holdings Plc.
NOTES TO THE CONSOLIDATED FINANCIAL STATEMENTS
At 31 December 2017
31 December
2017
31 December
2016
31 December
2017
31 December
2016
N 'million N 'million N 'million N 'million
Tier 1 capital
Share capital 4,302 4,302 16,316 16,316
Share premium 3,905 3,905 189,241 189,241
Statutory reserve 7,174 6,561 77,786 70,748
SMEEIS reserves - - 6,076 6,076
Retained earnings 9,570 14,014 173,487 153,924
Less: Goodwill/Deferred Tax (12,431) (9,774) (7,207) (6,890)
Less: Loan to subsidiary (excess over single obligor limit) - - - -
Less: Investment in subsidiaries - - (35,954) (35,649)
Total qualifying for tier 1 capital 12,519 19,008 419,746 393,766
Tier 2 capital
Fair value reserve (421) (2,417) 76,107 29,102
Other borrowings - - 129,152 233,976
(421) (2,417) 205,259 263,078
Tier 2 Capital Restriction (421) (2,417) 151,900 143,138
Less: Investment in subsidiaries - - (35,954) (35,649)
(421) (2,417) 115,946 107,490
Total regulatory capital 12,098 16,591 535,692 501,256
Total risk-weighted assets 76,929 73,431 3,019,880 2,818,158
Risk-weighted Capital Adequacy Ratio (CAR) 15.73% 22.59% 17.74% 17.79%
Tier 1 CAR 16.27% 25.88% 13.90% 13.97%
iii. Other Regulated Subsidiaries
Regulatory
Requirement31 December
2017
Excess/
(Shortfall)31 December
2016
Excess/
(Shortfall)
N 'million N 'million N 'million N 'million N 'million
FBN Capital Limited 1,100 16,802 15,702 15,514 14,414
FBN Insurance Limited:
Life Business 2,000 10,556 8,556 7,784 5,784
General Business 3,000 4,109 1,109 4,109 1,109
FBN Insurance Brokers Limited 5 356 351 331 326
All the regulated entities within the Group complied with all the regulatory capital requirements to which they were subjected.
Total tier 2 capital
FBN MERCHANT BANK FIRST BANK OF NIGERIA
Total qualifying for tier 2 capital
The table below summarises the Basel II capital adequacy ratio for 2017 and 2016. It shows the composition of regulatory capital and ratios for the
years. During those years, the Banks complied with all the regulatory capital requirements to which it was subjected.
85
FBN Holdings Plc.
NOTES TO THE CONSOLIDATED FINANCIAL STATEMENTS
At 31 December 2017
5 Significant accounting judgements, estimates and assumptions
a Impairment charges on financial assets
b Fair value of financial instruments
c Held-to-maturity investments
The estimation of impairment losses is subject to uncertainty, which has increased in the current economic environment, and is
highly sensitive to factors such as the level of economic activity, unemployment rates, property price trends, and interest rates. The
assumptions underlying this judgement are highly subjective. The methodology and the assumptions used in calculating
impairment losses are reviewed regularly in the light of differences between loss estimates and actual loss experience. See note 3
for more information.
The Group’s financial statements and its financial result are influenced by accounting policies, assumptions, estimates and
management judgement, which necessarily have to be made in the course of preparation of the consolidated financial statements.
The Group makes estimates and assumptions that affect the reported amounts of assets and liabilities within the next financial
year. All estimates and assumptions required in conformity with IFRS are best estimates undertaken in accordance with the
applicable standard. Estimates and judgements are evaluated on a continuous basis, and are based on past experience and other
factors, including expectations with regard to future events. Accounting policies and management’s judgements for certain items
are especially critical for the Group’s results and financial situation due to their materiality.
The Group reviews its loan portfolios for impairment on an on-going basis. The Group first assesses whether objective evidence of
impairment exists individually for financial assets that are individually significant, and individually or collectively for financial assets
that are not individually significant. Impairment provisions are also recognised for losses not specifically identified but which,
experience and observable data indicate, are present in the portfolio at the date of assessment. For individually significant financial
assets that has been deemed to be impaired, management has deemed that cashflow from collateral obtained would arise within
24 months where the financial asset is collaterized.
Management uses estimates based on historical loss experience for assets with credit risk characteristics and objective evidence
of impairment similar to those in the portfolio, when scheduling its future cash flows. The methodology and assumptions used for
estimating both the amount and timing of future cash flows are reviewed regularly to reduce any differences between loss
estimates and actual loss experience.
The use of historical loss experience is supplemented with significant management judgment to assess whether current economic
and credit conditions are such that the actual level of inherent losses is likely to differ from that suggested by historical experience.
In normal circumstances, historical experience provides objective and relevant information from which to assess inherent loss
within each portfolio. In other circumstances, historical loss experience provides less relevant information about the inherent loss
in a given portfolio at the balance sheet date, for example, where there have been changes in economic conditions such that the
most recent trends in risk factors are not fully reflected in the historical information. In these circumstances, such risk factors are
taken into account when calculating the appropriate levels of impairment allowances, by adjusting the impairment loss derived
solely from historical loss experience.
The detailed methodologies, areas of estimation and judgement applied in the calculation of the Group’s impairment charge on
financial assets are set out in the Financial risk management section.
The fair value of financial instruments where no active market exists or where quoted prices are not otherwise available are
determined by using valuation techniques. In these cases, the fair values are estimated from observable data in respect of similar
financial instruments or using models. Where market observable inputs are not available, they are estimated based on appropriate
assumptions.
Where valuation techniques (for example, models) are used to determine fair values, they are validated and periodically reviewed
by qualified personnel independent of those that sourced them. All models are certified before they are used, and models are
calibrated to ensure that outputs reflect actual data and comparative market prices. To the extent practical, models use only
observable data; however, areas such as credit risk (both own credit risk and counterparty risk), volatilities and correlations require
management to make estimates.
Changes in assumptions about these factors could affect the reported fair value of financial instruments. All fair values are on a
recurring basis. Refer to Note 3.7 for additional sensitivity information for financial instruments.
In accordance with IAS 39 guidance, the Group classifies some non-derivative financial assets with fixed or determinable
payments and fixed maturity as held to maturity. This classification requires significant judgement. In making this judgement, the
Group evaluates its intention and ability to hold such investments to maturity. If the Group were to fail to keep these investments to
maturity other than for the specific circumstances – for example, selling an insignificant amount close to maturity – the Group is
required to reclassify the entire category as available for sale. Accordingly, the investments would be measured at fair value
instead of amortised cost. During the year, the held to maturity investment portfolio was not tainted.
86

FBN Holdings Plc.
NOTES TO THE CONSOLIDATED FINANCIAL STATEMENTS
At 31 December 2017
5 Significant accounting judgements, estimates and assumptions continued
d Retirement benefit obligation
e Impairment of Goodwill
f Valuation of Insurance Contract Liabilities
The determination of the liabilities under long-term insurance contracts is dependent on estimates made by the Group. Estimates
are made as to the expected number of deaths for each of the years in which the Group is exposed to risk.
The Group bases these estimates on standard industry and national mortality tables that reflect recent historical mortality
experience, adjusted where appropriate to reflect the Group’s own experience. For contracts that insure the risk of longevity,
appropriate allowance is made for expected mortality improvements.
The estimated number of deaths determines the value of the benefit payments and the value of the valuation premiums. The main
source of uncertainty is that epidemics such as AIDS, and wide-ranging lifestyle changes, such as in eating, smoking and exercise
habits, could result in future mortality being significantly worse than in the past for the age groups in which the Group has
significant exposure to mortality risk.
However, continuing improvements in medical care and social conditions could result in improvements in longevity in excess of
those allowed for in the estimates used to determine the liability for contracts where the Group and Company are exposed to
longevity risk. Were the numbers of deaths in future years to differ by +/- 5% from management’s estimate, the liability would
increase by N32.1 million or decrease by N31.9 million (2016: N79 million and N77.7 million respectively). For contracts without
fixed terms, it is assumed that the Company will be able to increase mortality risk charges in future years in line with emerging
mortality experience.
Estimates are also made as to future investment income arising from the assets backing long-term insurance contracts. These
estimates are based on current market returns, as well as expectations about future economic and financial developments. The
average estimated rate of investment return is 13.5%. If the average future investment returns differed by -/+ 1% from
management’s estimates, the contract liability would increase by N34.7million or decrease by N29.8million (2016: N1.58million and
N1.31million respectively).
There was no impairment charge during the year (2016: Nil).
For defined benefit pension plans, the measurement of the group’s benefit obligation and net periodic pension cost/(income)
requires the use of certain assumptions, including, among others, estimates of discount rates and expected return on plan assets.
See note 41, “Retirement benefits obligation,” for a description of the defined benefit pension plans and sensitivity analysis. An
actuarial valuation is performed by actuarial valuation experts on an annual basis to determine the retirement benefit obligation of
the group.
The group tests annually whether goodwill has suffered any impairment, in accordance with the accounting policy. The
recoverable amounts of cash-generating units (CGU) have been determined based on value-in-use calculations. These
calculations require the use of significant amount of judgement and estimates of future cash flows. A number of factors affect the
value of such cash flows, including discount rates, changes in the economic outlook, customer behavior and competition See note
33 for detailed information on impairment assessment performed on the CGU. There was no impairment charge during the year
(2016: Nil)
87

FBN Holdings Plc.
NOTES TO THE CONSOLIDATED FINANCIAL STATEMENTS
At 31 December 2017
6 Segment information
Commercial Banking Business Group
Merchant Banking and Asset Management Business Group (MBAM)
Insurance Business Group
Others
Segment result of operations
Commercial
Banking
Group
MBAM
Group
Insurance
Group
Others Total
N 'million N 'million N 'million N 'million N 'million
At 31 December 2017
Total segment revenue 541,597 39,028 18,728 13,716 613,069
Inter-segment revenue (5,043) (172) (560) (11,851) (17,625)
Revenue from external customers 536,554 38,857 18,168 1,866 595,445
Interest income 436,392 25,260 6,090 1,843 469,586
Interest expense (121,454) (15,828) (782) - 0.00 (138,064)
Profit/(loss) before tax 44,125 10,923 4,441 (2,662) 56,827
Income tax expense (5,633) (2,347) (953) (107) (9,040)
Profit/(loss) for the year from continuing operations 38,492 8,576 3,488 (2,769) 47,786
Impairment charge on credit losses (148,579) 88 0 - (148,491)
Impairment charge on doubtful receivables (1,104) (686) (142) - (1,932)
Impairment charge on goodwill - - - - -
Loss for the year from discontinued operations (1,521) (6,254) (7,775)
Depreciation (10,422) (537) (242) (398) (11,600)
The segment information provided to the Group Executive Committee for the reportable segments for the period ended 31 December
2017 is as follows:
The Group's management reporting is based on a measure of operating profit comprising net interest income, loan impairment
charges, net fee and commission income, other income and non-interest expenses. This measurement basis excludes the effect of
non-recurring expenditure from the operating segments such as restructuring costs, legal expenses and goodwill impairments when
the impairment is the result of an isolated, non-recurring events.
Others comprises of FBN Holdings Plc., the parent company, and Rainbow Town Development Limited.
Following the management approach of IFRS 8, operating segments are reported in accordance with the internal reports provided to
the Group's Executive Committee (the chief operating decision maker), which is responsible for allocating resources to the operating
segments and assesses its performance.
The Group is divided into the following business units:
This is the Group's core business, which provides both individual and corporate clients/ customers with financial intermediation
services. This business segment includes the Group's local, international and representative offices offering commercial banking
services.
This is the investment-banking arm of the Group, providing advisory, asset management, markets and private equity services to a
large institutional (corporations and governments) clientele, as well as merchant banking services.
This includes the Group's legacy insurance brokerage business and the more recent full underwriting business (both life and
general). The underwriting business is performed by FBN Insurance Limited, a partnership with South African based Sanlam Group.
As the Group Executive Committee reviews operating profit, the results of discontinued operations are not included in the measure of
operating profit. The transactions between segments are carried out at arm's length, which is consistent with the basis of transacting
with external parties.
The information provided about each segment is based on the internal reports about segment profit or loss, assets and other
information, which are regularly reviewed by the Group Executive Committee.
Segment assets and liabilities comprise operating assets and liabilities, being the majority of the consolidated statement of financial
position.
88

FBN Holdings Plc.
NOTES TO THE CONSOLIDATED FINANCIAL STATEMENTS
At 31 December 2017
6 Segment information continued
Commercial
Banking
Group
MBAM
Group
Insurance
Group
Others Total
N 'million N 'million N 'million N 'million N 'million
At 31 December 2017
Total assets 4,949,985 183,933 50,692 51,927 5,236,537
Other measures of assets:
Loans and advances to customers 1,961,776 39,243 96 108 2,001,223
Expenditure on non-current assets 82,794 2,258 2,180 1,031 88,263
Investment securities 1,153,363 80,713 4,690 9,842 1,248,608
Total liabilities 4,355,535 153,096 40,054 9,660 4,558,344
At 31 December 2016
Total segment revenue 535,539 37,653 12,483 10,905 596,580
Inter-segment revenue (2,872) (1,406) (448) (10,023) (14,749)
Revenue from external customers 532,667 36,247 12,035 882 581,831
Interest income 381,672 18,890 3,955 764 405,281
Interest expense (89,737) (10,552) (550) 0 (100,839)
Profit/(loss) before tax 8,276 13,708 3,414 (2,450) 22,948
Income tax expense 1,093 (3,380) (1,021) (2,499) (5,807)
Profit/(loss) for the year from continuing operations 9,369 10,328 2,393 (4,949) 17,141
Impairment charge on credit losses (220,681) 258 - - (220,423)
Impairment charge on doubtful receivables (4,267) (1,340) (7) - (5,614)
Impairment charge on goodwill - - - - -
Loss for the year from discontinued operations (1,317) (3,581) (4,898)
Depreciation (10,594) (407) (202) (381) (11,584)
At 31 December 2016
Total assets 4,469,601 183,417 31,962 51,825 4,736,805
Other measures of assets:
Loans and advances to customers 2,041,852 41,684 293 65 2,083,894
Expenditure on non-current assets 83,358 1,823 1,937 1,197 88,315
Investment securities 961,236 51,089 25,913 12,350 1,050,588
Total liabilities 3,992,998 129,286 22,691 9,255 4,154,230
Geographical information
Revenues
31 Dec 2017 31 Dec 2016
N 'million N 'million
Nigeria 508,195 521,661
Outside Nigeria 87,250 60,170
Total 595,445 581,831
Non current asset
31 Dec 2017 31 Dec 2016
N 'million N 'million
Nigeria 79,710 79,425
Outside Nigeria 8,553 8,890
Total 88,263 88,315
89
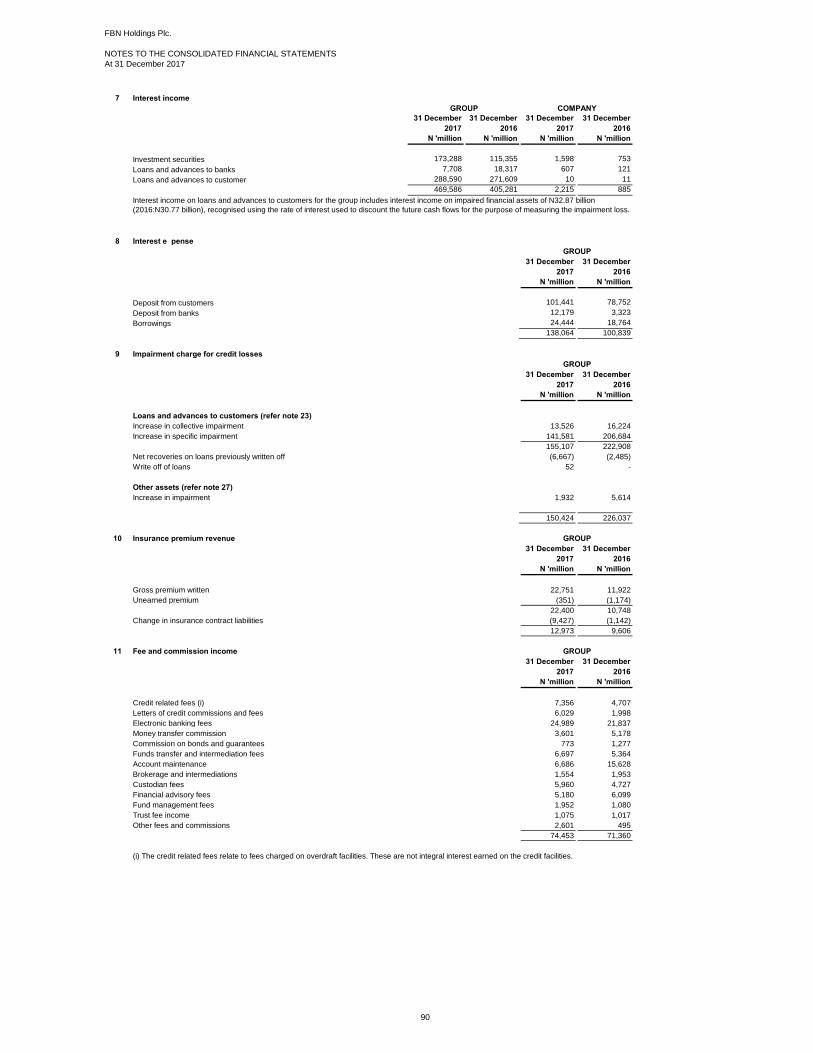
FBN Holdings Plc.
NOTES TO THE CONSOLIDATED FINANCIAL STATEMENTS
At 31 December 2017
7 Interest income
31 December 31 December 31 December 31 December
2017 2016 2017 2016
N 'million N 'million N 'million N 'million
Investment securities 173,288 115,355 1,598 753
Loans and advances to banks 7,708 18,317 607 121
Loans and advances to customer 288,590 271,609 10 11
469,586 405,281 2,215 885
8 Interest expense
31 December 31 December
2017 2016
N 'million N 'million
Deposit from customers 101,441 78,752
Deposit from banks 12,179 3,323
Borrowings 24,444 18,764
138,064 100,839
9 Impairment charge for credit losses
31 December 31 December
2017 2016
N 'million N 'million
Loans and advances to customers (refer note 23)
Increase in collective impairment 13,526 16,224
Increase in specific impairment 141,581 206,684
155,107 222,908
Net recoveries on loans previously written off (6,667) (2,485)
Write off of loans 52 -
Other assets (refer note 27)
Increase in impairment 1,932 5,614
150,424 226,037
10 Insurance premium revenue
31 December 31 December
2017 2016
N 'million N 'million
Gross premium written 22,751 11,922
Unearned premium (351) (1,174)
22,400 10,748
Change in insurance contract liabilities (9,427) (1,142)
12,973 9,606
11 Fee and commission income
31 December 31 December
2017 2016
N 'million N 'million
Credit related fees (i) 7,356 4,707
Letters of credit commissions and fees 6,029 1,998
Electronic banking fees 24,989 21,837
Money transfer commission 3,601 5,178
Commission on bonds and guarantees 773 1,277
Funds transfer and intermediation fees 6,697 5,364
Account maintenance 6,686 15,628
Brokerage and intermediations 1,554 1,953
Custodian fees 5,960 4,727
Financial advisory fees 5,180 6,099
Fund management fees 1,952 1,080
Trust fee income 1,075 1,017
Other fees and commissions 2,601 495
74,453 71,360
(i) The credit related fees relate to fees charged on overdraft facilities. These are not integral interest earned on the credit facilities.
GROUP
Interest income on loans and advances to customers for the group includes interest income on impaired financial assets of N32.87 billion
(2016:N30.77 billion), recognised using the rate of interest used to discount the future cash flows for the purpose of measuring the impairment loss.
GROUP COMPANY
GROUP
GROUP
GROUP
90
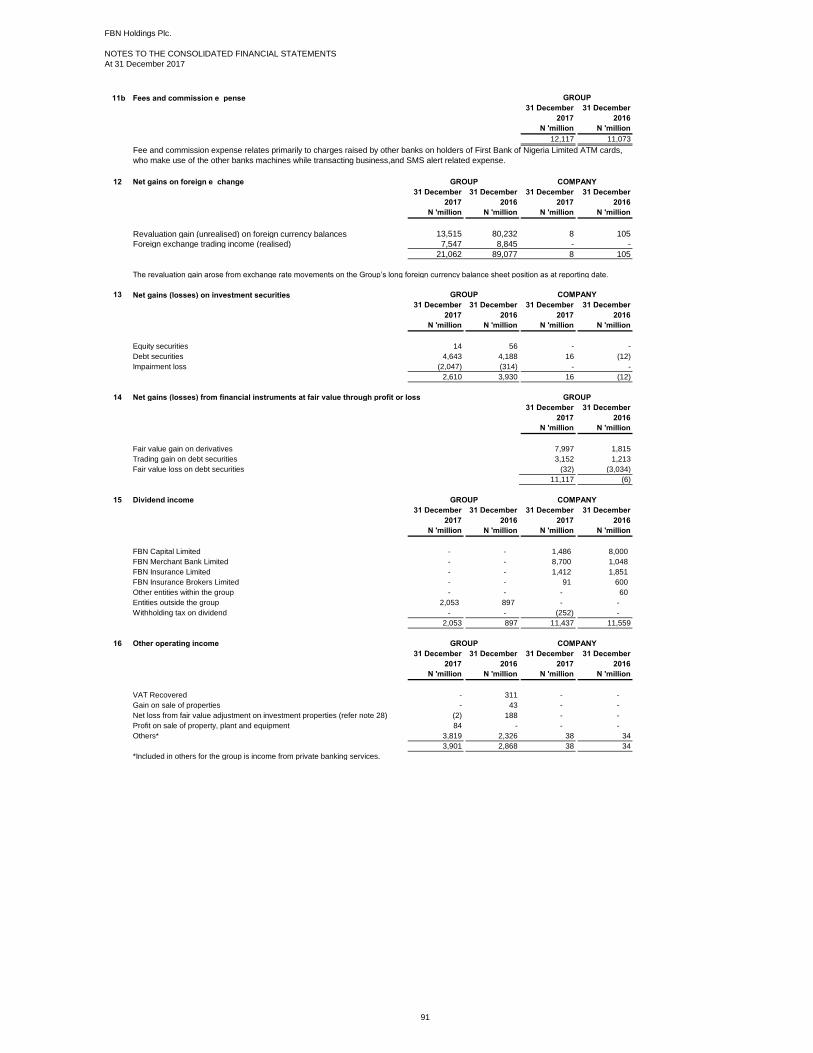
FBN Holdings Plc.
NOTES TO THE CONSOLIDATED FINANCIAL STATEMENTS
At 31 December 2017
11b Fees and commission expense
31 December 31 December
2017 2016
N 'million N 'million
12,117 11,073
12 Net gains on foreign exchange
31 December 31 December 31 December 31 December
2017 2016 2017 2016
N 'million N 'million N 'million N 'million
Revaluation gain (unrealised) on foreign currency balances 13,515 80,232 8 105
7,547 8,845 - -
21,062 89,077 8 105
The revaluation gain arose from exchange rate movements on the Group’s long foreign currency balance sheet position as at reporting date.
13 Net gains/(losses) on investment securities
31 December 31 December 31 December 31 December
2017 2016 2017 2016
N 'million N 'million N 'million N 'million
Equity securities 14 56 - -
Debt securities 4,643 4,188 16 (12)
Impairment loss (2,047) (314) - -
2,610 3,930 16 (12)
14 Net gains/(losses) from financial instruments at fair value through profit or loss
31 December 31 December
2017 2016
N 'million N 'million
Fair value gain on derivatives 7,997 1,815
Trading gain on debt securities 3,152 1,213
Fair value loss on debt securities (32) (3,034)
11,117 (6)
15 Dividend income
31 December 31 December 31 December 31 December
2017 2016 2017 2016
N 'million N 'million N 'million N 'million
FBN Capital Limited - - 1,486 8,000
FBN Merchant Bank Limited - - 8,700 1,048
FBN Insurance Limited - - 1,412 1,851
FBN Insurance Brokers Limited - - 91 600
Other entities within the group - - - 60
Entities outside the group 2,053 897 - -
Withholding tax on dividend - - (252) -
2,053 897 11,437 11,559
16 Other operating income
31 December 31 December 31 December 31 December
2017 2016 2017 2016
N 'million N 'million N 'million N 'million
VAT Recovered - 311 - -
Gain on sale of properties - 43 - -
Net loss from fair value adjustment on investment properties (refer note 28) (2) 188 - -
Profit on sale of property, plant and equipment 84 - - -
Others* 3,819 2,326 38 34
3,901 2,868 38 34
*Included in others for the group is income from private banking services.
COMPANY
COMPANY
GROUP
GROUP
COMPANY
GROUP
COMPANY
GROUP
Foreign exchange trading income (realised)
GROUP
GROUP
Fee and commission expense relates primarily to charges raised by other banks on holders of First Bank of Nigeria Limited ATM cards,
who make use of the other banks machines while transacting business,and SMS alert related expense.
91
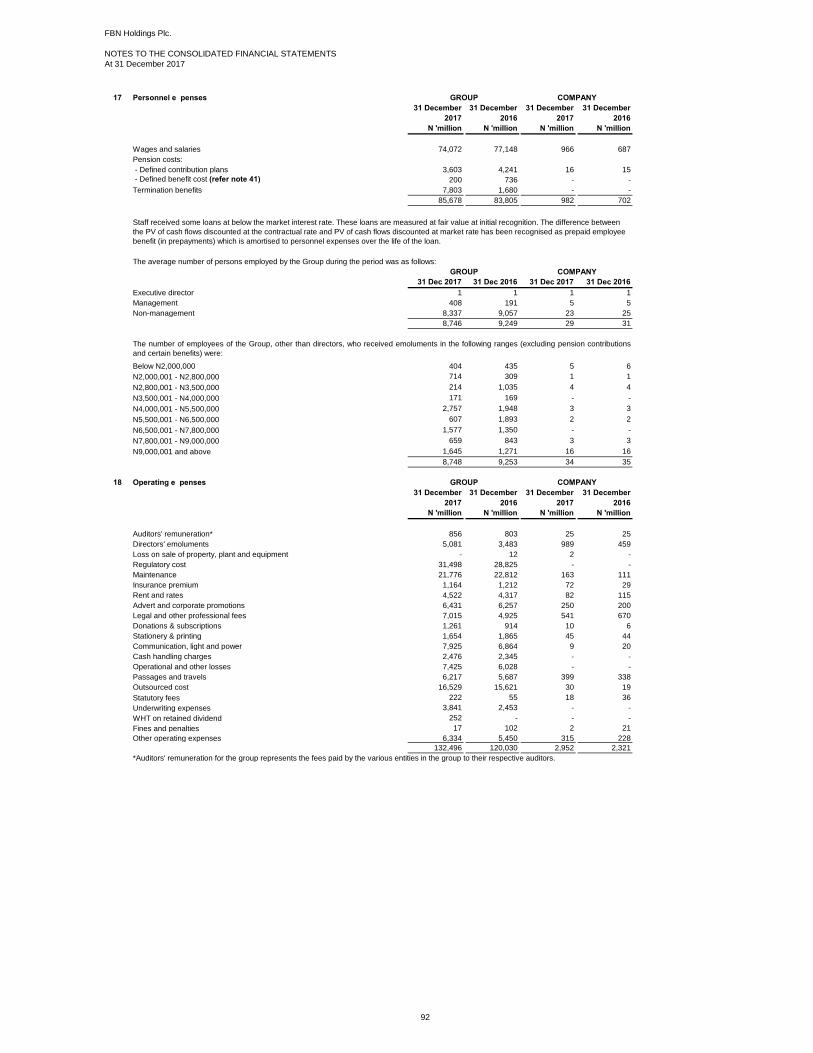
FBN Holdings Plc.
NOTES TO THE CONSOLIDATED FINANCIAL STATEMENTS
At 31 December 2017
17 Personnel expenses
31 December 31 December 31 December 31 December
2017 2016 2017 2016
N 'million N 'million N 'million N 'million
Wages and salaries 74,072 77,148 966 687
Pension costs:
- Defined contribution plans 3,603 4,241 16 15
- Defined benefit cost (refer note 41) 200 736 - -
Termination benefits 7,803 1,680 - -
85,678 83,805 982 702
31 Dec 2017 31 Dec 2016 31 Dec 2017 31 Dec 2016
Executive director 1 1 1 1
Management 408 191 5 5
Non-management 8,337 9,057 23 25
8,746 9,249 29 31
Below N2,000,000 404 435 5 6
N2,000,001 - N2,800,000 714 309 1 1
N2,800,001 - N3,500,000 214 1,035 4 4
N3,500,001 - N4,000,000 171 169 - -
N4,000,001 - N5,500,000 2,757 1,948 3 3
N5,500,001 - N6,500,000 607 1,893 2 2
N6,500,001 - N7,800,000 1,577 1,350 - -
N7,800,001 - N9,000,000 659 843 3 3
N9,000,001 and above 1,645 1,271 16 16
8,748 9,253 34 35
18 Operating expenses
31 December 31 December 31 December 31 December
2017 2016 2017 2016
N 'million N 'million N 'million N 'million
Auditors' remuneration* 856 803 25 25
Directors' emoluments 5,081 3,483 989 459
Loss on sale of property, plant and equipment - 12 2 -
Regulatory cost 31,498 28,825 - -
Maintenance 21,776 22,812 163 111
Insurance premium 1,164 1,212 72 29
Rent and rates 4,522 4,317 82 115
Advert and corporate promotions 6,431 6,257 250 200
Legal and other professional fees 7,015 4,925 541 670
Donations & subscriptions 1,261 914 10 6
Stationery & printing 1,654 1,865 45 44
Communication, light and power 7,925 6,864 9 20
Cash handling charges 2,476 2,345 - -
Operational and other losses 7,425 6,028 - -
Passages and travels 6,217 5,687 399 338
Outsourced cost 16,529 15,621 30 19
Statutory fees 222 55 18 36
Underwriting expenses 3,841 2,453 - -
WHT on retained dividend 252 - - -
Fines and penalties 17 102 2 21
Other operating expenses 6,334 5,450 315 228
132,496 120,030 2,952 2,321
*Auditors' remuneration for the group represents the fees paid by the various entities in the group to their respective auditors.
COMPANY
The average number of persons employed by the Group during the period was as follows:
Staff received some loans at below the market interest rate. These loans are measured at fair value at initial recognition. The difference between
the PV of cash flows discounted at the contractual rate and PV of cash flows discounted at market rate has been recognised as prepaid employee
benefit (in prepayments) which is amortised to personnel expenses over the life of the loan.
GROUP
GROUP COMPANY
The number of employees of the Group, other than directors, who received emoluments in the following ranges (excluding pension contributions
and certain benefits) were:
GROUP COMPANY
92
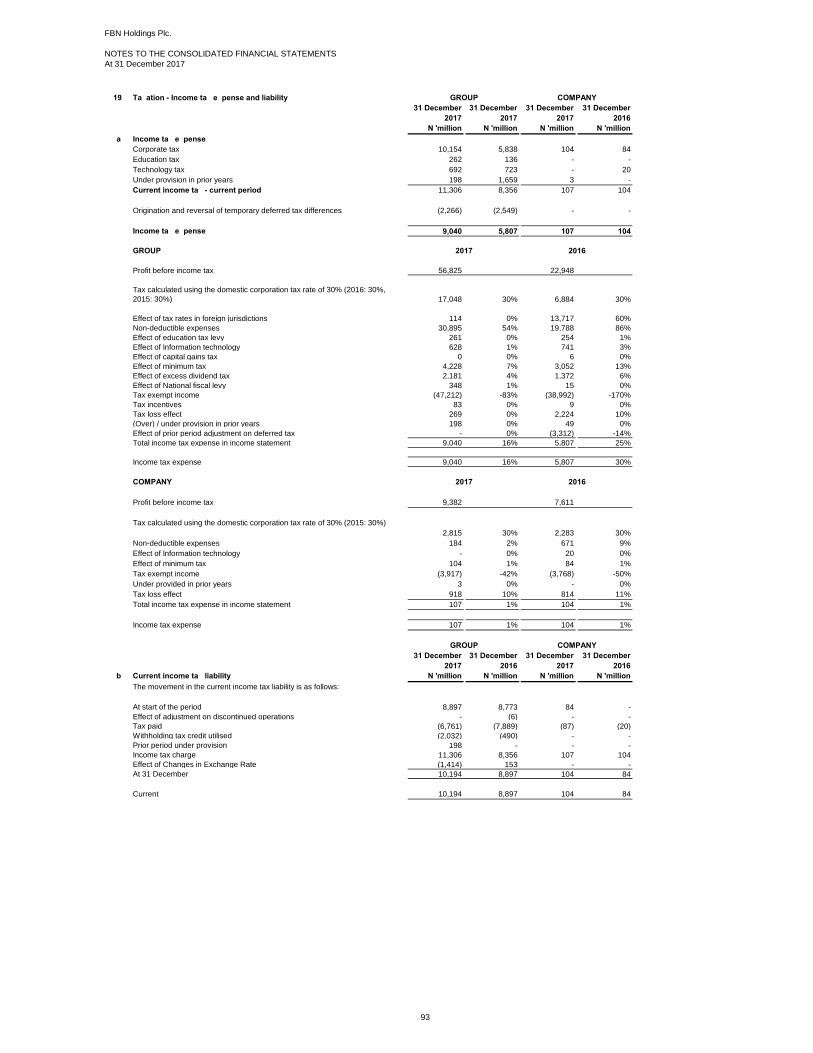
FBN Holdings Plc.
NOTES TO THE CONSOLIDATED FINANCIAL STATEMENTS
At 31 December 2017
19 Taxation - Income tax expense and liability
31 December 31 December 31 December 31 December
2017 2017 2017 2016
N 'million N 'million N 'million N 'million
a Income tax expense
Corporate tax 10,154 5,838 104 84
Education tax 262 136 - -
Technology tax 692 723 - 20
Under provision in prior years 198 1,659 3 -
Current income tax - current period 11,306 8,356 107 104
Origination and reversal of temporary deferred tax differences (2,266) (2,549) - -
Income tax expense 9,040 5,807 107 104
GROUP
Profit before income tax 56,825 22,948
17,048 30% 6,884 30%
Effect of tax rates in foreign jurisdictions 114 0% 13,717 60%
Non-deductible expenses 30,895 54% 19,788 86%
Effect of education tax levy 261 0% 254 1%
Effect of Information technology 628 1% 741 3%
Effect of capital gains tax 0 0% 6 0%
Effect of minimum tax 4,228 7% 3,052 13%
Effect of excess dividend tax 2,181 4% 1,372 6%
Effect of National fiscal levy 348 1% 15 0%
Tax exempt income (47,212) -83% (38,992) -170%
Tax incentives 83 0% 9 0%
Tax loss effect 269 0% 2,224 10%
(Over) / under provision in prior years 198 0% 49 0%
Effect of prior period adjustment on deferred tax - 0% (3,312) -14%
Total income tax expense in income statement 9,040 16% 5,807 25%
Income tax expense 9,040 16% 5,807 30%
COMPANY
Profit before income tax 9,382 7,611
2,815 30% 2,283 30%
Non-deductible expenses 184 2% 671 9%
Effect of Information technology - 0% 20 0%
Effect of minimum tax 104 1% 84 1%
Tax exempt income (3,917) -42% (3,768) -50%
Under provided in prior years 3 0% - 0%
Tax loss effect 918 10% 814 11%
Total income tax expense in income statement 107 1% 104 1%
Income tax expense 107 1% 104 1%
31 December 31 December 31 December 31 December
2017 2016 2017 2016
b Current income tax liability N 'million N 'million N 'million N 'million
The movement in the current income tax liability is as follows:
At start of the period 8,897 8,773 84 -
Effect of adjustment on discontinued operations - (6) - -
Tax paid (6,761) (7,889) (87) (20)
Withholding tax credit utilised (2,032) (490) - -
Prior period under provision 198 - - -
Income tax charge 11,306 8,356 107 104
Effect of Changes in Exchange Rate (1,414) 153 - -
At 31 December 10,194 8,897 104 84
Current 10,194 8,897 104 84
2017 2016
2017 2016
Tax calculated using the domestic corporation tax rate of 30% (2016: 30%,
2015: 30%)
GROUP COMPANY
Tax calculated using the domestic corporation tax rate of 30% (2015: 30%)
GROUP COMPANY
93

FBN Holdings Plc.
NOTES TO THE CONSOLIDATED FINANCIAL STATEMENTS
At 31 December 2017
20 Cash and balances with central banks
31 December 31 December
2017 2016
N 'million N 'million
Cash 169,033 101,255
Balances with central banks excluding mandatory reserve deposits 15,192 46,108
184,225 147,363
Mandatory reserve deposits with Central Banks 457,656 542,802
641,881 690,165
There was no call placement with the Central Bank in 2017 (31 December 2016: N7.5 billion)
21 Cash and cash equivalents
31 December 31 December 31 December 31 December
2017 2016 2017 2016
N 'million N 'million N 'million N 'million
Cash (Note 20) 169,033 101,255 - -
Balances with central banks other than mandatory reserve deposits (Note 20) 15,192 46,108 - -
Loans and advances to banks excluding long term placements (Note 22) 701,504 377,500 7,585 645
Treasury bills included in financial assets at FVTPL (Note 24) 8,491 5,671 - -
Treasury bills and eligible bills excluding pledged treasury bills (Note 25.1&25.2) 272,227 215,697 - -
1,166,447 746,231 7,585 645
22 Loans and advances to banks
Current balances with banks within Nigeria 214,240 105,532 1,636 18
Current balances with banks outside Nigeria 380,675 148,719 - -
Placements with banks and discount houses (short term) 106,589 123,249 5,949 627
701,504 377,500 7,585 645
Long term placement 41,425 67,371 - -
Carrying amount 742,929 444,871 7,585 645
23 Loans and advances to customers
GROUP Gross Specific Collective Total Carrying
amount impairment impairment impairment amount
N 'million N 'million N 'million N 'million N 'million
31 December 2017
Overdrafts 345,628 (44,205) (5,288) (49,493) 296,135
Term loans 1,898,675 (185,326) (43,015) (228,341) 1,670,334
Staff loans 8,243 (4) (292) (296) 7,947
Project finance 26,775 - (479) (479) 26,296
2,279,321 (229,535) (49,074) (278,609) 2,000,712
Advances under finance lease 1,072 (533) (28) (561) 511
2,280,393 (230,068) (49,102) (279,170) 2,001,223
31 December 2016
Overdrafts 393,870 (106,323) (4,860) (111,183) 282,687
Term loans 1,875,644 (156,756) (31,185) (187,941) 1,687,703
Staff loans 7,502 (3) (82) (85) 7,417
Project finance 115,923 (10,837) (303) (11,140) 104,783
2,392,939 (273,919) (36,430) (310,349) 2,082,590
Advances under finance lease 1,839 (497) (38) (535) 1,304
2,394,778 (274,416) (36,468) (310,884) 2,083,894
For the purpose of the statement of cash flows, cash and cash equivalents comprise balances with less than three months' maturity from the date
of acquisition, including cash in hand, deposits held at call with other banks and other short-term highly liquid investments with original maturities
less than three months.
GROUP COMPANY
Included in loans to banks is non current placement of N41.43 billion for Group (31 December 2016: N67.37 billion) which does not qualify as cash
and cash equivalent.
All other loans to banks are due within 3 months.
GROUP
Restricted deposits with central banks are not available for use in Group’s day to day operations. FBN Limited and FBNQuest Merchant Bank
Limited had restricted balances of N449.99 billion and N2.173bn respectively with Central Bank of Nigeria (CBN) as at 31st December 2017
(December 2016: N536.95 billion and Nil). This balance is CBN cash reserve requirement. The cash reserve ratio represents a mandatory 22.5%
of qualifying deposits (December 2016: 22.5%) which should be held with the Central Bank of Nigeria as a regulatory requirement. FBN Bank
Ghana and FBN Bank Guinea had restricted balances of N2.276 billion and N1.964 billion (December 2016: N2.035 billion and N2.273 billion)
respectively with their respective central banks.
94
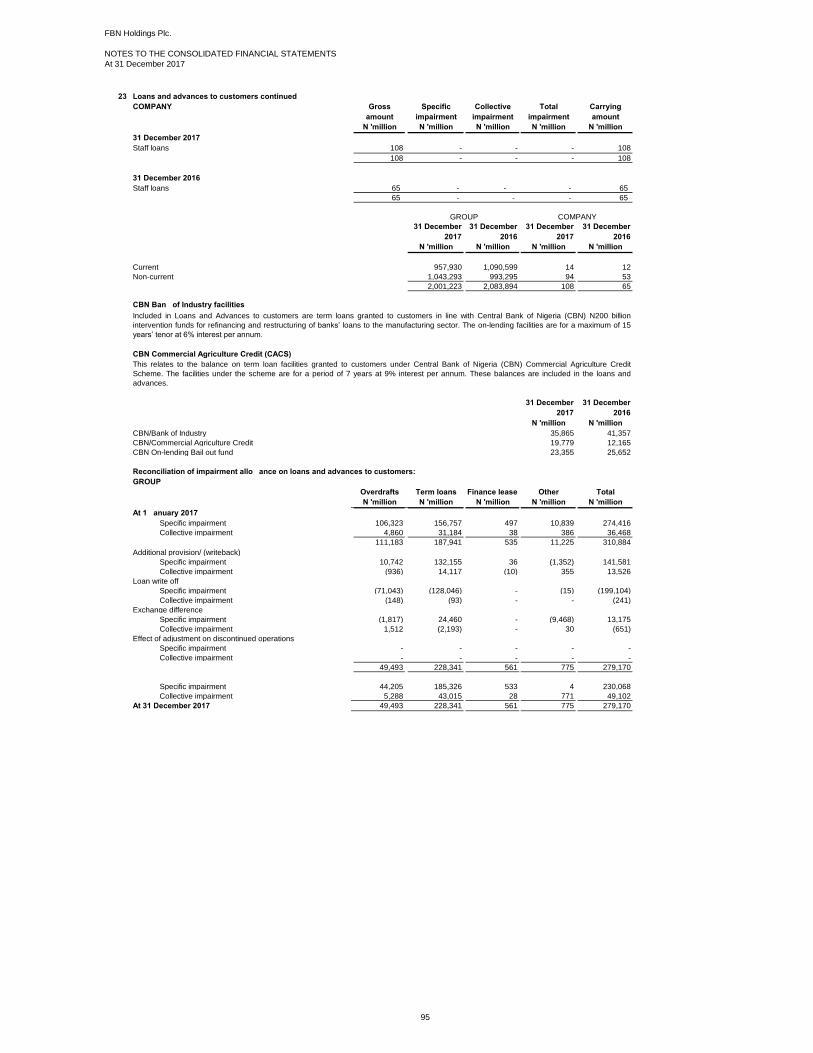
FBN Holdings Plc.
NOTES TO THE CONSOLIDATED FINANCIAL STATEMENTS
At 31 December 2017
23 Loans and advances to customers continued
COMPANY Gross Specific Collective Total Carrying
amount impairment impairment impairment amount
N 'million N 'million N 'million N 'million N 'million
31 December 2017
Staff loans 108 - - - 108
108 - - - 108
31 December 2016
Staff loans 65 - - - 65
65 - - - 65
31 December 31 December 31 December 31 December
2017 2016 2017 2016
N 'million N 'million N 'million N 'million
Current 957,930 1,090,599 14 12
Non-current 1,043,293 993,295 94 53
2,001,223 2,083,894 108 65
CBN/Bank of Industry facilities
CBN/Commercial Agriculture Credit (CACS)
31 December 31 December
2017 2016
N 'million N 'million
CBN/Bank of Industry 35,865 41,357
CBN/Commercial Agriculture Credit 19,779 12,165
CBN On-lending Bail out fund 23,355 25,652
Reconciliation of impairment allowance on loans and advances to customers:
GROUP
Overdrafts Term loans Finance lease Other Total
N 'million N 'million N 'million N 'million N 'million
At 1 January 2017
Specific impairment 106,323 156,757 497 10,839 274,416
Collective impairment 4,860 31,184 38 386 36,468
111,183 187,941 535 11,225 310,884
Additional provision/ (writeback)
Specific impairment 10,742 132,155 36 (1,352) 141,581
Collective impairment (936) 14,117 (10) 355 13,526
Loan write off
Specific impairment (71,043) (128,046) - (15) (199,104)
Collective impairment (148) (93) - - (241)
Exchange difference
Specific impairment (1,817) 24,460 - (9,468) 13,175
Collective impairment 1,512 (2,193) - 30 (651)
Effect of adjustment on discontinued operations
Specific impairment - - - - -
Collective impairment - - - - -
49,493 228,341 561 775 279,170
Specific impairment 44,205 185,326 533 4 230,068
Collective impairment 5,288 43,015 28 771 49,102
At 31 December 2017 49,493 228,341 561 775 279,170
GROUP COMPANY
Included in Loans and Advances to customers are term loans granted to customers in line with Central Bank of Nigeria (CBN) N200 billion
intervention funds for refinancing and restructuring of banks’ loans to the manufacturing sector. The on-lending facilities are for a maximum of 15
years’ tenor at 6% interest per annum.
This relates to the balance on term loan facilities granted to customers under Central Bank of Nigeria (CBN) Commercial Agriculture Credit
Scheme. The facilities under the scheme are for a period of 7 years at 9% interest per annum. These balances are included in the loans and
advances.
95
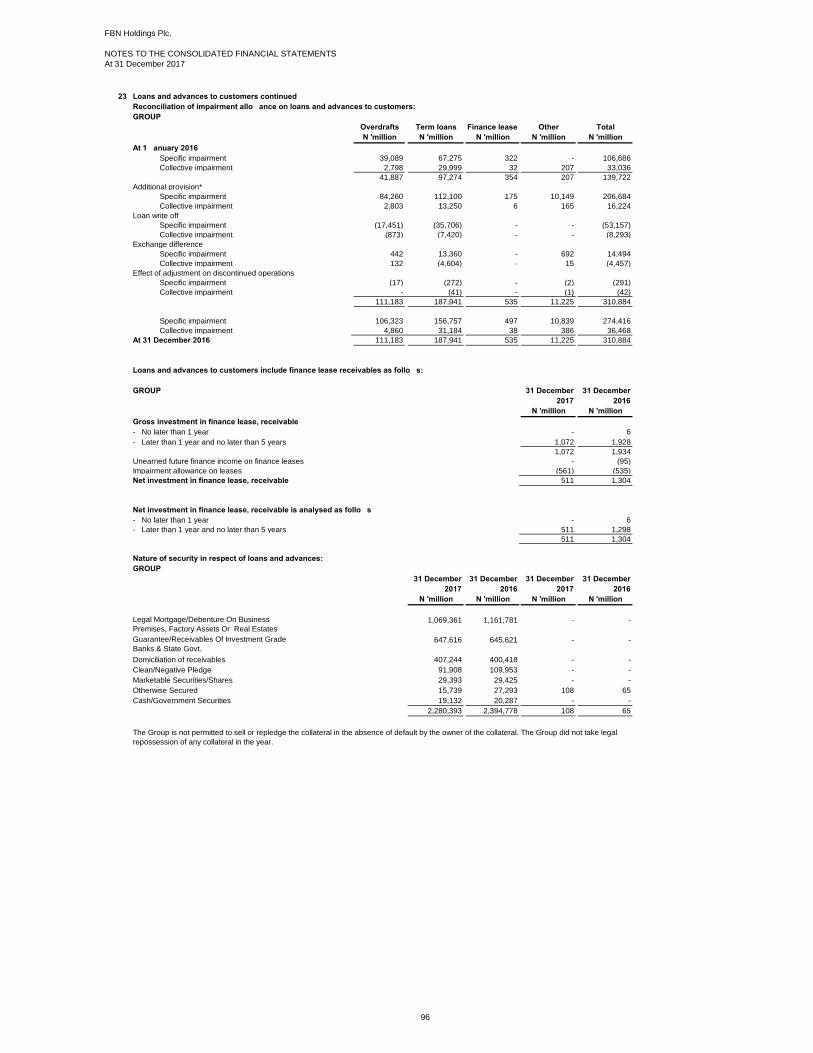
FBN Holdings Plc.
NOTES TO THE CONSOLIDATED FINANCIAL STATEMENTS
At 31 December 2017
23 Loans and advances to customers continued
Reconciliation of impairment allowance on loans and advances to customers:
GROUP
Overdrafts Term loans Finance lease Other Total
N 'million N 'million N 'million N 'million N 'million
At 1 January 2016
Specific impairment 39,089 67,275 322 - 106,686
Collective impairment 2,798 29,999 32 207 33,036
41,887 97,274 354 207 139,722
Additional provision*
Specific impairment 84,260 112,100 175 10,149 206,684
Collective impairment 2,803 13,250 6 165 16,224
Loan write off
Specific impairment (17,451) (35,706) - - (53,157)
Collective impairment (873) (7,420) - - (8,293)
Exchange difference
Specific impairment 442 13,360 - 692 14,494
Collective impairment 132 (4,604) - 15 (4,457)
Effect of adjustment on discontinued operations
Specific impairment (17) (272) - (2) (291)
Collective impairment - (41) - (1) (42)
111,183 187,941 535 11,225 310,884
Specific impairment 106,323 156,757 497 10,839 274,416
Collective impairment 4,860 31,184 38 386 36,468
At 31 December 2016 111,183 187,941 535 11,225 310,884
Loans and advances to customers include finance lease receivables as follows:
GROUP 31 December 31 December
2017 2016
N 'million N 'million
Gross investment in finance lease, receivable
- No later than 1 year - 6
- Later than 1 year and no later than 5 years 1,072 1,928
1,072 1,934
Unearned future finance income on finance leases - (95)
Impairment allowance on leases (561) (535)
Net investment in finance lease, receivable 511 1,304
Net investment in finance lease, receivable is analysed as follows
- No later than 1 year - 6
- Later than 1 year and no later than 5 years 511 1,298
511 1,304
Nature of security in respect of loans and advances:
GROUP
31 December 31 December 31 December 31 December
2017 2016 2017 2016
N 'million N 'million N 'million N 'million
Legal Mortgage/Debenture On Business
Premises, Factory Assets Or Real Estates 1,069,361 1,161,781 - -
Guarantee/Receivables Of Investment Grade
Banks & State Govt. 647,616 645,621 - -
Domiciliation of receivables 407,244 400,418 - -
Clean/Negative Pledge 91,908 109,953 - -
Marketable Securities/Shares 29,393 29,425 - -
Otherwise Secured 15,739 27,293 108 65
Cash/Government Securities 19,132 20,287 - -
2,280,393 2,394,778 108 65
The Group is not permitted to sell or repledge the collateral in the absence of default by the owner of the collateral. The Group did not take legal
repossession of any collateral in the year.
96

FBN Holdings Plc.
NOTES TO THE CONSOLIDATED FINANCIAL STATEMENTS
At 31 December 2017
24 Financial assets and liabilities at fair value through profit or loss
31 December 31 December
2017 2016
N 'million N 'million
Treasury bills with maturity of less than 90 days 8,491 5,671
Treasury bills with maturity over 90 days 20,837 5,866
Bonds 22,836 14,469
Total debt securities 52,164 26,006
Listed equity securities 755 286
Unlisted equity securities 7,801 5,242
Total equity securities 8,556 5,528
Derivative assets (refer note 24a) 22,993 15,177
Total assets at fair value through profit or loss 83,713 46,711
Current 67,462 35,364
Non Current 16,251 11,347
83,713 46,711
The Group uses the following derivative strategies:
Economic hedges
Customers Risk Hedge Needs
a Derivatives
Asset Liability
N 'million N 'million N 'million
Foreign exchange derivatives
Forward FX contract 205,319 5,040 (798)
Currency swap 55,049 7,680 (19)
Put options 279,638 10,273 (8,587)
540,006 22,993 (9,404)
Current 411,195 15,299 (3,184)
Non Current 128,811 7,694 (6,220)
540,006 22,993 (9,404)
Asset Liability
N 'million N 'million N 'million
Foreign exchange derivatives
Forward FX contract 554,263 8,092 (32,347)
Currency swap 36,600 865 (123)
Put options 151,472 6,220 (4,667)
742,335 15,177 (37,137)
Current 608,161 9,358 (32,825)
Non Current 134,174 5,819 (4,312)
742,335 15,177 (37,137)
GROUP
The Group use of derivative instrument is very nascent and has been limited to hedging of risk exposures resulting from adverse movement in
market risk factors. The Group’s derivative transactions are principally in Forward FX Contracts entered into to hedge against Foreign Exchange
Risks arising from cross-currency exposures.
Notional
contract
amount
31 Dec 2017
Notional
contract
amount
Fair values
GROUP
The Group offers its customers derivatives in connection with their risk-management objectives to transfer modify or reduce foreign exchange risk
for their own trading purposes. As part of this process, the Group considers the customers’ suitability for the risk involved, and the business
purpose for the transaction. Currently all hedge transactions with the customers are backed by trade (visible and invisible) transactions. The Group
also manages its derivative-risk positions through calculation of pre-settlement risk exposure and daily reporting of positions and risk measures to
senior management.
Fair values
31 Dec 2016
GROUP
The derivative instruments become favourable (assets) or unfavourable (liabilities) as a result of fluctuations in market interest rates or foreign
exchange rates relative to their terms. The aggregate contractual or notional amount of derivative financial instruments on hand, the extent to
which instruments are favourable or unfavourable, and thus the aggregate fair values of derivative financial assets and liabilities, can fluctuate
significantly from time to time. The fair values of derivative instruments held are set out below:
97
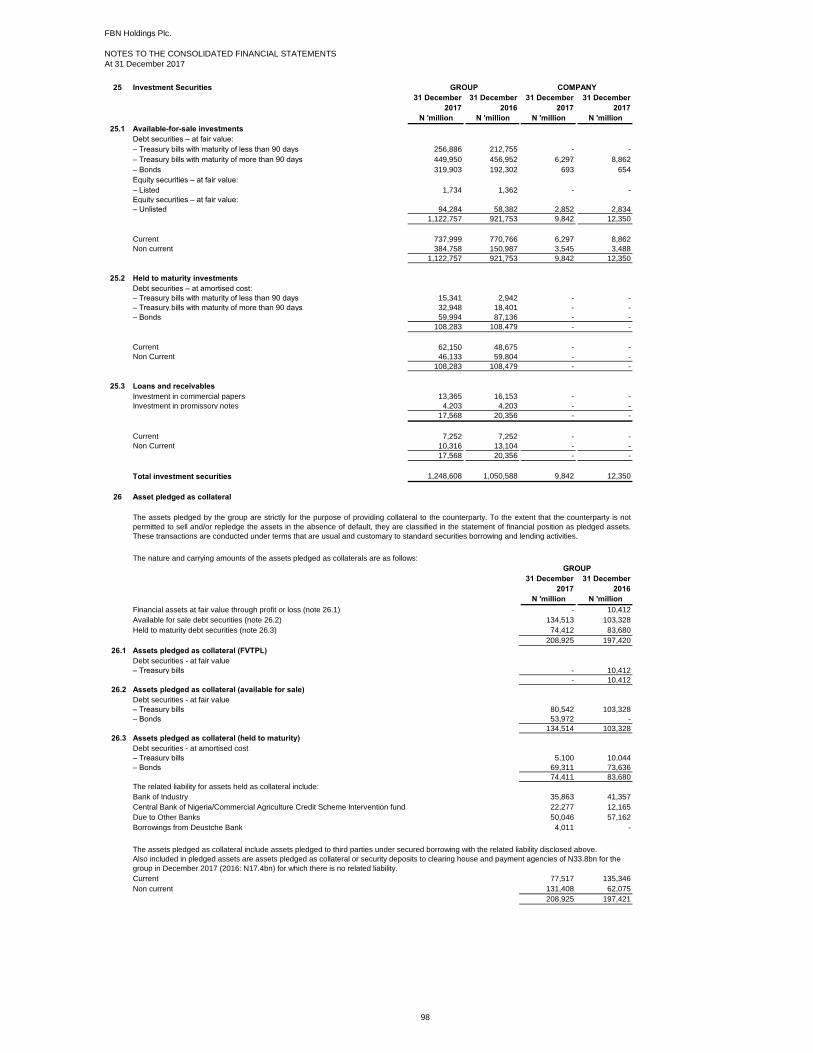
FBN Holdings Plc.
NOTES TO THE CONSOLIDATED FINANCIAL STATEMENTS
At 31 December 2017
25 Investment Securities
31 December 31 December 31 December 31 December
2017 2016 2017 2017
N 'million N 'million N 'million N 'million
25.1 Available-for-sale investments
Debt securities – at fair value:
– Treasury bills with maturity of less than 90 days 256,886 212,755 - -
– Treasury bills with maturity of more than 90 days 449,950 456,952 6,297 8,862
– Bonds 319,903 192,302 693 654
Equity securities – at fair value:
– Listed 1,734 1,362 - -
Equity securities – at fair value:
– Unlisted 94,284 58,382 2,852 2,834
1,122,757 921,753 9,842 12,350
Current 737,999 770,766 6,297 8,862
Non current 384,758 150,987 3,545 3,488
1,122,757 921,753 9,842 12,350
25.2 Held to maturity investments
Debt securities – at amortised cost:
– Treasury bills with maturity of less than 90 days 15,341 2,942 - -
– Treasury bills with maturity of more than 90 days 32,948 18,401 - -
– Bonds 59,994 87,136 - -
108,283 108,479 - -
Current 62,150 48,675 - -
Non Current 46,133 59,804 - -
108,283 108,479 - -
25.3 Loans and receivables
Investment in commercial papers 13,365 16,153 - -
Investment in promissory notes 4,203 4,203 - -
17,568 20,356 - -
Current 7,252 7,252 - -
Non Current 10,316 13,104 - -
17,568 20,356 - -
1,248,608 1,050,588 9,842 12,350
26 Asset pledged as collateral
31 December 31 December
2017 2016
N 'million N 'million
Financial assets at fair value through profit or loss (note 26.1) - 10,412
134,513 103,328
74,412 83,680
208,925 197,420
26.1 Assets pledged as collateral (FVTPL)
Debt securities - at fair value
– Treasury bills - 10,412
- 10,412
26.2 Assets pledged as collateral (available for sale)
Debt securities - at fair value
– Treasury bills 80,542 103,328
– Bonds 53,972 -
134,514 103,328
26.3 Assets pledged as collateral (held to maturity)
Debt securities - at amortised cost
– Treasury bills 5,100 10,044
– Bonds 69,311 73,636
74,411 83,680
The related liability for assets held as collateral include:
Bank of Industry 35,863 41,357
Central Bank of Nigeria/Commercial Agriculture Credit Scheme Intervention fund 22,277 12,165
Due to Other Banks 50,046 57,162
Borrowings from Deustche Bank 4,011 -
Current 77,517 135,346
Non current 131,408 62,075
208,925 197,421
GROUP
The assets pledged as collateral include assets pledged to third parties under secured borrowing with the related liability disclosed above.
Also included in pledged assets are assets pledged as collateral or security deposits to clearing house and payment agencies of N33.8bn for the
group in December 2017 (2016: N17.4bn) for which there is no related liability.
GROUP
The nature and carrying amounts of the assets pledged as collaterals are as follows:
COMPANY
Total investment securities
Held to maturity debt securities (note 26.3)
The assets pledged by the group are strictly for the purpose of providing collateral to the counterparty. To the extent that the counterparty is not
permitted to sell and/or repledge the assets in the absence of default, they are classified in the statement of financial position as pledged assets.
These transactions are conducted under terms that are usual and customary to standard securities borrowing and lending activities.
Available for sale debt securities (note 26.2)
98
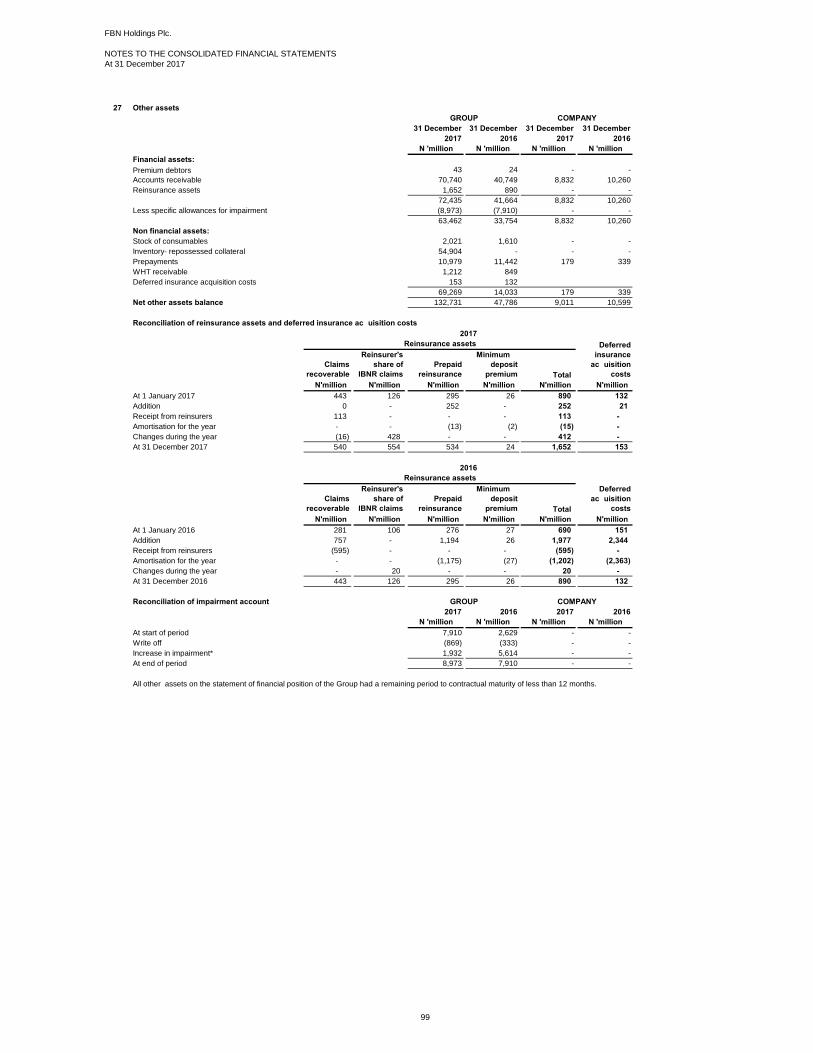
FBN Holdings Plc.
NOTES TO THE CONSOLIDATED FINANCIAL STATEMENTS
At 31 December 2017
27 Other assets
31 December 31 December 31 December 31 December
2017 2016 2017 2016
N 'million N 'million N 'million N 'million
Financial assets:
Premium debtors 43 24 - -
Accounts receivable 70,740 40,749 8,832 10,260
Reinsurance assets 1,652 890 - -
72,435 41,664 8,832 10,260
(8,973) (7,910) - -
63,462 33,754 8,832 10,260
Non financial assets:
Stock of consumables 2,021 1,610 - -
Inventory- repossessed collateral 54,904 - - -
Prepayments 10,979 11,442 179 339
WHT receivable 1,212 849
Deferred insurance acquisition costs 153 132
69,269 14,033 179 339
Net other assets balance 132,731 47,786 9,011 10,599
Reconciliation of reinsurance assets and deferred insurance acquisition costs
Claims
recoverable
Reinsurer's
share of
IBNR claims
Prepaid
reinsurance
Minimum &
deposit
premium Total
N'million N'million N'million N'million N'million N'million
At 1 January 2017 443 126 295 26 890 132
Addition 0 - 252 - 252 21
Receipt from reinsurers 113 - - - 113 -
Amortisation for the year - - (13) (2) (15) -
Changes during the year (16) 428 - - 412 -
At 31 December 2017 540 554 534 24 1,652 153
Claims
recoverable
Reinsurer's
share of
IBNR claims
Prepaid
reinsurance
Minimum &
deposit
premium Total
N'million N'million N'million N'million N'million N'million
At 1 January 2016 281 106 276 27 690 151
Addition 757 - 1,194 26 1,977 2,344
Receipt from reinsurers (595) - - - (595) -
Amortisation for the year - - (1,175) (27) (1,202) (2,363)
Changes during the year - 20 - - 20 -
At 31 December 2016 443 126 295 26 890 132
Reconciliation of impairment account
2017 2016 2017 2016
N 'million N 'million N 'million N 'million
At start of period 7,910 2,629 - -
Write off (869) (333) - -
Increase in impairment* 1,932 5,614 - -
At end of period 8,973 7,910 - -
Reinsurance assets
Reinsurance assets
Deferred
acquisition
costs
Deferred
insurance
acquisition
costs
Less specific allowances for impairment
All other assets on the statement of financial position of the Group had a remaining period to contractual maturity of less than 12 months.
COMPANYGROUP
2017
2016
GROUP COMPANY
99

FBN Holdings Plc.
NOTES TO THE CONSOLIDATED FINANCIAL STATEMENTS
At 31 December 2017
28 Investment properties
At start of period 3,003 3,025
Addition and capital improvement - 12
Disposal - (222)
Net loss from fair value adjustment (2) 188
Reclassification to held for sale (1,008) -
1,993 3,003
Entity:
Location:
Name of the professional:
Name of the professional firm/ entity:
FRC registration number of the professional:
29 Investment in associates (equity method)
i.
ii.
2017 2016 2017 2016
N 'million N 'million N 'million N 'million
FBN Heritage Fund
Balance at beginning of year 1,114 - - 1,500
Reclassification due to loss of control - 900 - -
Fair value gain - 214 - -
Share of profit 430 - - -
Share of other comprehensive income (65) - - -
Dividend received (122) - - -
Disposal of investment - - - (1,500)
At end of year 1,357 1,114 - -
30 Investment in subsidiaries
30.1 Principal subsidiary undertakings
31 December 31 December
2017 2016
N 'million N 'million
DIRECT SUBSIDIAIRES OF FBN HOLDINGS PLC.
First Bank of Nigeria Limited (Note 31 (i)) 205,557 205,557
FBNQuest Capital Limited (Note 31 (ii)) 4,300 4,300
FBN Insurance Limited (Note 31 (iii)) 4,724 4,724
FBN Insurance Brokers Limited (Note 31 (iv)) 25 25
New Villa Limited (Rainbow Town Development Limited) (Note 31 (v)) - -
FBNQuest Merchant Bank Limited (Note 31 (vi)) 17,206 17,206
231,812 231,812
INDIRECT SUBSIDIAIRES OF FBN HOLDINGS PLC.
FBNQuest Trustees Limited (Note 31 (vii)) 6,033 6,033
FBNQuest Funds Limited (Note 31 (viii)) 4,550 4,550
10,583 10,583
242,395 242,395
Seawolf Oilfield Services Limited (SOSL)
FBN Holdings Plc. holds 42% shareholding in Seawolf Oilfields Services Limited (SOSL). In 2014, Asset Mananagement Corporation of Nigeria
(AMCON), a major creditor of SOSL, appointed a receiver manager to take over the business. The investment has been fully impaired.
As at 31 December 2017, the recoverable amount of investment in Rainbow Town Development Limited was lower than the carrying amount.
(Cost: N5billion; Total Impairment: N5billion).
Ubosi Eleh & Co
FRC/2014/NIESV/0000000399
FBN Heritage Fund is an open-ended Securities and Exchange Commission (SEC) registered mutual fund that invests in stocks, bonds, money
market instruments, real estate and other securities in the Nigerian Capital Markets. The fund manager publishes daily unit price of the fund on the
memorandum listing section of the Nigerian Stock Exchange. The unit price of the fund as at reporting date was N111.58 (Cost: N100). In 2016,
the 15m units held by FBNHoldings was sold at an average price of N109.6 per units, resulting in gain on disposal of N144million.
Due to the loss of control, FBN Holdings Plc. deconsolidated the fund from the effective date of loss of control, December 31, 2016, and accounted
for the remaining holdings as associate using equity method. The Group's interest in FBN Heritage Fund as at December 31, 2017 is 40.76%.
Abuja
SOSL is a company incorporated in Nigeria and is involved in the oil and gas sector. SOSL has share capital consisting only of ordinary share
capital which are held directly by the group; the country of incorporation or registration is also their principal place of business. SOSL is not publicly
traded and there is no published price information.
FBN Heritage Fund
FBN Holdings Plc. sold 15million units of its interest in FBN Heritage Fund in 2016. This sale reduced the Group’s interest in the fund to 37.9%,
indicating a loss of control as at December 31, 2016.
Included in investment properties are mainly land acquired by the Group for capital appreciation. At the reporting period, the properties were valued
by registered valuer. The open market values of the properties were determined using recent comparable market prices. The investment properties
fall into level 2 fair value hierarchy and the fair value is recurring.
Jide Taiwo & Co
Lawal Abdulfatai Muritala Animasaun
FRC/2015/NIESV/0000001146
FBN Capital Limited
Lagos
GROUP COMPANY
No rental income (2016: Nil) arose from the investment properties during the year. The rental income, as well as the fair value gain, is included in
other income while fair value loss is included in other operating expense in the income statement. No direct operating expense was incurred on the
investment properties.
The information of the professionals engaged by the various entities within the Group for valuation of their respective investment properties are as
follows:
FBN Insurance Limited
100
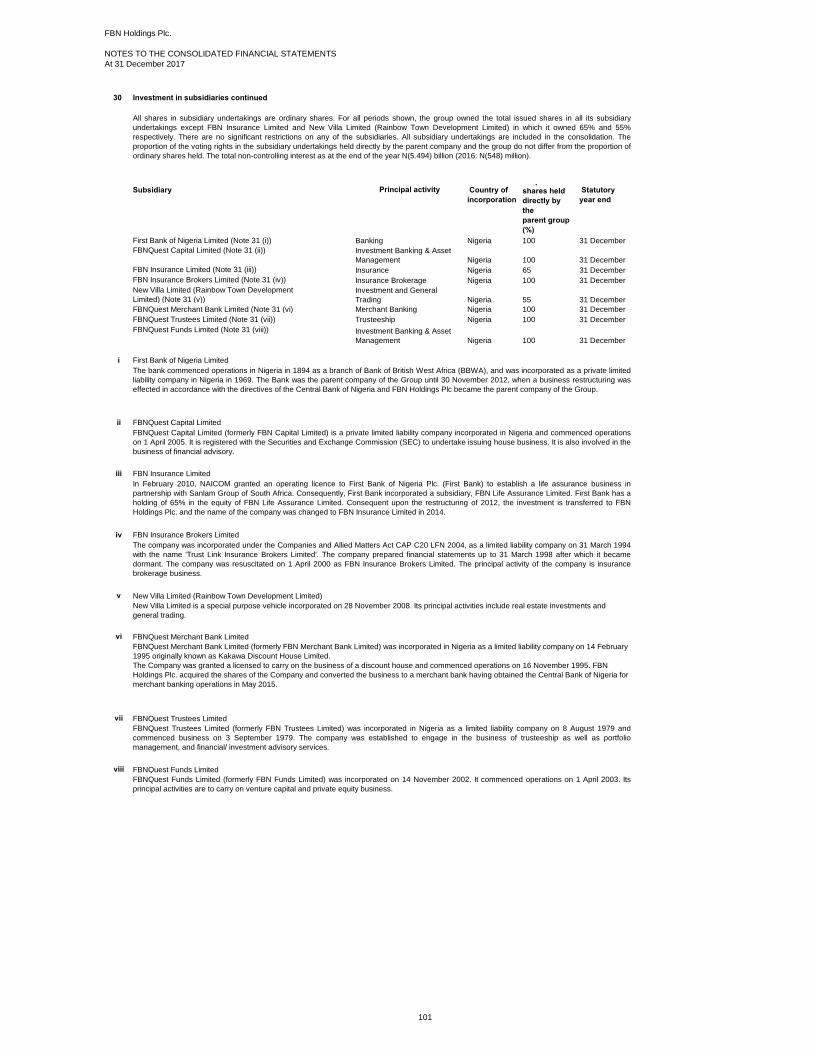
FBN Holdings Plc.
NOTES TO THE CONSOLIDATED FINANCIAL STATEMENTS
At 31 December 2017
30 Investment in subsidiaries continued
Subsidiary
First Bank of Nigeria Limited (Note 31 (i)) Nigeria 100 31 December
FBNQuest Capital Limited (Note 31 (ii))
Nigeria 100 31 December
FBN Insurance Limited (Note 31 (iii)) Nigeria 65 31 December
FBN Insurance Brokers Limited (Note 31 (iv)) Nigeria 100 31 December
New Villa Limited (Rainbow Town Development
Limited) (Note 31 (v)) Nigeria 55 31 December
FBNQuest Merchant Bank Limited (Note 31 (vi) Nigeria 100 31 December
FBNQuest Trustees Limited (Note 31 (vii)) Nigeria 100 31 December
FBNQuest Funds Limited (Note 31 (viii))
Nigeria 100 31 December
i First Bank of Nigeria Limited
ii
iii
iv
v New Villa Limited (Rainbow Town Development Limited)
vi FBNQuest Merchant Bank Limited
vii FBNQuest Trustees Limited
viii FBNQuest Funds Limited
FBNQuest Merchant Bank Limited (formerly FBN Merchant Bank Limited) was incorporated in Nigeria as a limited liability company on 14 February
1995 originally known as Kakawa Discount House Limited.
The Company was granted a licensed to carry on the business of a discount house and commenced operations on 16 November 1995. FBN
Holdings Plc. acquired the shares of the Company and converted the business to a merchant bank having obtained the Central Bank of Nigeria for
merchant banking operations in May 2015.
New Villa Limited is a special purpose vehicle incorporated on 28 November 2008. Its principal activities include real estate investments and
general trading.
FBNQuest Capital Limited (formerly FBN Capital Limited) is a private limited liability company incorporated in Nigeria and commenced operations
on 1 April 2005. It is registered with the Securities and Exchange Commission (SEC) to undertake issuing house business. It is also involved in the
business of financial advisory.
FBN Insurance Limited
FBN Insurance Brokers Limited
Principal activity Statutory
year end
In February 2010, NAICOM granted an operating licence to First Bank of Nigeria Plc. (First Bank) to establish a life assurance business in
partnership with Sanlam Group of South Africa. Consequently, First Bank incorporated a subsidiary, FBN Life Assurance Limited. First Bank has a
holding of 65% in the equity of FBN Life Assurance Limited. Consequent upon the restructuring of 2012, the investment is transferred to FBN
Holdings Plc. and the name of the company was changed to FBN Insurance Limited in 2014.
Merchant Banking
Trusteeship
Investment Banking & Asset
Management
FBNQuest Trustees Limited (formerly FBN Trustees Limited) was incorporated in Nigeria as a limited liability company on 8 August 1979 and
commenced business on 3 September 1979. The company was established to engage in the business of trusteeship as well as portfolio
management, and financial/ investment advisory services.
FBNQuest Funds Limited (formerly FBN Funds Limited) was incorporated on 14 November 2002. It commenced operations on 1 April 2003. Its
principal activities are to carry on venture capital and private equity business.
Banking
Insurance
Insurance Brokerage
Country of
incorporation
Investment and General
Trading
The bank commenced operations in Nigeria in 1894 as a branch of Bank of British West Africa (BBWA), and was incorporated as a private limited
liability company in Nigeria in 1969. The Bank was the parent company of the Group until 30 November 2012, when a business restructuring was
effected in accordance with the directives of the Central Bank of Nigeria and FBN Holdings Plc became the parent company of the Group.
Proportion of
shares held
directly by
the
parent/group
(%)
Investment Banking & Asset
Management
All shares in subsidiary undertakings are ordinary shares. For all periods shown, the group owned the total issued shares in all its subsidiary
undertakings except FBN Insurance Limited and New Villa Limited (Rainbow Town Development Limited) in which it owned 65% and 55%
respectively. There are no significant restrictions on any of the subsidiaries. All subsidiary undertakings are included in the consolidation. The
proportion of the voting rights in the subsidiary undertakings held directly by the parent company and the group do not differ from the proportion of
ordinary shares held. The total non-controlling interest as at the end of the year N(5.494) billion (2016: N(548) million).
The company was incorporated under the Companies and Allied Matters Act CAP C20 LFN 2004, as a limited liability company on 31 March 1994
with the name 'Trust Link Insurance Brokers Limited'. The company prepared financial statements up to 31 March 1998 after which it became
dormant. The company was resuscitated on 1 April 2000 as FBN Insurance Brokers Limited. The principal activity of the company is insurance
brokerage business.
FBNQuest Capital Limited
101
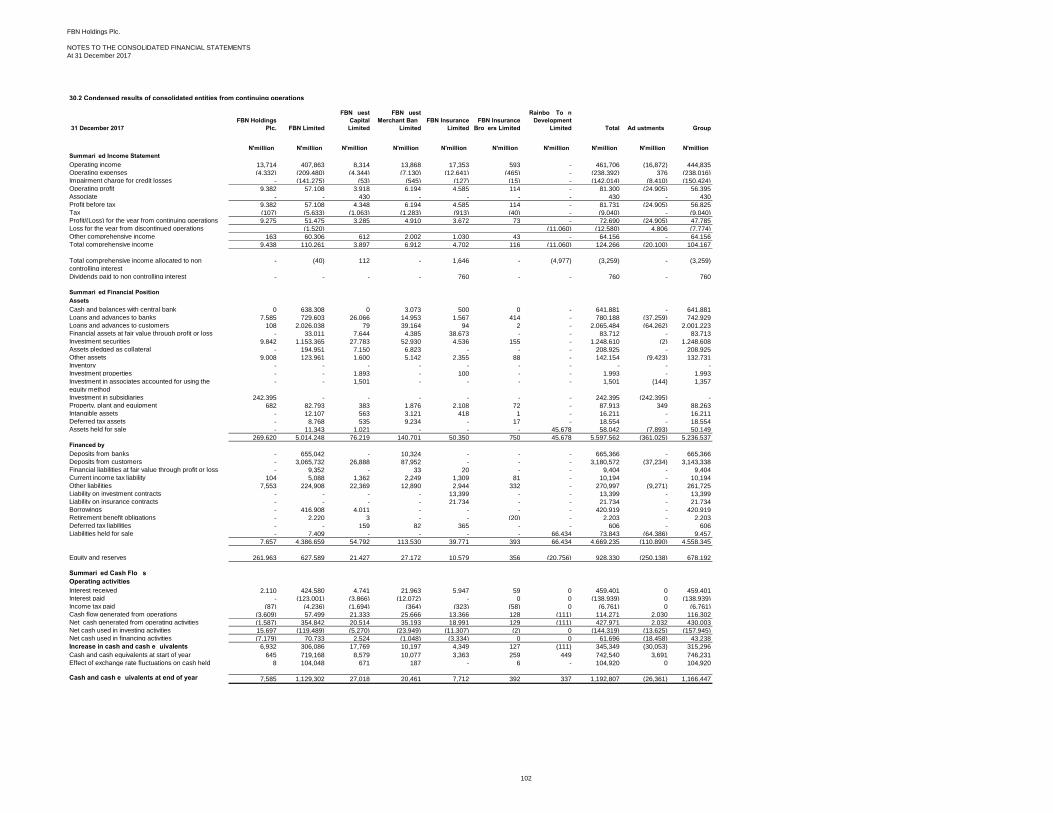
FBN Holdings Plc.
NOTES TO THE CONSOLIDATED FINANCIAL STATEMENTS
At 31 December 2017
30.2 Condensed results of consolidated entities from continuing operations
31 December 2017
FBN Holdings
Plc. FBN Limited
FBNQuest
Capital
Limited
FBNQuest
Merchant Bank
Limited
FBN Insurance
Limited
FBN Insurance
Brokers Limited
Rainbow Town
Development
Limited Total Adjustments Group
N'million N'million N'million N'million N'million N'million N'million N'million N'million N'million
Summarized Income Statement
Operating income 13,714 407,863 8,314 13,868 17,353 593 - 461,706 (16,872) 444,835 Operating expenses (4,332) (209,480) (4,344) (7,130) (12,641) (465) - (238,392) 376 (238,016)Impairment charge for credit losses - (141,275) (53) (545) (127) (15) - (142,014) (8,410) (150,424)Operating profit 9,382 57,108 3,918 6,194 4,585 114 - 81,300 (24,905) 56,395 Associate - - 430 - - - - 430 - 430 Profit before tax 9,382 57,108 4,348 6,194 4,585 114 - 81,731 (24,905) 56,825 Tax (107) (5,633) (1,063) (1,283) (913) (40) - (9,040) - (9,040)Profit/(Loss) for the year from continuing operations 9,275 51,475 3,285 4,910 3,672 73 - 72,690 (24,905) 47,785 Loss for the year from discontinued operations (1,520) (11,060) (12,580) 4,806 (7,774)Other comprehensive income 163 60,306 612 2,002 1,030 43 - 64,156 - 64,156
Total comprehensive income 9,438 110,261 3,897 6,912 4,702 116 (11,060) 124,266 (20,100) 104,167
Total comprehensive income allocated to non
controlling interest
- (40) 112 - 1,646 - (4,977) (3,259) - (3,259)
Dividends paid to non controlling interest - - - - 760 - - 760 - 760
Summarized Financial Position
Assets
Cash and balances with central bank 0 638,308 0 3,073 500 0 - 641,881 - 641,881 Loans and advances to banks 7,585 729,603 26,066 14,953 1,567 414 - 780,188 (37,259) 742,929 Loans and advances to customers 108 2,026,038 79 39,164 94 2 - 2,065,484 (64,262) 2,001,223 Financial assets at fair value through profit or loss - 33,011 7,644 4,385 38,673 - - 83,712 - 83,713 Investment securities 9,842 1,153,365 27,783 52,930 4,536 155 - 1,248,610 (2) 1,248,608 Assets pledged as collateral - 194,951 7,150 6,823 - - - 208,925 - 208,925 Other assets 9,008 123,961 1,600 5,142 2,355 88 - 142,154 (9,423) 132,731 Inventory - - - - - - - - - - Investment properties - - 1,893 - 100 - - 1,993 - 1,993
Investment in associates accounted for using the
equity method
- - 1,501 - - - - 1,501 (144) 1,357
Investment in subsidiaries 242,395 - - - - - - 242,395 (242,395) - Property, plant and equipment 682 82,793 383 1,876 2,108 72 - 87,913 349 88,263 Intangible assets - 12,107 563 3,121 418 1 - 16,211 - 16,211 Deferred tax assets - 8,768 535 9,234 - 17 - 18,554 - 18,554 Assets held for sale - 11,343 1,021 - - - 45,678 58,042 (7,893) 50,149
269,620 5,014,248 76,219 140,701 50,350 750 45,678 5,597,562 (361,025) 5,236,537 Financed by
Deposits from banks - 655,042 - 10,324 - - - 665,366 - 665,366 Deposits from customers - 3,065,732 26,888 87,952 - - - 3,180,572 (37,234) 3,143,338 Financial liabilities at fair value through profit or loss - 9,352 - 33 20 - - 9,404 - 9,404 Current income tax liability 104 5,088 1,362 2,249 1,309 81 - 10,194 - 10,194 Other liabilities 7,553 224,908 22,369 12,890 2,944 332 - 270,997 (9,271) 261,725 Liability on investment contracts - - - - 13,399 - - 13,399 - 13,399 Liability on insurance contracts - - - - 21,734 - - 21,734 - 21,734 Borrowings - 416,908 4,011 - - - - 420,919 - 420,919 Retirement benefit obligations - 2,220 3 - - (20) - 2,203 - 2,203
Deferred tax liabilities - - 159 82 365 - - 606 - 606 Liabilities held for sale - 7,409 - - - - 66,434 73,843 (64,386) 9,457
7,657 4,386,659 54,792 113,530 39,771 393 66,434 4,669,235 (110,890) 4,558,345
Equity and reserves 261,963 627,589 21,427 27,172 10,579 356 (20,756) 928,330 (250,138) 678,192
Summarized Cash Flows
Operating activities
Interest received 2,110 424,580 4,741 21,963 5,947 59 0 459,401 0 459,401 Interest paid - (123,001) (3,866) (12,072) - 0 0 (138,939) 0 (138,939)Income tax paid (87) (4,236) (1,694) (364) (323) (58) 0 (6,761) 0 (6,761)Cash flow generated from operations (3,609) 57,499 21,333 25,666 13,366 128 (111) 114,271 2,030 116,302 Net cash generated from operating activities (1,587) 354,842 20,514 35,193 18,991 129 (111) 427,971 2,032 430,003 Net cash used in investing activities 15,697 (119,489) (5,270) (23,949) (11,307) (2) 0 (144,319) (13,625) (157,945)Net cash used in financing activities (7,179) 70,733 2,524 (1,048) (3,334) 0 0 61,696 (18,458) 43,238
Increase in cash and cash equivalents 6,932 306,086 17,769 10,197 4,349 127 (111) 345,349 (30,053) 315,296
Cash and cash equivalents at start of year 645 719,168 8,579 10,077 3,363 259 449 742,540 3,691 746,231
Effect of exchange rate fluctuations on cash held 8 104,048 671 187 - 6 - 104,920 0 104,920
Cash and cash equivalents at end of year 7,585 1,129,302 27,018 20,461 7,712 392 337 1,192,807 (26,361) 1,166,447
102

FBN Holdings Plc.
NOTES TO THE CONSOLIDATED FINANCIAL STATEMENTS
At 31 December 2017
30.2 Condensed results of consolidated entities from continuing operations
31 December 2016
FBN Holdings
Plc. FBN Limited
FBNQuest
Capital Limited
FBNQuest
Merchant Bank
Limited
FBN Insurance
Limited
FBN Insurance
Brokers Limited
FBN Heritage
Fund
Rainbow Town
Development
Limited Total Adjustments Group
N'million N'million N'million N'million N'million N'million N'million N'million N'million N'million N'million
Summarized Income Statement
Operating income 12,715 434,663 16,961 8,115 11,362 572 456 (4,313) 480,529 (10,611) 469,918
Operating expenses (5,103) (199,039) (7,267) (3,289) (7,988) (534) (310) (182) (223,711) 2,778 (220,933)
Impairment charge for credit losses - (224,948) (1,173) 90 (7) 0 - - (226,038) 1 (226,037)
Operating profit 7,611 10,676 8,521 4,916 3,367 38 146 (4,494) 30,780 (7,832) 22,948
Associate - - 108 - - - - - 108 (108) -
Profit before tax 7,611 10,676 8,630 4,916 3,367 38 146 (4,494) 30,888 (7,940) 22,948
Tax (104) 1,093 (3,364) (16) (986) (35) - - (3,413) (2,394) (5,807)
Profit/(Loss) for the year from continuing operations 7,507 11,768 5,266 4,900 2,380 4 146 (4,494) 27,476 (10,336) 17,141
Loss for the year from discontinued operations (1,317) (1,317) (3,580) (4,898)
Other comprehensive income 2 3,136 (2,464) (2,736) (1,091) 91 (32) - (3,095) (4) (3,099)
Total comprehensive income 7,509 13,586 2,803 2,164 1,289 95 113 (4,494) 23,064 (13,920) 9,144
Total comprehensive income allocated to non
controlling interest
- (789) (1,427) - 451 - 42 (2,023) (3,746) (740) (4,486)
Dividends paid to non controlling interest - 174 - - 996 - 72 - 1,243 - 1,243
Summarized Financial Position
Assets
Cash and balances with central bank 0 689,598 1 66 500 0 - - 690,165 - 690,165
Loans and advances to banks 644 437,936 7,404 5,651 1,091 237 16 107 453,086 (8,215) 444,871
Loans and advances to customers 65 2,086,740 - 41,684 244 49 78 - 2,128,860 (44,966) 2,083,894
Financial assets at fair value through profit or loss - 23,493 5,377 17,678 162 - 1,209 - 47,919 (1,208) 46,711
Investment securities 12,350 961,236 30,254 20,836 25,811 102 1,662 - 1,052,251 (1,663) 1,050,588
Assets pledged as collateral - 161,134 - 36,286 - - - - 197,420 - 197,420
Other assets 10,598 38,610 4,302 4,645 1,539 102 - 1,504 61,300 (13,514) 47,786
Inventory - - - - - - - 44,204 44,204 (44,204) -
Investment properties - - 2,898 - 105 - - - 3,003 - 3,003
Investment in associates accounted for using the
equity method
- - 1,258 - - - - - 1,258 (144) 1,114
Investment in subsidiaries 242,395 - - - - - - - 242,395 (242,395) -
Property, plant and equipment 849 83,358 766 1,056 1,886 51 - 6 87,972 343 88,315
Intangible assets - 11,913 2,057 973 382 3 - 6 15,334 (6) 15,328
Deferred tax assets - 8,296 565 8,398 - 19 - - 17,278 - 17,278
Assets held for sale - 12,479 - - - - - - 12,479 37,853 50,332
266,902 4,514,792 54,882 137,272 31,720 563 2,966 45,826 5,054,921 (318,116) 4,736,805 Financed by
Deposits from banks - 377,214 - 38,864 - - - - 416,078 - 416,078
Deposits from customers - 3,030,091 17,547 64,728 - - - - 3,112,366 (8,145) 3,104,221
Financial liabilities at fair value through profit or loss - 37,137 - - - - - - 37,137 0 37,137
Current income tax liability 84 4,805 3,164 364 426 53 - 6 8,902 (5) 8,897
Other liabilities 7,114 217,553 15,207 4,358 2,843 170 25 1,898 249,168 (13,780) 235,388
Liability on investment contracts - - - - 9,440 - - - 9,440 - 9,440
Liability on insurance contracts - - - - 10,287 - - - 10,287 - 10,287
Borrowings - 316,792 0 - - - - 53,619 370,411 (53,619) 316,792
Retirement benefit obligations - 2,648 6 - - 8 - - 2,662 - 2,662
Deferred tax liabilities - 2 138 - 673 - - - 813 - 813
Liabilities held for sale - 10,611 - - - - - - 10,611 1,904 12,515
7,198 3,996,852 36,062 108,314 23,669 232 25 55,523 4,227,874 (73,644) 4,154,230
Equity and reserves 259,704 517,940 18,820 28,958 8,051 331 2,941 (9,697) 827,049 (244,474) 582,575
Summarized Cash Flows
Operating activities
Interest received 538 367,992 5,763 13,776 0 59 287 0 388,416 (287) 388,128
Interest paid - (89,410) (2,383) (8,259) - 0 0 0 (100,052) 15,879 (84,173)
Income tax paid (20) (5,062) (1,946) (184) (203) (58) 0 0 (7,473) (416) (7,889)
Cash flow generated from operations (1,728) (106,622) 615 2,681 10,943 65 558 (217) (93,705) 28,925 (64,780)
Net cash generated from operating activities (1,210) 166,898 2,049 8,014 10,739 66 845 (217) 187,185 44,101 231,285
Net cash used in investing activities 2,341 (175,575) (8,093) (9,311) (15,457) (10) 58 0 (206,046) (5,610) (211,656)
Net cash used in financing activities (5,384) (18,740) (3,061) 0 (1,014) (600) (1,554) 0 (30,353) (16,355) (46,707)
Increase in cash and cash equivalents (4,252) (27,417) (9,104) (1,297) (5,732) (543) (651) (217) (49,213) 22,135 (27,078)
Cash and cash equivalents at start of year 4,792 644,973 12,567 11,271 9,094 797 332 668 684,495 (18,127) 666,368
Effect of exchange rate fluctuations on cash held 105 101,612 5,115 102 - 6 - - 106,941 0 106,941
Cash and cash equivalents at end of year 645 719,168 8,579 10,077 3,363 259 (320) 449 742,220 4,011 746,231
103
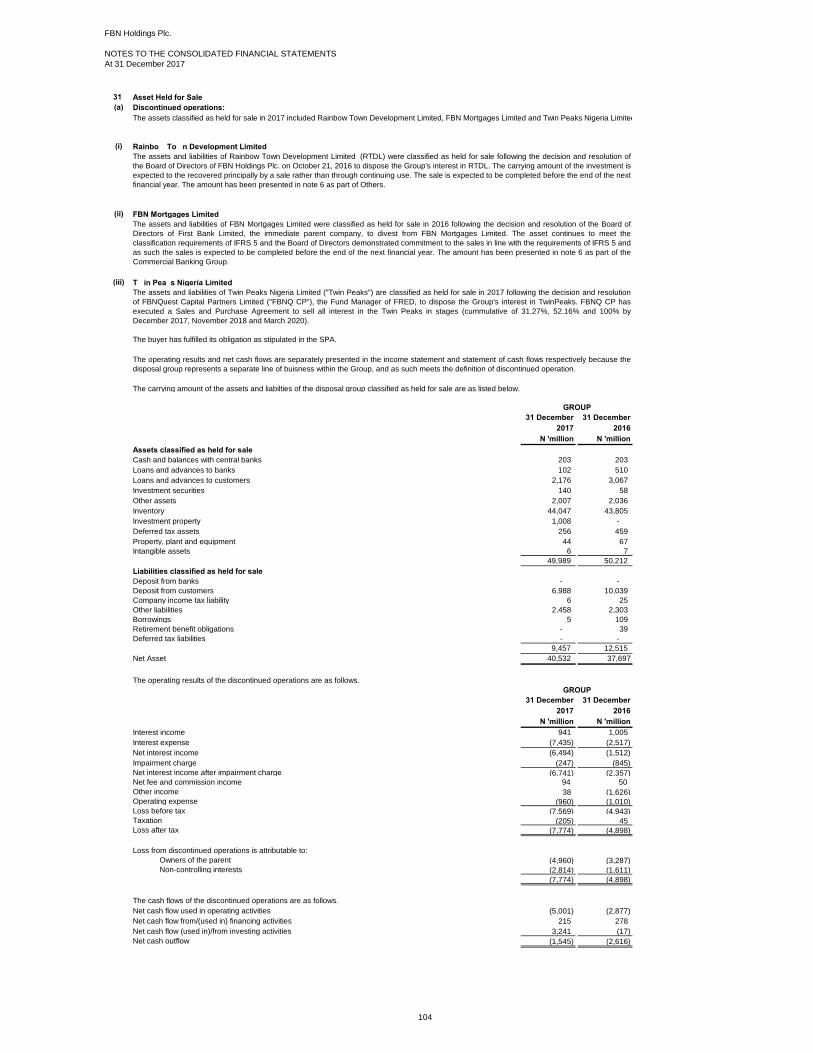
FBN Holdings Plc.
NOTES TO THE CONSOLIDATED FINANCIAL STATEMENTS
At 31 December 2017
31
(a) Discontinued operations:
(i) Rainbow Town Development Limited
(ii) FBN Mortgages Limited
(iii) Twin Peaks Nigeria Limited
The carrying amount of the assets and liabilties of the disposal group classified as held for sale are as listed below.
31 December 31 December
2017 2016
N 'million N 'million
Assets classified as held for sale
Cash and balances with central banks 203 203
Loans and advances to banks 102 510
Loans and advances to customers 2,176 3,067
Investment securities 140 58
Other assets 2,007 2,036
Inventory 44,047 43,805
Investment property 1,008 -
Deferred tax assets 256 459
Property, plant and equipment 44 67
Intangible assets 6 7
49,989 50,212
Liabilities classified as held for sale
Deposit from banks - -
Deposit from customers 6,988 10,039
Company income tax liability 6 25
Other liabilities 2,458 2,303
Borrowings 5 109
Retirement benefit obligations - 39
Deferred tax liabilities - -
9,457 12,515
Net Asset 40,532 37,697
The operating results of the discontinued operations are as follows.
31 December 31 December
2017 2016
N 'million N 'million
Interest income 941 1,005
Interest expense (7,435) (2,517)
Net interest income (6,494) (1,512)
Impairment charge (247) (845)
Net interest income after impairment charge (6,741) (2,357)
Net fee and commission income 94 50
Other income 38 (1,626)
Operating expense (960) (1,010)
Loss before tax (7,569) (4,943)
Taxation (205) 45
Loss after tax (7,774) (4,898)
Owners of the parent (4,960) (3,287)
Non-controlling interests (2,814) (1,611)
(7,774) (4,898)
The cash flows of the discontinued operations are as follows.
Net cash flow used in operating activities (5,001) (2,877)
Net cash flow from/(used in) financing activities 215 278
Net cash flow (used in)/from investing activities 3,241 (17)
Net cash outflow (1,545) (2,616)
The assets and liabilities of Rainbow Town Development Limited (RTDL) were classified as held for sale following the decision and resolution of
the Board of Directors of FBN Holdings Plc. on October 21, 2016 to dispose the Group's interest in RTDL. The carrying amount of the investment is
expected to the recovered principally by a sale rather than through continuing use. The sale is expected to be completed before the end of the next
financial year. The amount has been presented in note 6 as part of Others.
The assets and liabilities of Twin Peaks Nigeria Limited ("Twin Peaks") are classified as held for sale in 2017 following the decision and resolution
of FBNQuest Capital Partners Limited ("FBNQ CP"), the Fund Manager of FRED, to dispose the Group's interest in TwinPeaks. FBNQ CP has
executed a Sales and Purchase Agreement to sell all interest in the Twin Peaks in stages (cummulative of 31.27%, 52.16% and 100% by
December 2017, November 2018 and March 2020).
The buyer has fulfilled its obligation as stipulated in the SPA.
Asset Held for Sale
GROUP
The assets classified as held for sale in 2017 included Rainbow Town Development Limited, FBN Mortgages Limited and Twin Peaks Nigeria Limited.
GROUP
The operating results and net cash flows are separately presented in the income statement and statement of cash flows respectively because the
disposal group represents a separate line of buisness within the Group, and as such meets the definition of discontinued operation.
Loss from discontinued operations is attributable to:
The assets and liabilities of FBN Mortgages Limited were classified as held for sale in 2016 following the decision and resolution of the Board of
Directors of First Bank Limited, the immediate parent company, to divest from FBN Mortgages Limited. The asset continues to meet the
classification requirements of IFRS 5 and the Board of Directors demonstrated commitment to the sales in line with the requirements of IFRS 5 and
as such the sales is expected to be completed before the end of the next financial year. The amount has been presented in note 6 as part of the
Commercial Banking Group.
104

FBN Holdings Plc.
NOTES TO THE CONSOLIDATED FINANCIAL STATEMENTS
At 31 December 2017
(b) Non current asset held for sale
31 December 31 December
2016 2015
N 'million N 'million
Property, plant and equipment 160 120
Total Assets classified as held for sale 50,149 50,332
FBN Senegal, a subsidiary of First Bank of Nigeria Limited, has classified a building from its Property, Plant and Equipment as held for sale,
following management's decision to dispose the asset within 12 months in line with IFRS 5.
GROUP
105

FBN Holdings Plc.
NOTES TO THE CONSOLIDATED FINANCIAL STATEMENTS
At 31 December 2017
32 Property, plant and equipment
GROUP
Improvement Land Motor Office Computer Furniture Plant Work in
& buildings vehicles equipment equipment & fittings & machinery progress* Total
N million N million N million N million N million N million N million N million N million
Cost
At 1 January 2016 45,372 21,009 12,113 40,251 12,612 9,120 147 5,583 146,207
Additions 951 100 2,196 3,597 1,952 905 13 3,130 12,844
Reclassifications 24 - (18) 1,471 40 308 4 (3,549) (1,720)
Disposals - - (2,017) (750) (77) (44) (0) (169) (3,057)
Write Offs (8) - - - - - - (92) (101)
Discontinued Operations (161) - (190) (45) (56) (30) (11) - (492)
Exchange difference 1,216 22 297 292 554 189 36 143 2,749
At 31 December 2016 47,395 21,131 12,380 44,817 15,025 10,448 189 5,046 156,430
Accumulated depreciation
At 1 January 2016 7,511 - 7,005 27,635 9,899 5,668 91 (0) 57,809
Charge for the year 1,410 0 2,270 4,680 1,827 1,372 25 - 11,584
Reclassifications 0 - - 31 (29) (2) - - 0
Disposals - - (1,556) (566) (26) (40) (0) - (2,188)
Write Offs - - - - - - - - -
Discontinued Operations (39) - (119) (36) (50) (27) (9) - (281)
Exchange differences 297 (0) 164 184 401 123 21 - 1,191
At 31 December 2016 9,179 0 7,764 31,928 12,021 7,094 128 (0) 68,115
Net book amount at 31 December 2016 38,215 21,131 4,616 12,889 3,004 3,354 61 5,046 88,315
Cost
At 1 January 2017 47,395 21,131 12,380 44,817 15,025 10,448 189 5,046 156,430
Additions 842 59 2,099 2,291 1,892 427 37 5,169 12,816
Reclassifications 922 - 14 630 264 (577) - (1,253) -
Disposals (1) (11) (1,714) (533) (52) (134) - - (2,445)
Write Offs - - - - - - - - -
Held for sale (12) - - - - - - - (12)
Exchange difference (683) 3 (133) (255) (331) (7) 17 (55) (1,444)
At 31 December 2017 48,463 21,182 12,646 46,950 16,797 10,157 243 8,907 165,346
Accumulated depreciation
At 1 January 2017 9,179 0 7,764 31,928 12,021 7,094 128 (0) 68,115
Charge for the year 1,569 2,109 4,788 1,873 1,234 27 - 11,600
Reclassifications 239 - - 77 12 (328) - - -
Disposals (1) - (1,254) (512) (50) (132) - - (1,949)
Discontinued Operations - - - - - - - - -
Exchange differences (123) (118) (171) (276) (8) 12 - (684)
At 31 December 2017 10,863 0 8,502 36,110 13,580 7,860 167 (0) 77,083
Net book amount at 31 December 2017 37,600 21,182 4,145 10,840 3,217 2,297 76 8,907 88,263
Exchange Difference on Property, Plant and Equipment
These exchange difference on property, plant and equipment occurs as a result of translation of balances relating to the foreign entities of the group as at reporting date. The subsidiaries whose translation gave rise to the difference are FBN
Bank (UK) and FBN Bank (Congo).
* Work in progress refers to capital expenditures incurred on items of property, plant and equipment which are however not ready for use and as such are not being depreciated.
No capitalised borrowing cost relates to the acquisition of property, plant and equipment during the year.
106

FBN Holdings Plc.
NOTES TO THE CONSOLIDATED FINANCIAL STATEMENTS
At 31 December 2017
32 Property, plant and equipment
COMPANY
Improvement Motor Office Computer Furniture
& buildings vehicles equipment equipment & fittings Total
N million N million N million N million N million N million
Cost
At 1 January 2016 615 274 446 5 454 1,793
Additions - 29 1 3 6 39
Disposal - - - - - -
At 31 December 2016 615 303 447 8 460 1,832
Accumulated depreciation
At 1 January 2016 184 101 138 2 177 602
Charge for the year 123 72 89 2 96 381
Disposal - - - - - -
At 31 December 2016 307 173 227 4 273 983
Net book amount at 31 December 2016 308 130 220 4 187 849
Cost
At 1 January 2017 615 303 447 8 460 1,832
Additions - 228 2 4 1 235
Disposal - (55) - (0) - (56)
At 31 December 2017 615 474 448 13 461 2,010
Accumulated depreciation
At 1 January 2017 307 173 227 4 273 983
Charge for the year 123 96 89 3 88 398
Disposal - (51) - (0) - (51)
At 31 December 2017 430 217 316 6 360 1,330
Net book amount at 31 December 2017 186 257 132 6 101 680
107

FBN Holdings Plc.
NOTES TO THE CONSOLIDATED FINANCIAL STATEMENTS
At 31 December 2017
33 Intangible assets
Goodwill Customer Brand Core Computer Total
Relationship Deposits Software
Cost
At 1 January 2016 5,528 52 326 688 10,512 17,106
Additions - - - - 6,161 6,161
Reclassification 1,502 1,502
Disposals (116) (116)
Effect of adjustment from discontinued operations (13) (13)
Exchange difference 974 - - 217 774 1,965
At 31 December 2016 6,502 52 326 905 18,820 26,605
Additions - - - - 6,114 6,114
Reclassification - - - - (1,087) (1,087)
Exchange difference 146 - - 49 389 584
At 31 December 2017 6,648 52 326 954 24,235 32,216
Amortisation and impairment
At 1 January 2016 1,925 52 326 292 4,824 7,419
Amortisation charge - - - 208 3,116 3,324
Effect of adjustment from discontinued operations - - - - (6) (6)
Disposals - - - - (61) (61)
Exchange difference - - - 73 528 601
At 31 December 2016 1,925 52 326 573 8,401 11,277
Amortisation charge - - - 177 4,024 4,201
Exchange difference - - - 31 496 527
At 31 December 2017 1,925 52 326 781 12,921 16,005
Net book value
At 31 December 2017 4,723 - - 173 11,314 16,211
At 31 December 2016 4,578 - - 332 10,418 15,328
The amortisation charge for the year is included in the income statement.
The software is not internally generated.
Impairment tests for goodwill
The recoverable amount of each CGU has been based on value in use and the weighted average cost of capital (WACC). These calculations use
pre-tax cash flow projection covering five years. The cash flow projections for each CGU are based on forecasts approved by senior management.
The nominal growth rate reflects GDP and inflation for the countries within which the CGU operates or derives revenue from. The rates are based
on IMF forecast growth rates as they represent an objective estimate of likely future trends.
The discount rate used to discount the cash flows is based on the cost of capital assigned to each CGU, which is derived using a Capital Asset
Pricing Model (CAPM). The CAPM depends on inputs reflecting a number of financial and economic variables including the risk free rate and a
premium to reflect the inherent risk of the business being evaluated. These variables are based on the market’s assessment of the economic
variables and management’s judgement. The discount rates for each CGU are refined to reflect the rates of inflation for the countries within which
the CGU operates.
Goodwill is reviewed annually for impairment, or more fequently when there are indications that impairment may have occurred. The test involves
comparing the carrying value of goodwill with the recoverable amount, which is the present value of the pre-tax cash flows, discounted at a rate of
interest that reflects the inherent risks of the cash-generating unit to which the goodwill relates or the CGU's fair value if this is higher.
There was no impairment identified in the year ended 31 December, 2017.
Brands, customer deposits and customer relationships acquired in a business combination are recognised at fair value at the acquisition date.
They have finite useful lives and are subsequently carried at cost less accumulated amortisation and accumulated impairment losses. These costs
are amortised to profit or loss using straightline method over 3 years, 5 years and 2 years respectively. The Brand and Customer relationship
intangible assets were written off due to a change in the name of the acquired entities.
Goodwill is monitored on the operating segment level. The entity to which the goodwill relates is recognized as a cash generating unit (CGU) and
segmented as part of the Commercial Banking Business and Insurance Business Groups.
The goodwill balance of N4.72 billion includes N0.55 billion attributable to the acquisition of FBN Bank DRC in the Democratic Republic of Congo
concluded in 2013; N3.91 billion attributable to the acquisition of the ICB West Africa entities in 2013 and 2014; and N0.26 billion attributable to the
acquisition of FBN General Insurance Limited (formerly Oasis Insurance Plc) in 2014. The goodwill attributable to acquisition of FBN Bank DRC and
ICB West Africa entities is included in the Commercial Banking Group operating segment while goodwill attributable to acquisition of FBN General
Insurance Limited is included in Insurance Group operating segment.
GROUP
108
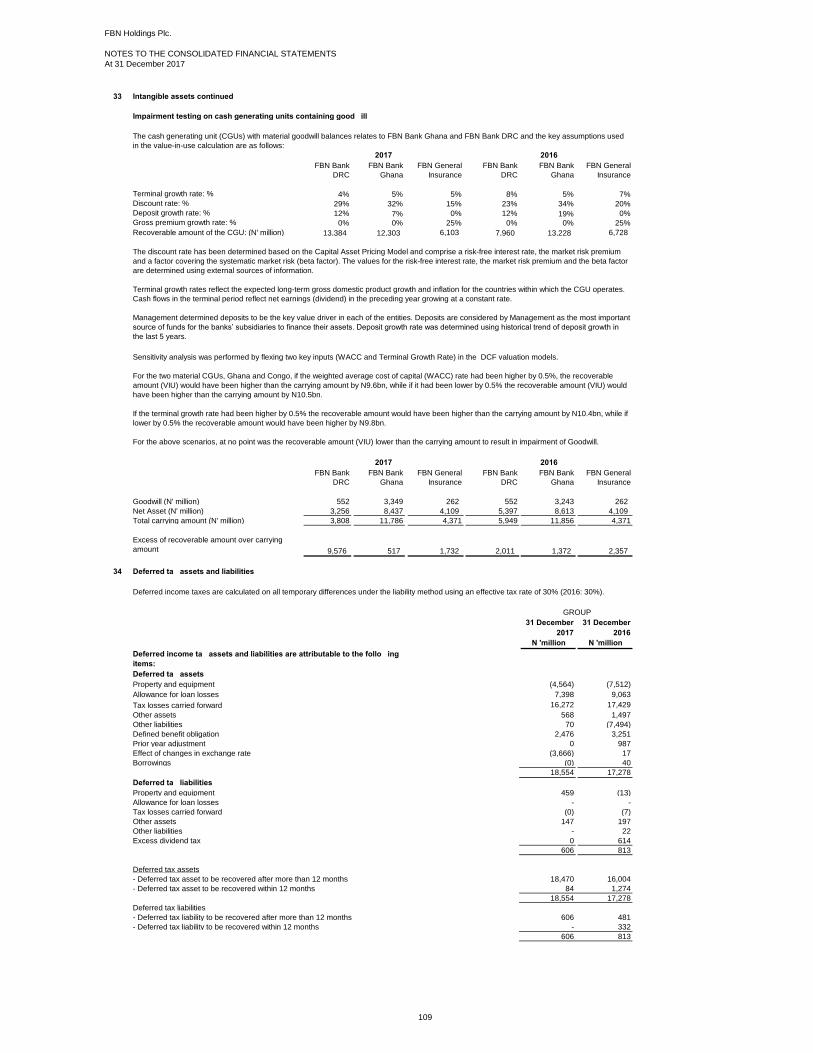
FBN Holdings Plc.
NOTES TO THE CONSOLIDATED FINANCIAL STATEMENTS
At 31 December 2017
33 Intangible assets continued
Impairment testing on cash generating units containing goodwill
FBN Bank
DRC
FBN Bank
Ghana
FBN General
Insurance
FBN Bank
DRC
FBN Bank
Ghana
FBN General
Insurance
4% 5% 5% 8% 5% 7%
29% 32% 15% 23% 34% 20%
12% 7% 0% 12% 19% 0%
0% 0% 25% 0% 0% 25%
Recoverable amount of the CGU: (N' million) 13,384 12,303 6,103 7,960 13,228 6,728
FBN Bank
DRC
FBN Bank
Ghana
FBN General
Insurance
FBN Bank
DRC
FBN Bank
Ghana
FBN General
Insurance
Goodwill (N' million) 552 3,349 262 552 3,243 262
Net Asset (N' million) 3,256 8,437 4,109 5,397 8,613 4,109
Total carrying amount (N' million) 3,808 11,786 4,371 5,949 11,856 4,371
Excess of recoverable amount over carrying
amount 9,576 517 1,732 2,011 1,372 2,357
34 Deferred tax assets and liabilities
31 December 31 December
2017 2016
N 'million N 'million
Deferred tax assets
Property and equipment (4,564) (7,512)
Allowance for loan losses 7,398 9,063
Tax losses carried forward 16,272 17,429
Other assets 568 1,497
Other liabilities 70 (7,494)
Defined benefit obligation 2,476 3,251
Prior year adjustment 0 987
Effect of changes in exchange rate (3,666) 17
Borrowings (0) 40
18,554 17,278
Deferred tax liabilities
Property and equipment 459 (13)
Allowance for loan losses - -
Tax losses carried forward (0) (7)
Other assets 147 197
Other liabilities - 22
Excess dividend tax 0 614
606 813
Deferred tax assets
- Deferred tax asset to be recovered after more than 12 months 18,470 16,004
- Deferred tax asset to be recovered within 12 months 84 1,274
18,554 17,278
Deferred tax liabilities
- Deferred tax liability to be recovered after more than 12 months 606 481
- Deferred tax liability to be recovered within 12 months - 332
606 813
The discount rate has been determined based on the Capital Asset Pricing Model and comprise a risk-free interest rate, the market risk premium
and a factor covering the systematic market risk (beta factor). The values for the risk-free interest rate, the market risk premium and the beta factor
are determined using external sources of information.
Terminal growth rates reflect the expected long-term gross domestic product growth and inflation for the countries within which the CGU operates.
Cash flows in the terminal period reflect net earnings (dividend) in the preceding year growing at a constant rate.
Management determined deposits to be the key value driver in each of the entities. Deposits are considered by Management as the most important
source of funds for the banks’ subsidiaries to finance their assets. Deposit growth rate was determined using historical trend of deposit growth in
the last 5 years.
The cash generating unit (CGUs) with material goodwill balances relates to FBN Bank Ghana and FBN Bank DRC and the key assumptions used
in the value-in-use calculation are as follows:
GROUP
Deferred income tax assets and liabilities are attributable to the following
items:
Deferred income taxes are calculated on all temporary differences under the liability method using an effective tax rate of 30% (2016: 30%).
Terminal growth rate: %
Deposit growth rate: %
Sensitivity analysis was performed by flexing two key inputs (WACC and Terminal Growth Rate) in the DCF valuation models.
For the two material CGUs, Ghana and Congo, if the weighted average cost of capital (WACC) rate had been higher by 0.5%, the recoverable
amount (VIU) would have been higher than the carrying amount by N9.6bn, while if it had been lower by 0.5% the recoverable amount (VIU) would
have been higher than the carrying amount by N10.5bn.
If the terminal growth rate had been higher by 0.5% the recoverable amount would have been higher than the carrying amount by N10.4bn, while if
lower by 0.5% the recoverable amount would have been higher by N9.8bn.
For the above scenarios, at no point was the recoverable amount (VIU) lower than the carrying amount to result in impairment of Goodwill.
20162017
2017 2016
Gross premium growth rate: %
Discount rate: %
109
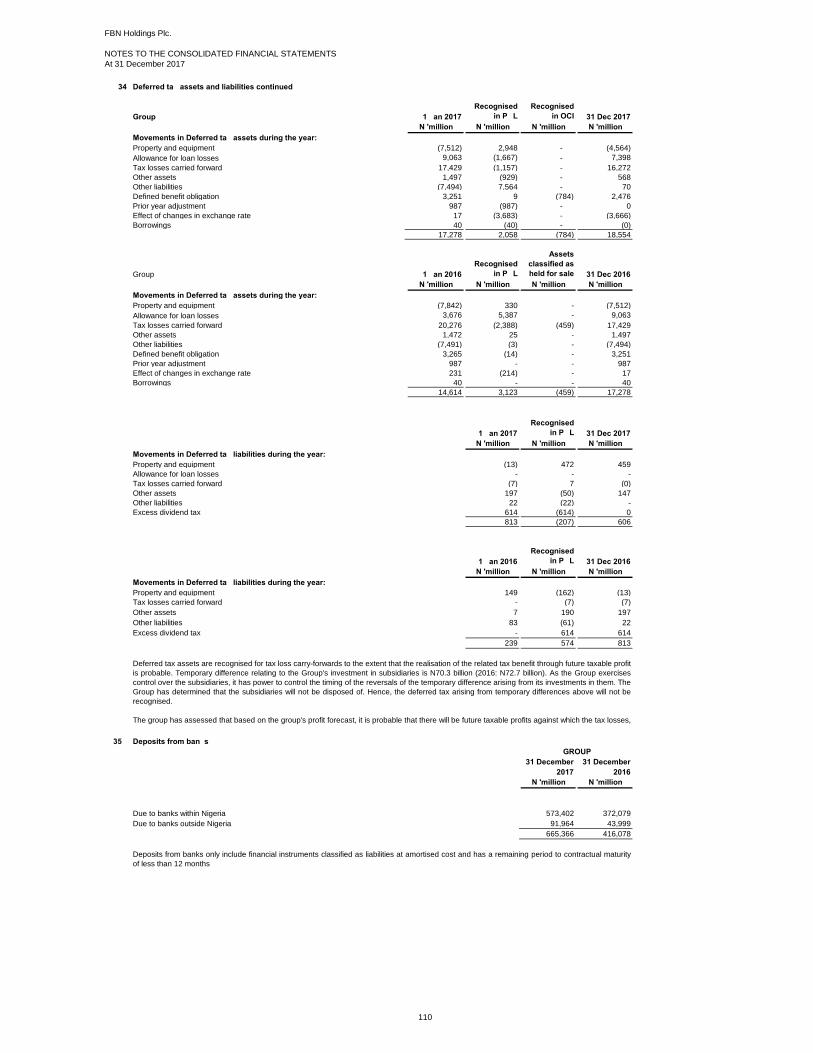
FBN Holdings Plc.
NOTES TO THE CONSOLIDATED FINANCIAL STATEMENTS
At 31 December 2017
34 Deferred tax assets and liabilities continued
Group 1 Jan 2017
Recognised
in P&L
Recognised
in OCI 31 Dec 2017
N 'million N 'million N 'million N 'million
Movements in Deferred tax assets during the year:
Property and equipment (7,512) 2,948 - (4,564)
Allowance for loan losses 9,063 (1,667) - 7,398
Tax losses carried forward 17,429 (1,157) - 16,272
Other assets 1,497 (929) - 568
Other liabilities (7,494) 7,564 - 70
Defined benefit obligation 3,251 9 (784) 2,476
Prior year adjustment 987 (987) - 0
Effect of changes in exchange rate 17 (3,683) - (3,666)
Borrowings 40 (40) - (0)
17,278 2,058 (784) 18,554
Group 1 Jan 2016
Recognised
in P&L
Assets
classified as
held for sale 31 Dec 2016
N 'million N 'million N 'million N 'million
Movements in Deferred tax assets during the year:
Property and equipment (7,842) 330 - (7,512)
Allowance for loan losses 3,676 5,387 - 9,063
Tax losses carried forward 20,276 (2,388) (459) 17,429
Other assets 1,472 25 - 1,497
Other liabilities (7,491) (3) - (7,494)
Defined benefit obligation 3,265 (14) - 3,251
Prior year adjustment 987 - - 987
Effect of changes in exchange rate 231 (214) - 17
Borrowings 40 - - 40
14,614 3,123 (459) 17,278
1 Jan 2017
Recognised
in P&L 31 Dec 2017
N 'million N 'million N 'million
Movements in Deferred tax liabilities during the year:
Property and equipment (13) 472 459
Allowance for loan losses - - -
Tax losses carried forward (7) 7 (0)
Other assets 197 (50) 147
Other liabilities 22 (22) -
Excess dividend tax 614 (614) 0
813 (207) 606
1 Jan 2016
Recognised
in P&L 31 Dec 2016
N 'million N 'million N 'million
Movements in Deferred tax liabilities during the year:
Property and equipment 149 (162) (13)
Tax losses carried forward - (7) (7)
Other assets 7 190 197
Other liabilities 83 (61) 22
Excess dividend tax - 614 614
239 574 813
35 Deposits from banks
31 December 31 December
2017 2016
N 'million N 'million
Due to banks within Nigeria 573,402 372,079
Due to banks outside Nigeria 91,964 43,999
665,366 416,078
GROUP
Deferred tax assets are recognised for tax loss carry-forwards to the extent that the realisation of the related tax benefit through future taxable profit
is probable. Temporary difference relating to the Group's investment in subsidiaries is N70.3 billion (2016: N72.7 billion). As the Group exercises
control over the subsidiaries, it has power to control the timing of the reversals of the temporary difference arising from its investments in them. The
Group has determined that the subsidiaries will not be disposed of. Hence, the deferred tax arising from temporary differences above will not be
recognised.
The group has assessed that based on the group's profit forecast, it is probable that there will be future taxable profits against which the tax losses,
from which deferred tax asset has been recognised, can be utilised.
Deposits from banks only include financial instruments classified as liabilities at amortised cost and has a remaining period to contractual maturity
of less than 12 months
110

FBN Holdings Plc.
NOTES TO THE CONSOLIDATED FINANCIAL STATEMENTS
At 31 December 2017
36 Deposits from customers
31 December 31 December
2017 2016
N 'million N 'million
Current 751,250 735,325
Savings 1,014,433 952,689
Term 881,196 842,260
Domiciliary 483,996 564,679
Electronic purse 12,463 9,268
3,143,338 3,104,221
Current 2,924,964 2,884,627
Non-current 218,374 219,594
3,143,338 3,104,221
37 Other liabilities
31 December 31 December 31 December 31 December
2017 2016 2017 2016
N 'million N 'million N 'million N 'million
Financial liabilities:
Customer deposits for letters of credit 81,083 112,492 - -
Accounts payable 92,973 39,385 - -
Creditors 6,769 17,660 206 237
Bank cheques 22,827 12,426 - -
Collection on behalf of third parties 11,156 5,772 - -
Unclaimed dividend 6,342 5,812 6,342 5,812
Accruals 5,260 3,530 1,005 1,065
226,410 197,077 7,553 7,114
Non financial liabilities:
35,315 38,311 - -
Other liabilities balance 261,725 235,388 7,553 7,114
38 Liability on investment contracts
31 December 31 December
2017 2016
N 'million N 'million
Long term clients 13,399 9,440
13,399 9,440
Non-current 13,399 9,440
39 Liability on insurance contracts
31 December 31 December
2017 2016
N 'million N 'million
Outstanding claims 1,588 975
Unearned premium 1,242 891
Short term insurance contract - Claims incurred but not reported (IBNR) 1,670 614
Liability on annuity fund 7,432 1,519
Liability on long term insurance contract - Life fund 9,802 6,288
21,734 10,287
Current 4,499 2,480
Non-current 17,235 7,807
21,734 10,287
Reconciliation of changes in liability on insurance contracts
Outstandin
g claims
Unearned
premium
IBNR claims
on short term
insurance
Annuity fund Life fund Total
N'million N'million N'million N'million N'million N'million
At 1 January 2017 975 891 614 1,519 6,288 10,287
Claims incurred 4,112 - - - - 4,112
Claims paid (3,499) - - - - (3,499)
Change in the year - 351 1,056 5,913 3,514 10,834
As at 31 December 2017 1,588 1,242 1,670 7,432 9,802 21,734
Outstandin
g claims
Unearned
premium
IBNR claims
on short term
insurance
Annuity fund Life fund Total
N'million N'million N'million N'million N'million N'million
At 1 January 2016 757 1,235 502 2 9,341 11,837
Claims incurred 3,000 - - - - 3,000
Claims paid (2,782) - - - - (2,782)
Change in the year - (344) 112 1,517 (3,053) (1,768)
As at 31 December 2016 975 891 614 1,519 6,288 10,287
2017
GROUP
Other liabilities are expected to be settled within no more than 12 months after the date of the consolidated statement of financial position.
GROUP
2016
Deposits from customers only include financial instruments classified as liabilities at amortised cost.
COMPANY
GROUP
GROUP
111
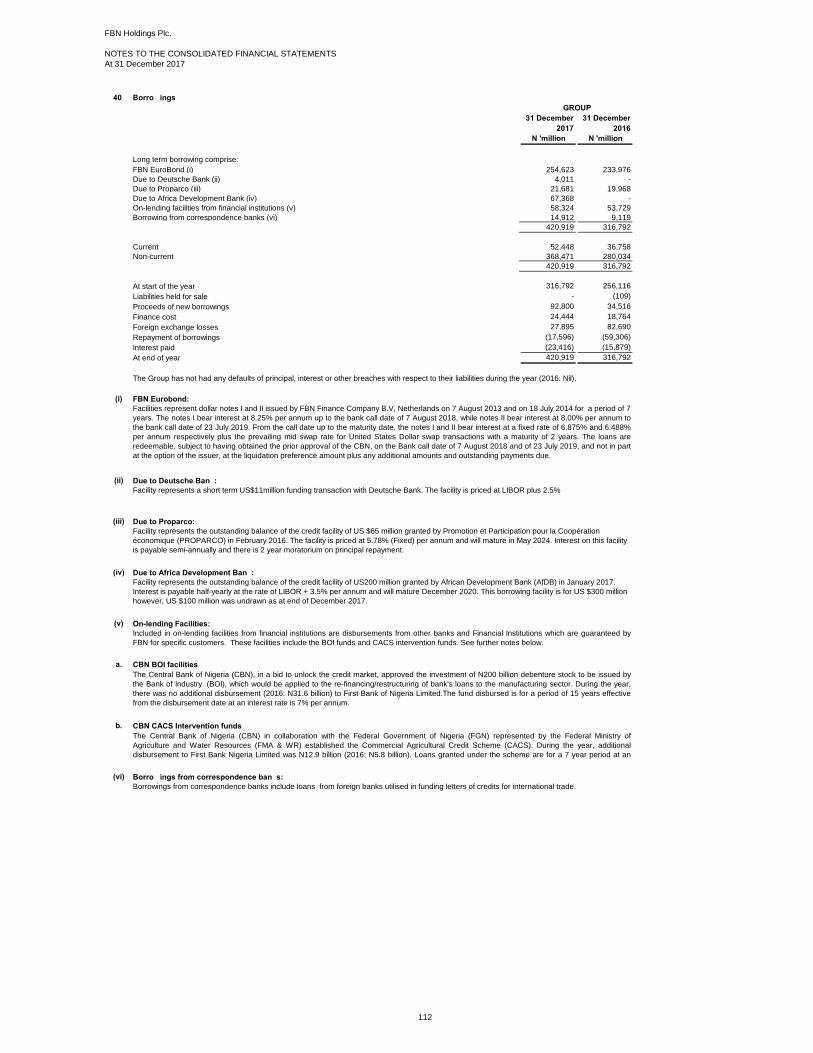
FBN Holdings Plc.
NOTES TO THE CONSOLIDATED FINANCIAL STATEMENTS
At 31 December 2017
40 Borrowings
31 December 31 December
2017 2016
N 'million N 'million
Long term borrowing comprise:
FBN EuroBond (i) 254,623 233,976
Due to Deutsche Bank (ii) 4,011 -
Due to Proparco (iii) 21,681 19,968
Due to Africa Development Bank (iv) 67,368 -
On-lending facilities from financial institutions (v) 58,324 53,729
Borrowing from correspondence banks (vi) 14,912 9,119
420,919 316,792
Current 52,448 36,758
Non-current 368,471 280,034
420,919 316,792
At start of the year 316,792 256,116
Liabilities held for sale - (109)
Proceeds of new borrowings 92,800 34,516
Finance cost 24,444 18,764
Foreign exchange losses 27,895 82,690
Repayment of borrowings (17,596) (59,306)
Interest paid (23,416) (15,879)
At end of year 420,919 316,792
(i)
(ii)
(iii)
(iv)
(v)
a. CBN/BOI facilities
b. CBN/CACS Intervention funds
(vi)
Due to Proparco:
Facility represents the outstanding balance of the credit facility of US $65 million granted by Promotion et Participation pour la Coopération
économique (PROPARCO) in February 2016. The facility is priced at 5.78% (Fixed) per annum and will mature in May 2024. Interest on this facility
is payable semi-annually and there is 2 year moratorium on principal repayment.
On-lending Facilities:
Included in on-lending facilities from financial institutions are disbursements from other banks and Financial Institutions which are guaranteed by
FBN for specific customers. These facilities include the BOI funds and CACS intervention funds. See further notes below.
Due to Deutsche Bank:
Facility represents a short term US$11million funding transaction with Deutsche Bank. The facility is priced at LIBOR plus 2.5%
FBN Eurobond:
Facilities represent dollar notes I and II issued by FBN Finance Company B.V, Netherlands on 7 August 2013 and on 18 July 2014 for a period of 7
years. The notes I bear interest at 8.25% per annum up to the bank call date of 7 August 2018, while notes II bear interest at 8.00% per annum to
the bank call date of 23 July 2019. From the call date up to the maturity date, the notes I and II bear interest at a fixed rate of 6.875% and 6.488%
per annum respectively plus the prevailing mid swap rate for United States Dollar swap transactions with a maturity of 2 years. The loans are
redeemable, subject to having obtained the prior approval of the CBN, on the Bank call date of 7 August 2018 and of 23 July 2019, and not in part
at the option of the issuer, at the liquidation preference amount plus any additional amounts and outstanding payments due.
Borrowings from correspondence banks:
Borrowings from correspondence banks include loans from foreign banks utilised in funding letters of credits for international trade.
GROUP
The Central Bank of Nigeria (CBN), in a bid to unlock the credit market, approved the investment of N200 billion debenture stock to be issued by
the Bank of Industry (BOI), which would be applied to the re-financing/restructuring of bank's loans to the manufacturing sector. During the year,
there was no additional disbursement (2016: N31.6 billion) to First Bank of Nigeria Limited.The fund disbursed is for a period of 15 years effective
from the disbursement date at an interest rate is 7% per annum.
The Group has not had any defaults of principal, interest or other breaches with respect to their liabilities during the year (2016: Nil).
The Central Bank of Nigeria (CBN) in collaboration with the Federal Government of Nigeria (FGN) represented by the Federal Ministry of
Agriculture and Water Resources (FMA & WR) established the Commercial Agricultural Credit Scheme (CACS). During the year, additional
disbursement to First Bank Nigeria Limited was N12.9 billion (2016: N5.8 billion). Loans granted under the scheme are for a 7 year period at an
interest rate of 9% p.a.
Due to Africa Development Bank:
Facility represents the outstanding balance of the credit facility of US200 million granted by African Development Bank (AfDB) in January 2017.
Interest is payable half-yearly at the rate of LIBOR + 3.5% per annum and will mature December 2020. This borrowing facility is for US $300 million
however, US $100 million was undrawn as at end of December 2017.
112

FBN Holdings Plc.
NOTES TO THE CONSOLIDATED FINANCIAL STATEMENTS
At 31 December 2017
41 Retirement benefit obligations
31 Dec 2017 31 Dec 2016
N 'million N 'million
Defined Contribution Plan 3 6
Defined Benefits Plan
Gratuity Scheme (i) (20) 8
Defined Benefits - Pension (ii) 1,457 1,934
Gratuity Scheme (iii) 763 714
2,203 2,662
Gratuity scheme (i)
Defined benefit - Pension (ii)
The movement in the defined benefit obligation over the year is as follows:
Present value
of the
obligation
Fair value of
plan assets Net
N 'million N 'million N 'million
Defined benefit pension obligations at 1 January 2016 12,033 (8,950) 3,083
Transfer from gratuity scheme (1)
Interest expense/(income) 1,226 (1,068) 158
Service cost 21 21
Curtailment losses (1) (1)
Remeasurement:
- Return on plan asset not included in net interest cost on pension scheme (34) 1,430 1,396
- change in demographic assumptions (2,681) - (2,681)
Contributions: -
- Employer - (42) (42)
Payments: -
- Benefit payment (1,553) 1,553 0
Defined benefit pension obligations at 31 December 2016 9,011 (7,077) 1,934
Interest expense/(income) 1,303 (1,153) 150
Service cost 19 - 19
Curtailment losses 0 - 0
Remeasurement:
- Return on plan asset not included in net interest cost on pension scheme 0 (882) (882)
- change in demographic assumptions 236 - 236
Contributions:
- Employer - 0 0
Payments:
- Benefit payment (1,504) 1,504 -
Defined benefit pension obligations at 31 December 2017 9,065 (7,608) 1,457
This relates to the schemes operated by FBN Insurance Brokers as a non-contributory defined gratuity scheme whereby on separation, staff who
have spent a minimum number of 3 years are paid a sum based on their qualifying emoluments and the number of periods spent in service of the
entity. The balance on this scheme is deemed immaterial.
GROUP
In addition, First Pensions Custodian Nigeria Limited (FPCNL), a direct subsidiary of First Bank of Nigeria Limited, has a non-contributory defined
gratuity scheme for directors. Directors are paid a sum based on an approved scale and the number of years of service subject to a maximum of 9
years. In 2017, the plan assets exceeded the defined benefit obligation by N37 million resulting in a net defined benefit asset.
GROUP
First Bank of Nigeria Limited has an old Defined Benefit scheme, discontinued in March 2001. The funds are placed with fund managers and the
Bank is under obligation to fund the deficit.
Plan liabilities are based upon independent actuarial valuation performed by Ernst & Young using the projected unit credit basis. This valuation
was carried out as at 31 December 2017 and 31 December 2016.
113
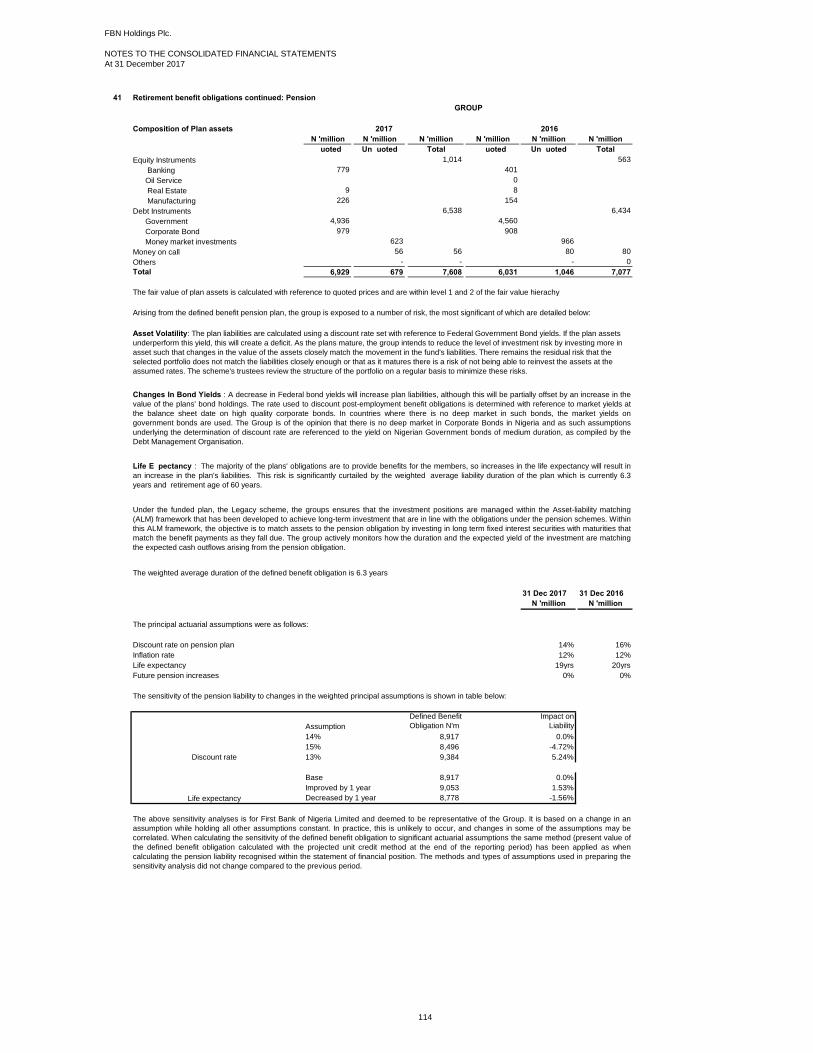
FBN Holdings Plc.
NOTES TO THE CONSOLIDATED FINANCIAL STATEMENTS
At 31 December 2017
41 Retirement benefit obligations continued: Pension
Composition of Plan assets
N 'million N 'million N 'million N 'million N 'million N 'million
Quoted Unquoted Total Quoted Unquoted Total
Equity Instruments 1,014 563
Banking 779 401
Oil Service 0
Real Estate 9 8
Manufacturing 226 154
Debt Instruments 6,538 6,434
Government 4,936 4,560
Corporate Bond 979 908
Money market investments 623 966
Money on call 56 56 80 80
Others - - - 0
Total 6,929 679 7,608 6,031 1,046 7,077
The fair value of plan assets is calculated with reference to quoted prices and are within level 1 and 2 of the fair value hierachy
Arising from the defined benefit pension plan, the group is exposed to a number of risk, the most significant of which are detailed below:
The weighted average duration of the defined benefit obligation is 6.3 years
31 Dec 2017 31 Dec 2016
N 'million N 'million
The principal actuarial assumptions were as follows:
Discount rate on pension plan 14% 16%
Inflation rate 12% 12%
Life expectancy 19yrs 20yrs
Future pension increases 0% 0%
The sensitivity of the pension liability to changes in the weighted principal assumptions is shown in table below:
Assumption
Defined Benefit
Obligation N'm
Impact on
Liability
14% 8,917 0.0%
15% 8,496 -4.72%
13% 9,384 5.24%
Base 8,917 0.0%
Improved by 1 year 9,053 1.53%
Decreased by 1 year 8,778 -1.56%
The above sensitivity analyses is for First Bank of Nigeria Limited and deemed to be representative of the Group. It is based on a change in an
assumption while holding all other assumptions constant. In practice, this is unlikely to occur, and changes in some of the assumptions may be
correlated. When calculating the sensitivity of the defined benefit obligation to significant actuarial assumptions the same method (present value of
the defined benefit obligation calculated with the projected unit credit method at the end of the reporting period) has been applied as when
calculating the pension liability recognised within the statement of financial position. The methods and types of assumptions used in preparing the
sensitivity analysis did not change compared to the previous period.
2017
Changes In Bond Yields : A decrease in Federal bond yields will increase plan liabilities, although this will be partially offset by an increase in the
value of the plans' bond holdings. The rate used to discount post-employment benefit obligations is determined with reference to market yields at
the balance sheet date on high quality corporate bonds. In countries where there is no deep market in such bonds, the market yields on
government bonds are used. The Group is of the opinion that there is no deep market in Corporate Bonds in Nigeria and as such assumptions
underlying the determination of discount rate are referenced to the yield on Nigerian Government bonds of medium duration, as compiled by the
Debt Management Organisation.
GROUP
Life Expectancy : The majority of the plans' obligations are to provide benefits for the members, so increases in the life expectancy will result in
an increase in the plan's liabilities. This risk is significantly curtailed by the weighted average liability duration of the plan which is currently 6.3
years and retirement age of 60 years.
Under the funded plan, the Legacy scheme, the groups ensures that the investment positions are managed within the Asset-liability matching
(ALM) framework that has been developed to achieve long-term investment that are in line with the obligations under the pension schemes. Within
this ALM framework, the objective is to match assets to the pension obligation by investing in long term fixed interest securities with maturities that
match the benefit payments as they fall due. The group actively monitors how the duration and the expected yield of the investment are matching
the expected cash outflows arising from the pension obligation.
Asset Volatility: The plan liabilities are calculated using a discount rate set with reference to Federal Government Bond yields. If the plan assets
underperform this yield, this will create a deficit. As the plans mature, the group intends to reduce the level of investment risk by investing more in
asset such that changes in the value of the assets closely match the movement in the fund's liabilities. There remains the residual risk that the
selected portfolio does not match the liabilities closely enough or that as it matures there is a risk of not being able to reinvest the assets at the
assumed rates. The scheme's trustees review the structure of the portfolio on a regular basis to minimize these risks.
2016
Discount rate
Life expectancy
114
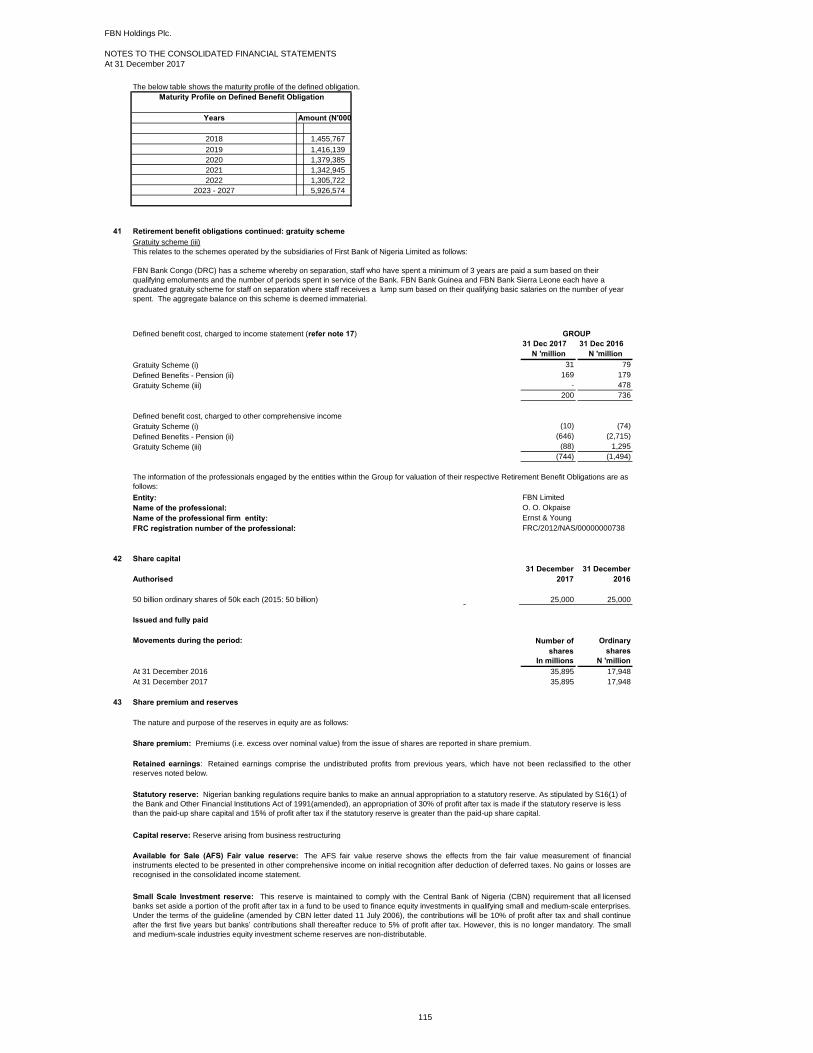
FBN Holdings Plc.
NOTES TO THE CONSOLIDATED FINANCIAL STATEMENTS
At 31 December 2017
The below table shows the maturity profile of the defined obligation.
Years
2018 1,455,767
2019 1,416,139
2020 1,379,385
2021 1,342,945
2022 1,305,722
2023 - 2027 5,926,574
41 Retirement benefit obligations continued: gratuity scheme
Gratuity scheme (iii)
Defined benefit cost, charged to income statement (refer note 17)
31 Dec 2017 31 Dec 2016
N 'million N 'million
Gratuity Scheme (i) 31 79
Defined Benefits - Pension (ii) 169 179
Gratuity Scheme (iii) - 478
200 736
Defined benefit cost, charged to other comprehensive income
Gratuity Scheme (i) (10) (74)
Defined Benefits - Pension (ii) (646) (2,715)
Gratuity Scheme (iii) (88) 1,295
(744) (1,494)
Entity:
Name of the professional:
Name of the professional firm/ entity:
FRC registration number of the professional:
42 Share capital
31 December 31 December
Authorised 2017 2016
50 billion ordinary shares of 50k each (2015: 50 billion) 25,000 25,000
Issued and fully paid
Movements during the period: Number of Ordinary
shares shares
In millions N 'million
At 31 December 2016 35,895 17,948
At 31 December 2017 35,895 17,948
43 Share premium and reserves
The nature and purpose of the reserves in equity are as follows:
Capital reserve: Reserve arising from business restructuring
Statutory reserve: Nigerian banking regulations require banks to make an annual appropriation to a statutory reserve. As stipulated by S16(1) of
the Bank and Other Financial Institutions Act of 1991(amended), an appropriation of 30% of profit after tax is made if the statutory reserve is less
than the paid-up share capital and 15% of profit after tax if the statutory reserve is greater than the paid-up share capital.
Small Scale Investment reserve: This reserve is maintained to comply with the Central Bank of Nigeria (CBN) requirement that all licensed
banks set aside a portion of the profit after tax in a fund to be used to finance equity investments in qualifying small and medium-scale enterprises.
Under the terms of the guideline (amended by CBN letter dated 11 July 2006), the contributions will be 10% of profit after tax and shall continue
after the first five years but banks’ contributions shall thereafter reduce to 5% of profit after tax. However, this is no longer mandatory. The small
and medium-scale industries equity investment scheme reserves are non-distributable.
Ernst & Young
FBN Limited
The information of the professionals engaged by the entities within the Group for valuation of their respective Retirement Benefit Obligations are as
follows:
GROUP
FRC/2012/NAS/00000000738
Available for Sale (AFS) Fair value reserve: The AFS fair value reserve shows the effects from the fair value measurement of financial
instruments elected to be presented in other comprehensive income on initial recognition after deduction of deferred taxes. No gains or losses are
recognised in the consolidated income statement.
O. O. Okpaise
Maturity Profile on Defined Benefit Obligation
Amount (N'000)
Share premium: Premiums (i.e. excess over nominal value) from the issue of shares are reported in share premium.
Retained earnings: Retained earnings comprise the undistributed profits from previous years, which have not been reclassified to the other
reserves noted below.
This relates to the schemes operated by the subsidiaries of First Bank of Nigeria Limited as follows:
FBN Bank Congo (DRC) has a scheme whereby on separation, staff who have spent a minimum of 3 years are paid a sum based on their
qualifying emoluments and the number of periods spent in service of the Bank. FBN Bank Guinea and FBN Bank Sierra Leone each have a
graduated gratuity scheme for staff on separation where staff receives a lump sum based on their qualifying basic salaries on the number of year
spent. The aggregate balance on this scheme is deemed immaterial.
115
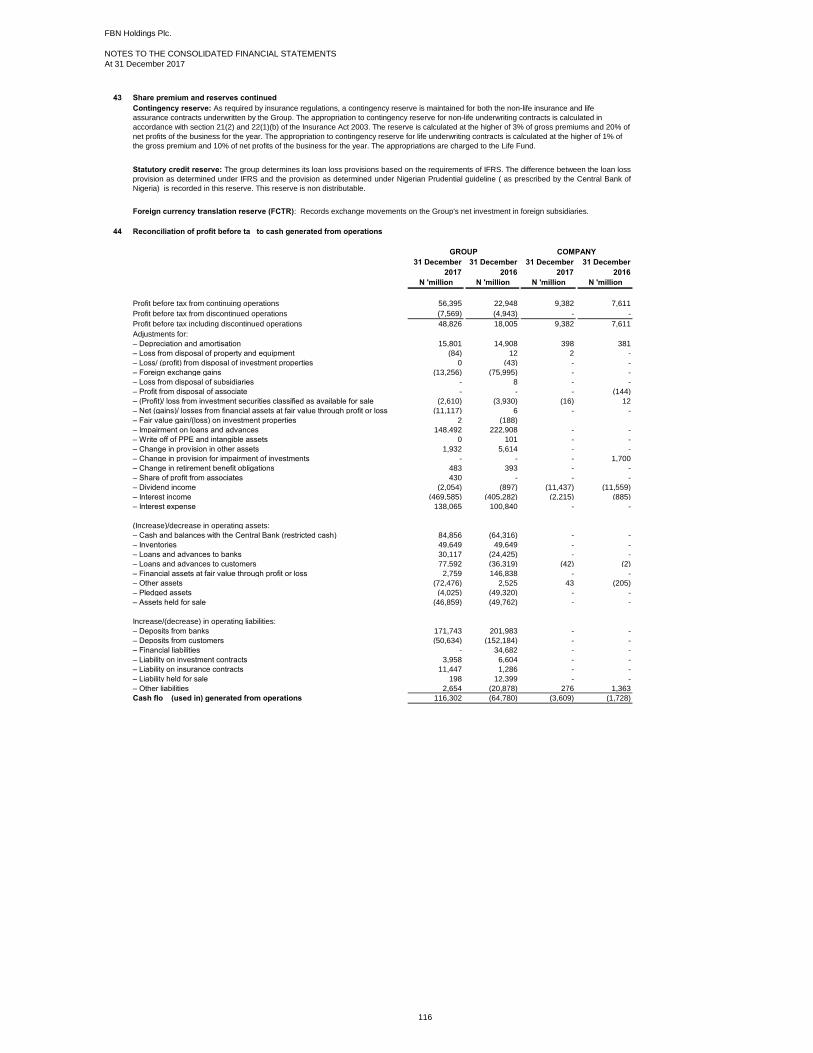
FBN Holdings Plc.
NOTES TO THE CONSOLIDATED FINANCIAL STATEMENTS
At 31 December 2017
43 Share premium and reserves continued
44 Reconciliation of profit before tax to cash generated from operations
31 December 31 December 31 December 31 December
2017 2016 2017 2016
N 'million N 'million N 'million N 'million
Profit before tax from continuing operations 56,395 22,948 9,382 7,611
Profit before tax from discontinued operations (7,569) (4,943) - -
Profit before tax including discontinued operations 48,826 18,005 9,382 7,611
Adjustments for:
– Depreciation and amortisation 15,801 14,908 398 381
– Loss from disposal of property and equipment (84) 12 2 -
– Loss/ (profit) from disposal of investment properties 0 (43) - -
– Foreign exchange gains (13,256) (75,995) - -
– Loss from disposal of subsidiaries - 8 - -
– Profit from disposal of associate - - - (144)
– (Profit)/ loss from investment securities classified as available for sale (2,610) (3,930) (16) 12
– Net (gains)/ losses from financial assets at fair value through profit or loss (11,117) 6 - -
– Fair value gain/(loss) on investment properties 2 (188)
– Impairment on loans and advances 148,492 222,908 - -
– Write off of PPE and intangible assets 0 101 - -
– Change in provision in other assets 1,932 5,614 - -
– Change in provision for impairment of investments - - - 1,700
– Change in retirement benefit obligations 483 393 - -
– Share of profit from associates 430 - - -
– Dividend income (2,054) (897) (11,437) (11,559)
– Interest income (469,585) (405,282) (2,215) (885)
– Interest expense 138,065 100,840 - -
(Increase)/decrease in operating assets:
– Cash and balances with the Central Bank (restricted cash) 84,856 (64,316) - -
– Inventories 49,649 49,649 - -
– Loans and advances to banks 30,117 (24,425) - -
– Loans and advances to customers 77,592 (36,319) (42) (2)
– Financial assets at fair value through profit or loss 2,759 146,838 - -
– Other assets (72,476) 2,525 43 (205)
– Pledged assets (4,025) (49,320) - -
– Assets held for sale (46,859) (49,762) - -
Increase/(decrease) in operating liabilities:
– Deposits from banks 171,743 201,983 - -
– Deposits from customers (50,634) (152,184) - -
– Financial liabilities - 34,682 - -
– Liability on investment contracts 3,958 6,604 - -
– Liability on insurance contracts 11,447 1,286 - -
– Liability held for sale 198 12,399 - -
– Other liabilities 2,654 (20,878) 276 1,363
Cash flow (used in)/generated from operations 116,302 (64,780) (3,609) (1,728)
Contingency reserve: As required by insurance regulations, a contingency reserve is maintained for both the non-life insurance and life
assurance contracts underwritten by the Group. The appropriation to contingency reserve for non-life underwriting contracts is calculated in
accordance with section 21(2) and 22(1)(b) of the Insurance Act 2003. The reserve is calculated at the higher of 3% of gross premiums and 20% of
net profits of the business for the year. The appropriation to contingency reserve for life underwriting contracts is calculated at the higher of 1% of
the gross premium and 10% of net profits of the business for the year. The appropriations are charged to the Life Fund.
Foreign currency translation reserve (FCTR): Records exchange movements on the Group's net investment in foreign subsidiaries.
COMPANY
Statutory credit reserve: The group determines its loan loss provisions based on the requirements of IFRS. The difference between the loan loss
provision as determined under IFRS and the provision as determined under Nigerian Prudential guideline ( as prescribed by the Central Bank of
Nigeria) is recorded in this reserve. This reserve is non distributable.
GROUP
116

FBN Holdings Plc.
NOTES TO THE CONSOLIDATED FINANCIAL STATEMENTS
At 31 December 2017
45 Commitments and Contingencies
45.1 Capital commitments
31 December 31 December
2017 2016
N 'million N 'million
Authorised and contracted
Group 1,122 953
Company - -
45.2 Operating lease rentals
31 December 31 December
2017 2016
N 'million N 'million
Within one year 667 332
Between two and five years 3,063 1,078
More than five years 6,102 2,926
9,832 4,336
45.3 Legal proceedings
45.4
31 December 31 December
2017 2016
N 'million N 'million
Performance bonds and guarantees 312,722 313,779
Letters of credit 218,247 156,845
530,969 470,624
45.5 Loan Commitments
31 December 31 December
2017 2016
N 'million N 'million
8,263 14,203
45.6 Compliance with covenants
The directors having sought the advice of the professional legal counsel are of the opinion that no significant liability will crystalise from these cases
beyond the provision made in the financial statements
In the normal course of business the group is a party to financial instruments which carry off-balance sheet risk. These instruments are issued to
meet the credit and other financial requirements of customers. The contractual amounts of the off-balance sheet financial instruments are:
Other contingent commitments
GROUP
GROUP
At the balance sheet date, the company had no capital commitments (2016: Nil) in respect of authorized and contracted capital projects.
The Group is subject to certain covenants primarily relating to its borrowings. Non-compliance with such covenants may result in negative
consequences for the Group including growth in the cost of borrowings and declaration of default. In the event of default, the lenders are entitled to
take various actions, including the acceleration of amounts due under the loan agreements and all actions permitted to be taken by a secured
creditor which would have a material adverse effect on the Group's business, results of operations, financial condition, cash flows, liquidity and/or
prospects.
GROUP
At 31 December 2017, the Group was committed to making the following future payments in respect of operating leases for land and buildings.
Subsisting lease agreements are expected to expire in June 2031 and February 2017 respectively.
Undrawn irrevocable loan commitments
GROUP
The Group is a party to a number of legal actions arising out of its normal business operations
The total outstanding contractual amount of undrawn credit lines, letters of credit, and guarantees does not necessarily represent future cash
requirements, as these financial instruments may expire or terminate without being funded. The fair value of credit related commitments is
disclosed in note 3.7.3b.
First Bank of Nigeria Limited, a subsidiary of FBN Holdings Plc., is subject to minimum capital requirements established by covenants stated in loan
agreements, including capital adequacy levels calculated in accordance with the requirements of the Basel Accord, as defined in the International
Convergence of Capital Measurement and Capital Standards (updated April 1998) and the Amendment to the Capital Accord to incorporate
market risks (updated November 2005), commonly known as Basel II. The Bank complied with this loan covenant. See Note 4 for the calculation of
the composition of the Bank’s capital in accordance with the Basel Accord. Management believes that First Bank of Nigeria Limited is in compliance
with these covenants at 31 December 2017 and 31 December 2016.
117

FBN Holdings Plc.
NOTES TO THE CONSOLIDATED FINANCIAL STATEMENTS
At 31 December 2017
46
(a) (b) (c) = (a) - (b) (d) (e) (f) = (c)-(d)-(e)
31 December 2017 N'million N'million N'million N'million N'million N'million
ASSETS
Financial assets at fair value through profit or
loss 18,768 - 18,768 - 2,159 16,609
Reinsurance receivables 1,652 - 1,652 399 - 1,253
20,420 - 20,420 399 2,159 17,862
LIABILITIES
Financial derivatives (9,342) - (9,342) - (7,775) (1,567)
Trade payables (399) - (399) (399) - -
(9,741) - (9,741) (399) (7,775) (1,567)
(a) (b) (c) = (a) - (b) (d) (e) (f) = (c)-(d)-(e)
31 December 2016 N'million N'million N'million N'million N'million N'million
ASSETS
Financial assets at fair value through profit or
loss 15,165 - 15,165 - 1,585 13,580
Reinsurance receivables 890 - 890 75 - 815
16,055 - 16,055 75 1,585 14,395
LIABILITIES
Financial derivatives (12,751) - (12,751) - 3,605- (9,146)
Trade payables (75) - (75) (75) - -
(12,826) - (12,826) (75) (3,605) (9,146)
Financial
instruments
Cash
collaterals
received
Total Assets subject to offsetting, master
netting and similar arrangements
Total Assets subject to offsetting, master
netting and similar arrangements
GROUP
The Group has master netting arrangements with counterparty banks, which are enforceable in case of default. In addition, applicable legislation
allows an entity to unilaterally set off trade receivables and payables that are due for payment, denominated in the same currency and outstanding
with the same counterparty. These fall in the scope of the disclosure. The Group received and provided margin deposits as collateral for
outstanding derivative positions. The Group or the counterparty may set off the Group's asset or liabilities with the margin deposit in case of default.
The information shown below relates to First Bank of Nigeria Limited and FBN Insurance Limited, as no other entity within the Group has an
offsetting arrangement.
In the insurance business, reinsurance payable and receivables create for the parties to the agreement, a right of set-off on recognised amounts
that is enforceable only following a predetermined events as stipulated within the treaty agreements. Each party to the agreement will have the
option to settle all such amounts on a net basis in the event of default of the other party. An event of default includes a failure by a party to make
payment when due.
GROUP
The disclosure does not apply to loans and advances to customers and related customer deposits unless they are set off in the statement of
financial position.
Net amounts
of exposure
Financial instruments subject to offsetting, enforceable master netting and similar arrangement are as follows:
Financial
instruments
Cash
collaterals
received
Total Liabilities subject to offsetting, master
netting and similar arrangements
Gross
amount
before
offsetting in
the
statement
of financial
position
Net amounts
of exposure
Net amounts
after
offsetting in
the statement
of financial
position
Amounts subject to master
netting and similar
arrangements not set off in
the statement of financial
position
Gross
amounts set
off in the
statement of
financial
position
Total Liabilities subject to offsetting, master
netting and similar arrangements
The amount set off in the statement of financial position reported in column (b) is the lower of (i) the gross amount before offsetting reported in
column (a) and (ii) the amount of the related instrument that is eligible for offsetting. Similarly, the amounts in columns (d) and (e) are limited to the
exposure reported in column (c) for each individual instrument in order not to understate the ultimate net exposure.
Offsetting Financial Assets and Financial Liabilities
Gross
amount
before
offsetting in
the
statement
of financial
position
Gross
amounts set
off in the
statement of
financial
position
Net amounts
after
offsetting in
the statement
of financial
position
Amounts subject to master
netting and similar
arrangements not set off in
the statement of financial
position
118
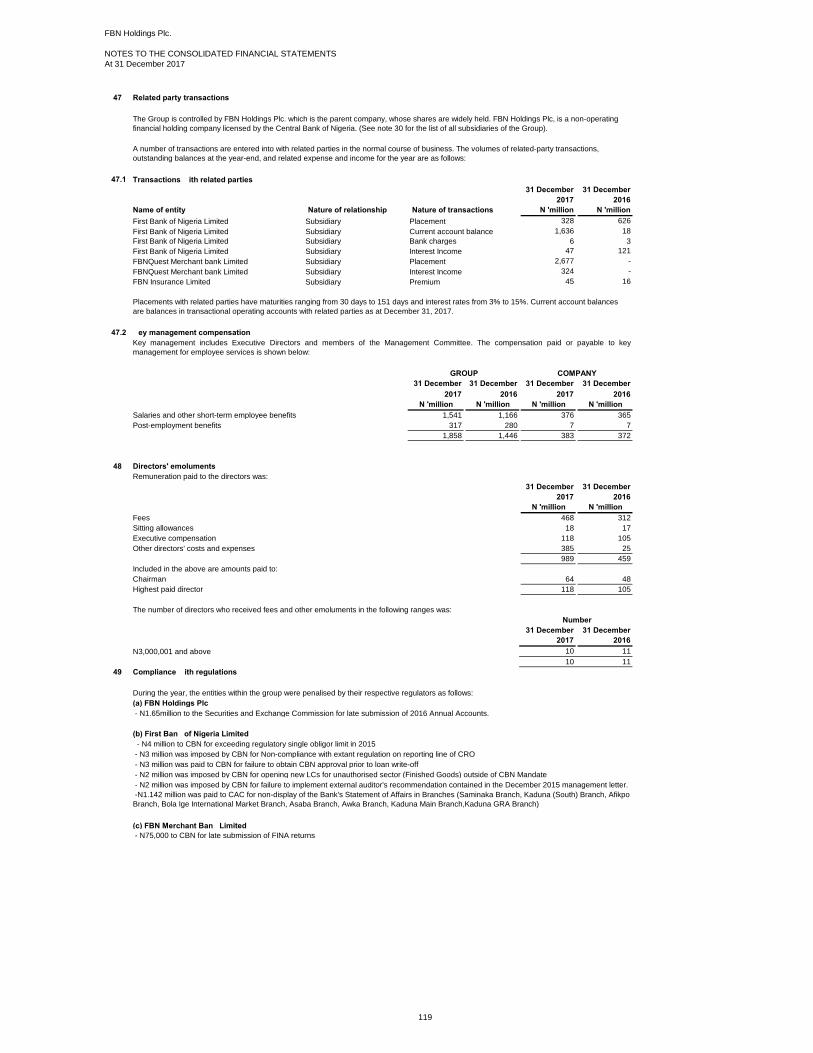
FBN Holdings Plc.
NOTES TO THE CONSOLIDATED FINANCIAL STATEMENTS
At 31 December 2017
47 Related party transactions
47.1 Transactions with related parties
31 December 31 December
2017 2016
Name of entity N 'million N 'million
First Bank of Nigeria Limited 328 626
First Bank of Nigeria Limited 1,636 18
First Bank of Nigeria Limited 6 3
First Bank of Nigeria Limited 47 121
FBNQuest Merchant bank Limited Placement 2,677 -
FBNQuest Merchant bank Limited 324 -
FBN Insurance Limited 45 16
47.2 Key management compensation
31 December 31 December 31 December 31 December
2017 2016 2017 2016
N 'million N 'million N 'million N 'million
Salaries and other short-term employee benefits 1,541 1,166 376 365
Post-employment benefits 317 280 7 7
1,858 1,446 383 372
48 Directors' emoluments
31 December 31 December
2017 2016
N 'million N 'million
Fees 468 312
Sitting allowances 18 17
Executive compensation 118 105
Other directors' costs and expenses 385 25
989 459
Chairman 64 48
Highest paid director 118 105
31 December 31 December
2017 2016
N3,000,001 and above 10 11
10 11
49 Compliance with regulations
During the year, the entities within the group were penalised by their respective regulators as follows:
(a) FBN Holdings Plc
- N1.65million to the Securities and Exchange Commission for late submission of 2016 Annual Accounts.
(b) First Bank of Nigeria Limited
- N4 million to CBN for exceeding regulatory single obligor limit in 2015
- N3 million was imposed by CBN for Non-compliance with extant regulation on reporting line of CRO
- N3 million was paid to CBN for failure to obtain CBN approval prior to loan write-off
- N2 million was imposed by CBN for opening new LCs for unauthorised sector (Finished Goods) outside of CBN Mandate
- N2 million was imposed by CBN for failure to implement external auditor's recommendation contained in the December 2015 management letter.
(c) FBN Merchant Bank Limited
Placements with related parties have maturities ranging from 30 days to 151 days and interest rates from 3% to 15%. Current account balances
are balances in transactional operating accounts with related parties as at December 31, 2017.
Remuneration paid to the directors was:
Subsidiary
Subsidiary
Subsidiary
Subsidiary
Subsidiary
Subsidiary
Subsidiary
Included in the above are amounts paid to:
GROUP
The number of directors who received fees and other emoluments in the following ranges was:
Key management includes Executive Directors and members of the Management Committee. The compensation paid or payable to key
management for employee services is shown below:
Number
- N75,000 to CBN for late submission of FINA returns
-N1.142 million was paid to CAC for non-display of the Bank's Statement of Affairs in Branches (Saminaka Branch, Kaduna (South) Branch, Afikpo
Branch, Bola Ige International Market Branch, Asaba Branch, Awka Branch, Kaduna Main Branch,Kaduna GRA Branch)
Interest Income
Nature of relationship Nature of transactions
Placement
Current account balance
Bank charges
Interest Income
Premium
A number of transactions are entered into with related parties in the normal course of business. The volumes of related-party transactions,
outstanding balances at the year-end, and related expense and income for the year are as follows:
COMPANY
The Group is controlled by FBN Holdings Plc. which is the parent company, whose shares are widely held. FBN Holdings Plc, is a non-operating
financial holding company licensed by the Central Bank of Nigeria. (See note 30 for the list of all subsidiaries of the Group).
119

FBN Holdings Plc.
NOTES TO THE CONSOLIDATED FINANCIAL STATEMENTS
At 31 December 2017
50 Events after statement of financial position date
51 Dividends per share
52 Earnings per share
31 December 31 December 31 December 31 December
2017 2016 2017 2016
N 'million N 'million N 'million N 'million
Profit from continuing operations attributable to owners of the parent (N'million) 51,405 19,020 9,275 7,507
Loss from discontinued operations attributable to owners of the parent (N'million) (7,774) (4,898) 0 0
35,895 35,895 35,895 35,895
- from continuing operations 1.43 0.53 0.26 0.21
- from discontinued operations (0.22) (0.14) - -
1.21 0.39 0.26 0.21
The calculation of basic earnings per share is based on the profit attributable to equity holders of the parent and the number of basic weighted
average number of shares.
The company does not have potential ordinary shares with convertible options and therefore there is no dilutive impact on the profit attributable to
the equity holders of the parent.
GROUP COMPANY
Basic/diluted earnings per share (expressed in Naira per share)
Basic earnings per share is calculated by dividing the net profit attributable to equity holders of the company by the weighted average number of
ordinary shares in issue during the year, excluding the average number of ordinary shares purchased by the members of the group and held as
treasury shares.
A cash dividend of N7.18 billion at N0.20 per share (2015: N5.38 billion) that relates to the period to 31 December 2016 was paid in May 2017.
Weighted average number of ordinary shares in issue (in million)
No significant event occurred after the reporting date.
120
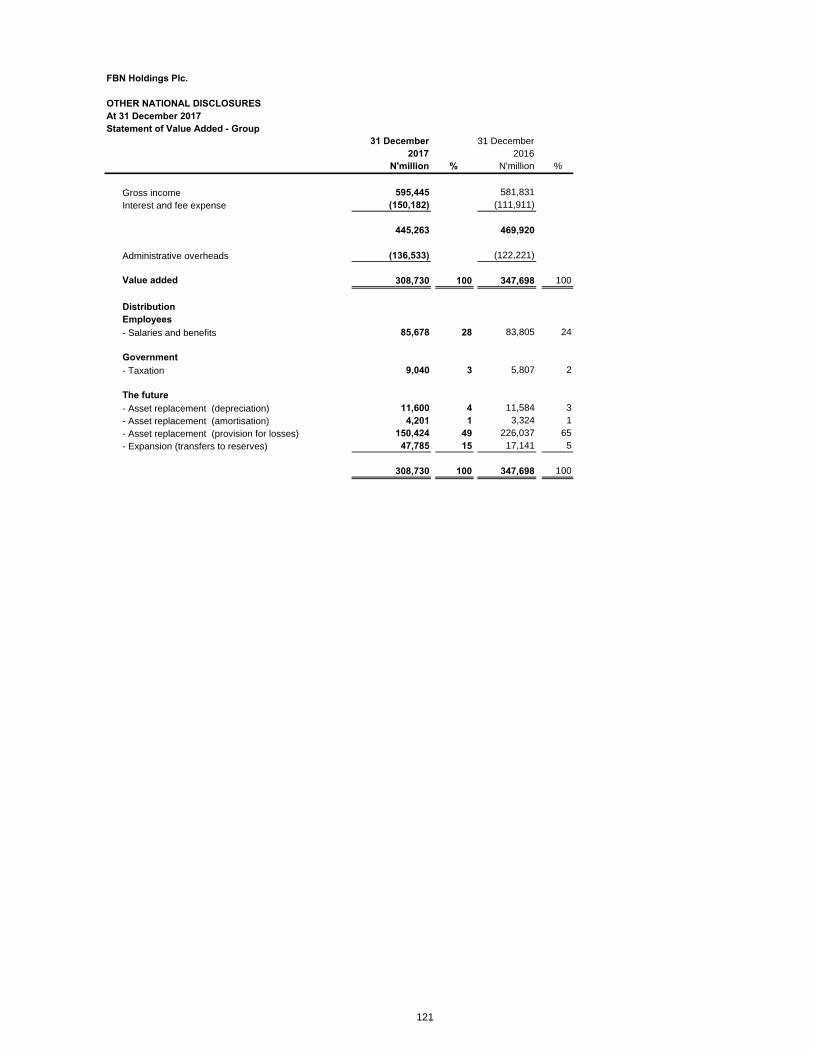
FBN Holdings Plc.
OTHER NATIONAL DISCLOSURES
At 31 December 2017
Statement of Value Added - Group
31 December 31 December
2017 2016
N'million % N'million %
Gross income 595,445 581,831
Interest and fee expense (150,182) (111,911)
445,263 469,920
Administrative overheads (136,533) (122,221)
Value added 308,730 100 347,698 100
Distribution
Employees
- Salaries and benefits 85,678 28 83,805 24
Government
- Taxation 9,040 3 5,807 2
The future
- Asset replacement (depreciation) 11,600 4 11,584 3
- Asset replacement (amortisation) 4,201 1 3,324 1
- Asset replacement (provision for losses) 150,424 49 226,037 65
- Expansion (transfers to reserves) 47,785 15 17,141 5
308,730 100 347,698 100
121
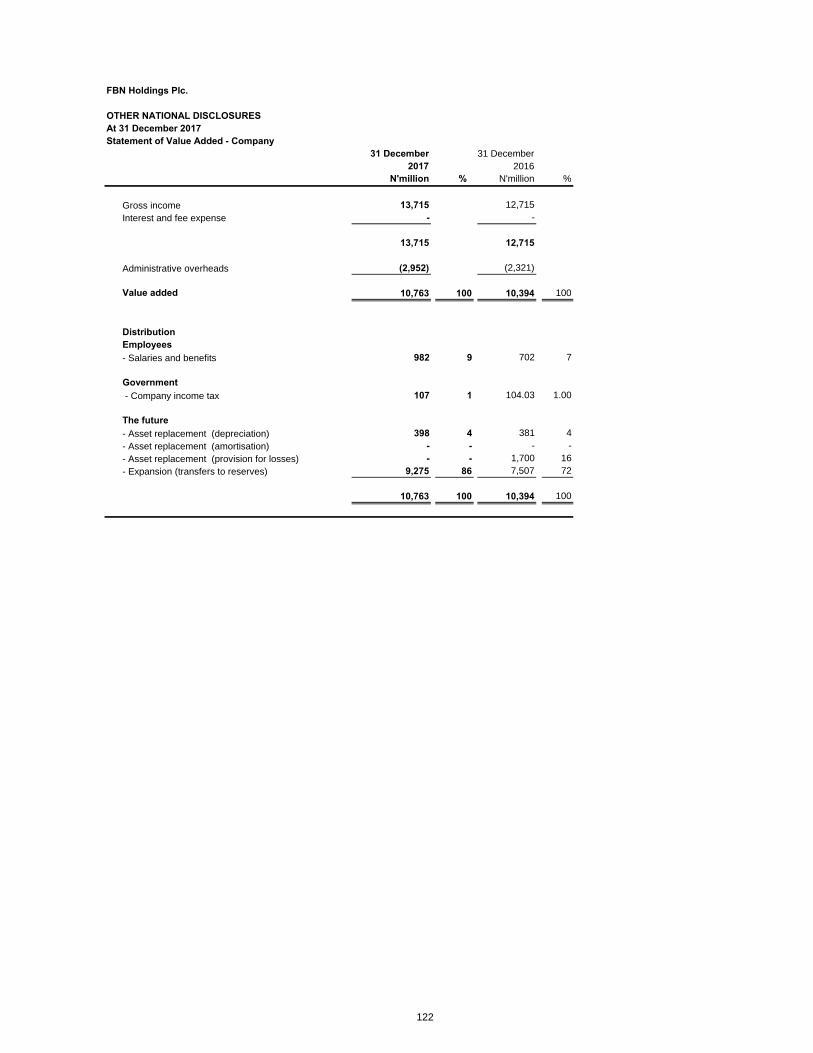
FBN Holdings Plc.
OTHER NATIONAL DISCLOSURES
At 31 December 2017
Statement of Value Added - Company
31 December 31 December
2017 2016
N'million % N'million %
Gross income 13,715 12,715
Interest and fee expense - -
13,715 12,715
Administrative overheads (2,952) (2,321)
Value added 10,763 100 10,394 100
Distribution
Employees
- Salaries and benefits 982 9 702 7
Government
- Company income tax 107 1 104.03 1.00
The future
- Asset replacement (depreciation) 398 4 381 4
- Asset replacement (amortisation) - - - -
- Asset replacement (provision for losses) - - 1,700 16
- Expansion (transfers to reserves) 9,275 86 7,507 72
10,763 100 10,394 100
122

FBN Holdings Plc.
OTHER NATIONAL DISCLOSURES
FIVE YEAR FINANCIAL SUMMARY - GROUP
STATEMENT OF FINANCIAL POSITION
31 December 31 December 31 December 31 December 31 December
2017 2016 2015 2014 2013
N'million N'million N'million N'million N'million
Assets:
Cash and balances with central bank 641,881 690,165 715,871 698,104 594,234
Loans and advances to banks 742,929 444,871 385,769 460,911 430,586
Loans and advances to customers 2,001,223 2,083,894 1,817,271 2,178,986 1,769,130
Financial assets at fair value through profit or loss 83,713 46,711 26,426 27,601 10,287
Investment securities 1,248,608 1,050,588 913,779 711,639 824,064
Assets pledged as collateral 208,925 197,420 105,646 68,483 53,650
Other assets 132,731 47,786 35,483 40,640 45,640
Inventory - - 49,649 37,805 30,253
Investment in associates 1,357 1,114 - - 7,029
Investment properties 1,993 3,003 3,025 2,826 2,413
Property, plant and equipment 88,263 88,315 88,398 88,557 81,299
Intangible assets 16,211 15,328 9,687 8,569 8,748
Deferred tax 18,554 17,278 14,615 11,285 7,120
Assets held for sale 50,149 50,332 570 8,331 4,549
5,236,537 4,736,805 4,166,189 4,343,737 3,869,001
Financed by:
Share capital 17,948 17,948 17,948 16,316 16,316
Share premium 233,392 233,392 252,892 254,524 254,524
Reserves 432,347 331,783 304,284 249,190 196,432
Non controlling interest (5,494) (548) 3,675 4,033 4,505
Deposits from banks 665,366 416,078 144,652 171,151 82,032
Deposits from customers 3,143,338 3,104,221 2,970,922 3,050,853 2,929,081
Financial liabilities at fair value through profit or loss 9,404 37,137 12,488 10,917 1,701
Liabilities on investment contracts 13,399 9,440 10,157 60,617 68,723
Liabilities on insurance contracts 21,734 10,287 11,837 8,260 3,651
Borrowings 420,919 316,792 256,116 369,707 126,302
Retirement benefit obligations 2,203 2,662 3,764 2,029 1,924
Current income tax 10,194 8,897 8,773 11,829 34,167
Other liabilities 261,725 235,388 168,441 132,633 149,606
Deferred income tax liabilities 606 813 239 87 37
Liabilities held for sale 9,457 12,515 - 1,592 -
5,236,537 4,736,805 4,166,189 4,343,737 3,869,001
123
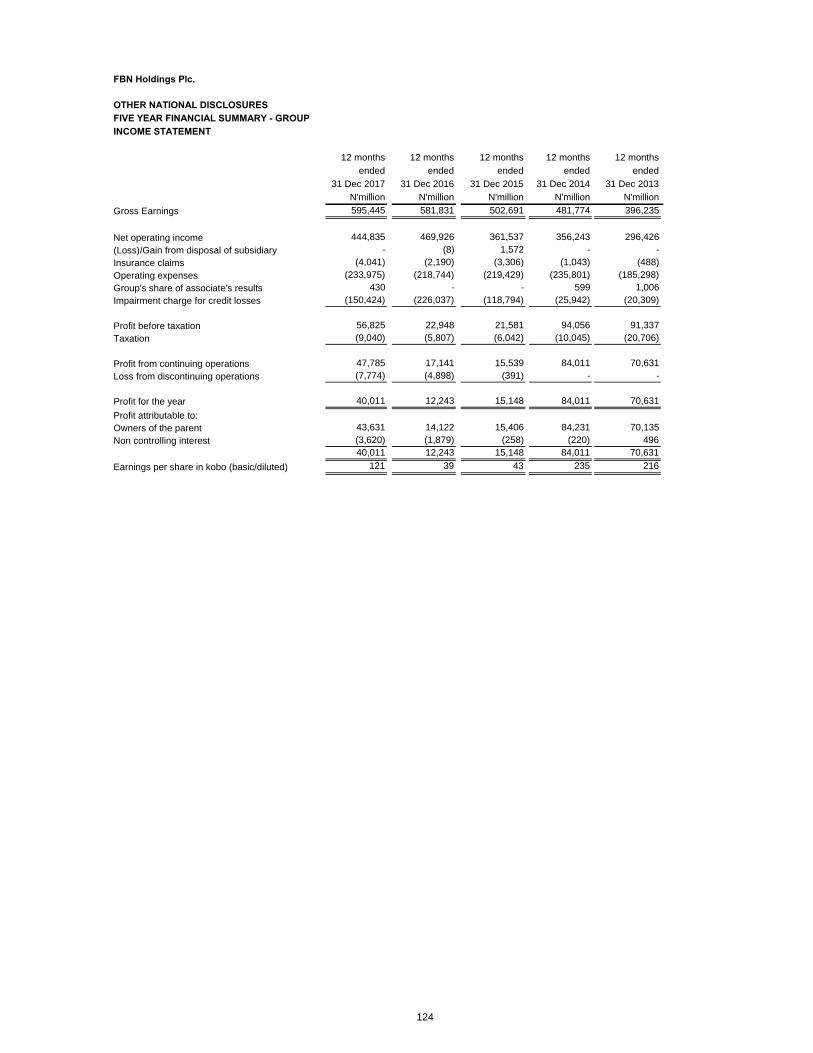
FBN Holdings Plc.
OTHER NATIONAL DISCLOSURES
FIVE YEAR FINANCIAL SUMMARY - GROUP
INCOME STATEMENT
12 months 12 months 12 months 12 months 12 months
ended ended ended ended ended
31 Dec 2017 31 Dec 2016 31 Dec 2015 31 Dec 2014 31 Dec 2013
N'million N'million N'million N'million N'million
Gross Earnings 595,445 581,831 502,691 481,774 396,235
Net operating income 444,835 469,926 361,537 356,243 296,426
(Loss)/Gain from disposal of subsidiary - (8) 1,572 - -
Insurance claims (4,041) (2,190) (3,306) (1,043) (488)
Operating expenses (233,975) (218,744) (219,429) (235,801) (185,298)
Group's share of associate's results 430 - - 599 1,006
Impairment charge for credit losses (150,424) (226,037) (118,794) (25,942) (20,309)
Profit before taxation 56,825 22,948 21,581 94,056 91,337
Taxation (9,040) (5,807) (6,042) (10,045) (20,706)
Profit from continuing operations 47,785 17,141 15,539 84,011 70,631
Loss from discontinuing operations (7,774) (4,898) (391) - -
Profit for the year 40,011 12,243 15,148 84,011 70,631
Profit attributable to:
Owners of the parent 43,631 14,122 15,406 84,231 70,135
Non controlling interest (3,620) (1,879) (258) (220) 496
40,011 12,243 15,148 84,011 70,631
Earnings per share in kobo (basic/diluted) 121 39 43 235 216
124
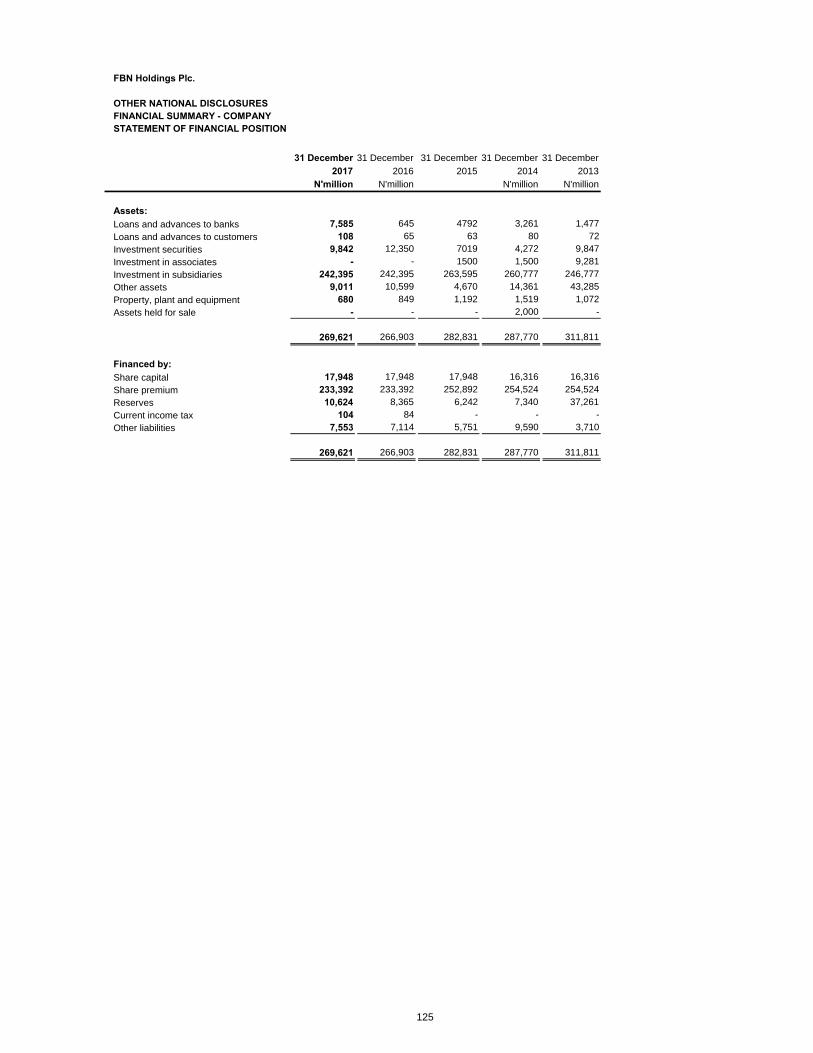
FBN Holdings Plc.
OTHER NATIONAL DISCLOSURES
FINANCIAL SUMMARY - COMPANY
STATEMENT OF FINANCIAL POSITION
31 December 31 December 31 December 31 December 31 December
2017 2016 2015 2014 2013
N'million N'million N'million N'million
Assets:
Loans and advances to banks 7,585 645 4792 3,261 1,477
Loans and advances to customers 108 65 63 80 72
Investment securities 9,842 12,350 7019 4,272 9,847
Investment in associates - - 1500 1,500 9,281
Investment in subsidiaries 242,395 242,395 263,595 260,777 246,777
Other assets 9,011 10,599 4,670 14,361 43,285
Property, plant and equipment 680 849 1,192 1,519 1,072
Assets held for sale - - - 2,000 -
269,621 266,903 282,831 287,770 311,811
Financed by:
Share capital 17,948 17,948 17,948 16,316 16,316
Share premium 233,392 233,392 252,892 254,524 254,524
Reserves 10,624 8,365 6,242 7,340 37,261
Current income tax 104 84 - - -
Other liabilities 7,553 7,114 5,751 9,590 3,710
269,621 266,903 282,831 287,770 311,811
125

FBN Holdings Plc.
OTHER NATIONAL DISCLOSURES
FINANCIAL SUMMARY - COMPANY
INCOME STATEMENT
12 months 12 month 12 month 12 month 12 month
ended ended ended ended ended
31 Dec 2017 31 Dec 2016 31 Dec 2015 31 Dec 2014 31 Dec 2013
Gross Earnings 13,715 12,715 6,794 16,969 74,988
Net operating income 13,715 12,571 5,195 7,800 72,289
Gain from disposal of subsidiary/associate - 144 1,600 - -
Operating expenses (4,333) (5,104) (4,615) (2,117) (1,658)
Profit before taxation 9,382 7,611 2,180 5,683 70,631
Taxation (107) (104) - - -
Profit after taxation 9,275 7,507 2,180 5,683 70,631
Earnings per share in kobo (basic) 26 21 6 16 216
126