fbs linkage ontology and technique to support engineering change management
TRANSCRIPT
ORIGINAL PAPER
FBS Linkage ontology and technique to support engineeringchange management
Bahram Hamraz • Nicholas H. M. Caldwell •
Tom W. Ridgman • P. John Clarkson
Received: 14 September 2012 / Revised: 3 May 2014 / Accepted: 3 June 2014
� Springer-Verlag London 2014
Abstract Engineering changes are essential for any
product development, and their management has become a
crucial discipline. Research in engineering change man-
agement has brought about some methods and tools to
support dealing with changes. This work extends the
change prediction method through incorporation of a
function–behaviour–structure (FBS) scheme. These addi-
tional levels of detail provide the rationales for change
propagation and allow a more proactive management of
changes. First, we develop the ontology of this method
based on a comprehensive comparison of three seminal
functional reasoning schemes. Then, we demonstrate the
FBS Linkage technique by applying it to a diesel engine.
Finally, we evaluate the method.
Keywords Engineering change management � Change
prediction � Functional reasoning � Multi-domain model
Abbreviations
CAM The Cambridge Advanced Modeller
CPM The change prediction method
DMM Domain mapping matrix
DRM The design research methodology
DSM Design structure matrix
EC Engineering change
FBS Function–behaviour–structure
FBSta The function–behaviour–state framework
FBStr The function–behaviour–structure framework
FR Functional reasoning
MDM Multidomain matrix
SBF The structure–behaviour–function framework
SEM Scanning electron microscope
1 Introduction
Heraclitus, a Greek philosopher known for his doctrine of
change as a central phenomenon to the universe, stated
around 500 BC that the only constant is change. For
engineering products, this is probably truer today than ever
before. Engineering changes (ECs) are raised throughout
the product lifecycle and can cause severe profit losses if
not managed sufficiently (Fricke et al. 2000; Maier and
Langer 2011). This is because they propagate and impact
all drivers of competitiveness—time, cost, and quality. As
product development times are continuously decreased, the
management of such changes is becoming more important
(Jarratt et al. 2011). Yet, still EC propagation is neither
clearly understood, nor is the management of changes
sufficiently supported.
This paper presents our continued effort in the devel-
opment of the FBS Linkage method—a multi-domain EC
B. Hamraz (&) � P. J. Clarkson
Department of Engineering, Engineering Design Centre,
University of Cambridge, Trumpington Street,
Cambridge CB2 1PZ, UK
e-mail: [email protected]
P. J. Clarkson
e-mail: [email protected]
N. H. M. Caldwell
Department of Science and Technology, University
Campus Suffolk, Waterfront Building, Neptune Quay,
Ipswich IP4 1QJ, UK
e-mail: [email protected]
T. W. Ridgman
Department of Engineering, Institute for Manufacturing,
University of Cambridge, 17 Charles Babbage Road,
Cambridge CB3 0FS, UK
e-mail: [email protected]
123
Res Eng Design
DOI 10.1007/s00163-014-0181-9
propagation method using the concepts of the function–
behaviour–structure (FBS) schemes (e.g. Gero 1990; Goel
and Chandrasekaran 1989; Umeda et al. 1990) and the
change prediction method (CPM) (Clarkson et al. 2004).
The additional levels of detail, namely functions, behav-
iours, and structures, and their relations provide the ratio-
nales for change propagation and allow a more proactive
management of changes. Proactive EC management com-
prises the five guidelines from Fricke et al. (2000): reduce
the number of changes, detect changes earlier, authorise
changes more effectively, implement changes more effi-
ciently, and continuously improve the management of
changes.
In prior work, we introduced the concept of the FBS
Linkage model and proved its feasibility and merit using a
diesel engine example (Hamraz et al. 2012a, b). However,
we did not detail the ontology of the FBS Linkage method
to provide a uniform framework for developing models,
and we did not elaborate the technique of building an FBS
Linkage model. These two shortcomings will be addressed
in this paper. We will present the ontology and the mod-
elling technique and apply them to build an enhanced
model for the diesel engine. Finally, we will evaluate the
method.
The remainder of this article is structured in five sec-
tions. Section 2 provides the background to this research.
Section 3 presents the FBS Linkage method. Section 4
applies this method to a diesel engine and discusses its
results. Section 5 evaluates the method, and finally, Sect. 6
concludes this article.
2 Background
2.1 Engineering change management
Engineering change (EC) can be defined as ‘‘changes and/
or modifications to released structure (fits, forms and
dimensions, surfaces, materials etc.), behaviour (stability,
strength, corrosion etc.), function (speed, performance,
efficiency, etc.), or the relations between functions and
behaviour (design principles), or behaviour and structure
(physical laws) of a technical artefact’’ (Hamraz et al.
2013a). The terms structure, behaviour, and function are
used as defined by (Gero and Kannengiesser 2004):
Structure defines, what an artefact is; behaviour describes,
what it does; and function prescribes, what it is for.
Change propagation is the term used to refer to the
domino-effect of ECs. Due to the interrelations between
constituent parts of engineering product, a single change
to one part usually has knock-on effects on other parts and
causes additional changes. This change snowballing might
take different patterns and in worst case leads to an
avalanche, which never comes to an end without inter-
vention (Eckert et al. 2004). Thereby, ECs significantly
influence the development time, cost, and quality. Dif-
ferent reports suggest that ECs use around one-third of the
engineering design capacity (Ahmed and Kanike 2007;
Fricke et al. 2000; Maier and Langer 2011). Therefore, the
management of ECs is essential. It can be well compared
with fire safety and fighting measures dealing with the five
guidelines ‘‘less’’, ‘‘earlier’’, ‘‘more effective’’, ‘‘more
efficient’’, and ‘‘better’’ (Fricke et al. 2000). These
guidelines suggest that: first, the occurrence of changes
should be avoided as far as possible; second, changes
should be detected as early as possible to reduce their
impact; third, changes should be selected more effectively,
and fourth, implemented more efficiently. Finally, the
organisation should learn from past changes to continu-
ously improve the management of ECs.
2.2 Engineering change methods
To stick with the fire safety and fighting analogy above, EC
methods and tools can be compared with the fire safety and
fighting equipment (e.g. fire alarm, engine, extinguisher).
They aim to support EC management in different phases.
Many methods and tools have been proposed in the last
10 years. Seminal methods on which many others have
built initially appeared on the scene in the early 2000s and
are C-FAR (Cohen and Fulton 1998; Cohen et al. 2000),
CPM (Clarkson et al. 2001b, 2004), RedesignIT (Ollinger
and Stahovich 2001, 2004). A comprehensive review can
be found in (Jarratt et al. 2011) and will not be repeated
here, but rather updated with recent developments in multi-
domain methods.
Pasqual and de Weck (2011) proposed a multi-domain
change propagation network model including the domains
product, change (process), and social. Thereby, the
product domain is a network of the components, the
change domain a network of change requests, and the
social domain a network of people. For the analysis of
changes within this network, they proposed a repository
of existing tools and metrics including two new metrics.
Ahmad et al. (2011b) proposed a method that tracks
changes across four domains using an information struc-
ture framework, which links requirements to functions,
functions to components, components to the detailed
design process. Rahmani and Thomson (2011, 2012)
proposed an interface representation model and imple-
mented it in a Java-based software. Their tool helps
linking product data from multiple engineering domains
and classifying and representing interfaces in a structured
format. It improves the information sharing and coordi-
nation between collaborating design teams and can be
used to support the management of cross-domain and
Res Eng Design
123
cross-discipline changes. Albers et al. (2011) imple-
mented their Contact and Channel Model (C&CM) in the
Cambridge Advanced Modeller (CAM) software environ-
ment (for an introduction to CAM, see e.g. Wynn et al.
2010). Their tool supports the modelling of functional
interrelations between function and form and helps reveal
the links between functional requirements and the physi-
cal parts on multiple levels of abstraction. Their model
can support change prediction analysis in combination
with CPM (Boerstring et al. 2008). Janthong (2011) used
the axiomatic design matrix (DM), which maps the
domains of design parameters to functional requirements
to estimate the effects of changes. The use of DM to trace
and analyse design changes was suggested in earlier work
from (Guenov and Barker 2005). Fei et al. (2011a, b)
proposed a modelling method, which helps to trace
change propagation within and between the functional
requirement domain and the physical structure (i.e. com-
ponents) domain. Van Beek and Tomiyama (2012) pre-
sented a multi-domain system network including the
product use domain, the function, behaviour, state
domains, and the stakeholder domain. They suggest that
this cross-domain network can be used to facilitate the
management of ECs. Their work extends their initial
approach as presented by Van Beek et al. (2010), which
applied graph theory principles to the Function–Behav-
iour–State model from Umeda and Tomiyama (1997) and
aimed to support modularisation. Koh et al. (2012) pro-
posed CPM-HoQ for assessing change options with
respect to their impact on customer requirements. Their
method builds on the concepts of CPM and House of
Quality and integrates the domains of components and
requirements.
2.3 Functional reasoning ontologies
Functional reasoning (FR) deals with theories and tech-
niques aimed at explaining and deriving functions of
artefacts. This research stream’s roots go back to early
work from Sembugamoorthy and Chandrasekaran (1986).
Since then, many FR approaches have been developed to
support design tasks (for an overview, see Umeda and
Tomiyama 1997; Chandrasekaran 2005). FR approaches in
engineering design are distinguished by representational
mechanisms of functional concepts, description mecha-
nisms of structure or state and possibly behaviour, and
explanation mechanisms for functions (Far and Elamy
2005). An excellent and very comprehensive review of FR
schemes can be found in (Erden et al. 2008).
Stone and Wood (2000) carried on the work from Little
et al. (1997) and developed the Functional Basis, a tax-
onomy scheme of flows and operations organised in three
levels of hierarchy. This functional basis subsumes seminal
classifications schemes from Pahl et al. (2007), Hundal
(1990) and the Soviet Union era design methodology
known as the theory of inventive problem solving (TRIZ)
(see e.g. Altshuller 1984; Malmqvist et al. 1996) and
supports generating of consistent functional models in
product design. This vocabulary contains 40 functions
(action words) and 31 flows (objects). Independently,
Szykman et al. (1999) developed a common functional
design vocabulary. Later, both taxonomies were merged
together into the Reconciled Functional Basis (Hirtz et al.
2002). This latest version of the functional basis consists of
53 functions and 42 flows both arranged in three hierarchy
levels. The hierarchy is of type specification-generalisation
and should allow designers to describe functions at dif-
ferent levels of detail.
Independently from each other, three research groups
developed FR schemes, which include three domains—
functions, behaviour, and structure or state. The first group
from Georgia Institute of Technology guided by Goel
extended the hierarchical representation of artefact’s
functions and behaviours from Sembugamoorthy and
Chandrasekaran (1986) into the Structure–Behaviour–
Function (SBF) model and proposed a number of tools
based on it (see e.g. Goel et al. 2009). The second group
from University of Sydney led by Gero developed the
Function–Behaviour–Structure (here: FBStr) framework
based on Gero’s earlier work on design representation (see
e.g. Qian and Gero 1996). The third group from the Uni-
versity of Tokyo directed by Tomiyama and Umeda
developed the Function–Behaviour–State (here: FBSta)
modelling and a conceptual design-support tool called
Function–Behaviour–State Modeler based on it (see e.g.
Umeda et al. 1996). Thereby, state is a generalised concept
of structure (Umeda et al. 1990).
3 FBS Linkage method
3.1 Incorporation of a FBS scheme to CPM
The change prediction method (CPM) uses a model of the
dependencies between component pairs to model change
propagation and compute the overall risk of change prop-
agation imposed on other components if one component
changes (Clarkson et al. 2004). CPM assumes that a change
to one component can only propagate to another compo-
nent if they are directly linked to each other (i.e. direct
change propagation) or if there is a path between them
leading over several intermediary components (i.e. indirect
change propagation). This assumption is essential, not only
for CPM but for most existing propagation methods. It
allows the use of network models to describe change
propagation.
Res Eng Design
123
However, CPM stays only at the component level and
does not provide more details of how changes propagate
from one component to another. We hypothesise that CPM
can be improved by detailing its component network to a
more sophisticated attribute network.
According to (Gero and Kannengiesser 2004, p. 374),
‘‘A designer constructs connections between the function,
behaviour and structure of a design object through expe-
rience. Specifically, the designer ascribes function to
behaviour and derives behaviour from structure.’’ Such a
FBS scheme may be represented as a multilayer network
composed of functional, behavioural, and structural attri-
butes, and the attribute connections can be used to describe
how changes propagate between the network elements: A
change to one FBS element might impact other elements if
they are directly or indirectly related to each other. Thus,
for a FBS scheme, it can be assumed analogous that:
changes can only propagate between structural, behav-
ioural, and functional elements along available links in the
FBS scheme.
This assumption enables the integration of a FBS
scheme into CPM by replacing the component network of
CPM with a FBS network. The CPM technique proceeds
with quantifying the component links in terms of likelihood
and impact of change propagation. Change likelihood
accounts for the frequency of how often a change propa-
gates. Change impact accounts for the severity of how
much of the initial effort has to be reinvested to implement
the propagated change. Both are estimations elicited from
experts based on their experience and product knowledge.
In case of existing designs, the estimations can be backed
up with historic data. However, the expert input is inevi-
table not only for new designs, where historic data is not
available, but also because some changes might have never
occurred in the past but need to be anticipated for the
future. The product of likelihood and impact is defined as
risk of change propagation. The links in the FBS network
may be quantified similarly. Consequently, the Forward
CPM algorithm may be applied to this numerical FBS
network to compute the combined risk of change
propagation. Combined refers to the sum of direct and
indirect risk.
In a similar way as the FBStr concept can be used to
model the design process from early stages of design (see
e.g. (Gero and Kannengiesser 2004), this method can be
applied already in the conceptual stage, where information
about functional requirements is available but the structure
is incomplete; and the designer proceeds by linking func-
tions to behaviours and behaviours to structures to deter-
mine the FBS network. Thus, in the early design phases, the
FBS network is incomplete and evolves. For the method
here, this means, in early design stages where the network is
incomplete, change propagation can only be described
within the already existing parts of the network. This allows
the method to be used to assess the impact of adding new
elements to the network on the existing elements. Apart
from the CPM application, the FBS network opens the door
to a number of possible applications to support designers at
different phases of product development, from conceptual
design, over embodiment design, to detail design and
throughout the product life cycle. These applications
include improving understanding of the overall system and
its functions, facilitating communication between engineers
of different disciplines, explanation mechanisms of func-
tions and means to promote the use of computers within
design, and a better understanding of the overall design
process (Erden et al. 2008; Van Beek et al. 2010).
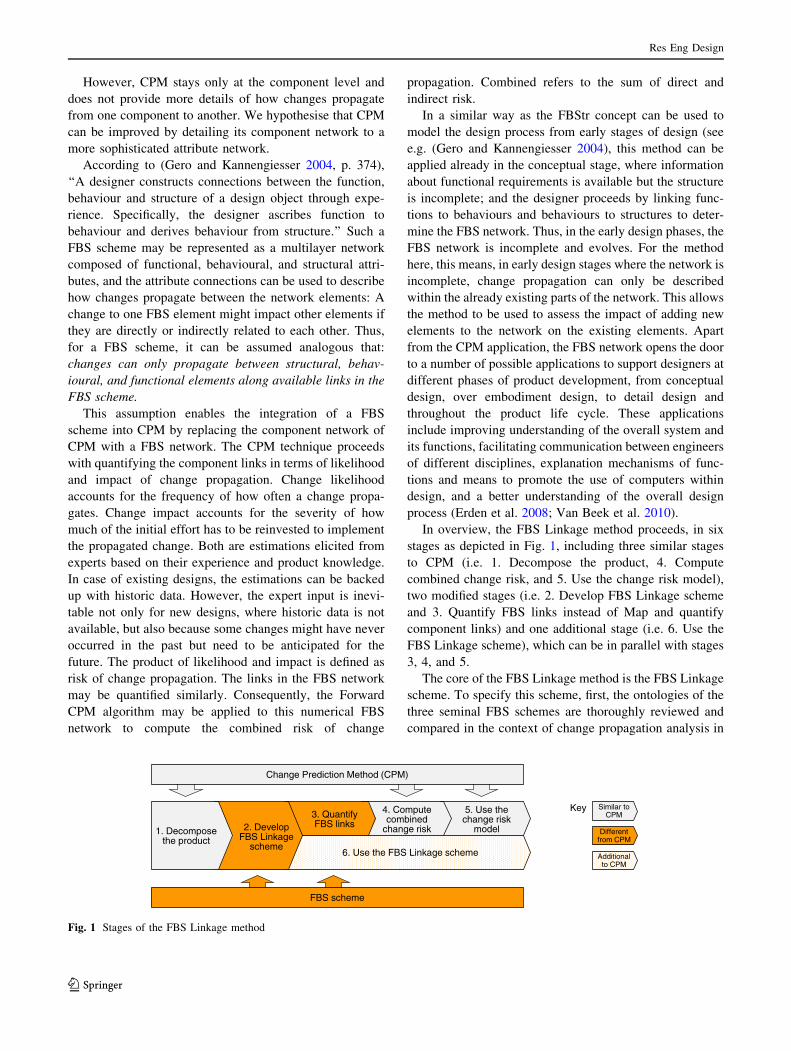
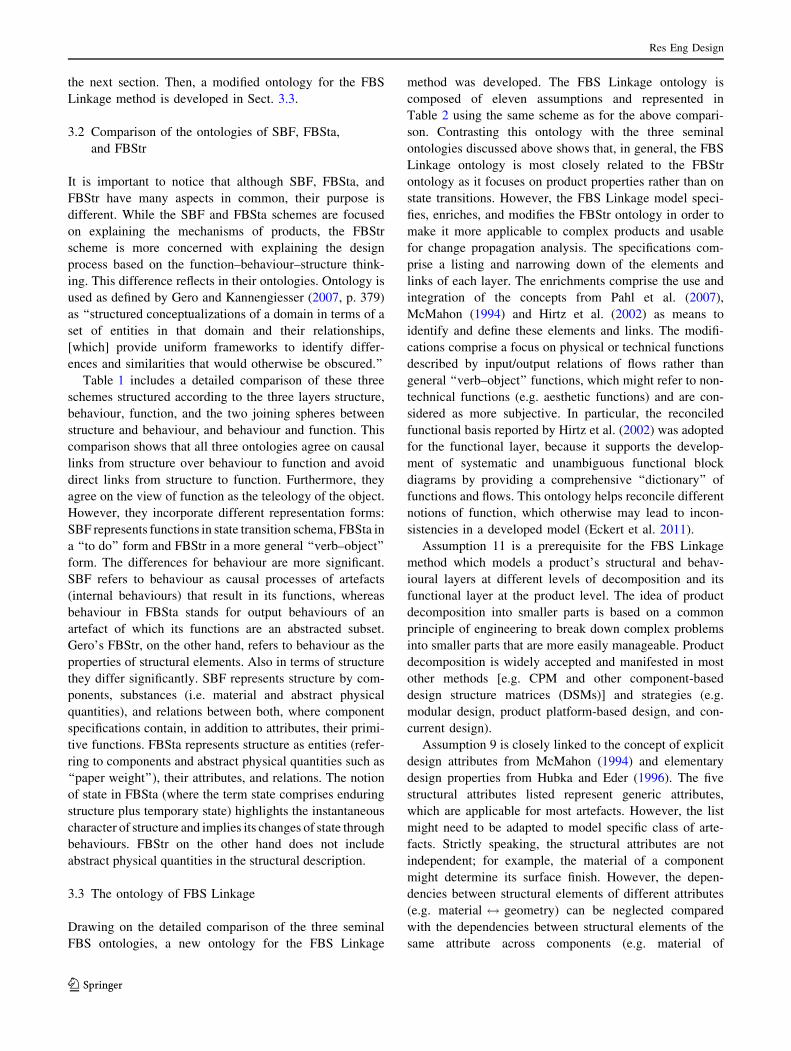
In overview, the FBS Linkage method proceeds, in six
stages as depicted in Fig. 1, including three similar stages
to CPM (i.e. 1. Decompose the product, 4. Compute
combined change risk, and 5. Use the change risk model),
two modified stages (i.e. 2. Develop FBS Linkage scheme
and 3. Quantify FBS links instead of Map and quantify
component links) and one additional stage (i.e. 6. Use the
FBS Linkage scheme), which can be in parallel with stages
3, 4, and 5.
The core of the FBS Linkage method is the FBS Linkage
scheme. To specify this scheme, first, the ontologies of the
three seminal FBS schemes are thoroughly reviewed and
compared in the context of change propagation analysis in
6. Use the FBS Linkage scheme
Key
Different from CPM
Additional to CPM
5. Use the change risk
model
3. Quantify FBS links
4. Compute combined
change risk
FBS scheme
1. Decompose the product
2. Develop FBS Linkage
scheme
Change Prediction Method (CPM)
Similar to CPM
Fig. 1 Stages of the FBS Linkage method
Res Eng Design
123
Ta
ble
1C
om
par
iso
no
fth
eS
BF
,F
BS
t,an
dF
BS
on
tolo
gie
s
On
tolo
gy
Str
uct
ure
–b
ehav
iou
r–fu
nct
ion
(SB
F)
Fu
nct
ion
–b
ehav
iou
r–st
ate
(FB
Sta
)F
un
ctio
n–
beh
avio
ur–
stru
ctu
re(F
BS
tr)
Mai
n
pu
bli
cati
on
s
(Sem
bu
gam
oo
rth
yan
dC
han
dra
sek
aran
19
86
)(U
med
aet
al.
19
90
)(G
ero
19
90
)
(Go
elan
dC
han
dra
sek
aran
19
89
)(U
med
aet
al.
19
96
)(G
ero
etal
.1
99
2)
(Go
elan
dS
tro
uli
a1
99
6)
(Um
eda
and
To
miy
ama
19
97
)(Q
ian
and
Ger
o1
99
6)
(Go
elet
al.
20
09)
(Van
Bee
ket
al.
20
10
)(R
ose
nm
anan
dG
ero
19
98
)
(Ger
oan
dK
ann
eng
iess
er2
00
4)
(Ver
maa
san
dD
ors
t2
00
7)
Fu
nct
ion
Key
dis
tin
ctio
nst
ate
tran
siti
on
sch
ema
Key
dis
tin
ctio
n‘‘
tod
o’’
form
Key
dis
tin
ctio
n‘‘
ver
b–
ob
ject
’’fo
rm
Defi
nit
ion
Defi
nit
ion
Defi
nit
ion
‘‘F
un
ctio
ns
inS
BF
des
crib
eth
ero
leth
atan
Ele
men
t
pla
ys
inth
eo
ver
all
op
erat
ion
of
ad
evic
e.T
hey
exp
ress
the
pu
rpo
seo
rg
oal
of
the
Ele
men
t,w
her
eas
the
Beh
avio
rd
escr
ibes
ho
wth
ep
urp
ose
isac
com
pli
shed
’’
(Go
elet
al.
20
09
,p
.2
6).
Fu
nct
ion
sar
ere
pre
sen
ted
asa
sch
ema
that
spec
ifies
thei
rp
re-c
on
dit
ion
s,p
ost
-
con
dit
ion
s,th
eb
ehav
iou
rth
atac
com
pli
shes
the
fun
ctio
n,
and
po
ssib
lyco
nd
itio
ns
un
der
wh
ich
the
spec
ified
beh
avio
rac
hie
ves
the
giv
enfu
nct
ion
(Go
el
etal
.2
00
9)
Fu
nct
ion
is‘‘
ad
escr
ipti
on
of
beh
avio
rab
stra
cted
by
hu
man
thro
ug
hre
cog
nit
ion
of
the
beh
avio
rin
ord
erto
uti
lize
it.
[…]
ing
ener
al,
[fu
nct
ion
sar
e]re
pre
sen
ted
in
the
form
of
‘to
do
som
eth
ing
’’’
(Um
eda
etal
.1
99
0,
p.
18
3)
‘‘F
un
ctio
n(F
)v
aria
ble
s:d
escr
ibe
the
tele
olo
gy
of
the
ob
ject
,i.
e.w
hat
itis
for’
’(G
ero
and
Kan
nen
gie
sser
20
04
,p
.3
74
)
‘‘A
fun
ctio
nm
ayb
ea
ph
ysi
cal
fun
ctio
n,
such
as
‘pro
vid
ing
suffi
cien
tsp
ace’
,o
ra
no
n-p
hy
sica
lfu
nct
ion
such
as‘p
rov
idin
gan
amb
ien
ce’’
’(R
ose
nm
anan
d
Ger
o1
99
8,
p.
16
9,
17
0)
Exa
mp
le(G
oel
etal
.2
00
9,
p.
24
):E
xam
ple
s(U
med
aet
al.
19
96,
p.
27
7):
Exa
mp
les
(Ger
oan
dK
ann
eng
iess
er2
00
4,
p.
38
1):
Th
efu
nct
ion
so
fa
win
do
war
e:
Fu
nct
ion
:tr
ansf
eran
gu
lar
mo
men
tum
To
mak
ea
sou
nd
En
han
cin
gw
inte
rso
lar
gai
n
Pre
-co
nd
itio
n:
ang
ula
rm
om
entu
mm
agn
itu
de
Li
To
gen
erat
eli
gh
tC
on
tro
llin
gn
ois
e
Po
st-c
on
dit
ion
:an
gu
lar
mo
men
tum
mag
nit
ud
eL
oP
rov
idin
gv
iew
By
beh
avio
ur:
tran
sfer
ang
ula
rm
om
entu
mP
rov
idin
gd
ayli
gh
t
Lin
ks
bet
wee
n
fun
ctio
n
and
beh
avio
ur
Key
dis
tin
ctio
nra
tio
nal
,o
ne-
to-o
ne
rela
tio
nK
eyd
isti
nct
ion
rati
on
al,
sub
ject
ive
(des
ign
er’s
cho
ice)
,
man
y-t
o-m
any
rela
tio
n
Key
dis
tin
ctio
nra
tio
nal
,su
bje
ctiv
e(d
esig
ner
’sch
oic
e),
man
y-t
o-m
any
rela
tio
n
‘‘T
he
rep
rese
nta
tio
no
fa
fun
ctio
no
fa
dev
ice
also
incl
ud
esa
po
inte
rto
the
inte
rnal
beh
avio
ro
fth
ed
evic
e
that
resu
lts
inth
efu
nct
ion
’’(G
oel
and
Str
ou
lia
19
96
,
p.
36
0)
‘‘T
he
rela
tio
nsh
ips
bet
wee
nfu
nct
ion
san
db
ehav
iors
are
sub
ject
ive
and
man
y-t
o-
man
yco
rres
po
nd
ent’
’(U
med
a
etal
.1
99
6,
p.
27
6)
‘‘S
pec
ifica
lly
,fu
nct
ion
isas
crib
edto
beh
avio
rb
y
esta
bli
shin
ga
tele
olo
gic
alco
nn
ecti
on
bet
wee
nth
e
hu
man
’sg
oal
san
do
bse
rvab
leo
rm
easu
rab
leef
fect
so
f
the
ob
ject
’’(G
ero
and
Kan
nen
gie
sser
20
07
,p
.3
80
)
‘‘E
ach
elem
ent
inan
SB
Fm
od
elh
asa
fun
ctio
n,
and
each
fun
ctio
nh
asa
corr
esp
on
din
gb
ehav
ior’
’(G
oel
etal
.
20
09
,p
.2
8)
‘‘…
on
efu
nct
ion
may
corr
esp
on
dto
man
yb
ehav
iors
and
on
eb
ehav
ior
may
be
asso
ciat
edw
ith
mo
reth
ano
ne
fun
ctio
n’’
(Qia
nan
dG
ero
19
96
,p
.2
91
)
Res Eng Design
123
Ta
ble
1co
nti
nu
ed
On
tolo
gy
Str
uct
ure
–b
ehav
iou
r–fu
nct
ion
(SB
F)
Fu
nct
ion
–b
ehav
iou
r–st
ate
(FB
Sta
)F
un
ctio
n–
beh
avio
ur–
stru
ctu
re(F
BS
tr)
Beh
avio
ur
Key
dis
tin
ctio
nin
tern
alb
ehav
iou
rs/s
equ
ence
of
stat
e
tran
siti
on
s
Key
dis
tin
ctio
no
utp
ut
beh
avio
urs
/seq
uen
ceo
fst
ate
tran
siti
on
s
Key
dis
tin
ctio
nd
eriv
able
attr
ibu
tes
Defi
nit
ion
Defi
nit
ion
Defi
nit
ion
‘‘T
he
‘‘B
’’in
aS
BF
dev
ice
mo
del
refe
rsto
the
inte
rnal
beh
avio
rso
fth
ed
evic
eth
atsp
ecif
yh
ow
the
stru
ctu
re
of
the
dev
ice
del
iver
sit
sfu
nct
ion
s,o
r,in
gen
eral
,it
s
ou
tpu
tb
ehav
iors
’’(G
oel
and
Str
ou
lia
19
96
,p
.3
56
)
‘‘In
tro
du
cin
ga
dis
cret
eu
nit
tim
e,w
ed
efin
eb
ehav
ior
as
‘‘se
qu
enti
alst
ate
tran
siti
on
sal
on
gti
me,
’’an
das
sum
e
that
ph
ysi
cal
ph
eno
men
ad
eter
min
eb
ehav
ior
of
an
enti
ty’’
(Um
eda
etal
.1
99
6,
p.
27
6)
‘‘B
ehav
iou
r(B
)v
aria
ble
s:d
escr
ibe
the
attr
ibu
tes
that
are
der
ived
or
exp
ecte
dto
be
der
ived
fro
mth
est
ruct
ure
(S)
var
iab
les
of
the
ob
ject
,i.
e.w
hat
itd
oes
’’(G
ero
and
Kan
nen
gie
sser
20
04
,p
.3
74
)
‘‘A
beh
avio
ris
rep
rese
nte
das
ase
qu
ence
of
stat
esan
d
tran
siti
on
sb
etw
een
them
’’(G
oel
etal
.2
00
9,
p.
25
)
‘‘S
BF
mo
del
su
sean
on
tolo
gy
of
pri
mit
ive
fun
ctio
ns
bas
edo
nth
eco
mp
on
ent–
sub
stan
ceo
nto
log
y,
wh
ich
enab
les
am
ore
pre
cise
spec
ifica
tio
no
fst
ate
tran
siti
on
s
ina
beh
avio
ur’
’(G
oel
etal
.2
00
9,
p.
26
)
‘‘A
beh
avio
ur
isth
us
ad
escr
ipti
on
of
the
ob
ject
’sac
tio
ns
or
pro
cess
esin
giv
enci
rcu
mst
ance
s’’
(Ro
sen
man
and
Ger
o1
99
8,
p.
16
9)
Exa
mp
le(G
oel
etal
.2
00
9,
p.
25
):E
xam
ple
s(U
med
aet
al.
19
96,
p.
27
6,
27
7):
Exa
mp
les
(Ger
oan
dK
ann
eng
iess
er2
00
4,
p.
38
1):
Beh
avio
ur:
tran
sfer
ang
ula
rm
om
entu
mH
itti
ng
ab
ell
Th
eb
ehav
iou
rso
fa
gla
ssar
e:
Sta
te1
:m
om
entu
mat
gy
rosc
op
ew
ith
mag
nit
ud
e
M_
inp
ut
Osc
illa
tin
ga
stri
ng
Th
erm
alco
nd
uct
ion
Tra
nsi
tio
nb
yu
sin
gfu
nct
ion
:‘‘
allo
wan
gu
lar
mo
men
tum
of
lin
kag
eg
yro
sco
pe-
wo
rmw
hee
l’’
Ala
mp
lig
hti
ng
Lig
ht
tran
smis
sio
n
Sta
te2
:m
om
entu
mat
piv
ot
wit
hm
agn
itu
de
L_
ww
Ab
atte
ryg
ener
atin
gel
ectr
icit
yD
irec
tso
lar
gai
n
Lin
ks
bet
wee
n
beh
avio
ur
and
stru
ctu
re
(sta
te)
Key
dis
tin
ctio
nca
usa
l,o
bje
ctiv
e(b
yp
hy
sica
lla
ws)
Key
dis
tin
ctio
nca
usa
l,o
bje
ctiv
e(b
yp
hy
sica
lla
ws)
Key
dis
tin
ctio
nca
usa
l,o
bje
ctiv
e(b
yp
hy
sica
lla
ws)
Man
y-t
o-m
any
rela
tio
nIn
gen
eral
,m
any
-to
-man
yre
lati
on
.W
ith
ino
ne
vie
w/
asp
ect:
on
e(b
ehav
iou
r)-t
o-m
any
(sta
tes)
rela
tio
n
Man
y-t
o-m
any
rela
tio
n
‘‘E
ach
com
po
nen
tp
lay
sa
fun
ctio
nal
role
ina
stat
e
tran
siti
on
ino
ne
or
mo
rein
tern
alb
ehav
iors
of
the
dev
ice;
[…]
Aco
mp
on
ent
may
also
be
affe
cted
by
som
est
ate
tran
siti
on
’’(G
oel
and
Str
ou
lia
19
96
,p
.3
79
)
‘‘H
ow
ever
,a
tran
siti
on
fro
ma
stat
eto
the
nex
tst
ate
[i.e
.
ab
ehav
iou
r]d
oes
no
to
ccu
rat
ran
do
mb
ut
isg
ov
ern
ed
by
som
ep
rin
cip
les;
viz
.p
hy
sica
lla
ws‘
‘(U
med
aet
al.
19
90
,p
.1
83
)
‘‘B
ehav
ior
isca
usa
lly
con
nec
ted
tost
ruct
ure
,th
atis
,it
can
be
der
ived
fro
mst
ruct
ure
usi
ng
ph
ysi
cal
law
so
r
heu
rist
ics’
’(G
ero
and
Kan
nen
gie
sser
20
07
,p
.3
80
)
‘‘C
ausa
lex
pla
nat
ion
sfo
rst
ate
tran
siti
on
sm
ayin
clu
de
ph
ysi
cal
law
s,m
ath
emat
ical
equ
atio
ns,
fun
ctio
ns
of
its
sub
syst
ems,
stru
ctu
ral
con
stra
ints
,o
ther
beh
avio
rs,
or
a
stat
eo
rtr
ansi
tio
nin
ano
ther
beh
avio
ur’
’(G
oel
etal
.
20
09
,p
.2
5)
‘‘H
ow
ever
,re
pre
sen
tati
on
so
fb
ehav
ior
may
dif
fer
dep
end
ing
on
the
ph
ysi
cal
situ
atio
ns
of
the
curr
ent
inte
rest
.[…
]T
ore
pre
sen
tth
isd
iffe
ren
ce,
we
intr
od
uce
asp
ects
.A
nas
pec
tis
aco
llec
tio
no
fal
lre
lev
ant
enti
ties
,at
trib
ute
s,re
lati
on
s,an
dp
hy
sica
lp
hen
om
ena
of
the
curr
ent
inte
rest
’’(U
med
aet
al.
19
96
,p
.2
76
)
‘‘S
imil
arly
[to
the
lin
ks
bet
wee
nfu
nct
ion
san
d
beh
avio
rs],
beh
avio
rca
nb
ed
eriv
edfr
om
mo
reth
an
on
est
ruct
ure
’’(Q
ian
and
Ger
o1
99
6,
p.
29
1)
Res Eng Design
123
Ta
ble
1co
nti
nu
ed
On
tolo
gy
Str
uct
ure
–b
ehav
iou
r–fu
nct
ion
(SB
F)
Fu
nct
ion
–b
ehav
iou
r–st
ate
(FB
Sta
)F
un
ctio
n–
beh
avio
ur–
stru
ctu
re(F
BS
tr)
Str
uct
ure
or
stat
e
Key
dis
tin
ctio
nco
mp
on
ents
,su
bst
ance
s(i
.e.
ph
ysi
cal
qu
anti
ties
),an
dre
lati
on
s
Key
dis
tin
ctio
nd
efin
edst
ate
of
enti
ties
(co
mp
on
ents
,
ph
ysi
cal
qu
anti
ties
),th
eir
attr
ibu
tes,
and
rela
tio
ns
Key
dis
tin
ctio
nel
emen
ts(c
om
po
nen
ts),
stru
ctu
ral
attr
ibu
tes,
and
rela
tio
ns
Defi
nit
ion
Defi
nit
ion
Defi
nit
ion
‘‘In
SB
Fm
od
els,
stru
ctu
reis
rep
rese
nte
din
term
so
f
com
po
nen
ts,
the
sub
stan
ces
con
tain
edin
the
com
po
nen
ts,
and
con
nec
tio
ns
amo
ng
the
com
po
nen
ts.
Th
esp
ecifi
cati
on
of
aco
mp
on
ent
incl
ud
esit
s
fun
ctio
nal
abst
ract
ion
s’’
(Go
elet
al.
20
09
,p
.2
4)
Th
est
ate
of
anen
tity
isd
efin
edb
y‘‘
ase
to
fen
titi
es,a
set
of
attr
ibu
tes,
and
ase
to
fre
lati
on
s’’
amo
ng
stth
em
(Um
eda
etal
.1
99
0,
p.
18
2)
‘‘T
he
stru
ctu
resp
ecifi
esw
hat
elem
ents
the
des
ign
is
com
po
sed
of,
wh
atth
eat
trib
ute
so
fth
eel
emen
tsar
e,
and
ho
wth
eyar
ere
late
d’’
,i.
e.w
hat
itis
(Qia
nan
d
Ger
o1
99
6,
p.
29
1)
‘‘E
ach
com
po
nen
th
aso
ne
or
mo
rep
rim
itiv
efu
nct
ion
s
rela
tiv
eto
the
sub
stan
ces:
allo
w,
mo
ve,
pu
mp
,cr
eate
,
des
tro
y,
or
exp
el’’
(Go
elan
dS
tro
uli
a1
99
6,
p.
35
8)
An
enti
tyco
uld
be
aco
mp
on
ent,
syst
em,
or
pro
du
ct,
its
attr
ibu
tean
yp
rop
erty
wh
ich
can
be
ob
serv
edb
y
scie
nti
fic
mea
ns,
and
are
lati
on
any
lin
kb
etw
een
enti
ties
,at
trib
ute
s,o
rre
lati
on
s(U
med
aet
al.
19
90
)
‘‘T
hes
est
ruct
ura
lp
rop
erti
esar
eth
ose
wh
ich
ad
esig
ner
dir
ectl
ym
anip
ula
tes
ino
rder
tog
ener
ate
ap
hy
sica
l
solu
tio
nto
anab
stra
ctp
rob
lem
.T
hu
s,w
hil
ed
esig
ner
s
tak
em
any
thin
gs
into
con
sid
erat
ion
inth
eco
urs
eo
f
des
ign
ing
,u
ltim
atel
yw
hat
they
do
isse
lect
stru
ctu
ral
var
iab
les
and
assi
gn
toth
emv
alu
esre
pre
sen
tin
g
mat
eria
lp
rop
erti
es,
shap
ed
escr
ipti
on
s,d
imen
sio
ns,
loca
tio
nan
dco
nn
ecti
vit
y’’
(Ro
sen
man
and
Ger
o1
99
8,
p.
16
9)
‘‘T
he
spec
ifica
tio
no
fa
sub
stan
cein
clu
des
its
pro
per
ties
’’
(Go
elet
al.
20
09,
p.
24
)
Th
en
oti
on
of
stat
eim
pli
es‘‘
chan
ges
of
stat
e’’
thro
ug
h
beh
avio
urs
‘‘(U
med
aet
al.
19
90
,p
.1
83
)
Ele
men
tsco
uld
be
asse
mb
lies
,co
mp
on
ents
,o
rp
arts
.
‘‘A
nel
emen
th
asm
any
pro
per
ties
,o
rat
trib
ute
s,fo
r
exam
ple
,co
lor,
shap
e,m
ater
ial,
and
soo
n.
[…]
Ifth
e
elem
ents
are
ph
ysi
cal,
the
rela
tio
nsh
ipb
etw
een
them
is
ap
hy
sica
lin
terc
on
nec
tio
nu
sin
gto
po
log
ical
or
geo
met
rica
ld
ata’
’(Q
ian
and
Ger
o1
99
6,
p.
29
2)
Exa
mp
les
(Go
elet
al.
20
09
,p
.3
1):
Exa
mp
les
(Um
eda
etal
.1
99
0,
p.
18
2):
Exa
mp
les
(Ger
oan
dK
ann
eng
iess
er2
00
4,
p.
38
1):
Co
mp
on
ents
:g
yro
sco
pe,
wo
rmw
hee
l,p
ivo
tE
nti
ties
:p
aper
wei
gh
t,p
aper
Ele
men
ts:
gla
ss,
fram
e
Su
bst
ance
:an
gu
lar
mo
men
tum
Rel
atio
n:
‘‘o
n’’
,i.
e.th
ep
aper
wei
gh
tis
on
the
pap
erA
ttri
bu
tes:
gla
zin
gle
ng
th,
typ
eo
fco
atin
g,
typ
eo
fg
lass
Co
nn
ecti
on
s:co
nta
ins,
con
nec
ted
Att
rib
ute
so
fp
aper
wei
gh
t:w
eig
ht,
vo
lum
e,d
ensi
ty,
wh
ich
are
also
rela
ted
toea
cho
ther
Rel
atio
n:
gla
ssan
dfr
ame
are
geo
met
rica
lly
inte
rlin
ked
Res Eng Design
123
the next section. Then, a modified ontology for the FBS
Linkage method is developed in Sect. 3.3.
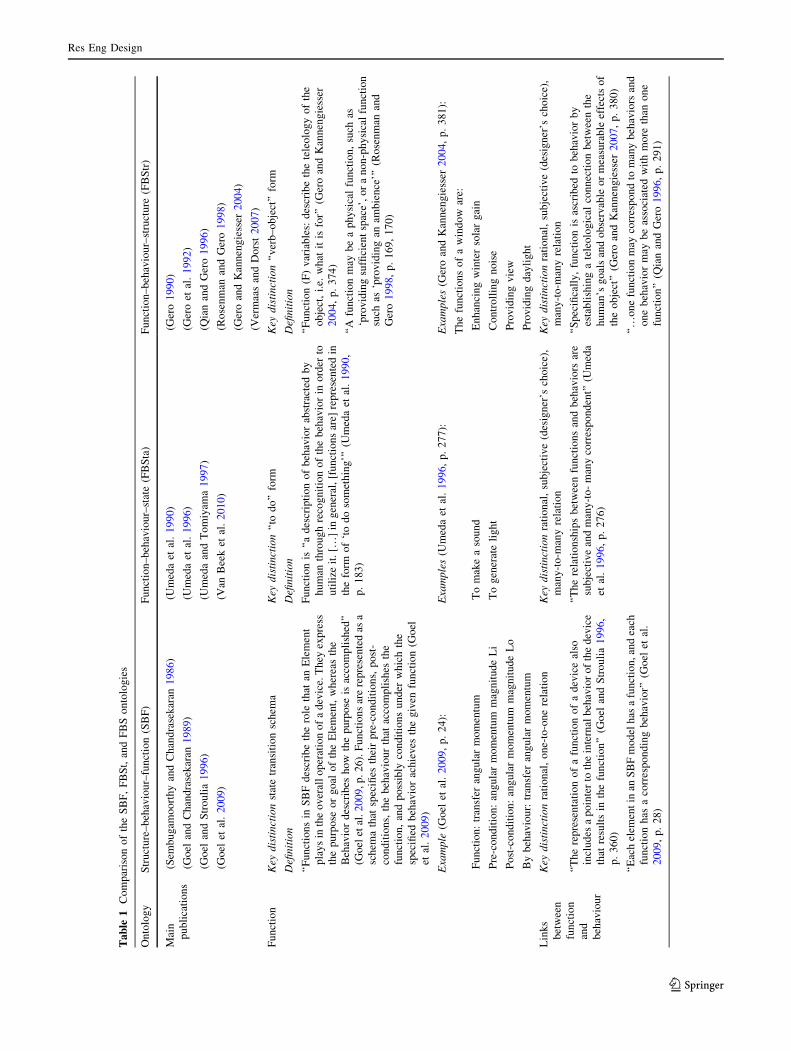
3.2 Comparison of the ontologies of SBF, FBSta,
and FBStr
It is important to notice that although SBF, FBSta, and
FBStr have many aspects in common, their purpose is
different. While the SBF and FBSta schemes are focused
on explaining the mechanisms of products, the FBStr
scheme is more concerned with explaining the design
process based on the function–behaviour–structure think-
ing. This difference reflects in their ontologies. Ontology is
used as defined by Gero and Kannengiesser (2007, p. 379)
as ‘‘structured conceptualizations of a domain in terms of a
set of entities in that domain and their relationships,
[which] provide uniform frameworks to identify differ-
ences and similarities that would otherwise be obscured.’’
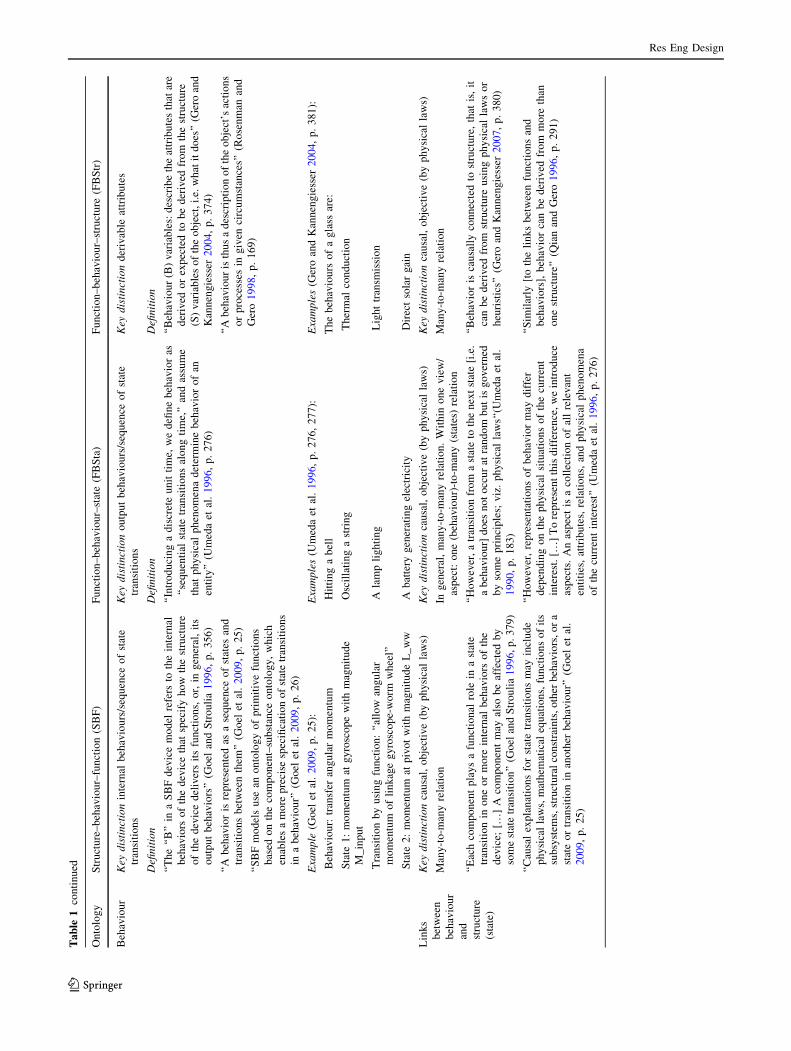
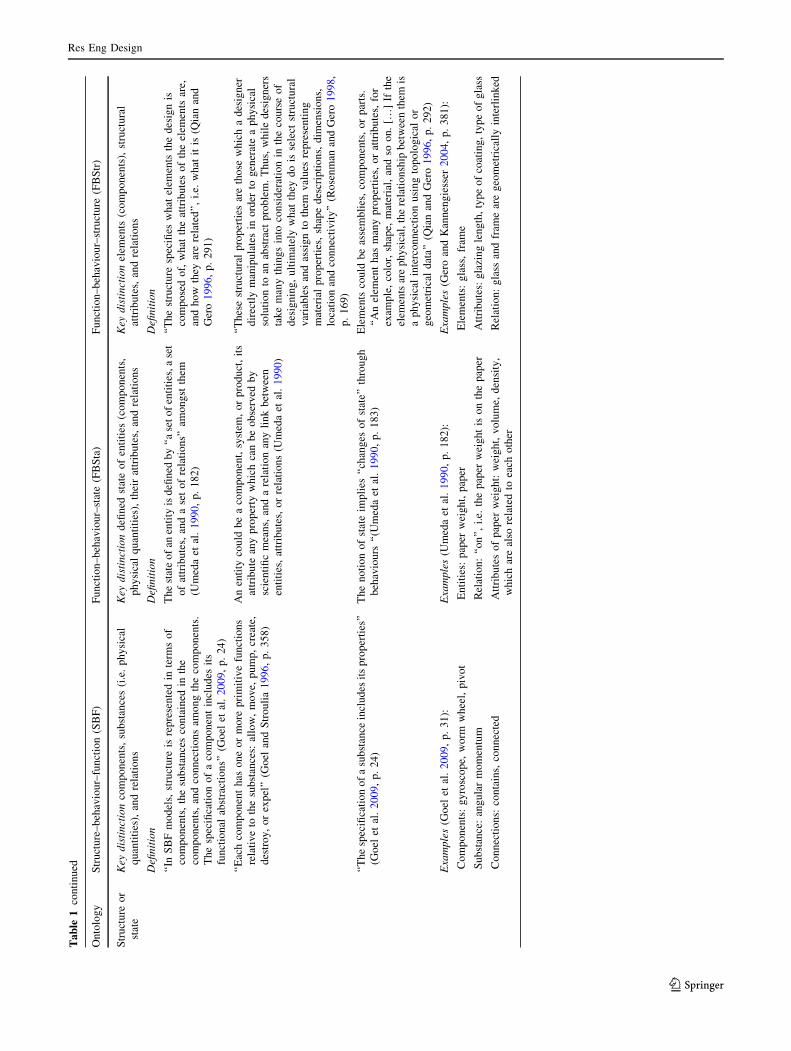
Table 1 includes a detailed comparison of these three
schemes structured according to the three layers structure,
behaviour, function, and the two joining spheres between
structure and behaviour, and behaviour and function. This
comparison shows that all three ontologies agree on causal
links from structure over behaviour to function and avoid
direct links from structure to function. Furthermore, they
agree on the view of function as the teleology of the object.
However, they incorporate different representation forms:
SBF represents functions in state transition schema, FBSta in
a ‘‘to do’’ form and FBStr in a more general ‘‘verb–object’’
form. The differences for behaviour are more significant.
SBF refers to behaviour as causal processes of artefacts
(internal behaviours) that result in its functions, whereas
behaviour in FBSta stands for output behaviours of an
artefact of which its functions are an abstracted subset.
Gero’s FBStr, on the other hand, refers to behaviour as the
properties of structural elements. Also in terms of structure
they differ significantly. SBF represents structure by com-
ponents, substances (i.e. material and abstract physical
quantities), and relations between both, where component
specifications contain, in addition to attributes, their primi-
tive functions. FBSta represents structure as entities (refer-
ring to components and abstract physical quantities such as
‘‘paper weight’’), their attributes, and relations. The notion
of state in FBSta (where the term state comprises enduring
structure plus temporary state) highlights the instantaneous
character of structure and implies its changes of state through
behaviours. FBStr on the other hand does not include
abstract physical quantities in the structural description.
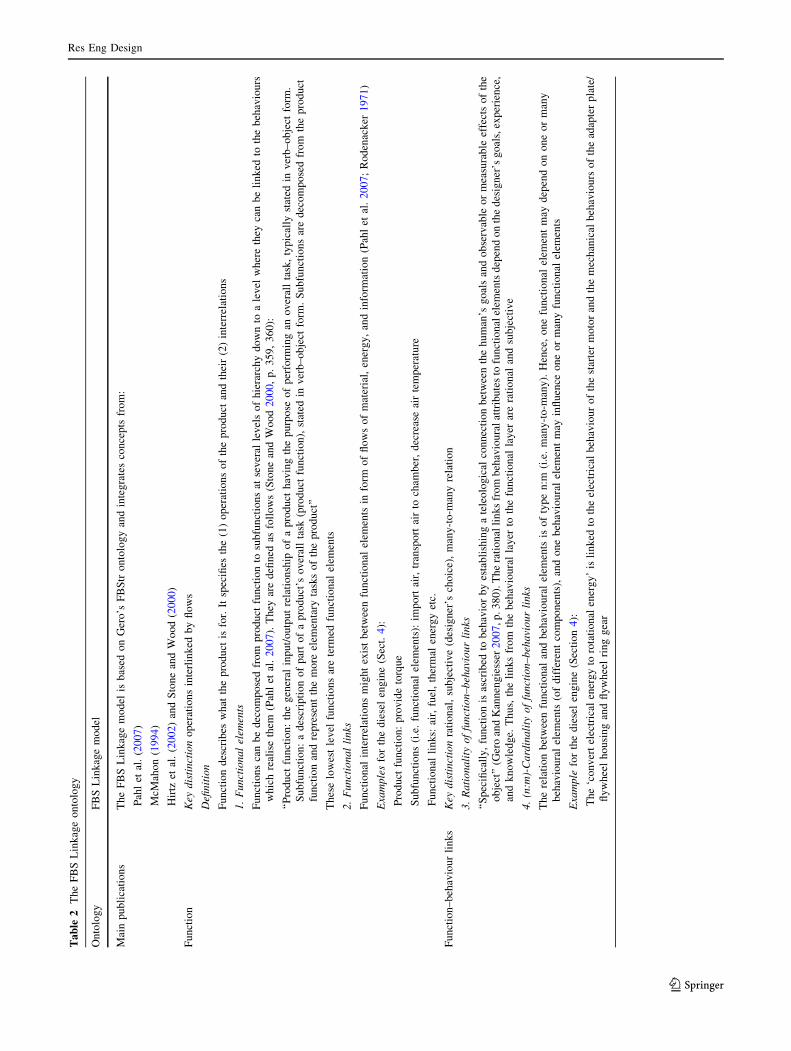
3.3 The ontology of FBS Linkage
Drawing on the detailed comparison of the three seminal
FBS ontologies, a new ontology for the FBS Linkage
method was developed. The FBS Linkage ontology is
composed of eleven assumptions and represented in
Table 2 using the same scheme as for the above compari-
son. Contrasting this ontology with the three seminal
ontologies discussed above shows that, in general, the FBS
Linkage ontology is most closely related to the FBStr
ontology as it focuses on product properties rather than on
state transitions. However, the FBS Linkage model speci-
fies, enriches, and modifies the FBStr ontology in order to
make it more applicable to complex products and usable
for change propagation analysis. The specifications com-
prise a listing and narrowing down of the elements and
links of each layer. The enrichments comprise the use and
integration of the concepts from Pahl et al. (2007),
McMahon (1994) and Hirtz et al. (2002) as means to
identify and define these elements and links. The modifi-
cations comprise a focus on physical or technical functions
described by input/output relations of flows rather than
general ‘‘verb–object’’ functions, which might refer to non-
technical functions (e.g. aesthetic functions) and are con-
sidered as more subjective. In particular, the reconciled
functional basis reported by Hirtz et al. (2002) was adopted
for the functional layer, because it supports the develop-
ment of systematic and unambiguous functional block
diagrams by providing a comprehensive ‘‘dictionary’’ of
functions and flows. This ontology helps reconcile different
notions of function, which otherwise may lead to incon-
sistencies in a developed model (Eckert et al. 2011).
Assumption 11 is a prerequisite for the FBS Linkage
method which models a product’s structural and behav-
ioural layers at different levels of decomposition and its
functional layer at the product level. The idea of product
decomposition into smaller parts is based on a common
principle of engineering to break down complex problems
into smaller parts that are more easily manageable. Product
decomposition is widely accepted and manifested in most
other methods [e.g. CPM and other component-based
design structure matrices (DSMs)] and strategies (e.g.
modular design, product platform-based design, and con-
current design).
Assumption 9 is closely linked to the concept of explicit
design attributes from McMahon (1994) and elementary
design properties from Hubka and Eder (1996). The five
structural attributes listed represent generic attributes,
which are applicable for most artefacts. However, the list
might need to be adapted to model specific class of arte-
facts. Strictly speaking, the structural attributes are not
independent; for example, the material of a component
might determine its surface finish. However, the depen-
dencies between structural elements of different attributes
(e.g. material $ geometry) can be neglected compared
with the dependencies between structural elements of the
same attribute across components (e.g. material of
Res Eng Design
123
Ta
ble
2T
he
FB
SL
ink
age
on
tolo
gy
On
tolo
gy
FB
SL
ink
age
mo
del
Mai
np
ub
lica
tio
ns
Th
eF
BS
Lin
kag
em
od
elis
bas
edo
nG
ero
’sF
BS
tro
nto
log
yan
din
teg
rate
sco
nce
pts
fro
m:
Pah
let
al.
(20
07
)
McM
aho
n(1
99
4)
Hir
tzet
al.
(20
02
)an
dS
ton
ean
dW
oo
d(2
00
0)
Fu
nct
ion
Key
dis
tin
ctio
no
per
atio
ns
inte
rlin
ked
by
flo
ws
Defi
nit
ion
Fu
nct
ion
des
crib
esw
hat
the
pro
du
ctis
for.
Itsp
ecifi
esth
e(1
)o
per
atio
ns
of
the
pro
du
ctan
dth
eir
(2)
inte
rrel
atio
ns
1.
Fu
nct
ion
al
elem
ents
Fu
nct
ion
sca
nb
ed
eco
mp
ose
dfr
om
pro
du
ctfu
nct
ion
tosu
bfu
nct
ion
sat
sev
eral
lev
els
of
hie
rarc
hy
do
wn
toa
lev
elw
her
eth
eyca
nb
eli
nk
edto
the
beh
avio
urs
wh
ich
real
ise
them
(Pah
let
al.
20
07
).T
hey
are
defi
ned
asfo
llo
ws
(Sto
ne
and
Wo
od
20
00,
p.
35
9,
36
0):
‘‘P
rod
uct
fun
ctio
n:
the
gen
eral
inp
ut/
ou
tpu
tre
lati
on
ship
of
ap
rod
uct
hav
ing
the
pu
rpo
seo
fp
erfo
rmin
gan
ov
eral
lta
sk,
typ
ical
lyst
ated
inv
erb
–ob
ject
form
.
Su
bfu
nct
ion
:a
des
crip
tio
no
fp
art
of
ap
rod
uct
’so
ver
all
task
(pro
du
ctfu
nct
ion
),st
ated
inv
erb
–o
bje
ctfo
rm.
Su
bfu
nct
ion
sar
ed
eco
mp
ose
dfr
om
the
pro
du
ct
fun
ctio
nan
dre
pre
sen
tth
em
ore
elem
enta
ryta
sks
of
the
pro
du
ct’’
Th
ese
low
est
lev
elfu
nct
ion
sar
ete
rmed
fun
ctio
nal
elem
ents
2.
Fu
nct
ion
al
lin
ks
Fu
nct
ion
alin
terr
elat
ion
sm
igh
tex
ist
bet
wee
nfu
nct
ion
alel
emen
tsin
form
of
flo
ws
of
mat
eria
l,en
erg
y,
and
info
rmat
ion
(Pah
let
al.
20
07
;R
od
enac
ker
19
71
)
Exa
mp
les
for
the
die
sel
eng
ine
(Sec
t.4
):
Pro
du
ctfu
nct
ion
:p
rov
ide
torq
ue
Su
bfu
nct
ion
s(i
.e.
fun
ctio
nal
elem
ents
):im
po
rtai
r,tr
ansp
ort
air
toch
amb
er,
dec
reas
eai
rte
mp
erat
ure
Fu
nct
ion
alli
nk
s:ai
r,fu
el,
ther
mal
ener
gy
etc.
Fu
nct
ion
–b
ehav
iou
rli
nk
sK
eyd
isti
nct
ion
rati
on
al,
sub
ject
ive
(des
ign
er’s
cho
ice)
,m
any
-to
-man
yre
lati
on
3.
Ra
tio
na
lity
of
fun
ctio
n–
beh
avi
ou
rli
nks
‘‘S
pec
ifica
lly
,fu
nct
ion
isas
crib
edto
beh
avio
rb
yes
tab
lish
ing
ate
leo
log
ical
con
nec
tio
nb
etw
een
the
hu
man
’sg
oal
san
do
bse
rvab
leo
rm
easu
rab
leef
fect
so
fth
e
ob
ject
’’(G
ero
and
Kan
nen
gie
sser
20
07
,p
.3
80
).T
he
rati
on
alli
nk
sfr
om
beh
avio
ura
lat
trib
ute
sto
fun
ctio
nal
elem
ents
dep
end
on
the
des
ign
er’s
go
als,
exp
erie
nce
,
and
kn
ow
led
ge.
Th
us,
the
lin
ks
fro
mth
eb
ehav
iou
ral
lay
erto
the
fun
ctio
nal
lay
erar
era
tio
nal
and
sub
ject
ive
4.
(n:m
)-C
ard
ina
lity
of
fun
ctio
n–
beh
avi
ou
rli
nks
Th
ere
lati
on
bet
wee
nfu
nct
ion
alan
db
ehav
iou
ral
elem
ents
iso
fty
pe
n:m
(i.e
.m
any
-to
-man
y).
Hen
ce,
on
efu
nct
ion
alel
emen
tm
ayd
epen
do
no
ne
or
man
y
beh
avio
ura
lel
emen
ts(o
fd
iffe
ren
tco
mp
on
ents
),an
do
ne
beh
avio
ura
lel
emen
tm
ayin
flu
ence
on
eo
rm
any
fun
ctio
nal
elem
ents
Exa
mp
lefo
rth
ed
iese
len
gin
e(S
ecti
on
4):
Th
e‘c
on
ver
tel
ectr
ical
ener
gy
toro
tati
on
alen
erg
y’
isli
nk
edto
the
elec
tric
alb
ehav
iou
ro
fth
est
arte
rm
oto
ran
dth
em
ech
anic
alb
ehav
iou
rso
fth
ead
apte
rp
late
/
fly
wh
eel
ho
usi
ng
and
fly
wh
eel
rin
gg
ear
Res Eng Design
123
Ta
ble
2co
nti
nu
ed
On
tolo
gy
FB
SL
ink
age
mo
del
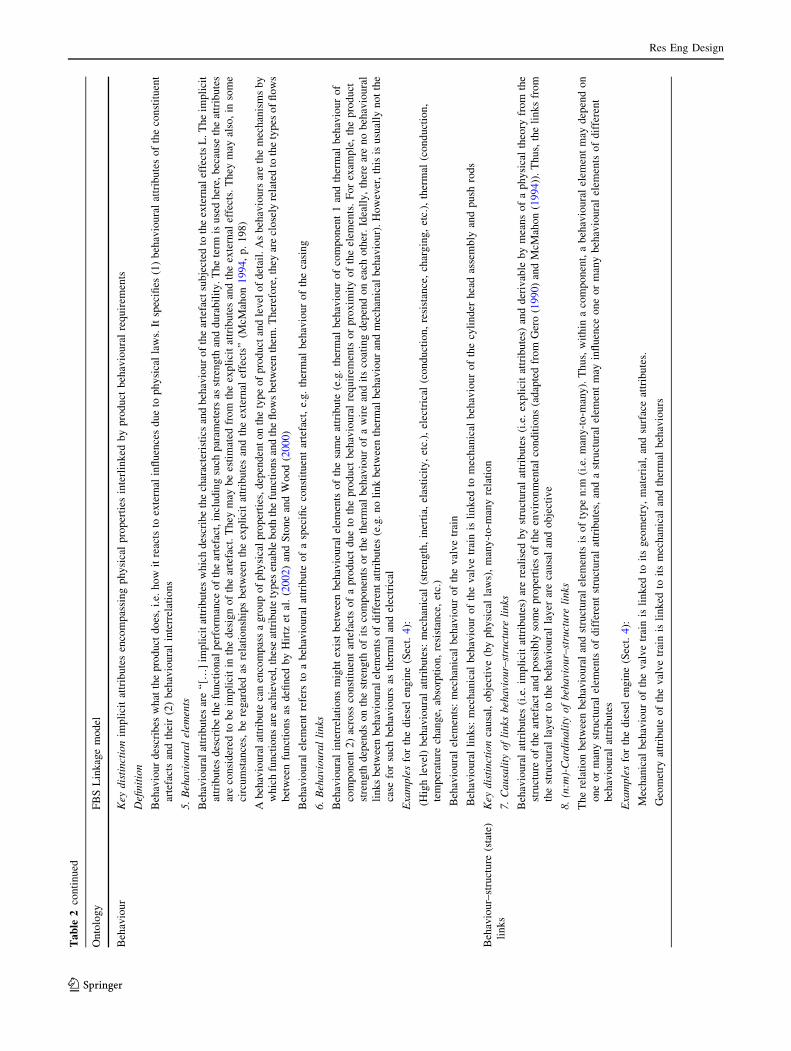
Beh
avio
ur
Key
dis
tin
ctio
nim
pli
cit
attr
ibu
tes
enco
mp
assi
ng
ph
ysi
cal
pro
per
ties
inte
rlin
ked
by
pro
du
ctb
ehav
iou
ral
req
uir
emen
ts
Defi
nit
ion
Beh
avio
ur
des
crib
esw
hat
the
pro
du
ctd
oes
,i.
e.h
ow
itre
acts
toex
tern
alin
flu
ence
sd
ue
top
hy
sica
lla
ws.
Itsp
ecifi
es(1
)b
ehav
iou
ral
attr
ibu
tes
of
the
con
stit
uen
t
arte
fact
san
dth
eir
(2)
beh
avio
ura
lin
terr
elat
ion
s
5.
Beh
avi
ou
ral
elem
ents
Beh
avio
ura
lat
trib
ute
sar
e‘‘
[…]
imp
lici
tat
trib
ute
sw
hic
hd
escr
ibe
the
char
acte
rist
ics
and
beh
avio
ur
of
the
arte
fact
sub
ject
edto
the
exte
rnal
effe
cts
L.
Th
eim
pli
cit
attr
ibu
tes
des
crib
eth
efu
nct
ion
alp
erfo
rman
ceo
fth
ear
tefa
ct,
incl
ud
ing
such
par
amet
ers
asst
ren
gth
and
du
rab
ilit
y.
Th
ete
rmis
use
dh
ere,
bec
ause
the
attr
ibu
tes
are
con
sid
ered
tob
eim
pli
cit
inth
ed
esig
no
fth
ear
tefa
ct.
Th
eym
ayb
ees
tim
ated
fro
mth
eex
pli
cit
attr
ibu
tes
and
the
exte
rnal
effe
cts.
Th
eym
ayal
so,
inso
me
circ
um
stan
ces,
be
reg
ard
edas
rela
tio
nsh
ips
bet
wee
nth
eex
pli
cit
attr
ibu
tes
and
the
exte
rnal
effe
cts’
’(M
cMah
on
19
94
,p
.1
98
)
Ab
ehav
iou
ral
attr
ibu
teca
nen
com
pas
sa
gro
up
of
ph
ysi
cal
pro
per
ties
,d
epen
den
to
nth
ety
pe
of
pro
du
ctan
dle
vel
of
det
ail.
As
beh
avio
urs
are
the
mec
han
ism
sb
y
wh
ich
fun
ctio
ns
are
ach
iev
ed,th
ese
attr
ibu
tety
pes
enab
leb
oth
the
fun
ctio
ns
and
the
flo
ws
bet
wee
nth
em.T
her
efo
re,th
eyar
ecl
ose
lyre
late
dto
the
typ
eso
ffl
ow
s
bet
wee
nfu
nct
ion
sas
defi
ned
by
Hir
tzet
al.
(20
02
)an
dS
ton
ean
dW
oo
d(2
00
0)
Beh
avio
ura
lel
emen
tre
fers
toa
beh
avio
ura
lat
trib
ute
of
asp
ecifi
cco
nst
itu
ent
arte
fact
,e.
g.
ther
mal
beh
avio
ur
of
the
casi
ng
6.
Beh
avi
ou
ral
lin
ks
Beh
avio
ura
lin
terr
elat
ion
sm
igh
tex
ist
bet
wee
nb
ehav
iou
ral
elem
ents
of
the
sam
eat
trib
ute
(e.g
.th
erm
alb
ehav
iou
ro
fco
mp
on
ent
1an
dth
erm
alb
ehav
iou
ro
f
com
po
nen
t2
)ac
ross
con
stit
uen
tar
tefa
cts
of
ap
rod
uct
du
eto
the
pro
du
ctb
ehav
iou
ral
req
uir
emen
tso
rp
rox
imit
yo
fth
eel
emen
ts.
Fo
rex
amp
le,
the
pro
du
ct
stre
ng
thd
epen
ds
on
the
stre
ng
tho
fit
sco
mp
on
ents
or
the
ther
mal
beh
avio
ur
of
aw
ire
and
its
coat
ing
dep
end
on
each
oth
er.
Idea
lly
,th
ere
are
no
beh
avio
ura
l
lin
ks
bet
wee
nb
ehav
iou
ral
elem
ents
of
dif
fere
nt
attr
ibu
tes
(e.g
.n
oli
nk
bet
wee
nth
erm
alb
ehav
iou
ran
dm
ech
anic
alb
ehav
iou
r).
Ho
wev
er,
this
isu
sual
lyn
ot
the
case
for
such
beh
avio
urs
asth
erm
alan
del
ectr
ical
Exa
mp
les
for
the
die
sel
eng
ine
(Sec
t.4
):
(Hig
hle
vel
)b
ehav
iou
ral
attr
ibu
tes:
mec
han
ical
(str
eng
th,
iner
tia,
elas
tici
ty,
etc.
),el
ectr
ical
(co
nd
uct
ion
,re
sist
ance
,ch
arg
ing
,et
c.),
ther
mal
(co
nd
uct
ion
,
tem
per
atu
rech
ang
e,ab
sorp
tio
n,
resi
stan
ce,
etc.
)
Beh
avio
ura
lel
emen
ts:
mec
han
ical
beh
avio
ur
of
the
val
ve
trai
n
Beh
avio
ura
lli
nk
s:m
ech
anic
alb
ehav
iou
ro
fth
ev
alv
etr
ain
isli
nk
edto
mec
han
ical
beh
avio
ur
of
the
cyli
nd
erh
ead
asse
mb
lyan
dp
ush
rod
s
Beh
avio
ur–
stru
ctu
re(s
tate
)
lin
ks
Key
dis
tin
ctio
nca
usa
l,o
bje
ctiv
e(b
yp
hy
sica
lla
ws)
,m
any
-to
-man
yre
lati
on
7.
Ca
usa
lity
of
lin
ksb
eha
vio
ur–
stru
ctu
reli
nks
Beh
avio
ura
lat
trib
ute
s(i
.e.
imp
lici
tat
trib
ute
s)ar
ere
alis
edb
yst
ruct
ura
lat
trib
ute
s(i
.e.
exp
lici
tat
trib
ute
s)an
dd
eriv
able
by
mea
ns
of
ap
hysi
cal
theo
ryfr
om
the
stru
ctu
reo
fth
ear
tefa
ctan
dp
oss
ibly
som
ep
rop
erti
eso
fth
een
vir
on
men
tal
con
dit
ion
s(a
dap
ted
fro
mG
ero
(19
90
)an
dM
cMah
on
(19
94))
.T
hu
s,th
eli
nk
sfr
om
the
stru
ctu
ral
lay
erto
the
beh
avio
ura
lla
yer
are
cau
sal
and
ob
ject
ive
8.
(n:m
)-C
ard
ina
lity
of
beh
avi
ou
r–st
ruct
ure
lin
ks
Th
ere
lati
on
bet
wee
nb
ehav
iou
ral
and
stru
ctu
ral
elem
ents
iso
fty
pe
n:m
(i.e
.m
any
-to
-man
y).
Th
us,
wit
hin
aco
mp
on
ent,
ab
ehav
iou
ral
elem
ent
may
dep
end
on
on
eo
rm
any
stru
ctu
ral
elem
ents
of
dif
fere
nt
stru
ctu
ral
attr
ibu
tes,
and
ast
ruct
ura
lel
emen
tm
ayin
flu
ence
on
eo
rm
any
beh
avio
ura
lel
emen
tso
fd
iffe
ren
t
beh
avio
ura
lat
trib
ute
s
Exa
mp
les
for
the
die
sel
eng
ine
(Sec
t.4
):
Mec
han
ical
beh
avio
ur
of
the
val
ve
trai
nis
lin
ked
toit
sg
eom
etry
,m
ater
ial,
and
surf
ace
attr
ibu
tes.
Geo
met
ryat
trib
ute
of
the
val
ve
trai
nis
lin
ked
toit
sm
ech
anic
alan
dth
erm
alb
ehav
iou
rs
Res Eng Design
123

Ta
ble
2co
nti
nu
ed
On
tolo
gy
FB
SL
ink
age
mo
del
Str
uct
ure
Key
dis
tin
ctio
nco
nst
itu
ent
arte
fact
s,ex
pli
cit
attr
ibu
tes,
and
rela
tio
ns
Defi
nit
ion
Str
uct
ure
des
crib
esw
hat
the
pro
du
ctco
nsi
sto
f.It
spec
ifies
wh
at(1
)co
nst
itu
ent
arte
fact
sth
ed
esig
nis
com
po
sed
of,
wh
at(2
)th
est
ruct
ura
lat
trib
ute
so
fth
ese
arte
fact
sar
e,an
dh
ow
they
are
(3)
stru
ctu
rall
yre
late
d(a
dap
ted
fro
mQ
ian
and
Ger
o(1
99
6))
9.
Str
uct
ura
lel
emen
ts
Str
uct
ura
lat
trib
ute
sar
e‘‘
[…]
exp
lici
tat
trib
ute
sd
escr
ibin
gth
ed
esig
n,
such
asit
sd
imen
sio
nal
par
amet
ers,
the
val
ues
of
the
pro
per
ties
of
the
mat
eria
lsfr
om
wh
ich
the
arte
fact
isco
nst
ruct
ed,
etc.
Th
eyar
ete
rmed
exp
lici
tat
trib
ute
sh
ere,
bec
ause
they
mu
stb
eex
pli
citl
yd
efin
edfo
rth
ear
tefa
ctto
be
mad
e’’
(McM
aho
n1
99
4,
p.
19
8).
Str
uct
ura
lat
trib
ute
sar
eg
rou
ped
into
geo
met
ry(d
imen
sio
ns,
shap
ed
escr
ipti
on
s),
mat
eria
l(t
yp
e,v
olu
me,
den
sity
,an
do
ther
exp
lici
tp
rop
erti
eso
f
mat
eria
l),
surf
ace
(su
rfac
efi
nis
h,
tex
ture
,an
dm
icro
dim
ensi
on
so
fsu
rfac
e),
colo
ur
(ty
pe,
ton
e,in
ten
sity
,an
dre
flec
tan
ce),
con
tro
ller
(co
des
,m
icro
chip
s,re
lay
s).
Str
uct
ura
lel
emen
tre
fers
toa
spec
ific
stru
ctu
ral
attr
ibu
teo
fa
spec
ific
con
stit
uen
tar
tefa
ct,
e.g
.th
em
ater
ial
of
the
casi
ng
10
.S
tru
ctu
ral
lin
ks
Str
uct
ura
lin
terr
elat
ion
sm
igh
tex
ist
bet
wee
nst
ruct
ura
lel
emen
tso
fth
esa
me
attr
ibu
te(e
.g.
mat
eria
lo
fco
mp
on
ent
1an
dm
ater
ial
of
com
po
nen
t2
)ac
ross
con
stit
uen
tar
tefa
cts
of
ap
rod
uct
du
eto
the
pro
du
ctst
ruct
ura
lre
qu
irem
ents
.F
or
exam
ple
,th
eg
eom
etry
req
uir
emen
to
fth
ep
rod
uct
inte
rlin
ks
the
geo
met
ries
of
its
con
stit
uen
tar
tefa
cts.
Idea
lly
,th
ere
are
no
stru
ctu
ral
lin
ks
bet
wee
nst
ruct
ura
lel
emen
tso
fd
iffe
ren
tat
trib
ute
s(e
.g.
no
lin
kb
etw
een
mat
eria
lan
dg
eom
etry
)
11
.C
on
stit
uen
ta
rtef
act
s/p
rod
uct
dec
om
po
siti
on
Ap
rod
uct
can
be
dec
om
po
sed
into
its
con
stit
uen
tar
tefa
cts
atd
iffe
ren
tle
vel
so
fd
etai
l.C
on
stit
uen
tar
tefa
cts
may
refe
rto
syst
ems,
asse
mb
lies
,co
mp
on
ents
,o
r
par
ts,
dep
end
ent
on
the
sele
cted
lev
elo
fd
etai
l
Exa
mp
les
for
the
die
sel
eng
ine
(Sec
t.4
):
Co
nst
itu
ent
arte
fact
s(h
ere
com
po
nen
ts):
cyli
nd
erh
ead
asse
mb
ly,
cyli
nd
erb
lock
asse
mb
ly,
val
ve
trai
n,
etc.
Str
uct
ura
lat
trib
ute
s:g
eom
etry
,m
ater
ial,
surf
ace,
con
tro
ller
Str
uct
ura
lel
emen
ts:
geo
met
ryo
fth
ev
alv
etr
ain
,m
ater
ial
of
the
val
ve
trai
n,
etc.
Str
uct
ura
lli
nk
s:g
eom
etry
of
the
val
ve
trai
nis
lin
ked
tog
eom
etry
of
the
geo
met
ries
of
the
cyli
nd
erh
ead
asse
mb
ly,
cyli
nd
erb
lock
asse
mb
ly,
etc.
Res Eng Design
123
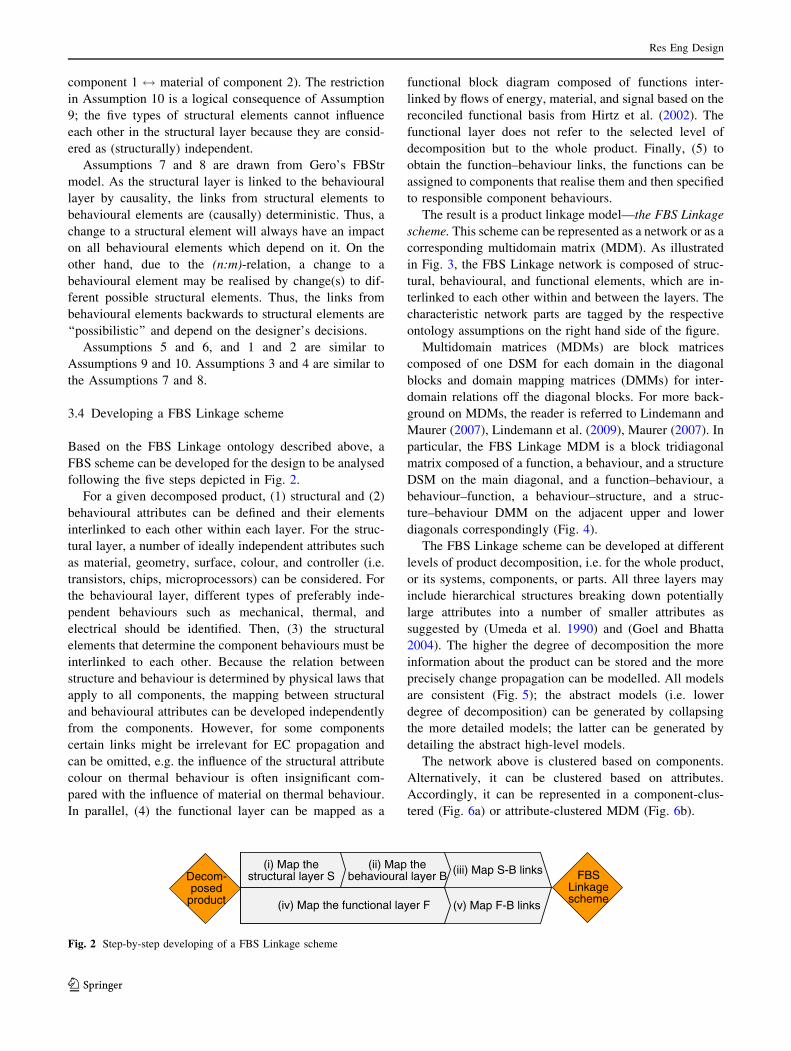
component 1 $ material of component 2). The restriction
in Assumption 10 is a logical consequence of Assumption
9; the five types of structural elements cannot influence
each other in the structural layer because they are consid-
ered as (structurally) independent.
Assumptions 7 and 8 are drawn from Gero’s FBStr
model. As the structural layer is linked to the behavioural
layer by causality, the links from structural elements to
behavioural elements are (causally) deterministic. Thus, a
change to a structural element will always have an impact
on all behavioural elements which depend on it. On the
other hand, due to the (n:m)-relation, a change to a
behavioural element may be realised by change(s) to dif-
ferent possible structural elements. Thus, the links from
behavioural elements backwards to structural elements are
‘‘possibilistic’’ and depend on the designer’s decisions.
Assumptions 5 and 6, and 1 and 2 are similar to
Assumptions 9 and 10. Assumptions 3 and 4 are similar to
the Assumptions 7 and 8.
3.4 Developing a FBS Linkage scheme
Based on the FBS Linkage ontology described above, a
FBS scheme can be developed for the design to be analysed
following the five steps depicted in Fig. 2.
For a given decomposed product, (1) structural and (2)
behavioural attributes can be defined and their elements
interlinked to each other within each layer. For the struc-
tural layer, a number of ideally independent attributes such
as material, geometry, surface, colour, and controller (i.e.
transistors, chips, microprocessors) can be considered. For
the behavioural layer, different types of preferably inde-
pendent behaviours such as mechanical, thermal, and
electrical should be identified. Then, (3) the structural
elements that determine the component behaviours must be
interlinked to each other. Because the relation between
structure and behaviour is determined by physical laws that
apply to all components, the mapping between structural
and behavioural attributes can be developed independently
from the components. However, for some components
certain links might be irrelevant for EC propagation and
can be omitted, e.g. the influence of the structural attribute
colour on thermal behaviour is often insignificant com-
pared with the influence of material on thermal behaviour.
In parallel, (4) the functional layer can be mapped as a
functional block diagram composed of functions inter-
linked by flows of energy, material, and signal based on the
reconciled functional basis from Hirtz et al. (2002). The
functional layer does not refer to the selected level of
decomposition but to the whole product. Finally, (5) to
obtain the function–behaviour links, the functions can be
assigned to components that realise them and then specified
to responsible component behaviours.
The result is a product linkage model—the FBS Linkage
scheme. This scheme can be represented as a network or as a
corresponding multidomain matrix (MDM). As illustrated
in Fig. 3, the FBS Linkage network is composed of struc-
tural, behavioural, and functional elements, which are in-
terlinked to each other within and between the layers. The
characteristic network parts are tagged by the respective
ontology assumptions on the right hand side of the figure.
Multidomain matrices (MDMs) are block matrices
composed of one DSM for each domain in the diagonal
blocks and domain mapping matrices (DMMs) for inter-
domain relations off the diagonal blocks. For more back-
ground on MDMs, the reader is referred to Lindemann and
Maurer (2007), Lindemann et al. (2009), Maurer (2007). In
particular, the FBS Linkage MDM is a block tridiagonal
matrix composed of a function, a behaviour, and a structure
DSM on the main diagonal, and a function–behaviour, a
behaviour–function, a behaviour–structure, and a struc-
ture–behaviour DMM on the adjacent upper and lower
diagonals correspondingly (Fig. 4).
The FBS Linkage scheme can be developed at different
levels of product decomposition, i.e. for the whole product,
or its systems, components, or parts. All three layers may
include hierarchical structures breaking down potentially
large attributes into a number of smaller attributes as
suggested by (Umeda et al. 1990) and (Goel and Bhatta
2004). The higher the degree of decomposition the more
information about the product can be stored and the more
precisely change propagation can be modelled. All models
are consistent (Fig. 5); the abstract models (i.e. lower
degree of decomposition) can be generated by collapsing
the more detailed models; the latter can be generated by
detailing the abstract high-level models.
The network above is clustered based on components.
Alternatively, it can be clustered based on attributes.
Accordingly, it can be represented in a component-clus-
tered (Fig. 6a) or attribute-clustered MDM (Fig. 6b).
(iv) Map the functional layer F
(ii) Map the behavioural layer B
(i) Map the structural layer S Decom-
posed product
(iii) Map S-B links
(v) Map F-B links
FBS Linkage scheme
Fig. 2 Step-by-step developing of a FBS Linkage scheme
Res Eng Design
123
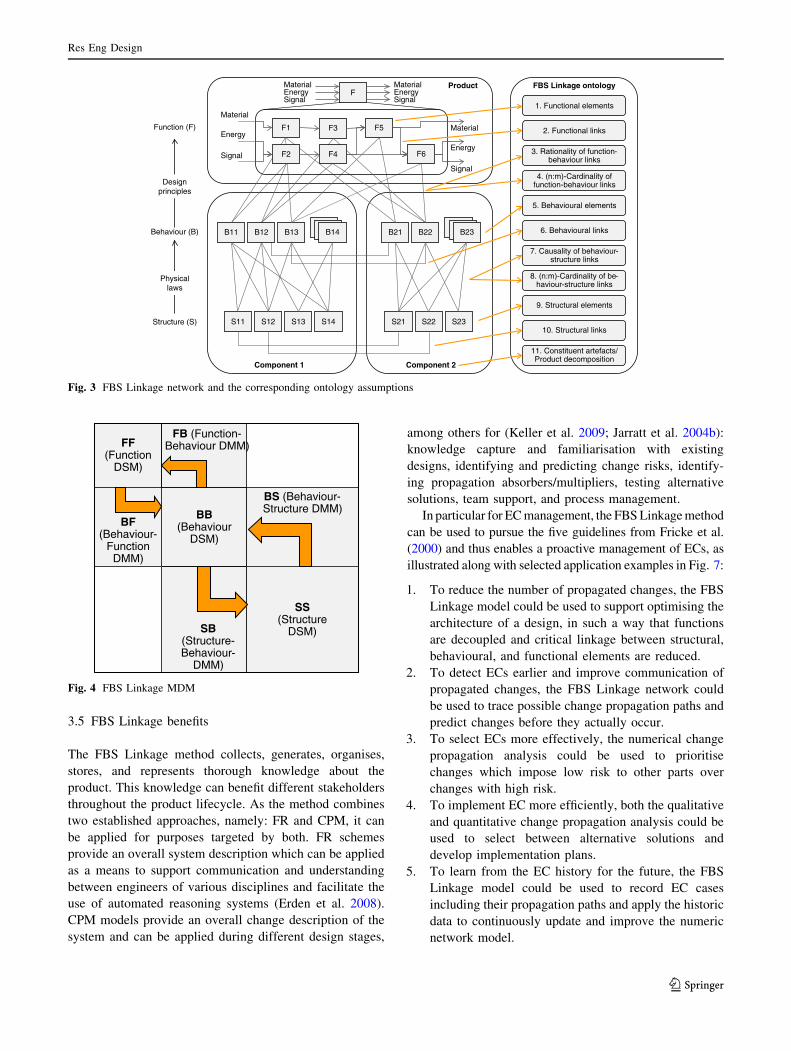
3.5 FBS Linkage benefits
The FBS Linkage method collects, generates, organises,
stores, and represents thorough knowledge about the
product. This knowledge can benefit different stakeholders
throughout the product lifecycle. As the method combines
two established approaches, namely: FR and CPM, it can
be applied for purposes targeted by both. FR schemes
provide an overall system description which can be applied
as a means to support communication and understanding
between engineers of various disciplines and facilitate the
use of automated reasoning systems (Erden et al. 2008).
CPM models provide an overall change description of the
system and can be applied during different design stages,
among others for (Keller et al. 2009; Jarratt et al. 2004b):
knowledge capture and familiarisation with existing
designs, identifying and predicting change risks, identify-
ing propagation absorbers/multipliers, testing alternative
solutions, team support, and process management.
In particular for EC management, the FBS Linkage method
can be used to pursue the five guidelines from Fricke et al.
(2000) and thus enables a proactive management of ECs, as
illustrated along with selected application examples in Fig. 7:
1. To reduce the number of propagated changes, the FBS
Linkage model could be used to support optimising the
architecture of a design, in such a way that functions
are decoupled and critical linkage between structural,
behavioural, and functional elements are reduced.
2. To detect ECs earlier and improve communication of
propagated changes, the FBS Linkage network could
be used to trace possible change propagation paths and
predict changes before they actually occur.
3. To select ECs more effectively, the numerical change
propagation analysis could be used to prioritise
changes which impose low risk to other parts over
changes with high risk.
4. To implement EC more efficiently, both the qualitative
and quantitative change propagation analysis could be
used to select between alternative solutions and
develop implementation plans.
5. To learn from the EC history for the future, the FBS
Linkage model could be used to record EC cases
including their propagation paths and apply the historic
data to continuously update and improve the numeric
network model.
Designprinciples
Function (F)
Behaviour (B)
Structure (S)
F
F1
B13B11
S12 S13 S14S11
B14
Physicallaws
B22B21 B23
S22 S23S21
Component 1 Component 2
F6
F5
F2
Product
F3
MaterialEnergySignal
MaterialEnergySignal
F4
B12
11. Constituent artefacts/ Product decomposition
FBS Linkage ontology
10. Structural links
9. Structural elements
8. (n:m)-Cardinality of be-haviour-structure links
7. Causality of behaviour-structure links
6. Behavioural links
5. Behavioural elements
4. (n:m)-Cardinality of function-behaviour links
3. Rationality of function-behaviour links
1. Functional elements
2. Functional links
Material
Energy
Signal
Material
Energy
Signal
Fig. 3 FBS Linkage network and the corresponding ontology assumptions
BB(Behaviour
DSM)
SS(Structure
DSM)
BS (Behaviour-Structure DMM)
SB(Structure-Behaviour-
DMM)
FF(Function
DSM)
FB (Function-Behaviour DMM)
BF (Behaviour-
Function DMM)
Fig. 4 FBS Linkage MDM
Res Eng Design
123
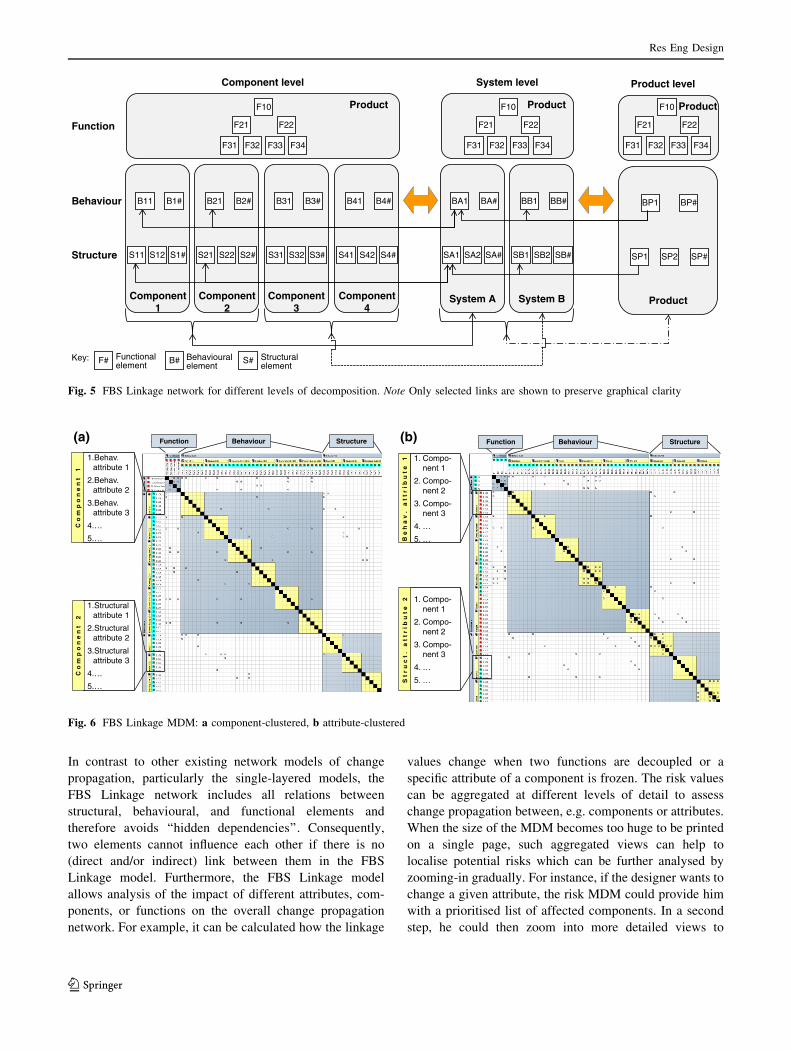
In contrast to other existing network models of change
propagation, particularly the single-layered models, the
FBS Linkage network includes all relations between
structural, behavioural, and functional elements and
therefore avoids ‘‘hidden dependencies’’. Consequently,
two elements cannot influence each other if there is no
(direct and/or indirect) link between them in the FBS
Linkage model. Furthermore, the FBS Linkage model
allows analysis of the impact of different attributes, com-
ponents, or functions on the overall change propagation
network. For example, it can be calculated how the linkage
values change when two functions are decoupled or a
specific attribute of a component is frozen. The risk values
can be aggregated at different levels of detail to assess
change propagation between, e.g. components or attributes.
When the size of the MDM becomes too huge to be printed
on a single page, such aggregated views can help to
localise potential risks which can be further analysed by
zooming-in gradually. For instance, if the designer wants to
change a given attribute, the risk MDM could provide him
with a prioritised list of affected components. In a second
step, he could then zoom into more detailed views to
Function
Behaviour
Structure
Component 1
S12 S1#
B1#
Component 2
S22 S2#S21
B2#
Component 3
S32 S3#S31
B3#B31
Component 4
S42 S4#S41
B4#B41
F21 F22
F10
F32 F33 F34F31
Product
System A
BA#BA1
System B
BB#BB1
Product
Component level System level
Product
BP#BP1
Product
Product level
F#Key: Functional element
B# Behavioural element
S# Structural element
S11
B11 B21
F21 F22
F10
F32 F33 F34F31
F21 F22
F10
F32 F33 F34F31
SA1 SA2 SA# SB2 SB# SP2 SP#SP1SB1
Fig. 5 FBS Linkage network for different levels of decomposition. Note Only selected links are shown to preserve graphical clarity
Behaviour StructureFunction(b) 1. Compo-
nent 1
2. Compo-nent 2
3. Compo-nent 3
4. …
5. … Be
ha
v.
at
tr
ibu
te
1
1. Compo-nent 1
2. Compo-nent 2
3. Compo-nent 3
4. …
5. … St
ru
ct
. a
tt
rib
ut
e 21.Structural
attribute 1
2.Structural attribute 2
3.Structural attribute 3
4.…
5.…
Co
mp
on
en
t2
Behaviour Structure
1.Behav. attribute 1
2.Behav. attribute 2
3.Behav. attribute 3
4.…
5.…
Co
mp
on
en
t1
Function(a)
Fig. 6 FBS Linkage MDM: a component-clustered, b attribute-clustered
Res Eng Design
123
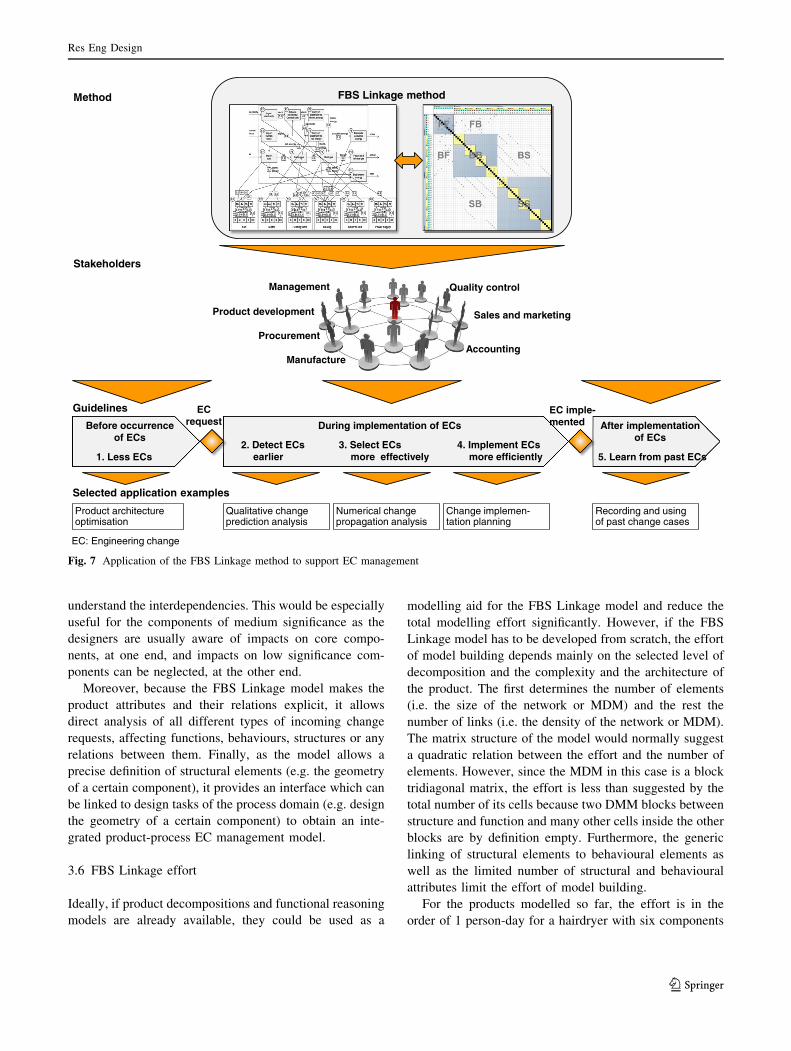
understand the interdependencies. This would be especially
useful for the components of medium significance as the
designers are usually aware of impacts on core compo-
nents, at one end, and impacts on low significance com-
ponents can be neglected, at the other end.
Moreover, because the FBS Linkage model makes the
product attributes and their relations explicit, it allows
direct analysis of all different types of incoming change
requests, affecting functions, behaviours, structures or any
relations between them. Finally, as the model allows a
precise definition of structural elements (e.g. the geometry
of a certain component), it provides an interface which can
be linked to design tasks of the process domain (e.g. design
the geometry of a certain component) to obtain an inte-
grated product-process EC management model.
3.6 FBS Linkage effort
Ideally, if product decompositions and functional reasoning
models are already available, they could be used as a
modelling aid for the FBS Linkage model and reduce the
total modelling effort significantly. However, if the FBS
Linkage model has to be developed from scratch, the effort
of model building depends mainly on the selected level of
decomposition and the complexity and the architecture of
the product. The first determines the number of elements
(i.e. the size of the network or MDM) and the rest the
number of links (i.e. the density of the network or MDM).
The matrix structure of the model would normally suggest
a quadratic relation between the effort and the number of
elements. However, since the MDM in this case is a block
tridiagonal matrix, the effort is less than suggested by the
total number of its cells because two DMM blocks between
structure and function and many other cells inside the other
blocks are by definition empty. Furthermore, the generic
linking of structural elements to behavioural elements as
well as the limited number of structural and behavioural
attributes limit the effort of model building.
For the products modelled so far, the effort is in the
order of 1 person-day for a hairdryer with six components
After implementationof ECs
During implementation of ECs
FBS Linkage method
Before occurrenceof ECs
ECrequest
EC imple-mented
1. Less ECs2. Detect ECs
earlier3. Select ECs
more effectively4. Implement ECs
more efficiently 5. Learn from past ECs
Management
Product development Sales and marketing
Manufacture
Quality control
AccountingProcurement
Guidelines
Stakeholders
Method
Product architecture optimisation
Qualitative change prediction analysis
Selected application examples
Numerical change propagation analysis
Change implemen-tation planning
Recording and using of past change cases
EC: Engineering change
Fig. 7 Application of the FBS Linkage method to support EC management
Res Eng Design
123
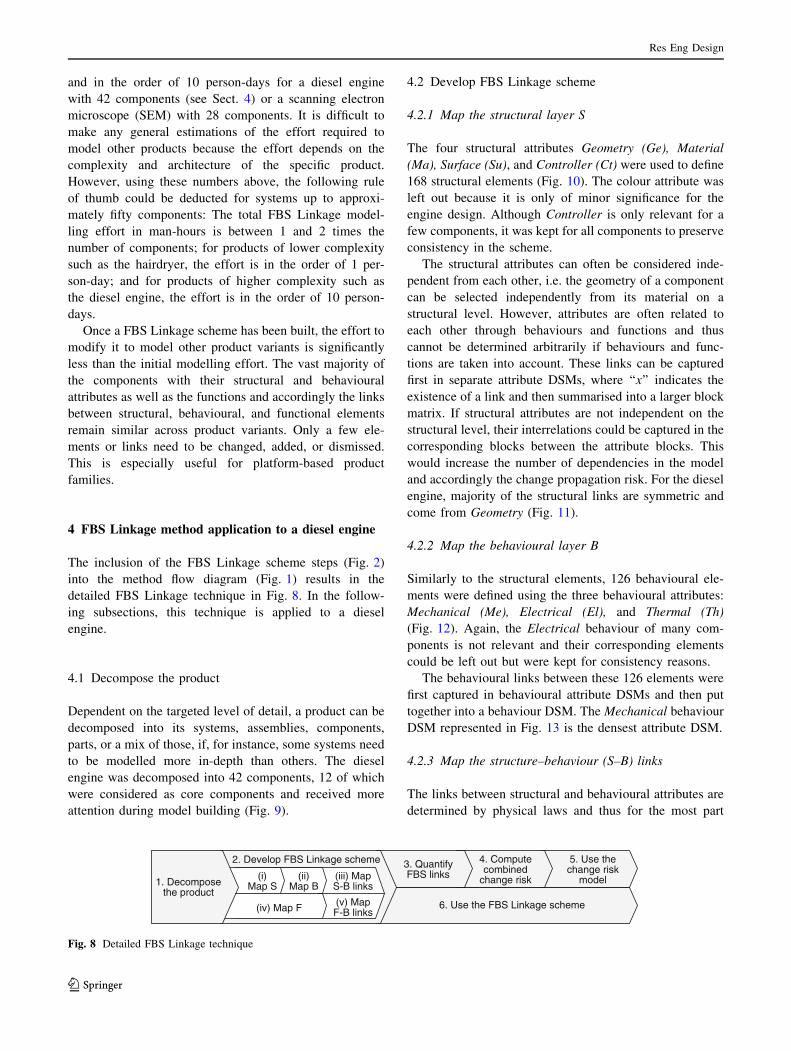
and in the order of 10 person-days for a diesel engine
with 42 components (see Sect. 4) or a scanning electron
microscope (SEM) with 28 components. It is difficult to
make any general estimations of the effort required to
model other products because the effort depends on the
complexity and architecture of the specific product.
However, using these numbers above, the following rule
of thumb could be deducted for systems up to approxi-
mately fifty components: The total FBS Linkage model-
ling effort in man-hours is between 1 and 2 times the
number of components; for products of lower complexity
such as the hairdryer, the effort is in the order of 1 per-
son-day; and for products of higher complexity such as
the diesel engine, the effort is in the order of 10 person-
days.
Once a FBS Linkage scheme has been built, the effort to
modify it to model other product variants is significantly
less than the initial modelling effort. The vast majority of
the components with their structural and behavioural
attributes as well as the functions and accordingly the links
between structural, behavioural, and functional elements
remain similar across product variants. Only a few ele-
ments or links need to be changed, added, or dismissed.
This is especially useful for platform-based product
families.
4 FBS Linkage method application to a diesel engine
The inclusion of the FBS Linkage scheme steps (Fig. 2)
into the method flow diagram (Fig. 1) results in the
detailed FBS Linkage technique in Fig. 8. In the follow-
ing subsections, this technique is applied to a diesel
engine.
4.1 Decompose the product
Dependent on the targeted level of detail, a product can be
decomposed into its systems, assemblies, components,
parts, or a mix of those, if, for instance, some systems need
to be modelled more in-depth than others. The diesel
engine was decomposed into 42 components, 12 of which
were considered as core components and received more
attention during model building (Fig. 9).
4.2 Develop FBS Linkage scheme
4.2.1 Map the structural layer S
The four structural attributes Geometry (Ge), Material
(Ma), Surface (Su), and Controller (Ct) were used to define
168 structural elements (Fig. 10). The colour attribute was
left out because it is only of minor significance for the
engine design. Although Controller is only relevant for a
few components, it was kept for all components to preserve
consistency in the scheme.
The structural attributes can often be considered inde-
pendent from each other, i.e. the geometry of a component
can be selected independently from its material on a
structural level. However, attributes are often related to
each other through behaviours and functions and thus
cannot be determined arbitrarily if behaviours and func-
tions are taken into account. These links can be captured
first in separate attribute DSMs, where ‘‘x’’ indicates the
existence of a link and then summarised into a larger block
matrix. If structural attributes are not independent on the
structural level, their interrelations could be captured in the
corresponding blocks between the attribute blocks. This
would increase the number of dependencies in the model
and accordingly the change propagation risk. For the diesel
engine, majority of the structural links are symmetric and
come from Geometry (Fig. 11).
4.2.2 Map the behavioural layer B
Similarly to the structural elements, 126 behavioural ele-
ments were defined using the three behavioural attributes:
Mechanical (Me), Electrical (El), and Thermal (Th)
(Fig. 12). Again, the Electrical behaviour of many com-
ponents is not relevant and their corresponding elements
could be left out but were kept for consistency reasons.
The behavioural links between these 126 elements were
first captured in behavioural attribute DSMs and then put
together into a behaviour DSM. The Mechanical behaviour
DSM represented in Fig. 13 is the densest attribute DSM.
4.2.3 Map the structure–behaviour (S–B) links
The links between structural and behavioural attributes are
determined by physical laws and thus for the most part
6. Use the FBS Linkage scheme
5. Use the change risk
model
3. Quantify FBS links
4. Compute combined
change risk
(iv) Map F
(i) Map S
(iii) Map S-B links
(v) Map F-B links
(ii) Map B 1. Decompose
the product
2. Develop FBS Linkage scheme
Fig. 8 Detailed FBS Linkage technique
Res Eng Design
123
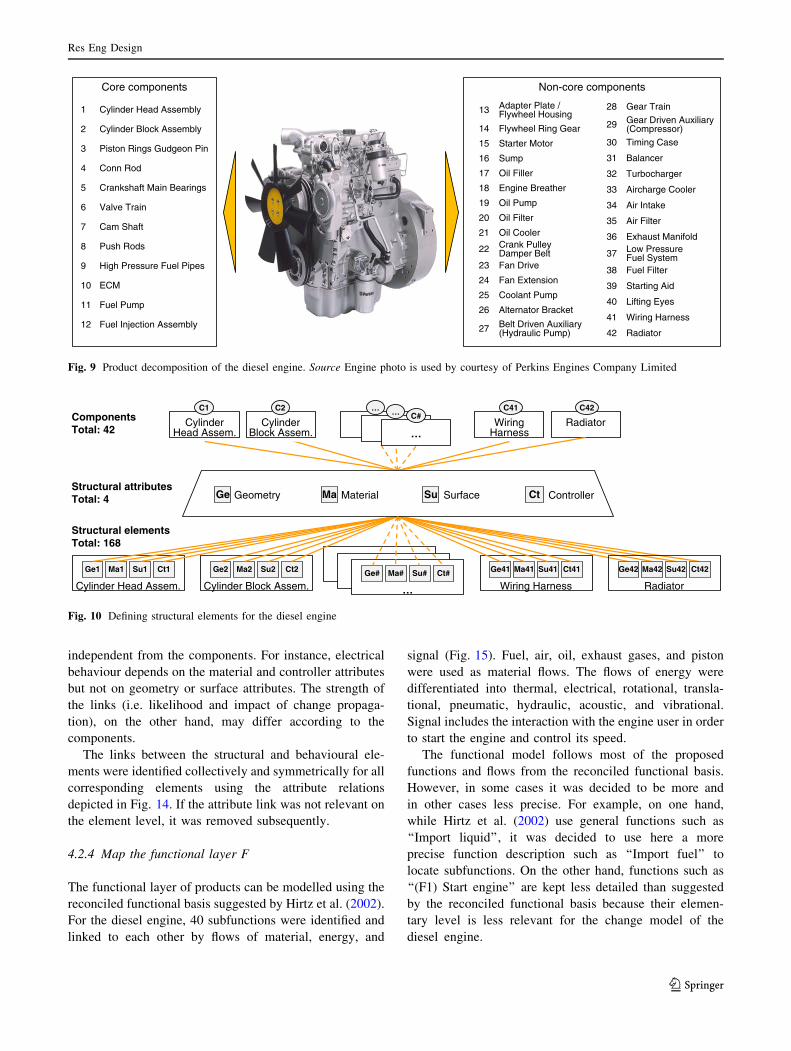
independent from the components. For instance, electrical
behaviour depends on the material and controller attributes
but not on geometry or surface attributes. The strength of
the links (i.e. likelihood and impact of change propaga-
tion), on the other hand, may differ according to the
components.
The links between the structural and behavioural ele-
ments were identified collectively and symmetrically for all
corresponding elements using the attribute relations
depicted in Fig. 14. If the attribute link was not relevant on
the element level, it was removed subsequently.
4.2.4 Map the functional layer F
The functional layer of products can be modelled using the
reconciled functional basis suggested by Hirtz et al. (2002).
For the diesel engine, 40 subfunctions were identified and
linked to each other by flows of material, energy, and
signal (Fig. 15). Fuel, air, oil, exhaust gases, and piston
were used as material flows. The flows of energy were
differentiated into thermal, electrical, rotational, transla-
tional, pneumatic, hydraulic, acoustic, and vibrational.
Signal includes the interaction with the engine user in order
to start the engine and control its speed.
The functional model follows most of the proposed
functions and flows from the reconciled functional basis.
However, in some cases it was decided to be more and
in other cases less precise. For example, on one hand,
while Hirtz et al. (2002) use general functions such as
‘‘Import liquid’’, it was decided to use here a more
precise function description such as ‘‘Import fuel’’ to
locate subfunctions. On the other hand, functions such as
‘‘(F1) Start engine’’ are kept less detailed than suggested
by the reconciled functional basis because their elemen-
tary level is less relevant for the change model of the
diesel engine.
Core components
1 Cylinder Head Assembly
2 Cylinder Block Assembly
3 Piston Rings Gudgeon Pin
4 Conn Rod
5 Crankshaft Main Bearings
6 Valve Train
7 Cam Shaft
8 Push Rods
9 High Pressure Fuel Pipes
10 ECM
11 Fuel Pump
12 Fuel Injection Assembly
13 Adapter Plate /Flywheel Housing
14 Flywheel Ring Gear
15 Starter Motor
16 Sump
17 Oil Filler
18 Engine Breather
19 Oil Pump
20 Oil Filter
21 Oil Cooler
22 Crank PulleyDamper Belt
23 Fan Drive
24 Fan Extension
25 Coolant Pump
26 Alternator Bracket
27 Belt Driven Auxiliary (Hydraulic Pump)
Non-core components
28 Gear Train
29 Gear Driven Auxiliary (Compressor)
30 Timing Case
31 Balancer
32 Turbocharger
33 Aircharge Cooler
34 Air Intake
35 Air Filter
36 Exhaust Manifold
37 Low PressureFuel System
38 Fuel Filter
39 Starting Aid
40 Lifting Eyes
41 Wiring Harness
42 Radiator
Fig. 9 Product decomposition of the diesel engine. Source Engine photo is used by courtesy of Perkins Engines Company Limited
… Wiring Harness
Radiator
Ge1 Ma1 Su1 Ct1
Cylinder Head Assem.
Ge2 Ma2 Su2 Ct2
Cylinder Block Assem.
Ge41 Ma41 Su41 Ct41
Wiring Harness
Cylinder Head Assem.
C1 C41 C42Components Total: 42
Structural attributes Total: 4
Structural elements Total: 168
Ge Geometry Ma Material Su Surface Ct Controller
Cylinder Block Assem.
C2
… … …
C#… …
Ge42 Ma42 Su42 Ct42
Radiator Ge# Ma# Su# Ct#
…
Fig. 10 Defining structural elements for the diesel engine
Res Eng Design
123
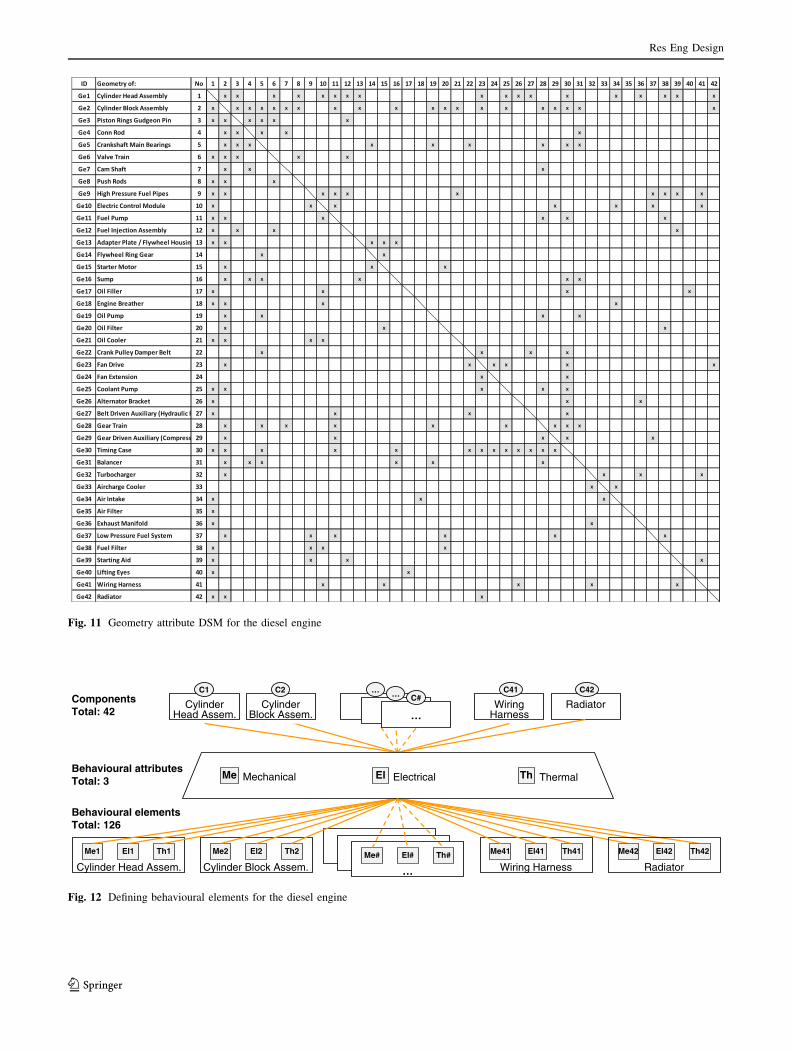
Fig. 11 Geometry attribute DSM for the diesel engine
… Wiring Harness
Radiator
Me1 El1 Th1
Cylinder Head Assem.
Me2 El2 Th2
Cylinder Block Assem.
Me41 El41 Th41
Wiring Harness
Cylinder Head Assem.
C1 C41 C42Components Total: 42
Behavioural attributes Total: 3
Behavioural elements Total: 126
Me Mechanical El Electrical Th Thermal
Cylinder Block Assem.
C2
… … …
C#… …
Me42 El42 Th42
Radiator Me# El# Th#
…
Fig. 12 Defining behavioural elements for the diesel engine
Res Eng Design
123
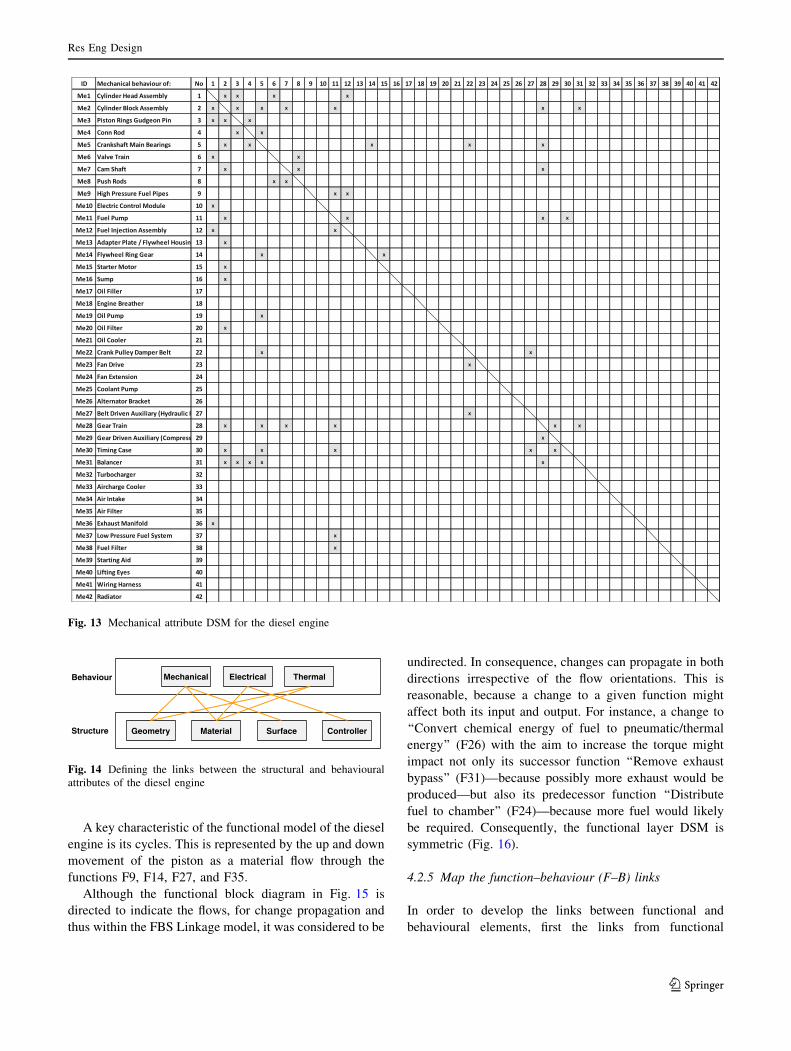
A key characteristic of the functional model of the diesel
engine is its cycles. This is represented by the up and down
movement of the piston as a material flow through the
functions F9, F14, F27, and F35.
Although the functional block diagram in Fig. 15 is
directed to indicate the flows, for change propagation and
thus within the FBS Linkage model, it was considered to be
undirected. In consequence, changes can propagate in both
directions irrespective of the flow orientations. This is
reasonable, because a change to a given function might
affect both its input and output. For instance, a change to
‘‘Convert chemical energy of fuel to pneumatic/thermal
energy’’ (F26) with the aim to increase the torque might
impact not only its successor function ‘‘Remove exhaust
bypass’’ (F31)—because possibly more exhaust would be
produced—but also its predecessor function ‘‘Distribute
fuel to chamber’’ (F24)—because more fuel would likely
be required. Consequently, the functional layer DSM is
symmetric (Fig. 16).
4.2.5 Map the function–behaviour (F–B) links
In order to develop the links between functional and
behavioural elements, first the links from functional
Fig. 13 Mechanical attribute DSM for the diesel engine
Geometry Material Surface Controller
Mechanical Electrical Thermal
Structure
Behaviour
Fig. 14 Defining the links between the structural and behavioural
attributes of the diesel engine
Res Eng Design
123
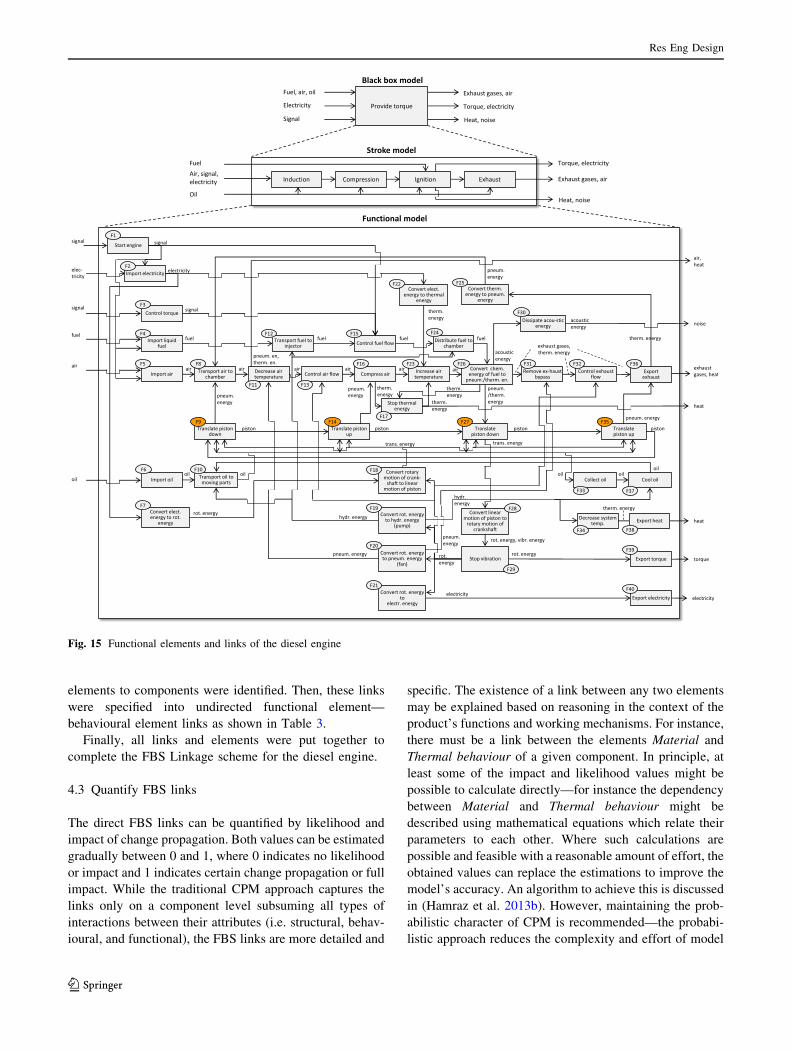
elements to components were identified. Then, these links
were specified into undirected functional element—
behavioural element links as shown in Table 3.
Finally, all links and elements were put together to
complete the FBS Linkage scheme for the diesel engine.
4.3 Quantify FBS links
The direct FBS links can be quantified by likelihood and
impact of change propagation. Both values can be estimated
gradually between 0 and 1, where 0 indicates no likelihood
or impact and 1 indicates certain change propagation or full
impact. While the traditional CPM approach captures the
links only on a component level subsuming all types of
interactions between their attributes (i.e. structural, behav-
ioural, and functional), the FBS links are more detailed and
specific. The existence of a link between any two elements
may be explained based on reasoning in the context of the
product’s functions and working mechanisms. For instance,
there must be a link between the elements Material and
Thermal behaviour of a given component. In principle, at
least some of the impact and likelihood values might be
possible to calculate directly—for instance the dependency
between Material and Thermal behaviour might be
described using mathematical equations which relate their
parameters to each other. Where such calculations are
possible and feasible with a reasonable amount of effort, the
obtained values can replace the estimations to improve the
model’s accuracy. An algorithm to achieve this is discussed
in (Hamraz et al. 2013b). However, maintaining the prob-
abilistic character of CPM is recommended—the probabi-
listic approach reduces the complexity and effort of model
Fig. 15 Functional elements and links of the diesel engine
Res Eng Design
123
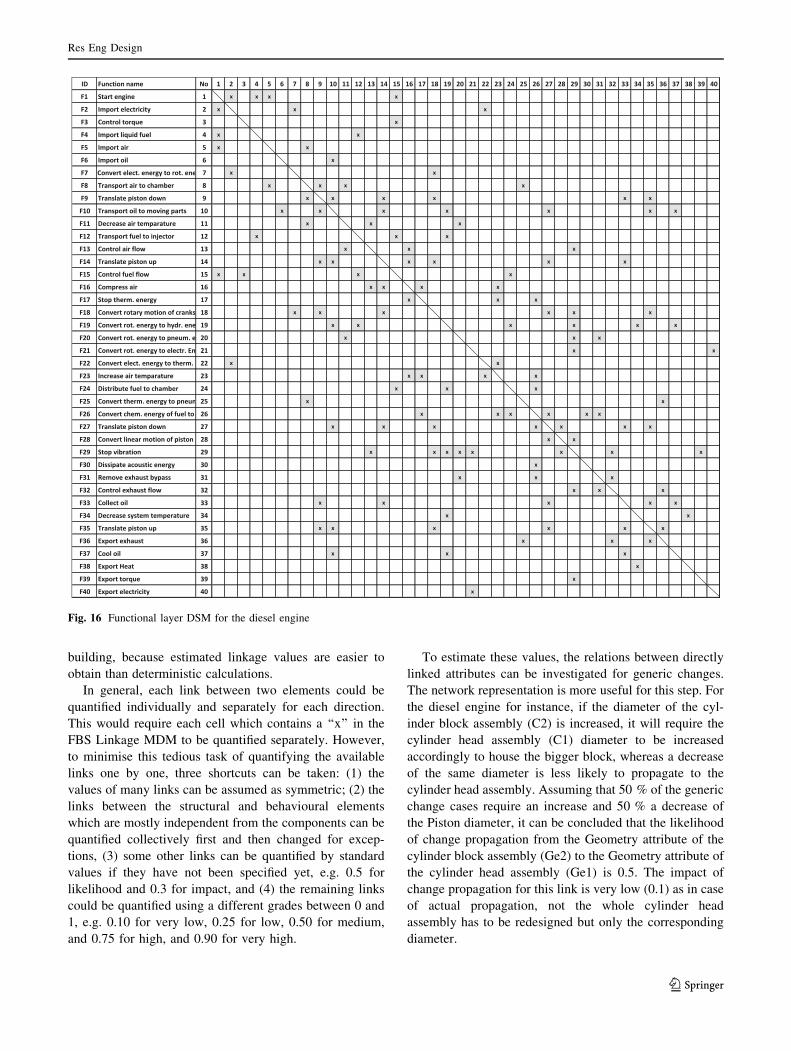
building, because estimated linkage values are easier to
obtain than deterministic calculations.
In general, each link between two elements could be
quantified individually and separately for each direction.
This would require each cell which contains a ‘‘x’’ in the
FBS Linkage MDM to be quantified separately. However,
to minimise this tedious task of quantifying the available
links one by one, three shortcuts can be taken: (1) the
values of many links can be assumed as symmetric; (2) the
links between the structural and behavioural elements
which are mostly independent from the components can be
quantified collectively first and then changed for excep-
tions, (3) some other links can be quantified by standard
values if they have not been specified yet, e.g. 0.5 for
likelihood and 0.3 for impact, and (4) the remaining links
could be quantified using a different grades between 0 and
1, e.g. 0.10 for very low, 0.25 for low, 0.50 for medium,
and 0.75 for high, and 0.90 for very high.
To estimate these values, the relations between directly
linked attributes can be investigated for generic changes.
The network representation is more useful for this step. For
the diesel engine for instance, if the diameter of the cyl-
inder block assembly (C2) is increased, it will require the
cylinder head assembly (C1) diameter to be increased
accordingly to house the bigger block, whereas a decrease
of the same diameter is less likely to propagate to the
cylinder head assembly. Assuming that 50 % of the generic
change cases require an increase and 50 % a decrease of
the Piston diameter, it can be concluded that the likelihood
of change propagation from the Geometry attribute of the
cylinder block assembly (Ge2) to the Geometry attribute of
the cylinder head assembly (Ge1) is 0.5. The impact of
change propagation for this link is very low (0.1) as in case
of actual propagation, not the whole cylinder head
assembly has to be redesigned but only the corresponding
diameter.
Fig. 16 Functional layer DSM for the diesel engine
Res Eng Design
123
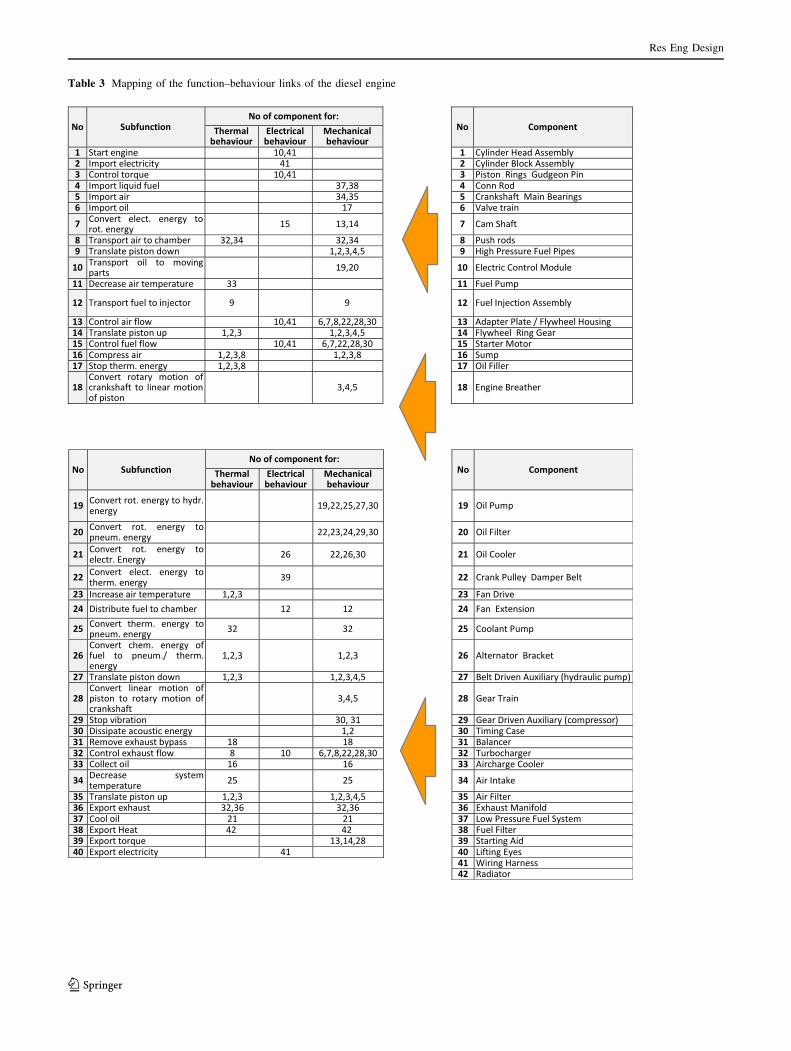
Table 3 Mapping of the function–behaviour links of the diesel engine
Res Eng Design
123
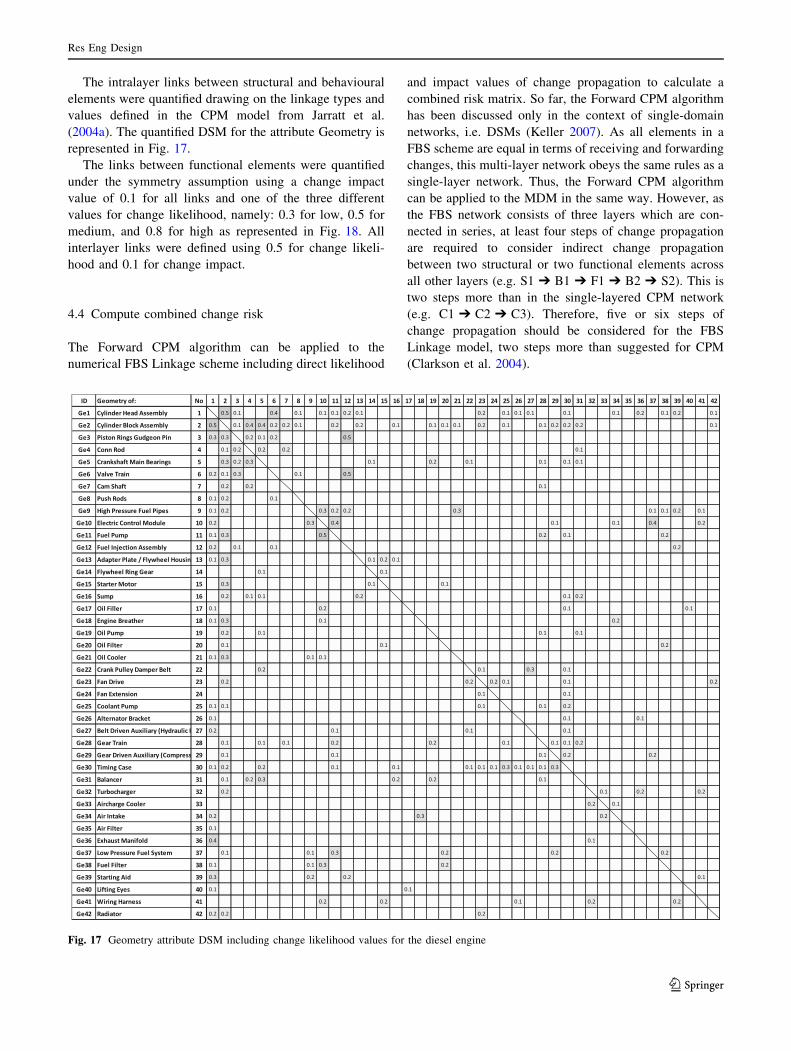
The intralayer links between structural and behavioural
elements were quantified drawing on the linkage types and
values defined in the CPM model from Jarratt et al.
(2004a). The quantified DSM for the attribute Geometry is
represented in Fig. 17.
The links between functional elements were quantified
under the symmetry assumption using a change impact
value of 0.1 for all links and one of the three different
values for change likelihood, namely: 0.3 for low, 0.5 for
medium, and 0.8 for high as represented in Fig. 18. All
interlayer links were defined using 0.5 for change likeli-
hood and 0.1 for change impact.
4.4 Compute combined change risk
The Forward CPM algorithm can be applied to the
numerical FBS Linkage scheme including direct likelihood
and impact values of change propagation to calculate a
combined risk matrix. So far, the Forward CPM algorithm
has been discussed only in the context of single-domain
networks, i.e. DSMs (Keller 2007). As all elements in a
FBS scheme are equal in terms of receiving and forwarding
changes, this multi-layer network obeys the same rules as a
single-layer network. Thus, the Forward CPM algorithm
can be applied to the MDM in the same way. However, as
the FBS network consists of three layers which are con-
nected in series, at least four steps of change propagation
are required to consider indirect change propagation
between two structural or two functional elements across
all other layers (e.g. S1 � B1 � F1 � B2 � S2). This is
two steps more than in the single-layered CPM network
(e.g. C1 � C2 � C3). Therefore, five or six steps of
change propagation should be considered for the FBS
Linkage model, two steps more than suggested for CPM
(Clarkson et al. 2004).
Fig. 17 Geometry attribute DSM including change likelihood values for the diesel engine
Res Eng Design
123
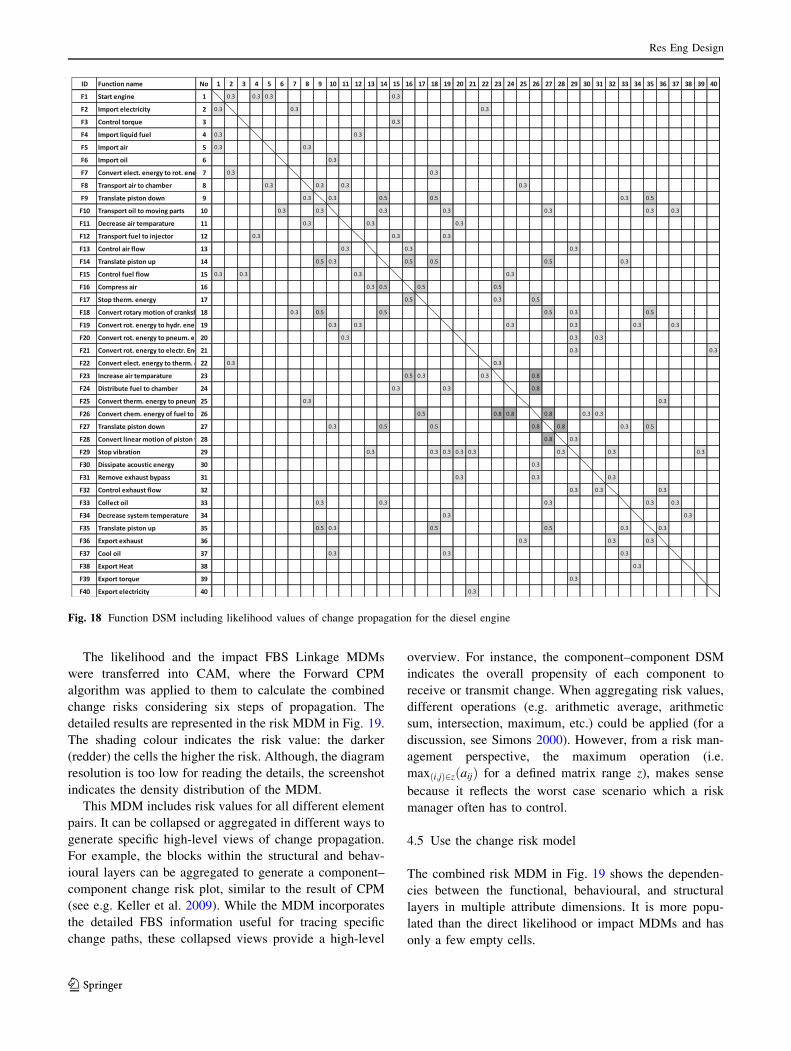
The likelihood and the impact FBS Linkage MDMs
were transferred into CAM, where the Forward CPM
algorithm was applied to them to calculate the combined
change risks considering six steps of propagation. The
detailed results are represented in the risk MDM in Fig. 19.
The shading colour indicates the risk value: the darker
(redder) the cells the higher the risk. Although, the diagram
resolution is too low for reading the details, the screenshot
indicates the density distribution of the MDM.
This MDM includes risk values for all different element
pairs. It can be collapsed or aggregated in different ways to
generate specific high-level views of change propagation.
For example, the blocks within the structural and behav-
ioural layers can be aggregated to generate a component–
component change risk plot, similar to the result of CPM
(see e.g. Keller et al. 2009). While the MDM incorporates
the detailed FBS information useful for tracing specific
change paths, these collapsed views provide a high-level
overview. For instance, the component–component DSM
indicates the overall propensity of each component to
receive or transmit change. When aggregating risk values,
different operations (e.g. arithmetic average, arithmetic
sum, intersection, maximum, etc.) could be applied (for a
discussion, see Simons 2000). However, from a risk man-
agement perspective, the maximum operation (i.e.
maxði;jÞ2zðaijÞ for a defined matrix range z), makes sense
because it reflects the worst case scenario which a risk
manager often has to control.
4.5 Use the change risk model
The combined risk MDM in Fig. 19 shows the dependen-
cies between the functional, behavioural, and structural
layers in multiple attribute dimensions. It is more popu-
lated than the direct likelihood or impact MDMs and has
only a few empty cells.
Fig. 18 Function DSM including likelihood values of change propagation for the diesel engine
Res Eng Design
123
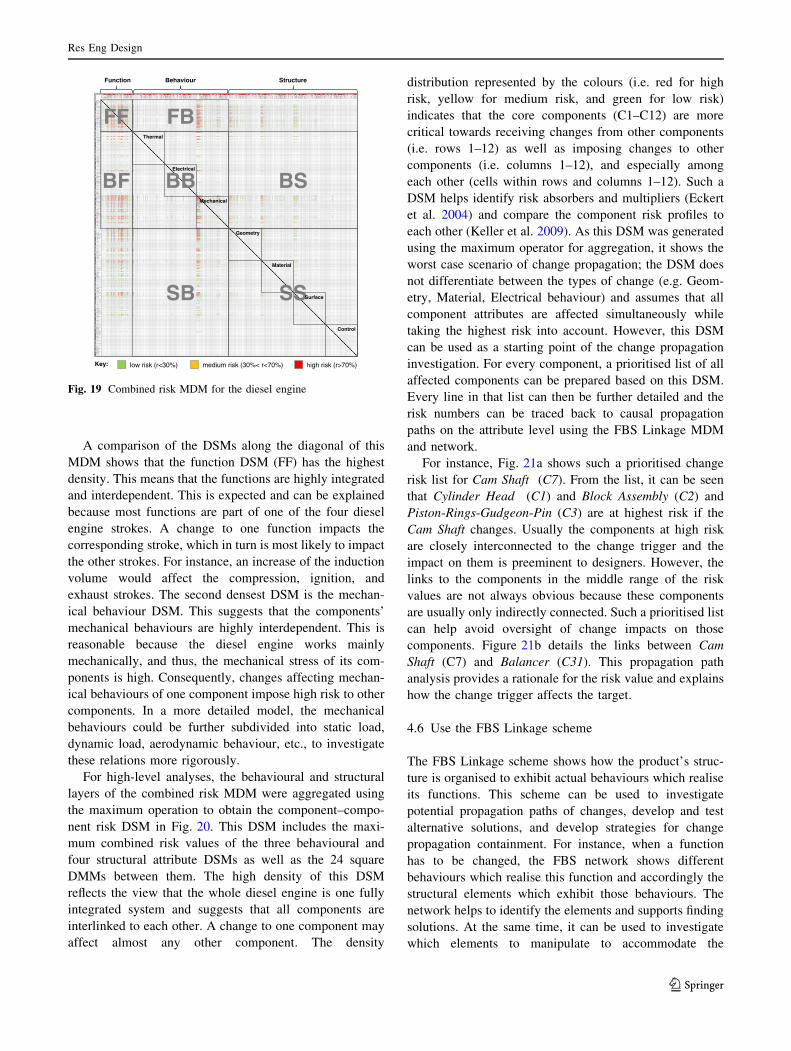
A comparison of the DSMs along the diagonal of this
MDM shows that the function DSM (FF) has the highest
density. This means that the functions are highly integrated
and interdependent. This is expected and can be explained
because most functions are part of one of the four diesel
engine strokes. A change to one function impacts the
corresponding stroke, which in turn is most likely to impact
the other strokes. For instance, an increase of the induction
volume would affect the compression, ignition, and
exhaust strokes. The second densest DSM is the mechan-
ical behaviour DSM. This suggests that the components’
mechanical behaviours are highly interdependent. This is
reasonable because the diesel engine works mainly
mechanically, and thus, the mechanical stress of its com-
ponents is high. Consequently, changes affecting mechan-
ical behaviours of one component impose high risk to other
components. In a more detailed model, the mechanical
behaviours could be further subdivided into static load,
dynamic load, aerodynamic behaviour, etc., to investigate
these relations more rigorously.
For high-level analyses, the behavioural and structural
layers of the combined risk MDM were aggregated using
the maximum operation to obtain the component–compo-
nent risk DSM in Fig. 20. This DSM includes the maxi-
mum combined risk values of the three behavioural and
four structural attribute DSMs as well as the 24 square
DMMs between them. The high density of this DSM
reflects the view that the whole diesel engine is one fully
integrated system and suggests that all components are
interlinked to each other. A change to one component may
affect almost any other component. The density
distribution represented by the colours (i.e. red for high
risk, yellow for medium risk, and green for low risk)
indicates that the core components (C1–C12) are more
critical towards receiving changes from other components
(i.e. rows 1–12) as well as imposing changes to other
components (i.e. columns 1–12), and especially among
each other (cells within rows and columns 1–12). Such a
DSM helps identify risk absorbers and multipliers (Eckert
et al. 2004) and compare the component risk profiles to
each other (Keller et al. 2009). As this DSM was generated
using the maximum operator for aggregation, it shows the
worst case scenario of change propagation; the DSM does
not differentiate between the types of change (e.g. Geom-
etry, Material, Electrical behaviour) and assumes that all
component attributes are affected simultaneously while
taking the highest risk into account. However, this DSM
can be used as a starting point of the change propagation
investigation. For every component, a prioritised list of all
affected components can be prepared based on this DSM.
Every line in that list can then be further detailed and the
risk numbers can be traced back to causal propagation
paths on the attribute level using the FBS Linkage MDM
and network.
For instance, Fig. 21a shows such a prioritised change
risk list for Cam Shaft (C7). From the list, it can be seen
that Cylinder Head (C1) and Block Assembly (C2) and
Piston-Rings-Gudgeon-Pin (C3) are at highest risk if the
Cam Shaft changes. Usually the components at high risk
are closely interconnected to the change trigger and the
impact on them is preeminent to designers. However, the
links to the components in the middle range of the risk
values are not always obvious because these components
are usually only indirectly connected. Such a prioritised list
can help avoid oversight of change impacts on those
components. Figure 21b details the links between Cam
Shaft (C7) and Balancer (C31). This propagation path
analysis provides a rationale for the risk value and explains
how the change trigger affects the target.
4.6 Use the FBS Linkage scheme
The FBS Linkage scheme shows how the product’s struc-
ture is organised to exhibit actual behaviours which realise
its functions. This scheme can be used to investigate
potential propagation paths of changes, develop and test
alternative solutions, and develop strategies for change
propagation containment. For instance, when a function
has to be changed, the FBS network shows different
behaviours which realise this function and accordingly the
structural elements which exhibit those behaviours. The
network helps to identify the elements and supports finding
solutions. At the same time, it can be used to investigate
which elements to manipulate to accommodate the
BehaviourFunction Structure
FF
BB
SS
FB
BF
SB
BS
Thermal
Electrical
Mechanical
Geometry
Material
Surface
Control
high risk (r>70%)medium risk (30%< r<70%)low risk (r<30%)Key:
Fig. 19 Combined risk MDM for the diesel engine
Res Eng Design
123
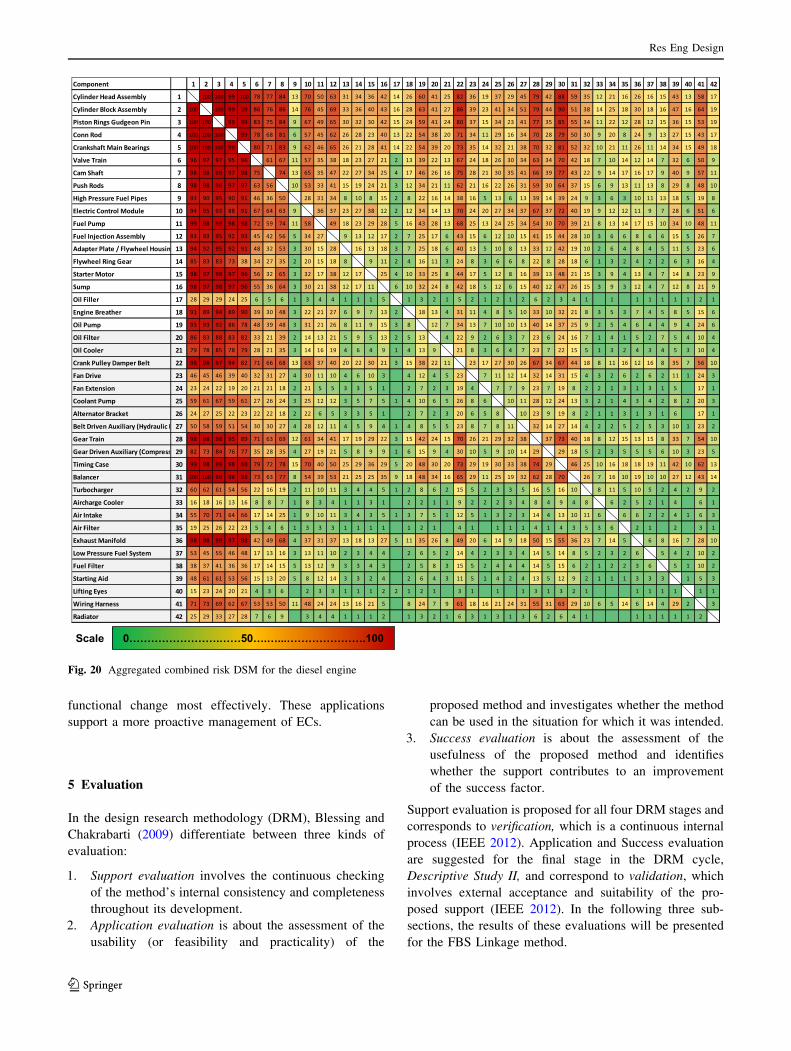
functional change most effectively. These applications
support a more proactive management of ECs.
5 Evaluation
In the design research methodology (DRM), Blessing and
Chakrabarti (2009) differentiate between three kinds of
evaluation:
1. Support evaluation involves the continuous checking
of the method’s internal consistency and completeness
throughout its development.
2. Application evaluation is about the assessment of the
usability (or feasibility and practicality) of the
proposed method and investigates whether the method
can be used in the situation for which it was intended.
3. Success evaluation is about the assessment of the
usefulness of the proposed method and identifies
whether the support contributes to an improvement
of the success factor.
Support evaluation is proposed for all four DRM stages and
corresponds to verification, which is a continuous internal
process (IEEE 2012). Application and Success evaluation
are suggested for the final stage in the DRM cycle,
Descriptive Study II, and correspond to validation, which
involves external acceptance and suitability of the pro-
posed support (IEEE 2012). In the following three sub-
sections, the results of these evaluations will be presented
for the FBS Linkage method.
Fig. 20 Aggregated combined risk DSM for the diesel engine
Res Eng Design
123
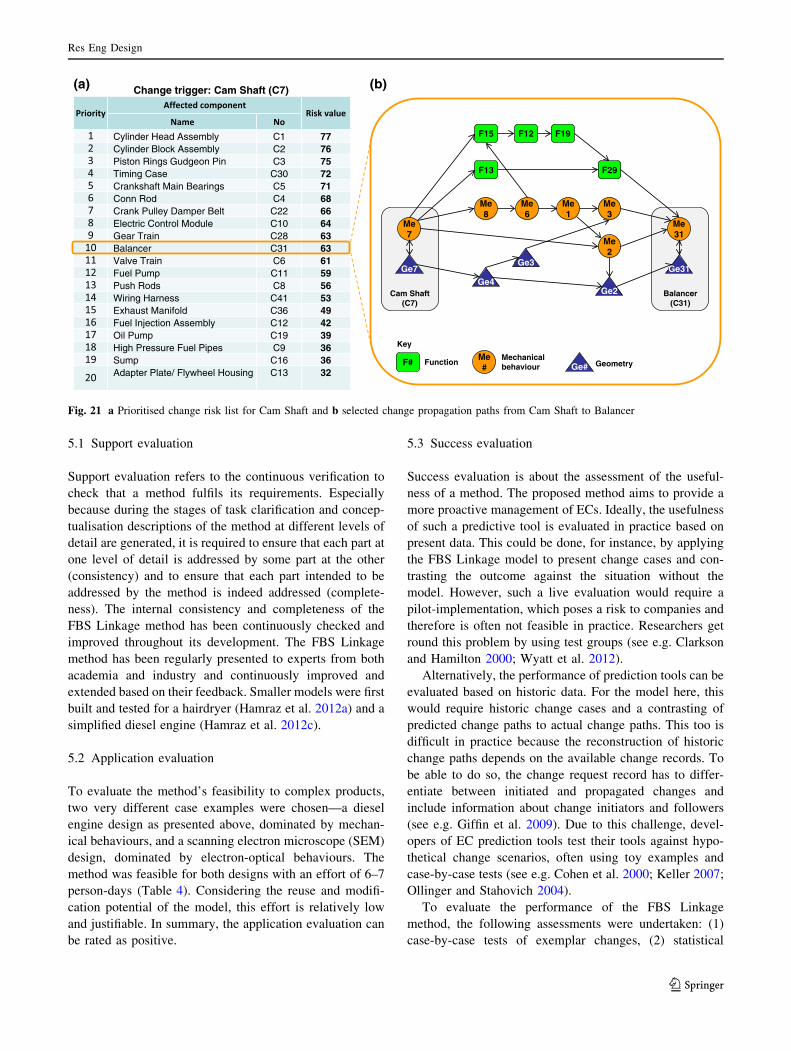
5.1 Support evaluation
Support evaluation refers to the continuous verification to
check that a method fulfils its requirements. Especially
because during the stages of task clarification and concep-
tualisation descriptions of the method at different levels of
detail are generated, it is required to ensure that each part at
one level of detail is addressed by some part at the other
(consistency) and to ensure that each part intended to be
addressed by the method is indeed addressed (complete-
ness). The internal consistency and completeness of the
FBS Linkage method has been continuously checked and
improved throughout its development. The FBS Linkage
method has been regularly presented to experts from both
academia and industry and continuously improved and
extended based on their feedback. Smaller models were first
built and tested for a hairdryer (Hamraz et al. 2012a) and a
simplified diesel engine (Hamraz et al. 2012c).
5.2 Application evaluation
To evaluate the method’s feasibility to complex products,
two very different case examples were chosen—a diesel
engine design as presented above, dominated by mechan-
ical behaviours, and a scanning electron microscope (SEM)
design, dominated by electron-optical behaviours. The
method was feasible for both designs with an effort of 6–7
person-days (Table 4). Considering the reuse and modifi-
cation potential of the model, this effort is relatively low
and justifiable. In summary, the application evaluation can
be rated as positive.
5.3 Success evaluation
Success evaluation is about the assessment of the useful-
ness of a method. The proposed method aims to provide a
more proactive management of ECs. Ideally, the usefulness
of such a predictive tool is evaluated in practice based on
present data. This could be done, for instance, by applying
the FBS Linkage model to present change cases and con-
trasting the outcome against the situation without the
model. However, such a live evaluation would require a
pilot-implementation, which poses a risk to companies and
therefore is often not feasible in practice. Researchers get
round this problem by using test groups (see e.g. Clarkson
and Hamilton 2000; Wyatt et al. 2012).
Alternatively, the performance of prediction tools can be
evaluated based on historic data. For the model here, this
would require historic change cases and a contrasting of
predicted change paths to actual change paths. This too is
difficult in practice because the reconstruction of historic
change paths depends on the available change records. To
be able to do so, the change request record has to differ-
entiate between initiated and propagated changes and
include information about change initiators and followers
(see e.g. Giffin et al. 2009). Due to this challenge, devel-
opers of EC prediction tools test their tools against hypo-
thetical change scenarios, often using toy examples and
case-by-case tests (see e.g. Cohen et al. 2000; Keller 2007;
Ollinger and Stahovich 2004).
To evaluate the performance of the FBS Linkage
method, the following assessments were undertaken: (1)
case-by-case tests of exemplar changes, (2) statistical
Cylinder Head Assembly C1 77Cylinder Block Assembly C2 76Piston Rings Gudgeon Pin C3 75Timing Case C30 72Crankshaft Main Bearings C5 71Conn Rod C4 68Crank Pulley Damper Belt C22 66Electric Control Module C10 64Gear Train C28 63Balancer C31 63Valve Train C6 61Fuel Pump C11 59Push Rods C8 56Wiring Harness C41 53Exhaust Manifold C36 49Fuel Injection Assembly C12 42Oil Pump C19 39High Pressure Fuel Pipes C9 36Sump C16 36Adapter Plate/ Flywheel Housing C13 32
Change trigger: Cam Shaft (C7)
Balancer (C31)
Cam Shaft (C7)
Me7
F13
Me31
Me2
Me8
Me1
Me6
Me3
F29
F15 F12 F19
F#Me#
FunctionMechanical behaviour
Ge2
Ge# Geometry
Ge31
Key
Ge4Ge7
Ge3
(a) (b)
Fig. 21 a Prioritised change risk list for Cam Shaft and b selected change propagation paths from Cam Shaft to Balancer
Res Eng Design
123
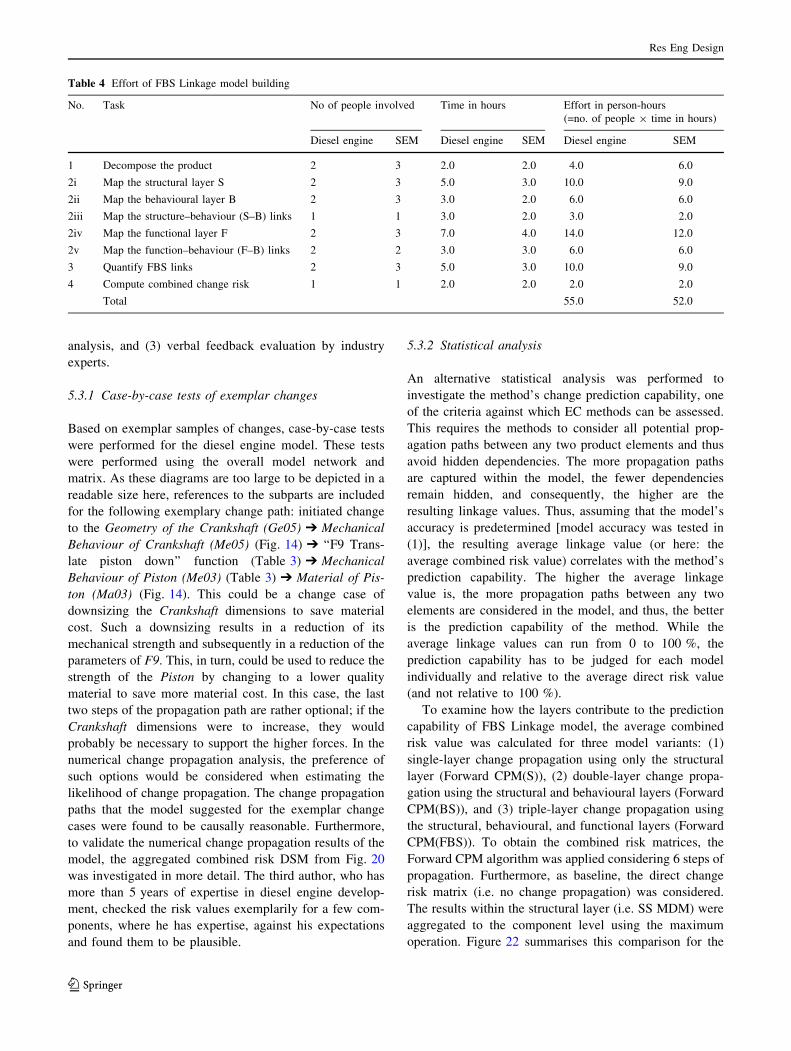
analysis, and (3) verbal feedback evaluation by industry
experts.
5.3.1 Case-by-case tests of exemplar changes
Based on exemplar samples of changes, case-by-case tests
were performed for the diesel engine model. These tests
were performed using the overall model network and
matrix. As these diagrams are too large to be depicted in a
readable size here, references to the subparts are included
for the following exemplary change path: initiated change
to the Geometry of the Crankshaft (Ge05) � Mechanical
Behaviour of Crankshaft (Me05) (Fig. 14) � ‘‘F9 Trans-
late piston down’’ function (Table 3) � Mechanical
Behaviour of Piston (Me03) (Table 3) � Material of Pis-
ton (Ma03) (Fig. 14). This could be a change case of
downsizing the Crankshaft dimensions to save material
cost. Such a downsizing results in a reduction of its
mechanical strength and subsequently in a reduction of the
parameters of F9. This, in turn, could be used to reduce the
strength of the Piston by changing to a lower quality
material to save more material cost. In this case, the last
two steps of the propagation path are rather optional; if the
Crankshaft dimensions were to increase, they would
probably be necessary to support the higher forces. In the
numerical change propagation analysis, the preference of
such options would be considered when estimating the
likelihood of change propagation. The change propagation
paths that the model suggested for the exemplar change
cases were found to be causally reasonable. Furthermore,
to validate the numerical change propagation results of the
model, the aggregated combined risk DSM from Fig. 20
was investigated in more detail. The third author, who has
more than 5 years of expertise in diesel engine develop-
ment, checked the risk values exemplarily for a few com-
ponents, where he has expertise, against his expectations
and found them to be plausible.
5.3.2 Statistical analysis
An alternative statistical analysis was performed to
investigate the method’s change prediction capability, one
of the criteria against which EC methods can be assessed.
This requires the methods to consider all potential prop-
agation paths between any two product elements and thus
avoid hidden dependencies. The more propagation paths
are captured within the model, the fewer dependencies
remain hidden, and consequently, the higher are the
resulting linkage values. Thus, assuming that the model’s
accuracy is predetermined [model accuracy was tested in
(1)], the resulting average linkage value (or here: the
average combined risk value) correlates with the method’s
prediction capability. The higher the average linkage
value is, the more propagation paths between any two
elements are considered in the model, and thus, the better
is the prediction capability of the method. While the
average linkage values can run from 0 to 100 %, the
prediction capability has to be judged for each model
individually and relative to the average direct risk value
(and not relative to 100 %).
To examine how the layers contribute to the prediction
capability of FBS Linkage model, the average combined
risk value was calculated for three model variants: (1)
single-layer change propagation using only the structural
layer (Forward CPM(S)), (2) double-layer change propa-
gation using the structural and behavioural layers (Forward
CPM(BS)), and (3) triple-layer change propagation using
the structural, behavioural, and functional layers (Forward
CPM(FBS)). To obtain the combined risk matrices, the
Forward CPM algorithm was applied considering 6 steps of
propagation. Furthermore, as baseline, the direct change
risk matrix (i.e. no change propagation) was considered.
The results within the structural layer (i.e. SS MDM) were
aggregated to the component level using the maximum
operation. Figure 22 summarises this comparison for the
Table 4 Effort of FBS Linkage model building
No. Task No of people involved Time in hours Effort in person-hours
(=no. of people 9 time in hours)
Diesel engine SEM Diesel engine SEM Diesel engine SEM
1 Decompose the product 2 3 2.0 2.0 4.0 6.0
2i Map the structural layer S 2 3 5.0 3.0 10.0 9.0
2ii Map the behavioural layer B 2 3 3.0 2.0 6.0 6.0
2iii Map the structure–behaviour (S–B) links 1 1 3.0 2.0 3.0 2.0
2iv Map the functional layer F 2 3 7.0 4.0 14.0 12.0
2v Map the function–behaviour (F–B) links 2 2 3.0 3.0 6.0 6.0
3 Quantify FBS links 2 3 5.0 3.0 10.0 9.0
4 Compute combined change risk 1 1 2.0 2.0 2.0 2.0
Total 55.0 52.0
Res Eng Design
123
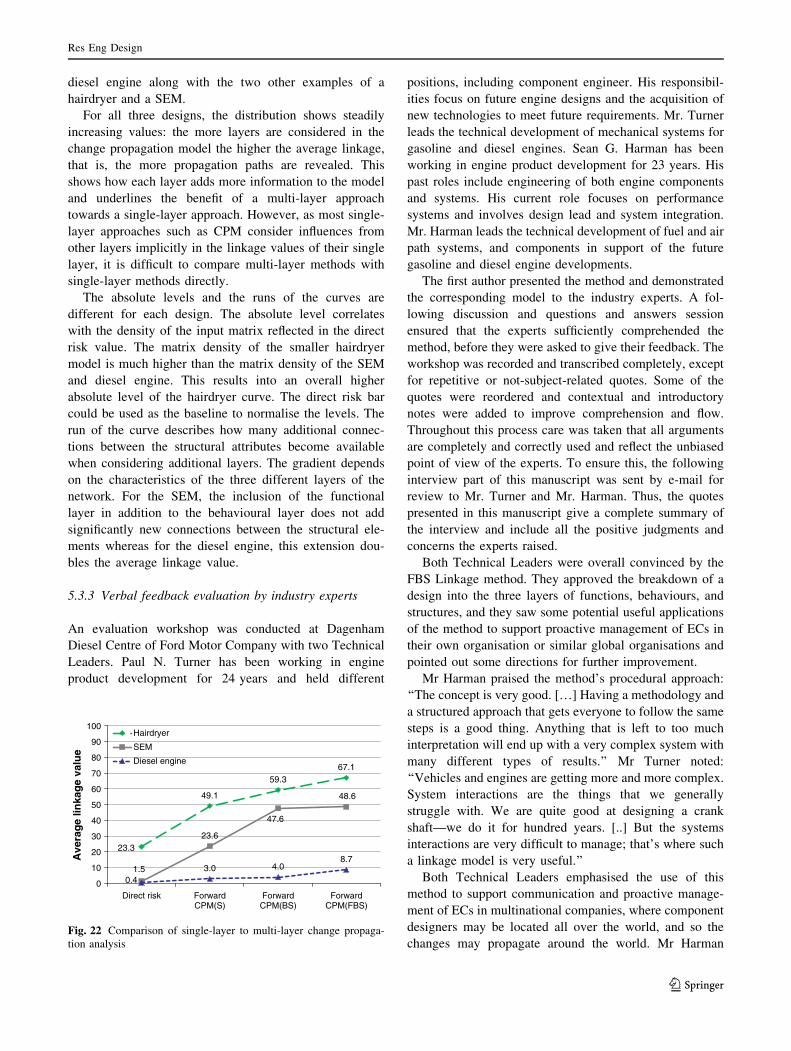
diesel engine along with the two other examples of a
hairdryer and a SEM.
For all three designs, the distribution shows steadily
increasing values: the more layers are considered in the
change propagation model the higher the average linkage,
that is, the more propagation paths are revealed. This
shows how each layer adds more information to the model
and underlines the benefit of a multi-layer approach
towards a single-layer approach. However, as most single-
layer approaches such as CPM consider influences from
other layers implicitly in the linkage values of their single
layer, it is difficult to compare multi-layer methods with
single-layer methods directly.
The absolute levels and the runs of the curves are
different for each design. The absolute level correlates
with the density of the input matrix reflected in the direct
risk value. The matrix density of the smaller hairdryer
model is much higher than the matrix density of the SEM
and diesel engine. This results into an overall higher
absolute level of the hairdryer curve. The direct risk bar
could be used as the baseline to normalise the levels. The
run of the curve describes how many additional connec-
tions between the structural attributes become available
when considering additional layers. The gradient depends
on the characteristics of the three different layers of the
network. For the SEM, the inclusion of the functional
layer in addition to the behavioural layer does not add
significantly new connections between the structural ele-
ments whereas for the diesel engine, this extension dou-
bles the average linkage value.
5.3.3 Verbal feedback evaluation by industry experts
An evaluation workshop was conducted at Dagenham
Diesel Centre of Ford Motor Company with two Technical
Leaders. Paul N. Turner has been working in engine
product development for 24 years and held different
positions, including component engineer. His responsibil-
ities focus on future engine designs and the acquisition of
new technologies to meet future requirements. Mr. Turner
leads the technical development of mechanical systems for
gasoline and diesel engines. Sean G. Harman has been
working in engine product development for 23 years. His
past roles include engineering of both engine components
and systems. His current role focuses on performance
systems and involves design lead and system integration.
Mr. Harman leads the technical development of fuel and air
path systems, and components in support of the future
gasoline and diesel engine developments.
The first author presented the method and demonstrated
the corresponding model to the industry experts. A fol-
lowing discussion and questions and answers session
ensured that the experts sufficiently comprehended the
method, before they were asked to give their feedback. The
workshop was recorded and transcribed completely, except
for repetitive or not-subject-related quotes. Some of the
quotes were reordered and contextual and introductory
notes were added to improve comprehension and flow.
Throughout this process care was taken that all arguments
are completely and correctly used and reflect the unbiased
point of view of the experts. To ensure this, the following
interview part of this manuscript was sent by e-mail for
review to Mr. Turner and Mr. Harman. Thus, the quotes
presented in this manuscript give a complete summary of
the interview and include all the positive judgments and
concerns the experts raised.
Both Technical Leaders were overall convinced by the
FBS Linkage method. They approved the breakdown of a
design into the three layers of functions, behaviours, and
structures, and they saw some potential useful applications
of the method to support proactive management of ECs in
their own organisation or similar global organisations and
pointed out some directions for further improvement.
Mr Harman praised the method’s procedural approach:
‘‘The concept is very good. […] Having a methodology and
a structured approach that gets everyone to follow the same
steps is a good thing. Anything that is left to too much
interpretation will end up with a very complex system with
many different types of results.’’ Mr Turner noted:
‘‘Vehicles and engines are getting more and more complex.
System interactions are the things that we generally
struggle with. We are quite good at designing a crank
shaft—we do it for hundred years. [..] But the systems
interactions are very difficult to manage; that’s where such
a linkage model is very useful.’’
Both Technical Leaders emphasised the use of this
method to support communication and proactive manage-
ment of ECs in multinational companies, where component
designers may be located all over the world, and so the
changes may propagate around the world. Mr Harman
23.3
49.1
59.3 67.1
1.5
23.6
47.6
48.6
0.4 3.0 4.0
8.7
0
10
20
30
40
50
60
70
80
90
100
Direct risk ForwardCPM(S)
ForwardCPM(BS)
ForwardCPM(FBS)
Ave
rag
e lin
kag
e va
lue
Hairdryer
SEM
Diesel engine
Fig. 22 Comparison of single-layer to multi-layer change propaga-
tion analysis
Res Eng Design
123
explained: ‘‘If you have to change the specifications of one
component in your area, the person affected by that change,
in a big organisation, might have no way to know that the
change is happening. So, if your model can use the existing
linkages to flag up the change to all affected designers,
each of them would be able to react early. […] There are
other methods to flag up changes, […] but you never know
how that effect is. Being able to quantify the effect is an
advantage. If the structure in this model is set up correctly,
you could minimise the number of false alarms and max-
imise the attention needed. […] For the automotive
industry, that would be a useful bonus for the amount of
work that you have to put into develop such a method.’’ Mr
Turner added: ‘‘Today, we have a rigorous change man-
agement process trying to make people go through the
steps and identify all the effects. […] The component
engineer is then responsible for presenting that; but it is
incumbent on the people who think they are affected to turn
up to the meeting and determine whether they are affected
or not. If they don’t turn up, or they don’t think they are
affected but they are. […] only later will people realise
‘Oops! A change has happened we didn’t know’’’.
Mr. Harman noticed that ‘‘Breaking down into function,
behaviour, and structure is an excellent idea. At the
moment, we look at block diagrams and try to get the
linkages between various components and systems. We try
to look at the effect from one to another in terms of flows
of energy, information, and material. Understanding how
functions, behaviours, and structures are interrelated is a
level of refinement which I think is very useful.’’
Mr. Harman regarded the familiarity of the method as an
advantage for acceptance in industry: ‘‘We have looked at
flows of any form of energy, material, and information
between components at the engine level. […] I can see the
systems that we do at the moment being quite useful in
terms of delivering input for this model, so we are not
coming straight from scratch. […] some of these functions
could link in into our current models such as our com-
bustion model and use that as input. There are quite well-
known function trees, for instance the relations between
material properties and surface areas for constant rotations.
Today, we look at these functions in isolation and then try
to work out what else might have an impact.’’ He then
pointed out the importance of input flexibility for such a
model: ‘‘You probably find that a lot of information is
already available in the database. It then comes back to
getting the information in the right structure. […] I think
making sure that the data capture is fit for use for all dif-
ferent types of information would be very useful. Just to
ensure that people can take existing information and
transfer it into the model rather than having to start from
scratch.’’ Mr Turner supported this argument and saw it as
an essential area for further improvement of the method:
‘‘For accurate change prediction to work effectively, I
would recommend that the model is linked to real data to
continually update and learn as it is being used, based upon
actual events. […] Expert estimations are fine to get it
started, but then in reality, the actual data can surprise you.
Having a methodology to refine that input and evolve the
model is mandatory.’’
Mr. Harman highlighted the Planning Office as a
potential good area to use this model for project size esti-
mation: ‘‘If we had a reasonable model to start with, we
could perhaps put in a level of change or define a new
function. So, we know what the function is and we know
what we need to change to get that function; and we can
put that in [the model] and that would tell us what the
knock-on effect would be to the whole engine. I’m sure
with a certain amount of expert input from the cost esti-
mating finance side you could probably start estimating the
size of the program based on the change.’’
Mr Turner emphasised it potential use to compare and
optimise between different engines: ‘‘Potentially, if you
take a diesel engine, and apply this to different types of
engine. You can compare what’s happening on Engine 1
versus Engine 2 versus Engine 3. It might be a useful way of
saying ‘well actually, something is going strange on Engine
2 because we are seeing a higher occurrence of these sorts
of linkages. Is that a design weakness or a usage condition
which is causing more problems on this engine?’’’
Both evaluators appreciated the flexibility of the model.
Mr. Harman referred to the different types of input: ‘‘For a
mechanical system like an engine, quite a few of these
links are based on laws of physics and therefore quite easy
to be more accurate in that relationship—it is not just an
estimate—there is often an equation behind it. […] I think
this model could be fairly accurate for critical attributes
and vaguer for secondary attributes of the engine.’’ Mr
Turner referred to the different levels of detail: ‘‘Rather
than doing it for every component, you might want to stick
at the systems level and then focus on the key systems, and
break them down further.’’
They briefly checked the functional block diagram of the
engine and but did not have enough time to check the
model and its results in more detail. However, with regard
to model accuracy and validation, Mr Turner suggested:
‘‘You have to create the model. You have your expert input
as starting point. You need to then use the model to see
how the changes actually flow through the system and
record the change paths in your change control system. We
don’t record that today; it would require some system type
changes in how we operate the company. You have to do
something like that to refine, update, and validate the
model.’’
Mr Harman noticed an application limitation of the
method: ‘‘If the key enabler for the tool to work is having
Res Eng Design
123
the expert input, I think, if you picture that for a very
large system (i.e. the entire vehicle), you won’t find
anybody who is expert enough to give you that informa-
tion and you have to get too many experts together; and if
you get two engineers in one room, you get four solutions.
You might want to think about where to pitch the models
size. For a diesel engine, which is quite a complex thing
to do, we are probably talking about half a dozen experts
to get enough detail. So, that doesn’t seem to be beyond
the level to make it. The bigger you make it the more
expertise you need or the higher level you have to go in
terms of linkages; the higher the level the less resolution
you get; and there is a trade-off between how much time
you spend to develop the model and how much benefit
you get from it. In terms of evaluating the model, you
might want to think about how you would perhaps look at
the input versus the resolution of the model, and then, try
to have a metric of how much accuracy you need versus
how much input you need […]. If you pitch it [the amount
of input] too high it will be a too big task and you won’t
get enough input; if you pitch it [the amount of input] too
low you won’t have enough resolution in order to be
useful. […] So you have an upfront requirement for the
model.’’
Mr. Turner concluded: ‘‘The thing that’s making me
think is how this would integrate with our current quality
tools; and could it enhance our current quality tools? I
think the answer is probably yes [to both]. It is just
making sure that it is aligned with our operating practices
globally. I think there is a merit to do this. You have to
start somewhere, start small and then expand and grow. I
think this method could do that. Particularly, as we are
now trying to think in a system way and look at the
interactions between components, this model potentially
has an opportunity to help construct some of that. The
hard bit in reality is always ‘how do you actually do it to
make it an automated tool?’ If it’s manual, it’s never used.
If it’s a tool that is straight forward and easy to use and
interlinking to existing systems, then this potentially could
work very well.’’
In summary, the success evaluation shows that overall
the method contributes to an improvement of EC man-
agement, and thus, the evaluation can be rated as positive.
However, it has to be noted that this is only an initial
evaluation. Next, for a more practical evaluation, experi-
ments with test groups could be run, involving a pilot-
implementation of the method and its application to
exemplary change case simulations. Eventually, for a
complete success evaluation, the method has to be imple-
mented as a software tool in a company and applied to
present change cases. The outcome can then be contrasted
against the situation without the tool to evaluate the actual
impact.
6 Conclusion
Engineering changes are raised throughout the product
lifecycle and can cause severe profit losses if not managed
sufficiently. As product development times are continu-
ously decreased, the management of such changes is
becoming more important.
This paper has presented our continued work on the FBS
Linkage method—a multi-domain change propagation
model based on the concepts of functional reasoning and
the CPM. Four contributions of this paper can be high-
lighted: First, we presented a comprehensive review and
comparison of the three seminal function–behaviour–
structure ontologies highlighting their key characteristics
and discussing their shortcomings in the context of change
modelling. Second, we used the previous comparison to
develop a function–behaviour–structure scheme, which is
more practical for change modelling and incorporated this
scheme into our FBS Linkage model. Third, we described
the modelling technique and applied it to develop a FBS
Linkage model for a diesel engine. Fourth, we evaluated
the FBS Linkage method.
The diesel engine was decomposed into 42 components.
For each component, four structural and three behavioural
attributes were defined and their elements were linked to
each other. A functional block diagram comprising 40
subfunctions was developed, and the FBS Linkage scheme
was completed by linking each subfunction to the respon-
sible behavioural elements. Subsequently, the FBS links
were quantified and a combined change risk matrix was
calculated using the Forward CPM algorithm. The numeric
change risk model was used to generate component-level
risk profiles and prioritised change risk lists.
The evaluation of the FBS Linkage method was overall
positive and comprised three parts:
1. The Support evaluation continuously ensured internal
consistency and completeness of the method.
2. The Application evaluation showed that the method
can be used in the situation for which it was intended.
3. The Success evaluation showed that overall the method
contributes to an improvement of EC management and
highlighted areas of further improvement.
The expert panel from industry found that ‘‘The concept is
good’’ and praised the systematic approach. They liked the
extension of CPM to include more details and found that
‘‘Breaking down into function, behaviour, and structure is
an excellent idea.’’ Both Technical Leaders highlighted the
potential benefit of the FBS Linkage method to support
communication and proactive management of ECs in a
global organisation. On the downside, they criticised the
intensive manual work required for building a model. They
suggested a few improvement ideas for future work. These
Res Eng Design
123
include the linking of the model to available information
databases and the capability of the model to capture change
paths and automatically use them to continuously learn and
improve.
Acknowledgments The authors would like to thank Professor
David C. Brown (Computer Science Department, Worcester Poly-
technic Institute) for the insightful discussions about functional rea-
soning and his helpful feedback for the model, Seena Nair
(Engineering Design Centre, University of Cambridge) for her sup-
port with CAM, Paul N. Turner and Sean G. Harman from Dagenham
Diesel Centre of Ford Motor Company for evaluating the method and
the diesel engine model, and the Perkins Engine Company for
enabling the diesel engine case study. This work was funded by a UK
Engineering and Physical Sciences Research Council Doctoral Prize.
References
Ahmad N, Wynn DC, Clarkson PJ (2011b) The evolution of
information while building cross-domain models of a design: a
video experiment. Paper presented at the international confer-
ence on engineering design (ICED’11), Copenhagen, Denmark
Ahmed S, Kanike Y (2007) Engineering change during a product’s
lifecycle. Paper presented at the international conference on
engineering design (ICED’07), Paris, France
Albers A, Braun A, Sadowski E, Wynn DC, Wyatt DF, Clarkson PJ
(2011) System architecture modeling in a software tool based on
the contact and channel approach (C&C-A). J Mech Des
133(10):101006–101008. doi:10.1115/1.4004971
Altshuller G (1984) Creativity as an exact science. Gordon and
Breach Science, New York
Blessing LTM, Chakrabarti A (2009) DRM, a design research
methodology. Springer, London
Boerstring P, Keller R, Alink T, Eckert CM, Clarkson PJ (2008) The
relationship between functions and requirements for an improved
detection of component linkages. Paper presented at the
international design conference (DESIGN’08), Dubrovnik,
Croatia
Chandrasekaran B (2005) Representing function: Relating functional
representation and functional modeling research streams. Artif
Intell Eng Des Anal Manuf (AIEDAM) 19(2):65–74
Clarkson PJ, Hamilton JR (2000) ‘Signposting’, a parameter-driven
task-based model of the design process. Res Eng Des
12(1):18–38
Clarkson PJ, Simons C, Eckert CM (2001b) Change prediction for
product redesign. Paper presented at the international conference
on engineering design (ICED’01), Glasgow, UK
Clarkson PJ, Simons C, Eckert CM (2004) Predicting change
propagation in complex design. J Mech Des 126(5):788–797
Cohen T, Fulton RE (1998) A data approach to tracking and
evaluating engineering changes. Paper presented at the ASME
design engineering technical conference (DETC’98), Atlanta,
GA, USA
Cohen T, Navathe SB, Fulton RE (2000) C-FAR, change favorable
representation. CAD Comput Aided Des 32(5):321–338
Eckert CM, Clarkson PJ, Zanker W (2004) Change and customisation
in complex engineering domains. Res Eng Des 15(1):1–21
Eckert C, Alink T, Ruckpaul A, Albers A (2011) Different notions of
function: results from an experiment on the analysis of an
existing product. J Eng Des 22(11–12):811–837. doi:10.1080/
09544828.2011.603297
Erden MS, Komoto H, van Beek TJ, D’Amelio V, Echavarria E,
Tomiyama T (2008) A review of function modeling: approaches
and applications. Artif Intell Eng Des Anal Manuf (AIEDAM)
22(2):147–169. doi:10.1017/S0890060408000103
Far BH, Elamy AH (2005) Functional reasoning theories: problems
and perspectives. Artif Intell Eng Des Anal Manuf (AIEDAM)
19(2):75–88. doi:10.1017/s0890060405050080
Fei G, Gao J, Owodunni D, Tang X (2011a) A model-driven and
knowledge-based methodology for engineering design change
management. Comput Aided Des Appl 8(3):373–382
Fei G, Gao J, Owodunni OO, Tang X (2011b) A method for
engineering design change analysis using system modelling and
knowledge management techniques. Int J Comput Integr Manuf
24(6):535–551. doi:10.1080/0951192x.2011.562544
Fricke E, Gebhard B, Negele H, Igenbergs E (2000) Coping with
changes: causes, findings, and strategies. Syst Eng 3(4):169–179
Gero JS (1990) Design prototypes: a knowledge representation
schema for design. AI Mag 11(4):26–36
Gero JS, Kannengiesser U (2004) The situated function–behaviour–
structure framework. Des Stud 25(4):373–391
Gero JS, Kannengiesser U (2007) A function–behavior–structure
ontology of processes. Artif Intell Eng Des Anal Manuf
(AIEDAM) 21(4):379–391
Gero JS, Tham KW, Lee HS (1992) Behaviour: a link between
function and structure in design. In: Brown DC, Waldron MB,
Yoshikawa H (eds) Intelligent computer aided design. Elsevier,
Amsterdam, pp 193–225
Giffin M, De Weck OL, Bounova G, Keller R, Eckert CM, Clarkson
PJ (2009) Change propagation analysis in complex technical
systems. J Mech Des 131(8):0810011–08100114
Goel AK, Bhatta S (2004) Use of design patterns in analogy-based
design. Adv Eng Inf 18(2):85–94. doi:10.1016/j.aei.2004.09.003
Goel AK, Chandrasekaran B (1989) Functional representation of
designs and redesign problem solving. Paper presented at the
international joint conference on artificial intelligence (IJ-
CAI’89), Detroit, MI, USA
Goel AK, Stroulia E (1996) Functional device models and model-
based diagnosis in adaptive design. Artif Intell Eng Des Anal
Manuf (AIEDAM) 10(4):355–370
Goel AK, Rugaber S, Vattam S (2009) Structure, behavior, and
function of complex systems: the structure, behavior, and
function modeling language. Artif Intell Eng Des Anal Manuf
(AIEDAM) 23(1):23–35
Guenov MD, Barker SG (2005) Application of axiomatic design and
design structure matrix to the decomposition of engineering
systems. Syst Eng 8(1):29–40. doi:10.1002/sys.20015
Hamraz B, Caldwell NHM, Clarkson PJ (2012a) FBS Linkage
model—towards an integrated engineering change prediction
and analysis method. Paper presented at the international design
conference (DESIGN’10), Dubrovnik, Croatia
Hamraz B, Caldwell NHM, Clarkson PJ (2012b) A multi-domain
engineering change propagation model to support uncertainty
reduction and risk management in design. J Mech Des. doi:10.
1115/1.4007397
Hamraz B, Caldwell NHM, John Clarkson P (2012c) A multidomain
engineering change propagation model to support uncertainty
reduction and risk management in design. J Mech Des
134(10):100905, 100901–100914. doi:10.1115/1.4007397
Hamraz B, Caldwell NHM, Clarkson PJ (2013a) A holistic categor-
isation framework for literature on engineering change manage-
ment. Syst Eng 16(4):473–505. doi:10.1002/sys.21244
Hamraz B, Hisarciklilar O, Rahmani K, Wynn DC, Thomson V,
Clarkson PJ (2013b) Change prediction using interface data.
Concurr Eng 21(2):139–154
Hirtz J, Stone RB, McAdams DA, Szykman S, Wood KL (2002) A
functional basis for engineering design: reconciling and evolvingprevious efforts. Res Eng Des 13(2):65–82. doi:10.1007/s00163-
001-0008-3
Res Eng Design
123

Hubka V, Eder WE (1996) Design science: introduction to the needs,
scope and organization of engineering design knowledge.
Springer, London
Hundal MS (1990) A systematic method for developing function
structures, solutions and concept variants. Mech Mach Theory
25(3):243–256. doi:10.1016/0094-114x(90)90027-h
IEEE (2012) IEEE Std 1012-2012—standard for system and software
verification and validation. Institute of Electrical and Electronics
Engineers (IEEE), New York, NY, USA
Janthong N (2011) A methodology for tracking the impact of changes
in (re)designing of the industrial complex product. Paper
presented at the IEEE international conference on industrial
engineering and engineering management (IEEM’11), Singapore
Jarratt TAW, Eckert CM, Clarkson PJ (2004a) Development of a
product model to support engineering change management.
Paper presented at the fifth international symposium on tools and
methods of competitive engineering (TMCE’04), Lausanne,
Switzerland
Jarratt TAW, Eckert CM, Clarkson PJ (2004b) The benefits of
predicting change in complex products: application areas of a
DSM-based prediction tool. Paper presented at the international
design conference (DESIGN’04), Dubrovnik, Croatia
Jarratt TAW, Eckert CM, Caldwell NHM, Clarkson PJ (2011)
Engineering change: an overview and perspective on the
literature. Res Eng Des 22(2):103–124
Keller R (2007) Predicting change propagation: Algorithms, repre-
sentations, software tools. Ph.D. thesis, University of Cam-
bridge, Cambridge, UK
Keller R, Eckert CM, Clarkson PJ (2009) Using an engineering
change methodology to support conceptual design. J Eng Des
20(6):571–587. doi:10.1080/09544820802086988
Koh ECY, Caldwell NHM, Clarkson PJ (2012) A method to assess
the effects of engineering change propagation. Res Eng Des
23(4):329–351. doi:10.1007/s00163-012-0131-3
Lindemann U, Maurer M (2007) Facing multi-domain complexity in
product development. In: Krause F-L (ed) The future of product
development. Springer, Berlin, pp 351–361. doi:10.1007/978-3-
540-69820-3_35
Lindemann U, Maurer M, Braun T (2009) Structural complexity
management. Springer, Berlin
Little A, Wood K, McAdams D (1997) Functional analysis: A
fundamental empirical study for reverse engineering, bench-
marking and redesign. Paper presented at the ASME design
theory and methodology conference, Sacramento, CA, USA
Maier AM, Langer S (2011) Engineering change management report
2011: survey results on causes and effects, current practice,
problems, and strategies in Denmark. DTU Management Engi-
neering, Department of Management Engineering, Technical
University of Denmark, Copenhagen, Denmark
Malmqvist J, Axelsson R, Johansson M (1996) A comparative
analysis of the theory of inventive problem solving and the
systematic approach of Pahl and Beitz. Paper presented at the
ASME design engineering technical conferences (DETC’96),
Irvine, CA, USA
Maurer M (2007) Structural awareness in complex product design.
Ph.D. Technology University of Munich, Munich, Germany
McMahon CA (1994) Observations on modes of incremental change
in design. J Eng Des 5(3):195–209
Ollinger GA, Stahovich TF (2001) RedesignIT—a constraint-based
tool for managing design changes. Paper presented at the ASME
design engineering technical conference (DETC’01), Pittsburgh,
PA, USA
Ollinger GA, Stahovich TF (2004) RedesignIT—a model-based tool
for managing design changes. J Mech Des 126(2):208–216
Pahl G, Beitz W, Feldhusen JA, Grote K-H (2007) Engineering
design: a systematic approach, 3rd edn. Springer, New York
Pasqual MC, de Weck OL (2011) Multilayer network model for
analysis and management of change propagation. Paper pre-
sented at the international conference on engineering design
(ICED’11), Copenhagen, Denmark
Qian L, Gero JS (1996) Function–behavior–structure paths and their
role in analogy-based design. Artif Intell Eng Des Anal Manuf
(AIEDAM) 10(4):289–312
Rahmani K, Thomson V (2011) Managing subsystem interfaces of
complex products. Int J Prod Lifecycle Manag 5(1):73–83.
doi:10.1504/ijplm.2011.038103
Rahmani K, Thomson V (2012) Ontology based interface design and
control methodology for collaborative product development.
Comput Aided Des Appl 44(5):432–444. doi:10.1016/j.cad.
2011.12.002
Rodenacker WG (1971) Methodisches Konstruieren: Grundlagen,
Methodik, Praktische Beispiele (German). 1, (4th ed: 1991) edn.
Springer, Berlin, Germany
Rosenman MA, Gero JS (1998) Purpose and function in design: from
the socio-cultural to the techno-physical. Des Stud 19(2):
161–186
Sembugamoorthy V, Chandrasekaran B (1986) Functional represen-
tation of devices and compilation of diagnostic problem solving
systems. In: Kolodner JL, Riesbeck CK (eds) Experience,
memory, and reasoning. Lawrence Erlbaum Associates, Hills-
dale, pp 47–73
Simons CS (2000) Change propagation in product design: a change
prediction method. M.Phil., University of Cambridge,
Cambridge
Stone RB, Wood KL (2000) Development of a functional basis for
design. J Mech Des 122(4):359–370
Szykman S, Racz JW, Sriram RD (1999) The representation of
function in computer-based design. Paper presented at the
ASME design engineering technical conferences (DETC’99),
Las Vegas, NV, USA
Umeda Y, Tomiyama T (1997) Functional reasoning in design. IEEE
Expert 12(2):42–48
Umeda Y, Takeda H, Tomiyama T, Yoshikawa H (1990) Function,
behaviour, and structure. In: Gero JS (ed) Applications of
artificial intelligence in engineering. Springer, Berlin,
pp 177–193
Umeda Y, Ishii M, Yoshioka M, Shimomura Y, Tomiyama T (1996)
Supporting conceptual design based on the function–behavior–
state modeler. Artif Intell Eng Des Anal Manuf (AIEDAM)
10(4):275–288
Van Beek TJ, Tomiyama T (2012) Structured workflow approach to
support evolvability. Adv Eng Inf 26(3):487–501. doi:10.1016/j.
aei.2012.05.003Van Beek TJ, Erden MS, Tomiyama T (2010) Modular design of
mechatronic systems with function modeling. Mechatronics
20(8):850–863. doi:10.1016/j.mechatronics.2010.02.002
Vermaas PE, Dorst K (2007) On the conceptual framework of John
Gero’s FBS-model and the prescriptive aims of design method-
ology. Des Stud 28(2):133–157. doi:10.1016/j.destud.2006.11.
001
Wyatt DF, Wynn DC, Jarrett JP, Clarkson PJ (2012) Supporting
product architecture design using computational design synthesis
with network structure constraints. Res Eng Des 23(1):17–52
Wynn DC, Wyatt DF, Nair SMT, Clarkson PJ (2010) An introduction
to the Cambridge Advanced Modeller. Paper presented at the 1st
international conference on modelling and management of
engineering processes (MMEP’10), Cambridge, UK
Res Eng Design
123