fda briefing document oncologic drugs advisory …€¦ · table 8: mt103-203 - summary of...
TRANSCRIPT

BLA 125557 S-013 ODAC Briefing Document Blincyto
FDA Briefing Document
Oncologic Drugs Advisory Committee Meeting
BLA 125557 S-013 Blincyto (blinatumomab) Applicant: Amgen, Inc.
DISCLAIMER STATEMENT The attached package contains background information prepared by the Food and Drug Administration (FDA) for the panel members of the advisory committee. The FDA background package often contains assessments and/or conclusions and recommendations written by individual FDA reviewers. Such conclusions and recommendations do not necessarily represent the final position of the individual reviewers, nor do they necessarily represent the final position of the Review Division or Office. We have brought the blinatumomab BLA S-013 to this Advisory Committee in order to gain the Committee’s insights and opinions regarding the effectiveness and safety of the proposed drug product for the proposed oncologic indication. The background package may not include all issues relevant to the final regulatory recommendation and instead is intended to focus on issues identified by the Agency for discussion by the advisory committee. The FDA will not issue a final determination on the issues at hand until input from the advisory committee process has been considered and all reviews have been finalized. The final determination may be affected by issues not discussed at the advisory committee meeting.

BLA 125557 S-013 ODAC Briefing Document Blincyto
Table of Contents
1. INTRODUCTION ................................................................................................................. 5
1.1 Proposed Indication .......................................................................................................... 5 1.2 Purpose of the Meeting ..................................................................................................... 5
2. MRD AS A BIOMARKER FOR ALL ................................................................................. 6
2.1 MRD as a Biomarker ........................................................................................................ 6 2.2 MRD as a Prognostic Biomarker for ALL ....................................................................... 7
2.2.1 Study 20120148 ................................................................................................ 7 2.2.2 Published Meta-Analysis ................................................................................ 10 2.2.3 Additional Literature ...................................................................................... 11
2.3 Summary of Issues Regarding MRD as a Biomarker for ALL ...................................... 12
3. BLINATUMOMAB FOR TREATMENT OF MRD-POSITIVE ALL .......................... 13
3.1 Clinical Trials/Studies Used In The Review .................................................................. 13 3.1.1 MT103-203 ..................................................................................................... 13 3.1.2 Propensity Score Analysis .............................................................................. 13 3.1.3 MT103-202 ..................................................................................................... 14
3.2 Efficacy ........................................................................................................................... 14 3.2.1 MT103-203 ..................................................................................................... 14 3.2.2 Propensity Score Analysis .............................................................................. 18
3.3 Safety .............................................................................................................................. 25 3.4 Summary of Study MT103-203 Results and Issues ....................................................... 28
4. CONCLUSIONS .................................................................................................................. 28
5. REFERENCES .................................................................................................................... 29
6. APPENDICES ...................................................................................................................... 30
6.1 Appendix 1: Analysis Population by supporting studies for various analyses ............... 30 6.2 Appendix 2: Evaluation of Covariate Balance Before and After Propensity Score
Adjustments With sIPTW ............................................................................................... 31 6.3 Appendix 3: Table of Grouped Terms Used for Adverse Reactions .............................. 32

BLA 125557 S-013 ODAC Briefing Document Blincyto
3
TABLES OF TABLES
Table 1: Study 20120148 - Demographics and Baseline Disease Characteristics .......................... 8 Table 2: Study 20120148 - Summary Descriptive Analysis of RFS by Baseline MRD Level ...... 9 Table 3: Published Meta-Analysis - Summary of Study Characteristics ...................................... 10 Table 4: Published Meta-Analysis - Outcomes in the Subgroup of B-Cell ALL Studies ............ 11 Table 5: MT103-203 - Demographics and Baseline Disease Characteristics ............................... 15 Table 6: MT103-203 - Summary of MRD Response at Cycle 1 .................................................. 16 Table 7: MT103-203 - Summary of Secondary Efficacy Endpoint Hematological RFS ............. 17 Table 8: MT103-203 - Summary of Hematological RFS ............................................................. 18 Table 9: Propensity Score Analysis – Demographics and Baseline Disease Characteristics ....... 19 Table 10: Propensity Score Analysis - Hazard Ratio (HR) Estimates for Evaluation of Treatment by HSCT Interaction Using sIPTW weighted Cox’s PH Model .................................................. 24 Table 11: Safety Database - Patient Disposition ........................................................................... 25 Table 12: Safety Database - TEAE Resulting In Treatment Withdrawal Or Interruption ............ 26 Table 13: Safety Database - Adverse Events of Special Interest .................................................. 27 Table 14: Covariate Balance Before and After Propensity Score Adjustments With Stabilized IPTW*: Propensity Score Analysis (Primary Analysis Set) ........................................................ 31
TABLES OF FIGURES
Figure 1: Study 20120148 - Kaplan-Meier Plot of Hematological RFS of Patients by Baseline MRD Level ..................................................................................................................................... 9 Figure 2: Box-Plot of Propensity Score by Treatment Group ...................................................... 20 Figure 3: Kaplan Meier Curve of RFS with Propensity-Score Adjustment ................................. 21 Figure 4: Kaplan Meier Curve of RFS After HSCT with Propensity-Score Adjustment ............. 22 Figure 5: Kaplan Meier Curve of OS with Propensity-Score Adjustment ................................... 22 Figure 6: Kaplan Meier Curve of OS After HSCT with Propensity-Score Adjustment ............... 23

BLA 125557 S-013 ODAC Briefing Document Blincyto
4
ABBREVIATIONS
AE Adverse event
AESI Adverse event of special interest ALT Alanine aminotransferase ALL Acute lymphoblastic leukemia ANC Absolute neutrophil count AST Aspartate aminotransferase CR Complete remission
DCAS Direct Comparison Analysis Set DFS Disease-free survival EFS Event-free survival HR Hazard ratio
HSCT Hematopoietic stem cell transplantation IPD Individual patient-level data
IPTW Inverse Probability or Treatment Weight sIPTW Stabilized Inverse Probability or Treatment Weight
IRC Independent Review Committee MRD Minimal residual disease OR Odds ratio OS Overall survival
PLT Platelets RFS Relapse-free survival SAE Serious adverse event SMQ Standardized MedDRA query VOD Veno-occlusive disease

BLA 125557 S-013 ODAC Briefing Document Blincyto
5
1. INTRODUCTION
1.1 Proposed Indication
The applicant is seeking approval of Blincyto (blinatumomab), a bispecific CD19-directed CD3 T cell engager for the indication “treatment of minimal residual disease (MRD)-positive B-cell precursor acute lymphoblastic leukemia (BCP ALL)."
1.2 Purpose of the Meeting
The purpose of this Advisory Committee meeting is to discuss a) whether there are sufficient data demonstrating that patients with BCP ALL in first or second complete remission (CR) warrant intensive postconsolidation therapy if the level of MRD is > 0.1%, and b) when such patients are treated with blinatumomab, whether achievement of MRD < 0.01% represents a degree of clinical efficacy that outweighs the risks of the therapy. Blinatumomab was granted accelerated approval on 12/3/2014 for treatment of Philadelphia chromosome (Ph)-negative relapsed or refractory BCP ALL on the basis of the CR rate, duration of CR, and proportion of patients with an MRD-negative CR or CR with partial hematological recovery (CRh) within 2 cycles of treatment in a single-arm trial. Clinical benefit was confirmed in a subsequent randomized study that showed a survival benefit for patients with relapsed or refractory Ph-negative BCP ALL treated with blinatumomab in comparison to standard chemotherapy. Activity was also demonstrated for treatment of relapsed or refractory Ph-positive BCP ALL in a single-arm trial. As of 7/11/2017, blinatumomab has regular approval for treatment of relapsed or refractory BCP ALL in adults and children. The applicant now seeks to extend the indication to patients with BCP ALL in CR but who are MRD-positive on the basis of Study MT103-203, a single-arm trial of up to 4 cycles of blinatumomab 15 mcg/m2 continuous infusion on days 1-28 of a 42-day cycle for treatment of patients with BCP ALL in CR or CR with partial platelet recovery and MRD > 0.1%. The applicant provided a retrospective analysis (Study 20120148) of outcomes of patients pooled from multinational group studies to show that the MRD level chosen for eligibility in MT103-203 represents a subgroup with an expected short duration of remission. In the Study 20120148 cohort, there were 268 patients in CR1 with measurable MRD > 0.01%. The median relapse-free survivals (RFS) were significantly shorter (2.0 - 10.6 months) for the subgroups with MRD > 0.1% than for those with MRD between 0.01% and < 0.1% (31.3 months). Additional publications confirmed that patients in CR2 with MRD > 0.01% had a shorter event-free survival (EFS) than those with undetectable MRD (18 vs 7 months and 12 vs 2 months), but patients in CR3 had similar outcomes independent of MRD status (EFS 5 vs 6 months). Although the retrospective analyses appeared to confirm that patients with ALL in remission with MRD > 0.1% had a poor prognosis, all were confounded by the inclusion of patients with marrow remission but incomplete hematological recovery, which may not reflect a true CR.

BLA 125557 S-013 ODAC Briefing Document Blincyto
6
The primary efficacy endpoint of MT103-203 was complete MRD response (defined as absence of detectable MRD using an assay with a sensitivity < 0.01%) after 1 cycle. There were 116 patients treated with blinatumomab. From this group, FDA identified 87 patients in CR with baseline MRD > 0.1%, including 61 patients in CR1, 25 in CR2 and 1 in CR3. A complete MRD response was achieved by 69 patients (79%; 95% CI: 70%, 88%). The estimated median RFS was 22.3 months. Of note, for the patients in CR1 who achieved MRD <0.005% after treatment with blinatumomab, the median RFS was not reached, while for those who achieved MRD <0.01% but >0.005%, the median RFS was 5.2 months. In a safety database of 137 patients treated with blinatumomab for MRD+ ALL, the safety profile of blinatumomab was similar to that established in patients treated for relapsed or refractory ALL. Fatal adverse events occurred in 3 (2%) patients with MRD+ ALL, 91% had fever, 69% had a neurological toxicity, 7% had cytokine release syndrome, and 2% had sepsis. The meaningfulness of results of the primary efficacy endpoint analysis in MT103-203 was difficult to interpret, considering the lack of a control arm. The applicant provided a propensity score analysis for all patients in CR1 in MT103-203 and a subgroup of patients in CR1 from Study 20120148 to assess the impact of blinatumomab therapy on RFS. The difference in RFS by log-rank was significant (p<0.0001; median 35.2 months vs 8.3 months), but FDA could not confirm the estimate of the benefit of blinatumomab using this approach, since the results were confounded by lack of matching for covariates that would affect the RFS endpoint, inclusion of patients with incomplete hematologic recovery (not true CR), lack of patients in CR2 or CR3, lack of comparability between groups in the duration of follow-up, and confounding by unequal use of HSCT. FDA seeks input from the committee on whether the available data support the need for additional intensive therapy for patients with BCP ALL in remission with MRD > 0.1%. The committee discussion will also assist the FDA in determining whether a reduction in MRD of as little as 1 log, from > 0.1% to < 0.01%, is sufficiently meaningful to outweigh the risks of therapy with blinatumomab as determined on the basis of a single-arm trial. 2. MRD AS A BIOMARKER FOR ALL
2.1 MRD as a Biomarker
A biomarker is a "defined characteristic that is measured as an indicator of normal biological processes, pathogenic processes, or responses to an exposure or intervention, including therapeutic interventions. Molecular, histologic, radiographic, or physiologic characteristics are types of biomarkers."1 MRD is a biomarker. In their application, the applicant proposes to use MRD as a measure of tumor burden in patients with ALL. FDA's review focused in part on whether the aspects of the MRD assessment used for patient selection and response assessment (marrow vs blood sample, timing of sampling relative to therapy, threshold for calling positivity 1 FDA-NIH Biomarker Working Group (2016-). BEST (Biomarkers, EndpointS, and other Tools) Resource, Silver Spring (MD): Food and Drug Administration (US); Bethesda (MD): National Institutes of Health (US); Accessed at https://www.ncbi.nlm.nih.gov/books/NBK338448/

BLA 125557 S-013 ODAC Briefing Document Blincyto
7
or negativity, etc.) are valid for the purposes of characterizing the intended population and establishing clinical benefit. An assay is not a biomarker. Assays are used to detect or quantitate biomarkers. A single biomarker may be measurable using many types of assays. Optimally, the assays will be analytically-valid and yield the same results for measures of the subject biomarker. MRD has been quantitated using such technologies as flow cytometry and molecular assays (i.e., polymerase chain reaction or next generation sequencing). For the pivotal trial, the applicant used a molecular assay for MRD to select patients for the study and to assess the response to therapy with blinatumomab. The analytical validity of the assay used by the applicant has been reviewed separately and is not intended as a subject for discussion by the Advisory Committee.
2.2 MRD as a Prognostic Biomarker for ALL
For acute leukemias, complete remission (CR) is defined as < 5% blasts in the marrow, trilineage hematopoiesis, neutrophil recovery to ≥ 1 Gi/L, platelet recovery to ≥ 100 Gi/L, and absence of extramedullary disease. Extensive clinical data support the expectation that patients with ALL who achieve CR have a longer OS than those who do not achieve CR. Nonetheless, a substantial proportion of patients who achieve CR subsequently relapse, and the time to relapse is shorter with each subsequent remission. The applicant provided two lines of evidence, an analysis of patient-level data and a meta-analysis of the literature, to show that MRD can be used to identify the subgroup of patients with ALL in CR at highest risk of relapse and the criteria which would indicate a reduced risk of disease recurrence. 2.2.1 Study 20120148 The applicant submitted Study 20120148, a retrospective cohort study investigating the hematological relapse-free survival (RFS) and overall survival (OS) in adult patients with Ph-negative BCP ALL in hematological CR with MRD. The study population was assembled by submission of data from ALL study groups outside the US. All patients diagnosed with Ph-negative BCP ALL in year 2000 to present who were treated at participating study group facilities and who met the eligibility criteria were to be included in the study cohort. The patients were included in this study if MRD was detected at a level of ≥ 0.01% (1 x 10⁻⁴) by PCR or ≥ 0.1% (1 x 10⁻³) by flow cytometry after at least 3 intensive chemotherapy blocks on an adult protocol. Patients with MRD < 0.01% or undetectable were not included in the study cohort. The study group identified the cases for data extraction and submission. There was no independent verification of the data. Data were collected for 287 patients, of whom 284 were in CR1. Two patients were missing RFS outcomes, and 14 were missing baseline MRD measurements, so FDA included only 268 patients in the analysis. Table 1 shows the characteristics of the 268 patients in the analysis cohort. All patients had Ph-negative ALL.

BLA 125557 S-013 ODAC Briefing Document Blincyto
8
Table 1: Study 20120148 - Demographics and Baseline Disease Characteristics FDA Analysis Set
N = 268 n (%)
Sex • Female • Male
111 (41) 157 (57)
Age at diagnosis (years) • Median
(Range)
32.5 years
(15-65 years) CR number
• CR1 268 (100%) MRD status
• Persistent • Relapse • Unknown
215 (80) 51 (19) 2 (1)
MRD level at baseline • ≥ 10% • 1% - < 10% • 0.1% - < 1% • 0.01% - < 0.1%
15 (6) 70 (26) 108 (40) 75 (28)
MRD assay sensitivity • > 0.01% • 0.01%-0.001% • Unknown
48 (18) 218 (81)
2 (1) WBC at diagnosis
• ≥ 30 Gi/L • < 30 Gi/L • Unknown
71 (26) 196 (73) 1 (<1)
Allogeneic HSCT • No • Yes
146 (54) 122 (46)
Source: FDA analysis The primary endpoint was hematological RFS, defined as the time from the baseline MRD detection to the date of hematological relapse or death due to any cause. The secondary endpoint was OS, defined as the time from the baseline MRD detection date until death. Table 1 and Figure 1 below show FDA's results of the Kaplan-Meier analysis for the hematological RFS by MRD level at baseline for the 268 patients in the analysis cohort. For MRD below 0.1%, the median RFS was 31.3 months (95% CI: 13.6, 75.4). The subgroups with MRD > 0.1% have a clearly worse prognosis. Whether the RFS for patients with MRD 0.01%


BLA 125557 S-013 ODAC Briefing Document Blincyto
10
2.2.2 Published Meta-Analysis Berry et al (2017) performed a meta-analysis of 39 publications to quantify the relationship between MRD and EFS or OS for patients with ALL. The studies included a total of 13,637 patients. The methods for selection of the studies included in the meta-analysis, data extraction, and the statistical analyses are described in detail in the publication. Table 3 shows the characteristics of the 39 publications and the subgroup of 11 publications that were specifically identified as pertaining to B-cell ALL. Overall, the studies had a mix of age groups, presence or absence of the Ph chromosome, MRD measurement methodologies, timing of sampling for MRD measurements, and cut-off used to designate MRD-negativity. Whether the patients in the studies were in true CR or had a CR with incomplete hematologic recovery at the time of MRD measurement was not described in the publication. Additionally, the prior number of relapses was not reported. For the 11 studies specifically identified as pertaining to B-cell ALL, the majority included only pediatric patients, used PCR to measure MRD, used samples from end of induction, and used 0.01% as the cut-off to designate MRD-negativity.
Table 3: Published Meta-Analysis - Summary of Study Characteristics Characteristic All Studies Included B-Cell ALL Studies Number of Studies 39 11 Year Published 2000-2015 2007-2015 Number of Patients 13,637 5,209 Population Pediatric 20 51% 9 82% Adult 16 41% 2 18% Mixed 3 8% 0 0% MRD Method PCR 23 59% 7 64% FC 12 31% 4 36% Mixed 4 10% 0 0% MRD Timing Induction 24 62% 11 100% Consolidation 4 10% 0 0% Other 11 28% 0 0% MRD Cut-Off 0.01% 17 44% 7 64% 0.04% 1 3% 0 0% 0.05% 2 5% 0 0% 0.1% 15 38% 4 36% 0.5% 1 3% 0 0% 1% 2 5% 0 0% Missing 1 3% 0 0% Source: Berry et al. (2017) eTable 1.

BLA 125557 S-013 ODAC Briefing Document Blincyto
11
For the purposes of the analysis, the cut-off for grouping MRD-negativity was as defined in the individual studies. The authors reported that for all included studies, the EFS HRs for achieving MRD-negativity were 0.23 (95% Bayesian credible interval [BCI]: 0.18, 0.28) for pediatric patients and 0.28 (95% BCI: 0.24, 0.33) for adults. The OS HRs were 0.28 (95% BCI: 0.19, 0.41) for pediatric patients and 0.28 (95% BCI: 0.20, 0.39) for adults. They concluded that there was a strong association between MRD and clinical outcomes. For both EFS and OS, the association was similar when assessed by subgrouping according to presence of the Ph chromosome, MRD methodology, timing of sampling for MRD measurement, or cut-off used to designate MRD-negativity (Berry et al. 2017 eTable 2). Table 4 shows the results for the subgroup of studies identified as pertaining to B-cell ALL specifically. The HRs are consistent with a strong association between MRD-negativity and EFS or OS for the B-cell ALL studies.
Table 4: Published Meta-Analysis - Outcomes in the Subgroup of B-Cell ALL Studies Outcome Population Number of Studies HRa (95% BCI) EFS Pediatric 9 0.21 (0.14, 0.30) EFS Adult 2 0.28 (0.17, 0.46) OS Pediatric 2 0.18 (0.09, 0.38) OS Adult 0 - Source: Berry et al. (2017) eTable 2. a HR for MRD-negative vs. MRD-positive
Note that these are nonrandomized responder analyses, i.e., irrespective of treatment received, patients with MRD-negative disease have longer EFS and OS. Additionally, because the analysis included studies with different cut-offs to determine MRD-negativity (Table 3), the results do not address what level of MRD identifies the high-risk group or what level of MRD identifies the group with good long-term prognosis. Further, because the description of the patient population did not include whether patients were in CR1 or later, whether the patients had true CR or marrow remission with incomplete hematologic recovery, or how HSCT use was addressed, it is not clear to what population specifically these results would apply. 2.2.3 Additional Literature The applicant identified two additional relevant studies published after the selection of studies for the meta-analysis. • Lussana et al. (2016) assessed the outcomes for 65 adults with Ph-positive ALL in first
remission who had an MRD measurement prior to allogeneic stem cell transplantation (HSCT). MRD was measured by quantitative PCR for BCR-ABL. Patients were considered MRD-negative if they had >4-log reduction in or no detectable BCR-ABL. The patients who were considered MRD-negative had a significantly lower 5-year relapse rate (8% vs 39%), numerically higher 5-year DFS (58% vs 41%) and numerically higher OS (58% vs 49%).

BLA 125557 S-013 ODAC Briefing Document Blincyto
12
• Jabbour et al (2017) conducted a retrospective analysis of 78 adults with Ph-negative or -positive B-cell ALL who achieved remission after treatment with the first (n=46) or second (n=32) "salvage" therapy and who had MRD results available at the time of CR, CRi or CRp. Salvage treatment consisted of inotuzumab ozogamicin for 53%, chemotherapy + inotuzumab ozogamicin for 33%, and blinatumomab for 14%. MRD was measured by flow cytometry with a sensitivity < 0.01%. Within the median follow-up of 27 months, 38 patients had hematologic relapse/progression. For the patients treated with first "salvage" therapy, those with MRD-negative remission had a longer median EFS (18 vs 7 months), higher 2-year EFS (46% vs 17%), longer median OS (27 vs 9 months) and higher 2-year OS (52% vs 36%). For the patients treated with second "salvage" therapy, there was no difference by MRD level at remission for median EFS (5 vs 6 months), 2-year EFS (7% vs 7%), median OS (7 vs 10 months) or 2-year OS (20% vs 15%). The authors concluded that patients who achieved remission following second "salvage" therapy had poor outcomes regardless of their MRD status.
FDA also identified an additional publication addressing MRD in CR2: • Saygin et al. (2018) evaluated retrospectively 106 adults with ALL who achieved second
CR/CRp/CRi. They showed in a multivariable Cox regression analysis that failure to achieve MRD-negativity in CR2 (defined as undetectable in an assay with sensitivity of 0.01-0.001%) resulted in an RFS hazard ratio of 3.36 (95% CI: 1.36-8.64, p=0.009). The median RFS for patients who achieved MRD-negativity was 12 months compared with 2 months in patients who remained MRD-positive. Patients who achieved only CRp or CRi had an inferior prognosis in comparison to those who achieved CR.
Available evidence suggest that there is improvement in EFS and a reduction in relapse for patients in remission with MRD-positivity prior to undergoing HSCT (Eckert et al. 2013), but the applicant identified no other systematic studies which tested the effect of additional intensive therapy for patients with BCP ALL in first or second remission with MRD-positivity after treatment with induction and consolidation (at least 3 blocks total) chemotherapy.
2.3 Summary of Issues Regarding MRD as a Biomarker for ALL
Despite its flaws, Study 20120148 provided substantial evidence that patients with ALL in CR1 with MRD > 0.1% have a poor prognosis. The available literature suggests that this is true for patients with ALL in CR2 as well, but those in CR3 all have a poor prognosis independent of MRD. Consequently, the applicant's use of MRD > 0.1% to select patients with poor prognosis appears to be supported by the available data showing median RFS less than 12 months. This is not to say that patients with MRD 0.01% - <0.1% do not have a poor prognosis; Study 20120148 did not include patients with MRD <0.01%, so the relative prognosis for those with MRD 0.01% - <0.1% could not be established simply due to lack of data for evaluation. It should be noted, however, that although the available information shows a strong correlation between MRD and outcome for patients with ALL in CR1 or CR2, including those with B-cell

BLA 125557 S-013 ODAC Briefing Document Blincyto
13
ALL and Ph-positive ALL, this is not sufficient to validate MRD <0.01% as a surrogate for clinical benefit in the intended population specifically. Most studies that proposed to establish MRD-negativity as a clinical endpoint were based on responder analyses (i.e. MRD-responder vs. MRD-nonresponder), which has inherent deficiencies. Currently, there are no meta-analysis results that demonstrate both trial-level and patient-level surrogacy of MRD for RFS or OS. Moreover, there are no studies that provide evidence to support the assertion that conversion from MRD-positive after 3 blocks of intensive chemotherapy to MRD-negative with additional treatment other than HSCT is even reasonably likely to predict clinical benefit. Hence, some demonstration of improvement in a long-term outcome is needed to establish the meaningfulness of MRD conversion. 3. BLINATUMOMAB FOR TREATMENT OF MRD-POSITIVE ALL
3.1 Clinical Trials/Studies Used In The Review
The FDA review was based on data from MT103-203 (the pivotal trial), MT103-202, and 20120148 (historical data), and FDA’s review of the literature. A propensity score analysis was conducted to evaluate the results of MT103-203 in comparison to the historical data from Study 20120148. The clinical studies are described in detail in Amgen’s briefing document. The sections below provide a brief overview for reference for the efficacy analyses. 3.1.1 MT103-203 Study MT103-203 was a multicenter, open-label, single-arm trial of blinatumomab in patients with BCP ALL with <5% blasts in bone marrow, ANC ≥ 1 Gi/L, platelets ≥ 50 Gi/L and MRD-positive after at least 3 intensive chemotherapy blocks. MRD-positivity was defined as ≥ 0.1% in an assay with a minimum sensitivity of 0.01% after at least 2 weeks from last systemic chemotherapy. Treatment consisted of up to 4 cycles of blinatumomab at 15 mcg/m2/day over 4 weeks followed by a two-week treatment-free period, and patients were followed until death or 5 years from the start of treatment. The primary objective of the study was to evaluate the ability of blinatumomab to induce complete MRD response. The primary endpoint for this objective was the proportion of patients who achieved complete MRD response defined as absence of MRD after one cycle of treatment with blinatumomab. The key secondary endpoint was hematologic RFS rate at 18 months from the start of blinatumomab (evaluated only in Ph-negative patients who did not undergo HSCT within 18 months of initial treatment with blinatumomab). 3.1.2 Propensity Score Analysis The pivotal study MT103-203 was a single-arm study design, which does not directly evaluate the effect of blinatumomab relative to clinical outcomes for untreated patients. In order to better understand the blinatumomab treatment effect with respect to RFS and OS among adult patients with MRD-positive BCP ALL, a propensity score analysis was conducted. Propensity score

BLA 125557 S-013 ODAC Briefing Document Blincyto
14
matching in observational data is a statistical matching technique that attempts to estimate the effect of treatment by accounting for the covariates that predict the likelihood of receiving the treatment. The propensity score attempts to reduce the bias due to confounding variables that could be found in an estimate of the treatment effect obtained from simply comparing outcome among the subjects that received the treatment versus those that did not. The Stabilized Inverse Probability Treatment Weight (sIPTW) approach for propensity score covariate adjustment was used in the analysis. In order to adjust for the potential instability caused by large weights, stabilized weights was considered whereby IPTW is multiplied by the marginal probability of receiving the actual treatment (Cole and Hernan 2004). To mimic the results from a randomized study, the average treatment effect (ATE) was estimated. The controls were selected from the Study 20120148 cohort. The selected controls were required to have characteristics that corresponded with subjects enrolled in the MT103-203. This Direct Comparison Analysis Set (DCAS) was comprised of adults (≥18 years old) in CR1, with MRD levels ≥ 0.1%, and time to treatment relapse from date of MRD detection of >14 days. The primary objective of this analysis was to compare blinatumomab patients from the MT103-203 study to those from the historical controls in Study 20120148 with respect to RFS after making adjustments for each study patient’s propensity score and controlling for HSCT. The primary null hypothesis tested for this analysis was that blinatumomab has no effect on RFS as compared to historical controls when controlling for HSCT. The alternative hypothesis was that blinatumomab has an effect on RFS when controlling for HSCT. The secondary objective of this analysis was to compare blinatumomab patients from the MT103-203 study to those from the Study 20120148 with respect to OS after making adjustments from each study patient’s propensity score and controlling for HSCT. 3.1.3 MT103-202 Study MT103-202 was an exploratory, proof-of-concept, multicenter, open-label, single-arm trial of blinatumomab for patients ≥ 18 years old in first complete hematologic remission with MRD-positive B-cell ALL (defined as quantifiable MRD level ≥ 0.01% any time after established standard induction or consolidation therapy for ALL). The primary endpoint was MRD response, defined as target MRD response genes (BCR/ABL or t[4;11]) below the detection limit and/or individual rearrangements of immunoglobulin or TCR genes below 0.01% within 4 cycles of treatment. Twenty-one patients were enrolled, and 20 completed at least one cycle of blinatumomab and had at least 1 available MRD response assessment. The results of MT103-202 were used largely in the analysis of safety of blinatumomab in the MRD+ population.
3.2 Efficacy
3.2.1 MT103-203 MT103-203 enrolled 211 patients, 116 patients received at least one infusion of blinatumomab, and the 113 were confirmed to have an eligible MRD measurement. The last subgroup

BLA 125557 S-013 ODAC Briefing Document Blincyto
15
comprised the applicant's primary endpoint full analysis set (PE FAS). FDA determined that of the 116 treated patients, only 87 were in true CR and had an MRD assay that met the required assay sensitivity or MRD level cut-offs. These 87 patients comprised the FDA efficacy analysis set. Table 5 shows the demographics and baseline disease characteristics of the applicant's and the FDA's analysis populations.
Table 5: MT103-203 - Demographics and Baseline Disease Characteristics Applicant's Primary Endpoint
Full Analysis Set N = 113 n (%)
FDA Efficacy Analysis Set
N=87 n (%)
Sex • Female • Male
46 (41) 67 (59)
36 (41) 51 (59)
Age • Median • (Range)
45 years
(18-76 years)
42 years
(18-76 years) Race
• White • Asian • Other (mixed) • Unknown
99 (88) 1 (1) 1 (1)
12 (11)
76 (87) 1 (1)
0 10 (9)
Disease Status • CR1 • CR2 • CR3 • CRi
68 (60) 30 (27) 1 (1)
14 (12)
61 (70) 25 (29) 1 (1)
0 MRD at baseline (central lab)
• > 10% • 1% - < 10% • 0.1% - < 1% • < 0.1% • Below LLOQ • Not quantifiable
9 (8) 44 (39) 51 (45) 3 (3) 5 (4) 1 (1)
7 (8) 35 (40) 45 (52)
0 0 0
Best MRD assay sensitivity • 0.01% • 0.005% • 0.001%
8 (7)
20 (18) 85 (75)
7 (8)
13 (15) 67 (77)
HSCT within 18 months of blinatumomab start
• No • Yes
26 (23) 87 (77)
18 (21) 69 (79)

BLA 125557 S-013 ODAC Briefing Document Blincyto
16
Table 5: MT103-203 - Demographics and Baseline Disease Characteristics Applicant's Primary Endpoint
Full Analysis Set N = 113 n (%)
FDA Efficacy Analysis Set
N=87 n (%)
WBC at diagnosis • > 30 Gi/L • ≤ 30 Gi/L • Unknown
18 (16) 76 (67) 19 (17)
14 (16) 57 (66) 16 (18)
Philadelphia chromosome • Positive • Negative
5 (4)
108 (96)
0
87 (100) Source: FDA analysis
Primary Efficacy Endpoint: Complete MRD Response The primary efficacy endpoint was complete MRD response within the first cycle. The results of FDA's analysis of the primary endpoint are shown in Table 6. Using protocol prespecified PE FAS, there were 88 (77.9%; 95% CI: 69.1% , 85.1%) subjects who achieved MRD complete response within the first cycle. The MRD response rate was greater than 44%, the prespecified null hypothesis threshold. The median time to MRD response was 29.0 days (range: 5 to 71 days). These results were consistent with those from applicant’s analyses. Using the FDA efficacy analysis set, 79.3% of patients achieved a complete MRD response within the first cycle (Table 6).
Table 6: MT103-203 - Summary of MRD Response at Cycle 1 Applicant's Primary Endpoint
Full Analysis Set N = 113 n (%)
FDA Efficacy Analysis Set
N=87 n (%)
Response n(%)(95%CI) Complete response (95% CI) Non-response (95% CI)
88 (77.9%)
(69.1%,85.1%)
25 (22.1%) (14.9, 30.9)
69 (79.3%)
(70.4%, 87.6%)
18 (20.6%) (12.4, 29.6)
Source: FDA analysis In addition, the primary endpoint of complete MRD response was analyzed by demographics and baseline characteristics. In general, consistent results of complete MRD responses were demonstrated across subgroups, confirming the results reported by the applicant. Also, FDA noted that approximately 45% of the MRD-responders underwent HSCT compared with 15% in MRD-nonresponders. However, due to the small sample sizes, a quantitative interaction of MRD response status and HSCT was not found.

BLA 125557 S-013 ODAC Briefing Document Blincyto
17
Key Secondary Efficacy Endpoint: Hematological RFS The key secondary endpoint was the hematological RFS rate in all subjects with Ph-negative ALL, censoring at either HSCT or post-blinatumomab salvage chemotherapy. The timing of the secondary analysis was based on all patients who had at least 18 months of follow-up for RFS (without death or relapse prior to that point). Table 7 shows the results of FDA's analysis of hematological RFS. In the PE FAS, 21 (19.1%) subjects had a hematologic RFS event (hematological relapse, secondary leukemia or death). The survival rate estimate based on analysis of 18-month hematological RFS, censored at HSCT or post-blinatumomab salvage chemotherapy, was 54% with 95% CI: of (33%, 70%). The lower bound excluded the null hypothesis of 28%, the prespecified threshold. The median RFS was not estimable. Using the FDA efficacy analysis set, the 18-month RFS was 56%, and the estimated median RFS was 22.3 months (Table 7).
Table 7: MT103-203 - Summary of Secondary Efficacy Endpoint Hematological RFS Applicant
Censored at HSCT or Post- Blinatumomab
Salvage Therapy N=110
FDAa Censored at
HSCT or Post-Blinatumomab
Salvage Therapy N=87
FDAa Not Censored at HSCT or Post-Blinatumomab
Salvage Therapy N=87
Number of events Relapse Secondary leukemia Death
21 (19.1%) 18 (16.4%) 1 (0.9%) 2 (1.8%)
15 (17.2%) 14 (16.1%)
1 (1.2%)
47 (54.0%) 29 (33.3%)
18 (20.7%)
KM estimates (95% CI) 18-month RFS Median RFS (month)
53.6%
(33.1%, 70.3%)
NA (6.3, NA)
59.3%
(35.6%, 76.8%)
NA (6.3, NA)
58.5%
(47.4%, 68.0%)
22.3 (15.0, NA)
aSource: FDA analysis The estimated median RFS time in first CR at the time of treatment with blinatumomab was 25.6 months (95% CI: 18.7, NA), the median RFS time in the second or third CR was 11.0 months (95% CI: 6.8, 15.4). Subjects in the first CR had numerically longer RFS time than those in the second or third CR. The estimated median RFS time was 23.6 months (95% CI: 17.4-NA) for patients with a complete MRD response and 5.7 month (95% CI: 1.6-13.6) for the MRD-nonresponders. The result demonstrated that MRD complete responders had numerically longer RFS time than those

BLA 125557 S-013 ODAC Briefing Document Blincyto
18
of MRD nonresponder subjects. RFS analysis by MRD response status censored at HSCT or post blinatumomab salvage chemotherapy was also performed using Kaplan-Meier (KM) analysis. The results demonstrated that patients with complete MRD response appear to have longer RFS.
Table 8: MT103-203 - Summary of Hematological RFS n RFS events
n(%) Censors n(%)
Median Survival (months) (95% CI)
RFS (not censored at HSCT or post-blinatumomab chemotherapy) In 1st CR In 2nd or 3rd CR
110 75 35
62 (56.4%) 36 (48%) 26 (74.3%)
48 (43.6%) 39 (52%) 9 (25.7%)
18.9 (12.3, 35.2) 24.6 (18.7, NA) 11.0 (6.8, 15.4)
RFS by MRD response at cycle 1(landmark analysis from day 45; not censored at HSCT or post-blinatumomab chemotherapy) MRD complete responder MRD nonresponder
85 15
40 (47.1%) 12 (80.0%)
45 (52.9%) 3 (20.0%)
23.6 (17.4, NA) 5.7 (1.6, 13.6)
RFS beginning at HSCT 74 38 (51.4%) 36 (48.6%) 20.9 (14.6, NA) Source: FDA analysis FDA conducted an additional subgroup analysis in the patients who achieved MRD < 0.01% using an assay with sensitivity < 0.01% or less. Of the 61 patients in true CR1, 53 patients had a best Cycle 1 MRD of <0.01% in an assay with a sensitivity of 0.001-0.005%. This included 48 patients who were determined to have MRD complete response, and 5 patients who were MRD-nonresponders (i.e. detectable residual MRD below the lower limit of quantitation). Median RFS was not reached (95% CI: 22.6, NR) for the patients who achieved an MRD complete response with an assay sensitivity of 0.001% or 0.005% compared with a median RFS of 5.2 months (95% CI: 0.4, NR) for the patients with MRD that was detectable but <0.01%, suggesting that the greatest RFS advantage was in the patients who achieved MRD of 0.005% or less. For the patients in CR2 from MT103-203, median RFS was 11.7 months (95% CI: 5.8, 18.6). There were too few controls available to allow a meaningful comparison to patients in CR2 not treated with blinatumomab. 3.2.2 Propensity Score Analysis In order to align two datasets (study MT103-203 and historical control Study 20120148), several criteria were implemented to create the Direct Comparison Analysis Set (DCAS) (see Appendix 2). The DCAS was comprised of adults (≥ 18 years old) in CR1 with MRD levels ≥ 0.1% in Study 20120148. Subjects in Study 20120148 included only patients with time to relapse >14 days from MRD detection, but it was noted that 14 days was the median time

BLA 125557 S-013 ODAC Briefing Document Blincyto
19
between the MRD assay and initiation of blinatumomab in Study MT103-203. Adding a criterion of minimal 14 days between MRD measurement and start of blinatumomab further reduced the sample size from Study MT103-203 from n=113 in PE FAS to n=73 in the Primary Analysis Set (33% reduction). The demographics and baseline characteristics of the patients in the propensity score analysis are shown in Table 9.
Table 9: Propensity Score Analysis – Demographics and Baseline Disease Characteristics 20120148
DCAS N=182 n (%)
MT103-203 CR1 Subset
N=73 n (%)
Country • Germany • Other
70 (38) 112 (62)
35 (48) 38 (52)
Sex • Female • Male
102 (56) 80 (44)
41 (56) 32 (44)
Age at MRD • Median
(Range)
32.5 years
(18-65 years)
46 years
(18-76 years) MRD at baseline
• >10% • 1% - < 10% • 0.1% - < 1% • 0.01% - < 0.1% • Unknown
13 (7)
56 (36) 113 (58)
0 0
3 (4)
25 (34) 38 (52) 6 (8) 1 (1)
Time from diagnosis to baseline MRD
• Median (Range)
8 months
(1-60 months)
6 months
(2-67 months) WBC at diagnosis
• >30 Gi/L • ≤30 Gi/L • Unknown
51 (28) 130 (71)
1 (1)
13 (18) 51 (70) 9 (12)
t(4;11) MLL-AF4 mutation • No/Unknown • Yes
167 (92) 15 (8)
68 (93) 5 (7)
Prior therapy GMALL protocol
• No • Yes
106 (58) 76 (42)
31 (42) 42 (58)
Source: FDA analysis

BLA 125557 S-013 ODAC Briefing Document Blincyto
20
Balance between the two treatment groups (MT103-203 patients and 20120148 patients) with respect to their propensity score was assessed via box plots (Figure 2).
Figure 2: Box-Plot of Propensity Score by Treatment Group
Source: FDA analysis FDA noted that there is difference in the distribution of propensity scores between groups from Figure 2. A stabilized inverse probability weighting scheme was implemented to improve the comparability of the covariates between groups. Before and after adjustment with stabilized IPTW from propensity score model fitted values, the standardized mean difference for each potential prognostic factors are presented (see Appendix 3). Since majority of the standardized mean difference are less than 0.25 (Rubin, 2001; Stuart, 2010), the propensity score analysis appear reasonable to adjust for imbalance of covariates (that can be observed) between groups. Evaluation of Group Difference on RFS Analyses of RFS were conducted using the Kaplan-Meier plots as well as Cox regression, by including a weight factor, i.e. stabilized IPTW (Inverse Probability Treatment Weight), calculated based on the propensity score for each patient. The median follow up time for blinatumomab group was 18 months. The median follow up time for control group was 8 months. Figure 3 below shows the Kaplan-Meier plot of RFS with propensity score weighted analyses. The estimated median RFS time was 35.18 months (95% CI: 24.16, NE) for the blinatumomab group and 8.30 months (95% CI: 6.23, 11.90) for the control group. The Kaplan-Meier curves demonstrate a separation between the two treatment groups in RFS over time. However, the

BLA 125557 S-013 ODAC Briefing Document Blincyto
21
CR/CRi status of patients in the DCAS is unknown. Therefore, it is not possible to determine whether the difference in outcome may be due to treatment or if inferior RFS in the DCAS group was due to an imbalance in patients in CRi, who are known to have poor outcomes.
Figure 3: Kaplan Meier Curve of RFS with Propensity-Score Adjustment
Source: FDA analysis Figure 4 below shows the Kaplan-Meier plot of RFS with propensity score weighted analysis after HSCT (analysis time defined from HSCT to RFS). The estimated median RFS time was not reached for blinatumomab group with the limited follow up, and 34.16 months (95% CI: 18.26, NE) for the control group. The Kaplan-Meier curves overlap over time demonstrating there is no difference between the two treatment groups.

BLA 125557 S-013 ODAC Briefing Document Blincyto
22
Figure 4: Kaplan Meier Curve of RFS After HSCT with Propensity-Score Adjustment
Source: FDA analysis
Evaluation of Group Difference on OS Figure 5 shows the Kaplan-Meier plot of OS with propensity score weighted analysis between the two treatment groups unadjusted for HSCT. The estimated median OS time was 36.49 months (95% CI: 24.16, NE) for the blinatumomab group, and 27.21 months (95% CI: 16.36, 38.59) for the control group. Figure 5: Kaplan Meier Curve of OS with Propensity-Score Adjustment
Source: FDA analysis

BLA 125557 S-013 ODAC Briefing Document Blincyto
23
Figure 6 shows the Kaplan-Meier plot of OS with propensity score weighted analysis between the two treatment groups after HSCT (analysis time defined from HSCT to RFS ). The estimated median OS time was 76.1 months (95% CI: 26.23, NE) for the blinatumomab group and 30.59 months (95% CI: 22.45, NE) for the control group. The Kaplan-Meier curves overlap over time demonstrating there is no difference between two treatment groups.
Figure 6: Kaplan Meier Curve of OS After HSCT with Propensity-Score Adjustment
Source: FDA analysis Evaluation of the impact of HSCT on RFS and OS FDA noted that 78% (57/73) and 44% (80/182) of patients underwent HSCT in the MT103-203 and control arms, respectively. Such difference in HSCT rate should be considered when interpreting the results of the propensity score analysis. Figure 3 shows that when no adjustment for HSCT was made, there is a separation between two curves for RFS. However, when HSCT was adjusted for (KM was plotted based on time from HSCT to relapse or deaths), the separation of curves disappears (see Figure 4). Similar results are observed for OS analyses (see Figures 5 and 6). These two graphs demonstrated potential confounding of HSCT on the group comparison. Such confounding was further demonstrated by the significant study group by HSCT interaction when HSCT was defined as a time-dependent covariate based on the Cox proportional hazards model (including study group, HSCT and HSCT by study group interaction in the model) for both RFS and OS endpoints. Hazard ratio estimates for each HSCT status based on RFS and OS are summarized in Table 10. The results demonstrate smaller HRs when no HSCT was performed, and larger HRs with

BLA 125557 S-013 ODAC Briefing Document Blincyto
24
HSCT. Due to the differential effect of HSCT on RFS (or OS), interpretation of the results of RFS and OS ignoring the group by HSCT interaction would not be appropriate.
Table 10: Propensity Score Analysis - Hazard Ratio (HR) Estimates for Evaluation of Treatment by HSCT Interaction Using sIPTW weighted Cox’s PH Model Endpoint
HSCT
HR (95% CI) (MT103-203 vs control)
RFS No HSCT 0.27 (.14, .52)
HSCT 0.90 (0.53, 1.53)
OS No HSCT 0.61 (0.40, 0.94)
HSCT 1.62 (0.61, 4.3)
The nominal p-value associated the interaction was <0.01 from the RFS analysis and ~0.07 from the OS analysis. Source: FDA analysis The above analyses were based on simplified scenarios without adjusting for any other potential prognostic factors/confounding. Also, the historical data do not allow for detailed evaluation of the effect of HSCT on RFS (or OS). It is not clear whether the lack of effect of blinatumomab on RFS (or worsen effect on OS) with HSCT was due to disease-related events or transplant-related mortality. Nevertheless, the analyses demonstrated the impact of the confounding effect from HSCT. Based on the analyses, FDA cannot confirm whether or not there is additional benefit for HSCT after blinatumomab. While on average, treatment with blinatumomab may show improvement in RFS, the actual effect of blinatumomab is difficult to estimate in the presence of the confounding effect from HSCT. Propensity Score Sensitivity Analyses In addition, a log-rank test stratified by quintiles (or quartiles) of propensity scores was performed. Without HSCT adjustment, the two treatment groups demonstrate the difference in RFS and OS using propensity score stratified log-rank test. There was no difference between the two treatment groups in RFS and OS analyses of propensity score with adjustment for HSCT. These sensitivity analyses further confirm the earlier results with or without adjustment for HSCT. There are major limitations in the propensity score analyses and in the interpretation of propensity score analysis results:
1. The study was not designed based on testing differences in RFS and OS. 2. While the propensity score analysis may appear to balance the covariates that can be
observed between groups, the analysis does not have the ability to create a balance between treatment groups with respect unmeasured and unknown covariates. If important unmeasured or unknown covariates are omitted, the propensity score method is known to yield biased estimates.
BLA 125557 S-013 ODAC Briefing Document Blincyto
25
3. Furthermore, due to the small sample size, the comparability between group after propensity score weighted analyses is not clear.
4. The follow up time between blinatumomab group and historical control group is not comparable.
5. There are potential limitations with respect to the completeness and quality of the historical data.
The analysis was based on a subgroup of patients (e.g. CR1 only; the sample size was reduced from n=113 in Prim EP FAS to n=73 [33% reduction] from Study 203). Due to this subgroup nature of the direct comparison analysis set, whether the results of these analyses represent the effect size for a broader population is not clear. The interpretation of the results are complicated further by the presence of HSCT and potentially different clinical practice between the clinical trial and historical control groups. In the presence of the confounding and time-dependent effect of HSCT and the issues of propensity score analyses, the actual benefit of blinatumomab is difficult to estimate.
3.3 Safety
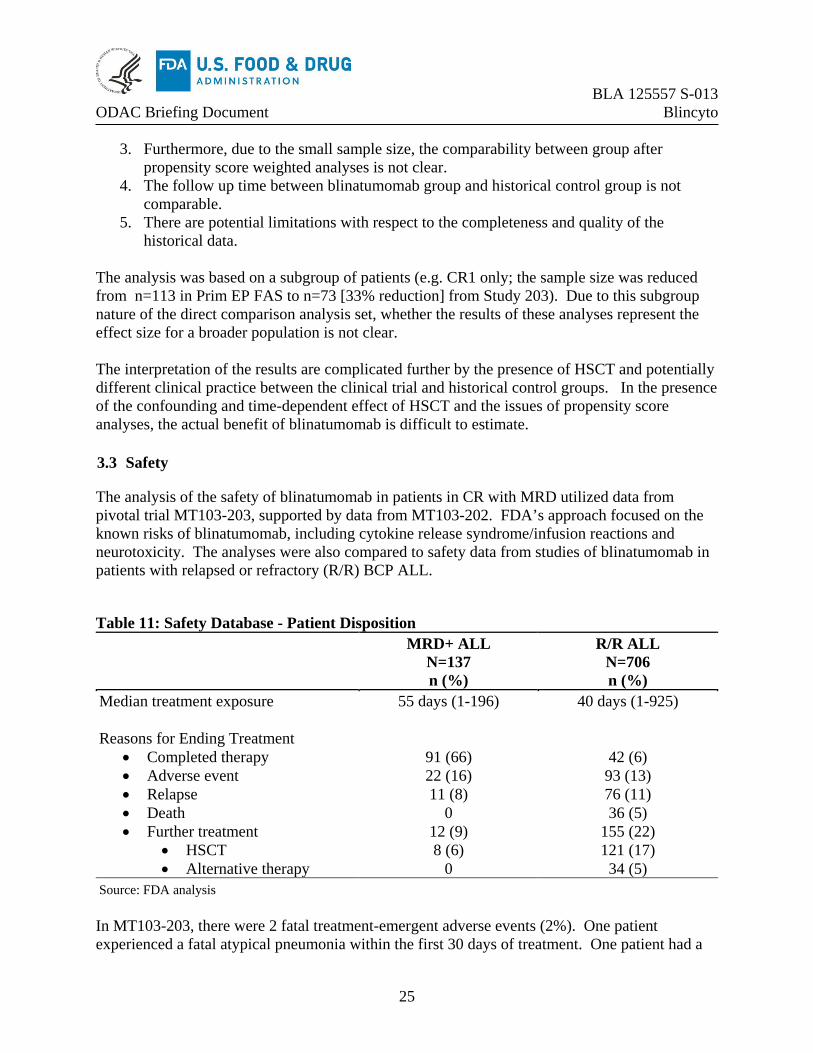
The analysis of the safety of blinatumomab in patients in CR with MRD utilized data from pivotal trial MT103-203, supported by data from MT103-202. FDA’s approach focused on the known risks of blinatumomab, including cytokine release syndrome/infusion reactions and neurotoxicity. The analyses were also compared to safety data from studies of blinatumomab in patients with relapsed or refractory (R/R) BCP ALL.
Table 11: Safety Database - Patient Disposition MRD+ ALL
N=137 n (%)
R/R ALL N=706 n (%)
Median treatment exposure Reasons for Ending Treatment
• Completed therapy • Adverse event • Relapse • Death • Further treatment
• HSCT • Alternative therapy
55 days (1-196)
91 (66) 22 (16) 11 (8)
0 12 (9) 8 (6)
0
40 days (1-925)
42 (6) 93 (13) 76 (11) 36 (5)
155 (22) 121 (17) 34 (5)
Source: FDA analysis In MT103-203, there were 2 fatal treatment-emergent adverse events (2%). One patient experienced a fatal atypical pneumonia within the first 30 days of treatment. One patient had a

BLA 125557 S-013 ODAC Briefing Document Blincyto
26
subdural hemorrhage at the site of a prior hemorrhage within 30 days of the last dose of blinatumomab. In MT103-202, 1 patient died due to sepsis. Permanent discontinuation and treatment interruptions due to AEs occurred in a similar proportion of patients in the MRD+ and R/R ALL groups. The most common AEs leading to discontinuation of treatment were neurological toxicities. The most common AEs requiring treatment interruption were cytokine release/infusion reactions and related clinical manifestations as well as neurological toxicities. The most common TEAE resulting in permanent discontinuation or treatment interruption of blinatumomab are shown in Table 12. The table includes only those events that occurred in >2% of subjects in either group.
Table 12: Safety Database - TEAE Resulting In Treatment Withdrawal Or Interruption TEAEa
MRD+ ALL N=137 n (%)
R/R ALL N=706 n (%)
TEAE with withdrawal • Seizure • Encephalopathy • Tremor • Dysphasia
TEAE with interruption
• Pyrexia • Overdose • Tremor • Aphasia • Hypertransaminasemia • Arrhythmia • Hypotension • Encephalopathy • Chills • Hypotension • Cytokine release/infusion reaction • Neutropenia • Seizure • Sepsis
23 (17) 6 (4) 5 (4) 5 (4) 3 (2)
39 (28) 9 (6) 4 (3) 5 (4) 4 (3) 4 (3) 4 (3) 3 (2) 4 (3) 3 (2) 2 (1) 3 (2)
0 0 0
100 (14) 4 (1) 13 (2) 3 (<1) 3 (<1)
216 (31) 21 (3) 5 (1) 11 (2) 6 (1) 6 (1) 7 (1)
3 (<1) 20 (3) 4 (<1) 3 (<1) 20 (3) 15 (2) 16 (2) 17 (2)
aIncludes grouped terms Source: FDA analysis AEs of particular interest with exposure to blinatumomab included fever, sepsis, cytokine release syndrome and neurotoxicities (Table 14).

BLA 125557 S-013 ODAC Briefing Document Blincyto
27
Table 13: Safety Database - Adverse Events of Special Interest Any Grade Grade ≥ 3 Adverse Event of Special Interesta
MRD+ ALL N=137 n (%)
R/R ALL N=706 n (%)
MRD+ ALL N=137 n (%)
R/R ALL N=706 n (%)
Any AE 137 (100) 705 (100) 90 (66) 604 (86) Fever 125 (91) 463 (66) 9 (7) 73 (10) Nervous System Disordersb 95 (69) 404 (57) 20 (15) 91 (13)
• Tremor 43 (31) 92 (13) 6 (4) 5 (1) • Seizure 6 (4) 25 (4) 5 (4) 9 (1) • Headache 55 (40) 227 (32) 5 (4) 16 (2) • Encephalopathy 14 (10) 89 (13) 6 (4) 30 (4) • Neurotoxicity 0 13 (2) 0 5 (1)
Sepsis 3 (2) 97 (14) 2 (1) 87 (12) Cytokine release/infusion reaction
9 (7) 103 (15) 4 (3) 24 (3)
aIncludes grouped terms bSystem Organ Class Source: FDA analysis Cytokine release syndrome, infusion reactions and capillary leak syndrome are difficult to distinguish as the clinical manifestations and timing overlap. FDA incorporated reports of AEs including capillary leak syndrome, cytokine release syndrome, and infusion related reaction for the safety analysis (see Appendix 3 for the list of grouped terms). Using this grouped term, 9 (7%) patients in the MRD+ ALL group developed any grade cytokine release/infusion reactions compared with 103 (15%) of R/R ALL patients. There were no fatal cytokine release/infusion reaction events in the MRD+ ALL population. In the MRD+ ALL group, 95 (69%) patients developed a neurological toxicity. The most common event terms were headache (40%), tremor (29%), insomnia (17%), aphasia (12%), and dizziness (10%). Fifteen percent of patients experienced a Grade ≥ 3 neurotoxicity. The most common Grade ≥ 3 neurotoxicities were tremor (4%), headache (4%), encephalopathy (4%), and seizure (4%). Aphasia tended to occur in the first week of treatment and usually resolved within 2 days. There were no fatal neurological events in the MRD+ ALL population, and all events resolved with treatment discontinuation, or interruption and supportive care. In comparison, 57% of patients in the R/R population developed a neurological toxicity. Nearly all patients (91%) in the MRD+ ALL population developed fever, but the incidence of Grade ≥ 3 fever was relatively low (7%). The incidence of sepsis (2%) was also relatively low in the MRD+ ALL population.

BLA 125557 S-013 ODAC Briefing Document Blincyto
28
3.4 Summary of Study MT103-203 Results and Issues
For the 87 patients with ALL in CR with MRD > 0.1% in Study MT103-203, FDA found that 79% (95% CI: (70%, 88%) converted to MRD below the limit of detection of the assay. The meaningfulness of the MRD conversion rate is unclear, since the long-term benefit of MRD reduction with salvage after 3 blocks of intensive chemotherapy is not established. The applicant also provided data for RFS, a longer-term outcome, and FDA calculated the estimated median RFS as 22.3 months for the patients in MT103-203. However, this time-to-event endpoint is difficult to interpret in a single-arm trial with a heterogenous population. In this case in particular, the patients in CR2 or CR3 had a shorter RFS than those in CR1. To add context, the applicant also submitted a propensity score analysis comparing RFS and OS for patients in CR1 in MT103-203 to historical control cases from Study 20120148. FDA's analysis of the propensity score data confirmed a significant difference in RFS for the patients on MT103-203. Whether this difference might be explained by the inclusion of poorer-risk patients in CRi in the controls could not be determined from the available data. Moreover, several factors as described in the section above limited the interpretability of the propensity score analysis. Lastly, the analysis was limited to patients in CR1, and it is not known whether the results would apply to patients in CR2 or later. With regard to safety, it was noteworthy that fatal adverse event occurred in 2% of the patients treated with blinatumomab for MRD-positivity. The safety profile of blinatumomab in this patient population was similar to that established for those treated for R/R ALL. The incidence of cytokine release syndrome was 7%, and the incidence of neurotoxicity was 69%. The rate of sepsis was lower in the patients treated for MRD than for R/R ALL (2% vs 14%). The safety profile may be acceptable for the MRD-positive population, but the risks of neurotoxicity and CRS remain. 4. CONCLUSIONS
The applicant is seeking an indication for use of blinatumomab to treat patients with BCP ALL with MRD > 0.1% after intensive chemotherapy. The data from Study 20120148, the historical control study, in addition to information from the literature, support the assertion that such patients have a poor prognosis (median RFS < 12 months). The results of MT103-203 showed that when treated with blinatumomab, 79% of the MRD-positive patients converted to MRD-negativity using an assay with sensitivity > 0.01%, and the estimated median RFS was 22.3 months. Although there were 2% treatment-related fatalities in the patients treated with blinatumomab, the safety profile was no worse than that established in the patients with R/R ALL. A propensity score analysis demonstrated that the RFS with blinatumomab was significantly greater than in the historical controls, but several flaws in the analysis were identified. FDA therefore seeks ODAC's advice on whether the efficacy outcomes as demonstrated in MT103-203 outweigh the potential risks from treatment with blinatumomab for patients with MRD-positive ALL.

BLA 125557 S-013 ODAC Briefing Document Blincyto
29
5. REFERENCES
Berry DA, Zhou S, Higley H, et al. (2017) Association of minimal residual disease with clinical outcome in pediatric and adult acute lymphoblastic leukemia: a meta-analysis. JAMA Oncol 3:e170580. Cole SR, Hernán MA (2004) Adjusted survival curves with inverse probability weights. Comput Methods Programs Biomed 75:45-49. Eckert C, Henze G, Seeger K, et al. (2013) Use of allogeneic hematopoietic stem-cell transplantation based on minimal residual disease response improves outcomes for children with relapsed acute lymphoblastic leukemia in the intermediate-risk group. J Clin Oncol 31:2736-2742. Jabbour E, Short NJ, Jorgensen JL, et al. (2017) Differential impact of minimal residual disease negativity according to the salvage status in patients with relapsed/refractory B-cell9 acute lymphoblastic leukemia. Cancer 123:294-302. Lussana F, Intermesoli T, Gianni F, et al. (2016) Achieving molecular remission before allogeneic stem cell transplantation in adult patients with Philadelphia chromosome-positive acute lymphoblastic leukemia: impact on relapse and long-term outcome. Biol Blood Marrow Transplant 22:1983-1987. Rubin DB. (2001) Using propensity scores to help design observational studies: Application to the tobacco litigation. Health Serv Outcomes Res Meth 2:169–188. Saygin C, Papadantonakis N, Cassaday RD, et al. (2018) Prognostic impact of incomplete hematologic count recovery and minimal residual disease on outcome in adult acute lymphoblastic leukemia at the time of second complete response. Leukemia & Lymphoma, 59:2, 363-371. Stuart EA. (2010) Matching methods for causal inference: A review and a look forward. Stat Sci 25:1-21. van Dongen JJ, van der Velden VH, Brüggemann M, Orfao A. (2015) Minimal residual disease diagnostics in acute lymphoblastic leukemia: need for sensitive, fast, and standardized technologies. Blood 125:3996-4009.

BLA 125557 S-013 ODAC Briefing Document Blincyto
30
6. APPENDICES
6.1 Appendix 1: Analysis Population by supporting studies for various analyses
Analysis set Analysis Study N Comments Study 20120148 Full analysis set(using historical data) (FAS-H)
Evaluate if MRD positive status as risk prognostic factor
20120148 268
Study MT103-203 Full Analysis Set (FAS)
MT103-203 116
Primary endpoint full analysis set (Prim EP FAS)
MT103-203 113 3 subjects excluded from FAS No MRD assay results n=1 MRD assay <0.005% n=2
Key Secondary endpoint full analysis set (Key Sec EP FAS)
1. Evaluate RFS 2. Evaluate the
association of MRD response and RFS
MT103-203 110 6 subjects excluded from FAS Ph+ subjects (n=5) MRD assay <0.005% (n=1)
Propensity Score Analysis Direct Comparison Analysis Set (DCAS) from study 20120148
Compare RFS and OS between groups
20120148 182 The DCAS was comprised of adult in CR1 with MRD levels ≥ 0.1% and time to relapse > 14 days from MRD detection
MT103-203 Subgroup
MT103-203
73
Cases with adequate controls in the DCAS
Source: FDA’s summary

BLA 125557 S-013 ODAC Briefing Document Blincyto
31
6.2 Appendix 2: Evaluation of Covariate Balance Before and After Propensity Score Adjustments With sIPTW
Table 14: Covariate Balance Before and After Propensity Score Adjustments With Stabilized IPTW*: Propensity Score Analysis (Primary Analysis Set)
*sIPTW: Stabilized Inverse Probability Weighting (which is a IPTW multiplied by the marginal probability of receiving the actual treatment received, Cole and Hernan, 2004). MRD at baseline was coded as : Note: p-value is not related to standard difference, but based on a univariate regression model with covariate as outcome and treatment as predictor. Source : Table 15 in Summary of Clinical Efficacy from the Applicant’s submission

BLA 125557 S-013 ODAC Briefing Document Blincyto
32
6.3 Appendix 3: Table of Grouped Terms Used for Adverse Reactions
Grouped Term Preferred Terms Included In Grouped Term Altered state of consciousness
Altered state of consciousness, depressed level of consciousness, disturbance in attention, lethargy, mental status changes, somnolence, stupor
Anemia Anaemia, erythropenia, haematocrit decreased, haemoglobin decreased, red blood cell count decreased
Anxiety Adjustment disorder with anxiety, anxiety, anxiety disorder, generalised anxiety disorder
Cytokine release syndrome/infusion reaction
Cytokine release syndrome, cytokine storm, capillary leak syndrome, infusion, infusion related reaction, macrophage activation
Delirium Delirium, delirium febrile Depression Depressed mood, depression, depression suicidal, major
depression, completed suicide, suicide attempt, adjustment disorder with depressed mood, adjustment disorder with mixed anxiety and depression, agitated depression, Columbia suicide severity rating abnormal, suicidal ideation, suicidal behavior
Encephalopathy Encephalopathy, toxic encephalopathy Headache Cluster headache, headache, sinus headache, tension headache Hepatotoxicity Acute hepatic failure, chronic hepatic failure, hepatic failure,
hepatocellular injury, hepatotoxocity, subacute hepatic failure Hypersensitivity Anaphylactic reaction, angioedema, dermatitis allergic, drug
eruption, drug hypersensitivity, erythema multiforme, hypersensitivity, urticaria
Hypertransaminitis Alanine aminotransferase increased, aspartate aminotransferase increased, hepatic enzyme abnormal, hepatic enzyme increased, hypertransaminasemia, transaminases increased
Hypotension Blood pressure decreased, blood pressure diastolic decreased, blood pressure systolic decreased, circulatory collapse, hypotension, hypovolemic shock
Intracranial hemorrhage Central nervous system haemorrhage, cerebellar haemorrhage, cerebral haemorrhage, haemorrhage intracranial, hemorrhagic stroke, subarachnoid haemorrhage, subdural haematoma, subdural haemorrhage
Neurotoxicity Neurological decompensation, neurological symptom, neurotoxicity
Neutropenia Agranulocytosis, febrile neutropenia, granulocytopenia, neutropenia, neutrophil count decreased
Pyrexia Pyrexia, body temperature increased

BLA 125557 S-013 ODAC Briefing Document Blincyto
33
Grouped Term Preferred Terms Included In Grouped Term Sepsis Abdominal sepsis, bacteremia, bacterial sepsis, candida sepsis,
device related sepsis, enterococcal sepsis, Enterobacter sepsis, Escherichia sepsis, fungal sepsis, neutropenic sepsis, post-procedural sepsis, pulmonary sepsis, sepsis, sepsis syndrome, septic shock, viral sepsis
Seizure Atonic seizures, partial seizures, partial seizures with secondary generalization, seizure, simple partial seizures
Thrombosis Axillary vein thrombosis, cerebral venous thrombosis, deep vein thrombosis, embolism, embolism venous, hepatic vacuolar thrombosis, hepatic vein thrombosis, intracranial venous sinus thrombosis, jugular vein thrombosis, mesenteric vein thrombosis, ophthalmic vein thrombosis, ovarian vein thrombosis, pelvic venous thrombosis, penile vein thrombosis, portal vein thrombosis, pulmonary embolism, pulmonary venous thrombosis, pulmonary thrombosis, renal vein thrombosis, retinal vein thrombosis, splenic vein thrombosis, subclavian vein thrombosis, venous thrombosis, venous thrombosis limb
Transfusion reaction Acute haemolytic transfusion reaction, allergic transfusion reaction, anaphylactic transfusion reaction, delayed haemolytic transfusions reaction, delayed serologic transfusion reaction, febrile non-hemolytic transfusion reaction, hemolytic transfusion reaction, transfusion reaction
Tremor
Action tremor, essential tremor, intention tremor, resting tremor, tremor