fda database models for sentinel - pharmamedtechbi.com/media/images/publications/archi… ·...
TRANSCRIPT
Defining and Evaluating Possible Database
Models to Implement the FDA Sentinel Initiative
FINAL REPORT
Report authors:
Jeffrey Brown, PhD Kimberly Lane, MPH Kristen Moore, MPH
Richard Platt, MD, MS
May 2009
Department of Ambulatory Care and Prevention Harvard Medical School and Harvard Pilgrim Health Care
Defining and Evaluating Possible Database Models to Implement the Sentinel Initiative. US Food and Drug Administration; Contact No. HHSF223200831315P

Final Report
Defining and Evaluating Possible Database Models to Implement the FDA Sentinel Initiative: Final Report
1. INTRODUCTION.................................................................................................................................. 1
1.1. FDA’s Sentinel Initiative.......................................................................................................... 1 1.2. Report Objectives.................................................................................................................... 1 1.3. Definitions ................................................................................................................................ 2
2. SENTINEL SYSTEM USER NEEDS ................................................................................................... 2 2.1. Methods for assessing user needs ....................................................................................... 2
2.1.1. Overview 2 2.1.2. Primary user needs: FDA Product Centers 2 2.1.3. Potential secondary user needs: federal agencies 2 2.1.4. Potential secondary user needs: external stakeholders 2
2.2. Anticipated Attributes of the Sentinel System Relative to User Needs............................. 3 2.2.1. System Functions: User needs relative to the primary goals of the System 3 2.2.2. System Model 4 2.2.3. System Infrastructure: Minimum characteristics to meet user needs 4 2.2.4. System Data Capabilities: Minimum data requirements to meet user needs 5
3. POTENTIAL DATABASE MODELS AND CHARACTERISTICS FOR THE SENTINEL SYSTEM ... 6 3.1. What data are needed? ........................................................................................................... 6 3.2. Where are the data stored? .................................................................................................... 9
3.2.1. Centralized versus distributed database models 9 3.2.2. Advantages and disadvantages of each approach 9
3.3. How are the data analyzed? ................................................................................................... 9 3.4. Is a common data model needed?....................................................................................... 10
3.4.1. Common data model definition 10 3.4.2. Advantages and disadvantages of using a common data model 10
3.5. What would a common data model look like?.................................................................... 11 3.5.1. Encounter-based patient-level data model 12 3.5.2. Patient-level summary data model 13 3.5.3. Drug and condition era model 14 3.5.4. Summary data model 14 3.5.5. Summary and recommendations 15
3.6. Additional database model characteristics ........................................................................ 15 3.6.1. Linkages: Medical charts 15 3.6.2. Linkages: External data sources 15 3.6.3. Linkages: Between institutions that participate in the Sentinel System 16 3.6.4. Timeliness 16
4. COMPARE AND CONTRAST EXISTING DATABASES WITH SENTINEL SYSTEM NEEDS ....... 17 4.1. Compare and contrast database models and characteristics with primary user needs
of the Sentinel System.......................................................................................................... 17
i

Final Report
5. Network Models and Other Initiatives ............................................................................................ 18 5.1. Data and network models ..................................................................................................... 18
5.1.1. Distributed models using a common data model approach 19 5.1.2. Centralized models 20 5.1.3. Health Information Exchanges (HIE) 21
5.2. Drug safety and information technology initiatives .......................................................... 21 6. RECOMMENDATIONS...................................................................................................................... 22 7. CONCLUSION ................................................................................................................................... 23 8. REFERENCES................................................................................................................................... 24 Appendix A. External Stakeholders User Assessment Tool ................................................................ 26
ii

Final Report
1. INTRODUCTION 1.1. FDA’s Sentinel Initiative In September 2005, the Health and Human Services (HHS) Secretary asked the Food and Drug Administration (FDA) (the “Agency”) to expand its current system for monitoring medical product performance and explore the possibility of building on the capabilities of multiple data systems to augment the Agency’s data query capabilities. In 2007, Congress enacted the Food and Drug Administration Amendments Act of 2007 (FDAAA), which mandates the Agency to create methods to obtain access to disparate data sources and to establish an active postmarket risk identification and analysis system that links and analyzes healthcare data from multiple sources. Consistent with FDA’s mission to protect and promote the public health, the Agency is embarking on the Sentinel Initiative to create a national, electronic distributed network, strengthening FDA’s ability to monitor the postmarket performance of its regulated products. The FDA’s current position on the Sentinel Initiative (the “System”) is summarized as follows:
The FDA will capitalize on the capabilities of multiple, existing automated health care data systems (e.g., electronic health record systems, Medicare data, other medical claims databases) to augment the Agency’s current surveillance capabilities. The System will enable queries of distributed data sources quickly and securely for relevant product safety information. Data will be held by its owners, and only organizations that agree to participate in this system will be included. Operations will adhere to strict privacy and security safeguards. Although the Agency foresees using a distributed data model for the initial implementation of the Sentinel Initiative, other approaches should be explored and understood for their eventual contribution to this initiative. The Sentinel Initiative is intended to be created through a public-private partnership involving a broad spectrum of stakeholders, including government agencies, data holders, academia, patients, consumers, and healthcare professionals.
The scope of this report is to define and evaluate possible database models that should be considered for use in the Sentinel Initiative. Although the FDA expects to rely initially on a distributed approach in which data are held by data owners, the FDA explicitly requested an assessment of the pros and cons of such an approach to be included in this report. In developing a network such as the envisioned Sentinel System, five key database model-related questions need to be addressed:
1. What does the system need to do? What types of analyses are most desired by the system users?
2. What data are needed to meet system needs? Are all types of electronic health data needed or are some data types or characteristics more important than others?
3. Where will the data be stored? Are data stored in a central location or in a distributed manner? 4. How will the data be analyzed? For each question posed to the System, will a single query (a
set of computer programs) be created by the user and distributed to each data owners for execution, or will each data owner be responsible for developing and implementing their own programs to answer the question?
5. Is a common data model needed, and if so, what will the model look like? Are data stored in a common data model or do they remain in their original formats? If a common model is needed, what will it look like?
1.2. Report Objectives The purpose of this report is to:
• Describe Sentinel System user needs; • Define potential database models for the Sentinel System;
1

Final Report
• Compare and contrast existing databases with Sentinel System user needs; • Identify existing data sources and environments operating under each identified potential
database model, evaluate each for content, quality, flexibility, and timeliness, and discuss how each could best contribute to the System; and
• Recommend characteristics and capabilities for potential database models for the Sentinel System.
1.3. Definitions The following definitions will be used for the purposes of this report: Users: The primary user of the System will be the FDA. Others could become secondary users once the System is in place. These potential future secondary users could include other federal agencies, the public, professional societies, the research community, medical product manufacturers, purchasers, payors, and others. Stakeholders: Stakeholders include all primary and potential secondary users, plus others who are interested in and may be affected by the Sentinel System. Database model: A database model describes the specific structure in which the required data elements and concepts are stored and how those concepts relate to each other. The database model for the Sentinel System will be designed for post-marketing surveillance.
2. SENTINEL SYSTEM USER NEEDS 2.1. Methods for assessing user needs 2.1.1. Overview User needs were solicited from (1) FDA Product Centers (primary users) and selected non-FDA federal agency stakeholders and (2) individuals who registered or attended a FDA-sponsored Sentinel Initiative meeting during 2008, and the membership of the International Society for Pharmacoepidemiology. 2.1.2. Primary user needs: FDA Product Centers We held semi-structured conversations with staff members at the three FDA Medical Product Centers: Center for Biologics Evaluation and Research (CBER), Center for Devices and Radiological Health (CDRH), and Center for Drug Evaluation and Research (CDER) in February 2009. The conversations focused on their interests, needs, requirements, insights, and expectations of the Sentinel Initiative. Calls were facilitated by Dr. Platt, who encouraged product center staff members to discuss issues they found to be important. Prior to each call, a summary of expected uses and required functionality and capabilities of the System was disseminated; this summary was based on the User Assessment Tool in Appendix A. 2.1.3. Potential secondary user needs: federal agencies Input was also solicited from other large federal agencies with experience in safety research and/or who expressed interest in using the System. In collaboration with FDA, we conducted semi-structured conversations with the Agency for Healthcare Research and Quality (AHRQ), Centers for Disease Control and Prevention (CDC), and National Institutes of Health (NIH) in January 2009. The structure of the conversations was similar to those held with the FDA Medical Product Centers. 2.1.4. Potential secondary user needs: external stakeholders To fully understand the potential database requirements and to maximize the System’s utility to a broad array of potential future users, feedback was solicited from various external stakeholders via email distribution of a User Assessment Tool in January 2009 (Appendix A). We targeted 569 individuals who registered, and provided an email address, to attend an FDA-sponsored Sentinel Initiative meeting held in
2

Final Report
2008. Stakeholders represented academics, data owners, federal agencies, the pharmaceutical, medical device, and biotechnology industries, patient advocates, and private firms. We also solicited input through the International Society for Pharmacoepidemiology’s (ISPE) website (http://www.pharmacoepi.org) and member newsletter. We received 68 comments from private companies (e.g., IT vendors, health plans, pharmaceutical industry), academics, non-HHS federal agencies, and patient advocates.
2.2. Anticipated Attributes of the Sentinel System Relative to User Needs This section describes the responses to the user needs assessment tool. The assessment tool was divided into four sections (System Functions, System Model, Infrastructure, and Capabilities); responses for each section are summarized below. The responses included below are not meant to be inclusive or to imply our agreement with the suggestions. Some suggestions are outside the scope of the System or were contradictory. Redacted user assessment tool responses will be provided to FDA for review. 2.2.1. System Functions: User needs relative to the primary goals of the System Input from Primary Users The anticipated primary functions of the Sentinel System include: adverse event signal detection and signal strengthening for drug, vaccine, biologics (blood, tissue, and organs), and devices; safety surveillance data mining (hypothesis generation); confirmatory safety studies (hypothesis evaluation); monitoring the adoption, diffusion, and ongoing use of new medical products; and augmentation of registry information (e.g., medical devices). FDA Medical Product Center staff members identified several additional primary uses. The ability to quickly calculate background incidence rates for outcomes of interest was noted as an important need. Rates could be calculated overall, in specific populations, or by strata based on demographics (age, sex) and co-morbidities. Additional primary users noted using the System to improve evidence regarding the predictive value of diagnosis codes of interest in automated health care data. Relating to blood products, there is interest in the potential to identify immediate adverse effects such as transfusion-related acute lung injury (TRALI) and transfusion-associated circulatory overload (TACO). FDA Product Centers’ staff also mentioned that the System should include at least two types of queries: ad hoc requests for targeted surveillance of selected events that emerge at some time after initial marketing, and routine surveillance of newly marketed products for a specified number of targeted events of interest. Input from potential secondary users: Federal Stakeholders Potential secondary System users identified a range of other possible uses for the Sentinel System. These potential users stressed that the System should not only complement existing federal surveillance systems, such as the CDC’s Vaccine Safety Datalink and BioSense programs, but also be compatible with those systems. For example, the Sentinel System could be used to perform investigative follow-up for BioSense or other federal surveillance systems, such as by providing access to timely emergency department and inpatient hospital admissions data. It was noted that the System may have the ability to enhance information collected during disease outbreak investigations, by identifying additional cases, generating baseline rates prior to a suspected outbreak, and providing denominator data on the number of users of a product, geographic distribution, or other characteristics of users or non-users. Interest was expressed for active surveillance for issues related to vaccines, injuries, infections, cancers, and other public health issues. Overall, it was suggested that the FDA and its federal partners maintain communication regarding the goals and objectives of the System and then work together to implement a system that will achieve these goals and objectives. Input from potential secondary users: Non-federal Stakeholders Potential secondary users identified opportunities for the Sentinel System such as: evaluation of drug utilization patterns; drug effectiveness studies; comparative effectiveness studies; evaluation of concomitant medication use and outcomes, including identification of drug interactions that may enhance susceptibility to severe adverse events; assessment of trends and patterns of off-label or non-approved medication use; RiskMAP effectiveness; assessments of disease burden and changes in clinical practice
3

Final Report
or population health; vaccine utilization studies; additional surveillance tasks including disease surveillance, outbreak monitoring, adoption and diffusion investigation, and use of novel procedures and/or techniques for diagnosis and treatment; health economics and outcomes research, including effectiveness and cost-effectiveness of care and in particular of drugs and devices; characterization of disease states or the natural history of disease; evaluation of biomarkers for adverse event risk; and assessment of the biological effect of ionizing radiation used during medical procedure studies. System Function Challenges Respondents identified numerous challenges regarding the primary uses of the System. They included: resource and time constraints on conducting confirmatory studies in a rapid fashion; identification of medical devices due to lack of unique identifiers; better understanding of variation in the potential data sources for the System; and a need for improved understanding of the methodologies and thresholds used for signal detection. It also was noted that extensive methodology work must be done to conduct safety surveillance data mining, including the implications and evaluation of false signals. Numerous stakeholders stressed the importance of transparent study designs and clear analytic plans. Others noted that the System may identify a large number of safety signals, and that the approach in evaluating the signals, including how that information will be evaluated and disseminated, will be crucial in the acceptance and support of the System. These stakeholders noted that substantial planning is needed to guide the FDA response to safety signals, especially given the current media interest in drug and vaccine safety. 2.2.2. System Model Sentinel System Model Feedback To gather feedback on the planned model for the Sentinel System, the user assessment tool included the following language provided by FDA:
The Sentinel System will use a distributed architecture that accesses existing databases, including electronic health record systems, Medicare/Medicaid data, and other medical claims databases. These databases will be held and managed by the current data owners, and they will adhere to all HIPAA, human subjects, and institutional privacy and confidentiality guidelines.
Respondents noted that standardization of data from different sources is essential. Additionally, quality control checks and source data validation were mentioned as important activities. Protection of patient privacy was a primary concern for some stakeholders. Others noted that the System should have the ability to link individuals across data sources. System Model Challenges The challenges noted principally focused on the use of different data sources, not on whether the System uses a distributed or centralized architecture. Challenges included: ensuring datasets use identical coding schemes, and the fact that inclusion of both paid and unpaid claims in some claims data systems can cause apparent duplication of some events; the need to link individuals across datasets to avoid duplication; resolution of disparate terminologies; accessing data with differing data policies across state boundaries; and examining and understanding differences in results across datasets. 2.2.3. System Infrastructure: Minimum characteristics to meet user needs Stakeholders were provided the following basic attributes of the System needs and asked to respond:
• Timely access to data from large populations representative of individuals exposed to the products FDA regulates;
• Ability to validate exposures and/or outcomes (e.g., through limited access to medical charts); and
• Allow study findings to be reproduced.
4

Final Report
The FDA Medical Product Centers' staff members stressed that overall timeliness of the System is very important. It also was strongly suggested that the System have a detailed audit trail to fully understand how the signal was generated or strengthened, especially in the event the data lead to regulatory action, and to ensure consistency in the data. Additional characteristics mentioned by federal stakeholders included the ability to prioritize requests to ensure all queries were internally discussed and agreed upon, implementation of a fully automated system, the ability to have pre-specified outcomes ready to be queried with a short lead time, the ability to freeze data at the time of analysis to allow results to be replicated, the ability for long-term longitudinal follow-up across hospitals, physician offices, and clinics (especially important to device safety), and the ability to link to external sources (e.g., National Center for Health Statistics) and across data sources. Input from other stakeholders External stakeholders noted that System should be available for “real time” surveillance, especially in situations where millions of people are exposed to products whose safety was studied in relatively few people prior to its use for routine purposes or as a response to a public health emergency. External stakeholders also noted that having the capacity to validate outcomes through medical chart review was valuable. It also was noted that the same database used to identify a signal should not be used to replicate the findings. System Infrastructure Challenges Respondents noted the large investment in infrastructure, governance, and management that will be needed to meet user needs. System requirements such as rapid response to queries, easy validation of exposures and outcomes, and efficient access to medical charts will require long-term development and implementation processes. A phased approached to network development, focusing on the primary needs during the first phase with a limited number of partners, was suggested as the most efficient approach to creating the System. 2.2.4. System Data Capabilities: Minimum data requirements to meet user needs The user assessment tool provided the following minimum System data capabilities as the basis for a response. The assessment tool noted that System must be able to:
• Identify exposure to medications, vaccines, and use of devices; • Capture inpatient and outpatient diagnoses and procedures; • Capture demographic information (at a minimum, age and sex); and • Link across datasets, for example to vital statistic data (e.g., state or national death registries).
Input from Stakeholders FDA Medical Product Centers' staff noted that, in addition to the capabilities listed above, the ability to identify incident events (diagnoses, procedures) is of primary importance. For medication dispensings, the Medical Product Centers suggested that there should be a way to capture drug adherence and long- versus short-term prescription medication use. Federal agency stakeholders mentioned the desire to have information regarding important confounder data, such as disease severity and modifiers of disease and medical product effectiveness (e.g., tobacco, alcohol, and illicit substance use). Additionally, these stakeholders wanted the ability to identify indications for drug use (i.e., on or off label). External stakeholders suggested that laboratory data be included, as it can be helpful in the identification of adverse events. Additional suggestions included radiology data, complaint data (versus diagnosis data) to facilitate earlier findings of safety problems, and tissue samples for genomic DNA analysis of individuals with serious adverse events. System Data Capability Challenges These included: challenges in monitoring rare diseases. Additionally, few electronic health data systems capture treatments administered in hospital or infusion centers; or highly specific information (e.g., lot number).
5

Final Report
Device safety surveillance was identified as a particularly difficult area, because devices do not have a unique identification number or lot number to identify model, make, and manufacturer, whether the device is single- or multi-use, or whether it is reprocessed. It was noted that for implantable devices, there are many variables that affect the safety and efficacy of devices utilized in intervention and/or operating rooms (e.g., medications used, specific procedures performed, other devices, and surgical interventional technique used during the procedures). For the most part, this information is missing from standard administrative and claims databases. In addition, safety surveillance for biologic products such as blood, blood products, and tissues has specific challenges, including ascertainment of exposed patients, specific treatment, age of blood product, and demographic and other donor characteristics.
3. POTENTIAL DATABASE MODELS AND CHARACTERISTICS FOR THE SENTINEL SYSTEM This section addresses what data are needed; where the data will be stored; how the data will be analyzed, and how will the data be structured.
3.1. What data are needed? Since the Sentinel System is intended to use electronic health information collected for other purposes (e.g., patient care and reimbursement), this question is equivalent to asking which healthcare data sources are most important. The key observational data sources are administrative and claims data and electronic medical record (EMR) data. Although other data sources can contribute (e.g., disease and medical device registries, personally-controlled health records), administrative, claims, and EMR data are the most widely used and most likely to quickly improve the FDA’s ability to monitor the postmarket performance of its regulated products. In addition, disease and treatment registries are typically prospective in nature; patients are consented for inclusion in the registry and data are collected at pre-specified intervals. Registries of this type are outside the scope of this discussion as our primary focus is on the secondary use of routinely-collected healthcare information. Several large insurers in the US maintain administrative and claims data warehouses for more than ten million individuals.1 Together, data from a few large public and private health insurers could cover well over 100 million members. Although a substantial number of individuals are covered by EMRs, there are no comparably large single sources of EMR data. A description of these data sources follows. Health insurer administrative and claims databases cover defined populations (enrollees). Examples include the data files of Medicare, Medicaid, and private health plans. They contain administrative data, including identifiers, dates of eligibility for care (coverage dates), demographic information, claims for care, and, in some cases, laboratory test results and other information. Since the insurer is financially responsible for at least some kinds of medical care that enrollees receive, it is possible to define the population that receives care and is at risk for outcomes of interest. This allows calculation of rates of use and of complications. There are caveats such as those who are insured by two or more insurers, such as Medicaid-Medicare dually eligible and some in the active or retired military. However, those populations for which the insurer expects to receive information for specific kinds of care can typically be identified. Administrative and claims data are also well standardized because the electronic submission of claims requires use of standard forms. Therefore, data across insurers can readily be combined or put into a standard format for analysis. EMR-based systems typically contain information about care delivered in specific settings, such as a medical practice (typically ambulatory) or hospital. EMR data warehouses contain detailed clinical information for care their setting has delivered (for example, in the hospital or ambulatory setting), including vital signs, laboratory values, infusions, procedures, and clinical notes. EMR data are extremely valuable for post-market safety evaluation when they are combined with administrative and claims data. This is the case for the CDC’s Vaccine Safety Datalink (VSD), which combines EMR, administrative, and claims data.2 Most EMR databases, however, do not contain information for care provided outside the practice or hospital. For example, an ambulatory EMR may contain information on prescriptions written,
6

Final Report
but have no record as to whether the prescription was actually dispensed. Further, if a patient seeks care outside the specific ambulatory setting covered by the EMR, care such as inpatient care or care by an outside specialist will not typically be recorded in the relevant ambulatory EMR. The same is true for hospital-based EMRs; in most cases the hospital EMR only contains information on care provided within the hospital or by hospital-affiliated providers. Although ambulatory and hospital-based EMRs can in many cases be useful for safety surveillance, (e.g., immediate adverse reactions to transfusions), the limited view of patient care is a disadvantage for many safety surveillance purposes that require more complete data about exposures and outcomes. This type of clinic-based information does not allow accurate ascertainment of exposure (or non-exposure) or outcomes. Exposure is difficult to calculate because it is based on prescribing instead of dispensing data, and it is often not possible to know the specific formulation that was dispensed. Assessment of non-exposure and outcomes cannot occur because it is not possible to define the period when exposures or outcomes would come to attention if they occur. Thus, it is impossible to calculate the amount of time at risk for outcomes. That is, a year without an encounter could mean the patient has been healthy or may have moved or received care elsewhere. Because there is no reliable concept of a defined population within most EMR-based databases, and because there is no expectation that all care will be contained within the available data sources, it is not possible to calculate incidence or prevalence rates. Finally, EMRs have been slow to standardize data capture and storage, meaning that each EMR implementation, even those using the same EMR vendor and product, can be substantially different due to clinic-based customization, guidelines for use, and many other forms of local variation. Table 1 provides an overview of administrative and claims and EMR data. Recommendation: Administrative and claims data covering defined populations currently provide the most readily-available, and most viable source for the initial implementation of the Sentinel System. Systems that have administrative and claims and EMR data available for a defined population are the more useful, but only a small minority of the U.S. population receive care in such systems.
7

Final Report
Table 1. Comparison of observational claims and electronic health records 3-7
Administrative and claims Electronic medical records Data source
• Private and federal health plans and health delivery systems, and Medicaid/Medicare populations.
• Point-of-care service in ambulatory or hospital settings
• Availability of specific data elements varies by EMR
Data available
• Demographic information • Diagnoses and procedures from medical
claims, identified by coding schema (e.g., ICD-9), from outpatient and inpatient encounters
• Outpatient prescription drug dispensing • Durable medical equipment
• Demographic information • Clinical data: diagnoses, symptoms,
procedures, vital signs, medical history • Prescription drug prescribing • Laboratory tests ordered • Laboratory test results • Detailed immunization records • Free text fields with clinical details
Advantages
• Comprehensive view of health-related activities for a defined population
• Claims are often audited • Studies have validated claims databases,
indicating prescription drug and outcome data can be of high quality (e.g., diagnostic codes in inappropriate demographic groups were uncommon)
• Recall and interview bias is minimized • Incidence rates can be generated
because a denominator is available
• Rich clinical data, especially for vital signs, laboratory test results, and health status, such as smoking status, and body mass index
• Information is based on treatment and not reimbursement
• Can identify outcomes not covered by ICD-9 coding, e.g., via problem lists
Limitations
• Duration of observation period is limited by period of coverage by a specific health plan.
• Important information on health status is unavailable (e.g., smoking status, occupation, menopause)
• Few symptoms are captured • Potential for misclassification: data
quality is optimized for billing, not for other uses
• Limited to the covered population • Inpatient exposures often unavailable • Limited ability to identify exposure to
medical devices • Some outcomes are poorly defined by
diagnostic coding • Validation of outcomes and collection of
supplemental data via medical chart review is time and resource intensive
• Information may not be available about care delivered in settings not served by the EMR system.
• Most EMRs are not linked to defined populations
• Difficult to define unexposed, or at-risk, time
• Dispensing data is most often not available
• Lack of EMR standardization
8

Final Report
3.2. Where are the data stored? 3.2.1. Centralized versus distributed database models In principle, the Sentinel System goals could be accomplished by implementing either a distributed network model or through creation of a large centralized data repository. Examples of each type of system are presented below in Section 5. A centralized system stores all patient and clinical data in one central database that is accessible to all authorized users.8 In the centralized model, all data owners (e.g., health plans, medical clinics) send their data to a central location; all the network data are physically stored together outside the physical control of the data owner. In this model data analyses are conducted by the entity that controls the data warehouse. In a distributed, or decentralized, system each data owner maintains physical control of their data behind their firewalls, protected by their security processes and rules. Analysis in a distributed model can involve distributing the analyses (i.e., executable programs) to the data owners for processing and return or distributing a protocol for local interpretation, programming, implementation, and return. A mixed model can be used for studies that require well-defined analytic datasets from disparate sources to be analyzed together, for example, when performing multivariate analyses. A mixed model uses a distributed approach for all analyses or cohort specifications that can be conducted in a distributed manner (e.g., incidence rates, safety surveillance, identification of specific cohorts) and only transfers data for combined analysis (e.g., case-control study, cohort study) if necessary, and then, only the minimum necessary data are transferred. The Meningococcal Vaccine Study (described below) uses a mixed model in which very little data are transferred for analysis;9 a cohort study may require extensive project-specific data transferred for analysis. 3.2.2. Advantages and disadvantages of each approach A distributed approach allows data owners to maintain physical control of their data; without this control it is our experience that data owners are unlikely to participate in a network. By allowing data owners to maintain control of their data and its uses, the distributed model avoids or reduces many of the security, proprietary, legal, and privacy concerns of data owners, including those related to the Health Insurance Portability and Accountability Act (HIPAA). This approach also highlights the need to have local content experts maintain a close relationship with the data. For example, only a local expert can easily and effectively trouble-shoot an unexpected finding or anomaly. This need for ongoing involvement of local data experts exists even if a centralized model is used. A distributed data model approach can eliminate the need to create, secure, maintain, and manage access to a complex central data warehouse, and can minimize the need to disclose protected health information to users other than the participating covered entities. In addition, a distributed network allows data owners to accurately assess, track, and authorize query requests, or categories of requests, on a case-by-case basis. A distributed network model will therefore encourage participation by data owners who might refuse to provide data to a centralized system.1 A centralized model simplifies the logistics of manipulating data files required to support analyses. We note that many disease and treatment registries use a centralized data warehouse approach, although once again, this type of patient-consented and targeted prospective data collection is not the focus of this report. We believe it will be more difficult to create and maintain a central database model to support the Sentinel System because of privacy, security, and proprietary concerns of the data owners. The CDC’s Vaccine Safety Datalink converted from a central to a distributed data model in 2000 because of data owners’ concerns about control of the uses of the data. The healthcare privacy concerns of the public may also hinder creation of a single data repository, especially one that is directly or indirectly under government control. Recommendation: We believe the best way to obtain participation by data owners and public support is through a distributed model that allows data owners to maintain confidentiality and physical control over their data and its uses. This does not exclude the possibility of using a mixed model when necessary.
3.3. How are the data analyzed? In the context of the Sentinel Initiative, a “query” can be defined as a structured question that is submitted to the Sentinel System. If a centralized model is used, a query can be run by anyone who has access to
9

Final Report
the central data warehouse and who has permission to execute the query. However, within a distributed research environment there are essentially two options for conducting analyses:
• Create a study protocol or other written instructions and ask each data owner to implement the protocol locally by creating the necessary analytic programs, and returning the results for either aggregation or meta-analysis; or
• Have the study investigator and analysts create the analytic code (i.e., query) based on the study protocol and distribute the code to each data owner to run against the data they have stored in the common model (described below).
The second approach reduces the potential for analytic inconsistency and ensures that the results from the data owners are comparable. Comparability is achieved through use of a common data model and the uniform implementation of the complex analytics necessary for querying. This avoids differences in interpretation of protocols by separate data holders. Based on our experience, having different sets of investigators and analysts each implement a protocol is an inefficient use of resources, and typically leads to different implementations of the protocol making the findings from different sites non-comparable. Additionally, it is difficult and sometimes impossible to identify implementation differences without detailed and timely investigation and data checking. Recommendation: We recommend that analyses be developed centrally and distributed to the data owners for execution against a common data model. This will ensure that complex analytic approaches are implemented identically and the findings comparable across institutions as long as the source data are comparably defined.
3.4. Is a common data model needed? The decision regarding whether to adopt a common data model (and if so, what it will look like) impacts the ease with which questions can be answered, the level of effort needed to answer the questions, and the groups responsible for the specific activities needed to respond to the question. 3.4.1. Common data model definition Broadly speaking, a common data model is a set of specific definitions for the structure of databases and of data elements (i.e., specific variables). The Centers for Medicare and Medicaid Services (CMS) publishes standard administrative and billing claims forms that are the basis of a common model for most public and private health care billing transactions in the U.S. Health care networks that involve data queries such as the HMO Research Network (HMORN), the Vaccine Safety Datalink (VSD), Informatics for Integrating Biology and the Bedside (i2b2), and the Electronic Primary Care Research Network (ePCRN) all use a common data model to facilitate multi-institutional querying. Common data models are often referred to as “standards-based” when the models use industry standards in their definition of network environments, data structures, and data element definitions. Most implementations of common data models require each contributing partner (in this case, each data owner) to transform its data into the common model, either virtually or physically. Physical transformations are referred to as an extract, transform, and load (ETL) process. Virtual transformations use an intermediate software layer that maps local data owner concepts and data elements to the common model and requires either real-time transformation of the data for querying or transformations of the query to allow it to run on the local data warehouse. There are trade-offs regarding implementation of a physical or virtual transformation. A physical transformation avoids the time required for real-time transformations of the data, and it is simpler to perform and respond to data quality checks. However, a physical transformation requires the permanent storage of duplicate information. 3.4.2. Advantages and disadvantages of using a common data model A common data model substantially reduces the need to centrally create and maintain complex metadata, ontology, and data mapping activities. That is, once the common data model is defined the data owners are responsible for mapping their data to the model. This obviates the need for centralized knowledge of the details of every data system in the network. A common data model also addresses issues related to
10

Final Report
syntactic and semantic interoperability. Understanding and addressing these concepts is crucial when considering a design that queries disparate data systems. Syntactic interoperability arises when two or more systems use the same terms, rules, and values to describe the same concept. For example, if two systems code the term “sex” as 1=Female, 2=Male, they are syntactically interoperable on that term. Semantic interoperability results when two or more systems use the same term to describe the same concept. For example, “gender” can mean different things in different systems. If two systems are semantically interoperable, they use “gender” to describe exactly the same concept; the system would not be interoperable if one used “gender” to describe “sex” and the other used “gender” to describe the sociological concept of “gender”. Another example involves the definition of a medical visit. Some systems define a “visit” as unique based on a patient and a day (i.e., a patient received medical care on a specific day with a specific a provider) meaning that each patient could only have one visit per day per medical care setting. Other systems define a “visit” as every unique patient-provider encounter during the day. With this definition an annual physical exam could generate multiple visits within the electronic system: a physician visit, radiology visit (e.g., for a mammography) and a laboratory visit (e.g., for blood work). Obviously, querying each system for the number of patient visits per year would generate different results without use of a common definition of “visit”. Once again, requiring data owners to transform their data to a common data model addresses both syntactic and semantic interoperability through the specifications in the common data model. That is, the common data model precisely defines all terms, rules, and values and requires the data owners to transform their data within the confines of the common model. Therefore, the term “sex” would have a common meaning and a standard set of expected values (e.g., 1=Female, 2=Male, 9=Unknown) and rules (e.g., missing values not permitted, 1, 2, and 9 only permitted values). Conversely, allowing data owners to participate without conforming to the common data model would substantially complicate the system design and implementation steps by requiring complex metadata, ontology, and data mapping activities to address data heterogeneity. Another advantage of a common data model is the ability to centralize analytics as opposed to requiring each data owner to interpret and implement a set of written instructions. As noted in Section 3.3 the use of a common data model and distribution of single analytic program is optimal. The common data model requires initial effort and expense to transform data to the common model and to store it for use through the System. In addition, to the extent that the common model does not capture the full granularity of the source data, the common model approach could result in the loss of information. An additional advantage of a common model is concentration of data validation on the initial transformations instead of requiring complex data checking effort after execution of each query. Recommendation: Initial implementation should include a common data model using an ETL procedure. This approach does not exclude other options going forward, but would greatly facilitate initiation of the Sentinel System.
3.5. What would a common data model look like? This section assumes that the Sentinel System will use a common data model. If a common data model is not required then the models described below would only be relevant as a potential intermediate step in automated data processing. Many types of data models should be evaluated as a potential model for the Sentinel System. A data model is defined as the structure or format of a database that formally defines the categories and the relationships within the data system. Examples of data models with varying levels of granularity are described below, ordered by decreasing granularity. Each type of data model has advantages and disadvantages to its implementation for the Sentinel System. This list is not exhaustive and the listed options are not mutually exclusive.
11
Final Report
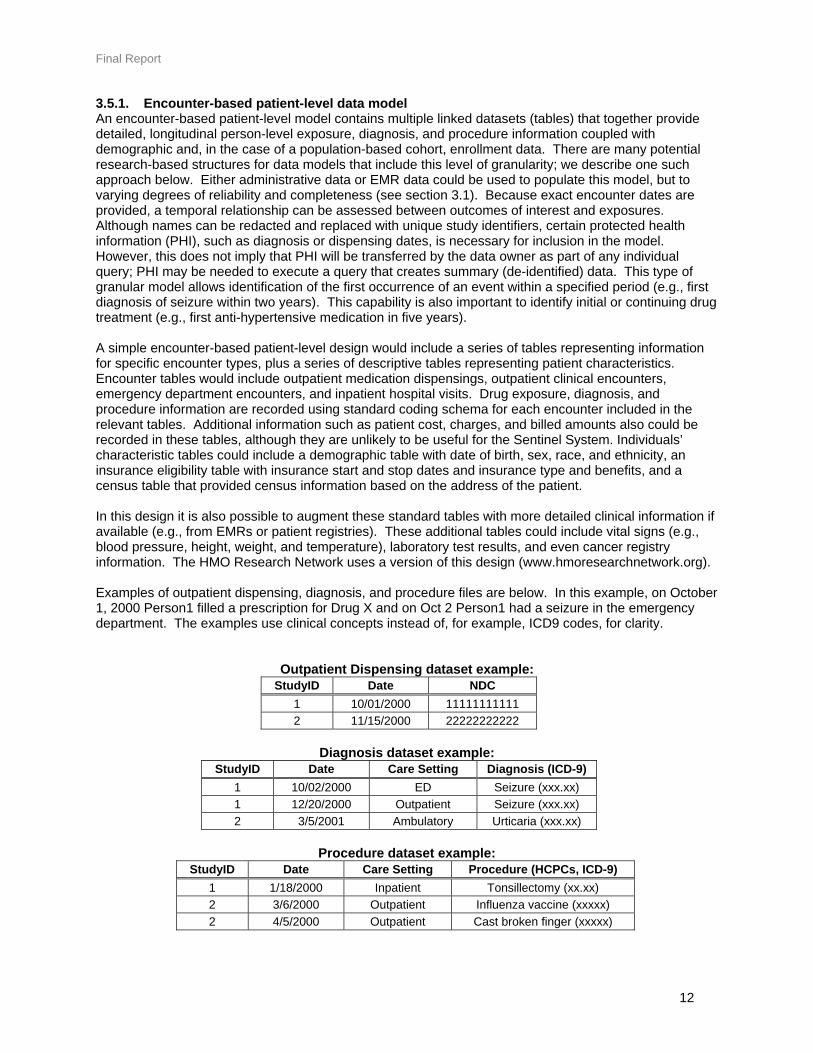
3.5.1. Encounter-based patient-level data model An encounter-based patient-level model contains multiple linked datasets (tables) that together provide detailed, longitudinal person-level exposure, diagnosis, and procedure information coupled with demographic and, in the case of a population-based cohort, enrollment data. There are many potential research-based structures for data models that include this level of granularity; we describe one such approach below. Either administrative data or EMR data could be used to populate this model, but to varying degrees of reliability and completeness (see section 3.1). Because exact encounter dates are provided, a temporal relationship can be assessed between outcomes of interest and exposures. Although names can be redacted and replaced with unique study identifiers, certain protected health information (PHI), such as diagnosis or dispensing dates, is necessary for inclusion in the model. However, this does not imply that PHI will be transferred by the data owner as part of any individual query; PHI may be needed to execute a query that creates summary (de-identified) data. This type of granular model allows identification of the first occurrence of an event within a specified period (e.g., first diagnosis of seizure within two years). This capability is also important to identify initial or continuing drug treatment (e.g., first anti-hypertensive medication in five years). A simple encounter-based patient-level design would include a series of tables representing information for specific encounter types, plus a series of descriptive tables representing patient characteristics. Encounter tables would include outpatient medication dispensings, outpatient clinical encounters, emergency department encounters, and inpatient hospital visits. Drug exposure, diagnosis, and procedure information are recorded using standard coding schema for each encounter included in the relevant tables. Additional information such as patient cost, charges, and billed amounts also could be recorded in these tables, although they are unlikely to be useful for the Sentinel System. Individuals’ characteristic tables could include a demographic table with date of birth, sex, race, and ethnicity, an insurance eligibility table with insurance start and stop dates and insurance type and benefits, and a census table that provided census information based on the address of the patient. In this design it is also possible to augment these standard tables with more detailed clinical information if available (e.g., from EMRs or patient registries). These additional tables could include vital signs (e.g., blood pressure, height, weight, and temperature), laboratory test results, and even cancer registry information. The HMO Research Network uses a version of this design (www.hmoresearchnetwork.org). Examples of outpatient dispensing, diagnosis, and procedure files are below. In this example, on October 1, 2000 Person1 filled a prescription for Drug X and on Oct 2 Person1 had a seizure in the emergency department. The examples use clinical concepts instead of, for example, ICD9 codes, for clarity.
Outpatient Dispensing dataset example: StudyID Date NDC
1 10/01/2000 11111111111 2 11/15/2000 22222222222
Diagnosis dataset example:
StudyID Date Care Setting Diagnosis (ICD-9) 1 10/02/2000 ED Seizure (xxx.xx) 1 12/20/2000 Outpatient Seizure (xxx.xx) 2 3/5/2001 Ambulatory Urticaria (xxx.xx)
Procedure dataset example:
StudyID Date Care Setting Procedure (HCPCs, ICD-9) 1 1/18/2000 Inpatient Tonsillectomy (xx.xx) 2 3/6/2000 Outpatient Influenza vaccine (xxxxx) 2 4/5/2000 Outpatient Cast broken finger (xxxxx)
12

Final Report
3.5.2. Patient-level summary data model A patient-level summary data model consists of multiple datasets (tables) that together summarize person-level exposure, diagnosis, and procedure data during a specific period (e.g., annually). Each summary dataset contains one row per person per period, providing date (e.g., name, unique identifier) of events of interest (exposures, diagnoses, procedures). Diagnosis and procedure summary datasets can be stratified by care setting (e.g., outpatient, emergency department, inpatient). Although two or more summary datasets can be linked by study identification number, temporal relationships between drug exposure and outcomes cannot be determined within a period. In this model, PHI need not be included. This summary model allows broad assessments of diagnoses, procedures, and medication use within the summary period (mostly likely annual). It would not allow precise temporal relationships within a year, but it does allow cross year relationships such as assessing the uptake of a new drug by demographic and clinical characteristics. There are multiple approaches to collecting and organizing the summary data. For example, for an individual drug (generic name) the number of days of exposure could be collected and/ or the number of dispensings during the year.
Outpatient Dispensing Summary example:
StudyID Period Days Exposed Generic Name 1 2000 100 Atorvastatin 2 2000 50 Terbinafine
Diagnosis summary dataset example: StudyID Period Care Setting Diagnosis (ICD-9)
1 2000 ED Seizure (xxx.xx) 1 2000 Outpatient Seizure (xxx.xx) 2 2000 Outpatient Urticaria (xxx.xx)
Procedure summary dataset example:
StudyID Period Care Setting Procedure (HCPCS, ICD-9) 1 2000 Inpatient Tonsillectomy (xx.xx) 2 2000 Outpatient Influenza vaccine (xxxxx) 2 2000 Outpatient Cast broken figure (xxxxx)
This model is less flexible than the encounter-based model, but still provides useful patient-level data while eliminating PHI. The model can incorporate data from disparate sources such as administrative claims and EMRs, either combined or separately. Some of the assessments this model would allow include:
• Assessment of medication use among newly-diagnoses diabetics in 2002 by identifying patients who had a diabetes diagnosis in 2002 and no diabetes diagnosis in 2001;
• Evaluation of users of a new medication by age, sex, and co-morbidity; • Assessment incidence and prevalence of conditions; • Medication use patterns; and • Hypothesis generation safety surveillance.
In addition, because this model maintains a patient identifier, the data could be linked to other data sources such as clinical details from EMRs, administrative claims data (if summaries are based on EMR data), and patient registries.
13

Final Report
3.5.3. Drug and condition era model A drug-condition era model consists of datasets (tables), which summarizes exposures to drugs or drug classes (“drug eras”) and outcomes (“condition eras”) based on length of exposure or clinical concepts. “Drug eras” represent the span of time a given person is assumed to be persistently using a given drug concept.10-11 This approach can allow for considerations on length of exposure and can be modified to accommodate cumulative exposure. “Condition eras” represent the span of time for which a patient can be considered to have a given concept. In each dataset, the period covered by the era is represented by a start date and an end date, so the drug exposure or length of outcome can be calculated by finding the difference between them. However, an end date may be difficult to ascertain depending on the data source (e.g., claims data only captures fill dates while inpatient electronic medical record data contains daily data). In a drug era model, independent prescriptions combine into one continuous period of use, through a “persistence window” which is the allowable span of time after the prescription should have completed before another prescription of the same drug needs to be filled to maintain drug persistence. A similar method is applied to a condition era dataset to consolidate diagnoses into condition eras. In the example tables below, taken together, drug era and procedure era datasets can say: Person1 had a seizure during the time of exposure of DrugX.
Drug era dataset example: StudyID NDC Era_start Era_stop
1 99999999999 01/15/2000 05/15/2002 1 11111111111 03/18/2000 04/20/2000 2 22222222222 01/09/2000 10/01/2002
Procedure summary dataset example: StudyID Outcome Era_start Era_stop
1 Seizure 05/09/2000 05/09/2000 2 Heart attack 04/18/2000 04/19/2000 2 Diabetes 01/09/2000 09/25/2002
3.5.4. Summary data model A summary data model consists of summary exposure and outcome datasets, each containing a list of exposures or outcomes and the number of unique individuals (and/or unique events) with that exposure or outcome in a specific time period (i.e., utilization). The most basic type of a summary dataset contains one row per exposure/outcome with the number of individuals with that exposure/outcome during a specific period (e.g., annual). Data can be stratified by potential confounders, such as age group, sex, and/or care setting (e.g., inpatient, outpatient). Although exposure and outcome summary datasets can be compared by period, they are cross-sectional in nature and therefore it is unknown if individuals with exposure X had outcome Y, and temporal relationships cannot be determined. This type of data model can allow very fast counts of outcomes and exposures in a particular database while not containing PHI Although limited in scope, this model can provide useful information for feasibility assessments (i.e., are there enough exposures to conduct a study) and may provide a low barrier to network entry for data owner skeptical of network participation. In the example datasets below, there were 7 diagnoses among 5 people of diagnosis X in 2000. Also, 50 people filled 100 prescriptions for Drug C for a total of 150,000 days of exposure.
14

Final Report
Diagnosis Summary dataset example: StudyID Period Number of people Number of events Diagnosis/ Condition
1 2000 5 7 X 2 2000 6 14 Y 2 2000 7 10 Z
Dispensing Summary dataset example:
StudyID Period Number of people Number of dispensings Days of exposure Drug 1 2000 10 20 850 A 2 2000 20 25 18000 B 2 2000 50 100 150000 C
3.5.5. Summary and recommendations The choice of data model is a function of the data available to the network, the willingness of data owners to provide detailed versus summary data for querying, and the purpose of the system. Section 4 (see Table 2) describes the ability of the different models to address Sentinel needs. In general, the more granular the data the more flexibility it provides. For example, the encounter-based patient-level model enables implementation of most types of observational studies, whereas summary-level data are most useful for monitoring of medical product use.
3.6. Additional database model characteristics Additional issues to consider relate to the ability to access full text medical records, the ability to link to external data sources, and timeliness. The first two issues can be summarized as to whether or not the model maintains a patient identifier that can be used for external linkages; if a unique patient identifier is available to the data owner that links back to detailed patient identifiers (e.g., name, address, social security number) then that data owner has the potential to access medical charts (paper or electronic) and to create linkages to external sources such as birth or death registries. 3.6.1. Linkages: Medical charts It should be considered essential for the Sentinel System to have the ability to obtain detailed information from the full text records that represent the care described in coded electronic data, whether it originates from claims or EMRs. Although administrative and claims data have good validity in identifying some outcomes (e.g., acute myocardial infarction and hip fracture), timely and cost-effective review of a relatively small number of medical records is necessary to validate many outcomes, especially for events that are poorly described using ICD-9 codes or have low predictive values in administrative and claims databases.12-16 Medical charts can also provide data on co-existing conditions, indication of off-label drug use, and other data that may help elucidate or validate findings. Data models in which the data owner maintains the ability to identify individuals by name and other identifying characteristics provide the potential for chart review. Fully integrated delivery systems provide the best access to medical charts because the data owners either have direct access to medical charts (e.g., medical groups) or have strong relationships with healthcare providers that maintain the charts. However, fully integrated delivery systems are rare. Most data owners (e.g., insurers) do not have direct relationships (other than for reimbursement) with the healthcare providers that maintain the charts; these data owners usually have more difficulty retrieving data from the charts due to the added burden of approvals and the need to make requests to numerous disparate providers. There are many examples of successful insurer-based chart reviews.17-19 3.6.2. Linkages: External data sources The ability for the Sentinel System to link to external data sources such as vital statistics databases (e.g., National Center for Health Statistics, birth and death registries, tumor registries) can allow capture of
15

Final Report
patient data beyond that found in administrative and claims databases or EMRs. This type of linkage is common in epidemiologic research. Examples include identification of death from the National Death Index and ascertainment of delivery information from State birth registries. The HMO Research Network Cancer Research Network (crn.cancer.gov) is an example of a system that links administrative and claims data, EMR data, and tumor registry information to enable a range of observational studies. Linkage across data sources requires identification of unique individuals within each system. This unique identification usually requires transfer of protected health information (e.g., name, date of birth, address, and/or social security number) from one data owner to another.* The protected information needed for the linkage is unlikely to be included in a centralized data warehouse, substantially complicating linkages. Within a distributed system the data owner has direct access to the information needed for the linkage and is the most reasonable institution to request the linkage. In addition, in a distributed system protected health information is only shared between the two institutions that need the information to conduct the linkage (health plan and curator of the external data source). Minimizing the number of entities involved in the linkage substantially reduces the potential legal complication of the linkage. 3.6.3. Linkages: Between institutions that participate in the Sentinel System Distinct from linkages to external data sources such as the National Death Index, the ability for cross-institutional linkages between participants in the Sentinel System can allow for comprehensive cross-sectional information and longitudinal follow-up, both major challenges for medical product safety surveillance. Within any cross-sectional view, patients can receive care across many different care delivery systems, making the ability to link individuals across those systems valuable. The ability for the Sentinel System to allow cross-institutional linkages would enable patient-level data collection beyond what is available in a single system. For example, in a Sentinel model populated by health plan claims data, linkages to EMR data or inpatient hospital information could add substantial clinical granularity. Longitudinal linkage across institutions is a separate and equally important issue. Most individuals move across medical systems and insurers, making it difficult to track individuals over time. The ability to link individuals across health insurer systems (as they switch insurance carriers) and EMR systems (as they switch providers) would allow long-term follow-up and address a substantial limitation of observational studies using routinely collected healthcare information. Although integration of multiple disparate sources could provide comprehensive cross-sectional and longitudinal healthcare data, linking individuals across systems opens substantial regulatory, privacy, and technical challenges. 3.6.4. Timeliness Timeliness refers to the interval until data becomes available for analysis. Because the Sentinel System will target new therapies, it may be important to have access to up-to-date information for monitoring and surveillance. This is especially important when a new medical product is quickly and widely disseminated. It may take three to six months for most claims (>95%) to be submitted, adjudicated, and be available for epidemiologic analysis. Although most insurers receive claims very soon after the care was provided, claims are subject to a complex adjudication process. The length of that adjudication process and the internal procedures implemented by each data owner impact how quickly data can be made available for research purposes. Even though claims data could be updated weekly or monthly, it is possible that data owners will find the updating process too onerous. EMR data are typically available much sooner than claims data, as they do not have to go through a submission and adjudication process. EMR data could be updated on a daily basis, and some researchers use daily EMR updates for public health surveillance activities.20
* It may be possible to minimize exchange of PHI by having two data holders use identical algorithms to perform one way encryption of identifiers, then evaluating the individuals who appear to match. To our knowledge this approach has not been implemented to link the kinds of health care databases of interest to the Sentinel System.
16
Final Report
The decision regarding where to store the data (i.e., a central or distributed model) does not necessarily impact the timeliness of the data; when the data are ready for sharing the data owner either sends it to a central repository or stores it locally for access through the System. The choice of database model could have an independent impact on timeliness to the extent that the model permits frequent updates (e.g., an encounter-based system can be updated at any time whereas an annual summary file should not be updated frequently) and requires substantial time and effort to create on the of the data owner.
4. COMPARE AND CONTRAST EXISTING DATABASES WITH SENTINEL SYSTEM NEEDS
4.1. Compare and contrast database models and characteristics with primary user needs of the Sentinel System Table 2 compares Sentinel System primary user needs to the several database models and their characteristics. Six primary user needs are presented across the top, with the database models and characteristics along the side. Since the focus here is on the ability of the data to address FDA’s needs, the ratings in Table 2 do not depend on whether data storage is distributed or centralized, or whether a common data model is used. This is because, although use of a common model greatly facilitates distributed research, the underlying granularity of the data and the characteristics of the data source impact the overall value of the data with respect to the user needs. That is, patient-level data are most granular and support most Sentinel System needs regardless of the way in which the data are organized or where the data are stored. Each cell in Table 2 includes a symbol denoting either how well the database model addresses the user needs, or how much value the database characteristic has in relation to the user need. An encounter-based patient-level data model that includes administrative and claims data and EMR information provides all the flexibility necessary to address the primary needs of the Sentinel System. Other data models that contain less granular information meet some of the needs of System, but not all. For each database model there are a wide range of specific implementation possibilities, and those possibilities will have some impact on how well the model meets the needs of the System. For example, a drug and condition era model could maintain specific patient identifiers that would allow linkage to other important information such as demographics, co-morbidities, and concomitant drug use, however, it is possible to have a drug and condition model that does not allow those linkages. Further, the ability to stratify by care setting (inpatient versus outpatient) is important for many safety surveillance activities, and it is possible that the summary models may or may not incorporate that stratification. This type of variation may be the result of a lack of information in the source files or a decision to exclude that information for other reasons of patient privacy or protection of proprietary information.
17

Final Report
Table 2. Ability of different database models to address Sentinel System needs Sentinel System User Needs
Database Models
Adverse event signal
detection
Augmentation of registry
information
Confirmatory safety studies
New medical products
monitoring
Safety surveillance data mining
Incidence and prevalence
rates Encounter based patient-level +++++ +++++ +++++ +++++ +++++ +++++
Patient-level summary data +++ +++ - ++++ ++++ +++
Drug and condition eras ++++ +++ - +++++ +++++ +++
Summary + - - +++ ++ ++ Characteristics Population-based +++++ +++++ +++++ +++++ +++++ +++++ Cohort-based +++ +++++ +++ +++ +++ ++ Linkage to medical charts ++++ +++ +++++ ++ ++ +
Linkage to external and cross institutional data sources
++ ++ +++++ + + +
Timeliness ++++ ++ ++ +++++ ++++ + +++++: Meets all needs/highest value ++++: Meets most needs/high value +++: Meets some needs/ somewhat valuable ++: Meets limited needs/ limited value +: Meets few needs/ little value
- : Not possible/ not relevant
5. Network Models and Other Initiatives 5.1. Data and network models The networks described below provide instructive examples, especially in the areas of infrastructure development. Although none of the networks have the capabilities required by the Sentinel System, there are some important overlaps such as the use of a common data model. It seems clear that developing any type of functioning network, whether to identify patients for a clinical trial or study large cohorts of patients for vaccine safety, requires substantial time and resources to develop governance procedures and data standards, to convert existing data into analyzable form, to verify its accuracy and correct problems that are identified, and to create communications capabilities that support network functions. The electronic Primary Care Research Network (ePCRN) focuses on identification of cohorts for enrollment in clinical research studies. Its security and privacy policies and approaches can be useful in developing a distributed research network. ePCRN does not have the capability to extract and store analytic datasets and remotely execute complex queries against them: that is, distributed analyses. The Harvard Catalyst distributed network project is based on the i2b2 and the Shared Pathology Information Network (SPIN) platforms, and like ePCRN, focuses on cohort or case identification and also will not be capable of distributed analytics. Both ePCRN and the Harvard Catalyst distributed network have (or plan to have) simple menu-driven querying capabilities. The current VSD data model is capable of conducting epidemiologic and surveillance activities for vaccine safety.
18

Final Report
5.1.1. Distributed models using a common data model approach Electronic Primary Care Research Network (ePCRN) The Electronic Primary Care Research Network (ePCRN) was created to facilitate patient recruitment for randomized controlled trial (RCT) studies among community medical practices in conjunction with the Federation of Practice-based Research Networks (FPBRN).21 Specific aims of the Network are to perform real-time identification of potential subjects for RCTs, to link primary care clinics with potential investigators, and to speed the translation and dissemination of research findings into clinical practice. Currently over one million patients are covered within the ePCRN. The ePCRN model reduces complications associated with semantic heterogeneity by making use of metadata and controlled vocabularies and utilizes software that accommodates variation in data structures (syntactic heterogeneity). The ePCRN has successfully overcome many of the trust issues that the Sentinel System will need to address. The ePCRN focused on a local data model with local control of the server (i.e., an autonomous system). Role-based restrictions define authorization policies as well as table- and column-based data restrictions for a finer degree of control. Much of the responsibility for maintaining authorization policies lies with the Research Director at each FPBRN site. Local institutional review boards (IRBs) and human subjects committees approve all research protocols and any data sharing arrangements, and typically protected health information (PHI) is only available locally. Additionally, significant effort has been put into developing a sustainable economic model that reimburses local practices when their locally held data is used. Informatics for Integrating Biology and the Bedside (i2b2) and Shared Health Research Information Network (SHRINE) i2b2 (Informatics for Integrating Biology and the Bedside) is an NIH-funded National Center for Biomedical Computing based at Partners HealthCare System.22 The purpose of i2b2 is to facilitate clinical and translational research. The i2b2 Center is developing a scalable informatics framework that will bridge clinical research data and the vast data banks arising from basic science research in order to better understand the genetic bases of complex diseases. The Harvard Catalyst (Harvard NIH Clinical and Translational Science Center) is developing a distributed network among participating entities in order to facilitate patient cohort identification and to identify the location of appropriate biological materials for research studies. This network will create the Shared Health Research Information Network (SHRINE) – a universal querying system – that will be built using the foundations of i2B2 and the Shared Pathology Information Network (SPIN). The i2b2 infrastructure uses a common data model that will be used to facilitate querying across the individual clinical data warehouses. HMO Research Network Virtual Data Warehouse (HMORN VDW) The HMO Research Network (HMORN) is a consortium of 15 U.S. health care delivery systems with integrated research divisions, offering a sample of geographically diverse, population-based health care data for more than 11 million U.S. citizens.23 HMORN collaborative projects that use data from multiple health plans include the NCI funded Cancer Research Network (CRN), the NHLBI funded Cardiovascular Research Network (CVRN), and the AHRQ funded Center for Education and Research on Therapeutics (CERT). These multi-center projects increasingly use the HMORN’s Virtual Data Warehouse (VDW), a distributed data network comprised of dataset standards and automated processes to facilitate the process of multi-site research while protecting the privacy of members and proprietary corporate information. Each health plan (site) maintains local datafiles that conform to VDW standards. These files are derived from administrative, claims, EMRs, and internal/external registries to cover enrollment, demographics, tumor, outpatient pharmacy dispensings, utilization (diagnoses and procedures), vital signs, census, death, and laboratory values (under development). At a minimum, site data must be updated annually; many sites update monthly. Vaccine Safety Datalink (VSD) The Vaccine Safety Datalink (VSD) Project is a collaboration between CDC’s Immunization Safety Office (ISO) and eight large managed care organizations (MCOs).2 It is recognized as a potential model for medical product safety monitoring. VSD investigators conduct “near real-time” surveillance on immunization safety issues and evaluate immunization safety hypotheses through research. The VSD analyzes data through a distributed data model (DDM) that was developed in 2002. Data from
19

Final Report
participating MCOs contain comprehensive medical and immunization histories for more than 5.5 million people annually. Participating MCOs assemble electronic administrative and claims and medical encounter data containing demographics, MCO enrollment, immunizations, and inpatient and outpatient diagnoses and procedures into a format specified by a data dictionary. All of the MCOs in the VSD are also members of the HMORN. Data is cleaned at sites and summary datasets are sent to the coordinating center for analysis weekly, although there can be up to an 8 week lag in the accrual of vaccination and outcome data, which can be detrimental to analyses when comparing exposed to unexposed individuals before the data “settle.” The DDM and newly created dynamic data files allow VSD investigators to conduct planned, near real-time surveillance for select vaccine adverse events. The VSD collaboration between clinicians, pharmacoepidemiologists, and vaccine safety experts produces findings that frequently influence national immunization policy and regulatory decisions. Menengococcal Vaccine Study The Meningococcal Vaccine Study is a post-marketing epidemiological evaluation of Guillain-Barré syndrome (GBS) following administration of a new meningococcal conjugate vaccine, Menactra®.9 The study represents a new collaboration that uses the data and other resources of five health insurers with an analyzable population of approximately 50 million members from 2005 through 2008. A common data model is used to support the distributed analysis of a cohort of approximately 10 million adolescents who belong to five health plans.9 Each of the five participating data owners extracts information from its data systems, and arrays in the study common data model that includes four standard format data files: demographics, enrollment, vaccination, outcome, and other medical encounter data. These files are maintained by the data owner; the study coordinating center leads the development of analytic programs, distributes the programs to the study sites, who run them and return tables, summary data and derived data elements for the common analysis. Each site is responsible for obtaining full text medical records from providers or medical facilities that submitted the claims associated with the diagnosis code indicative of GBS. Robert Wood Johnson Foundation Quality and Cost Project The Robert Wood Johnson Foundation has funded the Engelberg Center for Health Care Reform at the Brookings Institution and America’s Health Insurance Plans (AHIP) Foundation to conduct a project that will combine administrative and claims data from multiple health plans to provide a broader picture of physicians' care across their entire practices.24 Only by combining information from multiple health plans can a complete view of physician care be generated. Data will be aggregated across the public and the private sector health plans to assess quality measures endorsed by the National Quality Forum, and it will collaborate to develop and implement new measures for comparing the cost of care. 5.1.2. Centralized models General Practice Research Database (GPRD) The General Practice Research Database (GPRD) is a centralized population-based computerized database of anonymized, longitudinal electronic medical records and prescriptions from more than 500 primary care practices in the United Kingdom (UK).25 Within the UK, approximately 98% of the population is registered with a general practitioner (GP), who is responsible for almost the entirety of the patient’s medical care. The system was established in 1988 and currently includes data on approximately 13 million patients total, with approximately 6.5 million patients actively contributing data at any given time. Although all patient and practice identifiable data are removed, individual records can be linked longitudinally via a unique identification number. The GPRD has been recognized as an important tool for public health research due to its large size and its ability to obtain additional supplemental clinical detail and healthcare information.26
Health registries A health registry is a systematic collection of data about outcomes or exposures.27 Registries often hold centralized data on patients with a specific disease, including demographics and outcomes. Registry data can be collected through population-based surveillance (e.g., Surveillance Epidemiology and End Results [SEER]),28 patient opt-in (e.g., University of Pittsburgh Medical Center Arthritis Network)29, or
20

Final Report
physician referral (e.g., Victorian Spleen Registry at Alfred Hospital).30 Registries can be an important tool in determining incidence of diseases or outcomes or a centralized way to hold data on individuals with identical exposures or outcomes. However, health registries are often resource intensive to build and maintain, and can be limited in their ability to follow people longitudinally over many years. Although many registries are centralized, some registry data are collected in a de-centralized manner, and some have proposed using a distributed approach to analyze data held in disparate registries.31
National Cardiovascular Data Registry The National Cardiovascular Data Registry (NCDR)® is an initiative of the American College of Cardiology Foundation®.32 The NCDR helps achieve its mission of improving cardiovascular patient care through specific registries that collect information from patients who receive care at multiple institutions; the data are centrally stored for analysis. These hospital-based cardiovascular registries include ACTION Registry®-GWTG TM for acute coronary syndrome patients, CARE Registry® for carotid artery revascularization and endarterectomy procedures, CathPCI Registry® for diagnostic cardiac catheterizations and percutaneous coronary interventions, ICD Registry TM for implantable cardioverter defibrillators, and IMPACT Registry TM for improving pediatric and adult congenital treatment. These registries are examples of prospective data collection using that uses a common data model and a centralized data warehouse. Patients much provide informed consent for participation in the registries. Other databases Several companies sell access to databases with attributes such as full integration, de-identified data, and individual-level claims data, including IMS Health,33 MarketScan®,34 GE Centricity® EMR,35 and D2Hawkeye®.36 These can allow flexible and individualized design and implementation of analyses and can be rich in data. However, these systems are limited in their ability to link back to individuals for follow-up or further review. Other databases include individual health plans, health plan partnerships (e.g., Blue Health Intelligence®),37 and medical facilities that either conduct research or are willing to partner on research projects using their data resources. 5.1.3. Health Information Exchanges (HIE) A health information organization exchange (HIE) oversees and governs the exchange of health-related information among organizations according to nationally recognized standards. Regional health information exchanges are multi-stakeholder organizations responsible for motivating and causing integration and information exchange of health data for the purpose of improving the safety, quality, and efficiency of healthcare in that community. Although HIEs are not designed for research, they have the ability to share information from disparate sources. A well-known example is the Indiana Health Information Exchange, which provides services that streamline the healthcare industry by delivering information at the point-of-care.38 Products include a clinical messaging service, which provides communities with a single source for clinical results, and a disease management system, which creates reports that physicians can use to better monitor and improve the health of their patients. A typical HIE application is the ability to query disparate healthcare data sources (e.g., participating health insurers and medical group practices) in the community and retrieve information (e.g., recent medical dispensings) for a specific patient at the point of care in an urgent care environment.
5.2. Drug safety and information technology initiatives Several health information technology initiatives are relevant to the study of drug safety. These include standardization activities that may now be overseen by the Office of the National Coordinator for Health Information Technology (ONCHIT) and include HL7, caBIG, the Health Information Standards Technology Standards Panel (HITSP), among others. Some relevant coding standards include ICD-9-CM, HCPCs, and National Drug Codes. Other relevant standards include MedDRA, CDISC, RxNorm, SNOMED CT and LOINC. The National Library of Medicine maintains a Unified Medical Language System to help understand and use some of these standards. Other standards include the Continuity of Care Record
21

Final Report
(CCR) and the Continuity of Care Document (CCD), competing standards for the summary representation of patient health information. Information technology approaches to health care data networking are being developed through the caBIG Health Consortium and CDC’s National Center for Public Health Informatics. So although there are many initiatives and standards bodies, there is no single standard for the representation of healthcare data. There are billing standards used by CMS (and developed by the National Uniform Billing Committee) for submission of Medicare claims.
6. RECOMMENDATIONS Our recommendations are described below. Figure 1 illustrates the three of the key decisions: where the data are stored, how the data are stored, and how the data will be analyzed. .
What data are needed to meet system needs? We recommend initial development of the Sentinel System using data arising from defined populations, i.e., those for whom there is sufficiently complete information regarding therapies and outcomes that occur during specified periods. The best possible sources are ones that maintain administrative and claims data together with EMR data that arises from defined populations. Although the combination of administrative, claims, and EMR data for defined populations is preferred, relatively few systems have all the necessary data resources. The next priority should be large public and private insurers with large defined populations in administrative and claims databases. This recommendation is based on the large fraction of the population covered by these organizations (well over 100 million people), existing cross-institutional standardization, the comprehensive capture of ambulatory drug and some other exposures and many outcomes of interest, and extensive experience using these data sources for post-marketing safety analysis. These data sources will be very useful for assessing many types of questions. However, they are not well suited to evaluating medical devices and inpatient care that cannot be uniquely identified with administrative, claims, and EMR data. Continued development should incorporate data from other settings and sources that would expand the ability of the system to cover other regulated products. For example, inpatient data are needed to evaluate short-term outcomes of therapies like blood products, contrast agents, and general anesthetics; for these treatments and outcomes, inpatient data alone covers the defined population of interest. Inpatient data could also help identify specific medical devices and agents used in surgery. Additional work will also be indicated to take advantage of data in registries and practice-based EMRs; this will ordinarily require linking them to more complete data sources.
Where will the data stored? We support FDA’s announced intention to adopt a distributed data model in which the data are held by the data owners, giving the data owner control over access to, and use of, their data. This model is mostly likely to be acceptable to data owners because it gives the data owner control over the security, access, and use of the data, and allows data owners a clear and controllable mechanism for opting-in or opting-out of System activities. There is sufficient precedent to give confidence that a distributed model can work at the required scale.
How will the data be analyzed? We recommend a centralized approach to analytics in which queries, in the form of executable computer programs, are distributed to the data holders, who run them on locally held data (see Section 3.3). This approach ensures a level of standardization of definitions and analytic approaches, and of data quality that will otherwise be extremely difficult to achieve. This approach effectively requires adoption of a common data model.
22

Final Report
How will the data be stored? We recommend adopting a common data model, because the required initial mapping of different data structures, definitions, and concepts, facilitates subsequent uses. It will be important to preserve sufficient granularity of the data to support many needs, while avoiding complexity that will complicate standardization or use of the data.
Distributed Data Storage
Common Data Model Recommended
Data Storage(Section 3.2)
Data Model(Section 3.4)
Analytic Programming(Section 3.3) Comments
+ =
Figure 1. Overview of Sentinel System Configuration Options
+ Single Analytic Program
Distributed Data Storage
Common Data Model
Redundant effort; difficult to ensure
comparability+ =+ Multiple Analytic
Programs
Distributed Data Storage
No Common Data Model
Complex programming requirements+ =+ Single
Analytic Programs
Distributed Data Storage
No Common Data Model
Difficult to ensure comparability+ =+ Multiple
Analytic Programs
Centralized Data Storage
Common Data Model
Loss of local control and expertise+ =+ Single
Analytic Program
Centralized Data Storage
No Common Data Model
Loss of control; complex programming requirements+ =+ Single
Analytic Program
7. CONCLUSION The choice of database model for the Sentinel System must balance the primary user needs with the ability to enlist participation of data owners and external stakeholders, with the resource needs of the different options, and with the need to maintain flexibility to accommodate the rapid developments in health information technology. We suggest a staged approach, with a first stage that couples distributed access to the commonly available data sources (i.e., administrative and claims data), and that the distributed data be stored in a common data format. The data holders should be required to have access to original medical records to validate the coded electronic information. This will meet many primary user needs and also be acceptable to data owners. The next step, which should follow as soon as practicable, should be addition of EMR data from organizations that also have administrative and claims data, or that can provide other kinds of data to ensure complete coverage of defined populations. Additional System functionality, for instance developing capabilities for studying exposures and outcomes limited to inpatient settings, and new data sources can be added as the System matures.
23

Final Report
8. REFERENCES 1. Moore KM Duddy A, Braun MM, Platt R, Brown JS. Potential population-based electronic data
sources for rapid pandemic influenza vaccine adverse event detection: a survey of health plans. Pharmacoepidemiol Drug Saf. 2008;17:1137-1141.
2. Vaccine Safety Datalink project. Website: http://www.cdc.gov/vaccinesafety/vsd/.
3. Ryan PB, Mera R, Merrill GH. Opportunities and Challenges in Leveraging Observational Data for Pharmacovigilance. AMIA Pharmacovigilance and Informatics Summit, Washington DC, June 2007.
4. Strom BL. Data validity issues in using claims data. Pharmacoepidemiol Drug Saf. 2001;10:389-392.
5. Cooper WO, Hernandez-Diaz S, Gideon P, et al. Positive predictive value of computerized records for major congenital malformations. Pharmacoepidemiol Drug Saf. 2008;17:455-460.
6. Hennessy S, Leonard CE, Palumbo CM, Newcomb C, Bilker WB. Quality of Medicaid and Medicare data obtained through Centers for Medicare and Medicaid Services (CMS) Med Care 2007;45:1216-1220.
7. Hennessy S, Bilker WB, Weber A, Strom BL. Descriptive analyses of the integrity of a US Medicaid claims database. Pharmacoepidemiol Drug Saf. 2003; 12:103-111.
8. Connecting for Health, the Markle Foundation. Website: www.connectingforhealth.org.
9. Velentgas P, Bohn RL, Brown JS, Chan KA, Gladowski P, Holick CN, Kramer JM, Nakasato C, Spettell CM, Walker AM, Zhang F, Platt R. A distributed research network model for post-marketing safety studies: the Meningococcal Vaccine Study. Pharmacoepidemiol Drug Saf. 2008;17(12):1226-34.
10. Ryan P, Painter J, Merrill G. Defining medical conditions by mapping ICD-9 to MedDRA: a systematic approach to integrating disparate observational data sources for enabling enhanced pharmacovigilance analyses. Poster presented at the 44th Annual Drug Information Association Meeting, Boston, MA; 2008.
11. Merrill GH, Ryan PR, Eng M, Painter J. Using SNOMED to normalize and aggregate drug references in the Safetyworks observational pharmacovigilance project. Poster presented a the 3rd Annual KR-med International Conference, Phoenix, AZ; 2008.
12. Graham DJ, Staffa JA, Shatin D, et al. Incidence of hospitalized rhabdomyolysis in patients treated with lipid-lowering drugs. JAMA. 2004;292(21):2585-90.
13. Andrade SE, Gurwitz JH, Chan KA, et al. Validation of diagnoses of peptic ulcers and bleeding from administrative databases: a multi-health maintenance organization study. J Clin Epidemiol. 2002;55(3):310-313.
14. Andrade SE, Graham DJ, Staffa JA, et al. Health plan administrative databases can efficiently identify serious myopathy and rhabdomyolysis. J Clin Epidemiol. 2005;58(2):171-4.
15. Goff SL, Feld A, Andrade SE, et al. Administrative data used to identify patients with irritable bowel syndrome. J Clin Epidemiol. 2008;61(6):617-21.
16. Harrold LR, Saag KG, Yood RA, et al. Validity of gout diagnoses in administrative data. Arthritis Rheum. 2007;57(1):103-8.
17. Eng PM, Seeger JD, Loughlin J, Clifford CR, Mentor S, Walker AM. Supplementary data collection with case-cohort analysis to address potential confounding in a cohort study of thromboembolism in oral contraceptive initiators matched on claims-based propensity scores. Pharmacoepidemiol Drug Saf. 2008;17(3):297-305.
18. Nordstrom BL, Norman HS, Dube TJ, Wilcox MA, Walker AM. Identification of abacavir hypersensitivity reaction in health care claims data. Pharmacoepidemiol Drug Saf. 2007;16(3):289-96.
24

Final Report
19. Velentgas P, West W, Cannuscio CC, Watson DJ, Walker AM. Cardiovascular risk of selective cyclooxygenase-2 inhibitors and other non-aspirin non-steroidal anti-inflammatory medications. Pharmacoepidemiol Drug Saf. 2006;15(9):641-52.
20. Lieu TA, Kulldorff M, Davis RL, et al.; for the Vaccine Safety Datalink Rapid Cycle Analysis Team. Real-time vaccine safety surveillance for the early detection of adverse events. Med Care 2007;45(10 Supl 2):S89-95.
21. Electronic Primary Care Research Network (ePCRN). Website: http://www.epcrn.bham.ac.uk.
22. Informatics for Integrating Biology and the Bedside (i2b2). Website: https://www.i2b2.org.
23. HMO Research Network (HMORN) Website: http://www.hmoresearchnetwork.org.
24. Robert Wood Johnson, Engelberg Center for Health Care Reform at the Brookings Institution and Americans Health Insurance Plans. Website: http://www.rwjf.org/pr/product.jsp?id=22371.
25. General Practice Research Database (GPRD). Website: http://www.gprd.com/home/default.asp.
26. Lewis JD, Brensinger C, Bilker WB, Strom BL. Validity and completeness of the General Practice Research Database of studies of inflammatory bowel disease. Pharmacoepidemiol Drug Saf. 2002;11:211-218.
27. Gliklich RE, Dreyer NA, eds. Registries for Evaluating Patient Outcomes: A User's Guide. (Prepared by Outcome DEcIDE Center [Outcome Sciences, Inc. dba Outcome] under Contract No. HHSA29020050035I TO1.) AHRQ Publication No. 07-EHC001-1. Rockville, MD: Agency for Healthcare Research and Quality. April 2007.
28. Surveillance Epidemiology and End Results (SEER). Website: http://seer.cancer.gov
29. University of Pittsburgh Medical Center Arthritis Network. Website: http://www.arthritis.pitt.edu/netreg.htm
30. Victorian Spleen Registry at Alfred Hospital. Website: http://www.baysidehealth.org.au/infectious_diseases_unit/.
31. Brigham and Women’s Hospital, Harvard Medical School. An automated system to monitor medical device safety (F. Resnic). Website: http://www.dsg.harvard.edu/index.php/Main/ProjectSafety
32. National Cardiovascular Data Registry. Website: http://www.ncdr.com/webncdr/common
33. IMS Health. Website: http://www.imshealth.com
34. MarketScan®. Website: http://research.thomsonhealthcare.com/
35. GE Centricity® EMR. Website: http://www.gehealthcare.com/usen/hit/products/centricity_practice/emr_index.html
36. D2Hawkeye. Website: http://www.d2hawkeye.com.
37. Blue Health Intelligence. Website: http://www.bcbs.com/innovations/bhi/
38. Indiana Health Information Exchange. Website: http://www.ihie.com/
25