fdi and economic growth in pakistan: a sector wise ... and... · sugar, paper and pulp, leather and...
TRANSCRIPT

FDI and Economic Growth in Pakistan: A Sector Wise
Multivariate Cointegration Analysis
Adeel Ahmad Dar Visiting Lecturer at Department of Economics, Government College University,
Lahore, Pakistan Email: [email protected]
Contact No: +923214551036
Hafiz Muhammad Ali Bhatti, PhD Principal, Government Gordon College, Rawalpindi, Pakistan
Email: [email protected] Contact No: +923335703934
Taj Muhammad
Ph.D Candidate at Schumpeter Business School, University of Wuppertal, Germany
Email: [email protected] Contact No: +92301-4367105

Abstract
Liberal economic policies have promoted economic growth via Foreign Direct Investment (FDI)
around the globe. This paper investigates this preposition by resorting to sector-specific FDI and
GDP to Vector Error Correction Model (VECM) within panel cointegration methodology using
domestic investment, infrastructure, human capital and institutions as control variables. For this
purpose, Pakistani economy is disaggregated into primary, secondary and tertiary sectors. For
FDI and GDP of primary sector, various economic groups such as food, beverages, tobacco,
sugar, paper and pulp, leather and leather products, rubber and rubber products are used.
Similarly, for secondary sector, chemicals, pharmaceuticals and fertilizers, petro chemicals and
petroleum refining, cement, basic metals, metal products, machinery other than electrical,
electrical machinery, electronics, transport equipment, power, construction, mining and
quarrying, oil and gas exploration economic groups are used. For tertiary sector, wholesale and
retail trade, tourism, transport, storage and communication, financial businesses, social and
private services are used. Moreover, infrastructural and institutional index is derived using
Principle Component Analysis (PCA). Although, the panel approach signified both long run and
short run relationship between FDI and GDP but sector wise relationships are dismal. Only FDI
of primary sector showed short run relationship with respective GDP. Moreover, no cross sector
spillover exists between primary, secondary and tertiary sectors of Pakistan.
Keywords: Foreign Direct Investment, Economic Growth, Time Series Model, Panel Data
Model
JEL Codes: F23, O4, C31, C33

1. Introduction
From last three decades, minimal trade barriers along with progressive liberalization
economics policies have promoted globalization. Multinational enterprises (MNEs) defined by
centralized authority, international operations and massive new knowledge have complement the
evolution of international economy (Dunning, 1989). The liberal economic policies have
expressively contributed in advanced economies (Tintin, 2012). This liberalized thinking was
complemented by contemporary economic setup in these economies. Free trade via liberalized
economic policies, massive physical and human capital was boosted achieving massive growth
rates.
In 2000, 4.3% of global GDP was held by world’s largest 100 MNEs. On the whole, the
market value was 6.3 trillion US$. The intrusion of FDI in developing world has also promoted
economic growth. But the existing literature on economic growth highlights local structural
composition as a hurdle in the path of their economic growth (Perez, 1985). Similarly, the
dependency upon developed world’s knowledge also complements the structural problem of
developing economies. Moreover, the domestic absorptive capacity of developing economies
remains a point of concern for new knowledge intake from developed world (Adler, 1965). To
absorb new knowledge, efficient domestic human capital and infrastructure of the host economy
is a necessary condition (Narula & Marin, 2003). These threshold requirements limit absorptive
capability hindering the process of technology diffusion and growth in developing economies
(Nelson & Phelps, 1966). The developing economies remain stuck in vicious circle of low
growth rates, poor health of population, incompetent training and low work prospects. Therefore,
primary sector is a central catalyst to growth. The primary sector consists of inefficient labor,
minimal incomes and labor focused mechanisms for production (Lewis, 1954). Additionally, this

primary sector has an inadequate magnitude of land for production. Therefore, this dependence
upon primary sector leads to skeptical growth in developing economies.
The inefficient traditional sector also hinders the growth of other sectors. The provision
of cheap raw materials to secondary sector becomes limited mainly due to inefficient primary
sector. An inefficient primary sector also burdens secondary sector via excessive unproductive
labor supply. Therefore, the up gradation of primary sector is necessary for developing
economies. It can promote new industries along with expansion of prevailing ones. This
expansion of secondary sector also expand traditional sector because the demand for raw
materials grows significantly over time. Similarly, this growth also links with tertiary sector
because the demand for services in both these sectors would have a significant impact on tertiary
sector. To generate this linkage between sectors, the provision of FDI is pivotal for developing
economies. Because it can assist via new knowledge, improved capability of human capital and
increased production capability etc. The interconnection between sectors can be promoted the
provision of foreign capital. The primary sector of developed economies received 157 billion
US$ as FDI in 2005 (FAO Investment Centre). The stable inflow of investment in primary sector
also enhances capital flow to secondary sector (Lewis, 1954). But African and Asian economies
received very meager amount of FDI in comparison of advanced ones. Over the last decade,
advanced economies recorded more FDI inflows to secondary against primary sector. This shift
of investment towards secondary sector is accordance to Lewis (1954) description of linkage
with between primary. The similar pattern of FDI was also recorded by African and Asian
economies. The shift to secondary sector comes due to growth of primary sector. As primary
sector grows, the greater availability of cheap inputs encourages finished goods and services.

As secondary sector grows, it is complemented by tertiary sector (Berman, Bound, & Griliches,
1994). The first stage of value chain requires research and development (R&D) activities
followed by retailing and repairs etc. Tertiary sector provides wide-ranging activities like
transportation, education, financial services, trade, information and technology etc. used by
manufacturers during production. In 2008, half of the business services were used by secondary
sector. While in 2011, the services intensity for electronic products raised to 48% which was
only 25% in 2008. Moreover, in 2010, tertiary sector recorded 268 billion US$ of FDI in
advanced economies, while Asia and Africa only received 9 billion US$. Despite massive influx
of FDI in all three sectors, developed economies maintained a growth rate of 2% by 2012
whereas; developing economies showed a growth rate of 4% (World Development Indicators
(WDI)). These growth rates indicate that foreign capital has improved the domestic capabilities
in developing economies (Agmon & Hirsch, 1979).
For 2012, Pakistan recorded an impressive growth rate of 4.4% (KPMG, 2013). Pakistan
is a top liberal economy in South Asia. With an open economy having rapid paced private sector,
Pakistan allows 100% foreign equity in its secondary sector. However, the primary sector
provides employment to 45% labor force but tertiary sector has a massive share of 58% in
Pakistan’s GDP. Still, the primary sector is the driving force of the economy. In 2013, primary
sector had a growth rate of 3.3%, 3.5% of secondary sector and 3.7% of tertiary sector. Similar to
other economies, FDI inflows in tertiary sector has shown a massive increase as compared to
other sectors of Pakistan’s economy. Like other developing economies, the primary sector of
Pakistan’s economy is characterized by low productivity, inefficient labor, energy deficiencies
and fewer enticements. The secondary sector is composed of automotive, infrastructure,
commercial machinery, construction, pharmaceuticals, textiles and electronics. Like the global

economy, tertiary sector have also grown rapidly in last decade. Pakistan’s tertiary sector
consists of trade, financial services, oil and gas exploration and technology. In 2012, the
financial sector had assets of 10 billion rupees. Oil and gas exploration received FDI of 570
million US$. While infrastructure has a share of 11% in total GDP. The IT sector received 12
billion US$ of investment in last seven years.
Pakistan continuously promotes investor friendly policies to attract MNEs. Pakistan
facilitates foreign investors via full repatriation of profits, dividends and capital gains. In terms
of legal protection, Foreign Private Investment Act 1976 and Protection of Economic Reforms
Act 1992 focuses on removing equity caps on financial services, unnecessary regulations,
ensures transparency and quality inputs to foreign investors. However, the existing literature on
FDI in Pakistan is contemptuous. The studies by Iqbal, Shaikh, and Shar (2010), Ghazali (2010),
N. Ahmad, Hayat, Luqman, and Ullah (2012), M. H. Ahmad, Alam, Butt, and Haroon (2003)
and Dutta and Ahmed (2004) provides empirical evidence of role of FDI in Pakistan but a
concrete evidence is still missing. The study by Khan and Khan (2011) used similar approach as
used in this paper but estimated bivariate and gross effect estimation which isn’t a
comprehensive analysis of FDI growth nexus in case of Pakistan. The paper targets three major
issues: first, FDI-growth nexus in case of Pakistan by panel data approach. Second, how primary,
secondary and tertiary sectors are affected by their share of FDI? Last, to investigate the
existence of cross sector between Primary, Secondary and Tertiary sector. For this purpose, the
time span of 1997-2013 is targeted because of data availability of industry specific FDI and GDP
at State Bank of Pakistan (SBP). This study also uses domestic investment, human capital,
infrastructure and institutions as other explanatory variables.

This paper is divided into five sections. The second section represents the literature review.
The third section is of data and methodology used in this research. The fourth section shows
empirical outcomes. The last section represents conclusion and policy implication of this
research.
2. Literature Review
The presence of foreign direct investment (FDI) can be found even in 2500BC. Back then,
Sumerian merchants controlled their overseas commerce through foreign men. The expansion of
East India Company in 1600 and the existence of Virginia Company by 1606 at Jamestown, the
first foreign direct investment in America explain the presence of foreign investment as a
concept in human history (Wilkins, 1970). The industrial revolution prompted the need of
foreign investment and trade to increase production efficiency (Hussain, 2004).
By 19th century, European firms became well-known in Asia, Latin America and Africa.
European industries moved their capital abroad for cheap raw materials and higher returns
(Hobson, 1914). The neo-classical trade theory based on Heckscher and Ohlin model also
explains the capital movement for higher returns. This traditional theory of investment is linked
with ‘differential rate of return hypothesis’. The higher expectation of capital return motivates
foreign investment in a developing economy (Hufbauer, 1975; Nurkse, 1935). In addition, cheap
availability of raw materials for higher returns is complemented by ‘market size hypothesis’. A
firm increases investment in response to expected sales in a developing economy (Markowitz,
1959; Tobin, 1958). The creation of multinational enterprises (MNEs) is primarily linked to
economies of scale, nonmarketable technology, management and diversification of production
limiting competition in host economies (Hymer, 1976). Another justification of foreign
investment can be done through ‘product cycle hypothesis’. An innovating firm in accordance to

demand at home produces new product. Then, this new product is exported to other host
economies because the maturity of a new product at home forces a firm to invest overseas
(Agmon & Hirsch, 1979; Vernon, 1966). MNEs create new knowledge and upgrades domestic
labor, reducing cost of production in host economies (Buckley & Casson, 1976).
On the other hand, host economies prefer resource and efficiency seeking FDI in their
labor intensive economy. It improvises technical skills of domestic labor along with
infrastructure (Conner, 1991). Moreover, MNEs prefer regions having social, political and
economic uniformity (Dunning, 1980). These united markets provide common communication
infrastructure, trade patterns, availability of cheap raw materials and networking structure to
MNEs. The MNEs of Europe followed this regional pattern in Latin America, Africa and Asia to
exploit low-cost inputs for global integration (Dunning, 1998). The customary factors did play a
critical role in the progress of FDI (Reuber, 1973) but tax regulation and political stability also
influenced investment decisions especially in developing world (Dunning & Enterprises, 1993).
The unprecedented growth of globalization marginalized idiosyncratic factors such as cheap
inputs and regional uniformity against poor political situation and economic policies of
developing world (UNCTAD, 1997). In terms of low trade barriers, MNEs frolicked significant
share in the growth of developing economies. During 1991-1996, 100 economies adopted 599
liberalizations while only in 1997, 151 liberalizations changes accrued in 76 economies, mostly
Asian. This increase in trade liberalization policies demanded sufficient infrastructure, steady
administrative and economic milieu, skilled human capital, low-cost inputs, and rule of law as
prerequisites (UNCTAD, 1997). Ultimately, MNEs have to extemporize in new markets to race
with their opposing investors. This promotes growth and creates value addition. This economic
activity increases wages and competition. Eventually, MNEs look for more FDI destinations with

similar prerequisites (Jawahar & McLaughlin, 2001). The recurrence of this cycle will result in
latest locations, creating new rivalries along with the probe of new prospective regions for
investment.
Given the conceptual understanding, post liberalization period of developing economies
empirically proves FDI led growth nexus (Blonigen & Wang, 2004; Khawar, 2005; Lim, 2001;
Lipsey, 2004). This optimistic view is supported by certain threshold levels; efficient domestic
labor, infrastructure and law and order situation etc. As various spillovers are associated with
FDI, these thresholds complement the growth path of developing economies (Borensztein, De
Gregorio, & Lee, 1998). Recent studies showed the existence of FDI-growth nexus in developing
economies (Basu, Chakraborty, & Reagle, 2003; Hansen & Rand, 2006; Tadesse & Ryan, 2005).
Being a composite bundle, the impact of FDI is manifold in developing economies
(Balasubramanyam, Salisu, & Sapsford, 1996; De Mello, 1999). But various empirical studies
did focus upon export promotion due to FDI led growth (Rahmaddi & Ichihashi, 2012; Tadesse
& Ryan, 2005). Although, which sector’s exports should increase is debatable but most empirical
studies stress upon manufacturing and services exports due to FDI (Castejón & Woerz, 2006;
Ramasamy, Yeung, & Laforet, 2012) because, manufacturing and services are expected to
produce finished goods and services as compared to primary sector in developing economies.
Most developing economies are dependent upon primary sector. Being characterized by
abundance labor, lower efficiency and low wages, primary sector provides raw materials to
secondary sector (Lewis, 1954). It also provides numerous opportunities for FDI. FDI inflows to
primary sector tend to increase productivity through processed food items (Gow & Swinnen,
1998; Hawkes & Hawkes, 2005). It also results in output and yield increase. The expansion of
primary sector does affect secondary sector as well (Wachter, Gordon, Piore, & Hall, 1974). As

primary production increases, more cheap raw materials are available to secondary sector. Then,
the influx of FDI to secondary sector raises domestic market’s productivity and thus economic
growth (Banga, 2004; Elu & Price, 2010; Vahter, 2010). The MNEs have to transfer knowledge
to its domestic counterparts in order to capture new market. At first, domestic producers might
not be able to compete with MNEs but, knowledge transfer will help the natives to compete in
the long run (Javorcik, 2004). This knowledge transfer will increase the manufacturing
productivity through new production techniques and decreased factor prices creating a direct
linkage between primary and secondary sector. As domestic manufacturing market become
technology intensive to compete with MNEs by investing in R&D activities, more FDI takes
place (Guo, Gao, & Chen, 2013; Park, 2004; Simões & Simões, 1988). On the other hand,
services sector is also embedded in manufacturing value chain (Weill, 1992). The manufacturing
sector stresses upon sourcing of inputs and marketing through electronic media, creating
interdependence with services sector. Moreover, the linkages with manufacturing sector are
important for sustainable employment in the economy (Park, 2004). This growth of services
sector attracts FDI creating more linkages with manufacturing sector (Kolstad & Villanger,
2008). FDI to services can complement manufacturing sector’s growth. As services grow, it
raises manufacturing sector’s productivity through R&D activities, operational management such
as production and distribution services (Carree & Thurik, 2003).
Being a developing economy, Pakistan adopts investor attractive policies, offering
complete return on capital and profits. MNEs are revered with Foreign Private investment
Promotion and Protection act of 1976 and Protection of Economic Reforms act of 1992. Pakistan
focuses on minimizing process of doing business, provision of business infrastructure and tax
liberties for foreign investors (KPMG, 2013). The existing literature about the role of FDI in

Pakistan mainly targets trade (Dutta & Ahmed, 2004; Iqbal et al., 2010). Moreover, the literature
shows a long run relationship between of FDI inflows and economic growth of Pakistan (Ahmad
et al., 2003, Mughal, 2008, Khan & Khan, 2011, Zeb et al., 2013, Aqeel & Nishat, 2004,
Rahman, 2014, Younus et al. (2014), Abdullah et al., 2015 & Dar et al., 2015). FDI inflows also
promote domestic investment and exports of Pakistan. (Ahmad et al., 2012; Ghazali, 2010). The
influx of FDI along with financial development also promotes economic growth (Shahbaz &
Rahman, 2012). Similarly, FDI collaborates with domestic investment to promote economic
growth (Dar et al., 2015). On the other hand, Falki (2009), Shaheen et al. (2013) & Saqib et al.
(2013), showed a negative relationship between FDI and economic growth in case of Pakistan.
The existing studies on Pakistan are of time series dimension, targeting an overall impact of FDI
on trade, domestic investment and economic growth. This study tends to focus on a new
dimension of analyzing FDI-growth nexus. This study targets the FDI led growth hypothesis by
sector wise analysis of Pakistan.
3. Data and Methodology
For years, FDI has been a premier source of investment in Pakistan. It out spaces
portfolio investment and directly impacts the economic growth of Pakistani economy (Ghazali,
2010). Post liberalization period show huge influx of FDI in all sectors of Pakistan (Khan &
Khan, 2011). Although, primary sector had a significant share in Pakistani national income but, it
was used to facilitate secondary sector during different government regimes. Having a direct
linkage between them, both sectors received FDI respectively. But being a developing economy,
influx of FDI also recorded steep decline halting growth, mainly due to multidimensional
uncertainties in Pakistan (Khan & Khan, 2011). This study records Pakistani economy into three
sectors; primary, secondary and tertiary sector. Each sector is comprised of different economic

groups. For primary sector, food, sugar, beverages and tobacco, paper and pulp, rubber and
rubber products and leather and leather products are included. For secondary sector, chemicals,
pharmaceuticals and fertilizers, petro chemicals and petroleum refining, cement, basic metals,
metal products, machinery other than electrical, electrical machinery, electronics, transport
equipment, power, construction and mining and quarrying with oil and gas exploration are
included. For tertiary sector, financial businesses, tourism, transport, wholesale and retail trade,
storage and communication, social and private services are included. The selected sample period
is 1997-2013. While, the data used was collected from State Bank of Pakistan (SBP), Economic
Survey of Pakistan (2012-2013), Pakistan Bureau of Statistics (PBS), World Governance
Indicators (WGI) and United Nation Development Program (UNDP) reports.1
(a) Variable Definitions
The definitions of different variables used in this research are defined below:
(i) Gross Domestic Product (GDP): GDP is a measure of economic activity of an
economy. For a specific period of time, it highlights the total market value of both
goods and services within geographical boundary of an economy. Here, it is
subdivided into primary, secondary and tertiary sectors of Pakistani economy.2
(ii) Foreign Direct Investment (FDI): It represents a long term relationship between the
direct investor and resident entity. The direct investor of home economy owns ten
percent or more of the ordinary shares or voting power in resident entity of host
economy. It includes flows of funds, reinvestment of profits, intercompany debt
transactions, property patents and technology transfer etc.3
(iii) Domestic Investment (DI): Gross Fixed Capital Formation (GFCF) is used to explain
domestic investment. It represents new and existing resources by households, firms

and governments. But, it shows a gross value as it excludes disposals of fixed assets
within an economy. It only includes net improvement in land value but, excludes
mineral reserves, water forests and subsoil assets etc.
(iv) Infrastructure (INF): Infrastructure can be defined as the basic facilities required for
the working of any economy. It can be categorized into physical and organizational
services to enhance efficiency of an economy. For primary sector, we have used total
cropped area, credit disbursement (in million rupees), water availability to crops,
import of insecticides, production of tractors, number of tube wells, fertilizers off take
and energy consumption such as petroleum, gas and electricity for primary production
as infrastructural indicators. For secondary sector, energy consumption such as
electricity, gas and petroleum for secondary production are used. For tertiary sector,
education expenditure (% of GNI), health expenditure (% of GDP), total number of
mobile phones, law and order expenditures (in million rupees), quantity of buses and
length of roads was used as infrastructural indicators.4
(v) Human Capital (HC): Human Capital represents the skills possessed by individuals
such as knowledge and experience etc. Here, Human Development Index (HDI) is
used as Human Capital. While, HDI is the combination of knowledge, standard of
living and life expectancy at birth.
(vi) Institutions (INST): Institutions are defined as formal rules and informal norms that
structure human interaction through legitimate enforcement mechanism. Where,
human defined constraints are formal rules while, informal norms are imbedded
cultural norms of a society. Institutions ensure all kinds of transactions which help to

preserve life. For an institutional index, indicators such as political stability, control
of corruption, voice and accountability and rule of law were used.5
(b) Approach
Although, the contemporary hypothetical and pragmatic literature has emphasized on
feedback mechanism between FDI and economic growth in both long run and short run
dynamics, but empirical evidence on sector wise analysis is unfounded in case of Pakistan. In
addition, existing literature does not focus on FDI led growth in detail. On this basis of time
series analysis, the unit root characteristics in panel data can subject to spurious regression. A
comprehensive analysis is needed to complement policy structure regarding FDI through
cointegration between FDI and economic growth in both long run and short run in case of
Pakistan.
We formulate a panel framework based on three cross sections (primary, secondary and
tertiary) with seventeen time dimensions. Our empirical analysis is based on three steps (Basu et
al., 2003). Beginning from stationarity of variables, the existence of unit root prompted to check
for long run cointegration between respective variables (Pedroni, 2004). Given the existence of
long run cointegration across the panel, we look for error correction model to uncover granger
causality in the third step of our estimation. Comparing with the existing literature, our analysis
of panel data points out a major new dimension about FDI led growth hypothesis for Pakistan
but, it also has certain limitations as well. A steady series of sector specific FDI data is only
available for time period 1997-2013. Relatively shorter time dimension might not be enough to
fully capture the long run impact of FDI. But, given the data restriction, our focus is on
attribution only (Clements & Taylor, 2003).

Meanwhile, our analysis focuses on multivariate framework by including auxiliary
variables (domestic investment, infrastructure, human capital and institutions), for a detailed
explanation of FDI-growth link (Chakraborty & Nunnenkamp, 2008). One significant
contribution is the heterogeneity of our link across three sectors via panel cointergation
framework. By this way, we also tend to identify other growth determinants as well for Pakistan.
Lastly, the long run cointegration is a necessary condition for checking long run causality.
Therefore, we rely on standard granger causality procedure as compared to Toda and
Yamamoto’s test which don’t rely on pre-testing because it is appropriate for sector specific
panel cointegration framework (Chakraborty & Nunnenkamp, 2008). The unit root property of
panel analysis was examined using Levin, Lin & Chu (LLC), Im, Pesaran & Shin (IPS) and
Madala & Wu (MU) unit root tests. LLC mainly is an extension of Dickey Fuller (DF) test. It
allows for both unit specific fixed effect and unit specific time trend. It assumes cross sectional
independence of individual processes. IPS test assumes for same time periods for all cross
sections. It means that IPS test is ideal for balanced panel data analysis. IPS test is based upon
the average of individual unit root test statistics. MU test is ideal for unbalanced panel data
analysis. It does not allow for average of DF statistics. In order to test for unit root in time series
analysis, Augmented Dickey Fuller (ADF) test is used. It includes a lagged term of dependent
variable to remove autocorrelation. For panel cointegration, we resort to Pedroni cointegration
test which allows for multivariate cointegration analysis in panel data. It consists of seven
statistics in which four are based on pooling along within dimension while three are based on
between dimension. The within dimension means an average test statistic of cointegration across
different cross sections and between dimension means average is done in pieces for each cross
section. These statistics are as follows:

(i) Panel v-statistic
).....(..............................2
1 1
2
11
2/322/32
i
it
M
i
T
ti
vNMT
L
MTZMT
(ii) Panel ρ-statistic
).........(..........
1
2
1
2
11
1
22
11
2
11
ii
MT
ZMTM
i it
T
ti
M
iiitit
T
ti
NT
L
L
(iii) Panel t-statistic (non-parametric)
)(..........
22
11 1
2
111
2
11
2
11
2iii
iitit
M
i
T
ti
M
iit
T
tiMTtMT LLZ
(iv) Panel t-statistic (parametric)
).........(****
22
11 1
2
111
2
11
2
11
2iv
iitit
M
i
T
ti
M
iit
T
tiMTtMT LLZ
(v) Group ρ-statistic (parametric)
).......(..............................
1 1
2
1
1
22
1__
vMTMTM
i
T
tit
T
tiitit
NTZ
(vi) Group t-statistic (non-parametric)
)...(..........11 1
22
11
2
1
2_
viMMM
i
T
tiitit
T
titi
tMTZ
(vii) Group t-statistic (parametric)
).(..........*
1 1
22
11
2
1
21
_
**** viiMMM
i
T
titit
T
titi
tMT sZ
Given the existence of cointegration between the variables, Fully Modified Ordinary Least
Square (FMOLS) is used for long run cointegration vectors. It corrects the common problems
that prevail in long run relationship in the form of serial correlation and endogeneity of

regressors. Similarly, it is unbiased and fully efficient asymptotically (Philips & Hansen, 1990).
A general FMOLS model is as follows:
)........(..........)(1 11 1
ˆˆ viiiTixxittxxitN
i
it
T
t
N
i
T
tFM yB
Similarly, for time series analysis, bivariate analysis is estimated using Engle-Granger
cointegration approach. It is better in the sense that it provides an unbiased relationship between
the variables of interest.
4. Empirical Outcomes
(i) Unit root test
The provision of cross section effects with heterogeneity across panel has provided
weight to unit root testing in panel data analysis. For model selection, no intercepts with any
trends, heterogeneous intercepts and with no trends are optional. Here, using heterogeneous
intercepts with no trends (M1) and heterogeneous intercepts with trends (M2) models, we test for
the null hypothesis of nonstationarity for the referred variables. For this purpose, four residual
based tests are used given by Levin, Lin, and Chu (2002), Im, Pesaran, and Shin (2003) and
Maddala and Wu (1999) shown in table 1. Whereas, Levin, Lin, Chu & Shang statistics assumes
homogeneous unit root process while, remaining statistics assume heterogeneous unit root
process.
For both heterogeneous intercepts with no trends (M1) and heterogeneous intercepts with
trends (M2), all the variables show the rejection of null of nonstationarity at first difference.
Therefore, we can conclude that all referred variables have unit root properties or integrated at
order one or I(1).

Table 1. Panel Unit Root Test
(ii) Panel cointergation test
After the confirmation of unit root properties in referred variables, the next step is to look
for common stochastic trend or cointergation between them. For this purpose, Pedroni (1999)
cointegration approach is used allowing common long run relationships of referred variables. It
allows multiple heterogeneous cointergating vectors, preferred over traditional panel
cointegrating techniques with the null hypothesis of ‘no cointergation’.
The targeted cointegration relationship has following form:
ititititititit INSTHCINFDIFDIGDP 54321
here, βo represents sector specific effects while εit shows residuals specifying deviancy from
steady state relationship. The panel cointergation relationship checks for the stationarity of
extracted residuals at level or I(0), signifying long run cointegration between our model. On the
Variables Levin-Lin &
Chu t-rho-
stat
Im, Pesaran
& Shin (IPS)
w-stat
Maddala & Wu (MW) Decision
about Ho ADF fisher
chi-square
PP fisher
chi-square
M1: Heterogeneous intercepts with no trends D(GDP)
D(FDI)
D(DI)
D(INF)
D(HC)
D(INS)
-3.89a
-3.04a
-1.54c
-0.96
-2.28a
-5.11a
-3.61a
-3.66a
-2.24a
-1.38c
-2.50a
-3.52a
23.05a
23.32a
14.84a
12.60a
16.08a
23.24a
35.74a
34.26a
12.48c
14.71a
15.90a
19.20a
Reject
Reject
Reject
Reject
Reject
Reject
M2: Heterogeneous intercepts with trends
D(GDP)
D(FDI)
D(DI)
D(INF)
D(HC)
D(INS)
-3.04a
-2.04a
-2.89a
-2.12a
-2.66a
-4.07a
-2.27a
-2.41a
-1.17
0.82
-1.86a
-2.23a
15.02a
16.00a
9.79
4.49
12.37c
15.30a
26.00a
23.82a
8.00
23.86a
12.37c
12.76a
Reject
Reject
Reject
Reject
Reject
Reject
Source: Author’s own estimates
Here, a and c represents significance at 1% and 10%

other hand, Pedroni (1999) refers seven different statistics divided into two categories to examine
this long run cointegration. The first category includes four statistics based on polling
autoregressive coefficients (within dimension) across all the cross sections of the panel. While,
the second category includes three statistics based on average of autoregressive coefficients
(between dimension) for each cross section of the panel. For within dimension category, the
Table 2. Pedroni Cointegration Test
positive value of first stat with large negative values of two statistics reveals presence of long run
cointegration across all three cross sections. Similarly, large negative values of two between
Ho: No cointegration between the variables
Within Dimension M1: Heterogeneous intercepts with no trends Statistics
Panel V-Stat -0.67
Panel Rho-Stat 1.60
Panel PP-Stat 1.13
Panel ADF-Stat 1.34
Between Dimension
Statistics
Group Rho-Stat 2.39
Group PP-Stat -1.59c
Group ADF-Stat 0.73
Decision about Ho Weakly Reject
Within Dimension M2: Heterogeneous intercepts with trends
Statistics
Panel V-Stat 4.21a
Panel Rho-Stat 1.97
Panel PP-Stat -3.7a
Panel ADF-Stat -2.4a
Between Dimension
Statistics
Group Rho-Stat 2.5
Group PP-Stat -6.3a
Group ADF-Stat -2.6a
Decision about Ho Strongly Reject Source: Author’s own estimates Here, a and c represents significance at 1% and 10%

dimension statistics also show the presence of long run cointegration between our model for each
cross sectional unit of the panel. Table 2 reveals five significant test statistics at one percent.
Therefore, we conclude that FDI, domestic investment, infrastructure, human capital and
institutions are correlated with GDP in the long run.
(iii) Fully Modified Ordinary Least Square (FMOLS) test
Given that the referred variables are cointergated, showing significant relationship but the
results still can be misleading due to spurious regression problem (Phillips & Hansen, 1990).
Therefore, fully modified ordinary least square (FMOLS) test proposed by (Pedroni, 2000) is
used to tackle serial correlation and endogeneity of regressors. Similarly, it is unbiased and
asymptotically efficient. Given the results in table 3, foreign direct investment (FDI),
infrastructure (INF) and institutions (INS) showed a positive and significant relationship between
Table 3. Fully modified ordinary least square (FMOLS) test
Variables Coefficients
Foreign Direct Investment (FDI) 8.7a (8.4)
Domestic Investment (DI) -3.6a (-7.03)
Infrastructure (INF) 1440439a (17.98)
Human Capital (HC) -349289.10a (-8.2)
Institutions (INS) 114480.5a (3.8)
Source: Author’s own estimates Here, a represents significance at 1%
economic growth of Pakistan. On the other hand, domestic investment and human capital
showed negative relationship with Pakistan’s growth.

(iv) Vector Error Correction Model (VECM)
After the confirmation of long run relationship between respective variables, we look for
causality between them. Firstly, residuals are extracted from the cointegrated model. Then, using
these residuals, a dynamic error correction model is estimated. The results in table 4 show a
bidirectional short run causality of FDI, DI and institutions with GDP of Pakistan. Similarly,
there exists a unidirectional causality running from infrastructure and human capital to GDP of
Pakistan. Similarly, the error correction term signifies the existence of long run relationship
between our variables of interest.
Table 4. Vector Error Correction Model (VECM)
Short Run Long Run
Explained
variables
∆GDP ∆FDI ∆DI ∆INF ∆HC ∆INS ECT(-1)
∆GDP - 10.2a 7.0a 8.3a 3.5a 1.6 -0.12a
∆FDI 22.2a - 7.8a 0.3 0.9 156.2a -0.99b
∆DI 14.8a 45.9a - 5.0b 21.8a 8.2a -0.53b
∆INF 0.1 0.3 0.2 - 0.6 0.5 -0.44c
∆HC 0.4 0.1 1.0 0.7 - 0.6 -0.26c
∆INS 14.2a 4.0b 1.8 1.2 0.9 - -0.97a Source: Author’s own estimates
Here, ECT (-1) is error correction term. a is significance at 1%, b at 5% and c at 10%.
(v) Sector wise Causality
After exploring the causal relationship of referred variables in our panel, we focus on
finding the nature and magnitude of causal relationships in all cross sections of our study. For
primary sector, the results in table 5 reveal bidirectional short run causality between primary
sector FDI and GDP. Similarly, for secondary sector, the results of table 6 reveal no short run or
long run relationship between secondary sector FDI and GDP. Lastly, for tertiary sector, no short
run or long run relationship was found between tertiary sector FDI and GDP. The results are

somewhat surprising because post reform period registered tertiary sector as the largest recipient
of FDI in Pakistan. Similarly, all three sectors show a long run relationship from GDP to FDI.
Moreover, GDP of all sectors tends to develop a long run relationship with infrastructure. But in
short run, only GDP of tertiary sector tends to cause infrastructure. The sector wise results also
show that human capital tends to develop a long run relationship only with GDP of tertiary
sector. Lastly, economic growth in primary and secondary sector has a long run relationship with
domestic institutions. As these sectors grow, the performances of domestic institutions also
improve.
Table 5. Sector wise VECM
Primary
Secondary
Tertiary
Hypothesis W-Stat ECT(-1) Hypothesis W-Stat ECT(-1) Hypothesis W-Stat ECT(-1)
FDI → GDP GDP →FDI
3.18c 5.05a
0.027 -0.98a
FDI → GDP GDP →FDI
0.08 0.05
0.03 -0.60a
FDI → GDP GDP →FDI
0.41 0.75
-0.001 -0.64b
DI → GDP GDP → DI
0.23 0.37
-0.03 -1
DI → GDP GDP → DI
0.51 1.00
-0.06 -0.05a
DI → GDP GDP → DI
0.96 0.03
0.13 -0.67b
INF →GDP GDP → INF
1.00 1.80
-0.13 -0.75a
INF →GDP GDP → INF
0.37 16.33
-0.85 -0.58a
INF →GDP GDP → INF
0.86 4.54a
-0.20 -0.36c
HC → GDP GDP →HC
1.43 0.55
0.72 -0.10
HC → GDP GDP →HC
0.13 0.10
-2.1 0.24
HC → GDP GDP →HC
0.84 0.09
-0.94c -0.54
INS →GDP GDP → INS
1.13 0.04
-0.13 -0.74c
INS →GDP GDP → INS
0.12 0.04
0.04 -0.65
INS →GDP GDP → INS
4.14c
0.14 -0.1a
-0.74c
Source: Author’s own estimates Here, ECT (-1) shows error correction term. *** is significant at 1%, ** at 5% and *at 10% respectively.
(vii) Cross Sector Spillover test
Given the results about the impact of FDI overall and sector wise in economic growth of
Pakistani economy, we also focus upon the cross sector impact between primary, secondary and
tertiary sectors. The VECM results show no evidence of short causality and long run relationship

between FDI of a particular sector and economic growth of other sector. However, growth of
primary sector has a long run relationship with FDI inflows to secondary and tertiary sectors. It
means that as primary sector grows, it attracts more FDI in secondary and tertiary sectors.
Similarly, growth of secondary sector tends to cause FDI in primary sector in the short run.
There also exists a long run relationship between the two. As secondary sector grows, primary
sector receives more FDI. The growth of secondary sector also has a long run relationship with
FDI in tertiary sector. The growth of secondary sector attracts FDI in tertiary sector. Lastly, the
Table 6. Cross Sector VECM
Hypothesis W-Stat ECT(-1)
FDI(S) → GDP(P)
GDP(P) → FDI(S)
0.323
2.182
0.06
-0.76b
FDI(P) → GDP(S)
GDP(S) → FDI(P)
0.272
9.89a
0.003
-1b
FDI(T) → GDP(P)
GDP(P) → FDI(T)
0.791
1.015
0.05
-0.67b
FDI(T) → GDP(S)
GDP(S) → FDI(T)
0.008
0.386
0.03
-0.59b
FDI(S) → GDP(T)
GDP(T) → FDI(S)
0.430
2.945
0.01
-0.65b
Source: Author’s own estimates Here, P = primary sector, S = secondary sector and T = tertiary sector. Here, ECT (-1) is error correction term. a is significance at 1%, and b is significance at 5%.
growth of tertiary sector also attracts FDI in secondary sector. The cross sector VECM results
also support the market size hypothesis in case of Pakistan. The growth of a particular sector

affects the FDI inflows to other sectors but, FDI in a sector doesn’t have any cross sector
spillover in case of Pakistan.
5. Conclusion and Policy Recommendations
The post reform period recorded a boom in FDI inflows in Pakistan. This period also
documented a shift in composition of FDI. The focus shifted towards tertiary sector from
secondary sector. While primary sector continuously recorded a meager amount of FDI. Using
multivariate framework, this paper mainly focused upon FDI led growth hypothesis for Pakistan
through disaggregated analysis.
Pedroni panel cointegration approach highlighted that FDI, domestic investment,
infrastructure, human capital and institutions are cointegrated in the long run. While FMOLS
showed that FDI, infrastructure and institutions positively affects the long run economic growth
of Pakistan. On the other hand, domestic investment and human capital recorded a negative
relationship with economic growth of Pakistan. The VECM showed a bidirectional causality of
FDI and domestic investment with economic growth in short run. While there exists a
unidirectional short run causality from infrastructure and human capital to economic growth.
At sector level, there exists market size hypothesis of primary sector in the long run. But
there exists bidirectional causality between primary sector FDI and economic growth. For
secondary sector, no short run causality holds for Pakistan but, there exists a long run
cointegration from secondary sector growth to FDI, domestic investment and infrastructure.
Moreover, for tertiary sector, short run causality runs from tertiary sector’s growth to
infrastructure and institutions to economic growth. Similar to other sectors, growth of tertiary
sector attracts FDI, domestic investment, improves infrastructure and institutions in Pakistan.

Lastly, the cross sector results also showed no spillover impact of FDI of a particular
sector to other sectors. The growth of primary sector has a long run relationship with secondary
and tertiary sector’s FDI. Similarly, the growth of secondary sector causes FDI of primary sector
in the short run and also holds a long run relationship between them. It also shows a long run
relationship with tertiary sector’s FDI. But the growth of tertiary sector only showed a long run
relationship with FDI of secondary sector. Overall, the cross sector results also favor the market
size hypothesis for Pakistan.
Still, one can’t conclude that FDI has not complemented the growth process of both
secondary and tertiary sectors of Pakistan. One can’t ignore the energy crises and poor law and
order situation affecting these sectors. Similarly, disaggregated level results can undergo with
aggregation bias (Aykut & Sayek, 2007). Especially at sector level, the data limitation could also
be a factor for ambiguous results. However, it can be an important direction to evaluate the FDI
led growth hypothesis for Pakistan.
On the other hand, it also points fingers on the policies regarding foreign projects. This
means that FDI had no impact in improving domestic technology and exports in secondary and
tertiary sector. The policies should focus on the quality of the foreign project rather than FDI
itself. Moreover, local investors and human capital should be strengthened to extract favorable
results from FDI. This can improve the absorptive capacity of domestic markets, especially
secondary and tertiary for boasting the growth along with spillover effects to other sectors as
well.
Notes
1. The GDP data set was available at PBS. The sector wise data set was available via
economic groups from 1950 till 2014 but the sector wise data of FDI was only available

from 1997. The FDI data in disaggregated form was available in 24 economic groups for
the time period 1997-2001. For the time span 2002-2013, the FDI data was distributed in
36 economic groups. Therefore, it was added up for the major 24 economic groups.
Moreover, FDI data was available in million US$ terms while GDP data was in million
rupees, both in nominal terms. The FDI data was multiplied with real effective exchange
rate and divided by GDP deflator factor constant 2006. The GDP data was divided by
GDP deflator constant factor 2006 for common bases. The data of domestic investment
was also collected from SBP and Pakistan Bureau of Statistics (PBS). It was also
converted in factor cost 2006 using GDP deflator. All the variables used to derive an
infrastructural index were obtained from Economic Survey of Pakistan (2012-2013).
Human Capital data was obtained from UNDP reports. Lastly, the governance indicators
which were used to derive an institutional index were obtained from WGI.
2. The sector wise GDP data set is prepared by Pakistan Bureau of Statistics (PBS) and is
managed by Mr. Suleman Khan, who is the Assistant Director of Statistics at SBP.
Email: [email protected]
3. The FDI data by economic groups is managed by Mr. Muhammad Zarar Askari, who is
the Senior Joint Director at SBP. Email: [email protected]
4. Using Principal Component Analysis (PCA), the infrastructural index was derived for
primary, secondary and tertiary sector using various infrastructure variables. A separate
correlation matrix was also computed for each set of infrastructural variables of primary,
secondary and tertiary sectors to avoid multicollinearity.

5. Using Principal Component Analysis (PCA), a common institutional index was derived
for all three sectors. A correlation matrix was computed using four institutional variables
to avoid multicollinearity.
References
Abdullah, T. S., Ali, A., & Siraj, W. (2015). The Effect of Foreign Direct Investment on Economic Growth of
Pakistan. Cell, 223240369, 2130.
Adler, J. H. (1965). Absorptive capacity: The concept and its determinants: Brookings Institution.
Agmon, T., & Hirsch, S. (1979). Multinational corporations and the developing economics: potential
gains in a world of imperfect markets and uncertainty. Oxford Bulletin of Economics and
Statistics, 41(4), 333‐344.
Ahmad, M. H., Alam, S., Butt, M. S., & Haroon, Y. (2003). Foreign Direct Investment, Exports, and
Domestic Output in Pakistan [with Comments]. The Pakistan Development Review, 715‐723.
Ahmad, N., Hayat, M. F., Luqman, M., & Ullah, S. (2012). The causal links between foreign direct
investment and economic growth in Pakistan. European Journal of Business and Economics, 6,
20‐21.
Aqeel, A., Nishat, M., & Bilquees, F. (2004). The Determinants of Foreign Direct Investment in Pakistan
[with Comments]. The Pakistan Development Review, 651‐664.
Aykut, D., & Sayek, S. (2007). The role of the sectoral composition of foreign direct investment on
growth. Do multinationals feed local development and growth, 35‐62.
Balasubramanyam, V. N., Salisu, M., & Sapsford, D. (1996). Foreign direct investment and growth in EP
and IS countries. The economic journal, 92‐ 105.
Banga, R. (2004). Impact of Japanese and US FDI on productivity growth: a firm‐level analysis. Economic
and Political Weekly, 453‐460.

Basu, P., Chakraborty, C., & Reagle, D. (2003). Liberalization, FDI, and growth in developing countries: A
panel cointegration approach. Economic Inquiry, 41(3), 510‐516.
Berman, E., Bound, J., & Griliches, Z. (1994). Changes in the demand for skilled labor within US
manufacturing: Evidence from the annual survey of manufacturers. The Quarterly Journal of
Economics, 367‐397.
Blonigen, B. A., & Wang, M. (2004). Inappropriate pooling of wealthy and poor countries in empirical FDI
studies.
Borensztein, E., De Gregorio, J., & Lee, J.‐W. (1998). How does foreign direct investment affect economic
growth? Journal of international Economics, 45(1), 115‐135.
Buckley, P. J., & Casson, M. (1976). The future of the multinational enterprise (Vol. 1): Macmillan
London.
Carree, M. A., & Thurik, A. R. (2003). The impact of entrepreneurship on economic growth Handbook of
entrepreneurship research (pp. 437‐471): Springer.
Castejón, C. F., & Woerz, J. (2006). Good or bad? The influence of FDI on output growth. An industry‐
level analysis. Documentos de trabajo (Universidad de Zaragoza. Facultad de Economía y
Empresa)(1), 1.
Chakraborty, C., & Nunnenkamp, P. (2008). Economic reforms, FDI, and economic growth in India: a
sector level analysis. World development, 36(7), 1192‐1212.
Clements, M., & Taylor, N. (2003). Evaluating prediction intervals for high‐frequency data. Journal of
Applied Econometrics, 18, 445‐456.
Conner, K. R. (1991). A historical comparison of resource‐based theory and five schools of thought
within industrial organization economics: do we have a new theory of the firm? Journal of
management, 17(1), 121‐154.
Dar, A. A., Muhammad, T., & Mehmood, B. (2016). IS THERE A RELATIONSHIP BETWEEN FOREIGN
DIRECT INVESTMENT, HUMAN CAPITAL, TRADE OPENNESS AND ECONOMIC GROWTH OF
PAKISTANI ECONOMY?. Science International, 28(1).
Dar, A. A., Muhammad, T., & Mehmood, B. (2016). JOINT VENTURE INVESTMENT, INFRASTRUCTURAL
SPILLOVER AND ECONOMIC GROWTH: A SOUTH ASIAN PERSPECTIVE. Science
International, 28(1).
De Mello, L. R. (1999). Foreign direct investment‐led growth: evidence from time series and panel data.
Oxford economic papers, 51(1), 133‐151.
Dunning, J. H. (1980). Toward an eclectic theory of international production. The International Executive,
22(3), 1‐3.
Dunning, J. H. (1989). Multinational enterprises and the growth of services: some conceptual and
theoretical issues. Service industries journal, 9(1), 5‐39.
Dunning, J. H. (1998). Location and the multinational enterprise: a neglected factor? Journal of
international business studies, 45‐66.
Dunning, J. H., & Enterprises, M. (1993). the Global Economy. Domestic Governance, Strategies and.
Dutta, D., & Ahmed, N. (2004). Trade liberalization and industrial growth in Pakistan: a cointegration
analysis. Applied Economics, 36(13), 1421‐1429.
Economic survey 2012‐2013; Retrieved from Url: http://www.finance.gov.pk/survey_1213.html
Elu, J. U., & Price, G. N. (2010). Does China Transfer Productivity Enhancing Technology to Sub‐Saharan
Africa? Evidence from Manufacturing Firms*. African Development Review, 22(s1), 587‐598.
Falki, N. (2009). Impact of foreign direct investment on economic growth in Pakistan. International
Review of Business Research Papers, 5(5), 110‐120.
FAO Investment Centre : Retrieved from url: http://www.fao.org/investment/newsandmeetings/en/

Ghazali, A. (2010). Analyzing the relationship between foreign direct investment domestic investment
and economic growth for Pakistan. International Research Journal of Finance and Economics,
47(1), 123‐131.
Gow, H. R., & Swinnen, J. F. (1998). Up‐and downstream restructuring, foreign direct investment, and
hold‐up problems in agricultural transition. European Review of Agricultural Economics, 25(3),
331‐350.
Guo, B., Gao, J., & Chen, X. (2013). Technology strategy, technological context and technological catch‐
up in emerging economies: industry‐level findings from Chinese manufacturing. Technology
Analysis & Strategic Management, 25(2), 219‐234.
Hadi, T. (2013) . Investment in Pakistan. KPMG Report.
Hansen, H., & Rand, J. (2006). On the causal links between FDI and growth in developing countries. The
World Economy, 29(1), 21‐41.
Hawkes, C., & Hawkes, C. (2005). The role of foreign direct investment in the nutrition transition. Public
Health Nutrition-Wallingford, 8(4), 357‐365.
Hufbauer, G. C. (1975). The multinational corporation and direct investment. International trade and
finance: Frontiers for research, 253‐319.
Hussain, S. B. (2004). Encyclopedia of Capitalism (Facts on File Library of World History) 3 VOL SET.
Hymer, S. H. (1976). The international operations of national firms: A study of direct foreign investment
(Vol. 14): MIT press Cambridge, MA.
Im, K. S., Pesaran, M. H., & Shin, Y. (2003). Testing for unit roots in heterogeneous panels. Journal of
econometrics, 115(1), 53‐74.
Iqbal, M. S., Shaikh, F. M., & Shar, A. H. (2010). Causality relationship between foreign direct investment,
trade and economic growth in Pakistan. Asian Social Science, 6(9), 82.

Javorcik, B. S. (2004). Does foreign direct investment increase the productivity of domestic firms? In
search of spillovers through backward linkages. American economic review, 605‐627.
Jawahar, I., & McLaughlin, G. L. (2001). Toward a descriptive stakeholder theory: An organizational life
cycle approach. Academy of management review, 26(3), 397‐414.
Khan, M. A., & Khan, S. A. (2011). Foreign direct investment and economic growth in Pakistan: A sectoral
analysis. Pakistan Institute of Development Economics Islamabad PIDE working papers, 67.
Khawar, M. (2005). Foreign direct investment and economic growth: A cross‐country analysis. Global
Economy Journal, 5(1).
Kolstad, I., & Villanger, E. (2008). Determinants of foreign direct investment in services. European
Journal of Political Economy, 24(2), 518‐533.
KPMG (2013): Retrieved from
https://www.kpmg.com/PK/en/IssuesAndInsights/ArticlesPublications/Documents/Investment‐
in‐Pakistan2013.
Levin, A., Lin, C.‐F., & Chu, C.‐S. J. (2002). Unit root tests in panel data: asymptotic and finite‐sample
properties. Journal of econometrics, 108(1), 1‐24.
Lewis, W. A. (1954). Economic development with unlimited supplies of labour. The manchester school,
22(2), 139‐191.
Lim, M. E.‐G. (2001). Determinants of, and the relation between, foreign direct investment and growth:
a summary of the recent literature: International Monetary Fund.
Lipsey, R. E. (2004). Home‐and host‐country effects of foreign direct investment Challenges to
globalization: Analyzing the economics (pp. 333‐382): University of Chicago Press.
Maddala, G. S., & Wu, S. (1999). A comparative study of unit root tests with panel data and a new simple
test. Oxford Bulletin of Economics and Statistics, 61(S1), 631‐652.

Markowitz, H. (1959). Portfolio Selection, Efficent Diversification of Investments: J. Wiley.
Mughal, M. (2008). Boon or bane‐role of FDI in the economic growth of Pakistan.
Narula, R., & Marin, A. (2003). FDI spillovers, absorptive capacities and human capital development:
evidence from Argentina.
Nelson, R. R., & Phelps, E. S. (1966). Investment in humans, technological diffusion, and economic
growth. The American economic review, 56(1/2), 69‐75.
Nurkse, R. (1935). The schematic representation of the structure of production. The Review of Economic
Studies, 2(3), 232‐244.
Park, J. (2004). Korean Perspective on FDI in India: Hyundai Motors' Industrial Cluster. Economic and
Political Weekly, 3551-3555.
Pedroni, P. (1999). Critical values for cointegration tests in heterogeneous panels with multiple
regressors. Oxford Bulletin of Economics and Statistics, 61(s 1), 653‐670.
Pedroni, P. (2000). FULLY MODIFIED OLS FOR HETEROGENEOUS COINTEGRATED PANELS.
Pedroni, P. (2004). Panel cointegration: asymptotic and finite sample properties of pooled time series
tests with an application to the PPP hypothesis. Econometric theory, 20(03), 597‐625.
Perez, C. (1985). Microelectronics, long waves and world structural change: New perspectives for
developing countries. World development, 13(3), 441‐463.
Phillips, P. C., & Hansen, B. E. (1990). Statistical inference in instrumental variables regression with I (1)
processes. The Review of Economic Studies, 57(1), 99‐125.
Rahmaddi, R., & Ichihashi, M. (2012). The impact of foreign direct investment on host country exports:
Sector based evidence from Indonesian manufacturing.
Rahman, Ur. Zia. (2014). Impact of foreign direct investment on economic growth in Pakistan. Journal of
Economics and Sustainable Development, 5 (27).

Ramasamy, B., Yeung, M., & Laforet, S. (2012). China's outward foreign direct investment: Location
choice and firm ownership. Journal of world business, 47(1), 17‐25.
Reuber, G. L. (1973). Private foreign investment in development.
Saqib, D., Masnoon, M., & Rafique, N. (2013). Impact of foreign direct investment on economic growth
of Pakistan. Advances in Management & Applied Economics, 3(1), 35‐45.
Shahbaz, M., & Rahman, M. M. (2012). The dynamic of financial development, imports, foreign direct
investment and economic growth: cointegration and causality analysis in Pakistan. Global
Business Review,13(2), 201‐219.
Shaheen, S., Ali, M. M., Kauser, A., & Ahmed, F. B. (2013). Impact of trade liberalization on economic
growth in Pakistan. Interdisciplinary Journal of Contemporary Research in Business, 5(5).
Simões, V. C., & Simões, V. C. (1988). Portugal and FDI attraction: A multi‐criteria approach.
Management International Review, 42‐52.
Tadesse, B., & Ryan, M. (2005). Export Platforms and the Industry‐Specific FDI‐Trade Relationship.
Journal of Economic Integration, 644‐671.
Tintin, C. (2012). Does Foreign Direct Investment Spur Economic Growth and Development?‐A
Comparative Study: Free University of Brussels, Brussels.
Tobin, J. (1958). Liquidity preference as behavior towards risk. The Review of Economic Studies, 25(2),
65‐86.
United Nation Conference on Trade and Development (1997): Retrieved from
http://unctad.org/en/Docs/ldc1997_en.pdf
Vahter, P. (2010). Does FDI spur innovation, productivity and knowledge sourcing by incumbent firms?
Evidence from manufacturing industry in Estonia.

Vernon, R. (1966). International investment and international trade in the product cycle. The Quarterly
Journal of Economics, 190‐207.
Wachter, M. L., Gordon, R., Piore, M. J., & Hall, R. E. (1974). Primary and secondary labor markets: a
critique of the dual approach. Brookings Papers on Economic Activity, 1974(3), 637‐693.
Weill, P. (1992). The relationship between investment in information technology and firm performance:
A study of the valve manufacturing sector. Information systems research, 3(4), 307‐333.
World Development Indicators (WDI): Retrieved from http://data.worldbank.org/data‐catalog/world‐
development‐indicators
Wilkins, M. (1970). The emergence of multinational enterprise: American business abroad from the
colonial era to 1914 (Vol. 34): Cambridge, Mass: Harvard University Press.
Zeb, N., Qiang, F., & Rauf, S. (2013). Role of Foreign Direct Investment in Economic Growth of
Pakistan. International Journal of Economics and Finance, 6(1), 32.

Appendix
(i) Economic groups included in sectors
Different Sectors Included Economic Groups
Primary Sector Food, Beverages, Tobacco, Sugar, Paper and Pulp,
Leather and Leather Products, Rubber and Rubber
Products
Secondary Sector Chemicals, Pharmaceuticals and Fertilizers, Petro
Chemicals and Petroleum Refining, Cement, Basic
Metals, Metal Products, Machinery other than Electrical,
Electrical Machinery, Electronics, Transport Equipment,
power, Construction, Mining and Quarrying, Oil and
Gas Exploration
Tertiary Sector Wholesale and Retail Trade, Tourism, Transport,
Storage and Communication, financial Businesses,
Social and Private Services
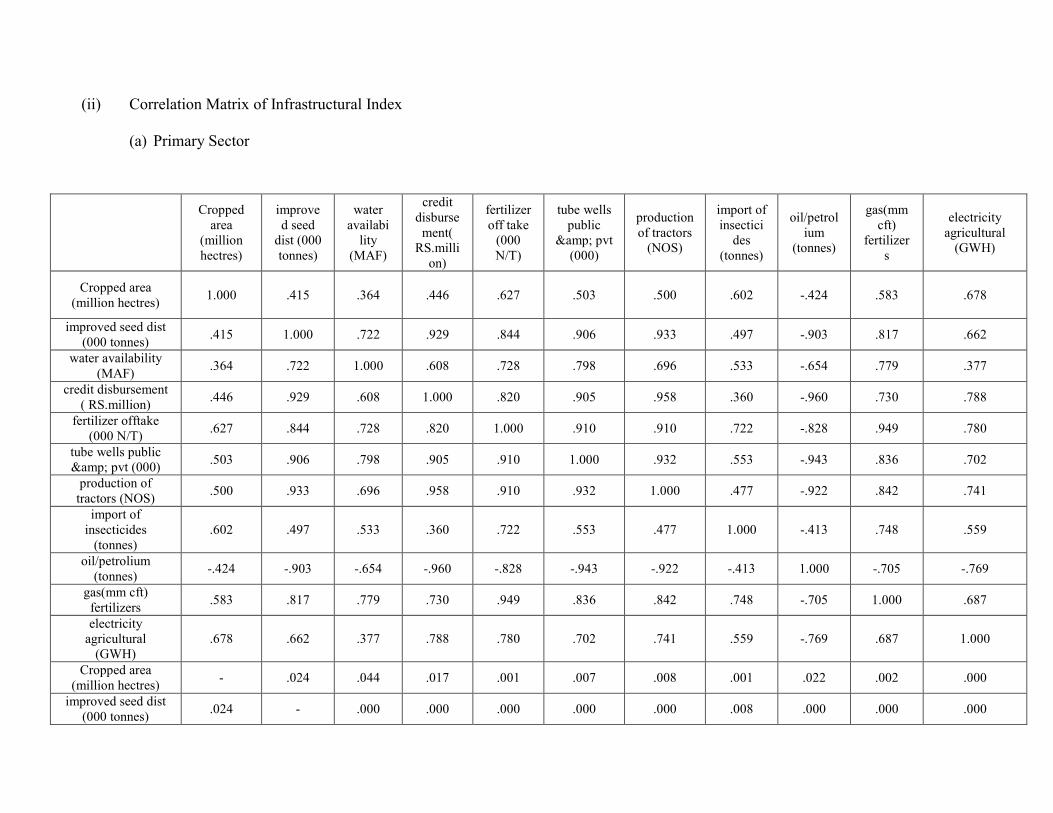
(ii) Correlation Matrix of Infrastructural Index
(a) Primary Sector
Cropped area
(million hectres)
improved seed
dist (000 tonnes)
water availabi
lity (MAF)
credit disburse
ment( RS.milli
on)
fertilizer off take
(000 N/T)
tube wells public
& pvt (000)
production of tractors
(NOS)
import of insectici
des (tonnes)
oil/petrolium
(tonnes)
gas(mm cft)
fertilizers
electricity agricultural
(GWH)
Cropped area (million hectres)
1.000 .415 .364 .446 .627 .503 .500 .602 -.424 .583 .678
improved seed dist (000 tonnes)
.415 1.000 .722 .929 .844 .906 .933 .497 -.903 .817 .662
water availability (MAF)
.364 .722 1.000 .608 .728 .798 .696 .533 -.654 .779 .377
credit disbursement ( RS.million)
.446 .929 .608 1.000 .820 .905 .958 .360 -.960 .730 .788
fertilizer offtake (000 N/T)
.627 .844 .728 .820 1.000 .910 .910 .722 -.828 .949 .780
tube wells public & pvt (000)
.503 .906 .798 .905 .910 1.000 .932 .553 -.943 .836 .702
production of tractors (NOS)
.500 .933 .696 .958 .910 .932 1.000 .477 -.922 .842 .741
import of insecticides
(tonnes) .602 .497 .533 .360 .722 .553 .477 1.000 -.413 .748 .559
oil/petrolium (tonnes)
-.424 -.903 -.654 -.960 -.828 -.943 -.922 -.413 1.000 -.705 -.769
gas(mm cft) fertilizers
.583 .817 .779 .730 .949 .836 .842 .748 -.705 1.000 .687
electricity agricultural
(GWH) .678 .662 .377 .788 .780 .702 .741 .559 -.769 .687 1.000
Cropped area (million hectres)
- .024 .044 .017 .001 .007 .008 .001 .022 .002 .000
improved seed dist (000 tonnes)
.024 - .000 .000 .000 .000 .000 .008 .000 .000 .000

water availability (MAF)
.044 .000 - .001 .000 .000 .000 .004 .000 .000 .038
credit disbursement ( RS.million)
.017 .000 .001 - .000 .000 .000 .046 .000 .000 .000
fertilizer offtake (000 N/T)
.001 .000 .000 .000 - .000 .000 .000 .000 .000 .000
tube wells public & pvt (000)
.007 .000 .000 .000 .000 - .000 .003 .000 .000 .000
production of tractors (NOS)
.008 .000 .000 .000 .000 .000 - .011 .000 .000 .000
import of insecticides
(tonnes) .001 .008 .004 .046 .000 .003 .011 - .025 .000 .003
oil/petrolium (tonnes)
.022 .000 .000 .000 .000 .000 .000 .025 - .000 .000
gas(mm cft) fertilizers
.002 .000 .000 .000 .000 .000 .000 .000 .000 - .000
electricity agricultural (GWH)
.000 .000 .038 .000 .000 .000 .000 .003 .000 .000 -
Determinant = 1.396E-010

(b) Secondary sector
(c) Tertiary sector
Education
exp (% of
GNI)
Health exp
(% of GDP)
Exp (law
and Order,
M.RS)
Length of
roads(KM)
Buses on
road-HCV
Correlation
Education exp (% of
GNI) 1.000 .631 -.545 -.755 -.820
Health exp (% of
GDP) .631 1.000 -.315 -.424 -.669
Exp (law and Order,
M.RS) -.545 -.315 1.000 .721 .800
Length of roads(KM) -.755 -.424 .721 1.000 .910
Buses on road-HCV -.820 -.669 .800 .910 1.000
Sig. (1-
tailed)
Education exp (% of
GNI)
- .003 .012 .000 .000
Health exp (% of
GDP) .003
- .109 .045 .002
Exp (law and Order,
M.RS) .012 .109
- .001 .000
Length of roads(KM) .000 .045 .001 - .000
Buses on road-HCV .000 .002 .000 .000 -
Oil/Petroleum
(tonnes)
Gas (mm cft) Electricity
(gwh)
Correlation
Oil/Petroleum (tonnes) 1.000 -.599 -.576
Gas (mm cft) -.599 1.000 .965
Eectricity (gwh) -.576 .965 1.000
Sig. (1-tailed)
Oil/Petroleum (tonnes) - .002 .003
Gas (mm cft) .002 - .000
Electricity (gwh) .003 .000 -
Determinant = .044

Determinant = .004
(iii) Correlation Matrix of Institutional Index
Rule of
Law
Control of
Corruption
Voice and
Accountability
Political
Stability and
Absence of
Violence
Correlation
Rule of Law 1.000 -.094 .113 .367
Control of Corruption -.094 1.000 -.383 .241
Voice and Accountability .113 -.383 1.000 -.312
Political Stability and
Absence of Violence .367 .241 -.312 1.000
Sig. (1-tailed)
Rule of law - .360 .333 .074
Control of Corruption .360 - .065 .176
Voice and Accountability .333 .065 - .111
Political Stability and
Absence of Violence .074 .176 .111
-
Determinant = .601