fdi from brics to lics: emerging growth driver? - imf · pdf filefdi from brics to lics:...
TRANSCRIPT

FDI from BRICs to LICs: Emerging Growth Driver?
Montfort Mlachila and Misa Takebe
WP/11/178

© 2011 International Monetary Fund WP/11/178
IMF Working Paper
African Department
FDI from BRICs to LICs: Emerging Growth Driver?
Prepared by Montfort Mlachila and Misa Takebe1
Authorized for distribution by Abebe Aemro Selassie and Bernardin Akitoby
July 2011
Abstract
Despite the rapid increase in FDI flows to LICs, there have been relatively few studies that have specifically examined these flows. This paper attempts to partially fill the void by throwing light on one particularly dynamic aspect of global FDI—flows from Brazil, Russia, India and China (BRICs). The paper finds that official data sources undoubtedly underestimate the volume and scope of FDI flows as many small and medium-sized enterprises (SMEs) do not always register their investment. As a result, while it is difficult to estimate accurately the growth impact of BRIC FDI, there is case study evidence that it is increasingly significant. Second, while initial investment, mostly by state-owned companies, has often been destined for natural resource industries, over time, investment has been spreading to agriculture, manufacturing, and service industries (e.g., telecommunications). Third, FDI from BRICs flows into many non resource-rich countries in LICs and plays a significant role in growth in those countries.
JEL Classification Numbers: F4, F5, O55, O57
Keywords: FDI, BRICs, low-income countries
Author’s E-Mail Address: [email protected]; [email protected]
This Working Paper should not be reported as representing the views of the IMF. The views expressed in this Working Paper are those of the authors and do not necessarily represent those of the IMF or IMF policy. Working Papers describe research in progress by the authors and are published to elicit comments and to further debate.
1 We are thankful to Yongzheng Yang for inspiring and extensively reviewing this paper, and to Cathy Pattillo and Chris Lane for helpful comments and suggestions. In addition, we are grateful for Ke Wang, Sibabrata Das and Trung Bui for excellent research assistance. All remaining errors are ours.

2 Contents Page
Abstract ..................................................................................................................................... 1
I. Introduction ............................................................................................................................ 3
II. Foreign Direct Investment from BRICs in LICs .................................................................. 5 A. Overview .................................................................................................................. 5 B. Data Issues ................................................................................................................ 6 C. Chinese FDI Flows to LICs and other Developing Countries .................................. 8 D. Chinese FDI Flows to Sub-Saharan Africa ............................................................ 13
III. Major Drivers of Chinese FDI and Their Implications ..................................................... 20
IV. Country Case Studies ........................................................................................................ 23 Angola ............................................................................................................. 24 Liberia……………………………………………………………………...... 25 Sudan ............................................................................................................... 26 Zambia ............................................................................................................ 26
V. The Impact of BRIC FDI ................................................................................................... 27
VI. Concluding Remarks ......................................................................................................... 28 References………………………………………………………………………………. 30
Tables
1. BRICs: Stocks of Outward Foreign Direct Investment to Low-Income Countries .............. 5 2. Major developing economy investors in Africa, 2006-2008. ............................................... 6 3. India: Outward Foreign Direct Investment Stocks to Low-Income and Other Developing Countries ................................................................................................................................... 6 4. Brazil: Outward Foreign Direct Investment Stocks to Low-Income and Other Developing Countries ................................................................................................................................... 6 4. China: FDI Flows to Low-Income Countries...................................................................... 13 6. China: Top FDI Destinations in Sub-Saharan Africa ......................................................... 14 7. Chinese FDI in Selected Sub-Saharan African Economies ................................................ 16 8. Chinese FDI Flows to Angola ............................................................................................. 24 Figures 1. FDI to Developing Countries, 1990–2008 ............................................................................ 3 2. BRICs: Annual Outward Foreign Direct Investment Flows, 1991-2009 .............................. 5 3. China’s Outward FDI Flows ................................................................................................. 8 4. China FDI Outflows, by region, 2003-2008………………………………………………..9 5. China Economic Cooperation, by region, 1998-2008……………………………………. 10 6. China: Global FDI Outflows—Geographic Distribution ...................................................... 8 7. China: Global FDI Outflows—Sectoral Composition ........................................................ 12 Boxes 1. Finding Good Data on Chinese FDI to LICs—Mission Impossible? ................................. 11 2. Typology and Financing of Chinese FDI ............................................................................ 17 3. Chinese FDI in Natural Resources in Africa, 2001–2007 .................................................. 18 4. Packaged Investment Projects in Natural Resources and Related Infrastructure ............... 19 5. Chinese Foreign Economic Cooperation ............................................................................ 20

3
I. INTRODUCTION
The past decade has witnessed a sharp increase in global FDI flows to LICs until they sharply declined in 2009 with the global financial crisis. These flows have been growing at an annual rate of about 20 percent during the period 2000-08. Although considerably less in volume compared to flows to emerging markets, the trends for LICs are strikingly similar in percent of GDP (Figure 1). In both groups, FDI flows were about 5-6 percent of GDP in 2008. This phenomenon occurred in the context of strong global growth, favorable financing conditions and robust terms of trade growth in LICs. Among others, abundant global liquidity coupled with low interest rates were key factors pushing FDI flows to LICs. Improvements in economic fundamentals in the context of market-oriented reforms in many LICs were important “pull” factors.2
The increasing FDI flows to LICs, particularly from BRIC, are expected to bring various benefits. The potential benefits of FDI are well-documented.3 In LICs, more than elsewhere, FDI has the potential of supplementing low savings and adding to the capital stock, thereby directly increasing productive capacity. This is particularly important if FDI is accompanied by improvements in infrastructure, as is often the case of FDI from BRICs. Indirectly, FDI can lead to productivity gains through technology transfer, skill acquisition, increased competition (and associated lower costs), and expansion of exports.
FDI, especially from BRICs, also has the potential to significantly increase the overall level of FDI in LICs as traditional investors are often unwilling to invest in some LICs due to sometimes still difficult working environments. Although some authors have emphasized the risk of BRIC FDI displacing local investors (e.g., Ademola et al. 2009), the welfare benefits in most cases would be expected to outweigh the costs.
Despite the rapid increase in FDI flows LICs, there have been relatively few studies that have specifically analyzed these flows. Dabla-Norris et al. (2010) is one of the few that have done this, while Kiggundu (2008) provides an overview of Chinese FDI to Africa. This study attempts to partially fill the void by throwing light on one particularly dynamic aspect of global FDI—flows from Brazil, Russia, India and China (BRICs).
2 See Dabla-Norris et al. (2010) for more details. 3 See for instance Moran et al. (2005).
0
100
200
300
400
1990 1992 1994 1996 1998 2000 2002 2004 2006 2008
-1
1
3
5
7
Figure 1. FDI to Developing Countries, 1990-2008(In percent of GDP and in US$ billions)
LICs (in percent of GDP, right scale)
EMEs (In percent of GDP, right sacle)
LICs (In US$ billions)
EMEs (In US$ billions)
Source: Dabla-Norris et al.
0
100
200
300
400
1990 1992 1994 1996 1998 2000 2002 2004 2006 2008
-1
1
3
5
7
Figure 1. FDI to Developing Countries, 1990-2008(In percent of GDP and in US$ billions)
LICs (in percent of GDP, right scale)
EMEs (In percent of GDP, right sacle)
LICs (In US$ billions)
EMEs (In US$ billions)
Source: Dabla-Norris et al. (2010).

4 The paper examines BRIC FDI to LICs with a special focus on Chinese FDI to sub-Saharan African (SSA) countries, and aims to broadly assess its macroeconomic impact using case studies. Similar to other forms of BRIC financial flows, comprehensive and reliable information on BRIC FDI to LICs is very limited.
The main findings of the paper are as follows. First, starting from a low base, BRIC FDI inflows to LICs have grown rapidly. The growth of the Chinese FDI stock is, in particular, phenomenal; it increased by 20-fold in just seven years from 2003 to 2009. Even this is likely to be an underestimate since many small and medium-sized enterprises (SMEs) do not always register their investment. Second, while initial investment from China, mostly by state-owned companies, has often been destined for natural resource industries, over time, investment has been spreading to agriculture, manufacturing, and service industries (e.g., telecommunications). Third, many non resource-rich countries have also attracted significant investment. Moreover, private companies, particularly small and medium-sized ones, have become the most dynamic investors, with the potential to form industrial clusters in some LICs as seen in East Asia. A key challenge for LIC policymakers is to ensure that BRIC FDI inflows (and that from other sources) continue to boost local firms’ links to the global economy, and help enhance domestic resource mobilization and develop new activities. Thus, continued improvement in the investment climate is important, as are policy incentives to FDI to encourage joint ventures and local employment. At the same time, however, policymakers should be forward-looking to ensure adequate skill supply required by local and foreign-invested firms; some policy measures such as local content and employment requirements can serve only as a temporary tool. Policymakers should also be aware that some of those policy instruments are very costly. At the same time, policymakers ensure that the development of new activities financed by FDI, particularly new resource extraction, should contribute to enhancing domestic revenue mobilization and, by extension, financing of priority public spending. Therefore, LIC governments need to carefully consider fiscal costs of any policy incentives to FDI, ensuring that public resources are devoted to the highest development priorities.
The paper is organized as follows. Section II examines the key characteristics of BRIC FDI in LICs with a special focus on Chinese FDI to SSA countries since there is almost no readily available and relatively reliable data on FDI from Brazil, India and Russia to LICs. Section III analyses the driving factors behind the rapid growth of Chinese FDI to SSA countries. In order to have a more textured and detailed picture, Section IV undertakes a number of case studies—Angola, Liberia, Sudan and Zambia—and gives some indications of the macroeconomic importance of Chinese FDI to these economies. Section V describes the impact of BRIC FDI, and Section VI presents concluding remarks focusing on challenges emanating from the rapid increase in FDI flows that policymakers face.
5
II. FOREIGN DIRECT INVESTMENT FROM BRICS IN LICS
A. Overview
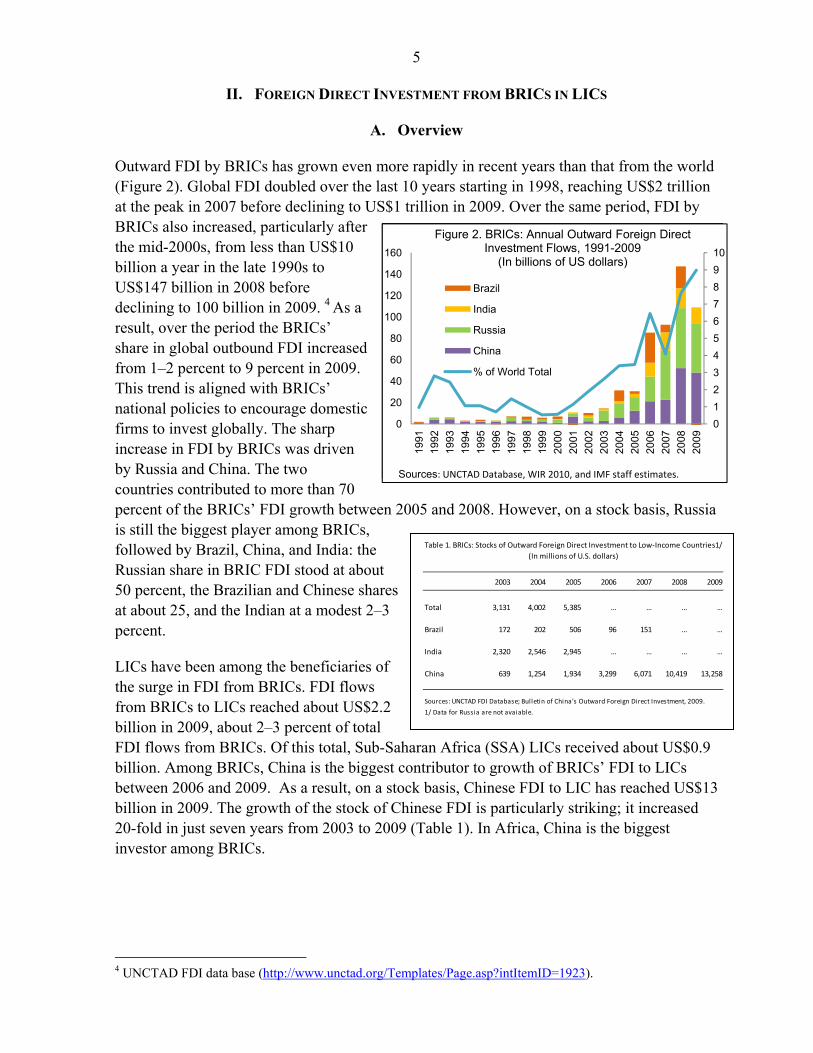
Outward FDI by BRICs has grown even more rapidly in recent years than that from the world (Figure 2). Global FDI doubled over the last 10 years starting in 1998, reaching US$2 trillion at the peak in 2007 before declining to US$1 trillion in 2009. Over the same period, FDI by BRICs also increased, particularly after the mid-2000s, from less than US$10 billion a year in the late 1990s to US$147 billion in 2008 before declining to 100 billion in 2009. 4 As a result, over the period the BRICs’ share in global outbound FDI increased from 1–2 percent to 9 percent in 2009. This trend is aligned with BRICs’ national policies to encourage domestic firms to invest globally. The sharp increase in FDI by BRICs was driven by Russia and China. The two countries contributed to more than 70 percent of the BRICs’ FDI growth between 2005 and 2008. However, on a stock basis, Russia is still the biggest player among BRICs, followed by Brazil, China, and India: the Russian share in BRIC FDI stood at about 50 percent, the Brazilian and Chinese shares at about 25, and the Indian at a modest 2–3 percent.
LICs have been among the beneficiaries of the surge in FDI from BRICs. FDI flows from BRICs to LICs reached about US$2.2 billion in 2009, about 2–3 percent of total FDI flows from BRICs. Of this total, Sub-Saharan Africa (SSA) LICs received about US$0.9 billion. Among BRICs, China is the biggest contributor to growth of BRICs’ FDI to LICs between 2006 and 2009. As a result, on a stock basis, Chinese FDI to LIC has reached US$13 billion in 2009. The growth of the stock of Chinese FDI is particularly striking; it increased 20-fold in just seven years from 2003 to 2009 (Table 1). In Africa, China is the biggest investor among BRICs.
4 UNCTAD FDI data base (http://www.unctad.org/Templates/Page.asp?intItemID=1923).
Table 1. BRICs: Stocks of Outward Foreign Direct Investment to Low-Income Countries1/
2003 2004 2005 2006 2007 2008 2009
Total 3,131 4,002 5,385 … … … …
Brazil 172 202 506 96 151 … …
India 2,320 2,546 2,945 … … … …
China 639 1,254 1,934 3,299 6,071 10,419 13,258
Sources: UNCTAD FDI Database; Bulletin of China's Outward Foreign Direct Investment, 2009.
1/ Data for Russia are not avaiable.
(In millions of U.S. dollars)
0
1
2
3
4
5
6
7
8
9
10
0
20
40
60
80
100
120
140
160
1991
1992
1993
1994
1995
1996
1997
1998
1999
2000
2001
2002
2003
2004
2005
2006
2007
2008
2009
Figure 2. BRICs: Annual Outward Foreign Direct Investment Flows, 1991-2009
(In billions of US dollars)
Brazil
India
Russia
China
% of World Total
Sources: UNCTAD Database, WIR 2010, and IMF staff estimates.

6 There is considerable heterogeneity in the way BRICs invest. FDI in LICs and SSA from some BRICs tends to be concentrated in a limited number of countries. For instance, the bulk of Indian FDI in Africa is destined for Mauritius and a dominant portion of its investment in Asia is in its neighborhood (Bhutan, Sri Lanka, and Nepal), and it is mostly in manufacturing and services. Similarly, Brazilian FDI is mainly concentrated in Bolivia, Angola, and Liberia, mostly in the energy and mineral industries. Chinese FDI appears to be the most geographically diversified among BRICs, spreading to all regions of the world (see below). That said, among Asian LICs, its FDI is mostly in manufacturing, while in SSA the lion’s share in volume terms is in natural resources, although there has been more diversification in recent years. Because of its size relative to the domestic economy, partly stemming from geographical concentration, BRIC FDI can be highly important for recipient countries. In the case of Mauritius, the stock of Indian FDI at end-2005 was as high as US$1.5 billion (22 percent of GDP), with a broad-based sectoral distribution in manufacturing, finance, tourism and other services. In African countries such as Nigeria and Zambia, amounts from China of over US$100 million per year have been the norm over the past few years. In Zambia, for instance, this has represented 1–1½ percent of GDP. In Mongolia, FDI from China reached over 4½ percent of GDP in 2008.
B. Data Issues
It is quite difficult to get reliable data on FDI flows from BRICs to LICs.5 We found that the most reliable data source is the FDI database complied by UNCTAD (Box 1). However, apart from China, the UNCTAD database is still very poor and out of date for other BRIC countries. Both Brazil and India report only FDI stock data to UNCTAD, while Russia does not report any data on FDI to LICs (Tables 2 and 3). The tables show FDI stocks to the main five destinations (including lower middle-income countries) in each region. It is likely that the data are grossly underestimated because of poor reporting by those countries, so only the broadest inferences can be made.
5 See also Dabla-Norris et al. (2010) on this point. Their study uses FDI data from OECD countries to LICs.
Table 2. Major developing economy investors in Africa, 2006-2008
Country Million of US dollars
South Africa 2,609
China 2,528
Malaysia 611
India 332
Taiw an POC 48
Korea 45
Chile 44
Turkey 35
Brazil 14
Source: UNCTAD, World Investment Report 2010
Note: Data refer to the outw ard f low s of the developing economies listed above to Africa as a region in 2006-2008 or the latest three-year period available. Data for India and Taiw an POC are on an approval basis. Data for Malaysia refer to equity only. As data on outflow s to Africa are not available, data for South Africa are derived as differences betw een tw o-year stocks.

7
2001 2002 2003 2004 2005 Average
Total to all developing countries and emerging economies 3,535 4,546 5,136 6,678 7,392 5,458Total to LIC 422 1,187 1,367 1,440 1,523 1,188
of which: total of LIC leading countries 418 1,181 1,361 1,432 1,511 1,181
Sub-Saharan Africa LICs 48 54 58 69 84 63of which: first five most important destinations 44 49 53 63 75 57
Senegal 22 22 22 22 23 22Nigeria 7 11 13 20 24 15Kenya 13 13 15 15 16 14Mozambique 0 0 0 3 10 3Uganda 2 2 2 3 3 3
Asia LICs 340 347 360 368 371 357of which: first five most important destinations 340 347 360 366 368 356
Vietnam 229 229 229 229 229 229Nepal 67 73 78 82 83 76Maldives 21 21 21 21 21 21Bangladesh 15 16 20 22 23 19Myanmar 8 8 12 12 12 11
Middle East LICs 34 786 948 1,002 1,068 768of which: first five most important destinations 34 786 948 1,002 1,068 768
Sudan 0 750 912 964 1,027 730
Total to other developing countries and emerging economies 3,113 3,359 3,770 5,237 5,870 4,270of which: total of other developing leading countries 3,024 3,265 3,661 5,118 5,745 4,163
Sub-Saharan Africa developing countries 643 777 953 1,106 1,422 980of which: first five most important destinations 643 777 953 1,106 1,422 980
Mauritius 618 752 927 1,077 1,383 951South Africa 22 22 22 25 36 25Botswana 3 3 4 4 4 4
Latin America developing countries 33 40 48 67 122 62Asia developing countries 185 229 329 447 536 345Middle East developing countries 497 557 680 778 937 690Central and Eastern Europe developing countries 1,755 1,755 1,759 2,840 2,852 2,192
Memorandum item:Sub-Saharan Africa 692 831 1,011 1,175 1,507 1,043
Total to LICSub-Saharan Africa LICs
Senegal 0.5 0.4 0.3 0.3 0.3 0.3Nigeria 0.0 0.0 0.0 0.0 0.0 0.0Kenya 0.1 0.1 0.1 0.1 0.1 0.1
Asia LICsVietnam 0.7 0.7 0.6 0.5 0.4 0.6Nepal 1.1 1.2 1.2 1.1 1.0 1.1Maldives 3.5 3.3 3.0 2.7 2.8 3.1
Middle East LICsSudan 0.0 5.0 5.1 4.4 3.7 3.7
Total to other developing countries and emerging economiesSub-Saharan Africa developing countries
Mauritius 13.6 15.8 16.4 16.9 22.0 16.9South Africa 0.0 0.0 0.0 0.0 0.0 0.0Botswana 0.1 0.1 0.0 0.0 0.0 0.0
Source: UNCTAD
Table 3. India: Outward Foreign Direct Investment Stocks to Low-Income and Other Developing Countries
(in millions of U.S. dollars)
(in percent of GDP)

8
C. Chinese FDI Flows to LICs and other Developing Countries
Chinese global FDI flows have increased very rapidly over the past few years (Figure 3).6 They have grown more than ten-fold to US$20.5 billion during the period 2003-2009. In terms of geographical composition, Africa, Asia and Europe increasingly gained shares mainly at the expense of Latin America (Figure 4 and 6).7
6 Excluding Chinese territories such as Hong Kong SAR and Macau SAR. 7 In late 2007, Chinese Industrial and Commercial Bank announced its investment into Standard Bank in South Africa for US$5.5 billion. This big investment is shown in a sharp jump in Chinese investment into South Africa in 2008.
2001 2002 2003 2004 2005 2006 2007 Average
Total to all developing countries and emerging economies 13,699 13,055 13,936 14,409 15,331 18,037 17,832 15,186Total to LIC 237 210 147 166 484 71 71 198
of which: total of LIC leading countries 237 210 147 166 484 71 71 198
Sub-Saharan Africa LICs 150 134 83 96 120 1 1 83Liberia 150 134 81 96 120 0 0 83
Latin America LICs 51 65 63 59 364 69 53 103Bolivia 51 65 63 59 64 66 53 60
Asia LICs 6 0 0 0 0 1 0 1Vietnam 6 0 0 0 0 0 0 1
Middle East LICs 31 11 1 12 0 0 17 10Armenia 31 11 1 1 0 0 17 9
Total to other developing countries and emerging economies 13,462 12,844 13,790 14,243 14,847 17,967 17,761 14,988of which: total of other developing leading countries 12,988 12,365 13,397 13,446 14,039 17,024 16,358 14,231
Sub-Saharan Africa developing countries 283 30 26 36 22 26 80 72of which: first five most important destinations 283 30 26 36 22 26 80 72
Angola 274 30 25 34 18 22 73 68Mauritius 1 1 1 2 2 2 3 2South Africa 8 0 0 0 1 2 1 2Equatorial Guinea 0 0 0 0 0 0 3 0
Latin America developing countries 13,158 12,758 13,604 13,766 13,908 16,709 16,677 14,369Asia developing countries 15 14 15 28 77 96 94 48Middle East developing countries 5 28 32 8 0 0 1 11Central and Eastern Europe developing countries 0 14 113 405 840 1,136 910 488
Memorandum item:Sub-Saharan Africa 433 164 109 131 142 26 81 155
LICsSub-Saharan Africa LICs 29.1 24.9 19.9 20.5 22.1 0.0 0.0 16.7Latin America LICs 0.6 0.8 0.8 0.7 23.5 0.6 0.4 3.9Asia LICs 0.0 0.0 0.0 0.0 0.0 0.0 0.0 0.0Middle East LICs 1.5 0.5 0.0 0.0 0.0 0.0 0.2 0.3
Source: UNCTAD
Table 4. Brazil: Outward Foreign Direct Investment Stocks to Low-Income and Other Developing Countries
(in percent of GDP)
(in millions of U.S. dollars)

9
1.72.8
8.8
10.7
12.7
16.6
20.5
0
5
10
15
20
25
2003 2004 2005 2006 2007 2008 2009
Figure 3. China's Outward FDI Flows (in billions of U.S. dollars)
Source: Statistical Bulletin of China’s Outward Foreign Direct Investment.
0
10
20
30
40
0
5
10
15
20
25
2003 2004 2005 2006 2007 2008 2009
Figure 4. China FDI Outflows, by region, 2003-2008(in billions of U.S. dollars)
Asia 1/ Africa 2/Europe Latin AmericaNorth America Oceania
1/ Excluding FDI to Hong Kong SAR, Macau SAR.2/ Including North Africa

10
8
10
12
14
16
18
20
0
10
20
30
40
50
60
70
1998 1999 2000 2001 2002 2003 2004 2005 2006 2007 2008
Figure 5. China Economic Cooperation, by region, 1998-2008(in billions of U.S. dollars)
Others America EuropeSSA Asia % of SSA (RHS)
Source: Chinese Ministry of Commerce.

11
Box 1. Finding Good Data on Chinese FDI to LICs—Mission Impossible?
Assembling a reliable database on Chinese FDI in LICs is a very challenging task. Normally, the most reliable source would be UNCTAD, which publishes an annual report on FDI, both inbound and outbound. For China, the main primary sources are the Ministry of Commerce (which provides information on approval basis before 2002 and on a commitment basis thereafter), and the State Administration of Foreign Exchange (SAFE). Both sources provide FDI data only on the nonfinancial sector and together with the National Bureau of Statistics publish the Statistical Bulletin of China’s Outward Foreign Direct Investment.
The FDI data from the Bulletin is in the form of flows and stocks. Unfortunately, there are large discrepancies between changes in stocks and flows that cannot be easily explained away by valuation changes. Attempts to supplement this data by individual IMF country desk officers proved less than satisfactory as most countries do not keep FDI data on a BOP basis by country of origin. Unless otherwise stated, the analysis in this paper is based on flow data.
There are three main problems in tracking Chinese FDI data in individual countries. First, headline FDI numbers often touted in the press are usually exaggerated. Often these cover intentions to invest over several years, and sometimes investment decisions can be reversed or modified substantially.1 Second, because of the so-called “Angola mode” of financing packages (see figure below)2, it is virtually impossible to disentangle genuine FDI from bilateral aid and suppliers/construction contracts. In this mode, the Chinese government reaches a framework agreement with a country to undertake a development project in exchange for access rights to natural resources, e.g., oil. No money is usually directly transferred to the recipient government. In return, the Chinese government awards a construction contract to a Chinese company, and a Chinese oil company acquires rights to begin exploration/production. Sometimes the Chinese oil company can acquire an interest for cash in a joint venture with a local LIC government. It is presumed Chinese official FDI statistics cover only a part of those financial packages under “Angola mode. Third, according to Chinese official sources, a very large amount of FDI is to tax heavens such as the Cayman Islands.
For these reasons, Chinese FDI to most LICs in official statistics is grossly underestimated. In the words of Kaplinsky and Morris (2009), “Official estimates of China’s FDI are contradictory, confusing and almost certainly understate their true significance”. For instance, according to Chinese data sources, Angola does not feature among the top five recipients of Chinese FDI in Africa, although it is well-established that the country is one of the biggest recipients of Chinese cooperation (Kaplinsky and Morris, 2009).
“Angola Mode”—Schematic Presentation
Source: Foster et al. (2009).
1A typical example is the Heritage Foundation’s China Global Investment Tracker database which gives project by project
headline numbers of over US$100 million without time series of actual flows. http://www.heritage.org/Research/Reports/2010/02/China-Global-Investment-Tracker-2010
2 The term “Angola mode” derives from the fact that this mode of financing was first used extensively in Angola.2

12 During the same period, there has been a significant sectoral shift in Chinese FDI flows (Figure 7). The flows have increasingly moved from mining and infrastructure to services such as wholesale and retailing, leasing, real estate, and hospitality business. The mining sector (including oil) accounted for less than one quarter of the total in value terms in 2009.
Chinese FDI to LICs has increased in importance, rising from 5.7 percent of its total outbound FDI in 2003 to nearly 10 percent in 2009. Among LICs, Asia and Sub-Saharan Africa are the major destinations, occupying more than 95 percent of Chinese FDI to LICs in 2003-2009 (Table 4). Pakistan, which was classified as a LIC until early 2010, was the top destination of Chinese FDI. This was driven by big investments in 2007 and 2008 totaling US$1.2 billion. The rest of destinations are mainly SSA countries with natural resources such as Nigeria and Zambia. In fact, excluding Pakistan, SSA countries composed 60-70 percent of Chinese FDI in LICs. Meanwhile, some non-SSA countries (which are non-resource-rich countries) such as Mongolia, Myanmar, Cambodia, and Vietnam are also at the top of the list. Their diasporas helped Chinese investors to establish contact and obtain local information. Such trends can be also be seen in Africa, as pointed out by Gu (2009).

13
D. Chinese FDI Flows to Sub-Saharan Africa
Since in recent years China has become much more visible in Africa, this section examines the characteristics of Chinese FDI to SSA countries. These flows have grown very rapidly over the past few years, although they remain relatively small in comparison to global FDI in SSA countries. They rose from about US$70 million to about US$1 billion during the period 2003-09 (more than a half of China’s FDI outflows to LICs in 2009) with an exceptionally sharp increase in 2008 to about US$5½ billion. However, most of this growth was recorded in South Africa, where the Chinese Industrial and Commercial Bank acquired a 20 percent stake in Standard Bank. Other major recipients of Chinese FDI by order of importance were Nigeria, Zambia, and the Democratic Republic of Congo (Table 6). Despite such a rapid growth of Chinese FDI to SSA countries, based on official sources, China is a minor player in global FDI to SSA countries. Compared to global FDI to SSA countries, the Chinese share is estimated to have increased from less than ½ percent in the early 2000s to about 4½ percent in 2007.
2003 2004 2005 2006 2007 2008 2009 Average
Total 118 411 449 694 2,375 6,555 2,358 1,851
Sub-Saharan Africa 68 152 201 362 1,297 5,480 1,070 1,233
of which LICs 47 126 139 262 767 598 943 412
Latin America 6 1 3 21 63 13 9 17
Asia 42 97 118 231 820 917 1,202 489Middle East 3 161 128 81 194 145 77 113
Total … 246.7 9.3 54.6 241.9 176.0 -64.0 110.8
Sub-Saharan Africa … 122.2 32.5 79.9 258.9 322.4 -80.5 122.6
of which LICs … 167.1 10.3 89.3 192.4 -22.0 57.6 82.5
Latin America … -75.9 110.1 621.0 203.5 -79.8 -33.3 124.3
Asia … 131.6 21.8 95.8 255.3 11.9 31.1 91.3Middle East … 5,759.3 -20.9 -36.1 138.6 -25.4 -47.1 961.4
Total 7.1 14.5 5.1 6.5 18.7 39.4 11.5 14.7
Sub-Saharan Africa 4.1 5.3 2.3 3.4 10.2 33.0 5.2 9.1
of which LICs 2.8 4.4 1.6 2.4 6.0 3.6 4.6 3.6
Latin America 0.3 0.0 0.0 0.2 0.5 0.1 0.0 0.2
Asia 2.5 3.4 1.3 2.1 6.4 5.5 5.9 3.9Middle East 0.2 5.7 1.4 0.8 1.5 0.9 0.4 1.5
Source: Statistical Bulletin of China’s Outward Foreign Direct Investment.
Table 4. China: FDI Flows to Low-Income Countries
(In millions of U.S. dollars)
(Annual growth rate, in percent)
(In percent of total Chinese FDI)

14 Table 6. China: Top FDI Destinations in Sub-Saharan Africa
(In millions of U.S. dollars)
Chinese FDI to SSA comes in various forms and through various financing mechanisms (Boxes 2,4 and 5). There are many actors involved, ranging from individual private entrepreneurs to vary large state-owned enterprises. Many of investment projects in natural resources took the form of packaged investment involving related infrastructure projects. The financing arrangements also range from own private financing to loans from the Chinese EXIM Bank or other state-owned banks. The China-Africa Development Fund has also played an increasingly important role in providing private equity financing for joint ventures.
The natural resource and infrastructure sectors attract the biggest share of Chinese FDI to SSA in terms of volume. Sectoral allocation of Chinese FDI to SSA countries seems to be concentrated on natural resources and related infrastructure (Boxes 2, 3 and 4). Due to the paucity of the data, the exact sectoral allocation of Chinese FDI to SSA countries is not known. However, since the largest recipients of Chinese FDI and economic cooperation in SSA are mostly natural resource countries, it is reasonable to conclude that Chinese FDI to SSA countries is mostly concerned with natural resources and infrastructure in terms of value.8,9,10 Chinese investment in the resource sector extends to many countries (Box 3). UNCTAD (2010) noted that the mining industry is the main destination of greenfield investment in Africa.
8 Private Participation in Infrastructure Project Database (http://ppi.worldbank.org) also shows that there are infrastructure projects involving equity participation by Chinese entities in SSA countries. However, the participation rate is not known. 9 A survey was conducted of all desk economists covering LICs with the aim of filling the data gap of BRICs’ FDI to LICs. 10 See UNCTAD (2009) and Broadman (2006). The staff survey also confirms this.
South Africa 774 South Africa 454
Nigeria 131 Nigeria 390
Zambia 79 Zambia 119
Congo, Dem. Rep. of 52 Niger 101
Niger 26 Congo, Dem. Rep. of 57
Madagascar 19 Angola 41
Ethiopia 18 Mauritius 16
Mauritius 13 Ethiopia 13
Chad 13 Madagascar 13
Guinea 12 Guinea 13
Source: Bulletin of China's Outward Foreign Direct Investment , 2009.
Ranking Based on Average, 2003-09 Ranking Based on 2007

15 In general, large state-owned firms tend to have a strong focus on resources and infrastructure, while private firms tend to concentrate on manufacturing and service industries (Kaplinsky and Morris, 2009). Therefore, while resource and infrastructure investment is likely the largest sector in value terms, the number of private projects in other sectors is high and growing.11
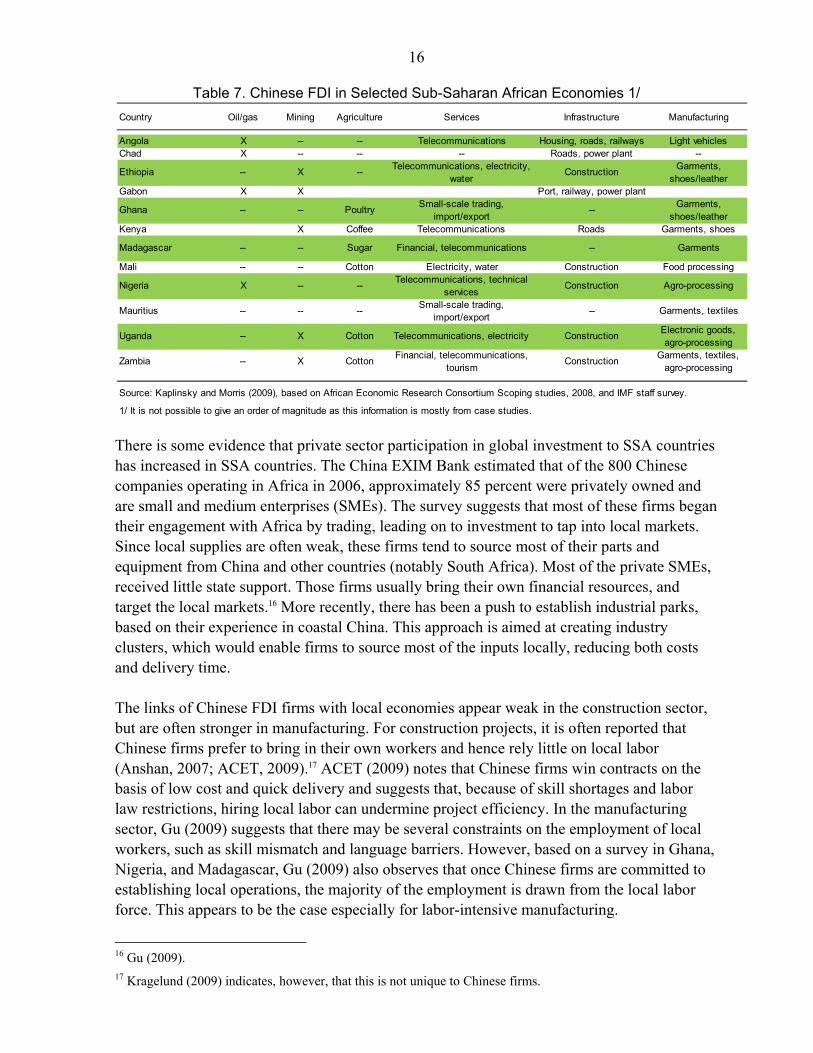
Indeed, there are some indications that China has begun to expand its investment beyond natural resources and infrastructure, seeking growing domestic and regional markets in SSA or taking advantage of preferential trade treatment of SSA exports in advanced countries (Table 7).12 As discussed above, official Chinese statistics indicate that at a global level, China’s outward FDI has shifted toward the service sector. This global shift to other sectors appears also to be occurring in SSA. For example, Chinese wholesalers became active particularly in Kenya, South Africa, and Uganda as a platform to service to Chinese migrant retailers in neighboring countries.13 In Tanzania, Chinese firms recently invested in automotive and truck assembly operations aiming to export to neighboring countries.14 Some southern African countries also began winning FDI in the apparel sector from China thanks to the US’s Africa Growth and Opportunity Act (AGOA), which gives eligible SSA countries duty-free access to the US market.15 Even in resource-rich countries, Chinese FDI is not necessarily concentrated in the resource sector, as the Zambia case demonstrates (Box 2 and Table 7).
11 Estimates of the number of Chinese FDI firms vary widely. UNDP/UNCTAD (2007) estimated that there were approximately 700 Chinese enterprises operating in Africa alone, including in three of its eight overseas economic and trade cooperation zones in Africa. The Chinese EXIM Bank puts the number at 800 in 2006. Other Chinese sources suggest that there were at least 2,000 Chinese enterprises in Africa in 2007–08. The exact number of FDI firms is difficult to estimate, as the situation is quite dynamic, and many small and medium sized enterprises (SMEs) are often not covered by official statistics. Baah and Jauch (2009) report that of the 450 recorded Chinese investment projects in Africa, an estimated 46 percent are in manufacturing, 40 percent in services and 9 percent in resource-related industries. The latter account for 28 percent of the total in value terms. 12 According to UNCTAD (2010), there has been a general trend of diversifying inflows to Africa.
13 Kaplinsky and Morris (2009).
14 Broadman (2006).
15 Broadman (2006) and UNCTAD (2009).
16
Table 7. Chinese FDI in Selected Sub-Saharan African Economies 1/
There is some evidence that private sector participation in global investment to SSA countries has increased in SSA countries. The China EXIM Bank estimated that of the 800 Chinese companies operating in Africa in 2006, approximately 85 percent were privately owned and are small and medium enterprises (SMEs). The survey suggests that most of these firms began their engagement with Africa by trading, leading on to investment to tap into local markets. Since local supplies are often weak, these firms tend to source most of their parts and equipment from China and other countries (notably South Africa). Most of the private SMEs, received little state support. Those firms usually bring their own financial resources, and target the local markets.16 More recently, there has been a push to establish industrial parks, based on their experience in coastal China. This approach is aimed at creating industry clusters, which would enable firms to source most of the inputs locally, reducing both costs and delivery time. The links of Chinese FDI firms with local economies appear weak in the construction sector, but are often stronger in manufacturing. For construction projects, it is often reported that Chinese firms prefer to bring in their own workers and hence rely little on local labor (Anshan, 2007; ACET, 2009).17 ACET (2009) notes that Chinese firms win contracts on the basis of low cost and quick delivery and suggests that, because of skill shortages and labor law restrictions, hiring local labor can undermine project efficiency. In the manufacturing sector, Gu (2009) suggests that there may be several constraints on the employment of local workers, such as skill mismatch and language barriers. However, based on a survey in Ghana, Nigeria, and Madagascar, Gu (2009) also observes that once Chinese firms are committed to establishing local operations, the majority of the employment is drawn from the local labor force. This appears to be the case especially for labor-intensive manufacturing.
16 Gu (2009). 17 Kragelund (2009) indicates, however, that this is not unique to Chinese firms.
Country Oil/gas Mining Agriculture Services Infrastructure Manufacturing
Angola X -- -- Telecommunications Housing, roads, railways Light vehiclesChad X -- -- -- Roads, power plant --
Ethiopia -- X --Telecommunications, electricity,
waterConstruction
Garments, shoes/leather
Gabon X X Port, railway, power plant
Ghana -- -- PoultrySmall-scale trading,
import/export--
Garments, shoes/leather
Kenya X Coffee Telecommunications Roads Garments, shoes
Madagascar -- -- Sugar Financial, telecommunications -- Garments
Mali -- -- Cotton Electricity, water Construction Food processing
Nigeria X -- --Telecommunications, technical
servicesConstruction Agro-processing
Mauritius -- -- --Small-scale trading,
import/export-- Garments, textiles
Uganda -- X Cotton Telecommunications, electricity ConstructionElectronic goods, agro-processing
Zambia -- X CottonFinancial, telecommunications,
tourismConstruction
Garments, textiles, agro-processing
Source: Kaplinsky and Morris (2009), based on African Economic Research Consortium Scoping studies, 2008, and IMF staff survey.
1/ It is not possible to give an order of magnitude as this information is mostly from case studies.
17
Box 2. Typology and Financing of Chinese FDI
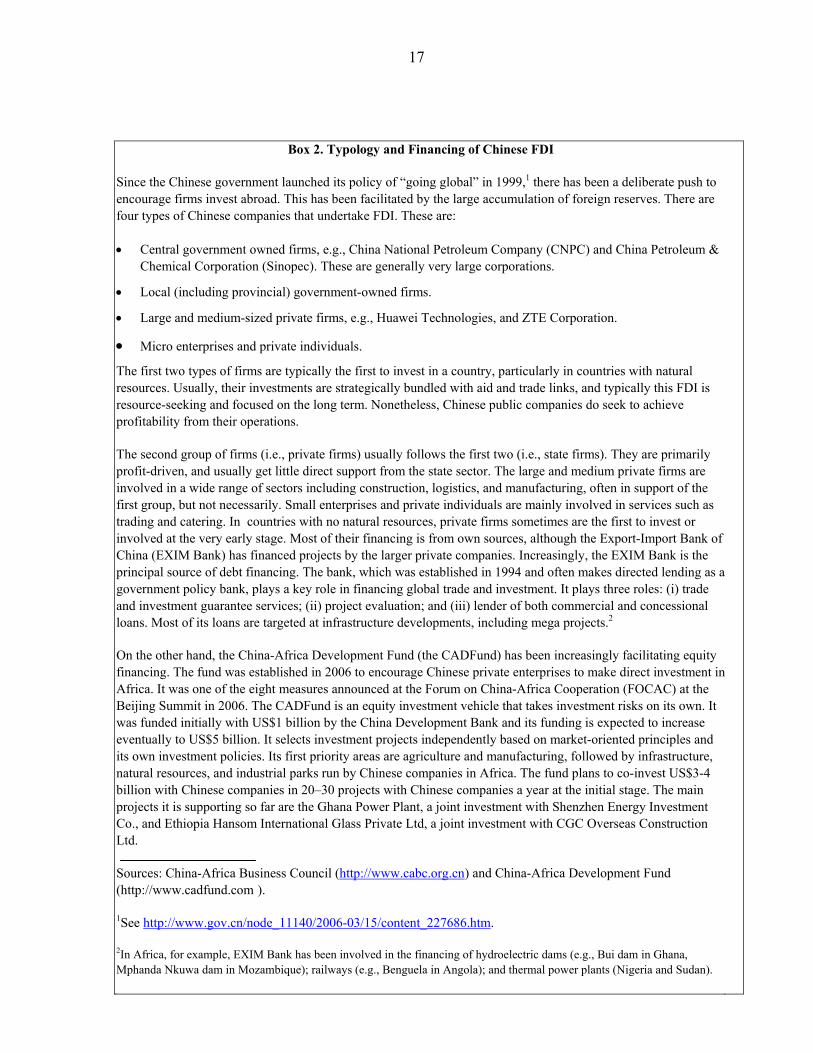
Since the Chinese government launched its policy of “going global” in 1999,1 there has been a deliberate push to encourage firms invest abroad. This has been facilitated by the large accumulation of foreign reserves. There are four types of Chinese companies that undertake FDI. These are:
Central government owned firms, e.g., China National Petroleum Company (CNPC) and China Petroleum & Chemical Corporation (Sinopec). These are generally very large corporations.
Local (including provincial) government-owned firms.
Large and medium-sized private firms, e.g., Huawei Technologies, and ZTE Corporation.
Micro enterprises and private individuals.
The first two types of firms are typically the first to invest in a country, particularly in countries with natural resources. Usually, their investments are strategically bundled with aid and trade links, and typically this FDI is resource-seeking and focused on the long term. Nonetheless, Chinese public companies do seek to achieve profitability from their operations.
The second group of firms (i.e., private firms) usually follows the first two (i.e., state firms). They are primarily profit-driven, and usually get little direct support from the state sector. The large and medium private firms are involved in a wide range of sectors including construction, logistics, and manufacturing, often in support of the first group, but not necessarily. Small enterprises and private individuals are mainly involved in services such as trading and catering. In countries with no natural resources, private firms sometimes are the first to invest or involved at the very early stage. Most of their financing is from own sources, although the Export-Import Bank of China (EXIM Bank) has financed projects by the larger private companies. Increasingly, the EXIM Bank is the principal source of debt financing. The bank, which was established in 1994 and often makes directed lending as a government policy bank, plays a key role in financing global trade and investment. It plays three roles: (i) trade and investment guarantee services; (ii) project evaluation; and (iii) lender of both commercial and concessional loans. Most of its loans are targeted at infrastructure developments, including mega projects.2
On the other hand, the China-Africa Development Fund (the CADFund) has been increasingly facilitating equity financing. The fund was established in 2006 to encourage Chinese private enterprises to make direct investment in Africa. It was one of the eight measures announced at the Forum on China-Africa Cooperation (FOCAC) at the Beijing Summit in 2006. The CADFund is an equity investment vehicle that takes investment risks on its own. It was funded initially with US$1 billion by the China Development Bank and its funding is expected to increase eventually to US$5 billion. It selects investment projects independently based on market-oriented principles and its own investment policies. Its first priority areas are agriculture and manufacturing, followed by infrastructure, natural resources, and industrial parks run by Chinese companies in Africa. The fund plans to co-invest US$3-4 billion with Chinese companies in 20–30 projects with Chinese companies a year at the initial stage. The main projects it is supporting so far are the Ghana Power Plant, a joint investment with Shenzhen Energy Investment Co., and Ethiopia Hansom International Glass Private Ltd, a joint investment with CGC Overseas Construction Ltd.
Sources: China-Africa Business Council (http://www.cabc.org.cn) and China-Africa Development Fund (http://www.cadfund.com ).
1See http://www.gov.cn/node_11140/2006-03/15/content_227686.htm.
2In Africa, for example, EXIM Bank has been involved in the financing of hydroelectric dams (e.g., Bui dam in Ghana, Mphanda Nkuwa dam in Mozambique); railways (e.g., Benguela in Angola); and thermal power plants (Nigeria and Sudan).

18
Box 3. Chinese FDI in Natural Resources in Africa, 2001–2007
Chinese firms became very active in investing directly in natural resources in SSA countries starting in 2003. During 2003–2007, Chinese firms were involved in 81 projects in at least 25 SSA countries, 40 percent of them in the oil sector, 55 percent in mining, and 5 percent in natural gas. In terms of value, more than 70 percent of the total commitment of about US$10 billion (cumulatively) was in the oil sector.
In the oil sector, Chinese firms usually acquire exploration and drilling rights, or directly purchase oil blocks or production-sharing contracts. In most cases, the investment has been made in the exploration stage, but some investment was recently made in the refining stage. Between 2001 and 2007, Chinese firms were involved in oil investment projects in 18 SSA countries across the continent, most of them among the top recipients of Chinese economic cooperation. Most investments were initiated under bilateral agreements and run by one or more of three state-owned enterprises: China National Petroleum Corporation (CNPC), China Petroleum & Chemical Corporation (Sinopec), and China National Offshore Oil Corporation (CNOOC).
In the mining sector, Chinese firms usually form a joint venture with local firms or directly purchase equity of local entities. Chinese firms were involved in mining projects in 16 SSA countries, especially in the mining belt of central-southern Africa (especially Zambia and Tanzania). Unlike in the oil sector, both Chinese state-owned and private companies are active in mining projects. Sources: The World Bank—PPIAF Chinese Project Database and IMF staff survey.

19
Box 4. Packaged Investment Projects in Natural Resources and Related Infrastructure
The lack of appropriate infrastructure has been one of the reasons why natural resources in SSA countries are left relatively untouched by traditional investors. SSA lags behind other developing regions on most infrastructure indicators, especially paved roads, railways, electricity supply and communications. In fact, according to the World Bank, annual infrastructure spending needs amount to over US$90 billion, of which only two-thirds are met.
In order to overcome such problems, China started to offer packaged investment projects both in natural resources and in related infrastructure. Normally in packaged projects, the natural resource part is equity-financed by Chinese entities as FDI and the infrastructure part is debt-financed usually by Chinese EXIM Bank on concessional terms as part of economic cooperation.
In many cases, packaging can help SSA countries to export natural resources to China. Indeed, there is quantitative evidence that FDI and economic cooperation often go hand-in-hand (Figure 8), and higher FDI from China is associated with greater concentration of exports to China (Figure 9).
From a political economy perspective, such arrangements have several advantages. First, they are appealing to SSA countries because inadequate infrastructure has been one of the biggest impediments not only for attracting FDI and but also for enhancing growth. Moreover, even compared to other global contractors, China has a very competitive construction sector that provides value for money. Second, they allow China to gain the competitive edge against other potential investors. Third, they enable China to demonstrate to a recipient country that it is in it “for the long haul”. Finally, for strategic resources such as oil, it is in China’s interest to ensure that it can count on secure supply in the long run.
.
Sources: Foster et al. (2009) and IMF staff.
y = 0.2474x - 0.1371
-0.2
0.0
0.2
0.4
0.6
0.8
1.0
0 1 2 3 4 5
FDI
Total Economic Cooperation
Figure 8. China FDI and Economic Cooperation
(in percent of GDP)
Source: WEO database. Statistical Bulletin of
y = 0.0164x + 0.1531
-0.2
0
0.2
0.4
0.6
0.8
1
0 5 10 15
FDI (
in p
erc
en
t o
f G
DP
)
Share of Exports to China in Total Exports ( in percent)
Figure 9. FDI and Share of Exports to China
Source: WEO database. Statistical Bulletin of China’s

20
8
10
12
14
16
18
20
0
10
20
30
40
50
60
70
1998 1999 2000 2001 2002 2003 2004 2005 2006 2007 2008
China Economic Cooperation, by region, 1998-2008
(in billions of U.S. dollars)
Others America
Source: Chinese Ministry of Commerce
8
10
12
14
16
18
20
0
10
20
30
40
50
60
70
1998 1999 2000 2001 2002 2003 2004 2005 2006 2007 2008
China Economic Cooperation, by region, 1998-2008
(in billions of U.S. dollars)
Others America
Source: Chinese Ministry of Commerce
Box 5. Chinese Foreign Economic Cooperation
One of the main reasons that FDI is under-reported is that typically it is part of Chinese “Foreign Economic Cooperation (FEC)” together with credit lines, long-term loans, and grants. In order to capture the comprehensive characteristics of Chinese FDI, it is worth looking at Chinese FEC. Conceptually, FEC is different from FDI. It is constructed based on contractors rather than investors as FDI. Therefore, FEC includes FDI projects contracted to Chinese firms, but not those contracted to non-Chinese firms. However, it is likely that most of Chinese FDI projects are contracted to Chinese firms because Chinese firms are competitive in the construction sector, the main field of Chinese FDI. Indeed, statistical analysis indicates that FEC and FDI are strongly correlated. However, FEC and FDI are not in a one-to-one relationship because FEC includes many items other than FDI as discussed above.
China has strengthened its economic cooperation with SSA countries over the last decade or so. Total Chinese foreign economic cooperation increased from about US$10 billion in the late 1990s to US$65 billion in 2008. Although roughly half of this goes to Asia, the share of SSA countries in total Chinese economic cooperation increased from about 10 percent in the late 1990s to 18 percent in 2008, and the absolute amount grew from about US$1 billion to US$12 billion. The sharp increase since the early 2000s coincided with the launch of the Forum on China-Africa Cooperation (FOCAC) by China and 51 African countries in 2000 to promote South-South cooperation; China’s declaration of the “Year of Africa” at the FOCAC Beijing Summit in 2006; and the start of subsequent initiatives to promote Chinese private investment in Africa.
Chinese economic cooperation with SSA countries has been concentrated in terms of country distribution. Among the top 10 countries, most of them are exporters of natural resources. For 1998–2008, the top 10 countries accounted for 60–80 percent of total Chinese economic cooperation with SSA countries. However, members in the top 10 changed often during the period. Angola, Tanzania, Botswana, and the Republic of Congo moved in recently and Guinea, Mauritius, and Zimbabwe dropped out. However, Nigeria, Ethiopia, and Mali continued to be favorites with China in most of the period.
III. MAJOR DRIVERS OF CHINESE FDI AND THEIR IMPLICATIONS
The lack of reliable data on Chinese FDI to SSA countries poses serious problems for quantitative empirical analysis to determine what is driving Chinese FDI. Therefore, this section mainly relies on findings from a growing literature on Chinese FDI and FDI to SSA

21 countries and summarizes the arguments.18 Traditionally, two types of drivers are considered to be behind FDI flows: pull factors (domestic conditions of recipient countries) and push factors (external conditions). Typical pull factors are macroeconomic conditions attracting inward FDI such as size of the economy, growth, inflation, fiscal and external balances, and openness of the economy, as well as structural factors such as the strength of institutions and the quality of infrastructure. Typical push factors are conditions encouraging outward FDI such as world interest rates and world economic growth. In the case of Chinese FDI in SSA, both pull and push factors play an important role.
For Chinese FDI to SSA countries, push factors include:
Abundant foreign reserves. The Chinese authorities seek to diversify the investment portfolio of their accumulating foreign reserves for a better rate of return. In addition, greater capital outflows would mitigate the appreciation pressure on the Renminbi.19 Given the current uncertainty over the growth prospects in the US and European economies, there might be growing incentives for China to invest in emerging markets and low-income countries, including in Africa.
Increasing natural resource security concerns. The Chinese authorities are eager to secure natural resources abroad in order to support high growth at home.20
Greater Chinese government support for outward FDI. Partly because of the above two push factors, the Chinese government has begun to support outward FDI with official loans, export credits, and ready access to foreign exchange for Chinese firms.21
Rising labor costs in China. Chinese firms seek lower labor and production costs abroad to survive given increasing competition and excess production capacity in their home market.22
More acceptance of risk. Some have argued that Chinese investors are less risk-averse than investors from industrial countries, they are willing to accept the relatively higher risks of SSA countries. 23
Pull factors in SSA countries include:
18 See for instance various publications by the Centre for Chinese Studies, Stallenbosch University. 19 China Monitor, August 2006. 20 Foster et al. (2009). 21 According to a survey by Yao and He (2006), Chinese firms investing in Africa rank “Chinese government support” as the second most important determinant of their investment decision. Also, on average 88 percent of Chinese firms engaged in FDI are owned by provincial governments. 22 Gu (2009). 23 The Center for Chinese Studies (2010).

22 Abundant natural resources. Many SSA countries are endowed with rich and
relatively untouched natural resources, which usually offer a high rate of return on FDI. This is the case for Chinese investments such as in Angola (oil), Democratic Republic of Congo (copper and cobalt), Liberia (iron ore), and Sudan (oil). 24
Improving investment and business climate. Several SSA countries, such as Zambia and Ghana have recently introduced business facilitation measures and reformed legal frameworks for FDI. 25 This has created an enabling environment that is attracting investment outside of the natural resource sector.
Better macroeconomic conditions. SSA countries have achieved relatively stable macroeconomic conditions with lower inflation and better fiscal and external balances.26 Countries with strong fiscal positions such as Botswana have attracted the establishment of major Chinese construction companies which are interested in bidding for government contracts.27
Greater economic liberalization and deregulation. Many SSA countries have pursued economic liberalization and deregulation for the past few years, giving foreign firms a better access to their markets, e.g., in Ethiopia.28
Privatization. Many SSA countries have been privatizing state-owned enterprises to reduce the burden on the budget and make the enterprises more efficient. Privatization has attracted FDI as a relatively easy access to SSA markets for foreign investors, for example, in Zambia, a large number of assets in the mining sector acquired by foreign companies used to be state-owned.29
Preferential trade schemes: The EU’s Everything but Arms (EBA) program and the U.S. African Growth and Opportunity Act (AGOA) have given foreign firms more incentive to invest in SSA countries as a base for exporting to Europe and the US, especially in sectors such as apparel where low-costs are a key consideration.
The available empirical evidence—albeit to be used very cautiously—does not identify particular pull factors for Chinese FDI to SSA, apart from abundant natural resources.30 Although some bilateral correlations were found, there does not seem to be any obvious 24 Basu and Srinivasan (2002) and Foster et al. (2009). 25 Basu and Srinivasan (2002), Broadman (2004), and Yao and He (2005). 26 UNCTAD (2009). Regional Economic Outlook Sub-Sahara Africa (2010) 27 The ten largest construction companies in Botswana are Chinese, including China State Construction Engineering Corporation and China Civil Engineering Construction Company. For the giant US$1.4 billion Morupule power plant, China National Electric Equipment Corporation was awarded a contract of US$970 million. 28 UNCTAD (2009). 29 Basu and Srinivasan (2002), and UNCTAD (2009). 30 An econometric model of the FDI determinants à la Dabla-Norris et al. (2010) did not yield any significant results.

23 relationship between FDI and most macroeconomic factors (e.g., real GDP growth, export growth, etc.) and structural indicators in a multivariate econometric model.31 This finding of little relation is likely due to several reasons. First, Chinese FDI flows are very likely underestimated with different degrees of underestimation over years, and do not capture its true trend and variation. Second, in most cases, most of those FDI have just started and do not provide enough historical evidence to support pull factor theory because of its short time series of data.
However, this does not mean that business environment and other structural factors are not important. It has been argued that Chinese investors, like other South-South investors, are more willing to put up with difficult working environments than their western counterparts on the promise of higher returns.32 Direct access to a large market, bypassing intermediaries and reducing the burden of import duties, can reduce production cost and thus increase profitability. At the same time, some Chinese companies are able to increase the marginal efficiency of underutilized equipment due to stiff competition in China. For these reasons, these investors have an interest in working in a business environment—while not ideal—that has sufficient safeguards for them to appropriate returns from their risky investments.
Although Chinese investors are more willing to take risk, the pull and the push factors identified above are still likely to be important in the long run. Given that Chinese involvement is typically based on commercial reasons, these pull factors should drive Chinese FDI in SSA countries particularly outside the natural resource and related infrastructure sector. Except for privatization and preferential trade schemes, all the factors are expected to continue if SSA countries sustain their reform momentum. In addition, over the long run, given China’s rapid development and moving up the industrial value chain, pressure is likely to build for lower cost destinations for its lower end industries, and also push Chinese FDI to SSA.
IV. COUNTRY CASE STUDIES
This section attempts to add “granularity” to the discussion by more closely examining four case studies, drawing on a recent series of studies commissioned by the African Economic Research Consortium, journal and newspaper articles, as well as the staff survey. The case studies highlight various aspects of BRICs’ involvement. For example, this case study provides evidence of FDI-trade complementarities (Angola, Liberia, and Sudan), regional integration (Zambia), fiscal revenue enhancement (Liberia) and significant growth impact (Liberia and Sudan). It also shows evidence of the importance of privatization (Zambia) and
31 CPIA or any of its components quality of public institutions and such as control of corruption were used as structural indicators. 32 Darby et al. (2009) show empirically that when South multinational enterprises have had prior experience of poor institutional quality at home, the impact of good governance on FDI in a given host country is moderated significantly or even eliminated in some cases. Gu (2009) argues that Chinese private entrepreneurs have a strong entrepreneurial spirit and have changed the concept of risk: “when Western firms see ‘risk’, they see ‘opportunity’.

24 business climate (Zambia) as the driver of FDI. We chose the following four different types of countries as case studies.
Angola—natural resource case: the country became the primary source of Chinese oil imports.
Liberia—a post-conflict country case involving all four BRICs who are vying to invest in various mining activities and replace western investors.
Sudan—growth spillover case: a country that has been cut off from access to most international financing sources, but which has tremendously developed its oil resources thanks to Chinese aid and FDI, thereby raising its overall growth.
Zambia—a “frontier” economy case: the country has attracted a lot of global FDI thanks to its fairly liberal investment climate and where Chinese involvement in industrial parks is likely to set the example for other countries.
Angola33 Overall FDI in Angola has historically been resource-seeking. Given that Angola is the second largest oil producer in sub-Saharan Africa, FDI has been concentrated in oil exploration and production, mainly offshore. The country is now China’s leading supplier of petroleum.
Angola typifies the difficulties in tracking BRICs FDI in LICs. Angola’s national private investment agency (ANIP) does not report investments made in the oil and diamond sectors, which are among the most important in the economy. As such Sinopec’s purchase of oil blocks is not included in FDI data. According to UNCTAD data, Chinese FDI to Angola was a negligible proportion of total Chinese FDI to Africa prior to 2006 (Table 8). Even during 2006-07, total FDI to Angola averaged only about US$30 million (3 percent of the African total) and likely to be underestimated.
Chinese involvement in Angola started in earnest in 2004 with the opening of a US$2 billion credit line. This was later increased and reached US$4.5 billion by 2007, thus making China the largest player in Angola’s post-war reconstruction. There is a sufficiently large Chinese presence to have a local Chinese business association. Major public and private companies such as Sinopec, Sinosteel, Jiangsu International, Huawei and ZTE have a strong local presence.
33 This case study draws in part on Kiala and Corkin (2009).
2003 2004 2005 2006 2007
Angola 0 0 0 22 41
Africa 75 317 392 520 1,574
Angola's share (percent) 0 0 0 4 3
Source: UNCTAD.
Table 8. Chinese FDI Flows to Angola(in millions of U.S. dollars)

25 Apart from the resource sector, the government’s strategy to attract FDI has been through the creation of industrial parks with special economic zone status. So far, two parks have been created near major ports—Viana near Luanda and Catumbela near Lobito. The government’s aim is to make Angola a major logistics hub servicing Zambia and Congo DRC once the Benguela railway line (a major transport route in southern Africa) is fully rehabilitated by Chinese companies.
Outside of the oil sector, there is evidence of Chinese FDI in the manufacturing (e.g., appliances, motorcycles, trucks) and telecommunications. For instance, ZTE, a major telecommunications firm, has invested considerably in local telephony (both fixed and mobile), and Zheng Zhou Nissan has invested about US$30 million to produce 30,000 pickups per year.
Apart from large public and private firms, there is also a very large number of Chinese small and medium firms that have invested in Angola. These firms are mainly in logistics and construction. There is also a very large number of private individuals involved in the services (tourism, trade, real estate and catering).
Liberia34
Liberia presents an interesting case of involvement by all four BRICs in the country’s mineral sector. Companies of BRIC origin are replacing US and European operators in Liberia as mining restarts after two decades of conflict. Given the announced headline numbers, the economic impact of planned FDI inflows are likely to be very large, especially for a post-conflict country.
The mining of iron ore in Liberia developed shortly after the Second World War. The largest producers were LAMCO, a Swedish-American-Liberian consortium and DELIMCO, a German Liberian Mining company. These companies opened mines in the 1960s, and produced iron ore until 1992, when they were overwhelmed by Liberia’s civil war.
Following the election of the Johnson-Sirleaf administration in 2005, concessions for the old mines went out to international competitive tender. The former LAMCO concession was won by the leading global steel giant ArcelorMittal (formed by the merger of the Indian company Mittal and European steel producer Arcelor) in 2008, which committed a US$1.5 billion investment including rehabilitation of a railway line and Liberia’s second port, with iron-ore production expected to start in 2011. The DELIMCO Bong mine concession was awarded in 2009 to China Union, which eventually combined with Wuhan Iron and Steel Company to start redevelopment of the mine and supporting infrastructure with an investment amounting to US$2.6 billion.
Negotiations on two additional iron ore projects are ongoing. These are with Severstal, a Russian company, for a reputed US$2 billion investment and with Vale do Rio Doce, the
34 We are grateful to Chris Lane for contributions to this section.

26 Brazilian producer, for trans-shipment of Guinean ore via a Liberian port and railway. An Israeli company is in negotiations for another large-scale mining concession.
With total financial commitments of US$6-7 billion spread over ten years, BRIC investors could overshadow total non-iron ore investment. Currently the latter are in the range of US$200-300 million per year. The additional FDI inflows would be quite significant, on the order of 30-40 percent of GDP per year, which should allow sustained GDP growth rates of 8-10 percent. The budgetary impact is likely to be significantly positive, beginning in the period 2015 onwards, based on the fiscal terms in the agreements of the two ratified mining agreements. Other companies interested in Liberian iron ore mining include Billiton (Australia) and Elinilto (Israel).
Sudan35 Apart from South Africa, Sudan has probably been the largest recipient of Chinese FDI in Africa. Given Sudan’s limited access to bilateral and multilateral financing, Chinese FDI has often been bundled with aid mainly project loans and credit lines. According to Suliman and Badawi (2009), Chinese FDI flows increased from nothing in 1996 to over US$800 million in 2007, making China the largest source of FDI by far.
A very large proportion of this FDI is in the oil sector, and has been undertaken by Chinese public companies. Most of these companies took over and significantly developed assets after Western companies left in the early 1990s. For instance, CNPC spent about US$700 million building its largest refinery outside of China in Sudan, and over 10,000 Chinese workers were involved in the building of a 1,500 km pipeline from the Heglig oilfield to Port Sudan on the Red Sea. Thus Chinese FDI has been critical in significantly expanding the role of oil sector in the economy, from 1 percent of GDP in 1999 to 18 percent in 2008—making Sudan the third biggest petroleum exporter in sub-Saharan Africa. By 2008 over 50 percent of government revenue came from this sector.
Most of the private companies (over 200) are engaged in oil-related services, especially construction, and also in import-substitution manufacturing (e.g., plastics).
Zambia36 Zambia has had long-standing relations with China since independence. The construction of the Tanzania-Zambia Railway (Tazara) in the 1970s was a high point in this relationship. However, for most of the 1980s and 1990s, there was very little Chinese FDI. The combination of China’s “going global” strategy, and Zambia’s privatization program, spurred Chinese FDI flows, particularly into the mining sector. At the same time, Zambia adopted quite liberal investment climate regulations with the establishment of the Zambia Development Agency, a one-stop shop for foreign investors. There is free repatriation of
35 This case study draws in part on Suliman and Badawi (2009). 36 This case study draws in part on Kragelund (2009) and Kamwanga and Koyi (2009).

27 profits, royalties, fees and wages, and no requirements for use of local content and local sub-contractors for inward FDI. Over the past decade, China became the third largest provider of FDI. Based on UNCTAD data (which is likely underestimated), Chinese FDI reached US$214 million (1½ percent of GDP) in 2008. Most of the FDI has been in the mining and related sectors, especially in copper and nickel production. For instance, China Non-Ferrous Company Africa invested US$150 million during 1998–03. One of the features of the government’s industrial development strategy is the development of industrial parks. In 2007 the government adopted legislation for Multi-Facility Economic Zones. These have special incentives such as duty-free importation of raw materials and capital goods for five years. Chinese investment has been at the core of the Zambian special economic zone strategy. For instance, the planned Chambishi multi-facility economic zone in the Copper Belt is expected to involve over 60 Chinese companies in a broad range of sub-sectors, anchored by a US$200 million copper smelter. Once finalized, Chinese companies would have a presence along the entire copper value chain. The total cost is expected to be over US$800 million, and the project would also cater to the nearby major mining regions of the Democratic Republic of Congo. Private Chinese companies are attracted to Zambia mainly because of its liberal investment climate, relatively limited domestic competition, and the ability to service other Chinese companies. As a result, there are a large number of registered private Chinese businesses (over 200). The largest private companies are in manufacturing (e.g., textiles), construction (e.g., Hainan), telecommunications (e.g., Huawei), and retail trade (e.g., Budget Stores). Recently, the Bank of China, a state-owned commercial bank, opened its first branch in Africa in Zambia. Finally, there are also a very large number of small operators in the trading and restaurant sectors.
V. THE IMPACT OF BRIC FDI
While they are difficult to quantify, the effects of BRIC FDI on local economies have been tangible. They include tapping under-exploited mineral resources, building up manufacturing capacity and helping foster regional integration. BRIC FDI has helped tap natural resources in many LICs. This is most evident in the rapid growth of oil and mining industries in Africa, partly made possible by BRIC investment, leading to sharp increases in production, exports, and processing capacity. In some cases such as Liberia, BRICs’ investment may also have strengthened the bargaining power of LICs, helping them to negotiate more favorable contracts with foreign firms. Additional revenues from these sources have strengthened countries’ balance of payments positions and given governments more fiscal space to undertake much needed investments in social and physical infrastructure. In some cases, e.g., Sudan, the direct growth payoff of BRIC FDI has been quite considerable. BRIC financing has helped increase manufacturing capacity in some LICs. This is clearly the case in countries such as Ghana where most Chinese FDI is involved in agro-processing and garment manufacturing. Even in resource-rich countries, there is now a greater emphasis on

28 increasing value added in both upstream and downstream industries (e.g., building refining capacity in Nigeria, and processing copper into electric wires in Zambia). FDI from BRICs can help foster regional integration. The need to have reliable transport networks to export products from various countries leads to better communications linkages. For instance, the rehabilitation of the Benguela railway line should facilitate trade among Angola, Democratic Republic of Congo (DRC) and Zambia, and exports from the mineral belt of DRC and Zambia; or the building of rail and port facilities in Liberia can facilitate the export of iron ore in both Liberia and Guinea. At the same time, it can potentially facilitate joint resource exploitation and use of the same industrial facilities and logistics networks, e.g., smelters, thereby increasing economies of scale and fostering positive network externalities. FDI from BRICs can enhance technology upgrading and employment in LIC. According to UNCTAD, in 2009 45 percent of international joint ventures in Africa are with firms from developing countries such as BRICs. Those partnerships should help transfer knowledge and skills to African firms. Employment by developing countries’ investors in Africa doubled during 2003-2005 (UNIDO 2007). However, at the same time, the entry of those firms creates fierce competition with African firms sometimes along with unemployment. 37
The entry of BRICs into LICs has injected a measure of competition among investors. Increasingly, LICs have more scope to be in the driver’s seat to extract the best possible benefits from FDI. The rapid industrial growth in BRICs should provide ample opportunities for LICs to attract efficiency-seeking and export-oriented FDI. Industrial parks are likely to become a new trend in the way Chinese companies invest in Africa. According to Gu (2009), by locating themselves in parks, firms gain mutual support and can more easily coordinate production. This in turn can reduce operating costs, even if the overall investment climate is not as favorable because by acting together firms can negotiate more favorable treatment from local authorities.
VI. CONCLUDING REMARKS
This paper has highlighted the importance of BRIC FDI in LICs’ development strategy. Among the key findings is that while BRIC FDI is relatively a small proportion of global FDI flows, in some LICs, it is the major source. While unreliable statistics make the assessment of its macroeconomic impact difficult, the available qualitative and other evidence demonstrates that the impact has been broadly positive, and thus BRIC FDI is emerging as a growth driver for LICs (including through other channels such as trade). Moreover, as BRIC FDI is often packaged with other development financing, the benefit for LICs goes beyond just FDI. The key challenge for LICs is to amplify the above positive effects of BRIC FDI by continuing to attract more inflows, ensuring that natural resource extraction contributes to strengthening domestic revenue mobilization, and fostering greater linkages of FDI with local
37 Broadman (2007).

29 economies., This challenge is not specific to BRIC FDI but is heightened by the prospect of attracting more FDI than in the past from a broader array of countries. Recipient countries can foster FDI by improving their business environment. The focus should be on improvements in areas that are critical for attracting FDI such as the availability of adequate and reliable infrastructure, rule of law, and reduction of red tape and corruption. At the same time, reducing high trade barriers is important, especially for FDI in search of intermediate inputs and regional exports. LICs should ensure that greater FDI, particularly in natural resources, translates into higher fiscal revenue, which can then be spent in priority areas. In the face of strong competition for FDI among recipient countries, LIC policymakers should carefully evaluate the benefits of policy incentives against the cost to ensure that public resources are used for the highest priorities. Regional policy coordination could help countries limit incentive competition. Deeper regional integration could also make small LIC economies more attractive to FDI, notably by having regional projects especially in the power and transport sectors.38 Moreover, policies aimed at attracting FDI should avoid discriminating against domestic firms. BRICs and LICs can cooperate more closely in promoting local employment and industrial linkages. While an important goal of attracting FDI is to increase local employment and strengthen local productive capacity, excessive local employment and input requirements could deter FDI inflows and undermine the efficiency of foreign-invested firms. To avoid such an outcome, investors could be encouraged to hire and train more local workers while, at the same time, recipient countries could aim to facilitate firms’ access to necessary skills, including by upgrading education programs and rationalizing labor market regulations. Similarly, linkages to local firms could be facilitated by encouraging joint ventures, improving internal transport systems, and ensuring equal access to industrial clustering by local firms (Broadman, 2006). The emergence of BRICs as a major force in LIC FDI should not distract them from hard-won improvements in governance and transparency. While FDI flows afford countries much needed revenues, all must be done to avoid weakening of governance and transparency. First, LICs need to drive a hard bargain to ensure that they maximize the benefits from FDI. This means increasingly putting in place measures that enable open and competitive bidding for the exploitation of natural resources, e.g., as Liberia. Second, there is need to increase transparency particularly of the so-called “Angola mode” of financing—not least through the publication of comprehensive, meaningful and timely statistics—both by the BRICs and recipient countries.
38 For instance, the West Africa Power Pool, which is working on a regional approach to power projects, could benefit from better coordination in order to reduce the region’s very high unit power costs.

30
REFERENCES
ACET, 2009, “Looking East: A Guide to Engaging China for Africa’s Policymakers African Center for Economic Transformation,” Vol. 2, November.
Ademola, O. T., A. S. Bankole, and A. O. Adewuyi, 2009, “China–Africa Trade Relations: Insights from AERC Scoping Studies,” European Journal of Development Research, Vol. 21, No. 4, pp. 485–505.
Baah, A.Y., and H. Jauch (eds.), 2009, Chinese Investments in Africa: A Labour Perspective, African Labour Research Network.
Basu, Anupam, and Krishna Srinivasan. 2002, “Foreign Direct Investment in Africa—Some Case Studies,” IMF Working Paper 02/61 (Washington: International Monetary Fund).
Broadman, Harry, 2006, “Africa’s Silk Road—China and India’s New Economic Frontier,” (Washington: The World Bank).
Calderón, César, 2009, “Infrastructure and Growth in Africa,” Africa Infrastructure Country Diagnostic, Working Paper No.3 (Washington: The World Bank).
Center for Chinese Studies, 2008, “How China Delivers Development Assistance to Africa,” University of Stellenbosch, South Africa.
Center for Chinese Studies, 2010, “Evaluating China’s FOCAC Commitments to Africa and Mapping the Way Ahead,” University of Stellenbosch, South Africa.
Center for Chinese Studies, “China Monitor,” various issues, University of Stellenbosch, South Africa.
Dabla-Norris, Era, Jiro Honda, Amina Lahreche, and Geneviève Verdier, 2010, “FDI Flows to Low-Income Countries: Global Drivers and Growth Implications,” IMF Working Paper 10/132 (Washington: International Monetary Fund).
Darby, Julia, Rodolphe Desbordes, and Ian Wooton, 2009, “Does Public Governance Always Matter? How Experience of Poor Institutional Quality Influences FDI to the South,” Discussion Paper Series No. 7533, CEPR.
Davies, Martyn, Hannah Edinger, Nastasya Tay, and Sanusha Naidu, 2008, “How China Delivers Development Assistance to Africa,” Centre for Chinese Studies, University of Stallenbosch.
Doemeland, Doerte, Cecilia Briceno-Garmendia, Abdikarim Farah and Johannes Herderschee, 2010, “Mining Concessions-for-Infrastructure: Chinese investment in the Democratic Republic of Congo (DRC),” unpublished, (Washington: The World Bank).
Foster, Vivien, William Butterfield, Chuan Chen, and Nataliya Puchak, 2009, “Building Bridges: China’s Growing Role as Infrastructure Financier for Sub-Sahara Africa,” Trend and Policy Options No. 5 (Washington: The World Bank).
Gu, Jing, 2009, “China’s Private Enterprises in Africa and the Implications for African Development,” European Journal of Development Research, Vol. 21, No. 4, pp. 570-87.

31 IMF, 2011, “New Growth Drivers for Low-Income Countries: The Role of BRICs,”
(Washington: International Monetary Fund).
Kamwanga, Jolly, and Grayson Koyi, 2009, “Impact of China—Africa Investment Relations: the Case of Zambia,” African Economic Research Consortium.
Kaplinsky, Raphael, and Mike Morris, 2009, “Chinese FDI in Sub-Saharan Africa: Engaging with Large Dragons,” European Journal of Development Research, Vol. 21, No. 4, pp. 551-59.
Kiala, Carina, and Lucy Corkin, 2009, “The Impact of China Investment Relations: The Case of Angola,” African Economic Research Consortium.
Kiggundu, N. Moses, 2008, “A Profile of China’s Outward Foreign Direct Investment to Africa,” Proceedings of the ASBBS (American Society of Business and Behavioral Sciences), Vol. 15, No.1, pp. 130-44.
Kragelund, Peter, 2009, “Part of the Disease or Part of the Cure? Chinese Investments in the Zambian Mining and Construction Sectors,” European Journal of Development Research, Vol. 21, No. 4, pp. 644-61.
Giles Mohan and May Tan-Mullins, 2009, “Chinese Migrants in Africa as New Agents of Development? An Analytical Framework,” European Journal of Development Research, Vol. 21, pp. 588–605.
Moran, Theodore, Edward Graham, and Magnus Blomstrom, eds., 2005, Does Foreign Direct Investment Promote Development? (Washington: Institute for International Economics).
Pateym, L.A., 2007, “State Rulers: Oil Companies and Armed Conflict in Sudan,” Third World Quarterly, Vol. 28, No.5.
Suliman, Kabbashi M., and Ahmed Badawi, 2009, “An Assessment of the Impact of China’s Investment in Sudan,” African Economic Research Consortium.
Standard Bank, “Economics BRIC and Africa,” 2010, August 4.
UNCTAD, 2008, 2009 and 2010), “World Investment Report,” (Geneva: United Nations Conference on Trade and Development).
UNDP/UNCTAD, 2007, Asian Foreign Direct Investment in Africa (New York and Geneva: United Nations).
UNIDO, 2007, Africa Foreign Investor Survey 2005 (Vienna: UNIDO).
Yao, Yang, and Ying He, 2005, “Chinese Outward Investing Firms, A Study for FIAS/IFS/MIGA,” Working Paper, Foreign Investment Advisory Service (Washington: The World Bank).
Zafar, Ali, 2007, “The Growing Relationship Between China and sub-Saharan Africa: Macroeconomic, Trade, Investment, and Aid Links,” The World Bank Research Observer, Vol. 22, pp. 103-30.