fdi role in development-web - cuts internationalcuts-international.org/sr-4.pdf · rakesh basant,...
TRANSCRIPT

#0411
�����������
� �������������������� �����������������
��������������������� �������������
!� �����������"������������#��$��
CUTS – C-C I E R

������������� �������������������� ��������������������
������������������ ��������������!� ����������
"������������#��$��
CUTS – C-CIER

������������� ������������������ �� ������������������ ��������������������� ������� ������� !� ��
��������"������������#��$��
Published by:
CUTS Centre for Competition, Investment & Economic RegulationD-217, Bhaskar Marg, Bani Park, Jaipur 302 016, IndiaPh: +91-141-220 7482, Fax: +91-141-220 7486Email: [email protected], Website: www.cuts-international.org
Acknowledgement:This report* is being published as a part of the Investment for Development Project,with the aim to create awareness and build capacity on investment regimes andinternational investment issues in seven developing and transition economies:Bangladesh, Brazil, Hungary, India, South Africa, Tanzania and Zambia. It issupported by:
Copyright: CUTS, 2004The material in this publication may be reproduced in whole or in part and in any formfor education or non-profit uses, without special permission from the copyrightholders, provided acknowledgment of the source is made. The publishers wouldappreciate receiving a copy of any publication, which uses this publication as asource. No use of this publication may be made for resale or other commercialpurposes without prior written permission of CUTS.
Citation:CUTS, 2004, FDI's Role in Development – Analysis of Investment Policy Regimes inBangladesh, Brazil, Hungary, India, South Africa, Tanzania and Zambia
Printed by: Jaipur Printers P. Ltd., Jaipur 302 001
ISBN 81-8257-029-8
*Country reports are also available with CUTS
#0411 SUGGESTED CONTRIBUTION INR75/US$15
DFIDDepartment forInternationalDevelopment, UK UNCTAD

Budapest University of Economic Sciences and PublicAdministrationHungary
Nucleo de Economia Industrial e da Technologia-NEITInstituto de EconomiaUniversity of CampinasBrazil
Institute for Global DialogueSouth Africa
Economic and Social Research FoundationTanzania
������� ������� ������
CUTS Africa Resource CentreZambia
National Council of Applied Economic ResearchIndia
NEIT-IE
B E I
Bangladesh Enterprise InstituteBangladesh
�������%����������

Acknowledgements
During the implementation of this project, significant contributions were madeby country researchers, partner organisations, members of the Project Advi-sory Committee, CUTS staff and many outside experts. It is difficult to list themall but some need special mention.
PROJECT ADVISORY COMMITTEE
Arvind Mayaram, Government of Rajasthan, JaipurDiana Tussie, FLASCO, Buenos AiresFarooq Sobhan, BEI, DhakaJohn Gara, Commercial Justice Reforms Programme, KampalaKarl Sauvant, UNCTAD, GenevaM. Sornarajah, National University of SingaporeMohan Kaul, CBC, LondonRichard Eglin, WTO, GenevaRoger Nellist, DFID, LondonSanjaya Lall, Oxford University, OxfordSabina Voogd/Myriam Vander Stichle, SOMO, Amsterdam
BangladeshAtiqur Rahman
BrazilGustavo Rocha BrittoMariano Laplane
HungaryMiklos Szanyi
IndiaSanjib PohitShalini SubramanyamSoumya SrinivasanSuman Bery
South AfricaBrendan VickersGarth Le Pere
TanzaniaFlora KessyFlora MusondaHKR AmaniLorah MadeteRose AikoSamuel Wangwe
ZambiaK.S. SajeevStephen MuyakwaGideon MudendaFrywell Chirwa
PARTNERS’ STAFF AND RESEARCHERS

OTHER EXPERTS
Ananya Raihan, CPD, Dhaka
Andres Lopez, CENIT, Buenos Aires
Aradhana Agarwal, ICRIER, New Delhi
Atiur Rahman, BIDS, Dhaka
Biswatosh Saha, XLRI, Tatanagar
Christian Rogg, DFID, London
David On'golo, Spellman & Walker Co.Ltd, Nairobi
Freddy Bob-Jones, DFID, London
James Zhan, UNCTAD, Geneva
John Dunning, University of Reading, UK
Joerg Weber, UNCTAD, Geneva
Juma Mwasacha, Tanzania Ambassador to France
Kalman Kalotay, UNCTAD, Geneva
Khalil Hamdani, UNCTAD, Geneva
Laveesh Bhandari, Indicus Analytics, New Delhi
Oliver Saasa, University of Zambia, Lusaka
Peter Muchlinski, Kent Law School, Kent
Rakesh Basant, IIM, Ahmedabad
Sebastian Morris, IIM, Ahmedabad
Trudi Hartzen Berg, TRALAC, Stellenbosch
Vicky Harris, DFID, London
CUTS STAFFEric Kalimukawa
James Chansa
Hilda Fridh
Manleen Dugal
Nitya Nanda
Olivia Jensen
Pranav Kumar
Pradeep S. Mehta
Rajeev Mathur
Sanchita Chatterjee
CONTENTS
Preface ....................................................................................................... iIntroduction ............................................................................................. iii
PART - I1 What Affects FDI ............................................................................ 19
1.1 The Three Broad Motives of InternationalEconomic Interaction ............................................................... 19
1.2 The Ownership-Location-Internalisation (OLI) Framework ..... 211.3 Cross-country Comparisons of FDI Inflows:
the Role of Structural and Policy Variables .............................. 231.4 Structure of Economies and Investment Policies ..................... 25
2 Quantum, Patterns and Contributionof FDI in Project Countries ............................................................ 292.1 Trends in FDI ........................................................................... 292.2 Role of FDI in Project countries ............................................... 312.2.1 FDI and Privatisation Initiatives ......................................... 312.2.2 FDI, Cross-Border Mergers & Acquisitions and Greenfield Investments .......................................................... 322.2.3 FDI, Domestic Capital Formation, Gross Domestic Product and Exports ............................................................. 342.2.4 FDI and Balance of Payments .............................................. 36
3 The Civil Society Survey ................................................................ 383.1 Why civil society: a discussion ............................................... 383.2 Comparison of the Results of the Civil Society Survey ........... 39
4 Findings of Case Studies ................................................................ 454.1 Enabling Environment ............................................................. 454.2 Technology Transfer ............................................................... 474.3 Job Creation and Job Loss ....................................................... 484.4 Growth of Local Industries ...................................................... 50
5 An Assessment of FDI Flows .......................................................... 525.1 Bangladesh could Attract more FDI ........................................ 525.2 History, Macroeconomic Policies, Regional Markets and
Privatisation Drive FDI in Brazil ............................................... 535.3 Hungary is Using FDI to Re-integrate, Privatise and
Cater to Regional Markets ....................................................... 54
5.4 Growth-oriented Policies and RegulatoryClarity are Critical for India ...................................................... 55
5.5 Growth-oriented Macro-policies are Needed in South Africa .. 555.6 The Tanzania Case Requires Further Exploration .................... 565.7 Zambia Exemplifies a Case of Governance Failure ................... 56
6 Conclusion and Policy Recommendations ..................................... 586.1 Role of Policy Liberalisation in Attracting FDI ........................ 586.2 Policy Recommendations ......................................................... 61
PART-II7. Global and Regional FDI Flows and Performance .......................... 67
7.1 Global Trends in FDI Flows ..................................................... 677.2 Regional Trends in FDI Flows.................................................. 687.3 Trends in LEMs and LDCs ....................................................... 707.4 Sectoral FDI Trends ................................................................. 71
8. International Developments in Policy and Regulatory Changes .... 748.1 Policy and Regulatory Changes ............................................... 748.2 Reasons for Changes ............................................................... 768.3 Competition for FDI Among Countries .................................... 788.4 International Trends ................................................................. 79
9. Overview of National Experiences ................................................... 839.1 Trends in FDI ........................................................................... 839.2 Changes in Policies Related to FDI .......................................... 859.3 Effectiveness of Policies and Related Problems ....................... 909.4 Performance of Countries Facilitating Inward FDI ................... 939.5 FDI and National Development Strategies ............................... 959.6 The Varying Impact of FDI ....................................................... 97
10. Conclusions & Way Ahead ........................................................... 104
Annexure-1 ............................................................................................ 106
Annexure-2 ............................................................................................ 109
Endnotes ............................................................................................... 111
Bibliography .......................................................................................... 112

List of TablesTable 3.1: Positive Aspects of FDI – Percentage of Civil Society
Respondents in Agreement ................................................... 40
Table 3.2: Negative Aspects of FDI – Percentage of Civil SocietyRespondents in Agreement ................................................... 41
Table 3.3: Measures to Increase the Benefits of FDI – Percentageof Civil Society Respondents in Agreement ........................ 42
Table 3.4: Restrictive Measures on Foreign Investors – Percentageof Civil Society Respondents in Agreement ......................... 43
Table 4.1: FDI and Government Policy Instruments .............................. 46
Table 7.1: FDI in LDCs and other Developing Countries ...................... 71
Table 8.1: Changes in National Regulations of FDI, 1991-2002 ............. 74
Table 9.1: Macro Characteristics of the Project Countries ..................... 83
Table 9.2: FDI Inflows in the Project Countries (US$mn) ...................... 84
Table 9.3: FDI Outflows in the Project Countries (US$mn) .................... 84
Table 9.4: Landmarks in Policy Changes in 1990s:The IFD Project Countries ..................................................... 86
Table 9.5: Changes in Investment Policies/New Investment Acts:IFD Project Countries ............................................................ 88
List of Boxes
Box 1.1: Type of FDI Classified by Motives of TransnationalCorporations and Principal Economic
Determinants in Host Countries ........................................ 19
Box 1.2: Potential Benefits of FDI ................................................... 21
Box 1.3: Imperfections in the International Capital Markets:
Another Form of Localisation? .......................................... 23
Box 9.1 Low Fructification of FDI in India ..................................... 91

List of ChartsChart 1.1: A Summary ..................................................................................... 26
Chart 1.2: A Summary ..................................................................................... 27
Chart 2.1 FDI Inflows in US$mn .......................................................... 29
Chart 2.2 Inward Stock of FDI in US$mn ............................................. 29
Chart 2.3: Yearly Variation in Inward FDI ............................................. 30
Chart 2.4: Cross Border M&A Activity, 2000 ....................................... 33
Chart 2.5: Share of World FDI to Share of GDPand Share of Exports, 1998-2000 ........................................... 35
Chart 2.6: Share of World FDI to Share of GDPand Share of Employment, 1998-2000 ................................... 36
Chart 7.1: FDI Inflows 1991-2002 .......................................................... 67
Chart 7.2: FDI Inflows to Host Regions ............................................... 69

LIST OF ABBREVIATIONS
ASCM Agreement on Subsidies and Countervailing MeasuresBEE Black Economic EmpowermentBITs Bilateral Investment TreatiesBOI Board of InvestmentBOP Balance of PaymentsCEE Central & Eastern EuropeCMM Capability Maturity ModelCOSATU Congress of South African Trade UnionCS Civil SocietyCSO Civil Society OrganisationCSR Corporate Social ResponsibilityCUTS Consumer Unity & Trust SocietyDFID Department for International DevelopmentEPZs Export Promotion ZonesEU European UnionFDI Foreign Direct InvestmentFIPB Foreign Investment Promotion BoardFTZ Free Trade ZoneGATS General Agreement on Trade in ServicesGDP Gross Domestic ProductGEAR Growth, Employment and RedistributionICT Information Communication TechnologyIFD Investment for DevelopmentIGOs Inter-governmental OrganisationsIIAs International Investment AgreementsIMF International Monetary FundIPAs Investment Promotion AgenciesIPO Initial Public OfferingIT Information TechnologyLDCs Least Developed CountriesLEMs Large Emerging MarketsM&As Mergers and AcquisitionsMERP Micro Economic Reform ProgrammeMIDP Motor Industry Development ProgrammeMNC Multinational CorporationMTEF Medium Term Expenditure FrameworkMTSF Medium Term Strategic FrameworkNAACAM National Association of Automotive Component and Allied
Manufacturers

NAFTA North American Free Trade AgreementNDC National Development CorporationNEP New Economic PolicyNGOs Non governmental OrganisationsNRG National Reference GroupODA Official Development AssistanceOECD Organisation for Economic Co-operation and DevelopmentOLI Ownership-Location-InternalisationPRSP Poverty Reduction Strategy PaperR & D Research and DevelopmentRMGs Ready-made GarmentsSADC Southern African Development CommunitySAPs Structural Adjustment ProgrammeSEI Software Engineering InstituteSoEs State-owned EnterprisesTNCs Transnational CorporationsTRIMs Trade Related Investment MeasuresTRIPs Trade Related Intellectual Property RightsUNCTAD United Nations Conference on Trade and DevelopmentWB World BankWIR World Investment ReportWTO World Trade OrganisationZFM Manus Free Zone

Preface
In the last two decades, facilitating inward foreign direct investment (FDI) hasbeen high on the agenda of policy changes in many developing and transitioneconomies. Many developing countries have adopted policies to attract moreforeign direct investment. Policymakers expect that FDI inflows would bringnew technologies, know-how and thus would contribute to higher productivityand competitiveness of domestic industries, which in turn would fostereconomic growth and development.
More and more developing countries have been signing bilateral investmenttreaties, avoidance of double taxation treaties and regional trade agreements tocreate a facilitative regime for FDI.
Simultaneously, FDI flows have multiplied and official development assistanceflows reduced around the world. In fact, some of the countries try to attract FDIby offering generous incentive packages. They justify the incentives by sayingthat foreign affiliates generate externalities though various studies haveconcluded that incentives are not quite effective in facilitating FDI.
Despite the fact that FDI now occupies an important place in national economicpolicies, there is no conclusive evidence to show that FDI has brought inknow-how and increased competitiveness of domestic industries in developingcountries. The empirical results show that there are productivity spilloversfrom FDI through foreign affiliate-local supplier linkages in upstream activities.However, there are no indications of spillovers occurring within the sameindustry. In other words spillovers from FDI are more likely to be vertical ratherthan horizontal in nature.
Against this background, CUTS conducted a seven-country, two-year projectentitled “Investment for Development” with the support of DFID, UK and incollaboration with the UNCTAD in September 2001. The aim of the project wasto study investment policies, performance and perceptions in seven developingand transition economies. It also aimed at creating awareness and buildingcapacity of the civil society on national investment regimes and internationalinvestment issues. The seven countries in the project were – Bangladesh,Brazil, Hungary, India, South Africa, Tanzania and Zambia.
������������� ����������

This report is in two parts and presents two of the publications under theproject. Part I, which is the synthesis report of the project, brings out commonand country specific findings, from case studies on each of the seven countries.In each country, three sectors that were or could be important for facilitatingand maximising benefits from FDI have been selected. It also highlights theglobal and regional trends and policies in the project countries and in FDI, andthe effectiveness of national policies. It also includes the results of a survey oncivil society perceptions of FDI carried out under the project.
Part II presents the CUTS advocacy policy document prepared as a part of theproject. It highlights the global and regional trends and policies in the projectcountries and in FDI, and the effectiveness of national policies. On the basis ofthe findings on these topics, the paper puts forward some recommendationsand action points for policy changes to governments, civil society and inter-governmental organisations.
May, 2004 Pradeep S. MehtaJaipur Secretary General
������������������ �����

Introduction
Foreign Direct Investment (FDI) essentially deals with the expansion ofproductive entities (firms) across international boundaries. As firms expand,they bring with them many tangibles and intangibles – capital, machinery,technology, managerial talent, brands, products and processes being some ofthe most important ones. Other intangibles, such as cultural aspects, are alsoconsidered to be intimately tied with FDI by many scholars. As firms bring inall the benefits, they also cause the host economies to incur some costs, themost important being the repatriation of surplus of profits.
.The picture painted by the literature on FDI is far from clear in terms of the‘net’ benefits. The trading firms of the colonial days, the exploitation of naturalresources, the meddling in the political environment of host countries, etc.,have been documented by historical evidence. Modern economic history has,however, shown in many different ways the advantages that foreign directinvestment brings with it, e.g., the experience of the South East Asian countrieswith FDI.
Given the contradictory findings, the question that arises is “What is civilsociety’s view on FDI?” Civil society’s views are important also because theyplay an important role in shaping the long-term orientation of the commonpeople. These, in turn, affect the shape and structure of a country’s policytowards FDI.
These papers have been prepared under the “Investment for Development”project, which is a two-year, seven-country project implemented by ConsumerUnity & Trust Society, Jaipur, India, with the support of the Department forInternational Development (DFID), UK, and in collaboration with the UnitedNations Conference on Trade and Development (UNCTAD).
The countries in the project were chosen so as to highlight a variety ofexperiences. Diversity in economic characteristics, geographical spread, andthe size of the economy were some of the key factors. In addition, CUTS’networking strength also contributed to the choice. There are, therefore, threegroups of countries: Large Emerging Markets (LEMs) - India, South Africa andBrazil, Least Developed Countries (LDCs) - Zambia, Tanzania and Bangladeshand a transition economy, Hungary. Though Hungary has a much higher percapita income than the other project countries, its study throws up usefulinsights on the characteristics of FDI, not only in transition economies, butalso the development process, in general.
������������� �����������

The salient features of the IFD project are:� It is a comparative study of seven developing countries;� The project involved CS organisations from the project countries in the
implementation of the project in these countries;� It conducted a CS perceptions’ survey. CS, for the purpose of the survey,
was defined as representatives of non-governmental organisations,academia, trade unions, chambers of commerce and media;
� The IFD project has attempted to promote a dialogue between thegovernment and CS, in each project country; and
� The project throws up learning for other developing countries, those withthe same characteristics as the project countries, as well as those which areat different stages of development.
The important questions that are dealt with in Part I of this monograph are:How have experiences of the countries been? How have specific industries/sectors been affected by FDI? Have these experiences been positive? Havethere been gains for specific sectors? This paper synthesises these issuesbased on the papers on the seven above-mentioned project countries.
Broadly, the paper seeks to explore three interrelated questions:1. How are countries trying to increase FDI?2. What have been the actions adopted by countries and how have they
fared?3. What has the general impact of FDI been?
Part II of this paper has been prepared on the basis of country papers andnational advocacy policy documents, and inputs from the NRG meetings andthe regional seminars held under the IFD project. It contains key results of theresearch and analysis, and recommendations and action points. It containsrecommendations for national, regional and international level policy changesto attract beneficial investment.
The purpose of part II is to highlight international, regional and nationalinvestment trends and policies using the IFD research as well as secondarysources of information. In the light of these policies, the paper attempts to putforward action points for three stakeholders – governments, CS and inter-governmental organisations (IGOs) – for changes in policies and practicesrelated to FDI.
������������������ �����

PART-I

������������� �����������
FDI can, essentially, be seen as the expansion of firms across borders. A firmwould only expand from its base (home country) if it expects to generate highenough surpluses for it to justify investing across large distances. If a firmgenerates enough surpluses from any other means (such as exports) then itneed not invest. In other words, FDI only occurs when there is no other meansof international economic interaction that can be expected to generate highersurpluses.
This section first identifies the three broad motives that justify any type ofinternational economic interaction. If only at least one of these three motives ismet, FDI is a possibility. However, for FDI to fructify, other factors, internal andexternal, also have to be present for the firm. These factors can best be puttogether by the Ownership-Location-Internalisation (OLI) framework, which isdiscussed in subsection 1.1.
1.1 The Three Broad Motives of International EconomicInteractionBroadly, three types of motives have been identified: (a) market-seeking; (b)resource/asset-seeking; and (c) efficiency-seeking. These are briefly discussedbelow.
CHAPTER-1
What Affects FDI1
Box 1.1: Type of FDI Classified by Motives of TransnationalCorporations and Principal Economic Determinants in Host Countries
A. Market-seekingDepends upon:� Market size and per capita income� Market growth� Access to regional and global markets� Country-specific consumer preferences (e.g., importance of/exposure to
foreign brands)� Structure of markets (presence of competition, or incumbent monopolies)

������������������ �����
The importance of different location specific determinants varies according tomotives Box 1.1. Market-seeking investors are likely to be attracted by potentialsales in host country markets. Consequently, markets that are large, growingand that can be used to access regional markets will be most attractive.
If resource/asset-seeking is the prime motive, availability and cost of accessingraw materials, other specialised assets, skilled and unskilled labour would becritical for making investment profitable.
Firms may also invest in a country to benefit from efficiencies arising fromexternalities (efficiency seeking). Here, the efficiency of resource use is critical.Costs of labour, infrastructure, etc., will be the key variables here. Externalities/spillover benefits could be derived through regional economic arrangements(including clusters) that give rise to economies of scale and scope.
These potential benefits are two-sided. As long as there is no existence ofmonopolies, host countries and their residents gain as well. This is presentedin Box 1.2.
B. Resource/Asset seekingDepends upon:� Raw materials� Low-cost unskilled labour� Skilled labour� Technological, innovatory and other created assets (e.g., brands)� Physical infrastructure (presence of ports, roads, power,
telecommunication)
C. Efficiency-seekingDepends upon:� Cost of resources and assets� Other input costs, e.g., transport and communication cost to/from and
within the host economy and costs of other intermediate products� Membership of a regional integration agreement conductive to the
establishment of regional corporate networks
Source: Adapted from UNCTAD (1998), p 91.

������������� �����������
However, even if a country possesses the resources and the market or efficiencyadvantages, it does not imply that FDI will actually occur. Take, for instance,the case of a country that has a very good market for Black Cola. It does notimply that a transnational corporation (TNC) will invest in that country. Itcould have a long-term contract with a domestic producer who could bemanufacturing it under licence. Alternatively, it could simply export Black Colato the country. Similarly, take the case where a country has a very good humanresource-base to produce software. That does not necessarily imply that aTNC will have a resource-seeking investment in that country. It could merelycontract out the software development to a firm from the host country andpurchase the final software.
OLI discusses the conditions under which foreign investment takes place.
1.2 The Ownership-Location-Internalisation (OLI) FrameworkFDI comes under many different forms. Joint ventures, subsidiaries andbranches are some of the most well-known forms. According to the OLIframework, the presence of ownership-specific competitive advantages in a
Box 1.2: Potential Benefits of FDI
Benefits to Host Country Areas of Caution
Investment, employment, technology and skill improvement occur in allcases. Of these, technology and skill improvements also spread throughoutthe economy over a period of time.
A. Market-seeking
� Training and skill enhancement� Employment opportunities� Greater range of products� Lower prices of products
B. Resource/asset seeking� Training and skill enhancement� Employment opportunities� Reduces waste of human and
physical resources
C. Efficiency-seeking� Utilisation of inherent strengths
of host country� Overall productivity gains
� Exploitative, if monopoly inessential items
� Gains are maximum when competi-tion exists in product markets
� Can be exploitative if monopoly infactor markets
� Long term contracts combinedwith monopoly
� Policies and incentives such assubsidies tend to neutralise thegains to the economy

������������������ �����
firm, location-specific advantages of host economies and superiority of intra-firm transactions (internalisation) over arm’s length transactions results inFDI.� Ownership-specific Advantage – The firms that have acquired some firm-
specific capability sometimes find that they must operate through a foreignsubsidiary, in order to fully exploit that competence. For example, advantagesbased on proprietary technology or brand names may compensate foradditional costs of establishing production facilities in a foreign economy.In fact, they can overcome the “foreign” firm’s disadvantages vis-à-vislocal firms arising out of “distance costs and the relative lack of familiarity”.
� Location-specific Advantage – The firms establish a subsidiary in a foreigncountry to take advantage of a large market, lower cost structure or a superiorinfrastructure of that country.
� Internalisation Advantage – The firms find greater benefits in exploitingboth ownership and location advantages by internalisation, rather thanarm’s length transactions. Such advantages may arise due to imperfectionsin the market for assets and inputs, especially those relating to technologyand management. These imperfections may not only involve significanttransaction costs but may also reduce the suitability of the ownershipadvantages (e.g., patents, etc.) that the firm may have. Such imperfectionsare likely to be more significant in earlier phases of the product/technology/industry life cycle.
It can be seen that the first and third conditions are firm-specific determinantsof FDI and essentially influence the probability and extent of investing abroad.The second set of conditions is location-specific and has an influence on thelocation of FDI. It is the location-specific conditions that the host countrygovernments can possibly influence in order to attract FDI.2 Consequently,various policy instruments can be used to enhance the location-specificadvantages of the host countries.

������������� �����������
The key advantage of the OLI framework is that it broadly identifies all thefactors that matter. In that sense, this is also a serious disadvantage. Moreover,this framework does not reveal which factors matter more.
As a consequence, policy makers cannot gain much from studying the OLI.Since the possible policies and actions are boundless, we need to focus on afew things that matter the most. The importance of this project should be seenin this light. By focussing on a range of developing countries spread over fourcontinents, with different economies and levels of development, it seeks toempirically determine which factors matter and which ones more.
1.3 Cross-country Comparisons of FDI Inflows: the Role ofStructural and Policy VariablesWhile all the project countries can be characterised as developing, except forHungary, which is a transition economy, they are disparate in terms of population
Box 1.3: Imperfections in the International Capital Markets –
Another Form of Localisation?
It has been argued that the pattern of FDI is determined by exchange risksand the market preferences for holding assets denominated in selectedcurrencies. Ceteris paribus, capital can flow from countries with low interestrates to those where foreign-exchange-risk-adjusted interest rates are high.Thus, when due to interest rate differentials, returns on foreign investment(corrected for expected foreign exchange depreciation) are higher than thaton domestic investment, enterprises invest abroad. Exchange ratefluctuations can also influence FDI inflows. The basic idea is thatdepreciation of the host country currency will give foreign enterprises theability to outbid domestic firms because of the increased value of theircapital. This may lead to inflows in various forms: expansion of productionoperations, entry into new foreign markets, reinvestment of earnings orconsolidation of market power through mergers and acquisitions (M&As)activity, etc. On the other hand, exchange rate volatility may impede FDI, asit increases uncertainty regarding the returns to investment. Some empiricalevidence suggests that, as compared to exchange rate levels, volatility ofexchange rate is a more important concern for FDI inflows, though notuniformly across all countries (UNCTAD, 1993).
This explanation is highly dependent upon the relative differences in theexchange rates and volatilities between home and host countries. Arguably,these determinants, therefore, be subsumed under the OLI framework.

����������������� �����
size, per capita income, levels of economic development, their political economyand their policies towards FDI. Therefore, before we can answer the question“How successful have these countries been in attracting FDI?”, we need aprior structure wherein to study the determinants of FDI that are empiricallygrounded.
We know that broadly FDI seeks markets, resources and/or efficiency, andwhen other conditions are present, these occur in different forms. One possibleway of studying it is to differentiate between structural and policy factors.Structural factors are considered here to be those that are inherent to the hosteconomy/country and are not affected directly by policy. Policy-related factors,on the other hand, are those that can be altered or changed by policy.
Structural factors capture market size and growth (market-seeking), naturalresource endowment (resource-seeking) and efficiency of production(efficiency-seeking), etc. It is difficult to get information on well-defined variablesthat directly capture these factors. However, it is possible to derive goodproxies for the same. National income, its growth and per capita incomes areused to arrest the size of the market and its growth. Since a direct measure ofnatural resource endowment is not available, reliance on imported manufacturedproducts is used as an indirect measure for resource seeking possibilities.3
Three factors (pointed out below) account for a very large part of FDI acrossthe world:� market size (as a variable capturing market seeking potential);� growth of the market (once again apprehends market seeking possibilities);
and� natural resource endowment (a variable to capture the resource-seeking
potential).Thus, market-seeking possibilities arising from a large economy and the naturalendowment-based resource-seeking turn out to be key structural determinantsof inward FDI. The remaining unexplained variation is, to a large extent, due topolicy differences and other qualitative differences across countries.
The role of these structural factors can be even more prominent in specificcountries. For example, areas that serve regional markets can be more attractivefor “market-seeking” FDI than what can be predicted on the basis of the marketsize of that country alone. Note that a large part of the variation in FDI isexplained by the structural factors. This is evidence enough that FDI is primarilya function of the nature of the economy. This insight cannot be over-emphasised.

������������� ����������
The analysis outlined above can also be used to predict the quantum of FDIinflows that can be expected in the project countries, given their market size,growth and natural endowments, as defined above. These reflect the structuralpotential of the economy to attract FDI. Good and bad policy can have apositive or negative impact on this inherent potential. In a subsequent section,we will analyse the observed flows of FDI in the light of these structuralfactors. This will help in the assessment of the relationship between the potentialand actual inflows of FDI, and how policy initiatives can impinge on thisrelationship. However, before we can do that, we need to have a betterunderstanding of FDI in the selected countries, and also their economic andsocio-economic conditions.
1.4 Structure of Economies and Investment Policies
This section analyses a range of issues, related to FDI determinants andpolicies for each of the project countries. To do so, first, the key motives for aninternational economic interaction and FDI, in particular market, resource andefficiency objectives must be revisited. The various conditions highlighted inthis section all tie into these three motives.
Chart 1.1 compares how each of the seven countries studied performs withrespect to the individual determinants. A higher ranking implies that the countryhas a relatively strong performance in that respect and vice versa. For instance,in the market size criteria, Brazil, Hungary, South Africa and India performstronger than Bangladesh, which, in turn, performs stronger than Tanzania andZambia.

������������������ �����
Overall, we find that Hungary has the most ‘attractive’ conditions for thevarious FDI motives, followed by South Africa, India and Brazil. Moreimportantly, we find that conditions in Zambia are the weakest, in terms of therange of motives for which FDI may occur. However, it does score the highestin terms of the natural resources for the size of its economy.
Chart 1.1: A SummaryA. Market-seeking
Variables Bang- Brazil Hungry India South Tanz- Zambialadesh Africa ania
Market size Market growth
Regionalmarkets
B. Resource/Asset-seeking
Raw materials
Low costunskilled labour
Skilled labour
Specificknowledgeassets
Infra-structure
C. Efficiency-seeking
Costs ofresources
Index: 1. Highly Favourable 2. Favourable 3. Less Favourable4. Negative 5. More Negative 6. Info Not Available
2 1 1 1 1 3 3
2 1 1 1 1 3 3
1 2 1 3 1 3 3
3 3 3 3 2 2 1
2 3 3 2 2 2 3
2 1 1 1 1 3 3
3 3 3 2 3 3 3
3 2 1 2 2 3 3
2 1 1 1 1 3 3

������������� �����������
A relatively poor performance on the above aspects, however, should not betaken to imply that there is no scope for FDI, only that attracting greater FDIwill be more difficult. Recall that we have found that these factors, at best,explain about half of the variation in FDI. Another half is affected by policy-related and other factors, to which we now turn.
Chart 1.2 summarises the policy-related and other conditions that prevail in theproject countries. As is true for any summary, it does not give the wholepicture, but it broadly identifies the performance with respect to the variouspolicy and structural factors studied. In the chart higher ranking impliespositively stronger actions and vice versa.
As the chart shows, Hungary has the strongest relative conditions and policies.Note that this is a relative presentation. As seen previously, countries havebeen converging in terms of their FDI-related policies and other non-FDI policy-related factors have, therefore, become the determining factors to differentiatethose countries.
Chart 1.2: A SummaryD. Relative Conditions and Policies
Bang- Brazil Hungry India South Tanz- Zambialadesh Africa ania
Economicstability
Liberal FDIpolicies (1)
Trade blocks
Tax breaks &subsidies
Perception ofcapital cost &exchange risk
Perception ofpolitical andother risks
Index: 1. Highly Favourable 2. Favourable 3. Less Favourable4. Negative 5. More Negative 6. Info Not Available
2 4 2 2 2 4 4
2 2 2 2 2 2 2
4 2 2 4 2 4 4
2 2 2 6 6 6 2
4 4 2 4 4 6 6
5 4 2 4 4 5 5

� ���������������� �����
Take, for instance, Hungary, which shows the most favourable conditions andpolicies. It performs significantly better than India, which is not a member ofany trade block and has relatively higher exchange and other risk perceptions.This is despite the fact that India has shown similar liberalism in its FDI-relatedpolicies.
Given this overview of conditions and policy, we now move on to studyinghow FDI has actually been occurring in the project countries. Therefore, interms of both FDI motives and relative conditions and policies related to it,Hungary scores the strongest.

������������� �����������
CHAPTER-2
Quantum, Patterns and Contributionof FDI in Project Countries
2.1 Trends in FDIThis chapter summarises the patterns of FDI inflows in the project countries.Global trends in FDI are related to the trends in growth, world trade and thedifferential growth rates of countries. Therefore, these variables are discussedbelow. Only the key findings are highlighted here.
��
�����
��� ���
���
�� ����������
���
�
���
�����
�����
�����
�����
��� ��� ����� ����� � � �������� ��� � !�
��� ��
����
����
11.52 3.94 0.6 0.15 0.9
335.47
214.980.0619.57
8.77 1.9323.15
1.7
0
50
100
150
200
250
300
350
400
Bangla
desh
Brazil
Hunga
ryInd
ia
S. Afric
a
Tanza
nia
Zambia
��� ��
������������� �������
����
Chart 2.1: FDI Inflows in US$mn
Chart 2.2: Inward Stock of FDI in US$mn

������������������ �����
� There have been significant fluctuations in the flow of FDI to variouscountries studied. Countries that obtain larger amounts tend to havelower fluctuations. This lumpiness in FDI is natural, as one large investmentproject can suddenly and temporarily shoot up the overall level ofinvestment.
� Sources of FDI are becoming plural, as firms from more and more countriesinvest abroad. The dominance of US is on the decline, as Europe, Japanand many East Asian countries are becoming important sources of FDI.
� As most countries became both hosts and sources, FDI became more akinto ‘trade’ with both outflows and inflows.
� Structural adjustments, privatisation and liberal FDI policies have resultedin large FDI flows in the services sector. Privatisation has been one of themost important causes of FDI in recent years. FDI is crucial to globalisationof the service sector.
� FDI cannot be expected to solve the problem of under-investment indeveloping economies by itself. As such, there is really no case for theoptimism that FDI per se can solve the problem of under-investment in theLDCs, though, on the whole, the share of FDI inflows to these countrieshas gone up in 1990s.
� There are significant inter-regional variations in FDI. In 1990s, Africa hadthe slowest growth in FDI, and Latin America and the Caribbean (startingfrom historical lows after the debt crisis) had significantly high growthrates. East Asia, of course, had the highest growth in FDI.
Overall, the information suggests that market-seeking has been the key driverfor recent investment. This is followed by natural resource-seeking in theAfrican countries and Bangladesh, in a limited way and efficiency-seeking incountries like Brazil, Hungary, India and South Africa.
�
���
����
����
����
����
����
����
����
����
����
������� ���� ���� ���� ���� ���� ����
��� ����
������
����
� �!"��#
$�%��
&'(�
Chart 2.3: Yearly Variation in Inward FDI

������������� �����������
2.2 Role of FDI in Project countriesApart from contributing to the up-gradation of knowledge, foreign investmentcan serve two broad purposes, namely, raise investment and relieve foreignexchange shortages. Insofar as these are among the key factors influencinggrowth in developing countries, FDI has the potential to become an importantvehicle of growth. Unless FDI affects national savings, it can either raisedomestic investment, provide additional financing for pre-existing currentaccount deficit or achieve some combination of the two.
2.2.1 FDI and Privatisation InitiativesPrivatisation policies have contributed significantly to FDI inflows in many ofthe project countries. In this subsection we pool together evidence from thecountry reports on the relative contribution of privatisation in attracting foreigninvestment.
In India, as part of the liberalisation process, the list of industries reserved forthe public sector was reduced from 17 to 6. However, the privatisation of SoEshas been extremely slow. Although estimates are not available, unlike in manyother developing countries, (especially in Latin America and Eastern Europe),FDI inflows into India have not been driven by privatisation policies and saleof SoEs to foreign investors. This is despite the fact that foreign financial andtechnical collaboration was made mandatory for all private sector entrantsbidding for a license as operators in the telecommunications sector.
The links between the privatisation process and FDI inflows have not beenvery strong in Bangladesh as well. The level of privatisation achieved hasbeen modest. Although international tender was called for privatisation ofmany SoEs no foreign investor ultimately invested. However, the governmenthas offloaded its shares of different companies, mainly to foreign firms, throughthe stock market. Besides, opening up of the energy sector has resulted insignificant FDI inflows in this sector, especially for natural gas.
Unlike, India and Bangladesh, the privatisation process in Zambia has madesignificant progress. By the year 2000, 248 out of 280 SoEs had been sold. Themajor sales have been of the copper mines. It is not known, however, if themajor buyers in these deals were foreign firms. Due to massive shedding oflabour in the post-privatisation period, the political commitment to privatisethe infrastructure sector is on the wane. This has added to the uncertaintiesregarding the liberalisation process and the associated FDI inflows.

������������������ �����
There is a strong FDI-privatisation link in South Africa; much of the FDI intothe country over the past few years has been in the form of acquisitions byforeign firms of SOEs. Till the end of 2001, about US$2.7bn have been raisedthrough the privatisation of the SoEs, mainly from international equity partners.The country has approximately 312 remaining parastatals, many of which aresubsidiaries of large SOEs in the telecommunications, power, transport andarmaments sectors.
The privatisation-FDI link seems to be even stronger in Hungary. During 1991-2000, about 41 per cent of the total FDI inflows into the country came throughthe privatisation process. Typically, many of these sales were made to firms inthe developed countries, which had co-operative links with the SoEs. Evensome greenfield investment started in the privatisation process. Privatisationled acquisitions by TNCs sought extant assets like brands, skills, market share,R&D competencies and supplier networks. In this sense most of theprivatisation investments remained embedded in the local economy. Mostgreenfield investment on the other hand was seeking relatively cheap labour.
Privatisation has been an important source of FDI inflows in Brazil as well,mainly in the financial services and utility sectors. In the second half of 1990s(1996-99) privatisation related inflows constituted about 26 per cent of the totalFDI inflows. About 80 per cent of the privatisation related foreign investmentwas in the service sector. These were mainly in those sectors, which were partof the privatisation programme, like sanitation, telecommunications, financialand business support services.
Privatisation programme in Tanzania has been going on for some time now.Between 1992 and 2001, 326 companies have been divested. Of these onlyabout 4 per cent were bought completely (100 per cent) by foreign entities.Another 58 per cent (190 out of 326) were sold to joint ventures between localand foreign investors. According to some estimates, privatisation proceedsaccounted for a third to half of the FDI inflows into Tanzania between 1992 and1998. This was essentially due to the privatisation of public utilities.
2.2.2 FDI, Cross-Border Mergers & Acquisitions and GreenfieldInvestmentFDI flows can result in new capacity creation through greenfield investment orthrough M&As where existing capacities/assets are acquired. Cross-borderM&A activity has been on the rise in recent years. The project countries arenot an exception to this trend, except for Bangladesh where this activity doesnot seem to be very significant In terms of value of transactions, the second

������������� �����������
half of 1990s have seen significant transfer of assets through M&As in Brazil,Hungary and South Africa. This trend is picking up in India.
It is interesting to note that in the year 2000, for all project countries (exceptBangladesh) the value of M&As was at least as much as 53 percent of thevalue of FDI flows. In general, during the 1990s, M&A activity has been asignificant source of FDI in Brazil, Hungary, South Africa and Zambia. Thistendency was also significant for India but to a limited extent. Tanzania andBangladesh, especially the latter, have not experienced significant cross-borderM&A activity. For Tanzania, however, this activity picked up suddenly in theyear 2000.
Alternative estimates show that cross-border M&As have been a very importantmode of FDI into India in recent years. During 1991-98, about 38 percent of theFDI made by TNCs came in to finance acquisition of equity stakes in existingenterprises. In fact, the share of pure technology collaborations with foreignfirms has declined drastically in 1990s; technology licensing is now mostlyaccompanied with equity participation.
No detailed information is available for Hungary regarding the relative role ofdifferent modes of FDI. Insofar as privatisation was the key element of FDI,M&A activity seem to have dominated with very few greenfield investment.
�"��"
���� ���� ����#�� �"" ��������������������
����
�
����
�����
�����
�����
�����
����� ����� � � �$�%�
�����
��� � !�
) ������*�+�,� ) ���-"�./��0�-#�������1�-"�./�
Chart 2.4: Cross Border M&A Activity, 2000

����������������� �����
As in Hungary, detailed information is also not available for Zambia. Butanecdotal evidence suggests that most foreign investment was for take-oversof privatised state enterprises; greenfield investment was very few. Thesituation was somewhat similar in Brazil. Due to the privatisation policy, theshare of M&A activity vis-à-vis greenfield investment rose sharply in the late1990s. In 1996 the share of cross-border M&As in total FDI was only about 45per cent which rose to 86 per cent in 1998. This is much higher than the ratio inthe developing countries (41 percent), South and South East Asia (33 percent)and even Latin America (56 per cent).
In South Africa also inward investment has increasingly taken the form ofM&As, largely as a result of state leveraged deals and the privatisation ofstate assets. During 1994-99 period, about 64 per cent of the total inflows werea result of cross-border M&A activity.
Interestingly, FDI in Bangladesh was mostly in greenfield projects mainly inthe energy sector (gas and power), telecommunication and cement.
Greenfield investment (fully owned subsidiaries and joint ventures) hasdominated as a mode of entry in Tanzania as well. While the role of cross-border M&A has increased in recent years, (essentially due to the privatisationpolicy), its share was no more than 10 percent during the 1990s. About 61 percent of the FDI projects approved were joint ventures indicating willingness ofpotential investors to form partnerships with local private investors. The jointventure route was more pronounced in transport (80 percent), mining (72percent), telecommunication (70 percent) and housing (88 percent) sectors.
Cross-border M&A activity undertaken by firms in the project countries hasbeen significant mainly for South Africa, Brazil and to some extent India. It maybe recalled that while India did not show very high outward FDI flows, theother two countries showed significant FDI flows out of their countries. Butthe estimates seem to suggest that a significant amount of outflows from allthree countries are being used for M&A activity. In contrast, the outflows fromHungary are less oriented towards M&A activity. Firms in the remaining threecountries (Bangladesh, Tanzania and Zambia) do not undertake M&A activityoutside their national boundaries.
2.2.3 FDI, Domestic Capital Formation, Gross Domestic Productand ExportsFDI flows contribute significantly to capital formation in Brazil and Hungary.FDI’s contribution to capital formation is very low in the two south Asian

������������� ����������
economies, India and Bangladesh. FDI inflows contributed as much as 31percent of Brazil’s capital formation in 1999. This contribution was only about2 percent for India. Its contribution to the capital formation in the remainingcountries was in the range of 8-14 percent. Only in South Africa and to anextent Hungary, outward FDI flows have been significant vis-à-vis the country’scapital formation.
Certain interesting patterns emerge when we standardise the stock of FDI bythe GDP of each country. Inward FDI stock, as a percentage of GDP was ashigh as 58 percent for Zambia in 1999. Even for Hungary and South Africa thisproportion was close to 40 percent. This reflects a significantly high penetrationof TNCs in these economies. This percentage was significantly lower for othereconomies, except Brazil where the percentage was close to 22 in 1999. The“transnationalisation” of the economies India and Bangladesh was particularlylow.
Is the share of project countries in global FDI flows any different from theirshare in world output, employment and exports? The share of FDI inflows toZambia in global FDI flows is about 70 percent more than their share in theworld GDP. The shares of Brazil and Hungary in global FDI are also higher thantheir share in GDP, but only by about 20 percent. Except for Tanzania for whichthe shares in global GDP and FDI flows are roughly the same, in all otherproject countries, their share in GDP is significantly more than in FDI flows.The share of Hungary in world employment is about 20 percent lower than theirshare in FDI flows. For Brazil, the shares are about the same but for othercountries, the employment shares are significantly more than the shares inFDI. In general, the shares in FDI are lower than the shares in exports for theproject countries. Brazil and Zambia are the only exceptions, the former having
� ��
� �� � ��� ��
� �� � ��
� ��� �&
� ��� ��
� �"� ��
" ��
� ��
�
� ��
�
� ��
�
� ��
"
" ��
#
B anglades h B raz il H ungary Ind ia S . A f ric a T anz an ia Z am bia
� � � � �$ � �' ( ) � � � � �$ � �* + , $ � % �
Chart 2.5: Share of World FDI to Share of GDP and Share ofExports, 1998-2000

������������������ �����
a significantly larger share in FDI than in exports. Does this mean that FDI canpotentially be more export oriented in countries other than Brazil and Zambia?
As has been mentioned earlier, these ratios can be affected by the size of theeconomy; but what these shares do reveal is that for their share of World GDP,exports and employment, FDI levels have been high in Brazil, Hungary, andZambia. Therefore, relative to their size of the economy, FDI has been high.But what it implies for further FDI is discussed in the next section.
2.2.4 FDI and Balance of PaymentsThe outflows in the form of dividends and interest payments to non-residentshave been significant in the case of South Africa. This has become importantbecause of the increased presence of non-resident investment in South Africaand the movement of some major national companies to London. Over the past50 years, South Africa has almost always recorded a surplus on the tradeaccount but a deficit on the current account.
In Brazil, an attempt to sustain an over valued currency in the late 1990s andthe strategy to balance the growing current account deficits with portfolioinvestment led to fast deterioration of the external accounts. Portfolio and FDIflows were crucial to finance the balance of payments deficits after the 1998crisis. In fact, the FDI/current account ratio was as high as 106 percent in 1998-99. However, the costs of financing the deficit by portfolio capital have becomeprohibitive after the Asian and local market crises in late 1990s. The currentaccount deficit was as high as 4.4 per cent of the GDP in 1999. Since then FDIinflows have declined in recent years, trade account surpluses are key toovercome the current account deficits.
�� ������������������������ ��������������������������
����� ��� !��""�#�$$$
���
���������
������
���
���������
���
���
���
���
������#��&��-�
�����#��&��-
��� ���
�����
�����
� �
��������
���
� !�
�����-"�2/0 �����-"�3'4 -�'��5
2

������������� �����������
The Hungary experience brings out sharply the links between capital flowsand balance of payment situation. In 1998 and 1999, Hungary’s current accountdeficit deteriorated significantly despite the improvements in exports and thedomestic economic situation. Foreign capital was blamed for this crisis as itwithdrew form Hungary and also repatriated substantial profits. While theinward FDI shrank, outward FDI grew during this period. Thus net inflow ofcapital ceased to cover deficits of the trade balance. Interestingly, theprivatisation policy had preferred the foreign investors precisely to performthis balancing role.
The key point is that large capital inflows in short periods of time are bound tobe followed by generation of profits that may be repatriated unless the economyis able to stimulate their reinvestment in the local economy. Such trends affectthe balance of payments situation even more adversely in conditions wheninward FDI is stagnating and hidden profits transfers are taking place throughpayments for “business and technical service payments”. Both these conditionsprevailed in Hungary. The data on Hungary showed that the outflows weremore pronounced for bank deposits and portfolio capital than for FDI that wasless volatile. Even portfolio profit transfers were more pronounced than FDIrelated profit transfers. Thus, growing volumes of inward and outward capital/income transfer pose a potential threat to macro economic stability that mayneed to be actively corrected through macro-economic policy.
There is also some evidence from Hungary to show that FDI projects contributedto reduce the trade deficits. Initially, while the new projects were being set up,increased imports of machinery etc. deteriorated the trade balance butsubsequently rapid export growth contributed to reducing the trade deficit.The major engines of export growth were large greenfield investment in theEPZs.
In India the average foreign investment inflows during 1993-2001 were morethan 20 times the average levels during 1985-91. However, this sharp increasein the level of foreign investment did not result in a large capital accountsurplus due to the offsetting declines in the net aid flows and deposits by thenon-resident Indians. The Reserve Bank of India followed the policy ofaccumulating foreign exchange. This meant that current account deficitsremained low and foreign investment inflows did not augment domestic savingsto augment domestic investment rates.

� ���������������� �����
Under the IFD project, a national survey on civil society perceptions wasconducted in the project countries. The aim of the survey was to gauge theperceptions of civil society on the positive and negative aspects of FDI, therelationship between FDI and domestic investment, and measures adopted bygovernments to facilitate FDI. Questionnaires were sent to potential respondentsfrom a range of organisations such as trade unions, business associations,NGOs, religious organisations and, representatives of the academia and themedia. The respondents were asked to provide their responses on a number ofissues related to FDI policy and performance. The results of the survey arepresented in the sections that follow. The number of respondents in the projectcountries is as follows:Bangladesh 50Brazil 11Hungary 50India 38South Africa 26Tanzania 50Zambia 43
3.1 Why Civil Society: a DiscussionDeveloping countries typically follow a dual approach in their FDI policy. Onthe one hand, they increasingly welcome FDI, and, on the other, they tend toput in place certain restrictions or constraints in their operations. This dualpolicy, it appears, has public support as the civil society respondents tend towelcome FDI but are in favour of certain interventions that would prevent themfrom functioning in a completely free manner.
Moreover, given the heterogeneity in levels of development of developingcountries – and the asymmetry in their characteristics and economic conditions,- objectives would tend to vary widely among developing countries. It is neitherfeasible nor desirable to formulate an inventory of development objectivesthat was applicable to all developing countries. At the same time, it is interestingto note that concerns related to FDI are broadly similar across a wide range ofcountries.
CHAPTER-3
The Civil Society Survey

������������� �����������
Globalisation and interdependence have opened new opportunities. Somecountries have successfully adapted to the changes and benefited fromglobalisation, a contributory factor being their openness to FDI. But, hasopenness to FDI actually helped the overall development of these countries ortheir ‘integration’ in a sustainable way into the global economy? In order tohelp developing countries to prevent and overcome any negative effect ofeconomic globalisation, there is a need for governments to form developmentpolicies, taking into account their own social, human and environmentaldimensions. The orientation and participation of civil society can play anextremely important role in the process of policymaking.
Unlike policy-makers, economists, and industry associations, civil society tendsto look at many non-economic dimensions as well. For any broad consensusto be achieved, countries need to take into consideration the views of therepresentatives of civil society. The key lies in their credibility and ability toaffect long-term public opinion. Sustained and long-term improvements in FDIpolicy can be achieved, if there is a consensus among the general public onpolicies.
There is a need for governments, therefore, to interact with civil society, andengage them in a dialogue in a constructive, structured and organised way.Civil society, therefore, should be involved in the decision-making andmonitoring processes of FDI on the international and national levels.
3.2 Comparison of the Results of the Civil Society SurveyOverall, the civil society survey results demonstrate that, in all the countries,civil society is positively oriented towards FDI. More importantly, a comparisonamong the country experiences shows that civil society is aware of its owncountry’s experiences. Countries that have had a positive experience withcertain aspects of FDI show high agreement levels. Take, for instance, responsesfrom the survey in India on whether FDI enhances exports. FDI in India hasbeen less oriented towards exports and more towards domestic products (seeInvestment Policy in India- Performance and Perceptions). Consequently, lessthan half the civil society respondents from India agree that FDI enhancesexports. FDI in South Africa did not have a negative impact on imports, thus alow agreement among the South African respondents on this query.
����������������� �����
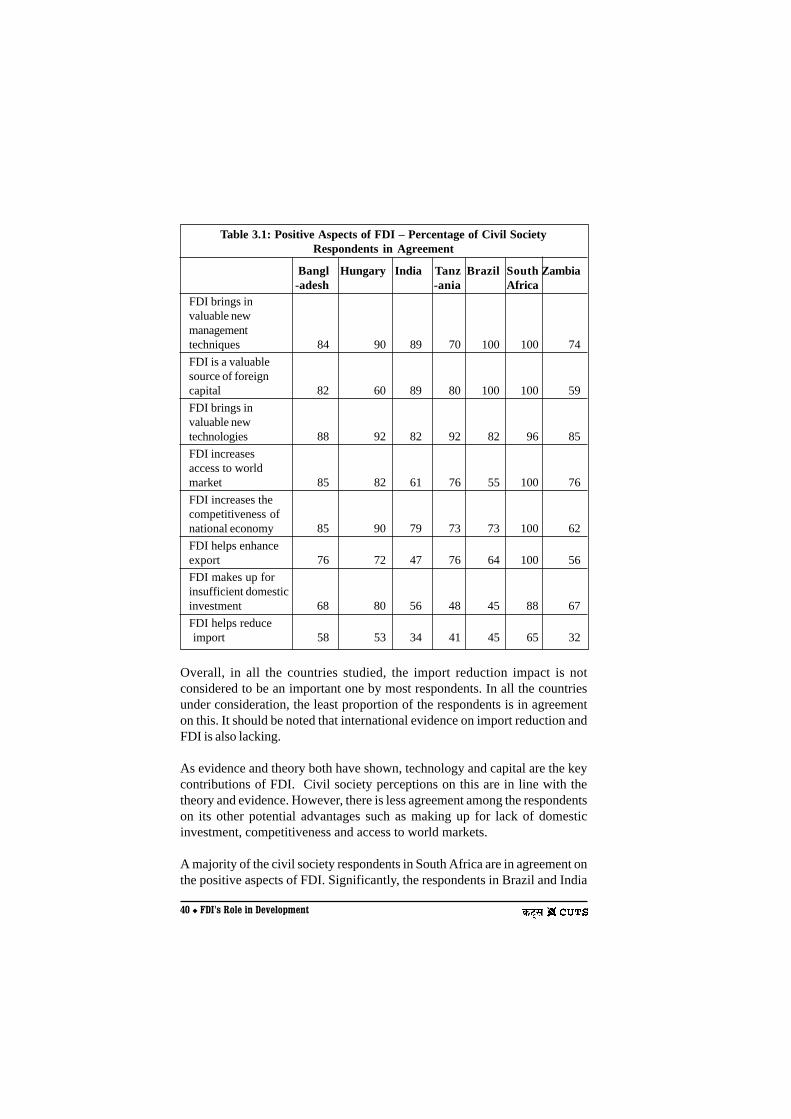
Overall, in all the countries studied, the import reduction impact is notconsidered to be an important one by most respondents. In all the countriesunder consideration, the least proportion of the respondents is in agreementon this. It should be noted that international evidence on import reduction andFDI is also lacking.
As evidence and theory both have shown, technology and capital are the keycontributions of FDI. Civil society perceptions on this are in line with thetheory and evidence. However, there is less agreement among the respondentson its other potential advantages such as making up for lack of domesticinvestment, competitiveness and access to world markets.
A majority of the civil society respondents in South Africa are in agreement onthe positive aspects of FDI. Significantly, the respondents in Brazil and India
Table 3.1: Positive Aspects of FDI – Percentage of Civil SocietyRespondents in Agreement
Bangl Hungary India Tanz Brazil South Zambia-adesh -ania Africa
FDI brings invaluable newmanagementtechniques 84 90 89 70 100 100 74
FDI is a valuablesource of foreigncapital 82 60 89 80 100 100 59
FDI brings invaluable newtechnologies 88 92 82 92 82 96 85
FDI increasesaccess to worldmarket 85 82 61 76 55 100 76
FDI increases thecompetitiveness ofnational economy 85 90 79 73 73 100 62
FDI helps enhanceexport 76 72 47 76 64 100 56
FDI makes up forinsufficient domesticinvestment 68 80 56 48 45 88 67
FDI helps reduce import 58 53 34 41 45 65 32

������������� ����������
tend to have a lower agreement on the positive aspects. Both Brazil and Indiaare large markets, with a strong domestic manufacturing base. The marginalimpact of FDI on such factors had been lower in these countries. We also findthat the respondents in Tanzania respond in a manner similar to Brazil andIndia.
Table 3.2 shows civil society perceptions of some potential negative aspectsof FDI. It finds that, overall, civil society respondents in all the countries havelesser agreement on the negative aspects than the positive ones. However,there are significant inter-country differences in the civil society responses onthis account.
Table 3.2: Negative Aspects of FDI – Percentage of Civil SocietyRespondents in Agreement
Bangl Hungary India Tanz Brazil Zambia South-adesh -ania Africa
FDI brings inenvironmentallyharmfultechnologies 38 28 39 38 18 11 23
FDI reduces theprofitableopportunitiesavailable todomestic investors 47 60 33 50 45 73 27
Foreign investorsare only interestedin getting access todomestic markets 58 46 72 47 55 55 23
FDI results out ofunfair advantagesof multinationalfirms 65 58 38 45 27 79 31
Foreign investorsdo not care aboutimpact of theirinvestments oncivil society 62 56 45 57 45 71 23

����������������� �����
As may be expected, most respondents, in general, perceive that foreigninvestors do not care about their impact on civil society. In the case of Indiaand Brazil, perceptions of this are weak. There is a very low agreement on thisamong the South African civil society respondents. The South Asianrespondents also largely agree with the perception that investors are ‘only’interested in gaining access to domestic markets. However, most respondentsfrom other countries do not agree with this view.
The experiences of Hungary and, to a lesser extent, Tanzania with FDI also mayhave contributed to the responses from these two countries, the respondentsare in greater agreement on the negative aspects. Overall, the responses suggestthat negative perceptions are the least in South Africa, followed by Brazil. Forthe rest of the countries, civil society perceptions are negative. Overall, therespondents in Zambia are in lesser agreement with either the positive or negativeaspects of FDI.
Table 3.3: Measures to Increase the Benefits of FDI – Percentageof Civil Society Respondents in Agreement
Bangl Hungary India Tanz Brazil South Zambia-adesh -ania Africa
Support localbusinesses toupgradetechnology/gainaccess to financeetc. 91 84 86 98 100 100 61
Strengthenenvironmentalregulation 77 88 81 93 0 54 61
Introduce/strengthencompetition policy 89 64 83 100 67 65 50
Strengthen sectoralregulation 66 58 83 97 17 38 50
Strengthen labourlegislation 69 40 76 98 17 4 50
Strengthen
intellectualproperty rightslegislation 88 63 95 90 33 69 85

������������� ����������
Therefore, there is a significant concern related to the negative aspects in mostcountries among the respondents. Given the concerns, it is but natural thatrespondents would have views on the role that the government should play.Many queries related to the direction that government policy should take wereasked. The responses are reported and discussed below.
Apart from Hungary and India, in all the countries, there is a strong agreementon the potential policy action that would support the strengthening of domesticbusinesses. There is less agreement on the necessity of strengtheningenvironmental regulations, e.g. the Tanzanian, Brazilian and South Africancivil society respondents are not much in support of this measure. This couldalso be the result of strong environmental regulations already in place incountries such as Brazil.
Table 3.4: Restrictive Measures on Foreign Investors – Percentageof Civil Society Respondents in Agreement
Bangl Hungary India Tanz- Brazil South Zambia-adesh ania Africa
Impose requirementson firms to:Create jobs 84 84 89 95 46 70Employ localmanagers 80 54 75 97 62 74Transfer technology 91 82 86 94 73 76Source supplies fromlocal firms or imposelocal content norms 71 78 68 94 38 65Export from theeconomy 80 53 85 94 46 47Balance foreignexchange impact 62 38 47 88 12 74Transfer skills andknow-how to localsubsidiary firms 94 88 80 100 69 59Transfer skills andknow-how to localnon-affiliate firms 63 62 67 81 38 70Train local technicaland managerialmanpower 94 92 87 97 100 47

���������������� �����
As has been discussed in the other parts of this paper, the gains from FDI canbe most significant when there is a high level of competition. Competitionprevents FDI from extracting monopoly rents and repatriating them. Anotheraspect of competition is that counter-balancing forces are present in theeconomy that could prevent exploitation. Strengthening of competition policygets the largest affirmative responses in all countries.
The survey responses from South Africa, Brazil and Tanzania show lesseragreement for greater government intervention, than the other countries.
Generally, most civil society respondents, except for the South African ones,are in favour of imposing certain requirements on FDI. Of the countries studied,the Tanzanian and Indian civil society respondents are mostly in favour ofspecific government interventions. Curiously, most South African civil societyrespondents, who have greater positive orientation towards FDI than the othercountries, also call for many specific interventions and policy measures.
Employment and technology-related requirements receive the most support inall the countries studied from a majority of civil society respondents. Withinthis class of interventions, those related to the training of local employeesreceive the strongest support from the respondents. Overall, the respondentsin India are in favour of greater government actions to increase the net benefitsof FDI to the economy, than the other respondents. In Brazil, the responsesshow greater variation and are highly issue-specific. Significantly, balancingrequirements for foreign exchange outgo receive the least support from therespondents.
In sum, therefore, the civil society responses reveal that there is a perceptionthat foreign direct investment plays an important role in the development ofhost economies.

������������� ���������
Under the IFD project, investment policies, performance and perceptions inthe selected sectors in the project countries were studied. Each country hascase studies of three sectors. The sectors include auto, power, mining, telecom,textiles, cement, and also include services such as the financial and tourismsectors. Generally the sector that received the highest FDI flows, either actualor approved, was chosen. Sectors were also chosen on the basis of current andexpected future importance for the particular country's economy by the partnerorganisations4. Automobile and telecom make up the main comparative studiesbecause most of the countries have chosen these, which reflects the importanceof these sectors in the FDI picture of the project countries.
4.1 Enabling EnvironmentThe findings of the case studies across several sectors in the seven countriesshow that everywhere the domestic policy environment has preceded the inflowof FDI. In this section the experience of the project countries in creating anenabling environment for particular sectors is discussed. In Brazil, in all thethree sectors – telecommunication equipment, pharmaceuticals and automobiles– a large part of total foreign investment was attracted by incentive policiesand mechanisms. In general, these policies do not make any distinction betweendomestic and foreign companies. In the case of telecommunication equipment,the main policies are the Information Technology Act, the Programme of Supportfor Investments on Telecommunications and the Fund for TechnologyDevelopment. Similarly, in the case of pharmaceuticals, the New IntellectualProperty Law was a strong reason for FDI attraction during 1990s in the sector.
In South Africa, as part of its plan to attract foreign investment, the government,in 1995, replaced its previous strategy of developing a local motor vehiclemanufacturing industry under the seven year Motor Industry DevelopmentProgramme (MIDP). MIDP was introduced to make SA’s automotive industryglobally competitive. MIDP abolished all local content requirements of theprevious programme, lowered tariffs on imported vehicles and components,established a duty-free allowance for original component equipment imports,which offset import duties on components and vehicles through import rebatecredits earned from exports, and established a higher duty-free allowance forlow cost vehicles.
CHAPTER-4
Findings of Case Studies

����������������� �����
In Hungary, the impact of FDI became favourable when the transition processgained momentum in 1990s. The Hungarian Government supported the creationof linkages of foreign firms with the local ones. Despite the change ingovernment, preferences for FDI in privatisation policy remained in place. Asa consequence, the Hungarian manufacturing industry became dominated byforeign companies. Also, major service industries, like electricity, water supply,telecommunication, and the banking sector received large quantity of foreigninvestment.
Table 4.1: FDI and Government Policy Instruments
Country
Brazil
South Africa
India
Tanzania
Bangladesh
Zambia
Sectors
Telecommunicationequipment
Pharmaceuticals
Autommobiles
InformationTechnology
Mining
RMG and Textiles
Mining
Government Policy Instruments
� The New Information Technology Act� Programme of Support for Invest-
ments on Telecommunications
� The New Intellectual Property Law
� Motor Industry DevelopmentProgramme
� The Electronics and ComputerSoftware Export Promotion Council,1988
� National Task Force on InformationTechnology and SoftwareDevelopment, 1998
� Software Technology Park Scheme� FDI up to 100 percent is allowed in
various categories.
� Introduction of a competitive miningpolicy and an equally competitivemineral legislation
� Review and streamlining of taxregulations on mining activities
� Provides many incentives and supportto the export-oriented industry
� EPZ provides an opportunity forthe foreign investors as well.
� Privatisation of mines through FDI

������������� ����������
In India, the success of the IT sector has been attributed to the role played bythe government in providing an enabling framework. India now has a liberalpolicy for FDI in the telecom sector. FDI up to 100 percent is allowed in variouscategories of this sector. Under the new Indian auto policy announced inMarch 2002, the government has permitted 100 percent FDI in the automobileand component sectors, under the automatic route. In the power sector too,the new policy permits 100 percent foreign equity and repatriation of profits,without any export obligations.
In the case of three LDCs also – Bangladesh, Tanzania and Zambia – theoverall liberalised environment has been important for attracting FDI. TheRMG sector of Bangladesh, the mining sectors of Tanzania and Zambia receivedsubstantial quantity of FDI, following the policy changes undertaken by thegovernments of these countries since early 1990s.
4.2 Technology TransferHost countries often associate inflows of FDI with a wide variety of benefits,the most common of which is transfer of modern technologies. According tothe case studies of the seven countries involving several sectors, FDI appearsto have a positive impact on the technology transfer and it demonstrates bettertechnologies to local firms. This is more evident in the case of the three LDCs– Bangladesh, Tanzania and Zambia.
In Bangladesh, FDI in RMG had a stronger impact on technology upgradationby local firms and the revenue of the government. The development of thetelecom sector, particularly in cellular phone services, is basically propelled byforeign investment and collaboration from Malaysia and Norway. The impactof FDI in the telecom sector is quite evident. It has improved the communicationnetwork of the country.
In Zambia, the privatisation of the mines through FDI, by way of TNCs investingin mines, revised the mining sector which was stagnating in the absence ofinternational capital and technology. There have been productive capacityimprovements in the mines, which have led to production increases.
Similarly, in Tanzania, FDI in the mining sector has gradually expanded theareas of exploration and mining. The banking and telecom sectors have alsobenefited from FDI, in terms of technology transfer.
In the case of the three large developing countries – India, Brazil and SouthAfrica – the influx of FDI in the automobile and telecom sectors has resulted in

���������������� �����
their modernisation. In India, it was way back in 1986 that Texas Instruments, aUS-based TNC, had set up a software development centre in Bangalore, to tapthe qualified workforce available in the vicinity. Subsequently, a host of otherTNCs began to follow the footsteps of Texas. Today, the Indian IT sector issaid to be one of the most competent in the world. Indian software companiescater to the needs of large TNCs in the developed countries, which outsourcetheir software requirements from India.
In South Africa, FDI in the telecom sector has had a positive impact ontechnology transfer. South Africa is the telecom giant of Africa. It ranks 23rd intelecom development and is the 14th largest Internet market in the world.
FDI in the automobile sector has brought new and advanced technology in allthe three countries. The automobile sector was one of the largest recipients ofFDI in Brazil. As a result, the competitive gap between Brazil and the developedeconomies, with regards to products and productive facilities and processes,has been reduced. Today, most of the big automobile TNCs have theirproduction base in South Africa. The automobile industry is one of SouthAfrica’s biggest exporters. Its automotive industry is increasingly acquiring aglobal reputation for quality, as illustrated by a recent award to BMW SouthAfrica for outperforming plants in Europe, USA and other regions.
In India too, the automobile sector has emerged as an important driver of theeconomy. Although the automobile industry in India is nearly six decades old,until 1982, it had only three manufacturers – Hindustan Motors, PremierAutomobiles and Standard Motors, which ruled the motor car industry. Owingto low volumes, it perpetuated obsolete technologies and was out of line withthe global industry. At present, the Indian automobile sector is growing fast,with support from economic reforms that have taken place since 1991 and FDIinflows.
In Hungary, the transition from centrally planned to market economy was greatlyenhanced by FDI as it played an important role in the privatisation process.Thus, it had a positive impact on the restructuring of the state-owned sectordirectly.
4.3 Job Creation and Job LossFDI is often attracted with the idea that it would result in economic growth,which, in turn, would create jobs. However, empirical evidence from the projectfindings shows that FDI results in more job-shedding (especially in the domesticsector) than creation. In other words, net job creation is either low or negative

������������� ����������
in most of the cases. This phenomenon is quite evident in the case of the threelarge developing project countries. LDCs: Bangladesh, Tanzania and Zambiahave not experienced any loss in jobs, as there were hardly any local firms inexistence before the economies were opened up to foreign investment.
The South African automotive industry is one of the largest employers in thecountry. There have, however, been several job losses in the sector over thepast few years, most dramatically in the component industry. According to theNational Association of Automotive Component and Allied Manufacturers(NAACAM), employment in the component industry has gone down from89000 in 1996 to 58500 in 2001. In the telecom sector, according to the labourunion, COSATU, Telkom, South Africa’s national telecommunications operator,shed 25000 jobs during its exclusivity period, with another 10000 job cuts areenvisaged post-IPO; which is almost a third of the company’s total labourforce. There has been severe job-shedding in food, beverages and agro-processing sectors as well. This could be attributed to factors such as a declinein consumption, the impact of M&As, the use of less labour-intensivetechnologies, outsourcing of services or the increasing use of unregisteredcasual labour.
In Brazil, there has been a loss in jobs in both the telecom equipment andautomotive industries. In the telecom equipment sector, there was a loss of3800 jobs in domestic companies but in foreign ones, 11700 were created. In theautomotive sector, as per the data of the National Statistics and CensusInstitute’s Annual Industrial Survey, there has been a significant increase inthe number of TNCs, but the number of jobs has gone down. Between 1996 and1999, more than 15000 jobs were shed in the vehicles sector alone. In auto partstoo, there was a shedding of more than 8000 jobs. The exception is thepharmaceutical industry, where, both in TNCs and domestic industries, jobswere created. In the period between 1996 and 1999, about 9400 jobs werecreated in the sector, of which about 5800 were by TNCs.
The Indian IT sector showed a trend contrary to that of the manufacturingindustry. The Indian companies have grown along with TNCs and a number ofjobs were created.
In Hungary, the adjustment efforts undertaken for its transition resulted in thewinding-up of activities and a loss of jobs. Both foreign and state-owned firmshad to scale back previous activities to the size and structure that fitted thenew market-oriented production patterns. Foreign firms did downsizing moreruthlessly than the local ones.

����������������� �����
4.4 Growth of Local IndustriesWhile attracting foreign investment, host countries do expect that besidesbringing in new technology and know-how, FDI inflows will also contribute toan increase in productivity and competitiveness of domestic industries. Thereis no conclusive evidence from the project research, except for a few exceptionswhich shows that FDI, in reality, increases the competitiveness of domesticindustries, like the Indian IT sector. However, the empirical results show thatthere are productivity spillovers from FDI through contacts between foreignaffiliates and their local suppliers in upstream activities, but there is no indicationof spillovers occurring within the same industry. In other words, spilloversfrom FDI are more likely to be vertical, rather than horizontal, in nature.
Findings of the case studies of the seven countries also reveal more or lesssimilar results. In the telecom equipment sector of Brazil, during 1996-99, thenumber of domestic companies dropped from 241 to 219, while the number offoreign companies doubled. In the case of the automotive industry of Brazil,the increasing presence of foreign companies proved to be disadvantageousfor domestic capital. According to Sindipecas’ data, in 1994, the share ofdomestic companies in the capital, sales and investment in the sector was 51.9,52.4 and 52 percent, respectively. With the increase of M&As by TNCs and theconsequent deepening of the concentration and denationalisation processand the different competitive performances shown by these two groups ofcompanies, this share dropped to 26.5, 27 and 14.5 percent, respectively.
In South Africa, the automotive industry had become extremely competitive inthe last decade. However, global pressures, together with the recentappreciation of the Rand and rising input costs, had forced a number of localcomponents companies to close down shop or scale back, as well as shed jobs.In certain sub-sectors of the agro-food complex, foreign TNCs effectivelydisplaced South African companies, closed them down or converted them intowarehouses. The dairy industry was a case in point; a strong European presencehad led to the import and warehousing of subsidised EU produce, rather thanfully utilising the local production capacity. The ‘crowding out’ of domesticfirms may have meant fewer linkages of foreign firms with the economy and notechnological learning from FDI.
The two exceptions to the above-mentioned trend are the IT sector of Indiaand the pharmaceutical industry of Brazil. After the entry of foreign companies,a number of Indian companies engaged in computer hardware started to spin-off their software divisions. Despite the entry of most leading MNCs in Indiafor software development, the industry is still dominated by domestic companies

������������� ����������
and talent. The top six software companies in India, ranked either on the basisof overall sales or turnover, are domestically owned.
The Indian software exporting companies themselves are sufficiently global intheir outlook. As many as 212 Indian software companies have eithersubsidiaries or branch offices overseas. Nearly 32 Indian software companieshave received Software Engineering Institute (SEI) USA’s Capability MaturityModel (CMM) Certification. Six of them have reached Level 5 of this certificationscheme, a distinction, which has been awarded, only to 12 companies world-wide.
The pharmaceutical industry of Brazil has also seen a growth in domesticindustries. There are a large number of middle and big domestic companies.The number of domestic firms has increased from 618 in 1996 to 673 in 1999.These companies accounted for a gross value of production of about US$2.8bn.On the other hand, 61 foreign companies generated about US$4.9bn in thesame year.
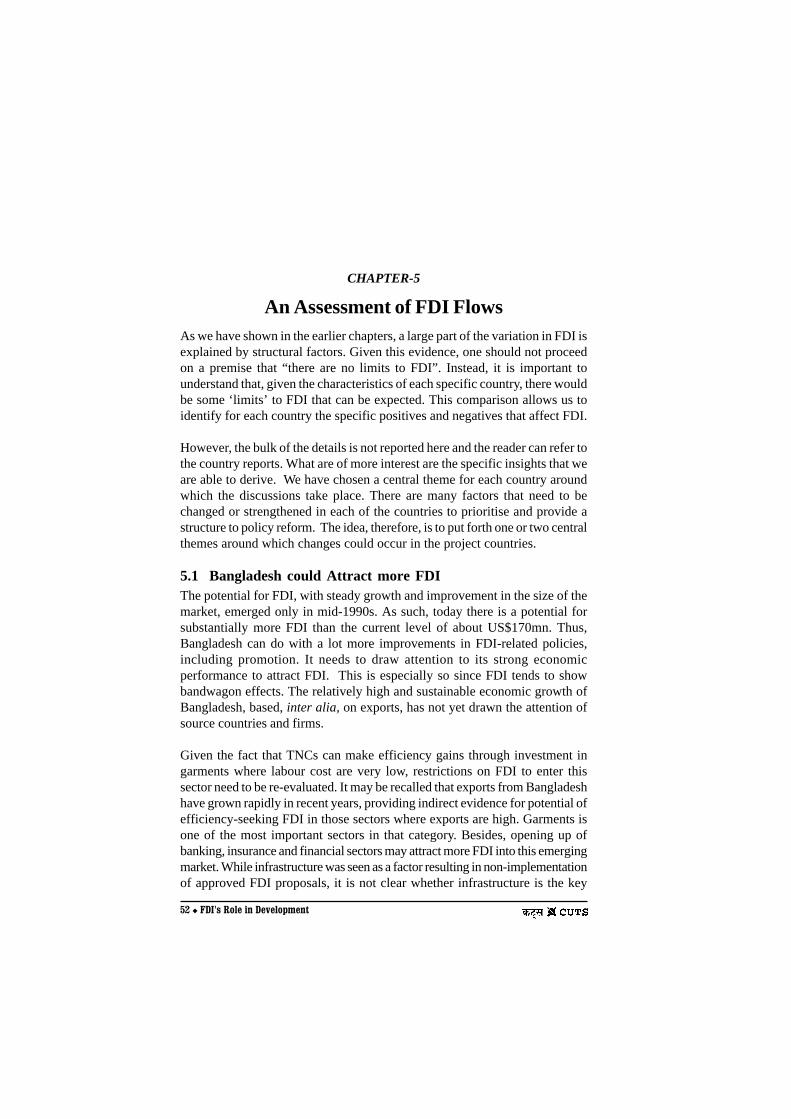
����������������� �����
As we have shown in the earlier chapters, a large part of the variation in FDI isexplained by structural factors. Given this evidence, one should not proceedon a premise that “there are no limits to FDI”. Instead, it is important tounderstand that, given the characteristics of each specific country, there wouldbe some ‘limits’ to FDI that can be expected. This comparison allows us toidentify for each country the specific positives and negatives that affect FDI.
However, the bulk of the details is not reported here and the reader can refer tothe country reports. What are of more interest are the specific insights that weare able to derive. We have chosen a central theme for each country aroundwhich the discussions take place. There are many factors that need to bechanged or strengthened in each of the countries to prioritise and provide astructure to policy reform. The idea, therefore, is to put forth one or two centralthemes around which changes could occur in the project countries.
5.1 Bangladesh could Attract more FDIThe potential for FDI, with steady growth and improvement in the size of themarket, emerged only in mid-1990s. As such, today there is a potential forsubstantially more FDI than the current level of about US$170mn. Thus,Bangladesh can do with a lot more improvements in FDI-related policies,including promotion. It needs to draw attention to its strong economicperformance to attract FDI. This is especially so since FDI tends to showbandwagon effects. The relatively high and sustainable economic growth ofBangladesh, based, inter alia, on exports, has not yet drawn the attention ofsource countries and firms.
Given the fact that TNCs can make efficiency gains through investment ingarments where labour cost are very low, restrictions on FDI to enter thissector need to be re-evaluated. It may be recalled that exports from Bangladeshhave grown rapidly in recent years, providing indirect evidence for potential ofefficiency-seeking FDI in those sectors where exports are high. Garments isone of the most important sectors in that category. Besides, opening up ofbanking, insurance and financial sectors may attract more FDI into this emergingmarket. While infrastructure was seen as a factor resulting in non-implementationof approved FDI proposals, it is not clear whether infrastructure is the key
CHAPTER-5
An Assessment of FDI Flows

������������� ����������
reason for Bangladesh not attracting FDI according to its potential. Politicalrisks are seen to be still high, but a good growth for some more time shouldmake the economy more creditworthy in the eyes of the international agencies.
Overall, Bangladesh can attract a lot more FDI by bringing about regulatoryand policy clarity in the business environment, given its open policies thatwelcome FDI into infrastructure and participation in privatisation. InBangladesh, with a weak entrepreneurship but strong growth factors, giventhe commitment to not allow the Taka to be overvalued, FDI in export industriescan further the growth effort. Higher growth will, in turn, enhance the potentialof FDI.
5.2 History, Macroeconomic Policies, Regional Markets andPrivatisation Drive FDI in BrazilIn the case of Brazil, except for a brief period in late 1980s and early 1990s, theactual FDI inflows have always been larger than the ‘potential’. Several factorsare responsible for the high FDI flows into the Brazilian economy. The historicaldevelopment of a strong manufacturing base is an important factor. Brazil, likemuch of Latin America, has been open to capital movements and has hadliberal FDI policies for a long time. Indeed, except for short periods, Brazil hasbeen open on the capital account. Brazil’s economy diversified a great dealduring the two world wars, because of the spurt in demand brought in by thewars. The immediate post-war import substitution also contributed to itsindustrial diversification. In the sixties and the seventies, as Brazil openeditself to TNCs, a process of dependent development of Brazilian industry (butwith high growth rates) took place (Evans, 1983). This rapid growth anddiversification, in a period when TNCs were allowed in liberally, was the keyreason for the high FDI stock in Brazil.
Much of the highly profitable and strategic segments of industry were occupiedby TNCs – drugs and pharmaceuticals, automobiles, electrical and electronicgoods, lifestyle products like cigarettes, etc. The public sector dominated oildistribution, refining and many other utilities. Domestic private companies,which had links with TNCs, dominated older industries like textiles, cement,and in retail trade and distribution. A factor that allowed such deep penetrationby TNCs was, besides the technological and organisational superiority, theirfinancial advantages, at a time when domestic abilities were not as advanced.
The liberalisation of the nineties followed the fiscal and macroeconomic non-sustainability of the late eighties. TNCs, already present in the manufacturingsector, are now entering the services sector as well. Such large volumes of FDI

���������������� �����
lead to income payments abroad, but not generation of export revenues. Untila well-functioning, all-American preferential trading arrangement emerges, TNCsand their international marketing networks are an important option for realisinggreater exports.
Earlier FDI inflows into Brazil were designed to serve the entire Latin Americanmarkets, as labour costs were low. The ‘maquiladora’ industries of Mexico,which took off after the emergence of NAFTA had led to a rather large declinein the labour intensive, export enclaves of Brazil. Thus, Brazil did not have theadvantage of a Mexico-type regional market. Despite this, since mid-1990s,FDI inflows into Brazil have been high. The active privatisation of both regulatedand other industries, along with the withdrawal of the state in the face of ahandicapped and much weakened domestic private sector, has been a largecontributor to this FDI. That much of the flows have taken the form of mergersand acquisitions results from the fact that FDI has been pulled in, to a largeextent, by major policy (not limited to foreign investment) and regime changesrather than by growth in the market as such.
Broadly then, in Brazil, big investment came along with vast income outflows.FDI continues to come in areas that are not likely to improve the long-termbalance of payments. The leverage point does not lie in FDI-related policiesper se, but primarily in broader processes. These have to do with two areas .One of them is strengthening of the domestic economic base of internationalagreements and labour market issues that will make Brazilian output(manufacturing, agriculture and services) more competitive internationally. Theother one includes macroeconomic and other measures that can reduce capitalflight and raise domestic investment rates.
5.3 Hungary is Using FDI to Re-integrate, Privatise and Caterto Regional MarketsIn the 1990s, Hungary received high FDI inflows probably reflecting bandwagoneffects and its status as an emerging economy in Eastern Europe and thespecial significance of Germany, France and Austria, re-establishing theirhierarchical relationship with Hungary.5 Besides its own markets, Hungary, asa source of cheaper labour for manufacturing product exports to the richerEuropean countries is an important factor. Hungary-based TNCs cater to thelarger regional markets. Additionally, the vigorous privatisation activity, whichhas put on the block its vast earlier state-run enterprises, has also significantlycontributed to the FDI inflows. In the near absence of a local capitalist class ofsubstance and strength, much of the privatisation of state-owned enterprises(SoEs) would have to take the form of FDI. Lower corporate taxes, state subsidies

������������� ���������
for large-scale investment in high-tech sectors and the ability to keep books ofaccount in foreign currencies in Export Promotion Zones (EPZs), and toovercome foreign exchange risks, seem to add to Hungary’s advantages listedabove. However, it is not clear whether all of these measures are sustainable.
5.4 Growth-oriented Policies and Regulatory Clarity are Criticalfor IndiaIndia is another country which, relative to its predicted FDI, could have attracteda lot more during 1980s and early 1990s. The gap between its potential andactual flows, which had been very large in the eighties, due to severe restrictions,have now narrowed down, as these restrictions gave way in the early nineties.Post-1995, for a short period, FDI inflows showed a spurt. After late 1990s,however, actual flows came down a bit, though remained at a higher levelcompared to 1980s.
Indeed, if the current lack of regulatory and policy clarity in areas like power,water, sanitation, roads and airports can be overcome, increases in FDI arepossible. It may be recalled that privatisation-related FDI inflows have notbeen as high in India as in many other project countries. Similarly, there aremany sectors, especially services – banking, insurance and real estate – where,with liberalisation, more FDI can possibly flow in. With the industrial growthdownturn since 1998, FDI potential may well have fallen. But, a significantincrease may even now be possible, if the lack of policy and regulatory claritythat restricts private investments, in general, is overcome.
While policy changes and regulatory clarity can lead to higher FDI inflows intoIndia, (especially through the privatisation route), policies to enhance growthare also critical. These will enhance the potential of the country to attract FDI.Many believe that the rate of growth of the economy can be enhancedsignificantly through a better policy mix. Enlarging the market size is critical forIndia to be in the same league as China.
5.5 Growth-oriented Macro-policies are Needed in South AfricaIn the case of South Africa, the realised FDI has been much below the“potential”. As mentioned, our FDI figures are net, rather than gross, andthere was a substantial ‘retirement’ of FDI, because many companies changedtheir headquarters to UK and Netherlands, as the apartheid regime gave way,resulting in negative inward FDI flows. Since then, other factors, like increasingcrime and law and order problems, would have restricted FDI too much belowits potential. In South Africa, the focus should not be so much on FDI-relatedpolicies as much as on more general policies which enhance growth, investment,and especially, exports.

����������������� �����
Apart from these, a few other issues may need to be sorted out. South Africa isthe only one among the project countries that has restrictions on TNCs insome sectors regarding local borrowing, hiring of minimum number of localemployees, ownership of immovable property and maintaining a capital base.Besides, there is evidence of significant regulatory uncertainty in the servicessector. It is important for the policy makers to ascertain the extent to whichsuch restrictions and uncertainties have impeded FDI inflows and take correctiveaction.
South Africa has a dominant and focal status within the region and has a greatpotential for economic development, given its size, resources, location andskills (which, of course, need to be improved). But, premature liberal capitalaccount policies have contributed to capital flight and a reduction in the growthpotential.6 Besides, social unrest too has taken its toll. Thus, apart from a fewFDI policies referred to above, overall growth and development policies areimportant.
5.6 The Tanzania Case Requires Further ExplorationA comparison of the potential and actual flows of FDI into Tanzania is verydifficult, as information required for assessing the potential is not available.Broadly, it seems that the realised FDI is lower than what could be achieved.Higher growth rates have enlarged the market in recent years, but have not ledto a significant increase in FDI inflows. It is possible that the ‘tax-break’competition in the region to attract FDI put countries with infrastructure andskill linked constraints, such as Tanzania, at a disadvantage. This may beparticularly relevant now, as trade barriers within the region are breaking down.For tradables, FDI can flow to most attractive locations and cater to the region.Perceptions of high political risks add to this disadvantage of the nation.
5.7 Zambia Exemplifies a Case of Governance FailureZambia went through major stress during the nineties, with economic growthhaving fallen dramatically before it recovered somewhat from the majorcontractionary structural adjustment and ‘stabilisation’ that the economy wentthrough. The large capital flight from Zambia was also a result of this macro-economic instability. High inflation, till the contractionary policies broughtabout severe deflation, underlies these large variations.
Nonetheless, if we focus on 1990s alone and disregard the large fluctuations inthe earlier period, potential FDI seems to be higher than what has been achieved.Since resource-seeking is the key driver of FDI here, a fall in the internationalprices of copper would also have led to limited FDI inflows in the country.

������������� ����������
More important than FDI policies, the larger issues of governance need to bedealt with.
In many African countries, and more so in Zambia, the problem is a more basicone, of the country lacking the structure to retain capital within the economy.Inappropriate stabilisation programmes, and especially, structural adjustment,that assume the existence of an ever ready private sector, have furthercontributed to the problem.

���������������� �����
The last section analysed FDI inflows into the project countries vis-à-vis theirpotential and identified a few elements that could have led to these gaps. Thissection views the key insights from the synthesis of the seven project countriesin the context of 1990s, when, worldwide, a liberal policy agenda had becomeacceptable. The insights are, however, also drawn from the experiences ofother countries.
The decade of 1990s, which is also the period of this study, is remarkable inmany ways. The period from about late 1980s to mid-1990s saw many LDCssubstantially liberalising their economies and attempting to ‘globalise’. In manycountries, these changes were linked to the ‘stabilisation’ programmes of theIMF and the World Bank. In the East Asian economies, there were attempts toglobalise, after a very successful period of exports-led growth from 1960s and1970s that had come from within these economies.
Thus, today, in the depressionary situation, globalisation is facing significantdifficulties. But, the liberal agenda of privatisation, increased foreign investment,both direct and portfolio, and increased openness on both trade and capitalflows continues to be actively sought and pushed, with some significantreversals, such as the re-imposition of capital controls in Malaysia. Highexpectation of large FDI inflows in such a scenario may be misplaced.
With practically no exception, nearly all countries turned towards the liberalagenda. In most of them, prior state failure (of varying degrees) had beensignificant and was an important contributory factor. The benefits were thenperceived as being automatic – an increased access to foreign savings to raisethe already high investment rates even further and, hence, of the prospects forhigher growth and greater share of the world market. The ease of repatriatingfunds and low tariffs have been identified as some of the key enabling factors.
6.1 Role of Policy Liberalisation in Attracting FDIThe debt crisis of the early 1980s, which had severely affected the LatinAmerican countries, reduced the share of LDCs for almost a decade thatfollowed. Virtually all countries had become distinctly open to FDI in the 1990s.In some countries, such as India, the change from highly restrictive policies to
CHAPTER-6
Conclusion and Policy Recommendations

������������� ����������
very open regimes has been dramatic. Indeed, today, among LDCs, there is averitable ‘incentive competition’ that has come about as LDCs vie with oneanother, through tax and fiscal concessions and other incentives, to attractFDI and multinationals.
However, we have seen that net flows of private capital in the developingcountries have been rather small. FDI has had a share of around 20 to 25percent LDCs, as a whole, if the special case of East Asia is kept aside. Assuch, there is really no case for the contention that FDI, per se, can solve theproblem of investment though FDI shares of LDCs, as a whole, have gone upin 1990s.
In the project countries, structural adjustments, privatisation and liberal FDIpolicies have resulted in large FDI flows, particularly in the services sector.Privatisation has been one of the most important causes of FDI in recent years.Among the project countries, except in India and Bangladesh, privatisationhas been quite significant and has resulted in private flows, especially foreignflows. In all the project countries, cross-border M&A activity has enhancedthe privatisation process, Bangladesh being the only exception. FDI is crucialfor globalisation of the services sector, it being one of the most importantamong non-tradeable sectors.
Besides, in many of the project countries, post-adjustment, fiscal stabilityseems to have been achieved, at the expense of compressing public expenditure,at a time when public services are either deteriorating or are not growing rapidlyenough. A tight monetary policy may have been good for controlling inflation,but may have reduced investment through a credit squeeze. Slower rates ofdomestic investment often result in lower FDI inflows.
Most importantly, the fluctuations in private capital inflows still need to berecognised. Fluctuations in FDI flows into LDCs have been high; countrieswith smaller volumes of FDI have experienced larger fluctuations in FDI inflows.Significant dependence on FDI to bridge the investment gaps in such a scenariocan be quite problematic. A fact that is not generally admitted, or evenrecognised, is that in inward capital movements to LDCs that have typicallyfollowed growth or liberalisation on the capital account, or both, have, after awhile, reversed in many cases. Overall, however, FDI can raise domesticinvestment, provide additional financing or achieve some combination of thetwo. This, however, is only possible given the ‘correct’ internal economicconditions.

������������������ �����
The experience of the project countries suggests that market-seeking has beenthe key driver for recent investment inflows. This is followed by naturalresource-seeking in the African countries and Bangladesh, and in a limitedway, efficiency-seeking in countries like Brazil, Hungary, India and South Africa.The policy focus should, however, be on efficiency improvement and marketgrowth. Besides, where resource-seeking possibilities exist, policy constraintsfor efficient utilisation of these resources by domestic and foreign entities arecritical. Market-seeking preferences are also met when countries are wellintegrated with the others in the region.
Apart from the two South Asian economies, India and Bangladesh, the othernations are rapidly getting integrated with the regional economic systems.While such integrations can create a potential for FDI inflows due to marketcreation, other features (e.g., skills, infrastructure, etc.) may be required tobecome a hub for FDI to cater to local markets. Prima facie, while South Africa,Hungary and Brazil seem to be equipped to take on this role, Tanzania andZambia are not very attractive in this respect. The role of infrastructure iscritical even for countries like India and Bangladesh, which are not yet a part ofan integrated regional market where export-intensive FDI can potentially beattracted. Thus, factors like infrastructure generate positive externalities forboth market and efficiency-seeking FDI.
Overall, there is not much difference in the FDI-specific policies adopted bythe project countries. All the countries have liberalised these policies to ahigher or lower degree. Only marginal improvements may be necessary, as FDIpolicies are already liberal. Some of these have been highlighted in the contextof specific countries in the last section.
In general, policy liberalisation on this front seems to be desirable, except forthe full capital account convertibility. As of now, capital account seems to befully convertible only in Zambia. Tanzania plans to do so soon, while policiesare very liberal in other countries, especially in South Africa. The move to fullconvertibility needs to be cautious and requires to be preceded by maturing ofcapital markets and establishment of regulatory structures.
Growth-oriented policies with high rates of domestic investment will go a longway in attracting FDI. Since privatisation and infrastructure provision is criticalin many respects, regulatory clarity is critical for attracting both domestic andforeign capital. In the absence of such clarity, investment may not flow in evenwhere market/structural potential exists.

������������� �����������
The civil society survey has shown that the respondents are largely positivelyoriented towards FDI in all the countries studied. However, it does havecertain specific concerns related to FDI’s contribution to the economy. Theseconcerns are reflected in its orientation towards having some constraints inthe functioning of FDI firms. Civil society perceptions, it appears, have beenshaped by a combination of the current economic climate of greater liberalisationand openness in economic policy and, perhaps more importantly, on the actualexperiences of their countries.
Consequently, studying the experiences across countries has two advantages.Firstly, it allows us to better appreciate the concerns of civil society. Secondly,it enables us to draw important policy conclusions directly from specificexperiences, rather than from abstract theories.
Civil society plays an important role in shaping public opinion in the long run.An understanding of what its perceptions are and how they are likely to evolvewill also better enable us to gauge public opinion. Inasmuch as public opinionshapes long term economic policy, it also allows us to assess the directions inwhich policy is likely to evolve in a range of countries. In other words, sensibleand sustainable policy is one that takes into consideration the ground realitiesof the sector and in the country. These ‘realities’ not only include the economicconditions and international business environment, but also public opinion.
The objective of this paper, as mentioned, is to recommend policy that issensible, sustainable and will allow FDI to maximally contribute to the progressof the host countries. The experiences of specific sectors in the differentcountries have yielded a rich set of insights. We find certain policies that havea positive impact, those that have a negative impact and another set that is notlikely to have had any impact.
6.2 Policy Recommendations1. The governments should interact closely with civil society. This will: (i)
enable a better appreciation in the public of the many facets of policyformulation, and (ii) enable the government to rate public opinion in abetter way.
2. Provide an enabling environment for better and more efficient economicactivity. The enabling environment includes: (i) education, (ii)infrastructure, (iii) good governance, and (iv) reduction of crime. (e.g.Indian software industry, tourism in Zambia)
3. Low government intervention allows private efforts to flourish. Thesecould be through international firms or domestic entrepreneurial initiatives(e.g. Indian IT industry, tourism and agro-processing in Zambia)
������������������ �����
4. FDI contributes the most in an open environment; trade liberalisationallows countries to maximise long term gains. However, in the short term,countries should expect a negative impact on domestic industry (e.g.telecom in Brazil, cement in Bangladesh)
5. Openness in trade, however, is a two-way street. If, for instance, Bangladeshwere to open its borders to Indian cement imports, without an opening ofIndian imports to (say) Bangladeshi textiles, then the gains will not occur.
6. Short run opportunities can be used to create long term strengths with thehelp of FDI (e.g. RMG in Bangladesh)
7. Even in the presence of infrastructure and ground-level constraints, apolicy of openness to FDI can create economic strengths (e.g. Zambianagro-industry)
8. Better marketing networks are a two-way street. While they offer highexport opportunities, they also may lead to greater imports. However, thenet effect is likely to be positive. Trying to have dual policies – encouragingexports and limiting imports – is not likely to yield long-term gains (e.g.Brazilian telecom, South African food and beverages sectors).
9. Many inequalities remain in international trading arrangements, and theseare strongest in the agriculture sector. These inequalities (such as limitson imports in developed countries, subsidisation of developed countryexports, etc.) negatively impact liberal policy formulation in developingcountries. Developed countries would do well to appreciate that theirdual policy of openness, when it suits them, and controls, when it doesnot, not only harm their credibility, but also have a strong negative impacton developing countries (e.g. South African food and beverages sector).
10. In some sectors, such as finance, good regulation is a necessary conditionfor not only FDI to be successful, but also for sustainable growth. Agovernment devoting more efforts to good regulation is likely to yieldmore FDI than creating specific policies aimed at attracting FDI (e.g.financial sector in Tanzania).
11. Gains from privatisation have also been documented, but these gains arethe most when public sector monopolies are not converted into privatesector ones. Breaking up large public sector organisations into more thanone competing entities is a good route. (e.g. mining in Zambia)
12. High level of incentives may attract FDI, but it also generates negativedomestic concerns about the overall benefit of FDI. (e.g. mining inTanzania)
13. Complementary sectors and activities have to be functioning properly,before FDI can be expected to make a strong positive impact. (e.g. powerproduction and distribution in India, telecom inter-connectivity inBangladesh)

������������� �����������
14. Advice from international experts should be taken, but it should also be inline with ground level realities. Civil society and domestic experts shouldbe incorporated in policy formulation that is more in line with the conditionsin a country. (e.g. power production in India)
15. FDI has a positive impact across the economy, such as in complementarysectors. (e.g. Tanzanian Telecom)
16. Un-competitive domestic base would tend to lose out in the presence ofgreater FDI. All available evidence would support the view that economiesare better served if reallocation of productive capacity towards moreproductive sectors occurs. Civil society should be able to appreciate thatre-allocation of resources is an integral part of economic growth. (e.g.Brazilian telecom manufacturing sector, South African auto industry )
17. Transfer-pricing practices of the TNCs that limit host government abilitiesto gain tax revenues also create a negative perception towards FDI in theeyes of civil society. These are unethical and sometimes illegal too. Bothdeveloped and developing countries need to co-ordinate their activitiesto limit such practices. (e.g. Brazilian auto industry)
18. If given a relatively free hand (not prevented by many rules and regulations),greater economic openness generates its own ‘pull’ for greater FDI, therebybenefiting all. In large markets, merely opening up of the economy will leadto greater FDI (e.g. Brazilian and Indian auto industry)

PART-II

������������� �����������
CHAPTER–7
Global and Regional FDI Flowsand Performance
7.1 Global Trends in FDI Flows
In 2000, global FDI inflows increased by 18 percent, faster than economicaggregates such as the world production, capital formation and trade. Theinflows reached a peak in 2000, plummeted by half in 2001 and by another fifth(of the 2001 level) in 2002. The fall in 2001 was the first fall in inflows since 1991and outflows since 1992. The driving force behind the decline in flows since2001 is a slowdown in the world economy and weak stock markets, which inturn led to a slowdown in mergers and acquisitions (M&As) activity. Thedecline in FDI inflows to developed countries was much sharper than that todeveloping ones, which experienced increasing FDI flows in 1990s. Incidentally,since 1993, FDI to developing countries as a group has been larger than aidinflows. In 2000, it was ten times larger than ODA.
Within the developing countries, however, FDI inflows have been uneven, asthe next two sections highlight.
Charts 7.1 and 7.2 show that most FDI in 2001 and 2002 has flowed into developedcountries and they have a larger share in global FDI than developing countriescombined.
Chart 7.1: FDI Inflows 1991-2002
Source: UNCTAD World Investment Report (WIR) 2003

� ���������������� �����
Global FDI did not only increased absolutely, but also in relative terms comparedto global gross domestic product (GDP) as well as gross fixed capital formation(GFCF). As a percentage of global GDP, both inward and outward FDI stockgrew in 1990s. Inward stock increased by more than two times, from 9.3 percentin 1990 to 22.3 percent in 2002, and outward stock grew by more than two-and-half times, from 8.6 percent in 1990 to 21.6 percent in 2002. As a percentage ofthe global GFCF, FDI inflows grew from an annual average of 4.4 in 1991-96 to12.2 percent in 2002 and FDI outflows grew from 5.0 percent in 1991-96 to 13.6percent in 2002 (an increase of nearly 3 times of both the figures).
7.2 Regional Trends in FDI Flows
Though almost all developing countries had undertaken liberalisation measuresto attract FDI in 1990s, the flows, performance and impact of FDI vary amongthe different regions. In this section, we examine FDI trends and performancesin four host developing regions of the world: Asia and the Pacific, Latin Americaand the Caribbean, Africa, and Central and Eastern Europe. Generally, all theregions have experienced an increase in both absolute and relative FDI in1990s.
FDI flows to Asia and the Pacific were US$102bn in 2001 compared to US$134bnin 2000. In 2002, flows into this region fell (by 11 percent, to US$95bn), likeother regions of the world, but the region weathered the downturn better thanthe others7. The decline was uneven across sub-regions, countries andindustries.
Latin America and the Caribbean saw a tripling of their FDI inflows in thesecond half of 1990s. In 1999 FDI inflows to this region reached a record levelof US$90bn, which was a 23 percent rise over 1998. Brazil and Argentina werethe two largest recipients in this region. A large part of the inflows came in theform of M&As. Privatisation was important in Argentina, Brazil and Chile, butfor the Andean Community countries, privatisation inflows remained low. Infact, the sharp increase in inflows in 1999 was due to only three major cross-border acquisitions in this region. FDI inflows to this region fell in 2002, for thethird consecutive year, by a third, to US$56bn. The decline was widespreadacross the region and mostly concentrated in services, thus countries in whichservice industries are important, like Argentina, Brazil and Chile, the declinewas more pronounced than in other countries of the region.
The African continent remained a small player in the global FDI game. However,the countries from the continent did not fare badly when we compare the ratio,of FDI inflows to their economic size, with other developing countries. On the

������������� �����������
contrary, some African countries received more FDI relative to GDP than theaverage developing country. UNCTAD World Investment Report (WIR) 2001reports that in 2000, FDI flows to Africa declined for the first time since the mid-1990s from US$10.5bn to US$9.1bn. In 2001, the inflows to Africa jumped fromUS$9bn to US$19bn but in 2002 fell again to US$11bn. As a result, the region’sshare in global FDI inflows fell from 2.3 percent in 2001 to 1.7 percent in 2002.
In 2002, Central and Eastern Europe (CEE) experienced an increase in FDIinflows to US$29bn, rising in 9 countries while falling in 10 others. Firms inseveral of these CEE countries – particularly the EU accession countries – arenow cutting down activities which are based on cheap unskilled labour andexpanding higher value added activities to take advantage of the educatedlocal labour force.
A look at the relative inward FDI figures: FDI inflows as percentage of GFCFwas the highest for CEE in 2002 followed by Latin America and the Caribbean,and Africa. Asia and the Pacific had the lowest FDI inflows as percentage of itsGFCF in 2002. This figure indicates how important FDI has been in totalinvestment of a country or region. In all the regions, this figure had risen in thesecond half of 1990s but declined in early 2000s, which also signals a slowdownof global FDI inflows. FDI inflows were nearly one-fourth of GFCF in LatinAmerica in 1999, declined sharply in the years that followed.
Source: UNCTAD WIR 2003
823.8
589.4
83.728.725
106.9
18.8 11
651.2
5695.1
460.3
0
100
200
300
400
500
600
700
800
900
World Developedcountries
Africa Latin Americaand the
Caribbean
Asia and thePacific
Central andEasternEurope
Host Regions
US
$ b
n
2001
2002
Chart 7.2: FDI Inflows to Host Regions

������������������ �����
Within Asia and the Pacific, FDI inflows as a percentage of GFCF rose from 6.2in 1991-96 to 13 (an increase of about two times) in 2000 but declined to 7.2 in2002 (a decline by about half). In Latin America and the Caribbean, FDI inflowsas a percentage of GFCF increased from an average of 8.1 in 1991-96 to 25.8 in1999 (an increase of more than three times) but by 2002, this had declined to14.6 in 2002 (a decline by nearly half times). Within Africa, FDI inflows as apercentage of GFCF increased from an average 5.3 in 1991-96 to 11.8 in 1999 (anincrease of more than two times) but declined to 8.9 in 2002 (a decline by aboutthree-fourth times). In CEE FDI inflows as a percentage of GFCF rose by morethan three times from 5.8 in 1991-96 to 18.5 in 1999 but declined by about onepercentage point to 17.2 in 2002.
7.3 Trends in Large Emerging Markets and Least DevelopedCountriesThe increase in FDI flows was spread unevenly among the different groups ofdeveloping countries in 1990s. In particular, least developed countries (LDCs)8
received very little of the increasing inward FDI in this period. Growth in FDIinflows to the LDCs have been poor in 1990s but FDI has played an importantrole in overall capital formation in some of these countries as shown by theirhigh share of FDI in GFCF9.
Actual FDI flows into the 49 LDCs as a group increased from an annual averageof US$0.6bn in 1986-90 to that of US$3.6bn in late 1990s. Even within thisgroup, FDI flows to LDCs are highly concentrated, and interestingly in 2001,more than 90 percent of FDI inflows were in the form of greenfield investment.In 2002 inflows to the LDCs declined by 7 percent to US$5.2bn. The declinewas 3 percent in LDCs in Africa and 50 percent in those in Asia and the Pacific.
Due to increasing FDI flows and declining ODA, the importance of ODA inexternal financial flows has been declining, though it still remains the largestcomponent of resource flows to LDCs.
Most FDI to LDCs has been resource seeking, in sectors like oil and miningand took the form of greenfield investment. However, the share of LDCs in totalFDI inflows to developing countries declined from 2.2 percent during 1986-1990 to 2.0 percent during 1996-99, because FDI to the bigger emergingeconomies grew faster. By large emerging markets (LEMs), we imply developingeconomies with considerable market size, which is defined by the purchasingpower of the people. LEMs appeared to attract more FDI than LDCs both interms of absolute numbers and in proportion of GDP as well as GFCF. LDCsreceived a tiny proportion of FDI from the M&As boom of late 1990s and 2000,which pushed up the level of global FDI inflows. Most M&A deals in developing

������������� �����������
countries were conducted in Latin America and the Caribbean with two LEMs,Brazil and Argentina, dominating the scene. Privatisation has been the mainvehicle for M&A in LEMs. Privatisation FDI was also important for transitioneconomies, particularly Hungary, and for some Asian countries. As notedearlier, M&As were not important for LDCs, the reasons being the slow pace ofprivatisation, poor investment climate and a general lack of attractive investmentopportunities.
The next section examines the sectoral FDI trends across the globe and in theIFD project countries.
7.4 Sectoral FDI Trends
Inward FDI to developing countries falls into three broad categories: investmentin the primary sector: either in the production of agricultural goods or in theextraction of minerals and other natural resources; investment in manufacturing,including, for example, the production of textiles and clothing and agro-processing; and investment in the tertiary or services sector, which includesfinancial services and tourism and utilities. FDI inflows to developing countrieswere distributed among the three sectors though some sectors received higherFDI than others.
Table 7.1: FDI in LDCs and other Developing Countries
Item
Average annual growth inFDI inflows, 1986-1999
FDI inflows as a % ofgross domestic capitalformation, 1997-99
LDCs
20%
27 of the 49 LDCs experienced agrowth rate of more than 20 percent.Wide variations: e.g. Burundi saw adecline of 33 percent and Cambodiasaw an increase of 474 percent.Wide fluctuations in growth rates.
8 %
16 LDCs attracted more FDI as apercentage of gross capital formationthan all developing countries taken asa whole.
Other developingcountries
22%
12%
Source: FDI in Least Developed Countries at a Glance, UNCTAD

������������������ �����
The latest trends in FDI suggest that the share of the services sector in totalFDI stock10 amounts to 60 percent at the global level, whereas it was less than50 percent a decade back. In contrast, the share of manufacturing in the FDIstock has declined to 35 percent in 2001 from more than 40 percent in 1990, andthat of the primary sector fell to 6 percent from 10 percent in the same period.For developing countries, services account for 52 percent of the inward FDIstock in 2001 compared to 41 percent accounted by manufacturing and 7 percentby the primary sector.
Within the services sector, there was a decline in the importance of traditionalactivities viz. financial and trading services and a rise in the importance ofsome other activities. The finance and trading stock decreased from 65 percentof total inward services stock in 1990 to 45 percent in 2001, while that ofservices such as power generation and distribution, telecommunications andbusiness services increased from 17 to 44 percent in the same period. Withinthe manufacturing sector two activities: chemicals and electronics account forone third of manufacturing FDI inward stock in 2001.
Of the IFD project countries, Brazil had the highest proportion of FDI cominginto the services sector, at 80 percent, mainly as a result of the privatisationprocess. The other two large emerging markets, India and South Africa, showedmixed patterns of investment in manufacturing and services. India has seenlarge amounts of FDI in the telecommunication, power, oil, automobiles andinformation technology sectors. These are all either new industries or havejust recently opened up to private investment. South Africa received most FDIin the telecommunication, energy and oil sectors, followed by food andbeverages and automobiles.
In Hungary, the only transition economy in the study, investment flows werethe largest in the manufacturing sector during 1990s. Investment was high inthe automobiles sector and electrical products, among others. However, thispattern changed at the end of 1990s, when services dominated FDI flows andcompanies in the automobiles and electrical sectors relocated to other countries.
The LDCs also experienced mixed patterns of investment. For Zambia, inparticular, mining constituted a large proportion of FDI, followed by tourismand agriculture. In Tanzania, investment in natural resources has been overtakenby investment in services, particularly in the telecommunication and financialsectors. FDI in agriculture has been low. Bangladesh has had most investmentin gas and power, while its most export-intensive sector, textiles, has received

������������� �����������
surprisingly little foreign investment. One problem faced by the LDCs, however,is that the proper data on sectoral FDI is lacking.
These sectoral patterns suggest that services are very important and thatmajor privatisation efforts will attract foreign investors. However, privatisationraises a number of concerns. These will be discussed later.
Recommendations
� Good information on the sectoral distribution of FDI is needed forgovernments to design effective policies.
� Investment promotion should be based on the sectoral aspects of thenational development plan.
� Economies are dynamic and the features that attract foreign investmentwill change over time. Policies need to be revised according to thesetrends.
� Develop sectoral incentives to encourage investment in sectors withpotential such as information communications technology (ICT) in India.
� Government intervention to support technological upgrading in somesectors may be appropriate, depending on a country’s level ofdevelopment. In other cases, a ‘hands-off’ approach may be moreeffective. In general, governments should play a limited role in dynamicand competitive industries like IT, where regulation can inhibit growth.

����������������� �����
CHAPTER-8
International Developments in Policyand Regulatory Changes
8.1 Regulatory and Policy Changes
Over the past decade, developing countries have increasingly opened up theireconomies to FDI. Of the changes made in FDI policy in recent years, practicallyall have been in the direction of liberalisation. (See Table 8.1: Changes in NationalRegulations of FDI)These changes include:� Minimising restrictions on sectors in which FDI is allowed;� Removing or reducing restrictions on equity structures, caps on the
proportion of foreign ownership and requirements for joint ventures;� Reducing barriers to the repatriation of profits; and� Lifting requirements for local content, value of imports or exports.
Table 8.1: Changes in National Regulations of FDI, 1991-2002
Year 1991 1992 1993 1994 1995 1996 1997 1998 1999 2000 2001 2002
Number of 35 43 57 49 64 65 76 60 63 69 71 70CountriesRegimesthat IntroducedChanges inTheir InvestmentPolicies
Number of 82 79 102 110 112 114 151 145 140 150 208 248RegulatoryChanges
Of which:
More 80 79 101 108 106 98 135 136 131 147 194 236Favourableto FDIa
Less 2 - 1 2 6 16 16 9 9 3 14 12Favourableto FDIb
Source: UNCTAD, WIR, 2003a: Including liberalising changes or changes aimed at strengthening market functioning, as well asincreased incentives.b: Including changes aimed at increasing control as well as reducing incentives.

������������� ����������
The pace of change has varied across regions, but most developing countriesnow have relatively open FDI policies and there is little variation in policiesbetween countries.
Some countries retain restrictions on industries, which are considered to be ofparticular national importance. In China, for example, foreign investment isrestricted in sectors related to “national and economic security”. In India, theagricultural sector remains closed to foreign investment, while Bangladeshdoes not allow investment in banking and insurance.
Some countries have implemented a “second generation” of policies to attractforeign investors. These policies have included the creation of investmentpromotion agencies (IPAs) and the use of other marketing techniques to promotethe country as an investment location. Countries have also tried to reduce theadministrative burden on foreign investors by creating ‘one-stop shops’,centralising the issue of licenses and permits in a single agency, while othercountries have removed licensing requirements as part of their economicliberalisation strategies. A further development has been the use of incentives,such as tax holidays or tax reductions, to attract foreign investors, and thecreation of export promotion zones or special economic zones in whichbusinesses are exempt from certain national regulations and import and exporttariffs. The pros and cons of investment incentives are discussed in section 8.3.
Changes in policies directly relating to FDI have been part of a general trendtowards economic liberalisation and deregulation. Some of the policiesassociated with this shift have had an important impact on the investmentenvironment and have encouraged investors to enter new countries. Theseinclude:
� Capital account liberalisation, which has made it possible for investors tomove money freely into and out of the country.
� Exchange rate liberalisation, which has removed the disparity betweenofficial and black market exchange rates and has improved investors’incentives to export.
� Financial sector reform, including deregulating banking, opening the sectorto competition and freeing interest rates. This has made it easier for investorsto raise finances locally.
� Trade liberalisation, which entails opening up of their borders to trade ingoods by countries, in the last decade, including all the project countries,which are all members of the World Trade Organisation (WTO). This canhave opposing effects on foreign investors: on the one hand, transnationalcorporations (TNCs) that were serving a closed domestic market may now

������������������ �����
face competition from imports. On the other hand, these firms may now beable to reach the larger market of the regional trading bloc.
� Deregulation, which includes reduction of red-tape and simplification ofregulations, thus reducing costs for investors by governments.
� Privatisation and contracting out has opened up the sectors previouslyreserved by governments for foreign investors and presented many excellentinvestment opportunities for global firms.
� Competition, which entails had opening up to competition from foreign anddomestic investors of sectors, which had high degrees of monopoly andconcentration. Countries are introducing or strengthening competition laws,which will benefit competitive firms, both foreign and domestic.
Two other broad initiatives that may encourage FDI are efforts to reducecorruption and to improve transparency in developing countries. Corruptionincreases risks and costs for the investor, both day to day and high-level or“grand” corruption. However, once ‘everyday’ corruption becomes “endemic”in the system – everyone expects others to be corrupt and behave accordingly– it may be extremely difficult to eradicate it. A culture of corruption usuallytakes time to change. Grand corruption has often been associated with theexploitation of natural resources, and some governments and firms have beeninvolved in recent sectoral initiatives to improve transparency in accountingand thus reduce the opportunities for corruption.
Almost all developing countries changed their policies in 1990s due to a varietyof reasons, some international while others domestic. The next section discussessome of the broad reasons for the changes.
8.2 Reasons for the Changes
The reasons behind these global policy trends are both domestic andinternational. At the national level, macroeconomic crises prompted many ofthe changes and created the political will needed to follow the changes. In1990s, many developing countries experienced severe balance of paymentsdeficits, large government budget deficits and high inflation, which promptedthorough-going programmes of economic reforms involving the liberalisationof capital and trade flows.
Some external sectors created direct pressures. The International MonetaryFund (IMF) and the World Bank (WB) have included liberalisation commitmentsas conditions for their loans, notably as part of the Structural AdjustmentProgrammes (SAPs). Zambia, for example, embarked on capital accountconvertibility as part of its SAP.

������������� �����������
Countries have also made liberalisation commitments in trade negotiations atthe regional or international levels. Member states of the WTO have had tomake commitments not just on trade liberalisation, but also on the protection ofintellectual property rights, in the Trade Related Aspects of Intellectual PropertyRights (TRIPs) Agreement, and on phasing out the use of “Trade RelatedInvestment Measures” in the TRIMs Agreement. This Agreement preventsthe use of export, import and local content controls on foreign investors bydeveloping countries after the 2002 deadline. The other WTO agreements,which have some bearing on investment flows are General Agreement on Tradein Services (GATS) and Agreement on Subsidies and Countervailing Measures(ASCM).
FDI has come to the fore as a source of finance for development as it becamemore important compared to other sources. Development aid has been fallingfor the last two decades, although donor countries pledged an increase in aidat the United Nations, Finance for Development Conference in 2002 in Monterrey,Mexico. Inflows of commercial debt have also dropped off from the levels of1970s and early 1980s – both governments and the Bank are conscious of thehigh risks involved in these commercial loans after repeated debt crises indeveloping countries. Furthermore, flows of portfolio investment are perceivedas unstable, and sometimes undesirable, after precipitation of currency crisesdue to rapid investor withdrawals from emerging markets, demonstrated duringthe Asian Crisis, the Tequila Crisis, and most recently in Argentina. Directinvestment has shown itself to be a more stable and reliable form of finance.
Recent academic thinking has drawn the attention of policy-makers to the newphenomenon of global production networks, in which firms locate their differentfunctions in locations across the globe in order to take advantage of thecompetitive benefits of each place. Through FDI, developing countries cantake part in these global networks, which bring with them access to rich markets,new technologies and management expertise. It is partly this new phenomenonthat has shaped policy-makers views of FDI towards positive direction.
At the same time, suspicion of TNCs in governments has gradually been replacedwith the view that TNCs, on balance, can benefit their host economies – a viewthat was based on historical experiences of colonisation, of political interferenceby foreign firms and exploitation of natural resources with little benefit to thehost economy. However, public opinion has not always kept pace with changingopinions in governments: the public tends to be more conscious of the local-level problems and adjustment costs associated with particular investment,while governments may be looking at the bigger picture.

� ���������������� �����
The last two sections have elaborated how most host economies, includingthe developing ones, have undertaken measures to facilitate higher FDI in1990s. Towards the end of 1990s, however, the attention shifted to policy andregulatory measures to benefit from FDI rather than to facilitate higher FDI.
8.3 Competition for FDI among Countries
In this section, competition among countries to attract higher FDI is discussedwith examples from the IFD project countries. To this end, they provide financialand fiscal incentives, undertake corporate restructuring and economic reforms,undertake investment promotion measures and, invite foreign investors toparticipate in the privatisation of state-owned units. Steps that improve theunderlying characteristics of the investment environment will benefit domesticinvestors as much as foreign firms and can be regarded as healthy competition.However, the provision of incentives, which has been an important aspect ofcompetition for FDI, is more controversial. This may create competition amongcountries for incentives e.g., Ramatex investment in Namibia where South Africaand Madagascar were also considered as possible hosts.
Financial and fiscal incentives that are commonly used include:� Direct subsidies to the firm for each job created;� Exemption from import and export tariffs;� Reduced rates of corporation tax;� Tax holidays (tax exemption for a defined period); and� Exemption from labour laws, such as the right of employees to organise.
The provision of incentives may be restricted to certain geographic locations,such as Export Processing Zones (EPZs), or deprived regions, or may be madeavailable to certain types of firms regardless of their location, e.g. exportingfirms. But there are doubts over the effectiveness of incentives in attractinginvestment if fundamental factors, like cost-levels and competitiveness compareunfavourably to other locations. It is only in cases where a number of locationsmeet the firm’s investment criteria that incentives may tip the balance in favourof one or the other location. In some cases, it may be worthwhile to offerincentives to a key or ‘first-mover’ investor, which then attracts other foreigninvestors to the country as suppliers.
Often incentives are used to correct market failures. For example, governmentsoften provide subsidies in the presence of external economies of scale.Incentives are also offered to compensate for deficiencies and distortions in ahost country’s business environment, for example, poor infrastructure and redtape.

������������� �����������
An incentives race among host countries may lead to a “race to the top” ingrants and subsidies or a “race to the bottom” in regulatory measures. Thiskind of race increases the risk that the cost of incentives might exceed thereturn to society. This is one argument against the use of incentives. Besides,it is difficult to gauge the effectiveness of incentives. Developed countriesfrequently employ financial incentives such as outright grants, whereas fiscalincentives are more common in developing countries due to budget constraint.Incentives have not been very successful in influencing the decision of foreigninvestors to invest in a country. Studies show that investment that flows intoa country probably would have flowed even without the incentives11.
There is evidence of incentives in the IFD project countries as well. SouthAfrica and Hungary, for example, offered a variety of incentives to investors.Both the countries introduced tax holiday schemes. The scheme was phased-out in South Africa and replaced with a reduction in corporate tax rates from 35to 30 percent of profits. Competition for FDI can also create incentives waramong subnational units e.g. incentives war among the Brazilian states. Theimplication of this could be severe on a country’s public finances.
Often countries have to remove or withdraw incentives. In Tanzania, thegovernment was forced to remove incentives on petroleum imports for miningcompanies and foreign missions due to reports of abuse of the services bybeneficiaries.
Often incentives help in creating a facilitative environment for investment.Fiscal and regulatory incentives helped to create an attractive investmentenvironment in Hungary. The country provided long tax holidays, which helpedto channelise profits from elsewhere in the country. This was importantespecially for investors planning to carry out further investment andreinvestment of profits generated elsewhere in Hungary. The other importantincentive was establishment of free trade zones. However, the European Unioncriticised both types of incentives in accession negotiations, as they did notconform to the EU incentive structure. These incentives were eventuallywithdrawn by Hungary.
8.4 International Trends
In this section, we set FDI trends in the context of international developments.There have been a number of changes in the organisations and institutionsthat affected FDI in recent years, both directly and indirectly.
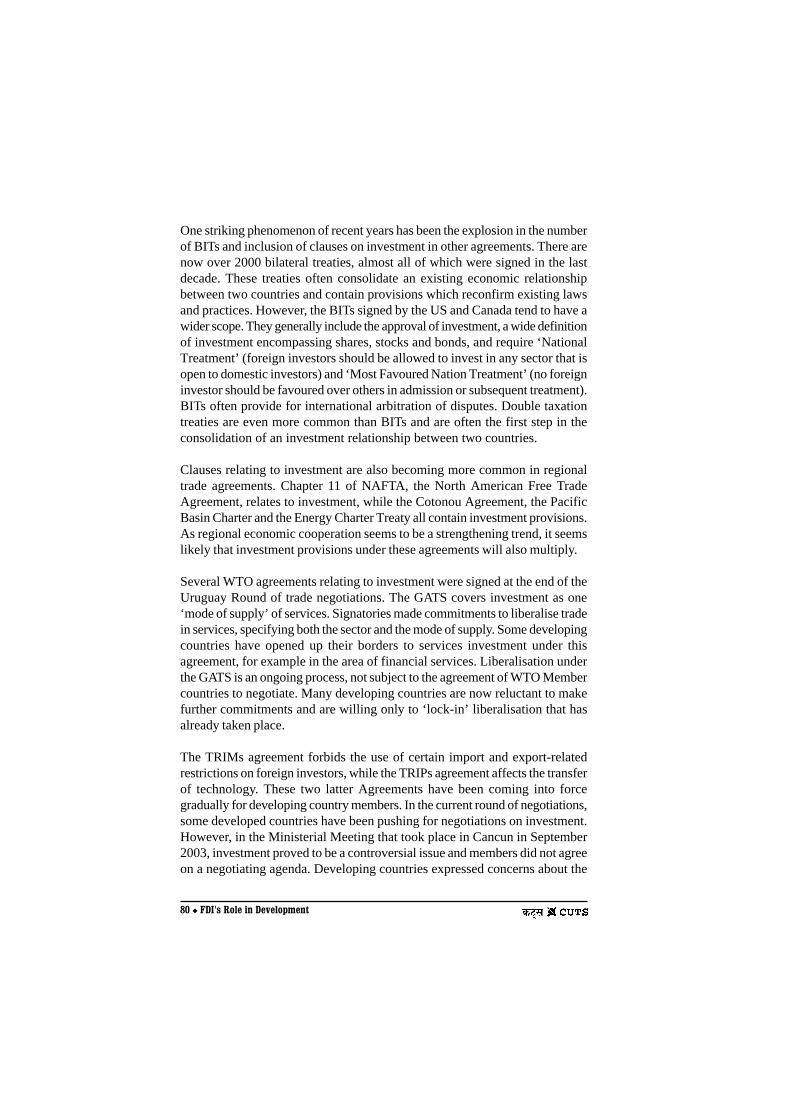
����������������� �����
One striking phenomenon of recent years has been the explosion in the numberof BITs and inclusion of clauses on investment in other agreements. There arenow over 2000 bilateral treaties, almost all of which were signed in the lastdecade. These treaties often consolidate an existing economic relationshipbetween two countries and contain provisions which reconfirm existing lawsand practices. However, the BITs signed by the US and Canada tend to have awider scope. They generally include the approval of investment, a wide definitionof investment encompassing shares, stocks and bonds, and require ‘NationalTreatment’ (foreign investors should be allowed to invest in any sector that isopen to domestic investors) and ‘Most Favoured Nation Treatment’ (no foreigninvestor should be favoured over others in admission or subsequent treatment).BITs often provide for international arbitration of disputes. Double taxationtreaties are even more common than BITs and are often the first step in theconsolidation of an investment relationship between two countries.
Clauses relating to investment are also becoming more common in regionaltrade agreements. Chapter 11 of NAFTA, the North American Free TradeAgreement, relates to investment, while the Cotonou Agreement, the PacificBasin Charter and the Energy Charter Treaty all contain investment provisions.As regional economic cooperation seems to be a strengthening trend, it seemslikely that investment provisions under these agreements will also multiply.
Several WTO agreements relating to investment were signed at the end of theUruguay Round of trade negotiations. The GATS covers investment as one‘mode of supply’ of services. Signatories made commitments to liberalise tradein services, specifying both the sector and the mode of supply. Some developingcountries have opened up their borders to services investment under thisagreement, for example in the area of financial services. Liberalisation underthe GATS is an ongoing process, not subject to the agreement of WTO Membercountries to negotiate. Many developing countries are now reluctant to makefurther commitments and are willing only to ‘lock-in’ liberalisation that hasalready taken place.
The TRIMs agreement forbids the use of certain import and export-relatedrestrictions on foreign investors, while the TRIPs agreement affects the transferof technology. These two latter Agreements have been coming into forcegradually for developing country members. In the current round of negotiations,some developed countries have been pushing for negotiations on investment.However, in the Ministerial Meeting that took place in Cancun in September2003, investment proved to be a controversial issue and members did not agreeon a negotiating agenda. Developing countries expressed concerns about the

������������� ��������� �
overloaded agenda and the negotiating capacity of poorer countries on newissues and whether there were any potential benefits of such an agreement fordeveloping countries.
Governments have been involved in a number of other initiatives at theinternational level to address specific concerns relating to private investment,such as the Organisation for Economic Co-operation and Development (OECD)Guidelines on Multinational Enterprises. These provide a framework withinwhich OECD governments help firms to develop their own codes of conductand a process for resolving concerns. Further, in order to tackle corruption,OECD governments have signed on to the Convention on Bribery of ForeignPublic Officials. In the aftermath of Enron’s collapse, the reporting requirementsfor TNCs have become more stringent and corporate governance regulationare being tightened in the US and Europe. An increasing proportion of fundsare being directed towards improving the environment for the private sector tooperate.
Discussions on corporate social responsibility (CSR) also assume an importantrole in any discussion and debate on investment. There have been extensivediscussions on how to enforce CSR: Should there be host country regulations?Should home countries have any role? Should codes of conduct be included ininternational investment agreements (IIAs)? Should there be guidelines instead,which companies would voluntarily adopt?
Recommendations
� Establish regional cooperation between countries to create awarenessabout the disadvantages and risks of using incentives and to discouragecompetition. Include clauses to constrain incentive races in bilateral,regional or international investment agreements.
� Investment promotion efforts should focus on the country’s underlyingstrengths rather than tax or other incentives. Investment promotionagencies should be strengthened, restructured and given greaterindependence, where needed.
� Streamline business licensing and registration regulations and makeenforcement simple and easy to implement. A one-stop-shop forinvestment approval is a useful step, although governments shouldensure that the one-stop-shop does not become a ‘many-stop’ or ‘full-stop’ shop.
� IGOs should provide training and advice for the negotiation ofinternational investment treaties. These negotiations are often highlycomplex and revolve around technical issues, with which officials from

����������������� �����
developing countries may not be familiar. Some capacity-building fornegotiation was conducted as part of the Doha Round Agenda but moreextensive and continuous training is needed for countries to defendtheir interests in bilateral and regional negotiations.
� IGOs should support developing countries by providing legal adviceand services to countries that do not have adequate financial resourcesor experienced personnel to take part in disputes or negotiations.
� Developing countries might benefit from a revision of the terms of existingtreaties, which would allow them more flexibility, appropriate to theirstage of growth.
� Strengthen and extend partnership efforts to deal with corruption,especially those forms of corruption related directly to foreign investment.

������������� ��������� �
CHAPTER–9
Overview of National Experiences
9.1 Trends in FDI
The project countries differ significantly in terms of the size of the economy,per capita income and industrial structure. In terms of gross national income,India is the largest economy followed closely by Brazil, and Zambia is thesmallest. However, if we consider per capita income, Hungary has the highestamong the project countries, followed by Brazil and South Africa. During 1980sand 1990s, India and Bangladesh experienced a rise in the rates of economicgrowth, Brazil experienced a marginal increase in the growth rates with
Table 9.1: Macro Characteristics of the Project Countries
Indicators/Country Bangladesh Brazil Hungary India South Tanzania ZambiaAfrica
Population (2002)(in millions) 136 174 10 1048 44 35 10
Surface area (2002)(Thousand sq. km) 144 8547 93 3287 1221 945 753
Population density2002) (People per sq.km of land area) 1042 21 110 353 36 40 14
Gross US$ bn 48.5 497.4 53.7 501.5 113.5 9.6 3.5NationalIncome US$ per(2002) capita 360 2850 5280 480 2600 280 330
PPP Gross US$ bn 234 1266 130 2691 430 19 8NationalIncome US$ per(2002) capita 1720 7250 12810 2570 9870 550 770
Gross % growth 4.4 1.5 3.3 4.4 3.0 5.8 3.0DomesticProduct Per capita(2001-02) % growth 2.6 0.3 3.5 2.8 2.2 3.6 1.3
Source: World Bank World Development Report, 2004
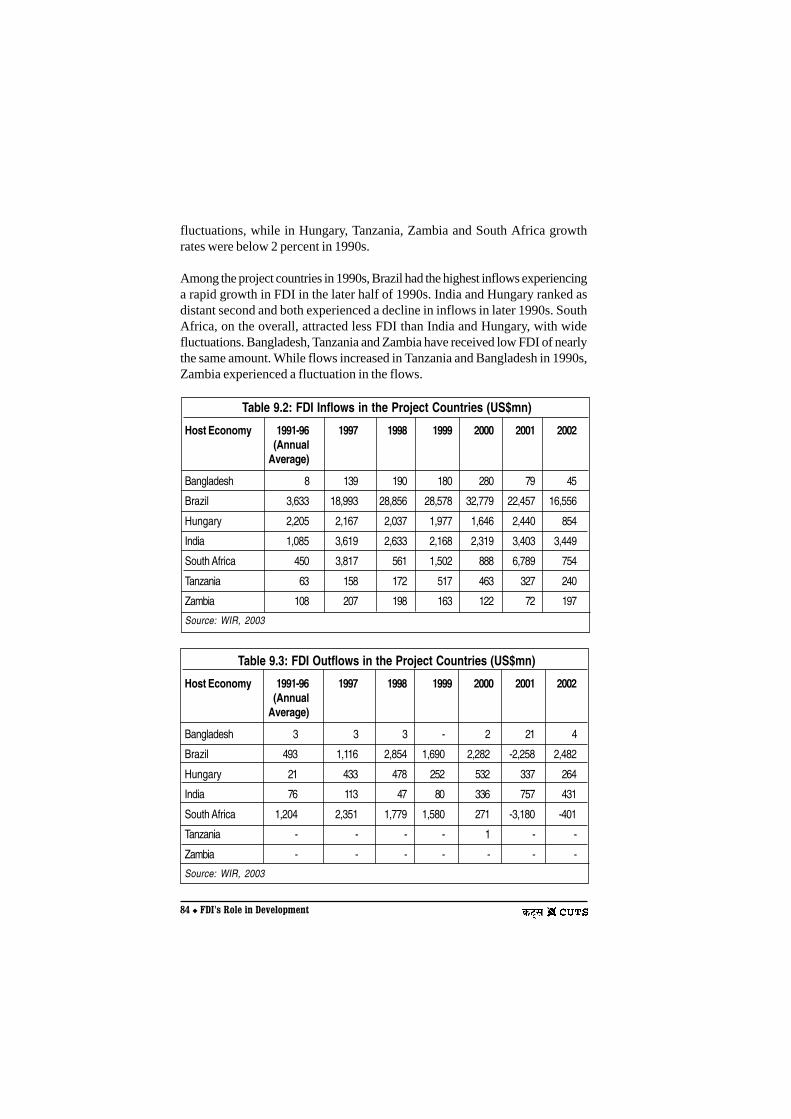
���������������� �����
fluctuations, while in Hungary, Tanzania, Zambia and South Africa growthrates were below 2 percent in 1990s.
Among the project countries in 1990s, Brazil had the highest inflows experiencinga rapid growth in FDI in the later half of 1990s. India and Hungary ranked asdistant second and both experienced a decline in inflows in later 1990s. SouthAfrica, on the overall, attracted less FDI than India and Hungary, with widefluctuations. Bangladesh, Tanzania and Zambia have received low FDI of nearlythe same amount. While flows increased in Tanzania and Bangladesh in 1990s,Zambia experienced a fluctuation in the flows.
Table 9.3: FDI Outflows in the Project Countries (US$mn)
Host Economy 1991-96 1997 1998 1999 2000 2001 2002(Annual
Average)
Bangladesh 3 3 3 - 2 21 4
Brazil 493 1,116 2,854 1,690 2,282 -2,258 2,482
Hungary 21 433 478 252 532 337 264
India 76 113 47 80 336 757 431
South Africa 1,204 2,351 1,779 1,580 271 -3,180 -401
Tanzania - - - - 1 - -
Zambia - - - - - - -
Source: WIR, 2003
Table 9.2: FDI Inflows in the Project Countries (US$mn)
Host Economy 1991-96 1997 1998 1999 2000 2001 2002(Annual
Average)
Bangladesh 8 139 190 180 280 79 45
Brazil 3,633 18,993 28,856 28,578 32,779 22,457 16,556
Hungary 2,205 2,167 2,037 1,977 1,646 2,440 854
India 1,085 3,619 2,633 2,168 2,319 3,403 3,449
South Africa 450 3,817 561 1,502 888 6,789 754
Tanzania 63 158 172 517 463 327 240
Zambia 108 207 198 163 122 72 197
Source: WIR, 2003

������������� ���������
In almost all the countries, except Bangladesh, cross-border M&A activitiesrose in 1990s. M&A flows have been significant in Brazil, Hungary and SouthAfrica in the second half of 1990s. FDI in Bangladesh was mostly in greenfieldprojects, mainly in the energy sector (gas and power) and telecommunicationsand cement. Outward FDI was in form of M&As for South Africa and Brazil,and to a lesser extent for India. In any case, outward FDI was lower in Indiathan the other two countries. Outflows from Hungary are less oriented towardsM&As, and from Tanzania and Zambia it is practically nil.
Inward FDI stock as a percentage of GDP was 58 percent for Zambia, 40 percentin Hungary and South Africa, and 22 percent in Brazil in 1999. For othercountries, especially in South Asia, this figure was significantly lower.
9.2 Changes in Policies Related to FDI
Each project country has a different historical experience with foreign investors,and continues to use different approaches to deal with investors. Howeversome similarities can be drawn, and study of the various national experienceswith foreign investors, can provide illustrative examples for other countries.Common for all countries in the project, as is common for most developingcountries, is that they have rapidly opened up their economies to foreigninvestors during 1990s.
This chapter highlights some of the policy changes adopted by the countries.Some of the broad initiatives are as follows:� All the countries have undertaken significant trade liberalisation measures
by reducing or removing quantitative restrictions and tariffs and gettingactively involved in regional trade agreements.
� Almost all countries undertook current or capital account liberalisation.� All countries have sought to privatise their state-run units.
Laws and regulations affecting investment are also important. The projectcountries modernised and revamped laws related to business and investmentto bring about a facilitative investment environment, and the need to implementthem effectively. The following laws were highlighted by the project countriesas the ones that deserve attention:
� Labour legislation/protection with clear regulations that are implementedconsistently.
� Intellectual property rights legislation that provides protection for investorswhile supporting the country’s technological development.
� Review the system of corporate law, including bankruptcy laws, to ensurethat investors have adequate legal protection.

����������������� �����
� Design and implement competition policies that protect consumers whilegiving a fair deal to businesses.
� Consider laws that tax short-term capital flows in order to discourage capitalflight.
� Entrench the principle of prompt and fair compensation for expropriation ofinvestors’ property in word and practice of the law.
The reasons for adopting liberalisation measures differ for different countries,e.g. impending economic crisis led Bangladesh, Tanzania and Zambia toimplement structural adjustment programmes prescribed by the InternationalMonetary Fund/World Bank (WB), whereas in South Africa, the newgovernment, in 1994, abolished policies which promoted apartheid and adoptedfinancial liberalisation. These incidents opened up opportunities for foreigninvestors to invest in these countries.
India’s New Economic Policy/New Industrialisation Policy was adopted in1991 and implemented after the country approached the IMF for a loan followinga foreign exchange crisis in the country. The new policies opened the doors toforeign investors to invest in the previously restricted productive activities.
For Hungary, the watershed in policy regime was the beginning of the processof transition of the economy from a state-controlled to a market economy withthe help of the Szechenyi Plan. (Refer to Table 9.4)
Country
Bangladesh
Brazil
Major Reforms
Structural Adjustment Programmes
“Internationalisation” of the Economy
Comment
WB/IMF induced policies; Vigoroustrade liberalisation, economic growth andpoverty reduction programmes.
Significant increase in FDI inflows,especially since 1994. New constitutionin 1988 made changes in the regulationof foreign capital; consitutional review of1993 and amendments of 1995 removedrestriction on foreign capital. In 1994-98,restrictions on extraction activities andon services progressively reduced.
Table 9.4: Landmarks in Policy Changes in 1990s: The IFD Project Countries
../..

������������� ��������� �
In South Africa the new government undertook overall economic growth anddevelopment strategies, which created conditions to facilitate higher FDI inthe country. Brazil undertook liberalisation policies in 1990s, which upturnedthe import substitution policy of the earlier decade and opened up sectors ofthe economy for foreign investors.
Turning to investment policies, it can be seen that while a few countries suchas Tanzania and Zambia enacted or modified investment Acts to facilitatehigher FDI, the others adopted related policies or enacted related Acts, whichcreated a facilitative environment for smoother inflows of FDI. Bangladeshcreated its Board of Investment (BoI) through the BoI Act and adopted a newindustrial policy in 1999, and Hungary adopted new investment policies, whichcreated a framework to facilitate higher FDI. (Refer to Table 9.5)
Until 1992 Hungary was a member ofthe Soviet led COMECON and had acentrally planned economy. TheSzechenyi Plan meant a move tomarket economy.
Liberalising FDI inflows.
Lifting of sanctions made it easier forforeign investment to flow in.
Two pillars: i) rapid expansion of non-traditional exports; and ii) an increasein private sector investment.
Emphasises on microeconomicreforms; set out framework for SA’seconomic strategies.
Macroeconomic policy; medium termstrategic priorities.
World Bank/IMF instituted adjustmentprogramme, aimed at raising GDP andtackling inflation.
World Bank/IMF instituted adjustmentprogramme, which initially destabilisedthe economy further and led towidespread poverty.
Hungary
India
South Africa
Tanzania
Zambia
COMECON12 to Szechenyi Plan,1992
New Economic Policy (NEP), 1991
End of apartheid sanctions, 1994
The Growth, Employment andRedistribution (GEAR) Strategy, 1996
Micro-Economic Reform Programme(MERP) and Integrated ManufacturingStrategy (IMS), 2001
Medium Term ExpenditureFramework (MTEF) and MediumTerm Strategic Framework (MTSF),1998
Economic Recovery Programme,1986-89
Structural Adjustment Programme,1991
Source: IFD Country Reports, CUTS.www.cuts.org/ifd-indx.htm

���������������� �����
Country
Bangladesh
Major Reforms
Board of Investment Act
Industrial Policy
Year
1989
1999
Comment
Created the Board of Investment (BOI) asa one-stop service for foreign investors wherethey would be able to receive all theclearances.
The private sector would play an importantrole in the economy.
Table 9.5: Changes in Investment Policies/New InvestmentActs: IFD Project Countries
Legal framework created for foreigninvestors; Joint ventures with foreigncompanies promoted by discount ofcorporate income tax.
1990sInvestment PolicyHungary
Industrial licensing abolished for mostsectors, except 18. Subsequently somemore industries exempted from licensing;FDI in 34 industries eligible for automaticapproval upto a foreign equity participationlevel of 51 percent of the paid-up capital of acompany. More liberalisation in subsequentyears
1991Industrial PolicyIndia
Private capital flows embraced.1990
National InvestmentPromotion Policy
Investment Promotion andProtection Act
New NationalInvestment Policy
New TanzaniaInvestment Act
Tanzania
1996 Governs all aspect of investment exceptthe mineral sector investment.
To create an attractive commercialenvironment and provide incentives forinward investment. Established TanzaniaInvestment Centre. 100 percent foreignownership permitted in most economicactivities.
Not applicable to Zanzibar, which has aseparate legislation. 100 percent foreignownership allowed in Zanzibar, except insome retail areas and tourist services.
1997
../..

������������� ��������� �
The other measures, which were important in positively influencing theinvestment environment, have been Acts to set up export processing zones,competition policy, sectoral policies, policies adopted by sub-nationalgovernments to facilitate FDI and, policies and legislations which simplify theadministrative and regulatory set up. Some of these are discussed below.
To facilitate investment, Bangladesh enacted the Private Export ProcessingZone Act in 1996, which enables private companies to set up special EPZs inselected areas, where they are allowed to import capital machinery on a dutyfree basis. Other measures to ensure greater transparency, predictability andlabour market efficiency have been Law Reform Commission, AdministrativeReforms Commission and Industrial Relations Act.
Among the measures which facilitated FDI in Brazil has been the adoption ofInformation Technology Law in 1993, which envisages a 15 percent reductionin industrialised products tax for producers of IT and telecom equipment, ifthey follow some minimum requirements for domestic production. ManausFree Zone (ZFM), which was created in 1957, attracted investment in 1970s dueto tax incentives. The 1988 constitution retains these incentives till 2013, butthese lost their effectiveness due to liberalisation of 1990s. Other measuresinclude the creation of Automotive Regime in 1990s, which provided variousincentives to rejuvenate the internal market. State programmes in Brazil alsoplayed an instrumental role in facilitating FDI. The 1988 constitution increasedfinancial powers and autonomy of the states. This led to a fiscal war among theBrazilian states.
In Hungary, the privatisation policy of 1990s favoured sales to foreign strategicinvestors and opened up the service sectors such as telecommunications,energy, water supply and, banking and finance, which facilitated high inwardFDI to the country. FDI incentive measures in the country included statesubsidies in 1990s for large-scale investment in certain high technology sectors,industrial free trade zones (FTZs) in 1982 with an aim to attract export-orientedand high technology FDI.
Promotes investment in productiveactivities; protection of investment; doesnot apply to banking and financialservices, insurance, mining andquarrying, which have separate Acts.
1993,amendedin 1996and 1998
Investment ActZambia
Source: IFD Country Reports

������������������ �����
In India, the earlier Competition Act, the Monopolies and Restrictive TradePractices Act, was amended initially but diluted subsequently. A newcompetition law has been passed but not yet put in place. However, regulatorsin telecom, insurance and other sectors have been instituted. India also put inplace a fiscal regime for foreign investors, which accorded favourable taxtreatment to foreign investors initially. Later on, foreign investors were broughtat par with domestic investors and non-resident Indian investors.
In Tanzania, institutions such as Parastatal Sector Reform Commission andNational Development Corporation (NDC) were created for overseeingprivatisation, mobilisation and channelisation of investment to the industrialsector.
Similarly, Zambia adopted the Zambia Privatisation Act in 1992, whichestablished the Zambia Privatisation Agency, which privatised 248 out of 280state owned enterprises by 2000. The country also adopted a CompetitionPolicy in 1995 that became operational in 1997.
In the next section, we discuss the implementation and effectiveness of FDI-related policies in facilitating higher FDI, and problems related to the policyregime of a country.
9.3 Effectiveness of Policies and Related Problems
The project countries have had different experiences with the implementationand effectiveness of policies. Countries in South Asia, although they haveliberalised their investment regimes considerably, did not experience aconsiderable increase in FDI flows. Similarly, Tanzania and Zambia did notexperience a dramatic increase in inflows despite taking measures to facilitateFDI, though Tanzania was relatively more successful than Zambia in thisrespect13. Again, inflows did not rise sharply in South Africa though it has aliberal regime for foreign investors and a well-developed capital market. Hungaryand Brazil, on the contrary, did experience higher inflows of FDI than earlierlevels.
The common problems associated with policy and law are a poor legal frameworkand weak enforcement mechanisms. A few of the project countries also facethe problem of outdated and inadequate laws. Often investors complain aboutuncertainty and instability in the policy environment e.g. the Black EconomicEmpowerment programme in SA. (See Annexure-2 - Box A: Why is SouthAfrica a net capital exporter?).

������������� �����������
A further common weakness is inadequate infrastructure. In several of theproject countries, investment is discouraged by poor transport and powernetworks that create extra costs and risks for investors. Improving thisinfrastructure would not only help to attract more foreign investment, butwould also encourage domestic development. However, infrastructureinvestments are very costly, and may be impossible for governments to make,given their large budget deficits, limited access to international financial marketsand falling levels of development assistance. This has prompted some countriesto look to the private sector to finance such investment.
There are also some specific problems associated with policies andimplementation. In Zambia, there have been no comprehensive trade policies.Some of the project countries also face the complaint that their labour policiesand regulation are investor-unfriendly: either appropriate regulation does notexist or there is problem of over-regulation. A major problem faced by theproject countries is the cost of conducting business. Often, the tax structure isblamed for this. It is also seen that there is a lack of effective policies/regulationto reduce cost of investment finance to small businesses. Further, an inefficientand corrupt regulatory and institutional mechanism severely hurts a country’sinvestment environment by slowing down or frustrating investment initiatives.(See Box 9.1: Low Fructification of FDI in India)
Box 9.1: Low Fructification of FDI in India
Several countries noted that they have a low fructification rate of approved FDI. InIndia, only about 20 percent of FDI approvals translate into actual investment. Thereis a difference between FDI approvals and actualisation in China as well, but the differenceis not as stark as in India.
Analysis of determinants of FDI in India shows that there is a relationship between therate of fructification and the size of the firm. The probability of a contract failuredeclines with a decline in size, but large firms might reduce FDI fructification rate. Thisimplies that FDI has been dominated by acquisitions, with large firms being able to resistit.
The other reason for low fructification rate in India is bureaucratic hassles and red tape,though the procedural route has been simplified and made non-discriminatory in the lastdecade. Investors lose their initial enthusiasm after going through the investment process.As per investors’ feedback, environmental clearances and legal work in the country arestill the most time consuming. There are three stages of a project approval: generalapproval, clearance, and implementation. Of the three stages, investors found thesecond most oppressive. In the Indian federal structure, clearance authorities are thestate governments. The gap between the central and state governments in their treatmentof foreign investors undermines FDI promotional efforts of central government.
Source: CUTS (2003), Investment Policy in India: An Agenda for Action

������������������ �����
In some countries, a change in the mindset of public officials towards foreigninvestment is required to implement bureaucratic reforms. The Report of theSteering Committee on Foreign Direct Investment in India chaired by N.K.Singh, Member, Planning Commission, Government of India (popularly knownas the N.K. Singh Committee Report) pointed out that there is a need to changethe mindset of bureaucrats in India.
Information on total FDI flows is a problem in many developing countries.Tanzania, Zambia and Bangladesh have reported problems in the measurementof inflows of FDI. Doubts are also expressed about the FDI data estimated bythe WB and UNCTAD. For example, Bangladesh is unable to measure themagnitude of FDI precisely due to the problem of non-reporting. UNCTAD andthe WB have estimated FDI for the country using the balance of paymentsaccounts. However, due to difficulties involved in accounting for transactionsthat do not require government approval, balance of payments accounts forBangladesh may not give a complete picture of the foreign private capitalflows. A study by WB in 1999 tried to re-estimate foreign capital inflow bycompiling information from alternative sources. It came out with the findingthat actual FDI flow was much higher than what BoP estimates show.
Governments may also have access to very limited information about actual(as opposed to planned or approved) investment flows. There are discrepanciesin the data between national and international sources, e.g. in Bangladesh onthe sectoral distribution of FDI. As information may only be collected duringthe investment approvals process, no information on the activities andperformance of foreign companies in the host country may be available, makingit impossible to assess the impact of FDI on the economy. In Tanzania, forexample, it was found that a large proportion of foreign companies were eithernot operating at the address supplied for investment approval, or were notcarrying out the activities stated in the application for approval.
As mentioned earlier, some countries need to undertake vigorous investmentpromotion of their countries. IPAs at the national and regional levels haveproliferated recently. This is the result of an increasing perception of competitionamong countries to attract FDI. Policy-makers have also recognised theimportance of investors’ perceptions in deciding where to locate a newinvestment. Contrary to the traditional view that investors are probably quiterational and well informed about all locations, it seems that investors are morelikely to be swayed by their impressions of a country or region, which may notbe based on fact. South Africa, for example, may suffer due to investor pessimismabout the African continent, even though its economy has differentcharacteristics.

������������� �����������
Most of the project countries have an IPA. Trade and Investment South Africa(TISA) is a good example of the kinds of services offered by an IPA. TISAemploys numerous marketing strategies for the country, including advertisingin the media, targeting particular investors with detailed information and holdingpromotional events in other countries. In India, the Foreign InvestmentPromotion Board (FIPB) has been created with the intention of creating asingle window facility for foreign investors, but investors still need to gainclearance for environmental matters, land acquisition and sectoral approvals.It should be noted that the FIPB does not play an active role in promoting thecountry as an investment destination in the same way as the South AfricanAgency, TISA, for example. Again, Bangladesh, Tanzania and Zambia all haveIPAs, but they are reported to be not very effective.
Within a single country, regions or states may compete with each other toattract investors. This phenomenon can be seen in the large federal countrieslike India and Brazil. This competition can be wasteful when looked at from theperspective of national development, and national governments should try torestrict this. If governments want to attract investment to backward regions aspart of a national development plan, efforts should be coordinated at the nationallevel.
There is little evidence to show whether investment promotion is effectivewhen underlying determinants of investors’ decisions are not favourable.Governments need to decide whether the creation of an IPA is the best use ofscarce resources under these circumstances. Where an IPA already exists, itsvalue may be increased by giving it a role in coordinating licenses andregistration requirements for all relevant ministries and assisting companies inidentifying suitable sites.
In the next section, we discuss the performance of countries in facilitatinginward FDI.
9.4 Performance of Countries Facilitating Inward FDI
All the project countries adopted measures to facilitate inward FDI with varyingdegrees of success. While the South Asian countries were less successful,Brazil and Hungary were more successful in attracting FDI. South Africa hadgreater outward than inward FDI, being the largest source of foreign investmentin Eastern and Southern Africa. Tanzania and Zambia were not much successfulin facilitating inward FDI, though Tanzania fared better both in terms of policiesthat were in place, and FDI trends.

����������������� �����
In Bangladesh, the potential for FDI with steady growth and improvement inthe size of the market emerged only in mid-1990s. The country, however, hasnot been able to attract much FDI. It needs to undertake vigorous investmentpromotion. A way of doing so is to draw attention to its strong economicperformance. The country also lacks regulatory and policy clarity, and goodbusiness environment given the already open policies that welcome FDI intoinfrastructure and participation in privatisation.
As noted earlier, Brazil received high FDI in 1990s. Several factors are responsiblefor the high propensity of FDI flows into the Brazilian economy. The historicaldevelopment of the manufacturing sector has increased the presence of TNCsin it. In recent years, the privatisation programme has led to a greater presenceof TNCs in the services sector, especially utilities.
Earlier, FDI inflows into Brazil were designed to serve the entire Latin Americanmarkets, as labour costs were low. However, the ‘maquiladora’ industries ofMexico, which took off after the emergence of NAFTA, have led to a ratherlarge decline in the labour intensive export enclaves of Brazil.
In 1990s, Hungary received substantial quantity of FDI. The country acted asa source of cheap labour for manufacturing product exports to the richerEuropean countries, including the EU. Hungary based TNCs thus catered tothe larger regional market. Additionally, the vigorous privatisation activity,which had put up for sale earlier state-run enterprises, had also significantlycontributed to the FDI inflows. Lower corporate taxes, state subsidies forlarge-scale investment in high-tech sectors and the ability to overcome foreignexchange risks seemed to have added to Hungary’s advantages listed above.
India received lower FDI as a percentage of GDP than some other developingcountries of similar size e.g. China and Brazil in 1990s. There is a lack of regulatoryand policy clarity in areas such as power, water, sanitation, roads and airports.In many sectors, especially services – banking, insurance, and real estate –with liberalisation, more FDI can possibly flow in. While policy changes andregulatory clarity can lead to higher FDI inflows into India (especially throughthe privatisation route), policies to enhance growth are also critical.
In South Africa, earlier there was a substantial withdrawal of FDI because manycompanies changed their headquarters to UK and Netherlands during theapartheid regime, resulting in negative inward FDI flows. Other factors, likeincreasing crime and law and order problems, might have restricted FDI to muchbelow its potential. The country should focus on general policies that enhancegrowth, investment, and especially exports rather than FDI related policies.

������������� ����������
South Africa has a dominant status in Eastern and Southern Africa and hasgreat potential for economic development given its size, resources, locationand skills (which need to be improved further). But premature liberal capitalaccount policies have contributed to capital flight and reduction in the growthpotential.14
Detailed data for analysing FDI in Tanzania is not available for the period understudy. However, with what is available one can ascertain wide fluctuations inFDI. Broadly, it seems that the realised FDI is lower than what could be achieved.Higher growth rates have enlarged the market in recent years but have not ledto a significant increase in FDI inflows. It is possible that tax incentives in theregion to attract FDI puts countries with infrastructure and skill-linkedconstraints, such as Tanzania, at a disadvantage. This may be particularlyrelevant now as trade barriers within the region are breaking down. Fortradeables, FDI can flow to most attractive locations and cater to the region.Perceptions of high political risks add to this disadvantage of the nation.
Zambia went through major stress during 1990s with economic growth havingfallen dramatically, before it recovered somewhat from the major contractionarystructural adjustment and ‘stabilisation’ that the economy went through. Thelarge capital flight from Zambia was also a result of this macro-economicinstability. High inflation till the contractionary policies brought about severedeflation underlie these large variations. Zambia therefore is different from thecountries studied in major ways – small, but with a rich resources base andsignificant governance failure.
Nonetheless, if we focus on 1990s alone and disregard the large fluctuations inthe earlier period, potential FDI seems to be higher than what has been achievedin Zambia. Since resource seeking motive is the key driver of FDI in the country,fall in international prices of copper may have led to limited FDI inflows. Asnoted earlier, high inward FDI is not a guarantee to achieve higher economicgrowth rate. Brazil is a case in point. Some of the project countries would haveto re-orient their national development strategies keeping this in mind. Thenext section discusses the relation between FDI strategy and overalldevelopment strategy in a country.
9.5 FDI and National Development Strategies
Until recently, most countries pursued state-centred development models thatfocused on the mobilisation of domestic resources, and investment by thegovernment and, restrictions on trade and capital flows. However, the policy

������������������ �����
orientation of many governments has changed dramatically in recent yearstowards a greater role for the market, including private investment. FDI canplay a number of roles in a national development strategy: on the one hand, itcan be seen as a source of foreign capital in the light of unstable portfolioinvestment flows or declining ODA. It may also be seen as a source of financefor the development of infrastructure in sectors like power generation andtransport networks, when governments are unable to invest because of sizeablefiscal deficits.
For other countries, FDI is sought for transfers of technology and expertise,and access to global markets. It is this latter aim that is prevalent in the nationaldevelopment strategy documents, although some of the other reasons areprobably implicit in government planning.
Among the project countries, not all national development strategies specificallyidentify FDI as a driver of growth or a contributor to poverty reduction. However,in India, the N. K. Singh Committee Report, specifically identified FDI asessential to achieving the target growth rate for the economy and recommendedpolicy changes needed to raise FDI inflows. In Brazil, foreign investment –both portfolio and direct – has long been seen as a key driver of growth. Thishas motivated the policies of deregulation and privatisation, though foreigncompanies have played an integral part in the Brazilian economy for manydecades. However, as noted earlier, economic growth rate in the country didnot get a boost from higher FDI in 1990s.
In South Africa, the key policy documents have been the GEAR, MERP andIMS. These policy instruments look into all aspects of policies for growth andBlack Economic Empowerment.
Hungary opened its doors to foreign investors as part of the process of itstransition from a state-controlled to market economy. However, the countrynow feels it is time to re-look and revamp its national development strategy inview of falling FDI inflows and slower growth rate of the economy. (SeeAnnexure-2 – Box B: Changes in Capital Attraction Factors in Hungary)
In LDCs, comprehensive national development strategy documents have beenprepared with an emphasis on the reduction of poverty. International financialinstitutions and bilateral donors have increasingly tried to coordinate theirown efforts towards priorities defined at the national level and have supportedthe consultative process needed to define these priorities at the national level.

������������� �����������
The outcome of these consultations is a Poverty Reduction Strategy Paper(PRSP), which covers important aspects of economic and social policy. Theseidentify an important role for the private sector in raising investment rates,leading to higher rates of economic growth. For example, the Tanzania PRSPcommits the government to raising private investment as a proportion of GDP.In Bangladesh, the PRSP recognised private investment as important for accessto technology, the development of infrastructure and the growth of themanufacturing sector.
The contribution of FDI to the economy can be strengthened, and successrates in attracting FDI can be increased, if FDI fits into the national developmentstrategy and is effectively regulated so as to have a positive impact on economicdevelopment. A clear idea of the way that FDI fits into the national developmentstrategy will help countries to target their marketing efforts and will influencethe design of the regulatory environment for private companies. Furthermore,a clear national development strategy will provide a foundation for governmentsto assess how resources should be allocated between competing uses, suchas the creation of an investment promotion agency or incentives for investors.
The next section discusses the impact of FDI on the national economies giventhe policy and regulatory changes, and global and national trends.
9.6 The Varying Impact of FDI
FDI can have a positive impact on a country’s economy by contributing tostocks of knowledge, raise the level of investment in the country and relieveforeign exchange shortages. However, FDI may also have a negative impact bycrowding out domestic investment or on the current and capital accounts inthe long run. It is difficult to assess the impact of FDI, as there are variousstudies contradicting on this, on the host developing economies.
The impact of FDI as felt by the project countries is discussed here withreference to privatisation, domestic capital formation, the effect on balance ofpayments, cases of investment withdrawal and sectoral experiences.
Privatisation FDI can contribute to a country’s economic restructuring processby relieving government budget constraints, and often leading to sequentialinvestment and bringing in advanced technologies. Privatisation hascontributed significantly to FDI inflows in many of the project countries.Privatisation FDI was important in Hungary, South Africa, Zambia, Tanzaniaand Brazil but not so strong in South Asia. Privatisation FDI is a form of

� ���������������� �����
acquisition. This type of FDI has contributed substantially to restructuringactivities, especially in Hungary, which helped the country in its transitionprocess. In Hungary, privatisation-led acquisitions by multinationalcorporations (MNCs) brought in assets like brands, skills, market share, R&Dcompetencies and supplier networks. Even some greenfield investment startedthrough the privatisation process as sequential investment.
The positive impact of privatisation FDI was weaker in the other projectcountries. In Brazil, utilities were privatised with mixed success. In Zambia,substantial privatisation was undertaken, but post-privatisation there wassubstantial shedding of labour. Tanzania and South Africa also experiencedsubstantial privatisation FDI.
It is usually expected that FDI would contribute to domestic capital formation,which is the process of adding to the net physical capital stock of an economyin an attempt to achieve greater total output15. FDI flows contributedsignificantly to capital formation in Brazil and Hungary but its contributionshave been much less significant in South Asia. In Brazil, FDI contributed to 31percent of capital formation but in India, only 2 percent. In the other countries,its contribution was in the range of 8-14 percent.
FDI can also have an effect on balance of payments. Large capital inflows inshort periods of time are followed by generation of profits, which could berepatriated unless the economy stimulates reinvestment from FDI. This affectsthe balance of payments adversely, especially if inward FDI stagnates andhidden profit transfers take place through payments for business and technicalservice payments. Among the IFD project countries, FDI outflows in the formof dividends and interest payments to non-residents have been significant inthe case of South Africa. The country has experienced an increased presenceof non-resident investment and moving of stock market listing to London bymajor national companies.
Brazil also faced balance of payments difficulties because of the attempt tosustain an over-valued currency in the late 1990s and the strategy to balancethe growing current account deficit with portfolio investment. The currentaccount deficit was as high as 4.4 percent of the GDP in 1999. The countrycould not rely on FDI to fill up the gap because FDI flows declined in the recentyears.
In 1998 and 1999, Hungary’s current account deficit deteriorated significantlydespite the improvements in exports. It is thought that this happened due to

������������� �����������
repatriation of substantial profits by foreign investors. Inward FDI flows toHungary shrank in this period while outward FDI grew during this period.However, in Hungary, FDI may have contributed to reduction of current accountdeficits by stimulating exports. The major engines of export growth were largegreenfield investment in the EPZs.
A few countries experienced cases of withdrawal by foreign investors, whichmay have an adverse effect on a country’s employment and economic growth16.For example, Anglo American Corporation announced its decision to pull outof Konkola Copper Mines – the biggest mine in Zambia – in 2002. SimilarlyIBM, Marc Shoe and Flexitronics had moved out their manufacturing unit ofHungary. Some of the investment withdrawal cases have been due to faultyprivatisation. The other reasons for withdrawal have been regulatory failure,bureaucratic and systemic delays and inefficiency, internal financial difficultiesin the companies, changes in strategies of the companies, and an increase inrelative attractiveness of other investment locations.
The impact of FDI on an economy can also be illustrated by looking at individualsectors. Three sector case studies were selected in each project country for anin-depth investigation. The sectors selected were the ones that were importantfor the country, through their impact on growth, exports, employment or otherfactors. Two sectors – automobiles and telecommunication – were taken up inseveral countries, which allowed for comparison between the countries’experiences. Other sectors were analysed individually, all yielded interestinginsights. The impact of FDI on some of the sectors is discussed below.
The automobile sector has been more-or-less a success story for all the fourcountries that took up the case, namely, Brazil, South Africa, Hungary andIndia. Openness to FDI has led to increased productivity and competitivenessin the sector, although it has had a mixed impact on employment. India andSouth Africa have benefited from the recent liberalisation of their sectoral FDIregimes and the lifting of supply constraints, while Brazil, which has had arelatively open policy for a longer period, has benefited from restructuring atthe global level. Between 1995 and 2000, the Brazilian auto sector accumulatedmore than US$18.6bn, making it one of the greatest recipients of FDI inmanufacturing. This experience suggests that FDI in the automobile sector willbenefit countries that have built up a domestic productive capacity.
The automobile sector demonstrates that a variety of policy approaches to FDIin manufacturing can be appropriate, depending on the country’s level of

������������������� �����
development. The four countries studied in this project were able to benefitfrom openness to FDI, but at some stages of economic development, the statemay need to play an active role in supporting the growth of domesticproductive capacity. At a later stage, openness can raise productivity andimprove competitiveness further. Thus, policies need to be tailored carefullyto suit national conditions.
One issue of concern is transfer pricing: the nature of the automobile industrywith an international network of firms and suppliers makes it possible for firmsto transfer profits between countries to circumvent taxes. Initiatives to tacklethe problem of transfer pricing need to be pursued at the international level.
Foreign investors have also been very active in the telecommunication sectorin developing countries, including the four project countries: Bangladesh,Hungary, Tanzania and South Africa. In South Africa, for example, the sectorconstitutes more than 7 percent of national GDP and is one of the top fourFDI-earners in the country. FDI has been attracted by the shift from state-owned monopolies to deregulated markets, privatisation of state-ownedcompanies in these countries as well as rapid technological change in thesector. FDI in telecommunication has benefited consumers, who now havehigher quality services and more choice. However, the impact on prices is notalways clear. In places where the market is highly competitive, prices havefallen, but where the state monopoly has been transferred to private ownership,there are concerns about the abuse of market power. In Tanzania, prices fordomestic calls, which were very low before privatisation, have risen, whileprices for long-distance and international calls have fallen. At the same time,the number of telephones per capita has increased.
A good regulatory system is also extremely important in the financial sector,as instability in this sector is quickly transmitted to all other areas of economicactivity. In Tanzania, FDI in the sector has resulted in major technologytransfers and improvements in service, but these benefits cannot be guaranteedwithout strong domestic sectoral policies to support them.
The power sector in India demonstrates policies that have not been successful.In India, the government tried to attract investors with incentives, but only400MW of capacity has been added by independent power producers between1991 and 2000, well below the government’s expectations. This has, amongother things, led to a series of withdrawals by foreign investors in the sector.

������������� ������������
The state electricity board in the Maharashtra state has gone into debt as aresult of the purchase agreements.
Mining has been a controversial sector for FDI. The profitability of naturalresource exploitation depends on the prevailing world price for a commodity.But if the government or investor misjudges the trend in global prices, theinvestment may not turn out to be profitable, as was the case with coppermines in Zambia. Copper mining accounts for 70 percent of the country’sexport earnings and so plays a crucial role in the economy.
In Tanzania, large incentives were provided to attract investors into miningand the sector has seen some positive results: the sector has been growing atover 16 percent between 1997, when the sector was opened to FDI, and 2001,and employment and tax revenues have also gone up. The cases revealed thatgovernments should be careful and realistic in their expectations from foreigninvestment in this sector. Incentives need to be proportionate to the benefitsto the domestic economy and politically sustainable.
The Indian Information Technology sector is seen as a success story in termsof the growth of the sector though it is dominated by domestic firms. It hasgrown from US$500mn in 1994 to a sector generating over US$8bn in 2000. Inthis sector, the government provided an enabling environment for the growthof the sector through investments in higher education and communicationsinfrastructure. However, it did not intervene directly in the sector and this‘hands-off’ approach seems to have been the best policy.
The cement industry in Bangladesh draws attention to the importance ofcompetition policies in relation to FDI. Foreign firms may offer efficiency andquality improvements in the short-term, but when a single large foreigninvestment overpowers domestic competitors, the impact of the investmentshould also be considered from a competition perspective, as prices may rise inthe longer-term under a monopoly.

������������������� �����
Recommendations
General
� Policies to promote competition and efficiency in the market, are importantin creating an enabling environment in a host economy.
� Policies to regulate transfer pricing in intra-firm trade are necessary forcreating greater accountability and transparency. The South Africanresearch highlighted the issue, and to a lesser extent, the Hungarian onehas also done so.
� Policies are needed to support small and medium enterprises by providingskills based training programmes on marketing, performance assessmentand management, and open up these businesses to foreign investment.
� Policies are required for supporting local businesses to upgradetechnology.
� Policies are needed to encourage export oriented FDI and identify acountry’s potential in this area. Development of special economic zonesand free trade zones, often, have proved to be helpful in this.
� Governments should reduce bureaucratic control and interference inbusiness and investment activities, in cooperation with civil society.
� Governments should also establish effective institutional and regulatorystructure to:a. Put in place effective intermediaries such as banks and credit
institutions;b. Assess the impact of various investment projects by national and
local governments;c. Make the judiciary transparent and independent.
Country Specific
� Bangladesh should improve the quality of its bureaucracy andgovernance, improve the law and order situation, and undertake furtherreforms. It should also conduct more investment promotion activities todraw attention to its growing market and increase policy clarity andtransparency.
� Brazil should implement policies to promote economic growth, whichcan promote linkages between local and foreign firms, and foreign firmsand local innovative activities. It should also promote projects, whichcan promote employment and training of local employees.
../..

������������� ������������
� Hungary needs to adapt FDI-related policies as the country loses itslow wage advantage.
� India needs to improve regulatory and policy clarity, and infrastructure.It should move ahead with its privatisation plans and undertakemeasures to market the country as an investment destination.
� South Africa should adopt policies to support domestic growth andexports, adopt marketing strategies to improve the image of the countryas an investment destination, and reduce volatility of its currency, theRand.
� Tanzania should improve its infrastructure and skill levels of theworkforce, reduce bureaucratic red tape, and improve its method ofdata collection of FDI.
� Zambia needs to improve its investment environment by strengtheningits institutions, increasing investment in health and education andgreater marketing of the country as an investment destination.
National Development Strategy
� National governments need to take a broad view of nationaldevelopment and how FDI can fit into overall objectives whendesigning FDI policies. Generally, there is a need to define what typeof FDI is needed by a country for generating economic growth anddevelopment, and in which sectors. For example, identification of nichesectors may generate greater FDI in South Africa, which would benefitits economy rather than a broad-based approach. In Brazil, preferentialtreatment can be given to those investment projects, which wouldresult in higher employment and advanced technologies for promotingeconomic growth and development.
A civil society perceptions survey was conducted by the partners. Theresults of the survey are given in Chapter 3 of Part I.

������������������ �����
CHAPTER -10
Conclusions and the Way Ahead
The basic learning from the IFD project is that though the countries haveadopted liberal investment policies to facilitate higher FDI in 1990s, not all ofthem have been successful in doing so. Further, higher FDI inflows do notensure higher economic growth and development. Given the situation,developing countries should rethink their national development strategies andre-orient or restructure FDI strategies to facilitate “quality” FDI.
Moreover, countries need to re-orient their development strategies to takeaccount of changing international economic factors e.g. growth of new kindsof FDI, effect of technological change on the information, communication, andtechnology (ICT) sector, growth of global production networks, change inattractiveness of certain investment locations to foreign investors etc. FDIcannot be separated from general economic development and countries needto integrate FDI strategies into national development strategies after properlydefining these.
The IFD project also revealed a number of areas in which further work isneeded.
1. Civil society perceptions: The survey conducted in the IFD project waslimited in scale, but demonstrated that civil society is interested in the issueand is generally well informed. Project participants agreed that it would bevaluable to deepen the study of civil society perceptions by conducting anin-depth survey of opinions in a representative sample of civil societyorganisations in each country. The survey could identify areas of concernto civil society and form the basis for a national information strategy onforeign investment.
2. Sectoral strategies: The impact of FDI varies hugely across sectors andappropriate policies need to be designed according to the specificcharacteristics of the sector such as infrastructure, utilities or export-orientedindustries. Further, detailed studies on the impact of FDI in particular sectorsof the economy would be very valuable in designing detailed policy andpromotion strategies.
3. Corporate social responsibility: This is an issue that is currently attractingmuch interest in the private sector. However, the concept has sometimesbeen interpreted rather narrowly and could be broadened to a tri-sectoral

������������� �����������
approach including governments and civil society organisations.Instruments like the Global Compact or the OECD Guidelines forMultinational Enterprises could also be extended to include otherstakeholders.
4. Comparative studies: In-depth national data needs to be analysedcomparatively to reveal commonalities and contrasts between countriesand ensure that policy transfer between countries only takes place whenthe underlying conditions are the same. Country-level studies should beinformed by and linked with the forefront of global research on FDI.
5. South-South investment cooperation and agreements: After the demise ofthe WTO Ministerial Meeting in Cancun in September 2003, trade andinvestment negotiations are expected to shift to the regional level. In thiscontext, studies on the potential benefits of South-South trade andinvestment agreements would be useful.
Other issues relating to investment include: technology transfer, competitionpolicy and law, coherence between policies, factors affecting capital absorptioncapacity, the role of incentives structure, causes of non-successful investments,links between official development assistance and FDI, and the role of labourmobility in international economic specialisation.

������������������� �����
Box 1: Host Country Determinants of FDI
Host Country Determinants
I. Policy framework for FDI� Economic, political and social stability
(macro-economic policies)� rules regarding entry and operations of
foreign enterprises, including performancerequirements
� standards of treatment of foreign affiliates� policies on functioning and structure of
markets (especially competition and M&Apolicies)
� international agreements on FDI� privatisation policy� trade policy (tariffs and NTBs) and
coherence of FDI and trade policies� macro-economic policies affecting
exchange rates, costs of capital� tax policy (national and state)
II. Economic determinants� see opposite column
III. Business facilitation� investment promotion (including image-
building and investment-generatingactivities and investment-facilitationservices)
� investment incentives� hassle costs (related to corruption,
administrative efficiency, etc.)� social amenities (bilingual schools, quality
of life, etc.)� after-investment services
Type of FDI classified by motives of TNCsand principle economic determinants inhost countries
A. Market-seeking� market size and per capita income� market growth� access to regional and global markets� country-specific consumer preferences
(including importance/ exposure to foreignbrands)
� structure of markets (degrees ofcontestability)
B. Resource/asset seeking� raw materials� low-cost unskilled labour� skilled labour� technological, innovatory and other
created assets (e.g. brand names),including as embodied in individuals, firmsand clusters
� physical infrastructure (ports, roads,power, telecommunication)
C. Efficiency-seeking� cost of resources and assets listed under
B, adjusted for productivity for labourresources
� other input costs, e.g. transport andcommunication cost to/from and within hosteconomy and costs of other intermediateproducts
� membership of a regional integrationagreement conductive to the establishmentof regional corporate networks
Source: Adapted from UNCTAD (1998), p 91.
Annexure-1

������������� ������������
Box 2: Potential Role of Certain Determinants of FDI in Project countries
Variables B’desh Brazil Hungary India S. Africa Tanzania Zambia
A. Market Seeking
Market size Less Important Important Important Important Not NotImportant important important
Market Limited Important Important Important Important Not NotGrowth important important
Regional Not Limited Important Not Important Not Notmarkets Important Import? Not Important Important
B. Resource /Asset Seeking
R a w No No No No Limited No? Importantmaterials importance
Low cost Yes, No No Yes, May be Some Nounskilled some some in some sectors?labour sectors sectors
Skilled labour Limited Yes Yes Yes Yes No No
Specific No No No Yes, in No No Noknowledge someassets sectors
Infra- No Yes, Yes Very Yes, No Nostructure limited limited limited
C. Efficiency Seeking
Costs of Limited Yes Yes Yes Yes No Noresources
D. Impact of Policies and Other Conditions
Economic Positive, Negative Positive, Positive Positive Negative Negativestability not critical important?
Liberal FDI Yes Yes Yes Yes Yes Yes Yespolicies (1)
Privatisation Yes, Yes Yes, Yes, Yes, Yes Yes,policy not critical critical critical critical critical
Trade blocks Not Market Market Not Market Not Notimportant creation creation important creation important important
Competition No law Not Positive? Positive Positive Not Notpolicy known known known
Tax breaks Important Important Important Not Not Important& subsidies important important? for
sectors

�� ���������������� �����
Capital cost & Positive, Not Not Positive, Positive, Not clear Not clearexchange risk not clear significant significant not
significant significant significant?
Political and High Moderate Low Moderate Moderate High Highother risks
Notes: 1. On the basis of the available information, it is difficult to derive a ranking of projectcountries in terms of the relative ease with which foreign entities can enter, operate and exit fromthese economies. A large variety of dimensions are relevant to figure out how liberal a country isvis-à-vis its FDI related policies (see chart 2.2).

������������� ������������
Annexure-2
Box A: Why is South Africa a Net Capital Exporter?
Since its transition to democratic governance in 1994, South Africa’sregulatory regime has undergone significant transformation andliberalisation. There were adoption of new policies and strategies,deregulation of certain sectors, trade liberalisation and phased reform ofcapital controls, privatisation of airlines and telecom industries etc. In spiteof all these, the country has fared poorly in the ‘global beauty contest’ forforeign capital. The country is in fact a net capital exporter.There are several lines of thinking on this:
� FDI is not necessarily superior to domestic investment and thus shouldnot be courted as an alternative to domestic investment. Though privatesector domestic investment is important for the growth of the economy,it is very low in the economy. It appears that the private sector is reluctantto invest unless government spending on infrastructure increases;
� SA’s inward investment is a sign of strength of its economy. The reasons:Firstly, the country does not have a technical shortage of capital butlacks viable projects. Its national savings are greater than national fixedinvestment, so there is no resource gap in the country;Secondly, SA’s domestic capital markets are well developed. ThereforeTNCs can raise their capital requirements for viable projects from thedomestic market rather than from their home countries;Thirdly, the case of investment ‘lock-out’ is reported in the country.There has been a high degree concentration in virtually all the industriesin SA for several decades. There are both horizontal oligopolisationand vertical integration. This leads, through tied contracts, to a ‘lock-out’ of any foreign investor in the main inward-oriented production,warehousing, distribution, marketing and retailing networks.
� There is unpredictability and uncertainty over government’s blackeconomic empowerment (BEE) policies, requirement of BEE partners,regulatory uncertainty and equity targets;
� The other reasons identified are small size of its market, poor economicgrowth, political events of the region, high crime level, shortage ofskilled labour, high user cost of capital, currency instability, labour marketrigidities, hidden costs, low return on investment and non-availabilityof readily published information on incentives schemes.
Source: CUTS (2003), Investment Policy in South Africa – An Agenda for Action

������������������� �����
Box B: Changes in Capital Attraction Factors in Hungary
Hungary is regarded as one of the successful transition economies in CentralEurope. The transition process was quick and straightforward with a highFDI in the manufacturing sector. FDI flowed into Hungary due to thefollowing factors:
� Advantageous location in Europe;� A sufficiently developed infrastructure network;� Cheap and educated labour force;� Privatisation policy;� Generous tax holiday system;� Industrial free trade zones
FDI inflows began to decline by the late 1990s though the stock of FDIcontinued to increase as most firms reinvested most of their profits. Thereasons identified for the changing flows and patterns of FDI are as follows:
� The completion of the privatisation process;� Other Central European countries were able to attract market and efficiency
seeking investment while Hungarian market for investment saturated;� Slow down of M&A activities;� An increase in real wage costs between 2000 and 2002;� Shortage of skilled labour;� Withdrawal of incentives such as tax holidays and industrial free trade
zones upon criticism by the European Union; and� Deteriorating image of the country.It is felt that the country had to create new opportunities and fundamentalsof a new and higher level of integration of the country into the internationallabour division system.
Source: CUTS (2003), Investment Policy in Hungary: An Agenda for Action

������������� ������������
Endnotes1 The discussion in this section draws heavily from UNCTAD (1998).
2 One can argue that location specific conditions also influence market imperfectionsand therefore cost of transactions and internalisation.
3 Provides details of the model and discusses the estimation results.
4 In other words, the choice of the sector was based on available information, aninteractive process between CUTS and the country team, as well as perceptions of thecountry experts.
5 The figures according to the UNCTC /UNCTAD based on OECD and other survey datathat go beyond the balance of payments flow data used in this analyses, show muchhigher inflows.
6 In 2000, the foreign investment allowance for private residents in South Africa wasraised to Rand 750,000. According to some this has amounted to a state sanctionedcapital flight. Some estimates reported in the country paper suggest that since 1997
about R 17.4 bn have left the country.
7 UNCTAD WIR 2003
8 The United Nations (UN) has designated 49 countries as LDCs – the list is reviewedevery three years by the UN Economic and Social Council.
9 UNCTAD (2002). FDI in Least Developed Countries at a Glance.
10 Stock refers to the external financial assets (outward stock) and liabilities (inwardstock) of companies, in contrast to flows, which refer to financial transactions conductedwithin a particular year. (Refer to “New FDI Pattern Emerging, says UNCTAD, reshapedby services economy, new industries” UNCTAD Press Release no UNCTAD/PRESS/PR/2003/105*, 28 October 2003).
11 UNCTAD (1996). Incentives and Foreign Direct Investment.
12 Economic organisation from 1949 to 1991, linking the USSR with Bulgaria,Czechoslovakia, Hungary, Poland, Romania, East Germany, Mongolia, Cuba, andVietnam with Yugoslavia as an associated member. Albania also belonged between 1949and 1961. Its establishment was prompted by the Marshall Plan, Comecon was formallydisbanded in June 1991.
13 CUTS (2003). Investment Policy in Select Least Developed Countries – Performanceand Perceptions.
14 In 2000, the foreign investment allowance for private residents in South Africa wasraised to Rand 750,000. According to some, this has amounted to state sanctionedcapital flight. Some estimates reported in the country paper suggest that since 1997about R 17.4.
15 Collins Dictionary of Economics, Second Edition
16 CUTS (2003), “Investment for Development: No 7”, Quarterly Newsletter of theCUTS Centre for Competition, Investment & Economic Regulation.

������������������� �����
Bibliography
Aliber, R Z (1993), The Multinational Paradigm, Cambridge, Massachusetts,The MIT Press.
Anon (2001), “A Review of Macroeconomic Scenario, Investment Policies andRegulatory Framework in Bangladesh”, Centre for Policy Dialogue andBangladesh Enterprise Institute, Dhaka.
Consumer Unity & Trust Society (2003), “Investment for Development: No 5”,Quarterly Newsletter of the CUTS Centre for Competition, Investment &Economic Regulation. (Jaipur: CUTS)
CUTS (2003), Synergising Investment for Development. (Jaipur: CUTS)
Julie A; Dhawan, Sonali; Bagri, Uttam; Gupta, Vivek; (1998), “FDI Flows inAsia”, Term paper, Course on Multinationals in the International EconomyIndian Institute of Management Ahmedabad.
Kumar, Nagesh (2002). Globalisation and the Quality of Foreign DirectInvestment. (New Delhi, Oxford University Press)
Planning Commission, Government of India (2002). Report of the SteeringGroup on Foreign Direct Investment. (New Delhi: Planning Commission)
The World Bank (2003). World Development Report 2004: Making ServicesWork for Poor People. (Washington, D.C., The World Bank and OxfordUniversity Press)
UNCTAD (1993), Explaining and Forecasting Regional Flows of ForeignDirect Investment, United Nations.
UNCTAD (2001). World Investment Report 2001 – Promoting Linkages. (NewYork and Geneva: United Nations).
UNCTAD (2002). FDI in Least Developed Countries at a Glance. (New Yorkand Geneva: United Nations)
UNCTAD (2002). World Investment Report 2002 – Transnational Corporationsand Export Competitiveness. (New York and Geneva: United Nations).
UNCTAD (2003). “New FDI Pattern Emerging, says UNCTAD, reshaped byservices economy, new industries”. UNCTAD Press Release no UNCTAD/PRESS/PR/2003/105*, 28 October 2003.

������������� ������������
UNCTAD (2003). World Investment Report 2003 – FDI Policies forDevelopment: National and International Perspectives. (New York andGeneva: United Nations).
United Nations Conference on Trade and Development (UNCTAD) (1996).Incentives and Foreign Direct Investment. (New York and Geneva: UnitedNations).
United Nations Conference on Trade and Development (UNCTAD) (1998),World Investment Report 1998: Trends and Determinants, United Nations.
Various country reports produced under the “Investment for Development”project published by Consumer Unity & Trust Society (CUTS), Jaipur, India.www.cuts.org/ifd-indx.htm
Various Country Reports produced under the Investment for Developmentproject by Consumer Unity & Trust Society (CUTS). www.cuts.org/ifd-indx.htm
World Trade Organisation, Ministerial Declaration, Ministerial Conference,Fourth Session, Doha, 9-14 November 2001. WT/MIN(01)/DEC/1. http://www.wto.org/english/thewto_e/minist_e/min01_e/mindecl_e.htm

CUTS Centre for Competition, Investment & Economic RegulationD-217, Bhaskar Marg, Bani Park, Jaipur 302 016, India
Ph: 91-141-220 7482, Fx: 91-141-220 7486Email: [email protected] Website: www.cuts-international.org
ISBN 81-8257-029-8