fdis in ethiopia – their impact on the agricultural sector and rural … · contacts: heinrich...
TRANSCRIPT

Discussion Papers
No. 12 / October 2009 / English Version
Foreign Direct Investment in the Agricultural Sector in
Ethiopia
by Lucie Weissleder
University of Bonn

This document has been produced with the financial assistance of the EuropeanUnion.
The contents of this document are the sole responsibility of Misereor and Heinrich-Böll-
Stiftung and can under no circumstances be regarded as reflecting the position of the
European Union.
Contacts: Heinrich Boell Stiftung, Hackesche Hoefe, Rosenthaler Str. 40/4, D-10178 Berlin Tel: ++49-(0)30-285-34-187 E Mail: [email protected] Misereor, Mozartstr. 9, D-52064 Aachen T: ++49-(0)241-442-168 E Mail: [email protected], [email protected] This paper does not necessarily represent the views of the before mentioned organizations. About the EcoFair Trade Dialogue: The EcoFair Trade Dialogue is a project carried out by the Heinrich Boell Foundation and MISEREOR in cooperation with the Wuppertal Institute. It aims at promoting a framework to organize international agricultural trade in a socially and ecologically sustainable way. The main outcome of a two years first phase of the project was the report “Slow Trade – Sound Farming. A Multilateral Framework for Sustainable Markets in Agriculture” (2007), which emerged from an extensive consultation and exchange process that took place across all continents. This discussion paper is one out of several “implementation papers” that are based on the perspectives and proposals contained in the “Slow Trade – Sound Farming” report. www.ecofair-trade.org

I want to thank you Dr. Alemu Getnet from the Addis Ababa University for his detailed report on
regulations, legal conditions and incentives for Foreign Direct Investment in Ethiopia.
Further I want to thank you Christian Peters-Berries from the hbf project office in Ethiopia and his
team for all the help and time they offered.

Table of Contents
1 Introduction ........................................................................................................................ 1
2 FDI evolvement in Africa................................................................................................... 4
3 Overview on Ethiopia‟s economy ...................................................................................... 7
4 Development of FDIs in Ethiopia ...................................................................................... 9
5 Ethiopia‟s Political Framework ........................................................................................ 18
6 Company regulations for investing - Results of the interviews ....................................... 21
6.1 Regulations and privileges ....................................................................................... 21
6.2 Exemptions ............................................................................................................... 23
7 Conclusions ...................................................................................................................... 24
References ................................................................................................................................ 27
Annex ....................................................................................................................................... 29

Summary of Main Findings
Global Foreign Direct Investment (FDI) reached in 2007 the all-time maximum level of
US$ 1,833 billion
Despite the global financial crisis FDI inflows into developing countries (especially
Africa) increased to their highest level ever
Through the global crisis new motives for undertaking FDI have evolved. Next to
efficiency-seeking and market-seeking (traditional motives of foreign investors) the
objective of food security and secure financial returns have become major drivers for FDI
flows
Ethiopia is one of the developing countries that has arouse the attention of foreign
investors as it is highly endowed with fertile land and has developed a very investor-
friendly environment over the last 10 years through strong changes in their national policy
framework
Ethiopia‟s poverty-stricken economy (more than 45% of the total population are food
insecure) is based on agriculture – accounting for almost half of the GDP, 60% of exports
and 80% of total employment. High investment flows into this sector leads to high
impacts on the total Ethiopian economy
Especially for the agricultural sector, regulations on investments have been relaxed
significantly. No minimum capital is required anymore, foreign agricultural activities are
exempted from the payment of custom duties and taxes on imports of capital goods,
according to the export orientation of the foreign investor he is exempted from income tax
for a certain time period and to all these incentives foreign investments are exempted from
the payment of sales and excise taxes for export commodities.
Investments in the agricultural sector of Ethiopia have increased from US$ 135 Mn in
2000 up to US$ 3500 Mn in 2008
Main investor countries are: EU, India, Israel, Saudi Arabia and the US
Main agricultural sectors: flori/horticulture, meat production, biofuel and food production
Main regions of investment: Oromia (excellent climatic conditions for flower production),
Amhara, SNNPR and multiregional
Sectors like the flori/horticultural sector can lead to an increase in the economic and social
development as it creates numerous job opportunities. At the same time, ecological
development is not taken into account as no strong environmental framework exists
Sectors like the meat and biofuel sector can cause negatives effects on food security and
poverty as competition on fertile production land and water increases. The predicted
objective of foreign investors is the food security in their own countries and the secure of
financial returns.
High investments in the agricultural sector are basically necessary for a sustainable
development but only if a comprehensive policy framework is in place

1
1 Introduction
Global Foreign Direct Investment (FDI) inflows rose in 2007, after four consecutive years of
growth, by 30% to reach $1,833 billion, well above the previous all-time high set in 2000
(UNCTAD, 2008). Especially in developing countries FDI inflows reached their highest level
ever ($500 billion) – a 21% increase over 2006. The least developed countries (LDCs)
attracted $13 billion worth of FDI in 2007 – also a record high (UNCTAD, 2008).
This development causes the attention of economists, scientist, governments, international
organizations and the civil society wanting to know what drives this high increases in FDI
inflows, whether this is a lasting trend and what the consequences might be. Even though the
international community shares the view that higher investments especially in the agricultural
sector are necessary to foster rural development and to overcome food insecurity and poverty,
recently several critical voices have been raised, addressing the potential negative impact of
FDIs in the agricultural sector in developing countries. Critical voices like Jacque Diouf
Direktor of the UN Agricultrual Organization (FAO) talk of "Neo-colonialism" and "Land
Grabbing".
Up to now establishing an economic relationship through FDI was mainly driven by two
different enterprise motives. The first one is to reduce production costs and through this to
become more efficient compared to competitors (vertical FDI) and the second motive is to
seek new markets (horizontal FDI). However, over the last 2 years, the economic surrounding
in which the enterprises act has changed substantially: Two big global crises – the world food
crises and the broader financial crises – have evolved two additional more economically and
politically driven motives – food security and secure financial returns - for undertaking FDI
for a number of countries (GRAIN, 2008).
Targeting the first motive “food security”, capital strong nations secure land for outsourcing
food production titled by newspapers such as the “Sueddeutsche.de” (January 2009) and the
“Financial Times Deutschland” (August 2009) as Neocolonialism1. According to GRAIN
(2008) especially countries that are net-importers such as Saudi Arabia, Japan, China and
India see this as an innovative long-term strategy to feed their people at an appropriate price
and with far greater security than heretofore. Since they rely on food imports, they are worried
about tightening markets resulting from the world food crises. On the other hand they are rich
1 A summary of latest newspaper article can be found under the land grab notebook released by GRAIN.
http://tinyurl.com/landgrab2008
2
of capital and are therefore seeking to cover the domestic food demand by gaining control of
farms in other countries.
The second new motive is to secure financial returns. Given the current financial meltdown,
all sorts of investors are turning to land as food prices increased in the last years and land
prices in many countries around the world are low. So there is money to be made by getting
control of the best soils (Grain, 2008).
Main continents where land was bought in the last three years are Asia, South America and
Africa. Africa is a continent with high endowments of natural resources especially fertile
agricultural land and on the other hand capital weak and therefore willing to receive capital
through selling or leasing land. In the latest newspaper articles especially Ethiopia, Kenya and
Madagascar are mentioned as countries where foreign countries try to buy or lease land
heavily.
Ethiopia is chosen for this case study since the countries government puts a lot of effort on
attracting FDIs in order to push agricultural and rural development. FDI flows in the
agribusiness sector have increased highly in Ethiopia in the last 3 years (since 2006). As
Ethiopia is among the most populous countries on the African continent, more than 45 % of
the population suffer from undernourishment (WFP, 2009) and ca. 40 % of the population live
from less than one US$ a day we would like to understand which consequences large amounts
of FDIs in the agricultural sector will have for the rural population.
In order to do so this study aims at analysing whether the above mentioned global reasons
(food security and security of financial returns) can also be seen for Ethiopia or whether other
reasons drive FDI inflows to Ethiopia. Through the use of country specific data bases and
complementary expert interview a detailed view of the investment development in Ethiopia
for the agricultural sector is provided for the years 2000 - 2008.
This paper will first give an overview on the development of FDI inflows into Africa in the
recent years. The overview will show that FDI inflows have increased differently in the
various parts of Africa (section 2). Ethiopia is thereby one country that has not received high
amounts of FDI inflows over time but where the interest of foreign countries has increased in
recent years when regarding the national investment database as well as the latest newspaper
articles. To interpret the development of the FDI inflows and hence resultant impacts on the
Ethiopian economy, a short overview of the current economic situation of Ethiopia is given in
section 3. Against this background information the database generated by the Ethiopian
Investment Agency is analysed to draw a picture of the development of FDI inflows over the

3
past years. As the political framework can have a significant influence on how attractive a
country can be for foreign investors, the main trade and investment agreements of the main
investor countries are summarised in section 5. Section 6 presents the results compiled by the
Ethiopian counterpart Dr. Getnet. Conclusions are drawn in section 7 containing a short
summary of the main results.

4
2 FDI evolvement in Africa
Africa is highly endowed with natural-, especially land resources. Over the past few years
investing in land has particularly become interesting for foreign investors against the
background of the global (food and financial) crises. Between 2005 and 2007 the overall FDI
inflows grew by nearly 80% from $29 billion to reach $53 billion, their highest level so far,
despite the global financial crises (UNCTAD, 2008). This is the highest percentage increase
of FDI inflows within the developing countries2. Figure 1 shows the development of total
African FDI inflows independent from a specific sector between 1997 and 2007. Further the
regional distribution of the FDI inflows among the five main sub-regions of Africa is stated.
In the World Investment Report 2008 by UNCTAD, this strong growth is explained as a
consequence of the booming global commodities market, rising corporate profitability of
investment and an increasingly FDI-friendly environment.
Figure 1: African FDI inflows, 1997-2007
0
5
10
15
20
25
30
35
40
45
50
55
1997 1998 1999 2000 2001 2002 2003 2004 2005 2006 2007
$ billion
South Africa
Central Africa
West Africa
East Africa
North Africa
Source: UNCTAD, 2008.
The African growth of FDI inflows is spread across 35 countries, and includes many natural
resource producers that have been attracting flows in the past few years, as well as new host
countries. North Africa attractes 42% of the FDI to the region in 2007 compared with 51% in
2006 and Sub-Saharan Africa attractes 58% of the flows, up from 49% in 2006. This slight
change in the distribution of the FDI inflows occures because large inflows to Nigeria and
2 Developing countries incorporate all countries from Africa, Latin America and the Caribbean as well as Asia
and Oceania (UNCTAD, 2008).

5
South Africa, combined with strong investments in Equatorial Guinea, Madagascar and
Zambia- each receiving about $1 billion or more inflows in 2007 – boosts overall FDI to Sub-
Saharan Africa (UNCTAD, 2008). In table 1 the distribution among African countries is listed
by range. The development of the single African regions between 2005 and 2007 can be
found in Annex 1.
Table 1: Distribution of FDI inflows among African host countries, by range, 2007
Range Host countries
Over $3.0 bn Nigeria, Egypt and South Africa
$2.0 bn to $2.9 bn Morocco, Libyan and Sudan
$1.0 bn to $1.9 bn Equatorial Guinea, Algeria and Tunisia
$0.5 bn to $0.9 bn Madagascar, Zambia, Ghana. Kenya, Democratic Republic of
Congo, Namibia, United Republic of Tanzania, Chad and
Burkina Faso
$0.2 bn to $0.4 bn Botswana, Mozambique, Côte dÌvoire, Uganda, Mali, Congo,
Mauritius, Cameroon, Gabon, Ethiopia and Seychelles
Less than $0.2 bn Djibouti, Cape Verde, Mauritania, Somalia, Guinea, Lesotho,
Sierra Leone, Senegal, Togo, Zimbabwe, Rwanda, Gambia,
Malawi, Benin, Liberia, Swaziland, São Tomé and Principe,
Central African Republic, Niger, Guinea-Bissau, Comoros,
Burundi, Eritrea and Angola
Source: UNCTAD, 2008.
The ten leading FDI host countries in Africa account for over 82% of the African inflows
(figure 2).
Figure 2: Top 10 recipients of FDI inflows, 2006-2007 (Billions of dollars)
Source: UNCTAD, 2008.

6
The top 10 host countries in 2007 share a number of common features: large reserves of
natural resources and/or active privatization programmes, liberalised FDI policies and active
investment promotion activities (UNCTAD, 2008).3
FDI inflows in 2007 to the five sub-regions of Africa differed with respect to their level,
growth and geographic distribution. North Africa is the main region into which FDI flows go,
accounting for $22 billion in 2007. The major industries that attracted FDI in North Africa
were processing industry and the financial sector. West Africa experiences a boom in the
primary sector4 and in the telecommunication sector, leading to another year of large inflows
($15.6 billion in 2007 and $15.8 billion in 2006).
The sub-region that ranks the lowest when looking at FDI inflows in Africa is East Africa
(including Ethiopia). Of course there are some countries that state an exception, as
Madagascar, Kenya or the Seychelles. The main sector that attracts FDI is the primary sector
which drove FDI inflows in 2007 to $4 billion compared to $2.4 billion in 2006. Central
Africa receives FDI inflows mainly from Asian investors in the primary and services sector.
It‟s total FDI inflows increase by 26% to $4 billion in 2007. The last sub-region is Southern
Africa. It experienced the highest growth among the sub-regions to $7 billion in 2007. Its
main investors are from Asia (China) in the finance sector and processing industry.
(UNCTAD, 2008)
Regarding the agribusiness sector (agricultural plus food processing sector) the FDI inflows
into the developing countries have nearly doubled between 2000 and 2006 increasing from
US$ 5 billion in 2000 up to US$ 9.1 billion in 2006. A further disaggregation of the data into
the single developing countries and into the sub-sectors of the agricultural sector that receive
the foreign investments is not possible. This is one reason why a case study is so sensible.
Case studies can give a detailed view of the development in a certain country and a specific
sector.
Although East Africa appears to be the region that has experienced the lowest FDI inflows
between 2005 and 2007 according to the World Investment Report 2008, its total FDI inflows
have doubled in this time period. Further, latest newspaper articles on FDI identify especially
East African countries such as Ethiopia, Kenya and Madagascar as potential host countries for
FDI inflows in the near future. Due to the good data availability, Ethiopia is chosen in this
3 Negative inflows in South Africa in 2006 are instances of reverse investment or disinvestment.
4 The primary sector includes the agricultural and the mining sector in the World Investment Reports by
UNCTAD
7
case study, for analysing how FDI inflows have developed for a certain sector (in this case the
agricultural sector) and what reasons stand behind this development.
3 Overview on Ethiopia’s economy
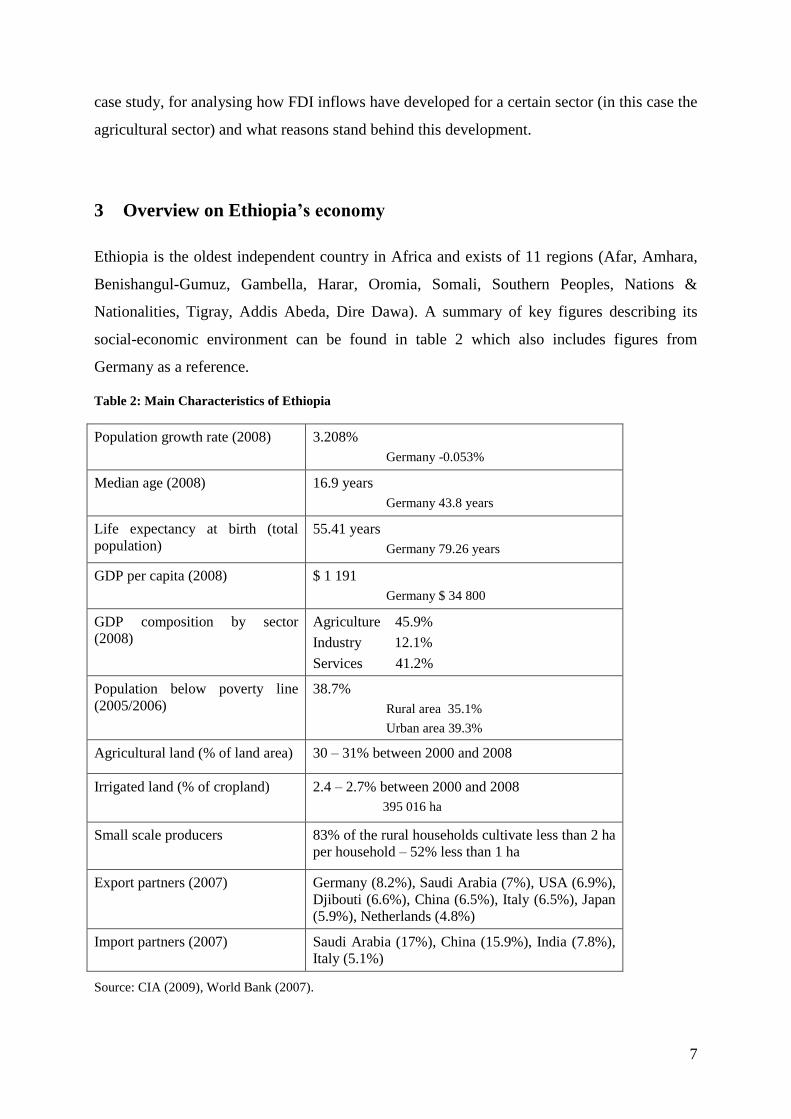
Ethiopia is the oldest independent country in Africa and exists of 11 regions (Afar, Amhara,
Benishangul-Gumuz, Gambella, Harar, Oromia, Somali, Southern Peoples, Nations &
Nationalities, Tigray, Addis Abeda, Dire Dawa). A summary of key figures describing its
social-economic environment can be found in table 2 which also includes figures from
Germany as a reference.
Table 2: Main Characteristics of Ethiopia
Population growth rate (2008) 3.208%
Germany -0.053%
Median age (2008) 16.9 years
Germany 43.8 years
Life expectancy at birth (total
population)
55.41 years
Germany 79.26 years
GDP per capita (2008) $ 1 191
Germany $ 34 800
GDP composition by sector
(2008)
Agriculture 45.9%
Industry 12.1%
Services 41.2%
Population below poverty line
(2005/2006)
38.7%
Rural area 35.1%
Urban area 39.3%
Agricultural land (% of land area) 30 – 31% between 2000 and 2008
Irrigated land (% of cropland) 2.4 – 2.7% between 2000 and 2008
395 016 ha
Small scale producers 83% of the rural households cultivate less than 2 ha
per household – 52% less than 1 ha
Export partners (2007) Germany (8.2%), Saudi Arabia (7%), USA (6.9%),
Djibouti (6.6%), China (6.5%), Italy (6.5%), Japan
(5.9%), Netherlands (4.8%)
Import partners (2007) Saudi Arabia (17%), China (15.9%), India (7.8%),
Italy (5.1%)
Source: CIA (2009), World Bank (2007).

8
Ethiopia is endowed with a lot of fertile land and in most regions with a sufficient amount of
rainfall. Still, almost 40% of the total population lives below the poverty line and this has not
changed significantly since 1995. 4-6 million people depend on international food assistance
even in years with good harvest. Due to increased food aid, the proportion of undernourished
population has decreased from 69% in 1995 down to 46% in 2004 (World Bank 2007). A
major reason for this high dependency on food aid is that even though the average annual
rainfall is sufficient with 848mm, most of the rain falls intensively, extremely spatial and with
very high temporal variability. This leads to high risks of annual droughts and intra-seasonal
dry spells as nearly all food crops in Ethiopia come from rainfed agriculture (FAOSTAT,
2005).
Ethiopia‟s poverty-stricken economy is based on agriculture, accounting for almost half of
GDP, 60% of exports and 80% of total employment. Under Ethiopia‟s constitution, the state
owns all land and provides long-term leases to the tenants. On average, 83% of the rural
households cultivate less than 2 ha per household and 52% less than 1 ha (FAOSTAT, 2005).
In 2007 the main important products especially regarding small scale productions are cattle
meat, roots and tubers, cow milk, maize, chillies and peppers, cereals, wheat, coffee, sorghum
and sheep meat (FAO statistics, 2009)5. Coffee is the major agricultural product with respect
to export flows. It accounts for 3% of the GDP and a quarter of the total population make a
living from this sector. Further main export products in 2006 after coffee are oilseeds, chat,
leather, gold, pulses, live animals, flowers, meat and fruit/vegetables (IMF, 2007)6.
The flower sector has only recently become an important agricultural sector for Ethiopia when
regarding the export potential. It is a relatively new but at the same time very dynamic sector.
Since 2001 up to 2007 the export value of flowers has increased from US$ 0.3 Mn up to US$
113 Mn (Joosten, 2007) which accounts for 7.8% of the total export value in 2007.
For attracting potential foreign investors many regions have invested in infrastructure so that
their agricultural land is accessible (Getnet, 2009).
Soil erosion is intensified in Ethiopia through different channels. Due to water erosion, which
is severe in the Ethiopian highlands, about 30,000 hectares of productive land are lost every
year, while two million hectares are irreversibly damaged. The rate of deforestation in
5 The production values of the single commodities in 2007 are: cattle meat (US$ 810 Mn), roots and tubers
(US$ 575 Mn), cow milk (US$ 447 Mn), maize (US$ 379 Mn), chillies and peppers (US$ 342 Mn), cereals
(US$ 335 Mn), wheat (US$ 331 Mn), coffee (US$ 266 Mn), sorghum (US$ 261 Mn), sheep meat (US$ 156 Mn) 6 The export values of the single commodities in 2006 are: coffee (US$ 354 Mn), oilseeds (US$ 211 Mn), chat
(US$ 89 Mn), leather (US$ 75 Mn), gold (US$ 65 Mn), pulses (US$ 37 Mn), live animals (US$ 28 Mn), flowers
(US$ 22 Mn), meat (US$ 19 Mn), fruit and vegetables (US$ 13 Mn)
9
Ethiopia is estimated at 80,000 to 200,000 hectares of land per year. Through the increased
deforestation, wind erosion is becoming increasingly severe in the semi-arid and Rift Valley
areas of the country (Taddese and Peden, 2006).
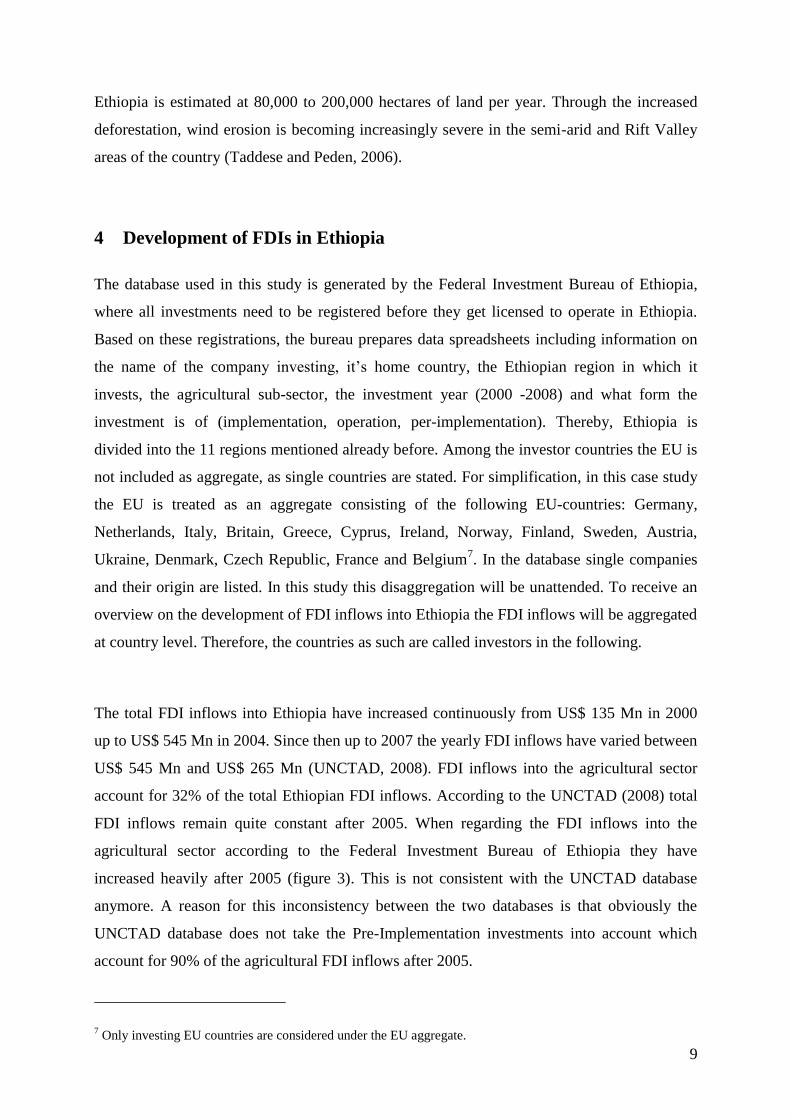
4 Development of FDIs in Ethiopia
The database used in this study is generated by the Federal Investment Bureau of Ethiopia,
where all investments need to be registered before they get licensed to operate in Ethiopia.
Based on these registrations, the bureau prepares data spreadsheets including information on
the name of the company investing, it‟s home country, the Ethiopian region in which it
invests, the agricultural sub-sector, the investment year (2000 -2008) and what form the
investment is of (implementation, operation, per-implementation). Thereby, Ethiopia is
divided into the 11 regions mentioned already before. Among the investor countries the EU is
not included as aggregate, as single countries are stated. For simplification, in this case study
the EU is treated as an aggregate consisting of the following EU-countries: Germany,
Netherlands, Italy, Britain, Greece, Cyprus, Ireland, Norway, Finland, Sweden, Austria,
Ukraine, Denmark, Czech Republic, France and Belgium7. In the database single companies
and their origin are listed. In this study this disaggregation will be unattended. To receive an
overview on the development of FDI inflows into Ethiopia the FDI inflows will be aggregated
at country level. Therefore, the countries as such are called investors in the following.
The total FDI inflows into Ethiopia have increased continuously from US$ 135 Mn in 2000
up to US$ 545 Mn in 2004. Since then up to 2007 the yearly FDI inflows have varied between
US$ 545 Mn and US$ 265 Mn (UNCTAD, 2008). FDI inflows into the agricultural sector
account for 32% of the total Ethiopian FDI inflows. According to the UNCTAD (2008) total
FDI inflows remain quite constant after 2005. When regarding the FDI inflows into the
agricultural sector according to the Federal Investment Bureau of Ethiopia they have
increased heavily after 2005 (figure 3). This is not consistent with the UNCTAD database
anymore. A reason for this inconsistency between the two databases is that obviously the
UNCTAD database does not take the Pre-Implementation investments into account which
account for 90% of the agricultural FDI inflows after 2005.
7 Only investing EU countries are considered under the EU aggregate.

10
According to figure 3, up to 2005 the level of FDI inflows ranged under $ 500 million each
year. When regarding the spreading between the three different possible forms of investment8
it is quite equal. After 2005 the investment flows increase heavily. Total FDI inflows now
reach about $ 3500 million each year. This increase appears mainly through Pre-
Implementation investments. This sort of investment has increased by 600% comparing
before and after 2005. The rate of investments type “Implementation” and “Operation” has
decreased slightly. A Pre-Implementation investment indicates that for some specific reason
investors want to secure the possibility of producing in a certain agricultural sector in
Ethiopia. Possible motives for this recent development will be discussed further on.
Figure 3: FDI inflows into the agricultural sector
0
500
1000
1500
2000
2500
3000
3500
2000 2001 2002 2003 2004 2005 2006 2007 2008
$ Million
Implementation
Operation
Pre-Implementation
Source: Federal Investment Bureau of Ethiopia (2009)
Generally, next to others, three main reasons can account for this significant change in the
development of the FDI inflows. The first one is a significant change in the exchange rate of
the main investors, leading to a depreciation of the Ethiopian Birr compared with the
currencies of the investors. The second reason, especially against the background of the world
food crises, is the grabbing of natural resources to secure the food demand in the investor‟s
country. The investment climate of Ethiopia can be seen as the third reason which will be
8 The three different forms are 1) Implementation = the production plant is being built, 2) Operation = the
production plant is already in use, 3) Pre-Implementation = Up to now land, machines, building materials etc.
have been bought (Federal Investment Bureau of Ethiopia, 2009)

11
discussed in more detail further on as it is more complex and indicates how FDI-friendly
Ethiopia is.
Exchange rate
In figure 4 the development of the exchange rate of the 5 main investors is shown over the
time period 2000 to 2008. Except for the EU, the exchange rate of the other four investors
remains stable over time. This shows that the assumed reason of depreciation cannot explain
the high increase of the total investment flows into the agricultural sector and the shift from
operational or implemental investments towards pre-implemented investments.
Figure 4: Development of the Exchange rate of the main investors, 2000 - 2008
0
2
4
6
8
10
12
14
2000 2001 2002 2003 2004 2005 2006 2007 2008
ETB/LCU
EU
India
Israel
SaudiArabia
USA
Source: OANDA (2009) and World Bank (2007)
Land Grabbing
As already mentioned, Pre-Implementation investment means that the company has already
acquired all the necessary requisites to start operation but has not started yet. This also
includes land which can only be leased in Ethiopia9. As investments have increased highly
between 2006 and 2008 it can be assumed that also the securing of land through long-time
9 In the interviews undertaken by Dr. Getnet it became clear that land can only be leased for a time period
between 20 and 45 years.
12
leasing contracts for food production has increased. In the further steps of the analysis this
aspect has to be kept in mind and when regarding the main specific sectors where the
investment flows go to it may become clearer if this reason really appears for Ethiopia.
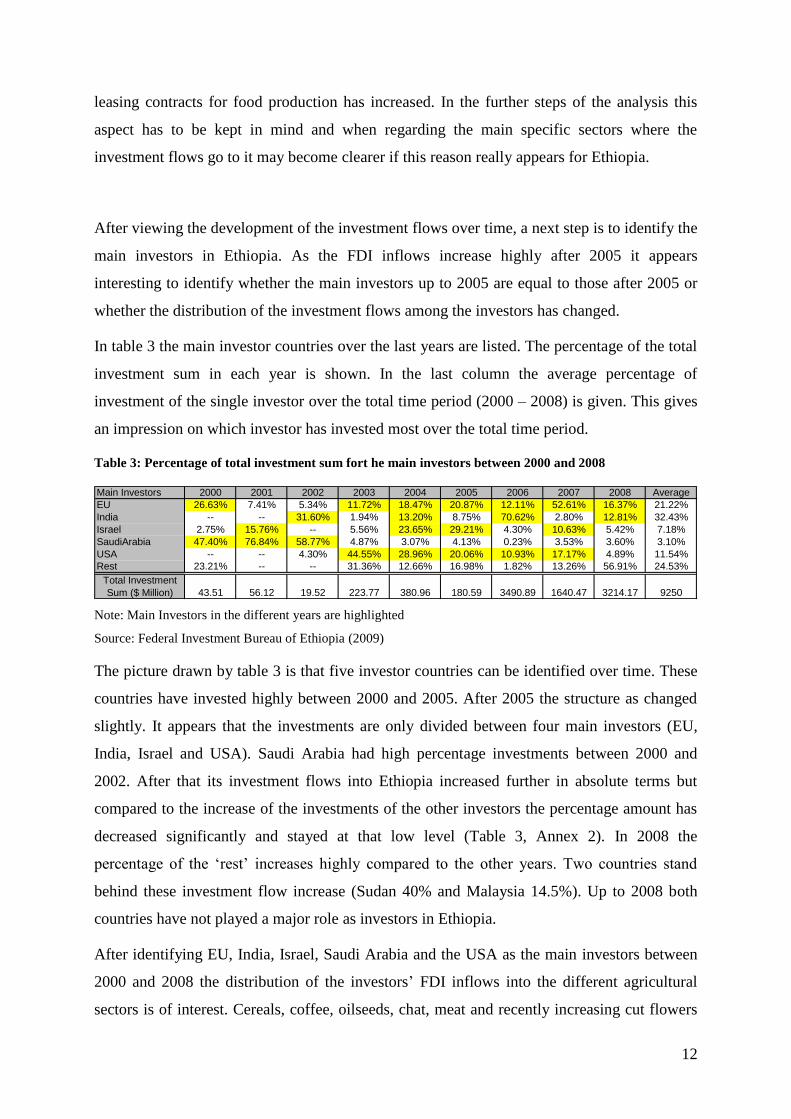
After viewing the development of the investment flows over time, a next step is to identify the
main investors in Ethiopia. As the FDI inflows increase highly after 2005 it appears
interesting to identify whether the main investors up to 2005 are equal to those after 2005 or
whether the distribution of the investment flows among the investors has changed.
In table 3 the main investor countries over the last years are listed. The percentage of the total
investment sum in each year is shown. In the last column the average percentage of
investment of the single investor over the total time period (2000 – 2008) is given. This gives
an impression on which investor has invested most over the total time period.
Table 3: Percentage of total investment sum fort he main investors between 2000 and 2008
Main Investors 2000 2001 2002 2003 2004 2005 2006 2007 2008 Average
EU 26.63% 7.41% 5.34% 11.72% 18.47% 20.87% 12.11% 52.61% 16.37% 21.22%
India -- -- 31.60% 1.94% 13.20% 8.75% 70.62% 2.80% 12.81% 32.43%
Israel 2.75% 15.76% -- 5.56% 23.65% 29.21% 4.30% 10.63% 5.42% 7.18%
SaudiArabia 47.40% 76.84% 58.77% 4.87% 3.07% 4.13% 0.23% 3.53% 3.60% 3.10%
USA -- -- 4.30% 44.55% 28.96% 20.06% 10.93% 17.17% 4.89% 11.54%
Rest 23.21% -- -- 31.36% 12.66% 16.98% 1.82% 13.26% 56.91% 24.53%
43.51 56.12 19.52 223.77 380.96 180.59 3490.89 1640.47 3214.17 9250
Total Investment
Sum ($ Million)
Note: Main Investors in the different years are highlighted
Source: Federal Investment Bureau of Ethiopia (2009)
The picture drawn by table 3 is that five investor countries can be identified over time. These
countries have invested highly between 2000 and 2005. After 2005 the structure as changed
slightly. It appears that the investments are only divided between four main investors (EU,
India, Israel and USA). Saudi Arabia had high percentage investments between 2000 and
2002. After that its investment flows into Ethiopia increased further in absolute terms but
compared to the increase of the investments of the other investors the percentage amount has
decreased significantly and stayed at that low level (Table 3, Annex 2). In 2008 the
percentage of the „rest‟ increases highly compared to the other years. Two countries stand
behind these investment flow increase (Sudan 40% and Malaysia 14.5%). Up to 2008 both
countries have not played a major role as investors in Ethiopia.
After identifying EU, India, Israel, Saudi Arabia and the USA as the main investors between
2000 and 2008 the distribution of the investors‟ FDI inflows into the different agricultural
sectors is of interest. Cereals, coffee, oilseeds, chat, meat and recently increasing cut flowers

13
are the main agricultural sub-sectors of the Ethiopian economy when regarding the export
value. But are these the main sectors where foreign investors invest in or do they chose other
sectors more important for the foreign economy?
For answering this question, the main investors with their percentage value of their total
investments into the main agricultural sectors are stated under table 4. The total period under
consideration is divided into two parts (2000-2005 and 2006-2008) according to the reckoned
differences in the development of the FDI inflows seen in figure 3.
Table 4: Main Investors and the main agricultural sectors 10
2000 - 2005 2006 - 2008
EU Flori/Horticulture Meat production$ 99 Mn (67.72%) $ 607 Mn (38.75%)
Biofuel$ 492 Mn (31.39%)
Flori/Horticulture$ 242 Mn (15.47%)
India Flori/Horticulture Sugar$ 66 Mn (91.21%) $ 2037 Mn (80.45%)
Israel Flori/Horticulture Flori/Horticulture$ 192 Mn (82.44%) $ 178 Mn (44.98%)
Biofuel$ 98 Mn (24.77%)
Vegetable production$ 60 Mn (15.06%)
SaudiArabia Meat production Meat production$ 45 Mn (45.19%) $ 66 Mn (41.75%)
Flori/Horticulture Biofuel$ 31 Mn (31.65%) $ 30 Mn (19.16%)
USA Food production Flori/Horticulture$ 66 Mn (28.35%) $ 217 Mn (30.48%)
Biofuel Meat production$ 65 Mn (28.05%) $ 159 Mn (22.41%)
Flori/Horticulture$ 35 Mn (14.93%)
Source: Federal Investment Bureau of Ethiopia (2009)
It appears that between 2000 and 2005 the main investment flows occur in the
flori/horticulture sector. The EU, India and Israel invest more than 60% of their total FDI
inflows in this sector. For Saudi Arabia and USA this sector is also important but they also
have high investment flows in further agricultural sectors (table 4).
After 2005, the major sub-sectors receiving FDI inflows changed slightly. FDI‟s into the
flori/horticulture still appear and in absolute value remain stable over time (figure 5) but
10 The food production sector is defined as the processing industry in the agricultural sector. Compared to this
the meat production sector only includes the raising and slaughtering of animals such as bulls, pigs etc.

14
investments in meat production and Biofuel have increased highly between 2006 and 2008
regarding all main investors (table 4).
This change in priority becomes even more apparent in figure 5, where total FDI inflows for
the single major sub-sectors in $ Million – independent of the investor and the region are
shown.
Figure 5: FDI inflows into the single main sub-sectors, 2000 - 2008
0
500
1000
1500
2000
2000 2001 2002 2003 2004 2005 2006 2007 2008
$ Million
Biofuel
Vegetable
Meat
Food
FloriHorti
Source: Federal Investment Bureau of Ethiopia (2009)
Since 2006 new agricultural sub-sectors for the foreign investors can be identified.
Investments in food and meat production as well as in Biofuel production increase highly. The
chosen agricultural sub-sectors are very export orientated leading to the assumption that
investors in Ethiopia invest for other reasons that market-seeking. Through analysing the
development of the export flows of these sectors between 2000 and 200711
it may be possible
to identify specific reasons why FDI flows into these sectors have increased (increase of
number of investing firms and their average investment sum).
Export flows of the flori/horticultural sector (as the traditional investment sector) and export
flows of the meat sector (attracting only recently high FDI inflows) are shown in figure 6 and
11 Export flows are only available up to 2007 in UNComtrade (2009)

15
7.12
Both figures show the total export flows (world) as well as the value of export flows into
the main investor countries if existent.
Regarding the export flows of the flori/horticultural sector it appears that most of the exports
go to the EU (80%) and parts to the USA. As Israel and the EU are the main investors in this
sector (both hold 20% of the total investment sum) with Israel receiving no high export flows
it can be concluded that the EU and also Israel have invested in the flori/horticultural sector of
Ethiopia to expand their cultivation in a country where production costs are low so that they
can provide the EU and the USA with low price products. Hence, they stay competitive
against other producers.
Figure 6: Total Export flows of Flori/Horticulture and divided into the main investor countries
0
20000
40000
60000
80000
2001 2002 2003 2004 2005 2006 2007
$ '000
USA
SaudiArabia
Isreal
EU
World
Source: UNComtrade (2009).
In comparison with the flori/horticultural sector shown in figure 6, figure 7 pictures the
development over time of the meat export flows. Here a different picture can be drawn. It
appears that Saudi Arabia receives 50 percent of the total export flows. As Saudi Arabia is the
main investor over the whole period (table 4) one can concluded that Saudi Arabia meet their
domestic demand partly through the meat production in Ethiopia undertaken by Saudi
Arabian companies. From this it can be assumed that Saudi Arabia tries to secure their
domestic food demand by investing in foreign economies.
12 Developments of Biofuel and food production export flows can not be pictured as data on a bilateral level do
not exist in UNComtrade. For Biofuel trade data is not easy to obtain, but generally one can say that increased
investments in this sector can be found in many countries in the world. The sector has received grown attention
in recent years because some countries like the EU or the USA support this sector highly on the one hand and on
the other hand, Biofuel production becomes more competitive in times of high oil prices.

16
Figure 7: Total Export flows of meat and divided into the main investor countries
0
5000
10000
15000
20000
2001 2002 2003 2004 2005 2006 2007
$ '000
SaudiArabia
EU
World
Source: UNComtrade (2009).
After viewing the main investors and their main agricultural sectors of interest the question
arises whether these investments are spread across Ethiopia or whether certain regions are
preferred compared to others.
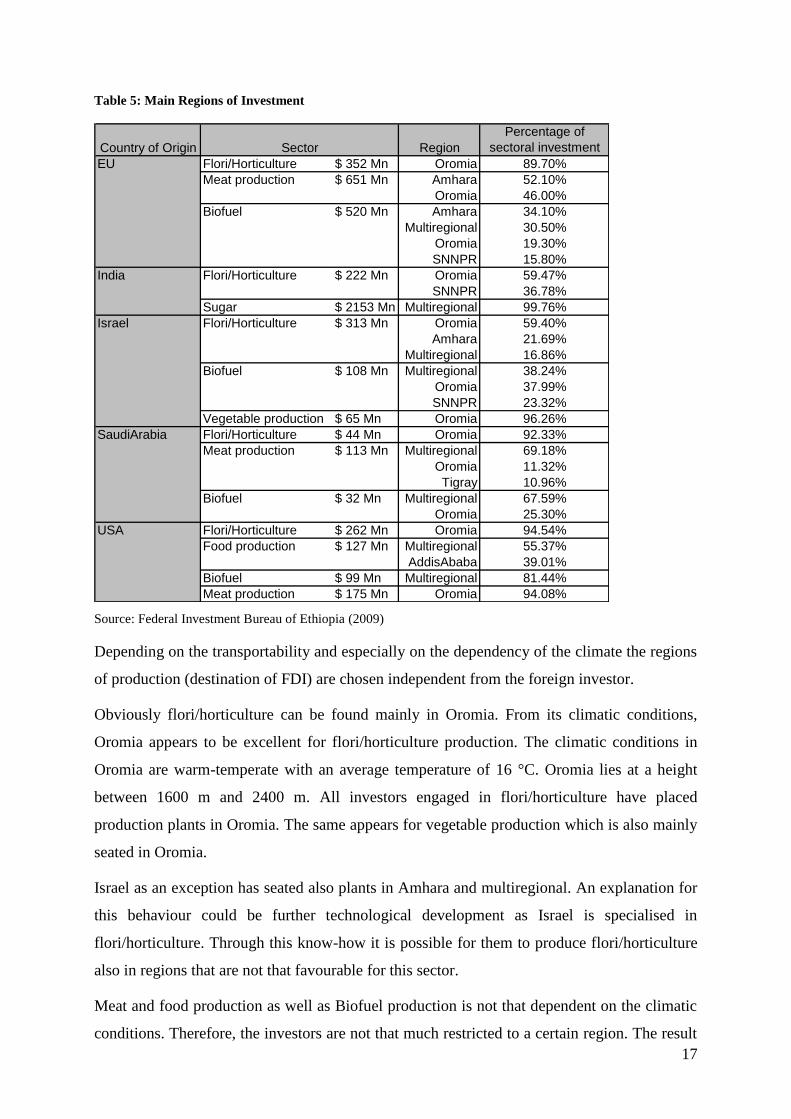
Table 5 shows into which regions the investors invest mainly for the main sectors. The
percentage behind the region shows how much of the total investment sum in a specific sector
are invested in the main region(s). For example: The EU has invested US$ 352 Mn into the
flori/horticulture sector between 2000 and 2008. Of this sum, the EU invests 89.70% into the
region of Oromia, which is located in the middle-east of Ethiopia.
17
Table 5: Main Regions of Investment
Country of Origin Region
Percentage of
sectoral investment
EU Flori/Horticulture $ 352 Mn Oromia 89.70%
Meat production $ 651 Mn Amhara 52.10%
Oromia 46.00%
Biofuel $ 520 Mn Amhara 34.10%
Multiregional 30.50%
Oromia 19.30%
SNNPR 15.80%
India Flori/Horticulture $ 222 Mn Oromia 59.47%
SNNPR 36.78%
Sugar $ 2153 Mn Multiregional 99.76%
Israel Flori/Horticulture $ 313 Mn Oromia 59.40%
Amhara 21.69%
Multiregional 16.86%
Biofuel $ 108 Mn Multiregional 38.24%
Oromia 37.99%
SNNPR 23.32%
Vegetable production $ 65 Mn Oromia 96.26%
SaudiArabia Flori/Horticulture $ 44 Mn Oromia 92.33%
Meat production $ 113 Mn Multiregional 69.18%
Oromia 11.32%
Tigray 10.96%
Biofuel $ 32 Mn Multiregional 67.59%
Oromia 25.30%
USA Flori/Horticulture $ 262 Mn Oromia 94.54%
Food production $ 127 Mn Multiregional 55.37%
AddisAbaba 39.01%
Biofuel $ 99 Mn Multiregional 81.44%
Meat production $ 175 Mn Oromia 94.08%
Sector
Source: Federal Investment Bureau of Ethiopia (2009)
Depending on the transportability and especially on the dependency of the climate the regions
of production (destination of FDI) are chosen independent from the foreign investor.
Obviously flori/horticulture can be found mainly in Oromia. From its climatic conditions,
Oromia appears to be excellent for flori/horticulture production. The climatic conditions in
Oromia are warm-temperate with an average temperature of 16 °C. Oromia lies at a height
between 1600 m and 2400 m. All investors engaged in flori/horticulture have placed
production plants in Oromia. The same appears for vegetable production which is also mainly
seated in Oromia.
Israel as an exception has seated also plants in Amhara and multiregional. An explanation for
this behaviour could be further technological development as Israel is specialised in
flori/horticulture. Through this know-how it is possible for them to produce flori/horticulture
also in regions that are not that favourable for this sector.
Meat and food production as well as Biofuel production is not that dependent on the climatic
conditions. Therefore, the investors are not that much restricted to a certain region. The result

18
is that production of these sectors appears in more different regions. As the focus on specific
sectors has slightly changed from 2000 to 2008, more regions receive investment flows now.
Up to 2005 it was mainly Oromia. But after 2005 also Amahara, SNNPR, Tigray and on a
multiregional base other regions receive also FDI flows.
Summarising this section one can say that through the analysis of the database generated by
the Federal Investment Bureau of Ethiopia it becomes apparent that trends in FDI inflows
have changed after 2005. Different sectors then before 2005 have become more important for
the foreign investors with all of the chosen sectors being very export-orientated. Also the
regional distribution of FDI inflows as changed slightly derived from the shift in sub-sectors.
Depending on the regarded sub-sector different reasons seem to appear for the increase in FDI
inflows. Investors in the flori/horticultural sector seek for more efficiency. In contrast,
investors in the meat sector seem to try to secure their own domestic food supply such as
Saudi Arabia.
These identified changes need further investigation especially against the background of the
impact of FDIs on rural development, poverty and food security in Ethiopia. The present case
study cannot answer these questions as further surveys would be necessary for these
continuative questions.
Changes in the political framework and the investment procedure for single firms have not
been regarded up to now as the political conditions are very complex and will be shown in
detail in the next sections.
5 Ethiopia’s Political Framework
After analysing the changes in the FDI inflows in Ethiopia over the last years, it is important
to take a look at the existing trade and (if established) investment agreements between the
main investor countries and Ethiopia. The range of the investment and trade agreements show
how FDI-friendly the environment is or whether high regulations are in place. As one
assumed reason for the increase in FDI inflows is food security, favourable trade agreements
between Ethiopia and the investor countries would have a positive affect on investment
decisions.
Ethiopian trade agreements

19
On a multilateral level, Ethiopia has applied for becoming a member country of the WTO in
2003. At the moment negotiations are still carried out. Next to this, Ethiopia has few bilateral
trade agreements, the main ones are adressed here.
Ethiopia- EU
As an ACP country Ethiopia had almost a duty-free access for its products imported to the EU
markets up to 2007. According to the WTO, these non reciprocal preferential treatment was
against the WTO regulations (Art. I) and had to expire by the end of 2007. Because of that,
the EU currently negotiates the Economic Partnership Agreements (EPAs) with the ACP
countries. These include a scheme to create a free trade area (FTA). Further, Ethiopia as an
LDC country is allowed to trade under the “Everything but Arms” (EBA) agreement. This
agreement includes unilateral trade preferences with almost duty-free access for most
products even though very strict rules of origin are implemented. (IEDG, 2008)
Ethiopia- Africa
COMESA (Common market for Eastern and Southern Africa) was founded 1994 following
up the Preferential Trade Area for Eastern and Southern Africa (PTA) which already existed
since 1981. COMESA contains of 20 member states including Ehtiopia with a population of
390 million. The main targets were the establishment of a free trade area with capital ,
investment, goods and services being able to flow freely in a customs union. A common
customs declaration has been implemented and in 2000 a free trade area between nine
(Dschibuti, Egypt, Kenya, Madagascar, Malawi, Mauritius, Sudan, Sambia and Simbabwe) of
the 20 member states was implemented (COMESA, 2009).
Ethiopia- USA
The most important agreement between USA and Ethiopia is the African growth and
opportunity act (AGOA) which was signed into law in May 2000. The first Title of this
agreement comprises the extension of certain trade benefits towards the Sub-Saharan Africa
(where Ethiopia is included). The negotiations are on reciprocal and mutually beneficial trade
agreements and in the long run are to include the posibility of establishing a free trade area.
(AGOA, 2000)
A second major agreement between the USA and Ethiopia occurs through the trade and
investment framework agreements (TIFAs) between the USA and COMESA. It entered into
force in October 2001. Its target it the creation and expansion of trade and investments
between the two parties (USTR, 2001).
20
Ethiopia- India
A first trade agreement between India and Ethiopia was signed in 1982. It only included very
specific products and was not a general agreement on all agricultural products. At the 5th
meeting of the India-Ethiopia Joint Trade Commission, several further bilateral trade
agreements are expected in 2008. Some in leather, other in apparel fashion (Thaindian News,
2008).
Ethiopian investment agreements
Over the past few years, African countries have increased their efforts to develop or enhance
their national policies and laws with a view to improving the investment climate. Only
recently, in May 2007, COMESA adopted an agreement for a Common Investment Area,
which envisages a free investment area by 2010. The Agreement aims at attracting and
promoting sustainable FDI by gradually eliminating restrictions and conditions relating to
investment and operation of projects. (COMESA, 2009)
Ethiopia on its own, established bilateral investment treaties with China, Denmark, Italy,
Kuwait, Malaysia, Netherlands, Russia, Sudan, Switzerland, Tunisia, Turkey, Yemen and
only recently with Djibouti. Furthermore, double taxation treaties13
are implemented between
Ethiopia and Italy, Kuwait, Romania, Russia, Tunisia, Yemen, Israel and South Africa. An
investment agreement with the whole EU does not exist yet (U.S. Department of State, 2008).
The USA has bilateral investment protection agreements with Ethiopia. The investment
incentive agreement with the United States provides investment support through its Overseas
Private Investment Corporation (OPIC) in the form of investment insurance and reinsurance,
debt or equity investment and investment guarantees. On the other hand the government of
Ethiopia provides exemption of taxes for all operations and activities undertaken by OPIC in
connection with any investment support, and all payments, whether of interest, principal, fees,
dividends, premiums or proceeds from liquidation of assets or any other nature. In addition,
OPIC will not be subject to any taxes in connection with any transfer which occurs as a result
of OPIC role as a creditor in support of investment in Ethiopia. This investment incentive
agreement was signed on 24th October 2000 (Getnet, 2009).
13 Double taxation treaties exist between many countries on a bilateral basis to prevent double taxation (taxes
levied twice on the same income, profit, capital gain, inheritance or other item). They are Double Taxation
Avoidance Treaties i.e. treaties to avoid tax is levied twice. For details see EIA (2008a:10).

21
The Netherlands have signed an agreement on encouragement and reciprocal protection of
investment with the government of Ethiopia. This agreement guarantees transfers such as
profits, interest, dividends in freely convertible currency of payments related to investment.
For a company from the Netherlands investing in Ethiopia this would mean that they would
not have to pay any tax and that profits can flow back to the Netherlands without any
restircitions (Getnet, 2009).
Regarding the development of the main political agreements it becomes apparent that
Ethiopia tries to ease trade between itself and the investor countries as well as making FDI
inflows easier. Ethiopia appears to be an FDI-frienly environment with the target of
increasing the relaxation of regulations.
Next to political agreements there are regulations firms face when trying to invest in Ethiopia.
These regulations will be viewed below.
6 Company regulations for investing - Results of the interviews14
In 1991/92 an incisive reform process on regulations of foreign investments started. The
regulatory regime governing FDI and privileges provided to FDI in Ethiopia underwent
significant changes15
. Government relaxed the minimum capital required for foreign investors
in its series of investment amendments e.g. the Ethiopian FDI policy does not require foreign
investor to meet specific performance goals or guidelines in terms of export, foreign exchange
restrictions for imports, minimum local content levels in manufactured goods, or employment
limits on expatriate staff anymore. In the following, the regulatory regime for FDI and
privileges provided to foreign investors are discussed.
6.1 Regulations and privileges
FDI across all sectors can be undertaken either in sole proprietor or jointly with domestic
investor or with the Government of Ethiopia. In general there is a minimum investment
capital requirement based on the type of the investors16
. This minimum capital requirement is
not applicable for FDI that exports ≥75% of its output and/or reinvests its profit. It should be
14 Section 6 is generated from a report written by Dr. Getnet, my counterpart in Ethiopia. Annex 3 describes the
background of his report. 15
The key proclamations and regulations of these changes are 7/1996, 37/1996, 35/1998, 36/1998, 116/1998,
168/1999, 280/2002, 84/2003, 373/2003, and 146/2008. 16
For details see Article 11 of the Investment Proclamation No. 280/2002.

22
noted, that there are areas where foreign investment is not permitted and therefore are
reserved for domestic investors1718
. These general restrictions are not applicable for foreign
investors in the agricultural sector.
In Ethiopia land can only be leased. The lease period ranges between 20 and 45 years.
Regarding the lease price of agricultural land, the price is determined based on each region‟s
land use regulation. For example, in Oromia regional state, the lease price of rural land varies
depending on the development level of that particular zone and its accessibility to roads. The
rental price ranges from Birr 70.40 to Birr 135 per hectare per year. Investors who will be
engaged in forestry can get land free of charge and those who will cultivate permanent crops
such as tea and coffee are exempted from lease for the first four years.
Foreign investors are allowed to hire qualified foreign nationals necessary for the
implementation of their projects. A foreign investor can hire foreign nationals on top
management position without any restriction upon obtaining the prior consent of the
Ethiopian Investment Agency19
.
FDI projects producing for export, particularly investments in the horticultural sector have
priority to get loan from the Development Bank of Ethiopia but they are also allowed to
obtain loan from foreign countries and are permitted to repay the principal and interest in
convertible foreign currency20
.
Investment guarantees for FDI include full repatriation of capital and profits. This
encompasses profits, dividends, interest payments on foreign loans, asset sale proceeds and
technology transfer payments. There is also a guarantee against expropriation21
. Furthermore,
the Ethiopian government has tried to provide investment guarantee and protection by being a
member of various agencies and organization such as MIGA, ICSID, and WIPO22
.
Foreign investors are allowed to remit profit and dividends accruing from investment,
principal and interest payment on foreign loans, payments related to technology transfer or
17 Domestic investor means an Ethiopian or a foreign national permanently residing in Ethiopia or a foreign
national but Ethiopian by birth and desiring to be considered as a domestic investor. 18
For details see Article 5, 6, 7, and 8 of the Investment Proclamation No. 280/2002 and the EIA (2008a:23-24). 19
For details see Article 36 of the Investment Proclamation No 280/2002 20
For details see Article 19 of the Investment Proclamation No. 280/2002 21
Exceptions appear in major cases of public interest when full market value compensation will be paid
promptly which can also be remitted at any convertible currency at the prevailing exchange rate on the date of
remittance. See Article 21 of the investment Proclamation No. 280/2002. 22
MIGA stands for Multilateral Investment Guarantee Agency (MIGA) which issues guarantees against non-
commercial risks to enterprise that invests in signatory countries. ICSID for International Centre for Settlement
of Investment Disputes between States and National of other States, and WIPO for World Intellectual Property
Organisations.

23
management agreement registered in accordance with the proclamation, proceeds from the
sale/liquidation of an enterprise, and proceeds from the transfer of shares or of partial
ownership of an enterprise to a domestic investor at any convertible currency at the prevailing
exchange rate on the date of remittance23
. Expatriates employed in an enterprise may also
remit salaries and other payments accruing from their employment.
6.2 Exemptions
FDI in the agricultural sector is eligible for all exemptions24 which will be discussed below.
Investors in all sectors of the Ethiopian economy including foreign investors who will be
engaged in agricultural activity are exempted from the payment of custom duties and other
taxes levied on imports of all capital goods (machinery, equipment and accessories) and
construction materials necessary for the establishment of new projects or expansion/upgrading
of the existing one. However, these capital goods and construction materials shall be superior
in quality, quantity and price compared to locally produced ones25
. Import of ambulances for
employees is exempted from custom duty.
The exemption of income tax begins from the day of production. The different conditions for
income tax exemption26
and according to those the different length of income tax exemption
are summarised in table 6.
Table 6: Conditions and periods of income tax exemption
Condition for income tax exemption Period of Income tax
exemption
Period of Income tax
exemption for
investments made in
underdeveloped regions
The FDI project exports at least 50% of its production 5 years 6 years
The FDI project exports less than 50% of its production 2 years 3 years
The FDI project supplies an exporter with at least 75% of its products 5 years 6 years
The FDI project is declared as facing special conditions by the BOI Up to 7 years Up to 8 years
The FDI project is declared as facing special conditions by the Council of
MinistriesMore than 7 years More than 8 years
The FDI project only produces for the local market but is necessary
according to the BOI2 years 3 years
An expansion or upgrading increases the production value by 25% and
50% of the total production is exported2 years 3 years
Source: Article 2 of Regulation No. 146/2008 and Article 4 and 5 of Regulation No. 84/2003.
23 For details see Article 20 of the Investment Proclamation 280/2002.
24 Investment incentives provided by the Ethiopian government are declared by the Council of Ministers
Regulation No. 84/2003 and Regulation No. 146/2008. 25
The Revenue and Custom Authority which is the principal body to review and grant the incentives has
specified the magnitude and types of machineries to be imported duty free. Interview with Mr. Misrak Seyoum,
Team Leader, Agriculture and Construction Sector Team, Revenue and Customs Authority on detailed
definition. 26
See Article 2 of Regulation No. 146/2008 and Article 4 and 5 of Regulation No. 84/2003.

24
Foreign investors engaged in agro-processing activities or in the production of agricultural
products are exempted from paying income tax for the period ranging between 2 to 8 years. In
general it can be stated that the higher the proportion of produced goods for export, the longer
the period of income tax exemption. Foreign-owned firms that export at least 50% of their
production or supply an exporter with at least 75% of their output are eligible for income tax
exemption for 5 years. In the case lower than this, FDI projects receive only 2 years of income
tax exemption. The Board of Investment (BOI) as well as the Council of Ministries may,
under special circumstances, grant exemption from income tax under special circumstances
stated under Article 4 sub-article 4 of Regulation No. 84/2003.
Further, investments necessary for expanding or upgrading the existing agro-processing
activities or the production of agricultural products are eligible for income tax exemption for
2 years provided that at least 50% of the output is exported and the firm‟s production value
increases by over 25%. As producing for the domestic market is also necessary the BOI can
decide an income tax exemption for 2- 3 years for those firms.
In addition to all these incentives, FDI in all sectors are exempted from the payment of sales
and excise taxes for export commodities.
It can be concluded that firm regulations on FDI have become extensively FDI- and export-
supportive since1991/92.
7 Conclusions
Over the last few years new motives next to the traditional ones have evolved for undertaking
FDI – food security and security of financial returns. This has lead to a high increase of the
global FDI flows in the last four years. Major recipients of these increased inflows are Asia,
South America and Africa. An increasing interest of foreign investors in Africa is mirrrowed
in the increase of FDI between 2005 and 2007 by nearly 80% according to the WIR 2008. In
the last years when regarding single African states the distribution of the FDI inflows is
changing. Especially Ethiopia, Kenya and Madagascar appear to attract the interest of
investors.
This study has given a first regional overview of the development of FDI inflows over the last
decade in Ethiopia. The general political trade and investment agreements with the main
investor countries show that Ethiopia has an FDI-friendly environment but this cannot explain
the heavy increase of FDI inflows over the last three years alone. But when regarding the

25
investment proceeding at firm level it becomes obvious how open the Ethiopian agricultural
sector is towards FDI and here especially towards export orientated investments.
The investor has as an investment guarantee the possibility of full repatriation of capital and
profits. Further, tax regulations seem to be very favorable. All investors who are engaged in
agricultural activities are exempted from the payment of custom duties and other taxes levied
on imports of all goods and construction materials necessary for the establishment of new
projects or the expansion of existing ones. Depending on the proportion of the export
orientation, foreign-owned agricultural firms are exempted from paying income tax for a
period ranging between 2 to 8 years. FDI in all sectors are exempted from the payment of
sales and excise taxes for export commodities. All these aspects have helped to attract FDI
inflows especially in the last few years.
The FDI inflows have to be divided into two stages. The first one is between 2000 and 2005
and the second one is from 2006 onwards. Up to 2005 mainly investments were undertaken of
the type “implementation” and “operation”, meaning that the production plants were rapidly
in use. The main sector was the flori/horticulture sector seated mainly in Oromia. Oromia was
thereby chosen because of the climatic conditions necessary for the flori/horitculture
production. Even though investment in the sector creates several job opportunities in rural
areas leading to a positive social development it might confront the local infrastructure with
serious challenges - without sustainable water, waste and pesticide management the
flori/horticulture sector the production leads to long time negative ecological effects.
After 2005 “pre-implementation” investments are mainly undertaken with an increase of the
total agricultural FDI inflows by 600%. Further a change in the main sectors of investment
can be seen. From 2006 on the main sectors are next to the flori/horticultural sector the meat
and biofuel sector. Because of this, the regions of investment have also changed slightly as
they are not so dependent on the climatic conditions anymore and these investments require
much more land than the horticultural sector does. These land intensive investments might
cause extreme negative effects on food security and poverty – especially because of possible
competition on fertile production land and water with domestic farmers. For a country like
Ethiopia were more than 45% of the total population are food insecure and one of the main
reasons is the low availability of fertile land (in combination with the high overuse of arable
land) this development seems to drive rural development in the complete wrong direction.
How FDI inflows will in the short and long-term influence the development of Ethiopia‟s
economy as well as the ecological and social rural development and how sustainable this

26
development will be, depends on the international policy framework, on the Ethiopian
government and on the single investors.
At the moment the regulations are very investor-friendly. Measures that would encourage
sustainable development seem to have to arise from the investor himself. Without doubt great
investments in the agricultural sector are necessary for a sustainable development of the
agricultural sector and to fight rural poverty and hunger. But a comprehensive policy
framework is needed to harness foreign direct investment for a sustainable development
especially for a positive social and ecological development.
27
References
AGOA (2000): Trade and Development Act of 2000, available at
http://www.agoa.gov/agoa_legislation/agoatext.pdf, accessed 28 April 2009.
Blas, J., England, A., Zapf, M. (2008): Auf fremden Feld, Financial Times Deutschland, 28th
of August 2008.
CIA (2009): The World Factbook, available at https://www.cia.gov/library/publications/the-
world-factbook/geos/et.html, accessed 8 April 2009.
COMESA (2009): Homepage, available at http://www.comesa.int/, accessed 27 April 2009.
Ethiopian Investment Agency (2008a) Investment Guide 2008, EIA
Ethiopian Investment Agency (2008b) Factor Costs 2008, EIA
EPA (2003) Environmental Impact Assessment Procedural Guidelines Series 1, Addis Ababa.
FAO statistics (2009): Country Profiles Ethiopia, avaible at
http://www.fao.org/countryprofiles/index.asp?lang=en&iso3=ETH&subj=4, accessed 29
April 2009.
FDRE (2002) Federal Negarit Gazeta, Re-Enactment of the Investment Proclamation, Pro.
No. 280/2002
FDRE (2002) Federal Negarit Gazeta27
, Environmental Impact Assessment Proclamation,
Pro. No. 299/2002
FDRE (2003) Federal Negarit Gazeta, Council of Ministers Regulations on Investment
Incentives and Investment Areas Reserved for Domestic Investors Reg. No. 84/2003.
FDRE (2003) Federal Negarit Gazeta, Investment (Amendment) Proclamation, Pro. No.
373/2003
FDRE (2008) Federal Negarit Gazeta, Council of Ministers Regulation to Amend the
Investment Incentives and Investment Areas Reserved for Domestic Investors Regulation,
Regulation No./ 146/2008
Federal Investment Bureau of Ethiopia (2009): Database on FDI from 2000 till 2008.
FAOSTAT (2005) AQUASTAT Survey 2005 – Irrigation in Africa in figures.
Getnet, Dr. (2009) Report on the regulations, legal conditions and incentives for Foreign
Direct Investment in Ethiopia. Fact sheet for the final report.
GRAIN (2008): Seized! The 2008 land grab for food and financial security. GRAIN Briefing
October 2008.
Thaindian News (2008) http://www.thaindian.com/newsportal/india-news/india-ethiopia-to-
intensify-trade-and-investment-links_100103067.html
International Economic Devlopment Group (2008) The new EPAs: comparative advantage of
their content and the challenges for 2008, available at
http://www.odi.org.uk/iedg/Projects/0708010_The_new_EPAs.html, accessed 30 July 2009.
International Monetary Fund (2007) The Federal Democratic Republic of Ethiopia: Statistical
Appendix. IMF Country Report No. 07/245.
27 Official law gazette of the FDRE.

28
Joosten, F. (2007) Development Strategy for the Ecportorientated Horticulture in Ethiopia.
University of Wageningen.
OANDA (2009): The currency site, available at http://www.oanda.com/convert/fxhistory,
accessed 15 April 2009.
OECD (2008): OECD Benchmark Definition of Foreign Direct Investment, fourth edition,
OECD Publications, Paris.
Oromia National Regional State (2008, Pro. No. 138/2008) Megeleta Oromia28
, A
Proclamation to Amend the Oromia National Regional State Proclamation to Provide for the
Re-establishment of Investment Administration No. 115/2006.
Steinberger, P. (2009): Die Erde wird knapp, Sueddeutsche.de, 01 of April 2009.
Taddese, G. and Peden, D. (2006) Effective management of Water and Livestock Resources
for Community Based Irrigation in Ethiopia. Working Paper ILRI, Ethiopia.
UNComtrade (2009): Database on bilateral trade flows, available at http://comtrade.un.org/,
accessed 29 April 2009, subject to fee.
UNCTAD (2008): World Investment Report 2008, available at
http://www.unctad.org/Templates/webflyer.asp?docid=10502&intItemID=2068&lang=1,
accessed 28 April 2009.
U.S. Department of State (2008) Investment Climate Statements 2008, available at
http://www.state.gov/e/eeb/ifd/2008/100861.htm, accessed 30 July 2009.
USTR (2001): Agreement between the Government of the United States of America and the
Common Market for Eastern and Southern Africa concerning the Development of Trade and
Investment Relations, available at
http://www.ustr.gov/assets/Trade_Agreements/TIFA/asset_upload_file367_7725.pdf,
accessed 23 April 2009.
World Food Programme (2009): http://www.wfp.org/. Website visited at the 09.10. 2009.
World Bank (2007): World Development Indicators, available at
http://web.worldbank.org/WBSITE/EXTERNAL/DATASTATISTICS/0,,menuPK:232599~p
agePK:64133170~piPK:64133498~theSitePK:239419,00.html, accessed 30 April 2009,
subject to fee.
28 Official law gazette of the Oromia National Regional State.

29
Annex
Annex 1: FDI inflows, by region and economy, 2005-2007
Millions of dollars
Region 2005 2006 2007
Africa 29459 45754 52982
North Africa 12235 23155 22415
Algeria 1081 1795 1665
Egypt 5376 10043 11578
Libyan 1038 2013 2541
Morocco 1653 2450 2577
Sudan 2305 3541 2436
Tunisia 782 3312 1618
West Africa 5652 15766 15553
Benin 53 53 48
Burkina Faso 34 34 600
Cape Verde 82 131 177
Côte d'Ivoire 312 319 427
Gambia 45 71 64
Ghana 145 636 855
Guinea 105 108 111
Guinea-Bissau 9 18 7
Liberia -1384 -205 42
Mali 224 83 360
Mauritania 814 155 153
Niger 30 51 27
Nigeria 4978 13956 12454
Senegal 45 220 78
Sierra Leone 83 59 81
Togo 77 77 69
Central Africa 3466 3232 4084
Burundi 1 - -
Cameroon 225 309 284
Central African Republic 17 18 27
Chad 613 700 603
Congo 724 344 352
Congo, Dem. Rep. Of -76 -116 720
Equatorial Guinea 1873 1656 1726
Gabon 60 268 269
Rwanda 14 16 67
São Tomé and Principe 16 38 35
East Africa 1535 2324 3867
Comoros 1 1 1
Djibouti 59 164 195
Eritrea -1 - -3
Ethiopia 265 545 254
Kenya 21 51 728
Madagascar 86 294 997
Mauritius 45 105 339
Seychelles 86 146 248
Somalia 24 96 141
Uganda 380 400 368
United Rep. Of Tanzania 568 522 600
Southern Africa 6571 1278 7063
Angola -1304 -38 -1500
Botswana 281 489 495
Lesotho 57 92 106
Malawi 27 30 55
Mozambique 108 154 427
Namibia 348 387 697
South Africa 6644 -527 5692
Swaziland -50 36 37
Zambia 357 616 984
Zimbabwe 103 40 69
FDI inflows
Source: UNCTAD (2008)

30
Annex 2: Amount of FDI inflows by the single investor, 2000-2008 (US$ 1000)
FDI in $ 2000 2001 2002 2003 2004 2005 2006 2007 2008
EU 11587 3989 958 24108 63944 34477 378580 756618 43480526.63% 7.41% 5.34% 11.72% 18.47% 20.87% 12.11% 52.61% 16.37%
Switzerland 523 191 554 325 18410.25% 0.06% 0.02% 0.02% 0.07%
Canada 10100 2419 2378 5845 5209 1262023.21% 0.70% 1.44% 0.19% 0.36% 0.48%
USA 771 91668 100270 33146 341634 246892 1297994.30% 44.55% 28.96% 20.06% 10.93% 17.17% 4.89%
Australia 3658 163 33380.12% 0.01% 0.13%
Israel 1198 8488 11443 81907 48270 134567 152844 1101072.75% 15.76% 5.56% 23.65% 29.21% 4.30% 10.63% 4.15%
Egypt 1239166 19140 114814 63157 164411 97778602.25% 5.53% 69.49% 2.02% 11.43% 3.68%
Sudan 1601 32591 6196 11119 22981 10652410.78% 9.41% 3.75% 0.36% 1.60% 40.10%
Nigeria 294 4448 30680.14% 0.31% 0.12%
Chad 1663 325 1020.05% 0.02% 0.004%
Djibouti 4101 12314 6140.13% 0.86% 0.02%
Kenya 22135 178 882510.76% 0.01% 0.61%
SouthAfrica 2250 9398 62220.65% 5.69% 0.43%
Brazil 2170 3070.15% 0.01%
Jamaica 1195 693 1633 4910.35% 0.02% 0.11% 0.02%
Iraq 1441 2710 8180.05% 0.19% 0.03%
Jordan 326 113 333 1302 51140.09% 0.07% 0.01% 0.09% 0.19%
Lebanon 956 1762 3549 9275 67500.28% 1.07% 0.11% 0.64% 0.25%
Oman 111 108 20450.004% 0.01% 0.08%
SaudiArabia 20625 41386 10547 10028 10620 6820 7104 50731 9564747.40% 76.84% 58.77% 4.87% 3.07% 4.13% 0.23% 3.53% 3.60%
Turkey 2061 79770.14% 0.30%
21769 566 1818 8760 1120410.58% 0.34% 0.06% 0.61% 0.42%
Yemen 394 4272 9339 9703 92280.11% 2.59% 0.30% 0.67% 0.35%
China 1271 493 8935 9447 64390.37% 0.30% 0.29% 0.66% 0.24%
SouthKorea 542 9770.04% 0.04%
India 5671 3983 45707 14455 2207885 40336 34019631.60% 1.94% 13.20% 8.75% 70.62% 2.80% 12.81%
Iran 1302 831 9310.79% 0.03% 0.04%
Pakistan 986 76753 72330.03% 5.34% 0.27%
Malaysia 38467114.48%
Russa 532 1417 48070.26% 0.41% 0.18%
Rest 1631 581 113 875 3469 89440.79% 0.17% 0.07% 0.03% 0.24% 0.34%
Sum of FDI 43511 53862 17946 205757 346282 165232 3126574 1438103 2656337
United Arab
Emirates
Note: The position “rest” contains all countries that have only invested once in the observation period
Source: Federal Investment Bureau of Ethiopia (2009)
31
Annex 3: Background to the report of Dr. Getnet
The objective of the report written by Dr. Getnet is to determine major regulations and
privileges, subsidies/incentives, range and applicability of penalties, market destination,
institutional status, and licensing process of FDI in agriculture in Ethiopia. This was done in
addition to the final report to receive an even more detailed overview on FDI in Ethiopia.
Specific questions could be proposed and answered through the use of a combination of
methodologies (desk review, interview, and data analysis).
The study undertook a desk review of available government policy documents, proclamations,
and regulations. Interviews were also conducted to generate qualitative information.
Knowledgeable key informants from relevant federal and regional government offices were
identified through the assistance of experts working in Ethiopian Investment Agency (EIA).
In addition to EIA itself, National Bank of Ethiopia (NBE), Revenue and Customs Authority
(RCA), Environment Protection Authority (EPA), and Oromia Investment Commission (OIC)
were identified for interviews29
.
29 List of interviewees are: Mr. Mohamed Seid, Director, Planning and Policy Department, EIA; W/o Lidia
Gizachew, Expert, Licensing and Registration Department, EIA; Mr. Nigussie Gurmu, Director, Facilitation and
After Care Department, EIA; Mr. Misrak Seyoum, Team Leader, Agriculture and Construction Sector Team,
RCA; Mr. Moges Belayneh, Expert, Foreign Exchange Statistics and Monitoring Department, NBE; Mr.
Solomon, Head, Environmental Impact Assessment Department, EPA; and Mr. Kalide Ahmed, Case Manager
for Land Issuance and Documentation, OIC (OIC is delegated to handle the land issue).

32
Annex 4: Investment licensing process30
Any foreign investor is required to submit their investment application to the Ethiopian
Investment Agency (EIA).Together with the application, a foreign investor is required to
submit a copy of a valid passport if the investment is to be made by an individual person or
copies of the memorandum and association articles of the company if the investment is to be
made by an existing or new company as stipulated in Article 14 of the amended Investment
Proclamation No. 373/2003. Apart from these documents, foreign investors are not required to
deposit the investment capital they are claiming to invest. After reviewing the application, the
EIA has time to provide investment license within 15 days of the application. From
experience the EIA takes only four hours for individual investors and a day for investments to
be made in the form of new private limited company. Foreign investors who would like to
invest in joint venture with the government should submit their application to the Supervising
Authority of Public Enterprises. The Authority submits the application to the Ministry of
Trade and Industry for approval and after approval it assigns the appropriate public enterprise
for the joint venture.31
Land is identified either by the investor himself or by the respective regional administration.
The allocation of land is determined by respective regional governments. Together with the
application for land, the investor is required to submit summary of the project (project
profile), description of the project‟s environmental impact mitigation measures, land use plan,
project implementation schedule, and a letter of promise to pay ten percent of the total land
lease cost in advance. The Investment Board gives the final decision on the application for
land. The decision of the Board includes, among others, the lease price and the period of
lease. Therefore, the only authority for granting of land in the region for both foreign and
domestic investors is the Investment Board.
30 Much of the information is obtained from the interview made with W/o Lidia Gizachew, Expert, Licensing
and Registration Department of EIA, Mr. Nigussie Gurmu, Director, Facilitation and After Care Department of
EIA, and Mr. Misrak Seyoum, Team Leader, Agriculture and Construction Sector Team, Revenue and Customs
Authority. 31
Interview with experts from EIA.