fe review: inaugural meeting of the external reference group data evidence paper paul mount,...
TRANSCRIPT

FE Review: Inaugural meeting of the External Reference Group
Data Evidence Paper
Paul Mount, Learning & Skills Analysis Division, [email protected] February 2005

1) Providers, learners and provision mix

3
There are 393 FE colleges in total
Of which:
• 253 General FE and Tertiary Colleges (GFEC) • 102 Sixth Form Colleges (SFC)• 16 Specialist Designated Colleges (SDC)• 17 Agriculture and Horticulture colleges (AHC)• 5 Art, Design and Performing Arts Colleges (DPAC)
The number of colleges has fallen significantly in recent years – there were 429 colleges in mid-2000
Source: Edubase

4
Regional distribution of colleges
Region Population No. collegesNE 2,515,479 23EM 4,172,179 27SW 4,928,458 33YH 4,964,838 41WM 5,267,337 49EE 5,388,154 34NW 6,729,800 64London 7,172,036 54SE 8,000,550 68
Source: Edubase

5
Size distribution of providers – learner numbers
• The average number of learners at a general FE college (GFEC) is 12,000
• The largest GFEC has 45,000 learners, the smallest has 2,500 learners
• The average number of learners at a sixth form college (SFC) is 2,000
• The largest SFC has 7,000 learners, the smallest has 570 learners
Source: DfES analysis of ILR
6
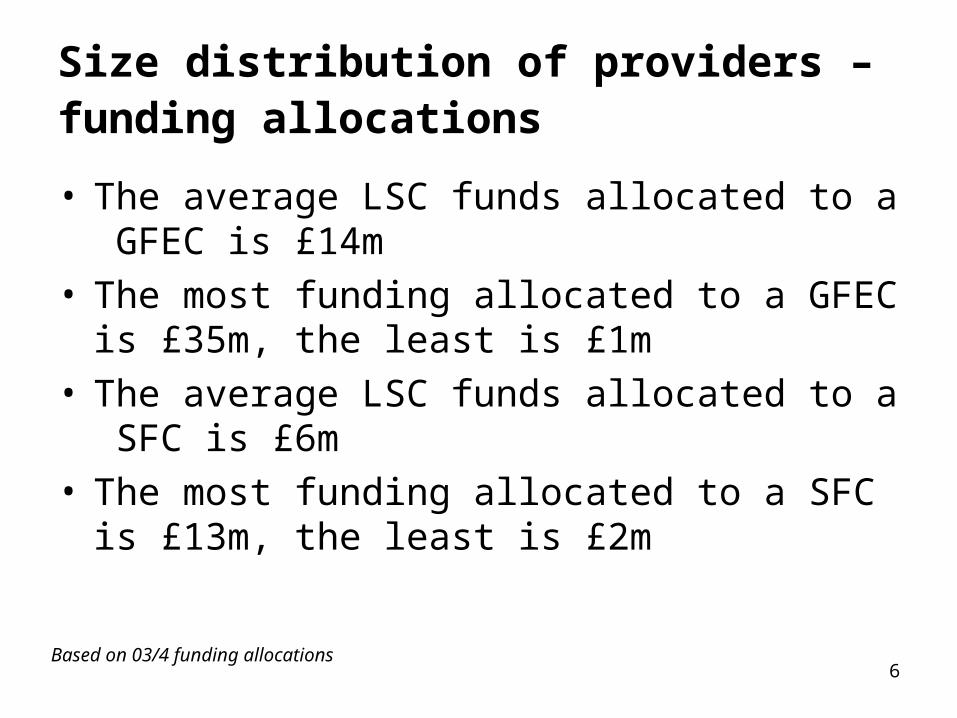
Size distribution of providers – funding allocations
• The average LSC funds allocated to a GFEC is £14m
• The most funding allocated to a GFEC is £35m, the least is £1m
• The average LSC funds allocated to a SFC is £6m
• The most funding allocated to a SFC is £13m, the least is £2m
Based on 03/4 funding allocations

7
GFECs dominate the FE sector in terms of learner numbers (3 million of the 4.1 million total learners)
Source: ILR/SFR05 (14 December 2004)
Note: Figures include external institutions (the majority of which are LEA-maintained providers)
Learners by type of college (03/4)Under 19 Over 19 All ages
GFEC 524 2,499 3,023 SFC 134 95 229 Ext. Insts 38 711 749 Other colleges 5 108 113 FE sector 701 3,413 4,114 % learners
Under 19 Over 19 All agesGFEC 13% 61% 73%SFC 3% 2% 6%Ext. Insts 1% 17% 18%Other colleges 0% 3% 3%FE sector 17% 83% 100%

8
The majority (71%) of GFEC learners are adults studying part-time The majority (56%) of SFC learners are under 19 year olds studying full time
GFEC and SFC learners in 2003/04 by mode of study and age
Full time Part timeUnder 19 Over 19 Under 19 Over 19 Total
GFEC (000 learners) 401 347 123 2,152 3,023 GFEC (% total learners) 13% 11% 4% 71%SFC (000 learners) 129 8 5 87 229 SFC (% total learners) 56% 3% 2% 38%
Source: ILR/SFR05 (14 December 2004)

9
Level 1 & entry is main level of study for adultsLevel 3 is main level of study for young people
Source: ILR/SFR05 (14 December 2004)Note: Figures include external institutions
Learners on council-funded FE provision2003/04
Percent total learnersUnder 19 19 plus All ages
Level 1 and entry 3% 36% 39%Level 2 4% 21% 25%Level 3 9% 11% 20%Level 4, 5 and HE 0% 2% 2%Level not specified 0% 13% 14%All levels 17% 83% 100%

10
ICT is the most popular area of study
% learners by area of learning (main qualification aim) – 2003/04
1%
2%
3%
3%
3%
3%
4%
5%
6%
7%
8%
9%
11%
17%
18%
0% 2% 4% 6% 8% 10% 12% 14% 16% 18% 20%
Land based provision
Retailing, Cust. Service and Transportation
Hairdressing and Beauty Therapy
Construction
Engineering, Technology and Manufacturing
Science and Mathematics
Humanities
Not known
English, Languages and Communications
Visual and Performing Arts and Media
Hospitality, Sports, Leisure and Travel
Business administration, Mangmt. & Prof.
Foundation programmes
Health, Social Care and Public Services
ICT
Source: ILR/SFR05 (14 December 2004)Note: Figures include external institutions
11
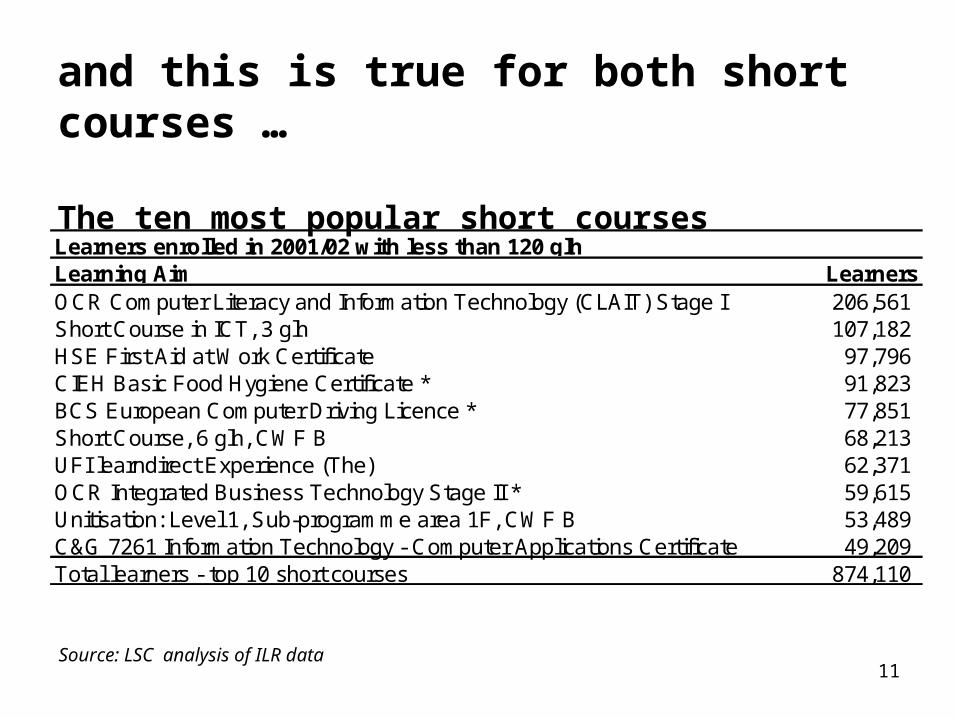
and this is true for both short courses …
The ten most popular short courses
Learners enrolled in 2001/02 with less than 120 glhLearning Aim LearnersOCR Computer Literacy and Information Technology (CLAIT) Stage I 206,561 Short Course in ICT, 3 glh 107,182 HSE First Aid at Work Certificate 97,796 CIEH Basic Food Hygiene Certificate * 91,823 BCS European Computer Driving Licence * 77,851 Short Course, 6 glh, CWF B 68,213 UFI learndirect Experience (The) 62,371 OCR Integrated Business Technology Stage II * 59,615 Unitisation: Level 1, Sub-programme area 1F, CWF B 53,489 C&G 7261 Information Technology - Computer Applications Certificate 49,209 Total learners - top 10 short courses 874,110
Source: LSC analysis of ILR data

12
.. and long courses
52
208
45
98
57
134
96
156
119
127
119
188
194
367
238
31
32
40
81
81
88
97
103
115
132
181
195
220
225
297
- 50 100 150 200 250 300 350 400
Retailing, Customer Service and Transportation
Not Know n
Land based provision
Science and Mathematics
Hairdressing and Beauty Therapy
Humanities
Construction
Engineering, Technology and Manufacturing
Hospitality, Sports, Leisure and Travel
English, Languages and Communication
Foundation programmes
Visual and Performing Arts and Media
Health, Social Care and Public Services
Business administration, Management and Professional
Information and Communication Technology
98/99 03/04
Source: DfES analysis of 98/9 ILR and ILR/SFR05 (14 December 2004) Note: Figures include external institutions
Learners on long courses in GFEC and SFC (000) by AOL of main qual. aim

13
The sector attracts a disproportionate number of female and ethnic minority learners
• In 2003/04, there were 2.5 million female learners and 1.6 million male learners
• In 2003/04 16% of learners in FE colleges were from non-white ethnic groups. (Adults from non-white ethnic groups account for 8% of the adult population)
Source: ILR/SFR05 (14 December 2004)Note: Figures include external institutions

14
A significant proportion of learners receive Widening Participation (WP) uplift
• 37% of learners were eligible for widening participation uplift in 2003/04 (additional funds are paid to the college, not the learner)
• WP uplift is payable for a variety of reasons• Most typically, the learner is resident in a post code
deemed to be relatively disadvantaged• The uplift is payable if the learning aim is basic skills• 47% of learners eligible for WP uplift have a short course
as their main qualification aim, compared to 41% of learners not receiving the uplift
Source: DfES analysis of ILR data
15
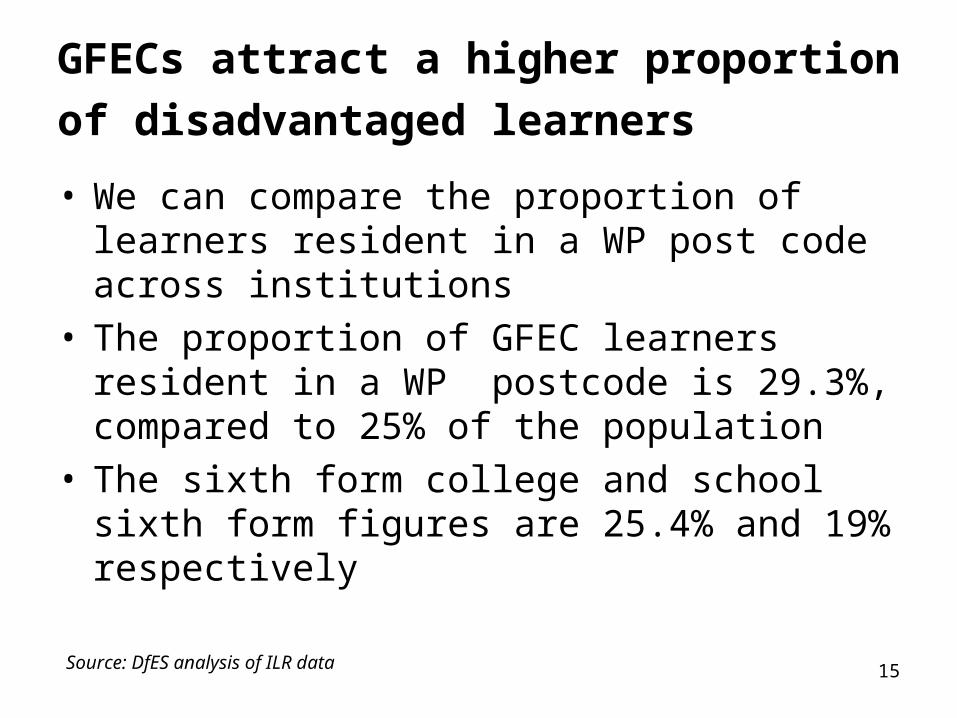
GFECs attract a higher proportion of
disadvantaged learners • We can compare the proportion of learners
resident in a WP post code across institutions• The proportion of GFEC learners resident in a
WP postcode is 29.3%, compared to 25% of the population
• The sixth form college and school sixth form figures are 25.4% and 19% respectively
Source: DfES analysis of ILR data

16
Total learner numbers increased markedly in 01/2 and 02/3. Expansion was almost entirely due to an increase in part-time adult provision
FE sector learner numbers (000)
-
500
1,000
1,500
2,000
2,500
3,000
3,500
4,000
1996/97 1997/98 1998/99 1999/2000 2000/01 2001/02 2002/03 2003/04
Under 19 Over 19
Source: ILR/SFR05 (14 December 2004)Note: Figures include external institutions

17
Much of the expansion in adult learning was in short course (<24 weeks duration) provision at GFECs
Source: DfES analysis of ILR data
GFEC: Number of qualification aims (000) - adult learners99/00 00/01 01/02 02/03
Short (< 24 weeks) 1,370 1,688 2,214 2,618A Level 66 59 57 58GCSE 74 61 57 54Long Vocational Level 1 and Entry 518 509 589 694Long Vocational Level 2 466 465 519 476Long Vocational Level 3 366 351 351 319Long Vocational Level 4,5 and HE 60 54 49 57Long Vocational Level Other 219 313 299 181Long course total 1,769 1,812 1,920 1,839Total 3,139 3,500 4,134 4,457

18
Half of the qualification aims in GFECs are short courses
GFEC and tertiary colleges: % qualifications by course length and student age
43%49% 50%
22%19% 19%
35%32% 31%
0%
10%
20%
30%
40%
50%
60%
00/01 01/02 02/03
Short Long 16-18 Long 19+
Source: LSC Benchmarking Data
19
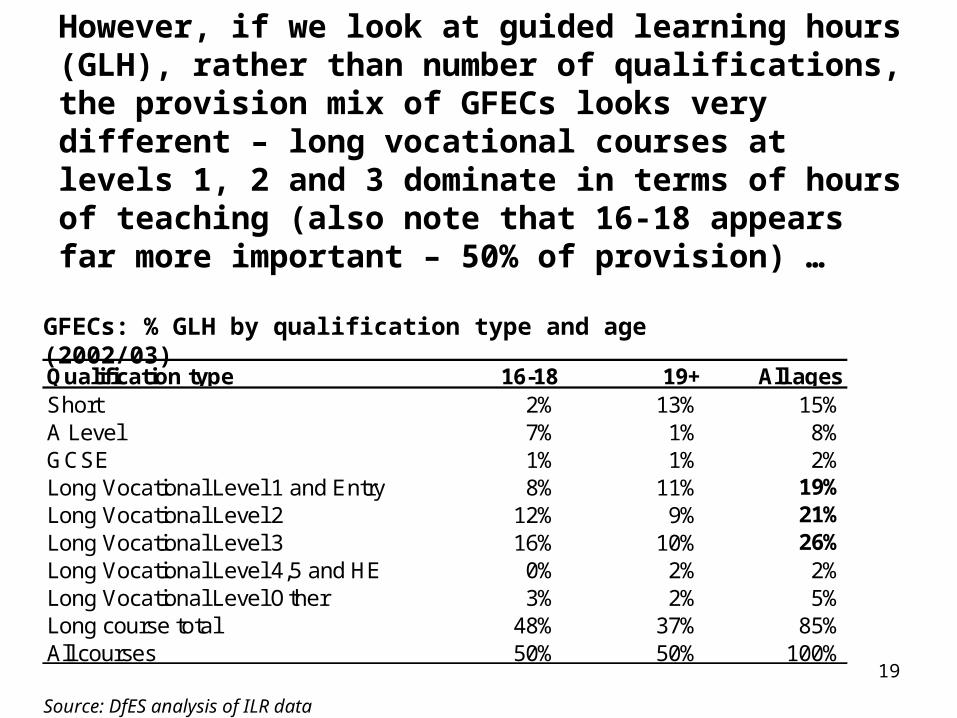
However, if we look at guided learning hours (GLH), rather than number of qualifications, the provision mix of GFECs looks very different – long vocational courses at levels 1, 2 and 3 dominate in terms of hours of teaching (also note that 16-18 appears far more important – 50% of provision) …
Source: DfES analysis of ILR data
GFECs: % GLH by qualification type and age (2002/03)
Qualification type 16-18 19+ All agesShort 2% 13% 15%A Level 7% 1% 8%GCSE 1% 1% 2%Long Vocational Level 1 and Entry 8% 11% 19%Long Vocational Level 2 12% 9% 21%Long Vocational Level 3 16% 10% 26%Long Vocational Level 4,5 and HE 0% 2% 2%Long Vocational Level Other 3% 2% 5%Long course total 48% 37% 85%All courses 50% 50% 100%

20
… and provision mix over time appears more stable
GFECs (all learners)
Source: DfES analysis of ILR data
GLH (m) in year: Change 02/3 on 97/8 % total provision Provision type 97/8 02/03 % m GLH 97/98 02/03Short 62 73 17% 11 11% 15%A Level 51 41 -20% -10 9% 8%GCSE 18 9 -49% -9 3% 2%Long Vocational Level 1 and Entry 68 92 35% 24 13% 19%Long Vocational Level 2 111 101 -9% -10 20% 21%Long Vocational Level 3 158 127 -20% -31 29% 27%Long Vocational Level 4,5 and HE 22 10 -55% -12 4% 2%Long Vocational Level Other 55 26 -53% -29 10% 5%Total 545 479 -12% -66

21
Sixth form college provision mix in 2002/03 – on the basis of qualification and GLH mix
Source: DfES analysis of ILR data
Short A level GCSE Voc. LongQualificationsAll ages 11% 43% 5% 41%16-18 3% 42% 4% 36%Adults 9% 1% 0% 5%Guided learning hoursAll ages 3% 60% 5% 32%16-18 1% 59% 4% 29%Adults 2% 1% 0% 4%
% of total provision

2) College performance

23
Success rate is the headline measure of performance for FE colleges
• For every one hundred learners who start a qualification, the Success Rate tells us how many achieve the qualification
• Success Rate can be expressed as Retention Rate multiplied by Achievement Rate
• On this definition, data is available from 97/8

24
The FE college headline success rate has increased significantly since 97/8
53% 53% 55%59%
68%65%
0%
10%
20%
30%
40%
50%
60%
70%
80%
1997/98 1998/99 1999/00 2000/01 2001/02 2002/03
Source: LSC Benchmarking DataNote: Figures exclude external institutions (including EIs, the 02/3 figure is 67%)

25
The recent improvement in success rates has been most marked for short courses and 16-18 long courses (a high proportion of which are ‘A’ levels)
00/01 01/02 02/03 02/03 v 00/01
Short 69% 76% 79% 10%
Long 16-18 57% 62% 64% 7%
Long 19+ 48% 51% 52% 4%
Long total 52% 56% 58% 6%
All courses/learners 59% 65% 68% 9%
Source: LSC Benchmarking Data. Excludes external institutions

26
Looking at retention and achievement separately helps us to understand better the drivers of change …
Source: LSC Benchmarking Data. Excludes external institutions
Success rate % 00/01 01/02 02/03Short 69% 76% 79%Long 16-18 57% 62% 64%Long adult 48% 51% 52%All long courses 52% 56% 58%Retention rate % 00/01 01/02 02/03Short 91% 92% 92%Long 16-18 74% 79% 80%Long adult 70% 71% 70%All long courses 72% 75% 75%Achievement rate % 00/01 01/02 02/03Short 76% 82% 86%Long 16-18 76% 78% 81%Long adult 69% 72% 75%All long courses 73% 75% 78%

27
… which vary according to length of course and age:
• For short courses, higher success driven by improvements in achievement
• The 16-18 year old long course retention rate increase is part due to the two-year ‘A’ level qualification being split into two one-year qualifications (AS/A2)
• The adult long course success rate has increased less quickly than the 16-18 equivalent, due to stable retention rate

28
Long course success rates vary by qualification type, level of study and age
For example: • For 16-18 year olds studying at level 2, the
GNVQ success rate is 61%, but the NVQ success rate is only 42%
• For adults studying at level 2, the NVQ success rate is 48%
• The GCE A/AS level success rate is 75% for 16-18 year olds and 54% for adults
Source: LSC Benchmarking Data. Includes external institutions

29
Moreover, within the same qualification type/age groups, there is significant variation by curriculum area
Source: LSC Benchmarking Data. Excludes external institutions
16-18 year old 'A' Level Success Rate by Area of Learning (2002/03)
81%
79%
78%
75%
74%
74%
72%
67%
0% 10% 20% 30% 40% 50% 60% 70% 80% 90% 100%
English, Languages and Communication
Visual and Performing Arts and Media
Hospitality, Sports, Leisure and Travel
Engineering, Technology and Manufacturing
Business administration, Management and Professional
Humanities
Science and Mathematics
Information and Communication Technology
30
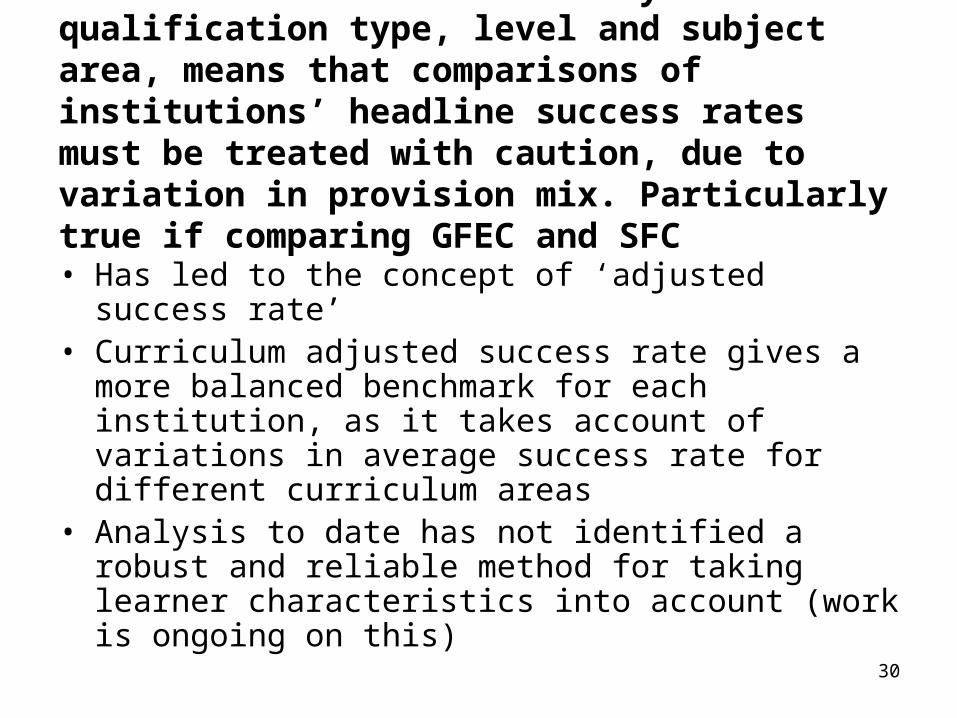
Variation in success rates by qualification type, level and subject area, means that comparisons of institutions’ headline success rates must be treated with caution, due to variation in provision mix. Particularly true if comparing GFEC and SFC
• Has led to the concept of ‘adjusted success rate’ • Curriculum adjusted success rate gives a more balanced
benchmark for each institution, as it takes account of variations in average success rate for different curriculum areas
• Analysis to date has not identified a robust and reliable method for taking learner characteristics into account (work is ongoing on this)

31GFEC SFCcol_type
0.20
0.40
0.60
0.80
1.00
succ
242
82
21
Maximum success rate
Median success rate
Minimum success rate
Substantial variation in college headline success rates …..
50% of college success rates lie in the shaded box. 25% lie between the box and the maximum and 25% lie between the box and the minimum

32
…which is significantly reduced when we calculate ‘curriculum adjusted success rates’
GFEC SFC
col_type
0.0
0.2
0.4
0.6
0.8
1.0
CA
succ

33
Adjusted success rates correct for qualification/ subject area provision mix differences, but not for learner mix differences (e.g. prior attainment, relative deprivation)
• The Measuring Success project within Success for All is guiding the development of a basket of measures
• For young people taking level 3 academic qualifications, there is a strong relationship between prior attainment at level 2 (e.g. GCSE) and level 3 (e.g. A level) outcome
• For adult learners and for vocational courses, such strong relationships do not exist

34
Value added for 16-18 year olds at level 3
• A more sophisticated measure of performance which takes into account the individual student’s starting point
• Based on a strong relationship between prior attainment, as measured by average points at GCSE/GNVQ, and outcome, as measured by points at level 3
• VA is currently widely used for reflection and improvement
• LSC leading work to develop an institutional measure of VA, for piloting in 2005 SCAAT (formerly known as the Performance Tables)

35
VA relationships and institutional comparison
• The following analysis looks at ‘A’ level performance for students with different levels of prior attainment, by institution type
• Most relevant comparison is schools and sixth form colleges, as ‘A’ level provision is their core business
• It should be noted that VA looks only at results in exams entered. If a school student does not enter for the exam, the institution is not penalised. If a college does the same, the penalty is a hit to its qualification success rate measure, which is a key targeted measure for colleges

36
Using VA can tell a different story from more basic performance measures. For example, when we look at average point score by candidates achieving Level 3 qualifications, GFE and other colleges lag significantly behind SFCs and schools
277 270
181
-
50
100
150
200
250
300
Sixth Form Colleges Maintained Schools Other FE Sector Colleges
Ave
rag
e p
oin
t sc
ore
Source: SFR38/2004
Note: based on UCAS points system: ‘A’ level grade A=120; B=100; C= 80; D=60; E=40

37
But GFECs attract more low prior attainment students (figure shows cumulative percentage of students below given prior attainment thresholds)
17 yr olds entering 2 or more GCE/VCE exams (cumulative % below given average GCSE/GNVQ prior attainment thresholds (2002/03)
0%
10%
20%
30%
40%
50%
60%
70%
80%
90%
100%
All maintained schools
Sixth form colleges
GFEC
All maintained schools 1% 5% 16% 34% 53% 72% 86% 96% 100%
Sixth form colleges 1% 5% 17% 38% 58% 77% 89% 97% 100%
GFEC 3% 14% 33% 57% 75% 88% 95% 98% 99%
<4 <4.5 <5 <5.5 <6 <6.5 <7 <7.5 <8
Note: GCSE points are allocated to grade as follows: A*=8; A=7; B=6; C=5; D=4; E=3; F=2; G=1

38
It is this that ‘explains’ much of the difference in average points per candidate. For given prior attainment, GFEC performance is only slightly below SFCs and maintained schools
FEC v Maintained Schools: Average GCE/VCE points (17 yrs old taking 2+ GCE) by prior attainment (2002/03) and institution type
0
20
40
60
80
100
120
140
4 4.25 4.5 4.75 5 5.25 5.5 5.75 6 6.25 6.5 6.75 7 7.25 7.5 7.75 8
GCSE/GNVQ average points per entry
GC
E/V
CE
ave
rag
e p
oin
ts p
er e
ntr
y
Sixth Form College
Maintained schools
GFEC
Note: GCSE points are allocated to grade as follows: A*=8; A=7; B=6; C=5; D=4; E=3; F=2; G=1. A level points are allocated to grade as follows: A=120; B=100; C= 80; D=60; E=40

39
This is easier to see if we compare college performance to schools. SFC performance is slightly better than schools and GFEC performance is slightly worse
College performance relative to schools
-8.0
-6.0
-4.0
-2.0
0.0
2.0
4.0
4 4.25 4.5 4.75 5 5.25 5.5 5.75 6 6.25 6.5 6.75 7 7.25 7.5 7.75 8
GCSE/GNVQ average points per entry
GC
E/V
CE
ave
rag
e p
oin
ts p
er e
ntr
y (c
olle
ge
- sc
ho
ol)
SFC minus Schools
GFEC minus Schools

40
Other measures of performance – inspection grades
• Inspection reports contain a wealth of performance data• As well as an overall assessment, grades are awarded
for ‘management & leadership’ and ‘teaching & learning’ by subject on a scale of 1-5, where: 1= Outstanding; 2 = Good; 3= Satisfactory; 4 = Unsatisfactory; 5 = Very Poor
• GFEC inspection data indicates generally ‘solid’ performance, with pockets of poor provision (graded 4 or 5) at the majority of providers
• A small number of GFECs have achieved excellence throughout the institution and this has not been at the expense of ‘harder to reach’ learners

41
GFEC performance in inspection: Management & Leadership grades in current inspection round (01/02 to present)
GFEC Management and leadership grades 01/2-03/4
4
60
79
26
2
0
10
20
30
40
50
60
70
80
90
1 2 3 4 5
Inspection grade
No
. co
lleg
es
171 GFECs inspected 01/2 – 03/4

42
GFEC performance in inspections: pockets of poor provision • 101 of 171 GFECs inspected have at least one subject area with T&L grade
4 or 5
• Almost three quarters of GFECs have been subject to some degree of re-inspection
GFEC: Overall inspection Grades 01/2-03/4
26
78
3
19
45
0
10
20
30
40
50
60
70
80
90
Full Partial Partial LM Partial WBL None
Inspection grade
No
. co
lleg
es

43
Other measures of performance – learner satisfaction
• Findings from Satisfaction Survey 2003/04 (31,786 respondents)
• 90% of FE learners were 'fairly', 'very' or 'extremely' satisfied with their overall learning experience
• 23% of FE learners were 'extremely' satisfied with their overall learning experience
• When asked to rate 'overall satisfaction with quality of teaching and learning', 63% of FE learners in the survey were 'very' or 'extremely' satisfied
• 60% of FE learners in the survey said they were 'very' likely to return to learning within the next 3 years
Source: LSC Learner Satisfaction Survey

44
Future development of performance measures
• Key areas for development are measures which allow comparison of institutional performance in two key areas:
1) Learner destinations: do learners progress to desirable outcomes (e.g. employment, further learning at a higher level)?
2) Employer responsiveness. How responsive are providers to the needs of local employers?

45
Future development of performance measures: Value for Money
• A project is currently underway to develop VFM indicators
• Benchmark provision within colleges - funding per successful outcome by provision type
• Cost benchmarking at a higher level (e.g. admin cost as % revenue).
• There is no comparable cost data at department/ course level

3) Funding

47
FE colleges are highly reliant on LSC funding
• 73% of FE college income is LSC funding • 11% is from fees - includes employers and
individuals• 16% is from other sources, including HEFCE
and EU grants, traded services and financial income
Source: DfES analysis of 02/3 college accounts

48
Plan-Led Funding
• Vast majority of colleges are within trust• Colleges agree plans with LSC
- No more funding audit
- No more retrospective claw back or unplanned growth - Data sharing- Learner numbers match plans
• Funding outturns impact allocation for next year• Simplified funding formula• Provision and funding profile to plan and monitor
progress

49
A complex system with the following key elements: • A ‘national base rate’ which is dependent on the type of
qualification (e.g. ‘A’ level, GCSE, NVQ). Varies with the ‘size’ of the learning aim (GLH) and cost of delivery
• National base rates are ‘uplifted’ by various weighting factors to better reflect costs. The main weighting factors relate to: subject area (programme weight); learner disadvantage; and college location (area uplift)
• An achievement element equal to 10% of the weighted base rate
• A fee element equal to 25% of the unweighted base rate, unless the learner is entitled to fee remission (then = 0)
• Funding ceases if a learner drops out
Underlying the ‘Plan-Led Funding System’ the LSC relies on a system of funding rates per qualification aim

50
Funding of qualification aims - summary
National base rate*
Programme weight=
Weighted national base rate *
Disadvantage uplift*
Area costs uplift=
Uplifted weighted national base rate-
Learner contribution=
Learner funding
10% dependent on achievement
Fee element (unless learner entitled to remission)

51
Example: GCE AS or A2 level, studied during the day (excluding General Studies)
• National base rate = £766• Assumed fee element = £191 (remitted for 16-18
year olds)• Most AS/A2 courses are programme weight
band A (=1)• With a number of exceptions being band B
(=1.12). For example, Biology, Chemistry, Physics, Geography and Music

4) Workforce

53
Key data on the FE college workforce
• 239,000 people work in FE colleges - 134,000 teachers, 27,000 teaching support staff and 78,000 other support staff
• Of the 134,000 teachers, 49,000 are full-time and 85,000 are part-time
• In terms of full-time equivalent (FTE), there are 52,000 full-time teachers and 23,000 part-time teachers
• Ethnic minorities are underrepresented in the FE workforce
Source: Staff Individualised Record 02/3

54
The age distribution of FEC teachers is skewed to the right. Only 19% of teacher FTEs are under 35
19%
32%
48%
66%
85%
96%
8%2%
-2,000
4,0006,0008,000
10,00012,000
14,00016,000
Under25
25-29 30-34 35-39 40-44 45-49 50-54 55-59 60 andover
0%10%20%30%40%50%60%70%80%90%100%
Number of FTEs % FTE < given age band
Source: Staff Individualised Record 2002/03

55
The majority of teaching staff are on permanent contracts. Average pay is 6% below that for school teachers
• 52% teaching staff are on permanent contract; 32% are on fixed term contract; 7% are ‘casual’; 4% are agency staff; 5% are self-employed
• The average salary of full-time FE teachers is £27,710 per annum (at 31/3/2002)
• This is 6% below the average salary for full-time secondary school teachers. The pay gap is higher for GFEC teachers (7%) than for SFC teachers (1%)
Source: Staff Individualised Record 02/3

56
We need a better understanding of recruitment and pay by region/subject
• Our best estimate of the Wastage Rate (based on the Labour Force Survey) is 20% (which is similar to the average for all industrial sectors). Survey evidence suggests a much lower figure. On average, wastage would not appear to be a major problem
• However, there are likely to be significant differences in wastage rates by region and subject area. Survey evidence suggests recruitment problems in certain subjects/regions. For example: ICT in London; Engineering in the North; and Construction in the West Midlands
• We lack pay data by region/subject. It is possible that inadequate differentiation accentuates recruitment problems

5) Market position

58
Competitive landscape
• SFCs are focused on 16-18 year olds studying ‘A’ levels and compete for students with schools sixth forms
• GFECs have a wider curriculum. They compete with schools and SFCs for ‘A’ level students, with WBL, other private providers and schools for students undertaking vocational learning and with private providers for adult short course provision

59
Of the total number of 16-18 year olds studying for GCE A/AS levels, 33% are based in FE colleges, and 67% in schools
Source: DfES
Note: FHE = Further and Higher education institutions (mainly GFEC for A levels)
Number learners by institution type 1985 2003 ChangeMaintained schools 181,300 257,300 76,000Independent schools 57,300 70,000 12,700Sixth form colleges 49,300 88,700 39,400Other FHE institutions 50,500 69,500 19,000Total 338,400 485,500 147,100
% learners by institution type 1985 2003 Change (% pts)Maintained schools 53.6% 53.0% -0.6%Independent schools 16.9% 14.4% -2.5%Sixth form colleges 14.6% 18.3% 3.7%Other FHE institutions 14.9% 14.3% -0.6%

60
Colleges provide a high volume of vocational provision to 16-18 year olds and adults
Long vocational provision (qual. aims): 16-18 year olds in 2002/03Level of study SFC GFEC Total FECLevel 1 and Entry 16,758 374,730 391,488Level 2 70,355 470,873 541,228Level 3 89,366 278,230 367,596Level 4,5 and HE 73 2,290 2,363Level Other 150,242 211,627 361,869Total 326,794 1,337,750 1,664,544
Long vocational provision (qual. aims): adults in 2002/03Level of study SFC GFEC Total FECLevel 1 and Entry 17,388 694,268 711,656Level 2 12,617 476,355 488,972Level 3 7,450 318,847 326,297Level 4,5 and HE 730 57,026 57,756Level Other 7,224 180,664 187,888Total 45,409 1,727,160 1,772,569
Source: DfES analysis of ILR

61
There is limited vocational provision in schools
• 49% of all 16-18 year olds are participating in ‘further education’ (school sixth forms and colleges)
• 12.4% of all 16-18 year olds are in ‘further education’ and have a level 3 vocational qualification as their highest qualification aim. Three quarters of these learners are based in colleges
• 8.8% of all 16-18 year olds are in ‘further education’ and have a level 2 or level 1 vocational qualification as their highest qualification aim. Nine out of ten are based in colleges
• A further 8% of all 16-18 year olds are on vocational provision in WBL providers (this is a separate category from ‘further education’)
Source:SFR03/2005

62
Are there benefits from competition?
• Local diversity means that it is difficult to draw conclusions at a national level
• In the past, competition has been cited as a key reason for low fee collection (incentives in the funding system drive this behaviour)
• Strategic Area Reviews (Success for All initiative) are designed to curb ‘destructive competition’ and improve local collaboration (amongst publicly funded providers at least)