fearnside, p.m., a.m.r. figueiredo & s.c.m. bonjour. 2013...
TRANSCRIPT
This file has been cleaned of potential threats.
If you confirm that the file is coming from a trusted source, you can send the following SHA-256
hash value to your admin for the original file.
16caa6d53df6cff064c20a4bdbb3da9a24731b6a75ac494c25e25f32c35e123b
To view the reconstructed contents, please SCROLL DOWN to next page.
The text that follows is a PREPRINT.
Please cite as:
Fearnside, P.M., A.M.R. Figueiredo & S.C.M. Bonjour. 2013. Amazonian forest loss and the long reach of China’s influence. Environment, Development and
Sustainability (in press).
DOI: 10.1007/s10668-012-9412-2
ISSN: Print 1387-585X Online: 1573-2975
Copyright: Springer Science + Business Media, LLC
The original publication will be available at: http://www.springer.com

1
Amazonian Forest Loss and the Long Reach of China’s Influence Philip M. Fearnside1, Adriano M.R. Figueiredo2, Sandra C.M. Bonjour3
1Instituto Nacional de Pesquisas da Amazônia-INPA, Manaus–AM, Brazil. E-mail: [email protected]. 2Faculdade de Economia da Universidade Federal de Mato Grosso, Cuiabá-MT, Brazil. E-mail: [email protected]. 3Faculdade de Economia da Universidade Federal de Mato Grosso, Cuiabá-MT, Brazil. E-mail: [email protected]. Contribution for Environment, Development and Sustainability, special issue on “China as a new shaper of international development: The environmental implications” (Guest editors: Frauke Urban, Giles Mohan & Sarah Cook). Revised 29 Sept. 2012 5069 words + abstract, tables and figures. Abstract China influences deforestation in Brazilian Amazonia in a variety of ways, including through the direct influence of Chinese enterprises (including land purchases). We examine these issues and present data on the growth of China’s role in Brazil’s soy and beef sectors, which represent two of the major drivers of deforestation in the country’s Amazon region. Keywords Amazonia, Brazil, China, Deforestation, Soybeans 1 Introduction
Brazil’s Amazon region contains vast natural resources including land, timber, minerals and hydroelectric potential. China’s strong economy and large demands relative to domestic supplies of these resources makes that country’s increasing interest in Brazil a logical turn of events. China has become Brazil’s largest trading partner and the greatest source of export surplus from agricultural commodities (US$85 billion in 2011), contributing to Brazil’s economic growth and to reducing the country’s vulnerability to external economic crises (da Nóbrega 2012). It should therefore not come as a surprise that China exerts multiple influences on events in Brazil, often to the detriment of Amazon forest.
Some of the main drivers of Amazon deforestation include roads, agribusiness
development (cattle pasture, soybean production, logging and agro-industrial expansion), fire and mining (Brown 2004; Fearnside 2005a, 2008). Hargrave and Kis-Katos (2011) analyzed the economic causes of deforestation in the Brazilian Amazon with a regression method. They investigated the deforested area using the theoretical model of Angelsen (1999), who argued that deforestation can be explained by the expected profits from land use, but that liberalization and macroeconomic issues may also be relevant. Angelsen and Kaimowitz (1999) showed that agricultural and forestry exports may lead to more deforestation. In general, the literature points to such

2
deforestation causes as the area of soybeans harvested, the area of cattle pastures, the prices of these commodities, roads, population density, cattle herd size, geographical variables related to climate and soil, rural credit policies and economic growth (Morton et al. 2006; Barona et al. 2010; Martins and Pereira 2012). Hargrave and Kis-Katos (2011) estimated deforestation as a function of these possible causes for each municipality (county) in the Legal Amazon (this 5-million km2 administrative region includes the states of Acre, Amapá, Amazonas, Maranhão, Mato Grosso, Pará, Rondônia, Roraima and Tocantins). They showed soybean prices and environmental fines to be factors influencing deforestation. Their findings, however, did not explicitly take into account the exports to China as the main consumer of Amazonian soybeans. Nepstad et al. (2006) have argued that China's demand for Brazilian soybeans has stimulated production and also deforestation in Mato Grosso, the biggest Brazilian producer.
The rapid rise in exports of products such soy and beef to China have
consequences for Amazonian deforestation that, while they may appear obvious, are nevertheless complex to quantify and interpret. This direct impact of commodity exports is only the tip of the iceberg of Chinese influence on Amazonia. Money earned from this trade is strengthening Brazilian agribusiness interests, with profound effects on domestic politics that are reflected in legislative and administrative changes weakening environmental protection. Impacts can also be expected from Chinese financing under negotiation for infrastructure such as a railway linking the state of Mato Grosso to a port on the Amazon River. Mato Grosso, an Amazonian state that is twice the size of the US state of California, is a major focus of expansion of soy, cotton and intensified cattle production. Chinese purchases of land for agriculture and timber imply an increasing direct role in commodity production. Other impacts come from exports from mining and from the processing of minerals, especially the demands for charcoal for pig-iron smelters and for electricity from hydroelectric dams for aluminum smelters. 2 Brazil’s exports to China 2.1 Interpreting export data
Data on exports by product, origin and destination (for quantities as well as value in US dollars) are provided by the Aliceweb system (The System Information Analysis of Foreign Trade via the Internet) of the Brazilian Ministry of Development, Industry and Foreign Trade (MDIC). Chinese demand for Brazilian exports reached approximately US$30 billion in 2010, having increased tremendously since 2000, with annual geometric rates from 2000 to 2010 of about 44% for non-agricultural products and 34% for agricultural products in values FOB (“free on board,” or the value at the port of shipment net of all domestic transportation and loading costs). Exports originating in the Legal Amazon and destined to China have also increased at an impressive rate of 52% yearly from 2000 to 2010, increasing from US$104 million in 2000 to US$6631 million in 2010 (research data based on Brazil, MDIC 2012).
Exports to China from the Brazilian Legal Amazon rose from an average of 13% of total Brazilian exports to China in the 2000-2004 period to an average of 23% in the 2005-2010 period. The change occurred abruptly from 14.6% in 2004 to 23.3% in 2005 and then kept stable. Almost half of the change in the 2004-2005 period can be attributed to FOB price increases, but for the 2009-2010 period (when FOB prices were
3
lower) the physical quantities explain most of the increase in value (research data based on Brazil, MDIC 2012).
An interesting point to observe is that the share of export value represented by a soybean composite (soy grain, soy oil and other vegetable oil) decreased from a high of 66.3% in 2003 to 34.4% in 2010, with an average of 47.7% over the last five years. Iron and manganese now represent a large share of Brazilian exports to China, reaching 63.1% in 2010 (49.8% as a 5-year average). In 2010 about 83% of the Legal Amazon’s exports were from the states of Pará (52% - iron) and Mato Grosso (31% - soybeans). The share of iron plus soybeans in these two states decreased from 79% in 2006 to 72% in 2008, but then rebounded to high levels: 89% in 2009 and 83% in 2010 (research data based on Brazil, MDIC 2012).
Figure 1 graphs the exports of soybeans from Mato Grosso and of iron from Pará. The impressive increase is apparent. The value of iron from Pará and of soybeans from Mato Grosso totaled US$5.5 billion in 2010 (research data based on Brazil, MDIC 2012). [Figure 1 here] 2.2 Interpreting deforestation data
Data on the area planted in soybeans and the size of the cattle herd were
obtained from IBGE (Brazilian Institute of Geography and Statistics). Data on area deforested in the Brazilian Amazon are available from the Prodes project of the National Institute for Space Research (Brazil, INPE 2012). The database reports deforested area in hectares at the municipal level for 2000-2010. Note that these data only report the clearing of forest, not the clearing of cerrado (central Brazilian savanna) that represents much of the soybean area in the state of Mato Grosso. We note that in the past there have been significant problems with Brazilian deforestation data (e.g., Fearnside 1997), but that transparency and reporting have been greatly improved for the years covered in our quantitative analysis.
Looking at deforestation in the Legal Amazon and comparing it to exports to China, to soybean planted area and to cattle herd size, Figure 2 exhibits an interesting behavior. In Figure 2, based on Brazil, INPE (2012) deforestation data, and Brazil, IBGE (2012) agricultural data, the cumulative area may give a misleading interpretation because this area is not the increase in deforestation. The cumulative deforested area clearly has a positive relationship with the area of soybeans, the size of the cattle herd and the value of exports, but for each year there is a different value for exports and soybean area, while the deforested area is a cumulative value. One point to be observed is that recent expansion of soybeans in Mato Grosso is taking place in preexisting pastures that represent areas deforested at some time in the past. The advance of soybeans into pasture areas in Mato Grosso has long been believed to displace ranching activity into forest areas such as those in Pará, contributing to deforestation there (Fearnside 2001; Fargione et al. 2008). Recently this effect has been demonstrated statistically (Arima et al. 2011).
[Figure 2 here]
4
In Figure 3, the increase in deforested area is depicted for each state in the Legal Amazon using Brazil, INPE (2012) data. It can be observed that the deforestation rate has declined since 2001, staying below 10,000 km² in 2009-2010. The state of Pará had the largest increase in deforested area (almost 3400 km²), or 52.6% of the total increase in 2010. Mato Grosso was an important state up to 2008 with a rapid expansion in agriculture and cattle raising, but there was a significant reduction in 2009-2010: Mato Grosso accounted for only 12% of the total increase in 2010. [Figure 3 here]
The data from Brazil, INPE (2012) and Brazil, MDIC (2012) exhibit a strict positive relationship between cumulative deforestation and the Legal Amazon’s exports, with a high correlation (0.82). A different pattern is seen if the increase in deforestation is plotted against the value of exports. This shows an inverted relationship with a negative correlation of -0.72 with total exports (Figure 4). [Figure 4 here]
Looking at the data in this way, the exports to China are not a driving force of deforestation directly, and more detailed observation is needed. Soy is a major product in total exports to China, but what is its relationship to the increase in deforestation? Figure 2, indicated a pattern associating cumulative deforestation with soybean area and cattle herd size. Figure 5 shows the increase in deforestation against these two variables using Brazil, INPE (2012) and Brazil, IBGE (2012) data. [Figure 5 here]
According to Figure 5, the increase in deforested area is accompanied by increases in either the cattle herd or the soybean area. However, the regression line had non-significant parameters and the correlations with the increase in deforestation were 0.3 for soybeans and 0.5 for cattle. On the other hand, there is a strong positive correlation (0.85) between the differences in soybean area and in cattle herd size. The same pattern was found by Marta and Figueiredo (2008).
Figure 6 shows the relation of exports to soybeans and cattle according to Brazil, MDIC (2012) and Brazil, IBGE (2012) data. The two scatters in Figure 6 present essentially the same information: a positive correlation between the exports to China and the sizes of the herd and the crop. The correlation is 0.69 for soybean area and 0.67 for cattle herd.
[Figure 6 here]
2.3 System estimation
A regression was performed for the entire Legal Amazon, aggregating the data
from the nine states in the region. The deforestation process is quite complex, leading us to use a systems approach. This approach allowed us to relate explanatory variables to both a deforestation equation and an exports equation.

5
The idea is that the soybeans are planted in already-existing cattle pastures (Marta and Figueiredo 2008). The soybeans are then exported and there is a kind of learning process where exports lead to an effect on the next period’s exports. These exports, together with a previous pressure from the preceding period’s deforestation and cattle herd size, are used to explain the amount of deforestation in the current period. The system uses the following variables: deforested area (DEFOR) and the FOB value of exports to China (EXPORT) as endogenous, and soybean planted area (SOY), cattle herd (HERD), previous-year deforestation and previous-year exports as instruments (the variables used in the first step of the three-stage linear system). All variables refer to the Legal Amazon from 2000 to 2010 with values expressed as logarithms. The system can then be expressed as (1) for year “t”. Dlog(DEFOR) t = β0 + β1*Dlog(HERD)t-1 + β2*Dlog(SOY)t + β3*DLog(DEFOR)t-1 + + β4*Log(EXPORT)t + ε1t Log(EXPORT) t = β5 + β6*Log(HERD)t-1 + β7*Log(SOY)t + β8*Log(EXPORT)t-1 + + ε2t (1) where the variables are as described above and the Dlog operator denotes the first difference between the logarithms, or Dlog(xt)=log(xt)-log(xt-1). This is done to account for the increase in deforested area, as well as the size of the cattle herd and the area in soybeans.
The estimation follows the three-stage least squares method, where a generalized least squares estimator is applied to a system of equations (in this case two equations) with a variance-covariance parameter matrix estimated in a previous step (in the first and second stages, the endogenous variables are regressed against instrumental variables and forecasts of endogenous variables are then used to calculate the variance-covariance parameter matrix).
Unfortunately, at this time we do not have data on exports by municipality. Municipal-level data would increase the degrees of freedom in this combination of cross-sectional and time-series data, allowing spatial regression techniques to be applied.
The results of the system estimation, as in expression (1). are presented in Table 1. The system residual Portmanteau tests for autocorrelations showed no autocorrelation at the 90% confidence level. There were satisfactory fits in both equations, with most of the parameters significant at the 99% confidence level. There were two non-significant parameters: the difference in cattle herd size in the deforestation equation and the intercept in the exports equation.
[Table 1 here]
In the equation for the increase in deforestation, the difference in soybean planted area exhibited a positive relationship, meaning that the expansion in soybean planted area may increase deforestation. The increase in deforestation in the previous year may lead to a decrease in the following year. Additionally, increases in exports to China are statistically significant in reducing the increase in deforestation (an unexpected result).

6
In the export equation, the cattle herd size in the previous year reduces the
export to China. The current exports are positively related both to soybean planted area and to exports in the previous year.
All of these results may be explained by the fact that most of soybeans in the Legal Amazon are in fact exported, and that China is expanding its imports. This functions like a learning-by-doing process, strengthening the trade relationship.
On the other side, the soybean plantations are occupying previous pastures. The persistence of cattle herds occupying land is a restriction on soybean cultivation and exports. The land-use shift from old degraded pasture into soybean cropping can, in some way, have a positive effect on exports. The problem is that the expansion in soybean area leads to more increase in deforestation. On the other side, increasing the cattle herd size does not seem to have a positive impact on the increase in deforestation. This is surprising, as other studies have found a strong effect of cattle herd size on deforestation (e.g., Alencar et al. 2004; Kaimowitz et al. 2004; Arima et al. 2005). This conclusion may be related to recent techniques improving pasture productivity (or pasture stocking), particularly in Mato Grosso. Although our analysis is at the level of the Legal Amazon for all variables, the effect of intensification would probably be substantially less important in other Amazonian states such as Pará.
Even though states like Mato Grosso and Pará exhibit increases in cattle herd size over the last four years, the herd in 2010 was about the same size as in 2005 for Pará, and Mato Grosso. The herd remained constant over the 2005-2008 period and had remarkable increases of more than 5% annually in 2009 and 2010. Mato Grosso had small increases in deforestation in 2009 and 2010, although it was one of the states with the largest increases in deforestation between 2000 and 2008, clearing land for herd expansion in the following years.
The relations of soybeans and cattle to deforestation over the 2000-2010 period were complicated by other factors that influenced the deforestation process to differing degrees in each year. The efforts of environmental authorities to control illegal deforestation through inspections and fines have varied substantially. Increased efforts to control deforestation appear to have had a significant effect from 2008 onwards, whereas before 2008 deforestation rates track soy and beef prices closely (Barreto et al. 2011; Assunção et al. 2012). In addition, the periods immediately preceding elections are normally characterized by deforestation increases both as a result of political pressure to relax environmental enforcement (especially at the state level) and as a result of anticipation by deforesters that election results will bring relaxed enforcement and/or amnesties forgiving past violations (see Fearnside 2003). 3 Other commodities 3.1 Timber China has cut almost all of its natural forests and, despite large-scale plantations of fast-growing trees, the country has a tremendous demand for timber such as that from Brazil’s Amazon forest. Unlike European and North-American markets, China is willing to buy wood from almost any species of tropical tree. An example of this

7
occurred when timber was sold prior to the 1988 flooding the Samuel Dam in the state of Rondônia (Fearnside 2005b). Export of raw logs from Brazil has been prohibited since 1965, but an exception was opened to allow logs from Samuel to be exported (Nogueira 1988). From 1987 through 1989, a continuous chain of barges arrived in the Amazon River port of Itacoatiara with logs for loading on ships, and one ship loaded with logs departed for China every two weeks during this period. The exception opened for the relatively small Samuel reservoir area had allowed logs to be illegally exported from vast areas in western Amazonia.
Chinese companies purchased several bankrupt sawmills in Manaus in 1996, thereby gaining the forest land holdings of the sawmill companies. Together with Malaysia, land purchases totaled 4.5 million hectares in the state of Amazonas (Amazonas em Tempo 1996). Most of the forest land bought by Chinese companies was in the municipality of Carauarí. A major increase in logging activity was expected at the time, but this did not occur (presumably due to the substantial bureaucratic barriers to obtaining approval of forestry management plans). Other countries have been satisfying most of the world’s demand for tropical timber, including the demands of China. However, Brazil has by far the largest stock of remaining tropical forest, and the pressure of this demand is bound to focus on Brazil once available stocks elsewhere are exhausted (Fearnside 1989a). 3.2 Alumina, aluminum and iron Chinese companies have interests in alumina (Al2O3: the precursor of primary aluminum) in Barcarena, Pará, where Alumina Brasil-China (ABC) and Aluminum Corporation of China Limited (Chalco) have a joint venture with the Brazilian mining company Vale (Vale 2009). The power demand for this electricity-intensive industry contributes to Brazil’s push for a massive increase in building hydroelectric dams in Amazonia over the next decade. Brazil’s 2011-2020 ten-year energy-expansion plan (Brazil, MME 2011) calls for 30 large dams to be built in the Legal Amazon by 2020, a rate of one dam every four months. The Chinese-Brazilian alumina plant will be an important beneficiary of the Belo Monte Dam, now under construction on the Xingu River, with transmission lines planned to connect Barcarena directly to the dam near Altamira, Pará. Belo Monte has environmental and social impacts that extend far beyond the areas that will be directly flooded, and the dam is likely to justify much larger upstream reservoirs to regulate the river’s flow (Fearnside 2006). The dam has functioned as a “spearhead” in creating precedents that weaken Brazil’s environmental licensing system and prepare the way for the many dams proposed under the energy-expansion plan (Fearnside 2012a). The expansion of Amazonian dams also receives a boost from China’s equipment sales, as in the case of the turbines from Dong Fang Electric Corporation International and Dong Fang Electric Machinery for the Jirau Dam now under construction on the Madeira River. The influence of both Brazil and China in expanding carbon credit for hydroelectric projects under the Kyoto Protocol’s Clean Development Mechanism has further increased the profitability of dams (Fearnside 2012b). Iron from Brazil is now largely exported to China (Soares 2012). The Chinese market has eclipsed the European purchasers that dominated exports from the Carajás Mine, in Pará, when the mine was opened in the 1980s. Processing of part of the ore for export as pig-iron consumes charcoal, providing a longstanding source of pressure on

8
the forests of eastern Amazonia and a challenge to environmental and labor authorities (Fearnside 1989b). The environmental and social impacts of charcoal production made European iron imports from Amazonia a target for criticism from non-governmental organizations (e.g., Sutton 1994), but this is no longer evident now that exports have shifted to China. 4 Financing from China
Another issue is the effect of Chinese finance in Latin America. China is a new and growing source of funding with less environmental restrictions, lower interest rates and different size loans (Gallagher et al. 2012). Most Chinese loans are for the oil, iron, steel, energy and telecom sectors. The official website of the state of Mato Grosso reports that the China Development Bank Corporation (CDBC) and the China Railway Engineering Co. (CREC) are interested in the construction and operation of a railroad between Cuiabá (Mato Grosso) and Santarém (Pará), cutting through Amazonia beside the BR-163 Highway (Mato Grosso 2012). The Santarém-Cuiabá railway has long figured in Brazilian development plans (see Laurance et al. 2001), but the high cost has kept it from being built until now. Chinese financing could remove this barrier (Maisonnave 2012). It should be remembered that major construction projects such as this very frequently involve corruption with significant effects on decision-making in the Brazilian government; an example is provided by revelations regarding the ongoing construction of Brazil’s North-South Railway, with the current revelations being only one in a sequence of scandals since construction began in 1986 (Mello and Amora 2012). 5 Land purchases by China
Currently land purchased directly by foreigners is limited to a maximum of 50 rural modules (making the limit 5000 ha in most of the Amazon region). The Brazilian government is planning to lower this limit with the express purpose of inhibiting land purchases by China (Reuters 2011). Among other effects, the Brazilian government believes that a spate of recent Chinese land purchases is an important factor in a sharp rise in land prices in the country (Latin American Herald Tribune 2012). However, the rising price of soy is also a factor (Agrimoney.com 2011). Chinese land purchases in Brazil in progress in January 2012 are shown in Table 2. This is undoubtedly very incomplete, since the Brazilian government stopped tracking foreign land purchases in 1994 and only resumed collection of this information in April 2012. Restrictions on outright purchases by foreigners are not likely to halt the trend to increasing control of land from abroad because Brazil’s 1988 Constitution changed the definition of “Brazilian” companies: rather than requiring a majority of the capital to be Brazilian, companies can be classified as “Brazilian” merely by having a headquarters in Brazil. Moreover, the lower house of the National Congress is currently debating the question of land acquisition by foreigners and a number of influential deputies have proposed changes in the law in order to relax existing restrictions (Brazil, Agência Câmara de Notícias 2012).
[Table 2 here]

9
6 Conclusions Demand for commodities by China increases deforestation in the Brazilian Legal Amazon. Even though deforestation rates were lower in 2010 than in 2000, the estimates confirmed the effect of soybean planted area in increasing both exports and deforestation over this period. The cattle herd size had a non-significant relation to increases in deforestation, but the relationship of cattle to soybean planted area is strong and positive. Therefore, the change in land use from pasture to soybean cropping (unless it occurs in degraded areas) may lead to more deforestation. Chinese purchases of agricultural and forest land and Chinese imports of commodities such as timber and aluminum also cause environmental impacts in Amazonia. Chinese financing and investment in Amazonian infrastructure such as railways and mineral processing facilities have additional impacts. Acknowledgements The first author thanks Conselho Nacional do Desenvolvimento Científico e Tecnológico (CNPq: Proc. 304020/2010-9, 610042/2009-2, 575853/2008-5), and Instituto Nacional de Pesquisas da Amazônia (INPA: PRJ13.03) for financial support. We thank two anonymous reviewers for helpful comments. References
Agrimoney.com. (2011). Soybeans' strength boosts Brazil's farmland prices. 7
November 2011. http://www.agrimoney.com/news/news.php?id=3352 Alencar, A., Nepstad, D. C., McGrath, D., Moutinho, P., Pacheco, P., Diaz, M. del C.
V., & Soares-Filho, B. (2004). Desmatamento na Amazônia: Indo além da
Emergência Crônica. Belém, Pará, Brazil: Instituto de Pesquisa Ambiental da Amazônia (IPAM), 87 pp. Available at: http://www.ipam.org.br/biblioteca/livro/Desmatamento-na-Amazonia-Indo-Alem-da-Emergencia-Cronica-/319
Amazonas em Tempo [Manaus]. (1996). Madeireiras asiáticas são multadas em R$91
mil. 2 August 1996, p. A-5. Angelsen, A. (1999). Agricultural expansion and deforestation: Modeling the impact of
population, market forces and property rights. Journal of Development
Economics, 58(1), 185-218. Angelsen, A., & Kaimowitz, D. (1999). Rethinking the causes of deforestation: Lessons
from economic models. The World Bank Research Observer, 14(1), 73-98. Arima, E., Barreto, P., & Brito, M. (2005). Pecuária na Amazônia: Tendências e
Implicações para a Conservação Ambiental. Belém, Pará, Brazil: Instituto do Homem e Meio Ambiente da Amazônia (IMAZON), 75 pp. Available at:

10
http://www.imazon.org.br/publicacoes/livros/pecuaria-na-amazonia-tendencias-e-implicacoes-para
Arima, E. Y., Richards, P., Walker, R., & Caldas, M. M. (2011). Statistical confirmation
of indirect land use change in the Brazilian Amazon. Environmental Research
Letters, 6: 024010. doi:10.1088/1748-9326/6/2/024010 Assunção, J., Gandour, C. C., & Rocha, R. (2012). Deforestation Slowdown in the
Legal Amazon: Prices or Policies? Climate Policy Initiative (CPI) Working Paper, Rio de Janeiro, RJ, Brazil: Pontífica Universidade Católica (PUC), 37 pp., Available at: http://climatepolicyinitiative.org/publication/deforestation-slowdown-in-the-legal-amazon-prices-or-policie/.
Barreto P., Brandão Jr., A., Martins, H., Silva, D., Souza Jr., C., Sales, M., & Feitosa, T.
(2011). Risco de Desmatamento Associado à Hidrelétrica de Belo Monte. Belém, Pará, Brazil: Instituto do Homem e Meio Ambiente da Amazônia (IMAZON), 98 pp. Available at: http://www.imazon.org.br/publicacoes/livros/risco-de-desmatamento-associado-a-hidreletrica-de-belo-monte/at_download/file
Barona, E., Ramankutty, N., Hyman, G., & Coomes, O. T. (2010). The role of pasture
and soybean in deforestation of the Brazilian Amazon. Environmental Research
Letters, 5, 9 pp. Brazil, Agência Câmara de Notícias. (2012). Relatório sobre compra de terras por
estrangeiros será votado em 11 de abril. 28 March 2012. Brasília, DF, Brazil: Agência Câmara de Notícias. Available at: http://www2.camara.gov.br/agencia/noticias/agropecuaria/413045-relatorio-sobre-compra-de-terras-por-estrangeiros-sera-votado-em-11-de-abril.html
Brazil, IBGE (Instituto Brasileiro de Geografia e Estatística). (2012). Sistema IBGE de
Recuperação Automática, SIDRA. Rio de Janeiro, Brazil: IBGE. Available at: http://www.sidra.ibge.gov.br/.
Brazil, INPE (Instituto Nacional de Pesquisas Espaciais). (2012). Projeto PRODES:
Monitoramento da Floresta Amazônica Brasileira por Satélite. São José dos Campos, São Paulo, Brazil: INPE. Available at: http://www.obt.inpe.br/prodes/.
Brazil, MDIC (Ministério de Desenvolvimento, Indústria e Comércio). (2012).
Aliceweb. Brasília, DF, Brazil: SECEX-MDIC. Available at: http://aliceweb2.mdic.gov.br/#.
Brazil, MME (Ministério de Minas e Energia). (2011). Plano Decenal de Expansão de
Energia 2020. Brasília, DF, Brazil: Empresa de Pesquisa Energética (EPE), MME, 317 pp. Available at: http://www.epe.gov.br/PDEE/20120302_1.pdf
Brown, L. (2004). The Brazilian dilemma. Pages 157–176 in Outgrowing the Earth: The
Food Security Problem in an Age of Falling Water Tables and Rising
Temperatures. New York, U.S.A.: Earth Policy Institute. & Norton, 256 pp.

11
da Nóbrega, M. (2012). A China, a Embrapa e o passado. Veja [São Paulo], 22 February 2012, p. 20.
Fargione, J., Hill, J., Tilman, D., Polasky, S., & Hawthorne, P. (2008). Land clearing
and the biofuel carbon debt. Science, 319, 1235-1238. Fearnside, P. M. (1989a). Forest management in Amazonia: The need for new criteria in
evaluating development options. Forest Ecology and Management, 27(1), 61-79. doi: 10.1016/0378-1127(89)90083-2
Fearnside, P. M. (1989b). The charcoal of Carajás: Pig-iron smelting threatens the
forests of Brazil's Eastern Amazon Region. Ambio, 18(2), 141-143. Fearnside, P. M. (1997). Monitoring needs to transform Amazonian forest maintenance
into a global warming mitigation option. Mitigation and Adaptation Strategies
for Global Change, 2(2-3): 285-302. doi: 0.1023/B:MITI.0000004483.22797.1b Fearnside, P. M. (2001). Soybean cultivation as a threat to the environment in Brazil.
Environmental Conservation, 28(1), 23-38. doi: 10.1017/S0376892901000030 Fearnside, P. M. (2003). Deforestation control in Mato Grosso: A new model for
slowing the loss of Brazil’s Amazon forest. Ambio, 32, 343–345. Fearnside, P. M. (2005a). Deforestation in Brazilian Amazonia: History, rates and
consequences. Conservation Biology, 19(3), 680-688. Fearnside, P. M. (2005b). Brazil's Samuel Dam: Lessons for hydroelectric development
policy and the environment in Amazonia. Environmental Management, 35(1), 1-19.
Fearnside, P. M. (2006). Dams in the Amazon: Belo Monte and Brazil’s hydroelectric
development of the Xingu River Basin. Environmental Management, 38(1), 16-27.
Fearnside, P. M. (2008). The roles and movements of actors in the deforestation of
Brazilian Amazonia, Ecology and Society, 13(1), 23. Available at: www.ecologyandsociety.org/vol13/iss1/art23/
Fearnside, P. M. (2012a). Belo Monte: A spearhead for Brazil’s dam-building attack on
Amazonia? GWF Discussion Paper 1210, Global Water Forum, Canberra, Australia. Available at: http://www.globalwaterforum.org/wp-content/uploads/2012/04/Belo-Monte-Dam-A-spearhead-for-Brazils-dam-building-attack-on-Amazonia_-GWF-1210.pdf
Fearnside, P. M. (2012b). Carbon credit for hydroelectric dams as a source of
greenhouse-gas emissions: The example of Brazil’s Teles Pires Dam. Mitigation
and Adaptation Strategies for Global Change, doi: 10.1007/s11027-012-9382-6. (online-first version published 6 May 2012 http://www.springerlink.com/content/c105v17021045048/fulltext.pdf)
12
Gallagher, K. P., Irwin, A., & Koleski, K. (2012). The New Banks in Town: Chinese
Finance in Latin America. Washington, DC, U.S.A.: Inter-American Dialogue, 37 pp.
GRAIN. (2012). GRAIN releases data set with over 400 global land grabs. 23 February
2012. http://www.grain.org/article/entries/4479-grain-releases-data-set-with-over-400-global-land-grabs
Hargrave, J., & Kis-Katos, K. (2011). Economic causes of deforestation in the Brazilian
Amazon: A panel data analysis for the 2000s. Discussion Paper Series n.17, Freiburg, Germany: University of Freiburg, 30 pp. Available at: http://www.vwl.uni-freiburg.de/iwipol/discussion_papers/DP17_Hargrave_Kis-Katos%20-%20Economic%20Causes%20of%20Deforestation%20in%20the%20Brazilian%20Amazon.pdf
Kaimowitz, D., Mertens, B., Wunder, S., & Pacheco, P. (2004). Hamburger Connection
Fuels Amazon Destruction. Bogor, Indonesia: Centre for International Forestry Research (CIFOR), 10 pp. Available at: http://www.cifor.org/publications/pdf_files/media/amazon.pdf
Latin American Herald Tribune, (2012). Brazil limits land sales to foreigners. Latin
American Herald Tribune, 12 April 2012. http://www.laht.com/article.asp?ArticleId=364278&CategoryId=14090
Laurance, W. F., Cochrane, M. A., Bergen, S., Fearnside, P. M., Delamônica, P., Barber,
C., D’Angelo, S., & Fernandes, T. (2001). The future of the Brazilian Amazon. Science, 291, 438-439. doi: 10.1126/science.291.5503.438.
Maisonnave, F. (2012). MT negocia financiamento chinês para ferrovia. Banco pode
emprestar US$ 10 bi, diz governo; contrapartida inclui importação da China. Folha de São Paulo, 27 June 2012. http://www1.folha.uol.com.br/fsp/mercado/51212-mt-negocia-financiamento-chines-para-ferrovia.shtml
Marta, J. M. C., & Figueiredo, A. M. R. (2008). Expansão da soja no cerrado de Mato
Grosso: aspectos políticos. Revista de Política Agrícola, 15(1), 117-128. Martins, P. F. S., & Pereira, T. Z. S. (2012). Cattle-raising and public credit in rural
settlements in Eastern Amazon. Ecological Indicators, 20, 316-323. Mato Grosso. (2012). Modal ferroviário e a economia de Mato Grosso (Parte I).
Available at: http://www.mt.gov.br/conteudo.php?sid=151&cid=73205&parent=0
Mello, F., & Amora, D. (2012). PF aponta superfaturamento na obra da ferrovia Norte-
Sul. Folha de São Paulo, 15 July 2012, p. A-4. Morton, D. C., DeFries, R. S., Shimabukuro, Y. E., Anderson, L. O., Arai, E., Espirito-
Santo, F. D. B., Freitas, R. & Morisette, J. (2006). Cropland expansion changes
13
deforestation dynamics in the southern Brazilian Amazon. Proceedings of the
National Academy of Sciences of the U.S.A., 103(39), 14637-14641. Nepstad, D. C., Stickler, C. M., & Almeida, O. T. (2006). Globalization of the Amazon
soy and beef industries: Opportunities for conservation. Conservation Biology, 20(6), 1595-1603.
Nogueira, W. (1988). China importa madeira em toras. Amazonas em Tempo [Manaus],
9 March 1988, Caderno 1, p. 8. Reuters. (2011). Brazil plans stricter land purchase rules. 19 November 2011.
http://farmlandgrab.org/post/view/19629 Soares, P. (2012). Vale diz que venda à China continua em alta. Folha de São Paulo, 14
July 2012, p. B-4. Sutton, A. (1994). Slavery in Brazil--A Link in the Chain of Modernization. Anti-
Slavery International, London, U.K. 128 pp. Vale. (2009). Pará terá refinaria de alumina. 18 January 2009.
http://saladeimprensa.vale.com/pt/versao_impressao/prt_detail.asp?tipo=1&id=15686.
FIGURE LEGENDS Figure 1. Value of exports (US$ FOB) for soybeans from Mato Grosso and iron from
Pará, Brazil, 2000-2010. Source: Research Data, MDIC. Figure 2. Cumulative area of deforestation (km²), Soybean planted area (ha), Cattle
herd (head) in the Brazilian Legal Amazon, 2000-2010. Source: INPE-PRODES, IBGE-SIDRA. Data normalized to year 2000 = 100.
Figure 3. Annual increase in deforested area (km²) in each state in the Brazilian Legal
Amazon, 2001-2010. Source: INPE-PRODES. Figure 4. Increase in deforested area (km²) in the Brazilian Legal Amazon against the
value of exports to China, 2001-2010. Source: INPE-PRODES; MDIC-Aliceweb.
Figure 5. Increase in deforested area (km²) in the Brazilian Legal Amazon against the
difference in soybean planted area and in cattle herd size, 2001-2010. Source: INPE-PRODES; IBGE-SIDRA.
Figure 6. Total Exports from the Brazilian Legal Amazon to China against the soybean
planted area and cattle herd, 2001-2010. Source: MDIC-Aliceweb; IBGE-SIDRA. Total Exports from Legal Amazon to China in FOB US$ bi. Soybean planted area in 10³ hectares. Cattle herd in millions of head.
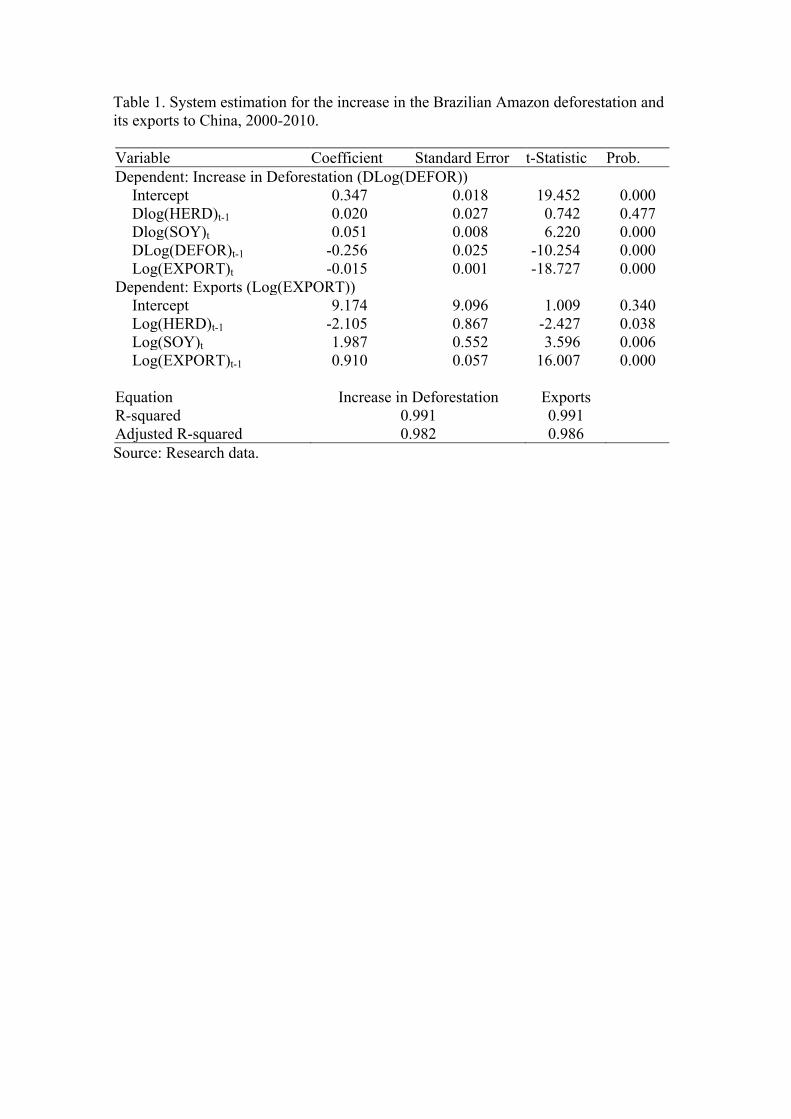
Table 1. System estimation for the increase in the Brazilian Amazon deforestation and its exports to China, 2000-2010. Variable Coefficient Standard Error t-Statistic Prob. Dependent: Increase in Deforestation (DLog(DEFOR))
Intercept 0.347 0.018 19.452 0.000 Dlog(HERD)t-1 0.020 0.027 0.742 0.477 Dlog(SOY)t 0.051 0.008 6.220 0.000 DLog(DEFOR)t-1 -0.256 0.025 -10.254 0.000 Log(EXPORT)t -0.015 0.001 -18.727 0.000
Dependent: Exports (Log(EXPORT)) Intercept 9.174 9.096 1.009 0.340 Log(HERD)t-1 -2.105 0.867 -2.427 0.038 Log(SOY)t 1.987 0.552 3.596 0.006 Log(EXPORT)t-1 0.910 0.057 16.007 0.000
Equation Increase in Deforestation Exports R-squared 0.991 0.991 Adjusted R-squared 0.982 0.986 Source: Research data.
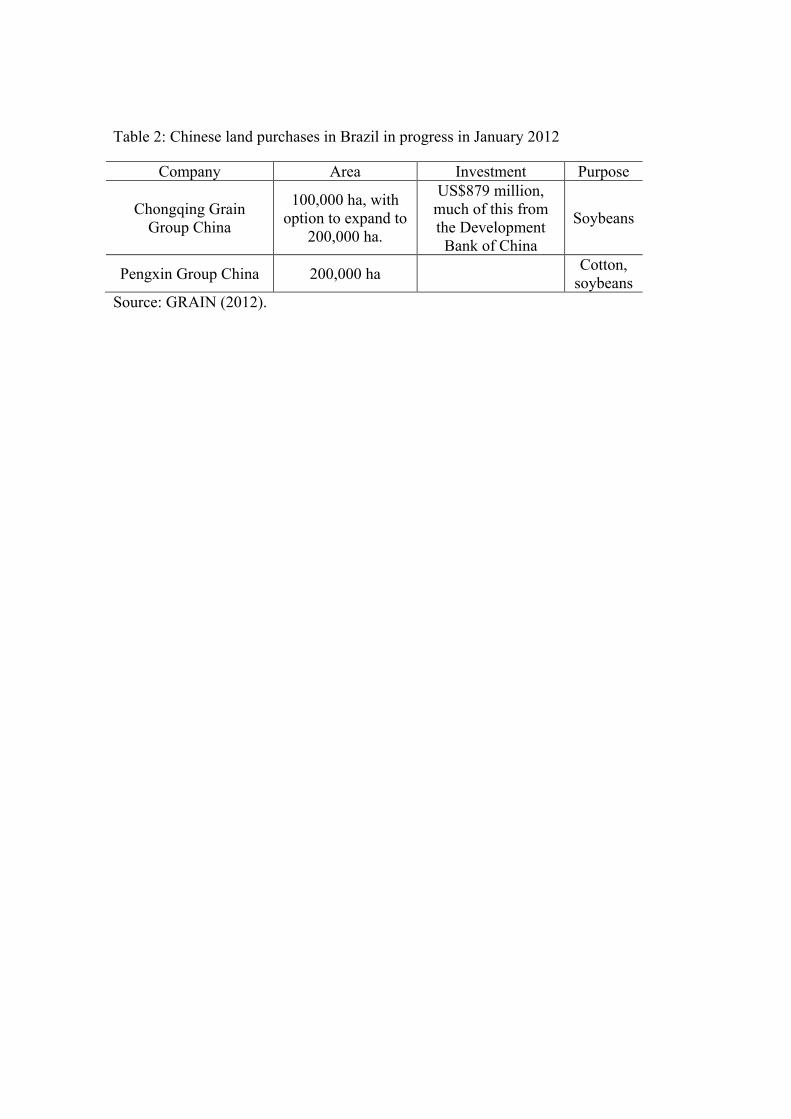
Table 2: Chinese land purchases in Brazil in progress in January 2012
Company Area Investment Purpose
Chongqing Grain Group China
100,000 ha, with option to expand to
200,000 ha.
US$879 million, much of this from the Development
Bank of China
Soybeans
Pengxin Group China 200,000 ha Cotton, soybeans
Source: GRAIN (2012).

Figure 1. Value of exports (US$ FOB) for soybeans from Mato Grosso and iron from Pará, Brazil, 2000-2010.
Source: Research Data, MDIC.
-
1.0
2.0
3.0
4.0
5.0
6.0
7.0
2000 2001 2002 2003 2004 2005 2006 2007 2008 2009 2010
FOB US$ Billion
Iron exports from Pará Soybean exports from Mato Grosso LA Exports to China

Figure 2. Cumulative area of deforestation (km²), Soybean planted area (ha), Cattle herd (head) in the Brazilian Legal Amazon, 2000-2010.
Source: INPE-PRODES, IBGE-SIDRA. Data normalized to year 2000 = 100.
100
125
150
175
200
225
250
2000 2001 2002 2003 2004 2005 2006 2007 2008 2009 2010
Deforestation Soybean area Bovine herd
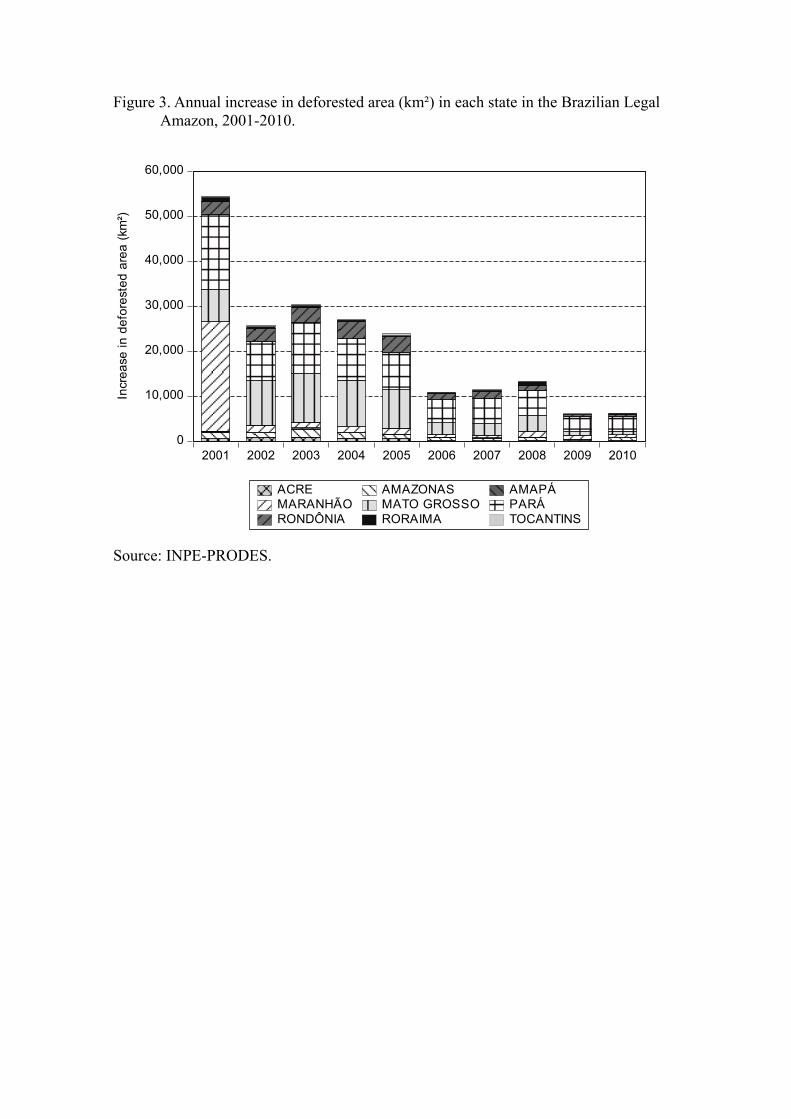
Figure 3. Annual increase in deforested area (km²) in each state in the Brazilian Legal Amazon, 2001-2010.
Source: INPE-PRODES.
0
10,000
20,000
30,000
40,000
50,000
60,000
2001 2002 2003 2004 2005 2006 2007 2008 2009 2010
ACRE AMAZONAS AMAPÁMARANHÃO MATO GROSSO PARÁRONDÔNIA RORAIMA TOCANTINS
Incr
ease
in d
efor
este
d ar
ea (k
m²)

Figure 4. Increase in deforested area (km²) in the Brazilian Legal Amazon against the value of exports to China, 2001-2010.
Source: INPE-PRODES; MDIC-Aliceweb.
0.0
1.0
2.0
3.0
4.0
5.0
6.0
7.0
0.0 10.0 20.0 30.0 40.0 50.0 60.0
Increase in Legal Amazon Deforestation (10³ km²)
Total Exports from Legal Amazon to China
Exports of Iron and Manganese from Legal Amazon to China
Exports of Soybean from Legal Amazon to China
FO
B U
S$
billio
n

Figure 5. Increase in deforested area (km²) in the Brazilian Legal Amazon against the difference in soybean planted area and in cattle herd, 2001-2010.
Source: INPE-PRODES; IBGE-SIDRA.
-4,000
-2,000
0
2,000
4,000
6,000
8,000
0.0 10.0 20.0 30.0 40.0 50.0 60.0
Increase in Deforested Area in the Legal Amazon (10³ km²)
Difference in soybean planted areaDifference in cattle herd
Soyb
eans
(10³
ha)
and
Cat
tle (1
0³ h
ead)

Figure 6. Total Exports from the Brazilian Legal Amazon to China against the soybean planted area and cattle herd, 2001-2010.
Source: MDIC-Aliceweb; IBGE-SIDRA. Total exports from Legal Amazon to China in FOB US$ billion. Soybean planted area in 10³ hectares. Cattle herd in106 head.
3.0
4.0
5.0
6.0
7.0
8.0
0.0 1.0 2.0 3.0 4.0 5.0 6.0 7.0
Total Exports from Legal Amazon to China
Soyb
ean
plan
ted
area
50.0
55.0
60.0
65.0
70.0
75.0
80.0
0.0 1.0 2.0 3.0 4.0 5.0 6.0 7.0
Total Exports from Legal Amazon to ChinaCa
ttle
herd