feasibility and cost/benefit analysis. cost considerations u cost classifications –tangible /...
Post on 19-Dec-2015
245 views
TRANSCRIPT

Feasibility and Cost/Benefit Analysis

Cost considerations
Cost classifications
–Tangible / Intangible
–Direct / Indirect
–Fixed / Variable
–Developmental / Operational

IS Chargeout Methods
IS incurs costs that are directly attributed to developing the system– salaries– hardware– software– supplies
Also indirect costs

IS Chargeback Methods
Chargeback method is technique used to bill end users for indirect costs of running information systems department– No charge (cost center vs. profit center)– Fixed charge– Variable – based on resource usage– Variable – based on volume

No Charge Method
treat IS costs as necessary cost of doing business
IS is a COST CENTER

Fixed Charge Method
IS costs are divided among all other departments, each assessed a fixed monthly charge
IS is now a PROFIT CENTER

Variable charge Method
Based on resource usage– connect time– CPU time
Based on volumes– Number of transactions– number of files– number of records

Benefit Considerations
Positive Benefits– increase revenues, improve services.
… Cost Avoidance Benefits
– reduced clerical costs, reduced overtime, …
Must consider both

Cost - Benefit Analysis
Process of comparing anticipated costs of IS to anticipated benefits
Performed throughout SDLC to determine economic feasibility

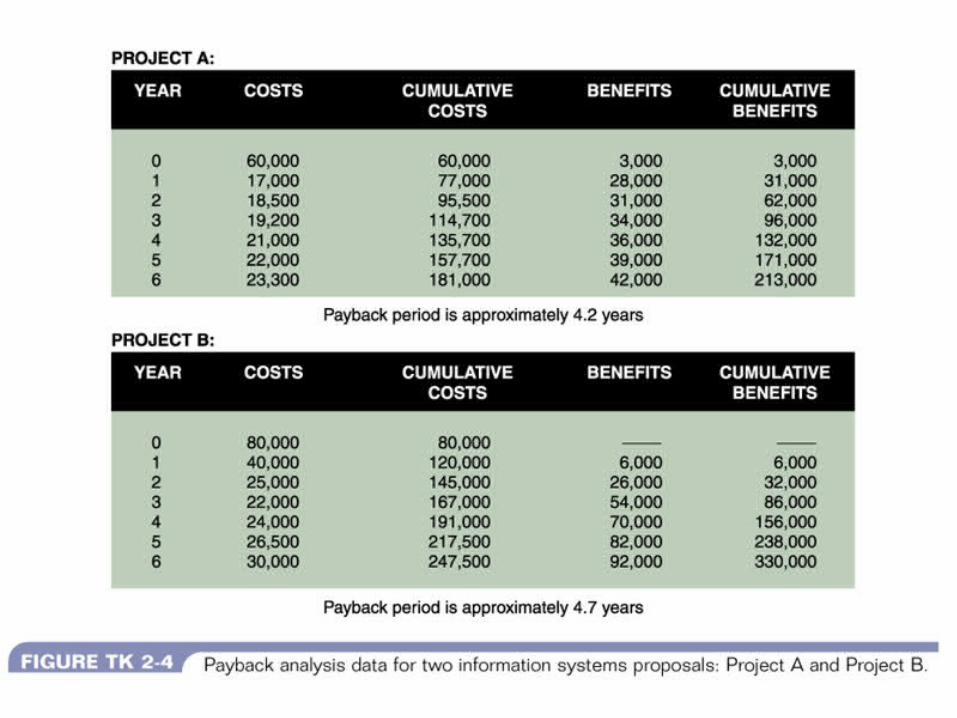
Payback Analysis
Determine the initial development cost of the system
Estimate annual benefits Determine annual operating costs Find the payback period by comparing total
development and operating costs to the accumulated value of the benefits produced by the system

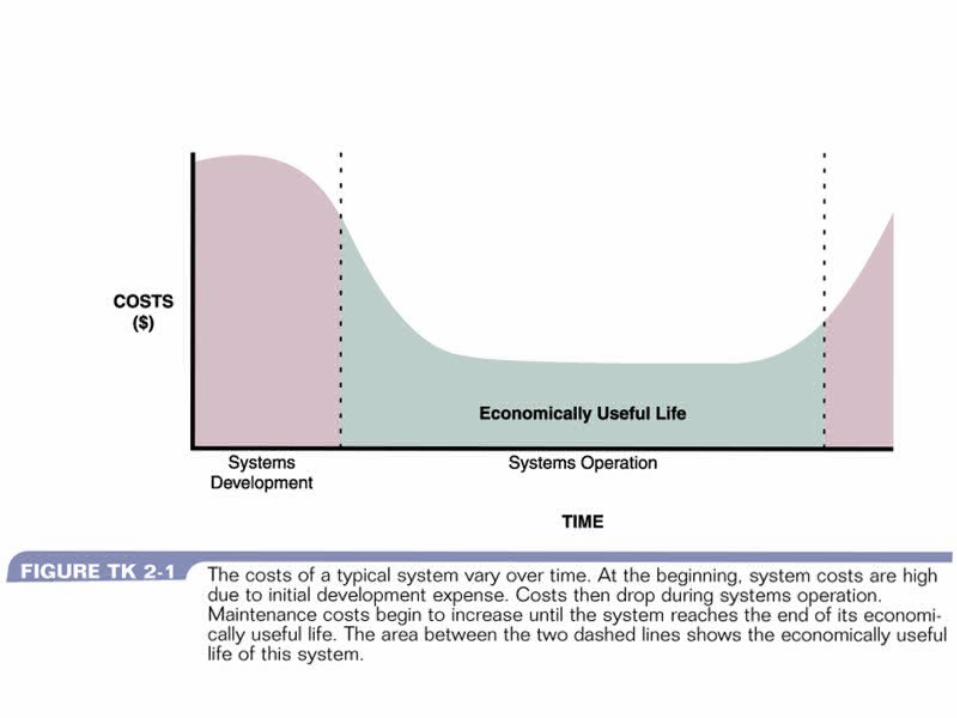
Payback Analysis Plot costs of IS year by year over entire
potential life– costs high at beginning (developing)– costs decrease at beginning of system
operation, stay relatively constant for a while
– costs eventually start to increase -- possibly rapidly (more and more maintenance required)


Payback Analysis
Plot benefits provided by IS against time–No benefit until system is
operational–Benefits increase rapidly–Benefits tend to level off

Payback Analysis
Payback period -- amount of time that passes before accumulated benefits equal accumulated costs of developing and operating system
NOTE -- not the point where the cost and benefit curves cross

Payback Analysis - ** Places emphasis on early costs and
benefits, ignoring costs and benefits after payback period
Rarely used to compare projects because later benefits are ignored
Many companies establish minimum payback periods for continued consideration (5 years)

Return on Investment Analysis
ROI = (total benefits - total costs)
total costs

Return on Investment Analysis
Many organizations require minimum ROI (15%)
You can used ROI for ranking projects
However, only an average rate and ignores time value of money


Present Value Analysis
PV of a future dollar is the amount of money that, when invested today at some specified interest rate, would grow to exactly one dollar at that point in the future

Present Value Analysis
PV = 1 / ( 1 + I) n
Rule of 72
Net Present Value


Present Value Analysis
Any project with positive net present value is economically feasible

PROJECT MANAGEMENT
Ongoing process of directing and coordinating all the steps in development of IS
Effective project management necessary throughout SDLC

Project Management -- Overview
GOAL -- produce IS that is acceptable to end users, in time, and in budget($)
Project Manager– manage project (daily activities)
Project coordinator– handles administrative and procedural
responsibilities

Management Functions
Planning Organizing Leading Controlling

Project Planning
Takes place at beginning and end of all SDLC phases

ACTIVITY (Task)
any project-related work requiring use of project resources (personnel, time or money) or any external effort that impacts the project
smallest unit of work over which project manager desires control
ACTIVITIES should be small and manageable

EVENT
Project milestone representing beginning or end of an activity
Concrete and recognizable (to verify that an activity is complete)


PROJECT MANAGER Defines project activities and events estimates time and cost to complete each
activity schedules/assigns activities to specific team
members coordinates activities monitors events evaluates/reports on progress

PROJECT ESTIMATING
REALISTIC TIME ESTIMATES VERY DIFFICULT
MUST CONSIDER– Size of project– IT Resources– Prior experience– Constraints

TIME ESTIMATES
Person days Time and people are NOT NOT
interchangeable Quantitative Method Experience Method Constraint Method

General Productivity Programmer does not spend 8 hours / day on
project assignments
– meetings
– training
– down time
– vacations
– maintenance
– other projects….

PROJECT SCHEDULING
(Identify activities) Determine order in which activities
will be performed Set start/end times for activities assign specific tasks to team
members

Scheduling Tools
Gantt Chart PERT/CPM
Gantt chart
First used in 1917 to control production of war materials
Horizontal bar chart that graphically illustrates a schedule


Gantt chart
Time represented by horizontal axis Activities listed vertically (in order by
start dates) Length of bar indicates duration of
activity Current date indicated with dotted line
or shaded bars

Gantt chart
Useful for tracking and reporting progress Picture is easily understood Not great for project control Do not show project dependencies; can
not determine impact on entire project caused by an activity that is behind schedule

PERT/CPM
Program Evaluation Review Technique
Critical Path Method Developed by Navy Special
Projects Office in 1950’s to control submarine missile program

PERT/CPM Project activities and events are graphically
presented as network of vectors and nodes Activity -- Vector (line with single
arrowhead) connects one node to another Event -- Node (usually circles) Vector similar to bar on Gantt, ---- length of
vector does not indicate length of activity

PERT/CPM
Activities can be scheduled serially or parallel
Dummy Activity (dashed vector)–indicates dependency, no time is
required Activity duration

PERT/CPM
Earliest completion time (ECT)
–calculated from beginning to end Latest completion time (LCT)
–calculated from end to beginning (after entire project has identified ECT)

PERT/CPM
Slack time
– amount of time by which an event can be late without delaying the project
– difference between LCT and ECT Critical Path
– Complete path through a PERT/CPM network where ECT equals LCT

Gantt Chart vs. PERT/CPM PERT shows dependencies
– much more helpful for project scheduling
– Useful for monitoring and controlling projects
– Critical path identified
– Difficult to construct Gantt
– Easier to use for reporting purposes

Gantt vs. PERT/CPM
Used in combination with each other neither address resource leveling
–process that manager used to ensure that no team members are either underutilized or overscheduled

Project monitoring and control
Traditional management functions of directing and controlling
structured walk through Peer review
Project Management Project reporting
– Project status meetings– Project status reports
Project management software– allows manager to iterate between
schedules, estimates and resource assignments
Change Control – Project coordinator responsibility

Software Change Control
Process of managing and controlling requested changes to system requirements document after requirements have be accepted and frozen

Software Change Control Complete change request form Project coordinator makes initial
determination If you are to proceed, analyze the impact of
requested changed (project manager or analyst)
Determine disposition of requested change

Why Projects fail???
When does programmer inform project manager that he is behind schedule?
When does project manager inform corporate management that the project is behind schedule?