feasibility of using anaerobic digestion and … of using anaerobic digestion and composting to...
TRANSCRIPT

Feasibility of Using Anaerobic Digestion and Composting to Recover Additional Value from Spent Mushroom Substrate
Final Report
Prepared by: Ron Fleming, Malcolm MacAlpine and Sandy English
University of Guelph Ridgetown Campus Ridgetown, ON, N0P 2C0
Prepared for: Canadian Mushroom Growers Association (CMGA)
June, 2006


Executive Summary
A study was conduc ted at the Ridgetown campus of the University of Guelph between November, 2005 and May, 2006. The objectives were to determine if either anaerobic digestion or composting could be used to add value to Spent Mushroom Substrate (SMS). In the case of the digester, the added value would in the form of methane recovered in the biogas. In the composter, the value would be in the finished compost, believed to be easier to market than fresh SMS.
Anaerobic digestion took place in a mesophilic complete mixed system. The SMS was first mixed with tap water to create a slurry which could be handled in the system. Composting took place in a covered in-vessel system equipped with a mechanical turner and with forced aeration. SMS was added as is with no extra amendments. Each of the two studies lasted for at least four months.
Both composting and anaerobic digestion proved effective at further breaking down the organic matter in SMS. The composting process resulted in finished compost having an excellent feel and appearance. It contained salt levels high enough to potentially limit the range of applications. With anaerobic digestion, the resulting biogas had a methane content of close to 50% (i.e. lower than desired).
Specific findings of the study: • Composting proceeded for several months and chemical changes continued for
most of the time. Heating occurred for more than two months, though the material resembled finished compost in about one month. Based on the final appearance of the compost, a marketable product could be removed from the system in as little as four weeks.
• Based on the final appearance of the compost, turning at least weekly was better than not turning at all or turning on a monthly basis. Weekly turning ensured a homogeneous end product with no sign of the straw present in the other channels.
• The mass of compost was measured at 150 days after the start of composting – some time after the compost process was believed to be complete. At that time, the final mass was 38 to 54% of the original, depending on the channel. A design value in the range of 40 to 50% appears reasonable.
• The C:N ratios of the SMS and finished compost were in the range of 10.6 to 12.2 – these somewhat low values (ideal might be between 20 and 25) did not appear to pose any practical problems.
• Based on a “Conservation of Ash” approach, levels of dry matter, N and C dropped as the composting proceeded while P and K remained relatively constant. The drop in levels of DM, N and C were similar in each of the three channels, regardless of turning frequency.
• The electrical conductivity (EC) of the compost in Channel 3 (assumed to be representative of the recommended management system) was 6.4 mS/cm. The EC of the fresh SMS was 5.6 mS/cm. Values between five and 10 are considered to be “High” and should be diluted if used as a soil amendment, depending on the sensitivity of the plantings. The germination test performed on the compost yielded a value of 97% for Channel 3 (using cucumber seeds). The lowest value

received was 86%. The relatively high germination percentages do not appear to support the EC results.
• Finished compost samples contained levels of copper in the range 117 to 123 :g/g, which exceeded the Canadian compost guideline of 100 :g/g. Molybdenum levels in the range 5.4 to 7.65 :g/g were also higher than the standard of 5.0 :g/g. Other metals were well within current guidelines.
• Both composting and anaerobic digestion were effective at reducing or eliminating odours and at greatly reducing numbers of indicator bacteria.
• In the original SMS, 65.4% of the dry matter was in the form of volatile solids (VS). During the final 50 days of the study, once it was believed that a steady state had been achieved, the digester was loaded at an average rate of 6.7 kg/day of VS.
• The biogas production (steady state period) averaged 0.72 m3/day, and methane represented 49.3% of the total gas yield.
• The methane yield from the steady state system averaged 53 L CH4/kg VS. This value is considerably less that what would be expected if livestock manure were the digested material (i.e. between 288 and 562 L CH4/kg VS, depending on manure type). Testing using hog manure in the same digester during the fall of 2005 yielded approximately 410 L CH4/kg VS.
• Based on recovering 20% of the theoretical energy yield from methane in the production of electricity and a further 40% in the recovery of heat energy, the SMS biogas production was equivalent to 2.1 kWh/day. Unfortunately, electrical energy inputs to the system (for heating and agitation) averaged 90 kWh/day. Recovering energy from SMS in the form of methane using an anaerobic digester does not appear to be practical, since the energy inputs are so much higher than the outputs.
An economic analysis was performed to assess the feasibility of composting
SMS to recover further value. The anaerobic digestion option was not considered, due to the poor energy picture. Only a covered in-vessel system was considered, complete with mechanical turning and fo rced aeration. Whether or not composting can pay for itself depends on two main factors: a) the value received from sales of compost (i.e. $30/t vs $40/t vs $60/t); and b) the current cost of disposal/sale/use of SMS.
If bulk compost can be sold as a premium product for $60/t (it is currently possible in Ontario), then the venture can be p rofitable at various sizes of operation. For some operations , the total cost to dispose of SMS may be high, while for others it may represent an income stream. This will have a huge impact on the feasibility of further composting.

Table of Contents
Introduction ................................................................................................................................... 1 Objectives...................................................................................................................................... 1 Background ................................................................................................................................... 1
Description ................................................................................................................................ 1 Uses for SMS............................................................................................................................ 3
a) Land Application .............................................................................................................. 3 b) Composting Further ........................................................................................................ 3 c) Horticulture ....................................................................................................................... 5 d) Turf Management ............................................................................................................ 5 e) Land Reclamation ........................................................................................................... 5 f) Control of Swine Behaviour ............................................................................................ 5 g) Animal Feed ..................................................................................................................... 6 h) Fuel.................................................................................................................................... 6 i) Anaerobic Digestion ......................................................................................................... 6 j) Land-filling and Incineration ............................................................................................ 6
Storage of SMS ........................................................................................................................ 6 Experimental Procedure ............................................................................................................. 7
Description of Test Facilities .................................................................................................. 7 Part A – Composting ........................................................................................................... 7 Part B – Anaerobic Digestion............................................................................................. 8
Description of Test Procedure .............................................................................................10 Part A – Composting .........................................................................................................10 Sample Collection ..............................................................................................................11 Sample Analysis.................................................................................................................12 Part B – Anaerobic Digestion...........................................................................................13 Sample Collection ..............................................................................................................14 Sample Analysis.................................................................................................................15
Results and Discussion – Part A: Composting ......................................................................16 General Observations ...........................................................................................................16 Physical Properties ................................................................................................................16
Temperature .......................................................................................................................16 Moisture ...............................................................................................................................18 Mass and Volume ..............................................................................................................18 Appearance.........................................................................................................................20
Chemical Analysis..................................................................................................................21 Bacteria Analysis....................................................................................................................27 Odour Analysis .......................................................................................................................27 General Discussion of Composting .....................................................................................28
Results and Discussion – Part B: Anaerobic Digestion .......................................................29 General Observations ...........................................................................................................29 Digester Performance ...........................................................................................................29
Temperatures .....................................................................................................................29 Gas Production...................................................................................................................29
Chemical Analysis..................................................................................................................32

Electricity Needs.....................................................................................................................33 Bacteria Analysis....................................................................................................................34 Odour Analysis .......................................................................................................................34 Explanation of Digester Design Issues...............................................................................35 General Discussion of Anaerobic Digestion ......................................................................35
Economic Analysis.....................................................................................................................36 Assumptions .......................................................................................................................37 Other considerations .........................................................................................................38
Summary .....................................................................................................................................39 Acknowledgements....................................................................................................................41 References ..................................................................................................................................42

Anaerobic Digestion and Composting of SMS Page 1
Introduction Spent Mushroom Substrate (SMS) is a by-product of mushroom production. It is what remains of the organic medium (i.e. “substrate”) used to grow mushrooms once a prescribed proportion of the original nutrients has been used. While it is often stored temporarily and land-applied, this use may not always be appropriate or possible. This study aims to explore alternate uses for SMS.
Anaerobic digestion is the breakdown of organic matter in the absence of oxygen. A typical system involves adding heat to maintain a specific temperature. The input material is in liquid form (usually between 1 and 15% dry matter) and at least 60% of the solids are volatile solids. This process usually takes between 15 and 40 days (20 days is typical). It yields biogas and a liquid digestate. The biogas consists mainly of methane and carbon dioxide. It is the methane that has the highest value, as it may either be burned directly or used to fuel a generator, thus producing electricity.
Composting is the breakdown of organic matter in the presence of oxygen. This is not new to mushroom producers, as a high percentage of the substrate is partially composted material. This substrate material is not “mature” compost when it is removed from the mushroom facility, however. It is possible that a more “sale”-able product may be obtained by allowing this SMS to complete the compost process.
Objectives There is relatively little information on using anaerobic digestion to further
process SMS. While there is some information on composting, there remain gaps in the knowledge. This study was initiated with the following objectives:
1. Assess the feasibility of using anaerobic digestion to further
process spent mushroom substrate. A focus of this part of the study is the value of the recovered methane gas.
2. Assess the feasibility of using composting to further process and add value to spent mushroom substrate.
Background
Description Mushroom substrate is a soil-like, growing medium used in the mushroom growing process. After a few cropping cycles, the mushroom yield diminishes with a given substrate and the compost material is declared “spent”. This

Anaerobic Digestion and Composting of SMS Page 2
substance is also referred to as spent mushroom compost or champost. The major components of SMS include chopped straw, poultry manure, horse manure, corn cobs, and gypsum (Guo et al., 2001). Other ingredients may include hay, cottonseed meal, cottonseed hulls, cocoa bean hulls, brewer’s grain, and some nutritive additives (Beyer, 1999). Mushroom compost is produced by first moistening the chopped straw with water for a few days before adding the manure, gypsum, and nutritive supplements. The compost is stacked in heaps, either in the open or under a roof, and turned every three days (Uzun, 2004). During this composting process, which lasts for about three weeks, the internal temperature of the stacks should not exceed 70oC. The compost is then transferred into a controlled temperature room where it is pasteurized, conditioned, and cooled. This eliminates most microbes and converts toxic ammonium into protein, and is then ready to be placed in the growing rooms (Uzun, 2004). Mushroom production lasts for approximately 70 days before new compost is required. When new compost is needed, the old remaining SMS is steam-pasteurized to remove any pests, weed seeds or diseases and then removed from the growing rooms (Anonymous, 2005). In 2003, world mushroom production reached over 2.7 million tonnes (Uzun, 2004). If about five kg of SMS is produced for each kg of mushrooms then about 13.6 million t of SMS are produced each year (Williams et al., 2001). This massive amount of SMS has traditionally been discarded as waste, creating an environmental nuisance, which gave rise to the need for a more suitable solution for the disposal of SMS. Agriculture, horticulture, and soil reclamation projects are now being considered due to the substrate characteristics. SMS improves soil structure by increasing organic matter, water and nutrient holding capacity, infiltration rate, permeability, aeration, microbial activity, soil temperature, and aggregate stability, while decreasing soil compaction, soil bulk density, and diurnal temperature changes (Stewart et al., 1998a; Uzun, 2004). Therefore, SMS is currently seen as a source of income to mushroom producers rather than an expense. The typical composition of SMS varies depending on its age, as seen in Table 1 (Uzun, 2004). One of the major disadvantages of fresh SMS is its relatively high salt content. Therefore, fresh substrate is usually weathered for about a year, during which time the salt content decreases, making it more suitable for plant growth or other uses. Fresh SMS contains about 1 to 2% N, 0.2 to 0.3% P, and 1.3 to 2.4% K (Uzun, 2004). SMS has a moisture content of approximately 60%. Typically, half of the dry matter is inorganic (ash) and the rest is organic (Uzun, 2004). The use of SMS has advantages over other composts because it is a consistent, homogenous product with similar characteristics all year round (Anonymous, 2005). SMS is weed and disease free due to the extensive composting and pasteurization before removing the substrate from the mushroom house (Beyer, 1999). The absence of heavy metals in SMS also reduces consumer concerns , compared to compost from some other sources (Anonymous, 2005).

Anaerobic Digestion and Composting of SMS Page 3
Table 1: Examples of Properties of Spent Mushroom Substrate (Uzun, 2004)
Content Units Fresh SMS
Weathered 8-16
months SMS
Horse Manure
Chicken Manure
Sodium % (DM basis) 0.72 0.22 0.3 0.13
Potassium % (DM basis) 2.35 1.03 1.2 2.25
Phosphorous % (DM basis) 0.36 0.55 0.9 2.5
Organic nitrogen % (DM basis) 1.83 1.89 3.5 6.11
Total nitrogen % (DM basis) 1.93 1.92 3.5 6.11
Solids % (As is) 43.39 49.43 24 20
Volatile solids % (DM basis) 62.78 44.29 - -
pH 7.23 8.05 7.2 6.5
Uses for SMS Following is a description of a variety of ways that SMS has been used – or at least areas where research efforts have been directed. a) Land Application - The most common use for SMS is land application for agriculture, since it is an ideal soil amendment. Experimentation has shown that SMS has increased corn, broccoli, cabbage, and tomato yields (Anonymous, 2005). Another study showed that when SMS was added to tomato plots, there was less evidence of root rot and yields were 66 to 82% higher (EAP, 1994). Therefore, this by-product has been proven to act as a soil conditioner and fertility source in vegetable production. As discussed earlier, SMS contains relatively high levels of salt so it should be aged for at least six months before applying to the land. Leaching peaks during the fifth and sixth months of weathering and stabilizes after twelve months. Most of the salts originally present are released during the first year of weathering, depending on rainfall (Uzun, 2004). The traditional method has been to allow SMS to naturally weather in the field but the re is a potential for environmental problems caused by the leachate. b) Composting Further - Passive composting involves creating shallow piles of SMS and allowing it to decompose naturally into a more stable, humus-like product (Hardy et al., 2000). Passive composting minimizes labour and machine inputs but requires a longer composting time, an increased exposure to runoff

Anaerobic Digestion and Composting of SMS Page 4
problems, and a large land area. The best management practices for passive composting include maintaining shallow piles (less than 90 cm) to discourage anaerobic conditions and odours, preventing storm water runoff, and applying vegetative cover (Hardy et al., 2000). Active composting involves mixing the SMS and storing it in elongated piles or windrows, which are periodically turned or agitated. This provides faster decomposition, prevents compaction, and disperses gases (Hardy et a l., 2000). The best management practices for active composting include composting on a concrete or compacted low-permeability surface, collecting waste liquids for storage and treatment, managing piles to maintain aerobic conditions, and diverting storm water runoff to controlled areas (Hardy et al., 2000). Berms or other structures should be constructed in order to divert runoff away from SMS piles, to prevent contaminated runoff from entering surface waters (CMGA, 2000). After aging for 18 months, very little N and P are lost. Levels of K can decrease considerably because it is much more soluble (Uzun, 2004). Research has shown that a 90 cm pile of SMS leaches 1,150 kilograms of nitrate per acre into the soil, which is 25 times the average nitrate level for a fertilized cornfield. In addition leachate can have up to 100 times the organic carbon of pond water (Hardy et al., 2000). In a study where SMS piles were weathered for two years, the total organic carbon in the soil did not rise but weathering did alter the soil pH. It also significantly increased electrical conductivity, water-soluble organic carbon, and water-soluble and exchangeable inorganic ions (Guo et al., 2001). Major inorganic cations that are leached out include potassium, sodium, calcium, magnesium, and ammonium, and major anions include chlorine and sulphate (Guo and Chorover, 2004). Although leachate is a major concern when dealing with SMS, one study showed that the rate of inorganic nitrogen leaching from mushroom compost was considerably slower than from chicken litter applied at the same rate (Stewart et al., 1998b). The slow release is the result of recalcitrant organic nitrogen. This study concluded that SMS is suitable as a slow-release source of nitrogen for crops but applications, particularly initially and at low rates, may cause nitrogen immobilization (Stewart et al., 1998b). SMS should not be applied to young plants because they are particularly sensitive to high levels of salts and ammonium (Uzun, 2004). The suggested rate of application varies depending on the SMS nutrient content, the local soil conditions, and the choice of the cultivar to be grown. SMS is usually applied in broadcast or in bands. Broadcast application provides a uniform effect while bands permits the use of lower doses of SMS. After application, SMS should be incorporated into the soil to prevent nitrogen loss (Uzun, 2004). Volatile sulphur compounds and cresol are the principal odour compounds in SMS (CMGA, 2000). To reduce odours, SMS may be placed in windrows and turned periodically to significantly increase the rate of microbial decomposition. Aeration may also decrease offensive odours by reducing anaerobic fermentation (CMGA, 2000). Heinemann et al. (2003) compared odours from an aerated floor system with those from a conventional windrow. They found that air samples

Anaerobic Digestion and Composting of SMS Page 5
from the windrows generally had higher odour intensities and were less pleasant than samples from the vessel. Hydrogen sulfide concentrations in the vessel SMS were as much as two orders of magnitude lower than concentrations found in the windrow SMS (Heinemann et al., 2003). Therefore, aeration was found to significantly reduce odours in terms of intensity and pleasantness. Garcia-Gomez et al. (2002) found that two types of rock dust (glacial silt and quartz dolerite), when added to SMS, increased indicators of microbial activity, resulting in increased temperature, protein, and oxygen requirements. Therefore, the addition of rock dust can enhance the composting rate of SMS. c) Horticulture - SMS, when blended with soil, has been shown to be an effective soil conditioner in landscaping. SMS can be used as mulch or as an alternative to peat, as a component of soil mixes and potting mix (Anonymous, 2005; Hardy et al., 2000). Obtaining SMS in the fall and winter allows it to weather, making it ready to use in a garden the following spring. Spring and summer are the best time to use weathered SMS as mulch (Beyer, 1999). When used as mulch, it is usually applied in a 5 cm thick layer but a 10 cm layer provides better weed control (Uzun, 2004). d) Turf Management - SMS is great to spread on newly seeded lawns. The material provides cover against birds eating the seeds and will hold water in the soil while the seeds germinate (Beyer, 1999). SMS has also been proposed for use on golf courses (Hardy et al., 2000). e) Land Reclamation - SMS is useful for the biological treatment (bio-remediation) of contaminated soils and for land reclamation (Garcia-Gomez et al., 2002; Zhang et al., 1995; Anonymous, 2005). SMS contains enzymes found to be effective in breaking down pollutants such as DDT and various chemical dyes (TCUHK, 2003). The potential utility of organic matter in SMS is enormous in the case of mine reclamation, especially if the mine site and mushroom farm are in close proximity (Hardy et al., 2000). Long distance transport of SMS is expensive because of its low bulk density and high moisture content, therefore a cost-benefit analysis is needed (Williams et al., 2001). The use of SMS has been quite effective in stabilizing severely disturbed soils, mitigating coal mine drainage, and even in wetlands for remediation of contaminated water. f) Control of Swine Behaviour - Beattie et al. (2001) examined the effect of spent mushroom compost on pig behaviour. There were three different treatments: T1 was a control barren pen, T2 had an empty horizontal rack suspended above the pigs’ heads, and T3 had mushroom compost on a horizontal rack suspended above the pigs’ heads. Pigs released particles of the compost from the rack by nosing a metal grid from below. The results showed that fewer pigs in T3 were involved in nosing, biting, and chewing pen mates. Also feed intake was lower and the feed conversion ratio was better than T1 (Beattie et al., 2001). This suggests that pigs redirect rooting behaviour towards pen mates and the feeder in the absence of any rooting substrate.

Anaerobic Digestion and Composting of SMS Page 6
g) Animal Feed - Zhang et al. (1995) studied a new way for effective utilization of SMS. They suggested that the fermented spent compost media is highly-nutritious fodder for poultry and animals. The lignin in the spent grain has been broken down by the mushrooms and can be digested by pigs and other animals (RN, 2000). To cut down on the cost of feed, they mix it with mushroom substrate, which helps to cut down at least 50 percent of their chicken feed (RN, 2000). SMS has also been used for earthworm production (vermiculture) because it is rich in protein and is highly nutritious (IBS, 2000). h) Fuel - SMS has been looked at as an energy source to meet the potentially high energy demands of a mushroom production facility. The primary factors that determine the suitability of the waste as a fuel are moisture, calorific value, and ash content. SMS contains about 60 to 77 % moisture, has a calorific value of 3.2 to 4.6 megajoules per kg, and an ash content of 6 to 13 % as received (Williams et al., 2001). On a dry ash-free basis, SMS has a calorific value equivalent to sewage sludge which has been successfully fired for many years (Williams et al., 2001). i) Anaerobic Digestion - Anaerobic digestion can reduce the bulk density of organic waste by converting it into a stable digestate similar to compost but in an oxygen-free environment (Hardy et al., 2000). The by-product is biogas which is composed of methane and carbon dioxide. The biogas can be used for energy generation directly or it can be used to generate steam. If a large mushroom farm produces 30 t of SMS per day (six t per day dry weight), this translates to a 1,000 cubic meter digester (Hardy et al., 2000). The production of gas and electricity from a digester depends on the efficiency of the digester. Estimates of efficiency range from 16 to 50 percent (Hardy et al., 2000). Determining the economic feasibility of building a digester would require further research on the amount of gas that would be produced from SMS. j) Land-filling and Incineration - SMS is presently regarded as an agricultural waste and hence does not require disposal as landfill or by incineration (Williams et al., 2001).
Storage of SMS The main environmental concern about the storage of SMS is the leaching of salts and other solutes during heavy rains. SMS should not be stored on saturated soils, in depressions that may accumulate water during rainstorms, in natural drainage ways, in locations subject to flooding, or where runoff will access waterways (CMGA, 2000). Environmental protection regulations in Pennsylvania, USA, state that SMS may be stacked up to 90 cm high in fields with a seasonal ground water table 50 cm below the surface. In addition, SMS storage areas must be located at least 30 m away from any body of water or

Anaerobic Digestion and Composting of SMS Page 7
public road, 100 m from any domestic well, and 300 m from any public water source (Uzun, 2004). Ontario (Canada) has regulations for the temporary storage of organic materials – including SMS piled in stacks in a field prior to eventual spreading. The regulations consider moisture and nutrient content of the material as well as site conditions in determining a maximum allowable storage period for a site (e.g. 60 days). One of the considerations is the distance to surface water (OMAFRA, 2005).
Experimental Procedure
All tests were carried out at the Ridgetown Campus of the University of Guelph, located in Ridgetown, Ontario, Canada. A compost system and an anaerobic digester were both available for testing.
Description of Test Facilities Part A – Composting – Since 1998, the Ridgetown campus has been carrying out composting trials – initially looking at using liquid swine manure as a main ingredient in various compost mixes. The composter is an in-vessel system consisting of three channels – each 15.2 m long, 2.2 m wide and 1.8 m deep. The walls separating the three channels are of reinforced concrete. The channels are covered (housed in a building), to give protection from the weather.
The mechanical turner is a prototype - the MARVEL, built by Global Earth Products. It is hydraulically operated, powered by a 15 kW electric motor driving a hydraulic pump. This powers a 15 kW hydraulic motor to operate the apron and also powers the hydraulic cylinders needed to lift the apron. A 2.25 kW electric motor drives a second hydraulic pump that powers four hydraulic motors operating the drive wheels.
The control panel includes a PLC controller to operate the turner. The turner travels down each channel on steel tracks and can be moved from one channel to the next at one end on a steel transfer cart. It can turn while running in both directions in the channels.
Each channel is equipped with an aeration system installed below the floor. One aeration fan is provided for each of the three channels. The fans are Airstream Inline Centrifugal Fans (Model # ILC-318, 2.25 kW electric). They are rated at 1650 L/sec at a static pressure of 100 mm. The fans force outside air through a transition plenum to two 250 mm PVC water pipes and then to the individual aeration floors. In each of these ducts is a pressure transducer (Omega Canada Inc., model PX154-025D1). These three devices are connected to the data-logger and record the static pressures.
The first channel (Channel 1) has four lengths of 100 mm PVC pipe buried in the concrete floor along with spigots (a 75 mm high cone attached to the pipe) spaced 30 cm apart having a 10 mm hole drilled in it, allowing air to jet up into the compost. The other two channels (Channels 2 and 3) have a concrete floor

Anaerobic Digestion and Composting of SMS Page 8
with a central poured concrete plenum 200 mm wide, 150 mm deep. This air plenum is covered with a metal plate with regularly spaced holes to allow air to enter the compost in the center of the channel. From earlier studies it was determined that the three channels performed similarly regardless of the different aeration systems.
Temperatures in the channel are measured using six thermocouples (shielded thermocouple cable type T 24-AWG), connected to a data-logger (Campbell Scientific CR10). There are also thermocouples set up to measure outside air temperatures and the temperature of air inside the building.
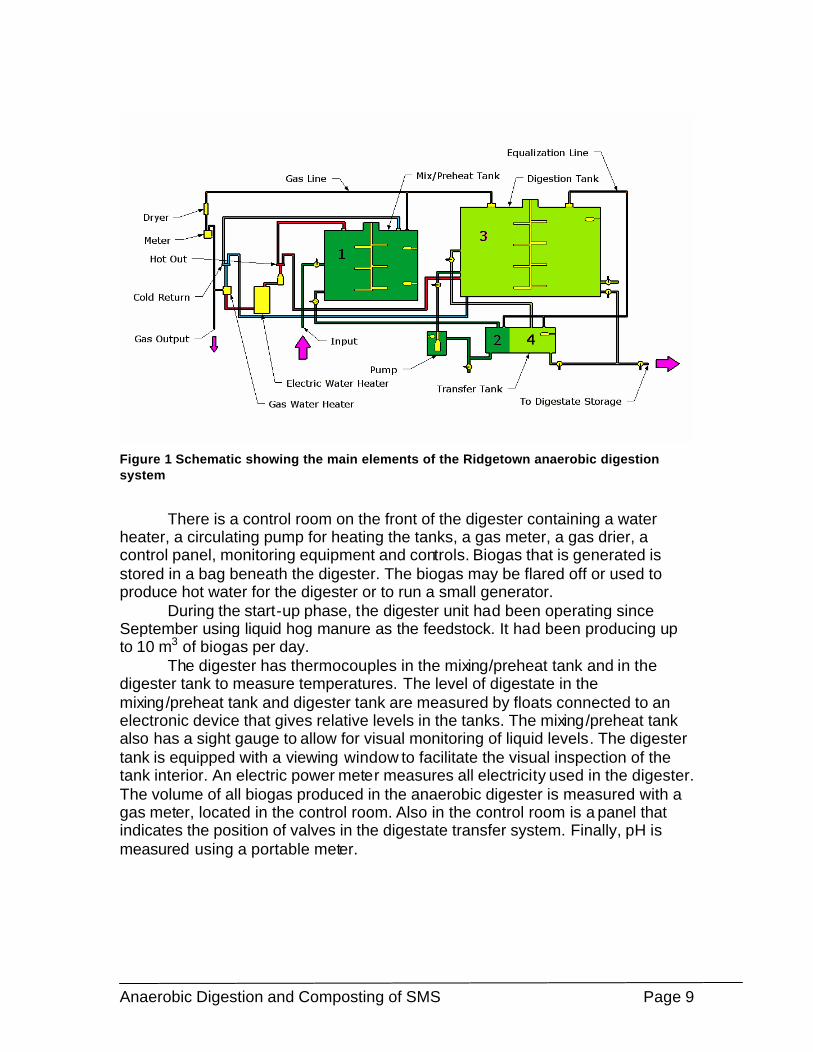
The data logger reads the temperatures and operates the aeration fans. A base level of aeration is maintained (3 minutes on in each hour) until any one of the six thermocouples in a channel exceeds 66oC. Then a second level of aeration is initiated - three minutes on for every 10 minutes, until the temperature drops below 60oC. The data logger also monitors time of the fan operation, static pressure as well as numerous other parameters. Unlike many commercial systems, this is operated as a batch system. This was chosen to allow the flexibility to experiment with turning frequencies, etc. and to develop the best recipe without having to regularly remove small amounts of “finished” compost. Part B – Anaerobic Digestion – The pilot scale unit was purchased in the summer of 2005 and was ready for the SMS trials by December. It is a trailer-mounted digester 2.6 m wide, 8.5 m long and 3.6 m high. The wheels and axles have been removed and it has been mounted on concrete supports. The digester is designed to operate in the mesophilic temperature range (around 37oC). It consists of two main tanks, both insulated and heated and all related piping, pumps, heating system and controls. A schematic of the system is shown in Figure 1. The first tank is a mixing/preheat tank, with a capacity of 3200 L. The main digestion tank (stainless steel) holds 7900 L. Each tank is cylindrical and has a mechanical mixer with several paddles that rotate based on preset times. Mixers are set to one hour cycles six times per day in the digester and three times per day in the mix tank.
The temperature of liquid in each tank is maintained using hot water. This water is heated in a water heater and circulated with a pump.
Normal operation involves adding a well-mixed liquid (target DM content of around six to 10%) to the mixing/preheat tank. If needed, extra liquid may be added in a nearby tank and the mixture stirred and pumped with a chopper pump. This tank is normally filled weekly. The liquid is temporarily stored in the mixing/preheat tank until it is added to the digester tank, at a rate of about 450 L per day (i.e. the normal rate of addition of fresh material). This addition of material is cycled manually and usually takes place only 5 days per week, so the average hydraulic retention time is in the range of 20 to 28 days. Once a new material is added, the system should reach a steady-state condition within a few weeks. As digestate is removed from the system it is directed to a nearby underground storage.
Anaerobic Digestion and Composting of SMS Page 9
Figure 1 Schematic showing the main elements of the Ridgetown anaerobic digestion system
There is a control room on the front of the digester containing a water
heater, a circulating pump for heating the tanks, a gas meter, a gas drier, a control panel, monitoring equipment and controls. Biogas that is generated is stored in a bag beneath the digester. The biogas may be flared off or used to produce hot water for the digester or to run a small generator.
During the start-up phase, the digester unit had been operating since September using liquid hog manure as the feedstock. It had been producing up to 10 m3 of biogas per day.
The digester has thermocouples in the mixing/preheat tank and in the digester tank to measure temperatures. The level of digestate in the mixing/preheat tank and digester tank are measured by floats connected to an electronic device that gives relative levels in the tanks. The mixing/preheat tank also has a sight gauge to allow for visual monitoring of liquid levels. The digester tank is equipped with a viewing window to facilitate the visual inspection of the tank interior. An electric power meter measures all electricity used in the digester. The volume of all biogas produced in the anaerobic digester is measured with a gas meter, located in the control room. Also in the control room is a panel that indicates the position of valves in the digestate transfer system. Finally, pH is measured using a portable meter.

Anaerobic Digestion and Composting of SMS Page 10
Description of Test Procedure The source of Spent Mushroom Substrate was Rol-Land Farms, a major Ontario mushroom producer, located nearby. The first step in the process involved meeting with Hank Vander Pol, Rol-Land Farms, and collecting samples of SMS for an initial nutrient analysis. This took place in the fall of 2005, and the source of sample was the Blenheim facility. Samples of leachate water were also collected, in case this liquid might be needed in either the composting or anaerobic digestion process. When the trials started, SMS was delivered to the site by Rol-Land Farms.
The compost channels were available for testing first, so the compost trial began in December, 2005. This was behind the initial projected schedule, mainly due to the length of time needed for some scheduled maintenance on the equipment.
The start of the anaerobic digester trials was delayed until January, 2006, to avoid the Christmas break period, when extensive monitoring would be more difficult to achieve. During the fall, several “bugs” were worked out of the system (normal start-up issues), the system of collecting and analyzing gas samples was worked out, a chopper pump was purchased, and several other steps were taken to allow for the collection of study data.
Part A – Composting – The study was run as a single batch using all three channels. On December 13, 2005, two truckloads of SMS were delivered to the Ridgetown test site and the composting trials began. The original plan was to test three different compost recipes, one per channel. The recipes were to be designed based on the nutrient content of the SMS and any other materials deemed appropriate to achieve the desired C:N ratio. Also, if liquid were needed to achieve the correct moisture level, it could be water or waste water (including the compost leachate , referred to as “goody water”) from the mushroom facility. Based on the earlier nutrient and moisture testing, we determined that the material needed no additions – it was ideal for composting “as is” (e.g. C:N ratio of 17 and moisture levels of 58%). The test procedure was therefore modified to compare turning frequency and its impact on how rapidly the SMS composted. During the trial, there was constant monitoring of the compost temperatures. Odour characteristics were assessed, and volume and mass reductions were measured. Samples were taken of the raw materials before composting and then at 4 week intervals. Monitoring was scheduled to continue for 12 weeks when the composting process was expected to be finished. The management of the system was designed to be somewhat flexible, as it was unknown what problems may arise and what odours may be created. The original concept was as follows:
• For at least 12 weeks, the SMS would remain in the in-vessel channels with aeration fans operating at the levels required based on the SMS temperatures.
• All channels would be turned when the SMS was first placed in the channels . From that point onward, Channel 1 would not be turned again,

Anaerobic Digestion and Composting of SMS Page 11
Channel 2 would be turned after 4 weeks and 8 weeks and Channel 3 would be turned on a weekly basis (when possible).
• SMS would be managed in all cases to maintain aerobic conditions in the compost. Increased odour levels would be used to indicate anaerobic conditions. If odour levels became high, aeration rates would be increased temporarily. In the event of unacceptably high odour levels, we were prepared to remove the material from the channels (and move further from the nearby residences).
• At the end of week 12, the compost would be moved to an outdoor storage to continue the curing process, if required.
• Monitoring would continue for up to 16 weeks (depending on the maturity level of the compost).
When the trial was run, the actual testing ran for 12 weeks. However,
compost remained in the channels until about 20 weeks after the start of the project. The initial volume in the composting vessel and volumes throughout the study period were measured to track the reduction in compost volume. Measurements were made of the mass and bulk density of the SMS – at the start of the study, partway through the study and again at the end of the study period. The volume and mass of the finished compost (in each channel) were measured at the completion of the study. Table 2 shows the relevant measurement dates. Table 2 – Summary of dates when volume and mass of compost were measured Date of Measurement Days after start Measurement December 13, 2005 0 Volume, mass and bulk density January 12, 2006 30 Volume and bulk density February 7, 2006 56 Volume and bulk density May 12, 15, 2006 150 final volume, mass and bulk density Temperatures were measured constantly during the in-vessel treatment (December 14, 2005 to March 15, 2006) using up to 6 thermocouples per channel, connected to the data logger. Ventilation rates, static pressure and times of fan operation were also recorded. The compost was also checked regularly using an analog compost temperature probe (to ensure the thermocouples were functioning properly). Odours were assessed subjectively during each visit to the compost building. The goal was to determine how offensive the process could be, and how effective composting might be at reducing or eliminating any odours. Odour assessment was based on intensity and character. The character descriptors were those used by the wastewater treatment industry. Sample Collection - Initially two samples of SMS and “goody water” were collected to determine if additional carbon or nitrogen had to be added for composting. When the study was initiated, seven nutrient samples were taken to get a representation of the nutrient content of the SMS. Throughout the study

Anaerobic Digestion and Composting of SMS Page 12
period, two representative composite samples were taken monthly from each channel. A record of sampling dates is given in Table 3. Table 3 – Record of sampling dates – Compost study Date of Sampling Days after start Material sampled November 11, 2005 preliminary SMS and “goody water” December 13, 2005 0 SMS January 10, 11, 2006 28 compost January 25, 2006 43 compost February 7, 2006 56 compost March 15, 2006 92 compost Samples were collected using sanitized equipment and placed in sterile plastic bags. They were then refrigerated to about 4oC for later delivery to the lab. The samples were collected by digging down 30 cm into the compost in 6 different locations and collecting grab samples. Samples to monitor pathogen numbers were collected from SMS samples over the study period and final composite samples were collected from each channel. These samples were refrigerated to about 4oC then delivered to the lab within 24 hours of collection, in a cooler chilled to about 4oC. Sample Analysis – As mentioned, samples for pathogen analysis were delivered within 24 hours of sampling to the Food Microbiology Lab, Laboratory Services Division, University of Guelph. Nutrient samples were stored in a refrigerator until delivery to the Laboratory Services Division, University of Guelph. All nutrient samples were tested for %N, %P, %K, NH4-N, NO3-N, % Total Carbon, % Organic Carbon, % Inorganic Carbon, %Ash, % Dry Matter, and pH. Pathogen samples were tested for Total Coliform and E. coli. The following is a brief description of the test procedures:
• Dry Matter - samples weighed wet, dried in 80oC oven for 24h, weighed dry, dry matter calculated. On-site measurements were made occasionally using a 100 gram sample, and drying in a microwave oven. The sample was placed in the microwave (set on high power) for 7 minutes initially and re-weighed. This was repeated for one or two minute cycles until the weight was stable.
• K - modified Kjeldahl digestion, digestate analyzed by atomic absorption • N - modified Kjeldahl digestion, digestate analyzed using colorimetric
method • NH4-N - KCl extraction, extract analyzed using colorimetric method • P - modified Kjeldahl digestion, digestate analyzed using colorimetric
analysis • pH - saturated paste method using pH electrode • NO3-N - KCl extraction, extract analyzed using colorimetric method • LOI (% Ash) - muffle furnace at 480o C, before and after weights taken • Total C, Inorganic C, Organic C - combustion method (Leco C analyzer) • Total Coliform and E. coli - Laboratory Services Division Method MID-104

Anaerobic Digestion and Composting of SMS Page 13
- Enumeration of Total Coliform and Escherichia coli using the Most Probable Number Method - Revision No. 1 (98/09/01). Samples were prepared using the procedures designed to measure E. coli in compost samples.
In addition to using the University of Guelph labs, several samples were
taken to A&L Canada Laboratories Inc., London, Ontario for compost testing, including heavy metals analysis and nutrients, maturity (CO2) and germination tests using cucumber. Part B – Anaerobic Digestion - The test ran from January 12 to March 31, 2006 (88 days). Because it takes several weeks to establish the desired bacterial colonies, only one recipe was tested. The recipe was designed based on the nutrient content of the SMS plus added water so that only the contribution of SMS to the biogas production would be evaluated. It was initially thought that the waste water from the mushroom facility supplying the SMS would be used for the moisture in the recipe but after receiving the results of the SMS nutrient analysis it was decided tap water was the best approach.
On January 12, 2006 we picked up 540 L of SMS from the Blenheim mushroom plant. The material was dark brown to black in colour and was stored in large stacks up to six m high. The odours on site were “rotten/offensive”, similar to odours from solid manure stored anaerobically.
On January 13, we started loading the digester with a blend of SMS and potable water. The mixture consisted of 180 L of SMS gradually added to 600 L of water - giving a final volume of 675 to 690 L. Only the volume of SMS added was measured – mass was not measured each time (the bulk density of fresh material averaged 505 kg/m3, so it was assumed that 90 kg of SMS was added each time). The SMS was mixed using a pump in a portable tank. The pump was a submersible shredder sewage pump (AMT 1 hp, 220 volt, model 5761-95) capable of handling 50 mm solids. This step was designed to raise the moisture level from around 70% (of the SMS) to about 94%. This moisture content was similar to the liquid hog manure tested earlier in the system. Therefore it was possible to compare the results using SMS to the gas production using hog manure. Several digester designs will handle material with a higher dry matter content. This moisture level was also considered the best compromise considering the limitations of the pumping equipment available. During mixing, the solids had a tendency to float. These were mixed in using a fork or shovel. The pump was run for about an hour to ensure all coarse material was chopped up.
Approximately 1350 L of the SMS/water blend was added to the mixing/preheat tank (i.e. two batches). The partially digested hog manure had been moved out of this tank and into the digester tank to make room for the SMS. Typically this volume of material was added to the system twice per week.
The SMS used on January 13 was sourced from the Blenheim operation. However, it appeared to be more “mature” than desired, having partially broken

Anaerobic Digestion and Composting of SMS Page 14
down in the temporary storage piles. The decision was made to source future supplies of fresh SMS from the Kingsville plant, which has fresh material almost daily.
Material was prepared and added to the mixing/preheat tank to ensure that the blend of SMS and water could be added to the digester tank at a rate of about 450 L per day, for five days a week (i.e. the target rate of addition of fresh material). During the study period, daily gas production in cubic metres was recorded, along with electrical power used, biogas pressure in the system, the temperature of the mix tank and the digester tank, as well as the heating system water pressure, pH of the SMS and water, mix tank and digester tank. Other operational notes were taken documenting how the digester was working and technical issues involved in operations. Samples of biogas, SMS and water, SMS, mix tank liquids, and digested SMS were collected throughout this time period. Sample Collection – Between December 2, 2005 and March 17, 2006, 50 biogas samples were collected. The initial samples were biogas generated from liquid hog manure (eight samples on December 2 and 6, 2005). The remaining 42 biogas samples were generated from anaerobically digested SMS. Samples were taken February 21, 22, 23, 24, 27, 28, March 1, 2, 3, 6, 15, 16 and 17, 2006.
The sampling procedure involved using a 20 mL syringe and a 3-way valve. Gas was drawn from the gas stream coming from a jet attached to the anaerobic digester and storage bag. The collected gas was then injected into a pre-evacuated sealed vial (10 mL). The vials were refrigerated until shipping to the lab.
First, the syringe was flushed with fresh air (at least three times) to ensure that the syringe contained no residual biogas. The 3-way valve has a tube that can be inserted into the gas jet to be sure no air contaminates the sample. Gas was drawn into the syringe and the needle was inserted into the pre-evacuated vial. The 3-way valve was rotated to allow the gas to enter the vial. Assuming the vacuum was intact in the vial, the syringe plunger would start to draw down and then the remainder of the gas was drawn into the vial. The syringe was left in the vial with the plunger held down for three to five seconds and then removed from the vial. The sample numbers were recorded, as well as the time and date of sampling and the presence (or absence) of a vacuum in the vial.
The following samples were collected for nutrient analysis: the fresh SMS, the SMS/water mixture before entry into the digester, liquid from the mix tank and the digested SMS. The samples of fresh SMS were collected when the SMS was first brought to the site. These were composite samples. A sample of the SMS/water mixture was collected in a 500 mL bottle from the agitation stream of the shredder pump. The samples were collected just prior to pumping the SMS into the digester, at the point when the solids should be in suspension. As the SMS was pumped, it

Anaerobic Digestion and Composting of SMS Page 15
was apparent that there were still a significant volume of solids that did not stay suspended so these samples do not completely reflect the solids content of the SMS pumped to the digester.
The Mixing/preheat tank samples were collected from a sampling valve near the bottom of the tank. With the solids that tended to precipitate from the SMS in the mix tank, this port became plugged on several occasions making it impossible to collect samples.
The anaerobically digested SMS samples collected from the digester tank were taken as the digestate was transferred out of the digester to the final storage. Samples were collected directly from the stream of digested SMS draining from the digester.
Samples for the bacteria analysis were taken from fresh SMS (solid) being added to the digester and from the anaerobically digested SMS collected directly from the stream of digested SMS draining from the digester. Samples were tested for Total Coliform (MPN) and E. Coli (MPN). Sample Analysis - The gas analysis was done using Gas Chromatography by Dr Mario Tenuta and Brad Sparling, Department of Soil Science, University of Manitoba. These tests included methane, carbon dioxide and nitrous oxide. Results were reported in parts per million (based on volume). The remainder of the samples were delivered to the Laboratory Services Division of the University of Guelph. All nutrient samples were tested for Total N, P, and K, NH4-N, NO3-N, Total Carbon, Organic Carbon, Inorganic Carbon, Ash, Dry Matter, E.C. and pH. Pathogen samples were tested for Total Coliform and E. coli. The test procedures are the same as those described earlier in the compost section.

Anaerobic Digestion and Composting of SMS Page 16
Results and Discussion – Part A: Composting
General Observations Composting measurements started on December 13, 2005, with the
delivery of two truckloads of spent mushroom substrate from the Kingsville operation of Rol-Land Farms. The material was weighed and evenly distributed among the three compost channels. A total of 72,670 kg of SMS was delivered and each channel received 24,223 kg (not weighed into each channel – divided based on equal volumes). The resulting volume in each channel was 48 m3, and the average depth was 1.5 m.
The SMS was brown to dark brown in colour, with visible straw. The odour was slightly offensive, with an organic smell, but not manure-like. The material in each channel was mechanically turned on December 14, to break up any dense areas and to help level out the channels. This was the only turning for Channel 1. Channel 2 was turned monthly and the material in Channel 3 was turned weekly. The exception was a 20-day period between Day 8 and Day 28, when no turning was done. See Table 4 for compost turning dates. All compost sat undisturbed in the channels from Feb. 8 until it was removed, starting May 10. Table 4 - Turning schedule for composting SMS (note: May 10 to 15, 2006 – compost removed from channels) Date of turning
Days after start
Channel 1
Channel 2
Channel3
Dec. 14, 2005 1 yes yes yes Dec. 15, 2005 2 yes Dec. 21, 2005 8 yes Jan. 10, 2006 28 yes yes Jan. 18, 2006 36 yes Jan. 24, 2006 42 yes Jan. 31, 2006 49 yes Feb. 8, 2006 57 yes yes
Physical Properties Temperature - Within a day of adding the SMS to the channels, the internal temperatures in the channels had risen to the range of 40 to 60oC. During the initial turning (one day after placing into the channels), the building filled with vapour. This is typical of an actively-composting material in winter – when warm moist air meets cold outside air. For the next few weeks, vapour was released in large quantities every time one of the aeration fans started running. Outside air

Anaerobic Digestion and Composting of SMS Page 17
temperatures hovered around the freezing mark throughout the study. Frost formed on the surface of the compost during the cold periods. Temperatures of the three channels and the ambient air are shown in Figure 2.
-20
-10
0
10
20
30
40
50
60
0 4 8 12 16 20 24 28 32 36 40 44 48 52 56 60 64 68 72 76 80 84 88
Days Elapsed
Tem
per
atu
re (
o C)
Channel 1 AvgChannel 2 AvgChannel 3 AvgOutside 1
Figure 2 Average temperatures of the compost over the study period (Ch1 no turning; Ch 2 monthly turning; Ch 3 weekly turning)
Generally, the temperatures followed the expected pattern: fairly high for
several weeks, then dropping off and gradually approaching ambient air temperatures. These temperatures are consistent with a material that contains a good deal of compostable organic material. This does not exhibit the temperature characteristics of “finished” compost, until nearly three months into the study.
The temperatures in Channel 1 remained the highest during the study period, presumably because this channel was never turned. Turning the material helps bulk it up so air can move through more easily and it mixes the material so the entire mass is exposed to the high temperatures. It can however, lower the temperatures, at least temporarily.
The temperatures represent averages of four to six thermocouples, but all were installed inside the compost mass. What they do not show is the fact that the surface material in Channel 1 was never exposed to the high temperatures, and therefore did not break down over time. With some compost (perhaps not an issue with SMS), there are concerns with pathogen or weed seed destruction, and this would not have happened on the surface of Channel 1, even though the core temperatures were high.
Anaerobic Digestion and Composting of SMS Page 18
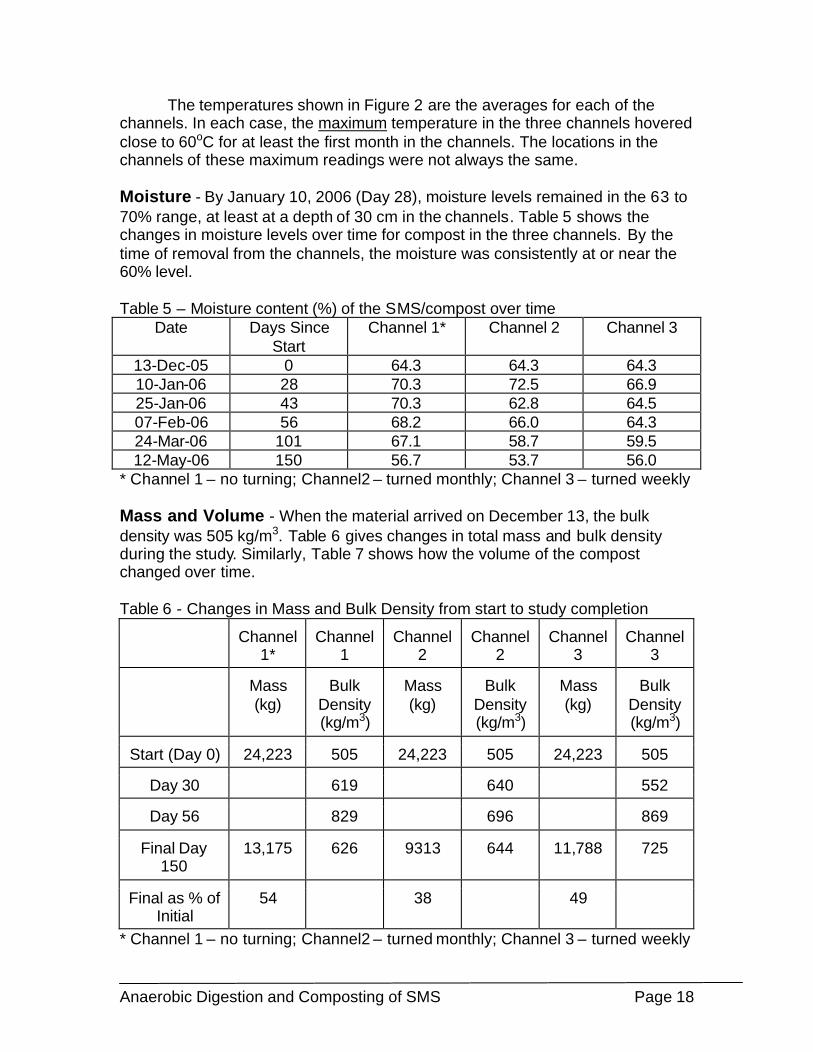
The temperatures shown in Figure 2 are the averages for each of the channels. In each case, the maximum temperature in the three channels hovered close to 60oC for at least the first month in the channels. The locations in the channels of these maximum readings were not always the same.
Moisture - By January 10, 2006 (Day 28), moisture levels remained in the 63 to 70% range, at least at a depth of 30 cm in the channels. Table 5 shows the changes in moisture levels over time for compost in the three channels. By the time of removal from the channels, the moisture was consistently at or near the 60% level. Table 5 – Moisture content (%) of the SMS/compost over time
Date Days Since Start
Channel 1* Channel 2 Channel 3
13-Dec-05 0 64.3 64.3 64.3 10-Jan-06 28 70.3 72.5 66.9 25-Jan-06 43 70.3 62.8 64.5 07-Feb-06 56 68.2 66.0 64.3 24-Mar-06 101 67.1 58.7 59.5 12-May-06 150 56.7 53.7 56.0
* Channel 1 – no turning; Channel2 – turned monthly; Channel 3 – turned weekly Mass and Volume - When the material arrived on December 13, the bulk density was 505 kg/m3. Table 6 gives changes in total mass and bulk density during the study. Similarly, Table 7 shows how the volume of the compost changed over time. Table 6 - Changes in Mass and Bulk Density from start to study completion
Channel 1*
Channel 1
Channel 2
Channel 2
Channel 3
Channel 3
Mass (kg)
Bulk Density (kg/m3)
Mass (kg)
Bulk Density (kg/m3)
Mass (kg)
Bulk Density (kg/m3)
Start (Day 0) 24,223 505 24,223 505 24,223 505
Day 30 619 640 552
Day 56 829 696 869
Final Day 150
13,175
626 9313
644 11,788
725
Final as % of Initial
54 38 49
* Channel 1 – no turning; Channel2 – turned monthly; Channel 3 – turned weekly

Anaerobic Digestion and Composting of SMS Page 19
Table 7 - Changes in Volume from start to study completion
Channel 1* Channel 2 Channel 3
Volume (m3) Volume (m3) Volume (m3)
Start (Day 0) 48 48 48
Day 30 28.32 23.80 26.83
Day 56 25.91 25.89 26.54
Final Day 150 21 14.5 16.27
Final as % of Initial 44 30 34 * Channel 1 – no turning; Channel2 – turned monthly; Channel 3 – turned weekly
Mass reductions were largely from the evaporation of water and the loss of carbon (i.e. as carbon dioxide). Figure 3 shows a breakdown of total weights of Dry Matter and Moisture in each channel and the change over the 150 total days of the study. In general, the material shrunk to between 30 and 44% of its initial volume. Some of this was a result of loss of moisture and carbon to the air. Some was due to a shrinking, as evidenced by the increase in density from the start to the end of the study. It is unclear why the measured bulk densities were so high on Day 56, though it is likely that it was over-compressed during measurement.
0
4000
8000
12000
16000
20000
24000
28000
Day 0Each
Day 150Ch 1
Day 150Ch 2
Day 150Ch 3
WaterDM
Figure 3 Total dry matter and moisture in each channel at start and at Day 150 of study
Using Channel 3 as a design guide, we would expect the volume to

Anaerobic Digestion and Composting of SMS Page 20
decrease by about 2/3, the bulk density to increase from about 505 to 725 kg/m3 and the mass to decrease to ½ of the initial mass. Appearance - The appearance of the compost changed over time. As mentioned earlier, the initial SMS was brown to dark brown in colour, with visible straw (see Figure 4). Over time, the straw broke down and disappeared and the material became darker. On Day 28, the colour was almost black. When Channels 2 and 3 were turned, the compost appeared to have a consistency similar to an organic soil. This was not the case on the surface of Channel 1, which had not been turned. The surface material had not been exposed to the high temperatures of the inside of the mass, and the straw had not broken down at all. By Day 57 (final turning date for Channels 2 and 3), the material appeared to be finished compost, especially in Channel 3. In colour and consistency, it appeared to be at least as good as the bagged compost available at the garden supply outlets. Finished compost is shown in Figure 5. The density of this material was high enough that the turner (underpowered for this material) was struggling to make its way down the channel.
Figure 4 Close -up view of "fresh" SMS
At this point, the measurement phase was considered to be complete, although the material was left in the channels for storage. It was removed between May 10 and 15, five months after it was placed in the channels. The compost in Channel 1 still had some material on the surface that looked like the original SMS, with visible straw. The compost in Channel 2 was earth-like except directly over the aeration system (central plenum) where the compost had dried out. The compost in Channel 3 was soil-like and granular. It appeared there would be no need to screen this product before bagging for sale – it could be marketed “as is”.

Anaerobic Digestion and Composting of SMS Page 21
Figure 5 Close -up view of composted SMS
Chemical Analysis
The original sampling was carried out on material from the Blenheim operation of Rol-Land Farms. However, SMS for the study was delivered from the Kingsville operation of Rol-Land Farms. It was originally assumed that this material would possess very similar properties, since the two facilities use the same compost recipe and are very similar operations . The materials were different however, likely related to the length of time material had been stored at Blenheim prior to sampling. The C:N ratio of the initial samples of SMS was 17, whereas the Kingsville material had a C:N ratio of 11.6, somewhat lower than expected. This did not appear to cause any composting problems, nor did it lead to any odour emissions during composting. Table 8 gives a summary of the main chemical constituents measured – for the initial SMS and for the compost in the three channels on Day 56.
Considering the fact that the appearance of the material changed dramatically over the period of time and there was such a quantity of heat and moisture given off, the concentrations of the parameters in Table 8 changed surprisingly little. Past experience has shown that composting helps concentrate nutrients, as the nutrients stay behind while moisture and carbon are lost. This table does not demonstrate that characteristic of composting.
Concentrations of P and N were higher than those reported (from literature) in Table 1. Levels of K and ash were similar to those in Table 1 (i.e. using ash = 100 - % Volatile Solids). Very little of the N was in the inorganic forms measured, suggesting that organic N represented most of the total N (similar to Table 1).

Anaerobic Digestion and Composting of SMS Page 22
Table 8 – Chemical characteristics of fresh SMS on Dec. 13, 2005 and compost from the three channels on Feb. 7, 2006 (Day 56) Units SMS Ch 1* Ch 2 Ch 3 NH4-N mg/kg (as is) 341 732 69.8 62 NO3-N mg/kg (as is) 14.1 71.3 116 128 Total N % (as is) 0.95 0.84 0.81 0.85 Total N % (DM basis) 2.66 2.65 2.38 2.38 Total P % (as is) 0.49 0.59 0.54 0.58 Total P % (DM basis) 1.37 1.86 1.59 1.62 Total K % (as is) 0.81 0.74 0.85 0.89 Total K % (DM basis) 2.28 2.32 2.51 2.50 pH pH units 6.5 7.8 7.3 7.4 Dry Matter % (“as is”) 35.7 31.8 34.0 35.7 Ash % (DM basis) 35.4 46.8 46.6 44.5 EC mS/cm 5.6 6.2 6.5 6.4 Total C % (DM basis) 30.7 28.1 28.4 29.1 Organic C % (DM basis) 29.7 26.4 26.5 27.5 C:N ratio 11.6 10.6 11.9 12.2 * Ch1 – no turning; Ch2 – turned monthly; Ch3 – turned weekly
One number that should remain constant as the batch composts is the ash content. It represents inorganic materials that will always be present, no matter what happens to the organic matter. For this reason, and because it is often difficult to weigh material at different stages of composting, the concentration of ash is sometimes used as a way to measure concentrations of other constituents. The concentration of ash (as a % of the total dry matter) will continually increase, as the organic matter disappears. Assuming that ash remains constant, the concentration can be used to calculate the total dry matter at different times – and this can be used to calculate the total mass of other constituents.
This Conservation of Ash approach was used to create Figures 6, 7, 8, 9 and 10. These graphs show the changes in the total mass of Dry Matter, N, P, K and C over the first 56 days of the study, when the most active composting was going on. The graphs demonstrate that the three channels performed similarly when considering these constituents. As expected, the total dry matter decreased in all three channels. The amount of N lost from each channel ranged from 25 to 32%, with the lowest loss from Channel 1, which was not mechanically turned during the study period. The amount of C was expected to drop, as organic C was lost in the form of CO2 gas. There is no opportunity to lose P and K, and these graphs, while not horizontal lines, are as close as one would expect to horizontal, given the sampling methods.

Anaerobic Digestion and Composting of SMS Page 23
0
2000
4000
6000
8000
10000
0 28 43 56
Ch1
Ch2
Ch3
Figure 6 Changes in mass of DM in each channel
(based on the assumption of Conservation of Ash)
0
40
80
120
160
200
240
0 28 43 56
Ch1
Ch2
Ch3
Figure 7 Changes in Total N in each channel
(based on the assumption of Conservation of Ash)

Anaerobic Digestion and Composting of SMS Page 24
0
20
40
60
80
100
120
140
0 28 43 56
Ch1
Ch2
Ch3
Figure 8 Changes in Total P in each channel
(based on the assumtion of Conservation of Ash)
0
40
80
120
160
200
0 28 43 56
Ch1
Ch2
Ch3
Figure 9 Changes in Total K in each channel
(based on the assumption of Conservation of Ash)

Anaerobic Digestion and Composting of SMS Page 25
0
400
800
1200
1600
2000
2400
2800
0 28 43 56
Ch1
Ch2
Ch3
Figure 10 Changes in Total C in each channel
(based on the assumption of Conservation of Ash)
Table 8 shows changes in the Electrical Conductivity (EC) of the compost
over the 56 days. This is a measure of the soluble salts present, and is of particular concern with SMS. Using Table 9 as a guide, it appears that all EC values are considered to be “High”. Seeds should not be placed directly into this material without diluting with other soils having a lower salt content. Recall that none of the material used in these trials had been exposed to any rainwater – which would have helped lower salt content by leaching it out (and perhaps causing other environmental concerns). Samples of compost were collected on March 15 for germination testing, using cucumber seeds. Also, a fresh sample of SMS (from Kingsville) was submitted for comparison. Germination results for Channels 1, 2 and 3 and the fresh SMS were: 86, 89, 97 and 97%, respectively. These relatively high values suggest that plant growth may be better than the EC test would indicate.
Samples collected on January 11 and March 15 were submitted for Compost Stability Index testing. This test measures the respiration of CO2-C, expressed as a percentage of both the total organic matter and also the total solids content of the compost. A Compost Stability Index value of 7 denotes compost that is “Well matured, aged compost, cured”. A value of 8 is interpreted as “Inactive, highly matured compost”. The sample from Channel 3 (turned weekly) collected on January 11 scored a 7, as did the SMS sample (collected December 13 and frozen until January 11). All other samples scored an 8. The only surprise was that the fresh SMS had such a high score, especially in light of the heat produced when it was initially added to the channels. It had undergone a considerable amount of composting activity, before arriving as SMS. However, it obviously still contained significant amounts of compostable material.

Anaerobic Digestion and Composting of SMS Page 26
Table 9 – Interpretation of Electrical Conductivity results Description EC
(mS/cm) Interpretation
Very low 0 - 0.75 May be used as a planting media directly, will require some nutrient addition for plant growth.
Acceptable 0.75 - 2 May be used directly as a media for small plants and seeding.
Medium 2 - 3.5 May be used for transplanting potted plants and mature plants with high nutrient demand. In application with tender plants may need to be diluted with 25 to 50% soil.
Medium high 3.5 - 5 Can be used for topdressing established plants or blending in as a soil amendment to gardens or soils 2-1 to 5-1.
High 5 - 10 Used as a soil amendment and will require diluting with existing soil depending on the use 4-1 up to 10-1 for more sensitive plantings.
Very High >10 Use only at low application rates in areas of plantings that do not have salt sensitivity.
The samples from March 15 (Day 92) were also submitted for an analysis
of heavy metal concentrations. There are Canadian Guidelines for metals contents in compost that is marketed as finished compost (CCME & AAFC, 1995). Table 10 gives the results of this testing for the three channels, compared to the values in the guidelines - the potential problem cells are shaded. Table 10 – Comparison of concentrations of heavy metals in compost at Day 92 with Canadian Guidelines for compost (CCME & AAFC, 1995) Metal Units DL* Ch1** Ch2 Ch3 Canadian
Guidelines Arsenic :g/g 1 1.29 BDL*** 1.59 13 Cadmium :g/g 1 BDL BDL BDL 3 Chromium :g/g 1 12.2 14.2 16.1 210 Cobalt :g/g 1 BDL 1 1.4 34 Copper :g/g 1 122.6 116.8 121.2 100 Lead :g/g 1 3.35 2.5 3.35 150 Mercury :g/g 0.1 0.14 0.12 0.13 0.8 Molybdenum :g/g 2 7.65 5.4 6.25 5 Nickel :g/g 1 8.3 6.8 7.3 62 Selenium :g/g 1 BDL BDL BDL 2 Zinc :g/g 1 285.6 290.5 285.7 500 * DL = Detection Limit ** BDL = below Detection Limit *** Ch1 – no turning; Ch2 – turned monthly; Ch3 – turned weekly

Anaerobic Digestion and Composting of SMS Page 27
The metals of concern are copper and molybdenum, where the compost concentrations are somewhat higher than the allowable concentrations. It may be possible to reduce these concentrations at the source, but it is more likely that the compost could be mixed with a material such as sand, to dilute these metals to acceptable levels (and bring down salt concentrations also).
Bacteria Analysis On March 15, 2006 (Day 92 of the study) , one composite sample from
each channel was collected for bacteria testing. In addition, five samples of fresh SMS were submitted for testing at the same time (note that these samples were new material freshly removed from the mushroom facility – no bacteria analysis was performed in December). Tests were run to determine Most Probable Numbers (MPN) of Total Coliform bacteria and E. coli. The geometric mean value (typically used for bacteria results) of Total Coliform for the fresh SMS was 2.14 x 10⁵ MPN. The corresponding value for E. coli was 3.56 x 10³ MPN. As expected, the numbers were lower for the composted SMS. The geometric means for the three samples were 1.39 x 10³ MPN for Total Coliform and 3.63 x 10² MPN for E. coli. It was somewhat surprising that the reduction in numbers was not greater, given the temperatures achieved and the duration of the heating period. However, not all parts of the compost mass were exposed to these high temperatures, especially in Channel 1, which was not turned. More samples should be taken to better document the survival (or re-establishment) of bacteria in the composting SMS.
Odour Analysis As mentioned earlier, when the material arrived (Day 0), it had an odour
that was deemed slightly offensive, with an organic smell, but not manure-like. The same odour was noted in the building on Day 1. On December 15, the turning of Channel 3 resulted in a strong organic odour – believed to be the result of anaerobic conditions in the channel. This odour was only evident when turning the compost and when the fans operated. To correct this problem, the aeration fans were turned on continuously for 2.25 hours to return the compost to an aerobic state. This cleared up the odours.
By December 16, compost odours had diminished to only slightly detectable. On December 19, odours in the compost building were only detectable when the fans operated and were slight and non-offensive. By the following day, no odours could be detected in the building. On January 10, 2006, there was a slight offensive odour detected when the fans turned on. It appeared that portions of the channels had once again become anaerobic. Once again, the fans were turned on, for four hours, to correct the problem. On January 11, the building was odour free. When digging into the compost, any odours detected were best described as “earthy”.

Anaerobic Digestion and Composting of SMS Page 28
General Discussion of Composting
Even though the composting SMS was left in the channels for 150 days, there would be no advantage to taking so long for this composting process to finish. Judging by the appearance of the compost, the material that was turned weekly (i.e. in Channel 3) could have been removed in three weeks or less. At this point, there was still biological activity ongoing, but there was likely no advantage to keeping the compost in the channel. For example, it could have been stacked somewhere to finish the curing process over the following few weeks. This is consistent with previous experience composting livestock manure at this site – where material has successfully been removed from the channels at the two-week stage, with no further odour concerns. SMS has been successfully composted in Ontario in windrows (in a commercial operation), then cured with limited turning. This material was ready for bagging in four to six weeks. Part of the success in this approach relies on keeping good control of moisture levels and stack height so that aerobic conditions are maintained.
Certainly by the four -week period at the latest, the compost had an appearance similar to an organic soil – it was black, granular, with a desirable structure and moisture level. The material inside the mass of Channel 1 also had this appearance, but the surface material (which had never been mixed in) looked very similar to the fresh SMS. Based strictly on appearance, the desirable strategy would be to turn the SMS regularly (e.g. once a week or more often), to ensure good mixing and uniform breakdown of organic matter.
The biggest issues with the finished compost relate to salt and metal levels. The nutrient tests showed relatively high salt levels - at levels which would not support the germination of seeds without mixing with other soils. The germination tests were in conflict with these results. Cucumber seeds had relatively high germination levels. The metals that exceeded Canadian standards were copper and molybdenum. This could be resolved by mixing with other materials or, possibly, by working with the inputs to reduce levels at the front end.
For the setup at Ridgetown, labour inputs were fairly low. Most of the labour with this system is in the moving of material in and out of the channels. Much of the rest of the process can be automated.

Anaerobic Digestion and Composting of SMS Page 29
Results and Discussion – Part B: Anaerobic Digestion
General Observations
The requirement to mix the SMS with water was somewhat cumbersome. This step required that a chopper pump be used for long periods of mixing. During the transfer into the digester, a shovel was used to manually move the settled solids.
Between January 12 and February 15, 2006, the time that the digester was being loaded with SMS and water, there were numerous technical issues that had to be addressed. These were mostly in the nature of improving the design of the digester to better deal with winter weather - frozen equipment and hoses. Because of freezing conditions and some of these technical problems, it was not always possible to transfer SMS when desired. Gas production averaged about 1 m3 per day during this time period.
Digester Performance As mentioned earlier, the loading of the digester did not proceed as
smoothly as planned, mainly due to problems related to the freezing weather conditions. However, the mixture of SMS and water was added to the system at regular intervals and gas was produced. Figure 11 shows the cumulative loading of the system. The rate of loading remained relatively even from start to finish, although the loading rate for the first third of the study was somewhat higher than during the second two thirds.
Temperatures - Daily notes were taken of how the digester was operating throughout the study period. Temperature profiles are shown in Figure 12. The preheat tank maintained temperatures between 30 and 35oC for almost the entire study. The mean preheat tank temperature was 32.7oC. More important, the main digester tank temperature averaged 38.0oC and stayed between 35 and 40oC for almost the entire study (the lowest temperature was 33oC). There was no evidence to suggest that the variations in temperature caused any decrease in performance of the system. Gas Production – A record of gas production is shown in Figure 13. This represents the cumulative production of biogas between Jan. 12 and March 31, 2006. During this 78 day period, biogas production totalled 77 m3, representing an average production of 0.99 m3/day. However, the production was higher during the first four weeks than later in the study. This could represent the gas produced by the residual swine manure in the system. The swine manure was gradually phased out as the SMS was introduced. Assuming that the period

Anaerobic Digestion and Composting of SMS Page 30
between Feb. 10 and March 31 represents a steady-state condition where only SMS and water are present in the system, the gas production from the SMS averaged 0.720 m3/day.
0
2000
4000
6000
8000
10000
12000
14000
16000
18000
1 8 14 21 28 34 41 48 55 64 74
Figure 11 Cumulative loading (L) of the anaerobic digester with the SMS/water mixture
0
5
10
15
20
25
30
35
40
45
1 7 12 18 22 28 33 39 43 49 55 63 69 77
Mix/preheattankDigestertank
Figure 12 Digester temperatures during study period (Jan. 12 to Mar 31, 2006)

Anaerobic Digestion and Composting of SMS Page 31
0
10
20
30
40
50
60
70
80
1 8 14 21 28 34 41 48 55 64 74
Figure 13 Cumulative biogas production (m3)
Another explanation for the difference in gas production is the difference in
loading rate, alluded to earlier. Overall, 18,950 L of the SMS/water mix were added to the system, at an average rate of 252.7 L/day. The average hydraulic retention time (HRT) was 31.3 days, longer than planned. However, during the first 28 days, the average rate of liquid addition was 299 L/day (HRT = 26.4 days). During the remaining 50 days, liquid additions averaged 212 L/day (HRT = 37.4 days). The longer the material remains in the system, the closer we can get to the theoretical maximum amount of biogas available. However, there are logistical considerations. Most systems opt for a compromise between capturing the most biogas and keeping costs in line – choosing systems that give the optimum recovery of gas. These often have retention times of 20 to 25 days.
During anaerobic digestion, it is the volatile solids that are broken down by bacteria to produce biogas. The SMS contained 65.4% (DM basis) Organic Matter – or Volatile Solids – see Table 11. Another way of expressing this is that for the period of interest between Feb. 10 and March 31, the loading rate of VS was 6.7 kg/day.
Not all biogas is created equal. It is the methane portion that has the greatest value as an energy source, and the methane concentration of biogas (e.g. for livestock manure) is often in the range of 60 to 65% of total volume. This number varies based on the properties of the raw material, but the higher the percentage the better. As mentioned earlier, 50 biogas samples were collected, including eight samples from digested liquid hog manure (i.e. before SMS was
Anaerobic Digestion and Composting of SMS Page 32
added to the digester). Unfortunately, 11 vials did not appear to have a vacuum when the samples were taken. Of these, six were for the digested liquid hog manure. The remaining two vials of biogas from the liquid hog manure had values that were deemed to be out of range, so they could not be used. For the 36 samples of biogas for the SMS project, the average concentration of carbon dioxide was 48.0% (range from 44.2 to 51.1%). For methane, the average concentration was 49.3% (range from 47.6 to 50.6%). Only trace amounts of nitrous oxide were measured and no other gases were analyzed.
These concentrations of methane were low but not surprising considering the nature of the input material. The average biogas production from February 10 to March 31 was 0.720 m3/day. Therefore, the average production of methane was 355 L/day. If the loading rate of VS was 6.7 kg/day, then the SMS yielded only 53.0 L CH4/kg VS. To put this into perspective, it is useful to look at methane yields for livestock manure. A number of researchers have reported yields of between 288 and 562 L CH4/kg VS, depending on whether the manure was from swine, dairy, poultry or beef (e.g. Fulhage et al., 1993; Barker, 2001).
The relevant performance of the Ridgetown unit using hog manure is not available because of the gas sampling problems. However, if we assume the biogas produced using hog manure contained 60% methane (a reasonable assumption based on the literature), the methane yield in November, 2005 was 410 L CH4/kg VS. This is within the range of reported values for swine manure. It seems safe to conclude that the methane production for SMS is less than 20% of what might be achieved for fresh livestock manure.
The most common options for using the gas are to burn it, producing heat, or to fuel an engine which powers a generator. This latter option results in electrical power plus heat from the engine. Pure methane has a theoretical heat value of 10 kWh/m3. However, heat boilers are 80 to 90% thermally efficient. Based on 355 L/day of methane, a heat boiler might produce 3.0 kWh of heat energy per day. Similarly an engine (e.g. 20% efficient at producing electricity and 40% thermally efficient) might recover 2.1 kWh/day (as electricity and heat). Of course, these numbers would be scaled up for much larger operations. One must also consider that the methane content of the gas is likely too low for some engines, and that hydrogen sulfide may need to be scrubbed from the gas to improve engine life.
Chemical Analysis
Results of the chemical analysis of liquid and solid samples are shown in Table 11. The concentration of Volatile Solids has already been discussed. One characteristic of anaerobic digestion that must be considered by those using the digestate is that the form of N changes. The percent of organic N drops and the inorganic N increases. In the fresh samples of SMS, 4.4% of the total N was in the form of NH4. However, in the digestate, this had risen to 68%. This represents a more readily available form of N when used for crop production.

Anaerobic Digestion and Composting of SMS Page 33
During digestion, the pH increases, as shown in Table 11. Most other parameters should not change appreciably, at least theoretically. Any changes shown in the table are likely at least partly due to sample variability and the difficulties in collecting truly homogeneous samples, especially of the initial mixture of water and SMS (as noted below the table). Table 11 Chemical characteristics of fresh SMS and digestate leaving the anaerobic digester Parameter Units Fresh SMS SMS + Water* Digestate NH4-N % (as is) 0.041 0.006 0.160 NH4-N % (DM basis) 0.114 0.309 10.1 Total N % (as is) 0.95 0.07 0.23 Total N % (DM basis) 2.61 2.70 14.7 Total P % (as is) 0.51 0.04 0.04 Total P % (DM basis) 1.41 1.41 2.53 Total K % (as is) 0.80 0.07 0.17 Total K % (DM basis) 2.21 3.74 11.0 pH pH units 6.6 7.2 8.3 Dry Matter % (as is) 36.4 2.72 1.63 Ash % (DM basis) 34.6 29.7 42.7 O.M. (VS) % (DM basis) 65.4 70.3 57.3 E.C. mS/cm 5.6 1.29 5.6 Total C % (DM basis) 31.4 34.1 31.4 C:N ratio 12.1 13.79 2.21 Sample Size number 12 8 10 * due to rapid settling of solids, it was very difficult to retrieve a representative sample from the freshly mixed SMS and water
Electricity Needs
The electricity needed to run the study is reported in Figure 14. The demand was fairly steady throughout the time period. The main users of power were the water heater (needed to maintain tank temperatures) and the agitators. During the period from February 10 and March 31, electrical inputs averaged 89.8 kWh/day. It is likely that the electrical efficiency of the test setup could be improved by adding more insulation to the tanks and by converting to a gas water heater. However, the fact remains that the system generated methane having an energy value of about 2.1 kWh/day, while using 89.8 kWh/day. This fact should be enough to discourage anyone from considering this treatment option if the main benefit is recovery of energy.

Anaerobic Digestion and Composting of SMS Page 34
0
1000
2000
3000
4000
5000
6000
7000
1 8 14 21 28 34 41 48 55 64 74
Figure 14 Cumulative electrical power used by the digestion system during the study
Bacteria Analysis
On five different days between March 3 and March 17, 2006, samples of digestate were collected and analyzed to determine bacteria populations. These results were compared with the results from five samples of fresh SMS. Tests were run to determine Most Probable Numbers (MPN) of Total Coliform bacteria and E. coli. The geometric mean value of Total Coliform for the fresh SMS was 2.14 x 10⁵ MPN. The corresponding value for E. coli was 3.56 x 10³ MPN. These values were reported in the compost discussion earlier. For the digestate, the geometric means were both 27 MPN (i.e. for Total Coliform and for E. coli). This represents a considerable reduction in bacteria numbers, as expected. The digestate included two samples that tested below the lower detection limit (LDL). Where this occurred, a value of ½ the LDL was inserted to perform the calculations.
Odour Analysis The digestion process is largely confined with no gas allowed to escape. The fresh SMS had an organic, slightly offensive odour, but did not smell like untreated livestock manure. The biogas had a “hydrogen sulphide” smell that could be detected if gas was released. The flared biogas also had a hydrogen sulphide odour though it was not as intense. The greatest potential for odours from this system appears to be from the fresh SMS. These should be minimized as long as the SMS is used shortly after being removed from the mushroom plant.

Anaerobic Digestion and Composting of SMS Page 35
Explanation of Digester Design Issues This was the first winter the digester was in operation and valuable
lessons were learned in dealing with cold and windy weather conditions. The problems took time and effort to address and caused frustration.
An attempt to load the digester quickly was hampered by freezing temperatures. Occasionally, hoses, pumps and floats froze. On January 23, a power failure resulted in some of the hot water heating system freezing and a decline in the digester and mix tank temperatures. Power was lost again on February 7, when a main panel fuse blew. Adjustments in timing of functions were made and some re-wiring was done. With colder weather again in March, some transfer pipes froze. This delayed the addition of SMS to the digester. On March 13, the transfer hoses froze once again. From March 13 to 31 all equipment operated as it should. In general, other than the scheduling of loading the digester, the listed problems did not appreciably lower the efficiency of the digester.
General Discussion of Anaerobic Digestion
This portion of the study showed that Spent Mushroom Substrate can be successfully digested using a mesophilic digester. The biogas yield was far below that which would be considered feasible. Anaerobic digestion is a process that requires energy inputs. Unfortunately, the energy inputs far exceeded the energy outputs (i.e. using methane gas as a fuel).
Anaerobic digestion was quite effective in reducing the levels of the indicator bacteria measured. This would be expected to translate into similar reductions in the levels of any pathogens present in the mix. Also, anaerobic digestion of SMS was effective in controlling odours. Odours emissions were minimal, and were only present in the raw materials (i.e. before entering the digester).
The digester had a number of technical issues, largely due to cold winter temperatures. These had nothing to do with the technology itself, but were simply design issues on a new piece of equipment. They serve to point out the challenges of using this technology in cold climates.
There has been very little mention of the digestate. This liquid contains nearly all of the nutrients that entered the digester. As such, it represents a liquid that should be land-applied – and will be governed by the regulations in Ontario’s Nutrient Management Act. There is a large volume of liquid that will require storage before land application, and trucking costs will be higher than for the original SMS due to the large amount of water that is needed. This consideration alone would be enough to discourage most producers from considering the treatment technology.
More water was added during this study than would theoretically be necessary. Part of this was to accommodate the equipment at hand and part was to err on the side of caution – extra water was not expected to hurt the process

Anaerobic Digestion and Composting of SMS Page 36
during this test phase. Reducing the volume of water would reduce the heat needed, would raise the throughput (and resulting gas production) and would reduce the volume of liquid digestate that must be stored and spread. It may however require several design changes to handle the thicker material. While most digesters are designed as liquid systems, there are anaerobic digesters designed to handle materials with lower moisture contents (e.g. source separated municipal organic waste). Perhaps these should be considered, though the gas output values will not improve.
A summary of the main results from the Ridgetown study is given in Table 12. This also shows the corresponding performance data for a larger operation – perhaps useful for design purposes. The scale -up numbers are based on a unit input of 1000 kg of fresh SMS. In other words, for every one tonne of SMS added to the digester daily, the useable energy produced will be in the order of 75 kWh.
Table 12 Summary of Ridgetown results and potential scale-up design numbers Quantity Units Ridgetown
results Scale-up
SMS loading rate kg/day 28 1000 SMS loading rate m3/day 0.055 1.96 VS loading rate kg/day 6.7 239 liquid loading rate m3/day 0.212 7.57 biogas yield m3/day 0.72 25.7 methane yield m3/day 0.355 12.7 approx useable energy* kWh/day 2.1 75 * based on electricity production at 20% efficiency and heat recovery at 40% efficiency
Economic Analysis
An analysis of the economics of either composting or using anaerobic digestion must first consider the current systems of handling SMS. Presently, plants (at least in Ontario) can produce in the range of a few hundred tonnes to over 1500 tonnes of SMS per week. This is often either sold or given to local farmers and landscapers. The material represents an excellent source of nutrients and organic matter, whether used in crop production or landscaping. Most SMS is distributed as partially finished compost, while a small amount is currently composted in windrows and sold in bags as “mushroom” compost for homeowners and landscapers.
Based on the results of this study, there appeared to be no advantage in considering anaerobic digestion of SMS as a treatment option. It required considerably more energy inputs than were recovered from the SMS. Also, assuming a liquid system of digestion, the storage and handling of the liquid digestate would likely be a greater challenge than the current situation. The

Anaerobic Digestion and Composting of SMS Page 37
following economic discussion, therefore, will focus only on composting as a viable treatment option. Assumptions - A number of assumptions were made in the economic analysis of the feasibility of composting SMS. Following is a list and discussion of these assumptions:
• The three most representative SMS production sizes to consider are 500 t/week, 1000 t/week and 1500 t/week (Vander Pol, 2006).
• The size of the composting operation is based on using a covered, in-vessel system for two weeks, followed by two further weeks of curing in static piles or in windrows. The receiving and curing/processing areas would also be under cover.
• The compost in the channels would be turned every two or three days to ensure the most rapid composting and good mixing. Channels would include a forced aeration system.
• In vessel composting sizes are based on a standard channel having a width of 3.7 m, height of 2 m, and length of 100 m (Smith, 2006).
• Final compost production is based on the final mass of compost being 40% of the initial mass of SMS. While this study averaged slightly higher than this, we felt it was prudent to err on the conservative side with this figure. It is possible this number will be 50% in some situations, which will result in more compost to market.
• All of the revenue estimates are based on wholesale f.o.b. the farm for bulk finished compost. Established Ontario values are used for three levels of compost quality. High quality compost sold wholesale in bulk has been valued at $60/t f.o.b. the compost plant. Medium quality compost is valued at $40/t and lower quality compost is valued at $30/t (Gingerich, 2006).
• The initial capital cost of the compost system starts at an estimated $1,752,000. Capital costs for each size of operation include site preparation, composting structures (Cover-All buildings), SMS storage and curing compost storage (Cover-All buildings), aeration fans and ducts, temperature monitoring, leachate collection, electrical installation, other materials, compost turner(s), belt conveyors to move compost within the facility, tractor(s), platform truck scales, office equipment and engineering costs (Smith, 2006).
• Depreciation and other operating costs are based on estimates from Global Earth Systems (Smith, 2006). These costs cover capital repayment of the structures and equipment, interest rates of 7% over seven years (payback period), fuel and equipment maintenance, and labour and management costs.
Results of the economic analysis are shown in Table 13. Based on the
bulk wholesale pricing for composted SMS as a premium quality compost, it appears that potential gross income will exceed the cost of operation and capital

Anaerobic Digestion and Composting of SMS Page 38
costs for a mushroom plant selling compost at $60/t using a seven-year payback for all plant sizes. The difference in profitability for the different selling prices points out the importance of market development and market research. It will be critical to brand the product as superior to other composts to realize these revenues. It appears that composting can be an economically feasible alternative method of handling Spent Mushroom Substrate. This economic study is not in-depth, so more work is needed to establish actual costs and revenue potential for a specific operation. Market development and market research is vital to ensure that the estimated value of the composted SMS can be realized. Of course, there is the potential to oversupply the marketplace, even if it is high quality compost. Table 13 Comparison of costs and revenue for various composting scenarios
SMS Produced (t/week)
Capital Costs - Building and Equipment*
Yearly Operating
Costs**
Compost Produced
(t/yr)***
Selling Price ($/t)
Total Yearly
Revenue
500 $1,752,000 $468,000 10,400 $30.00 $312,000
500 $1,752,000 $468,000 10,400 $40.00 $416,000
500 $1,752,000 $468,000 10,400 $60.00 $624,000
750 $2,628,000 $702,000 15,600 $30.00 $468,000
750 $2,628,000 $702,000 15,600 $40.00 $624,000
750 $2,628,000 $702,000 15,600 $60.00 $936,000
1500 $5,256,000 $1,404,000 31,200 $30.00 $936,000
1500 $5,256,000 $1,404,000 31,200 $40.00 $1,248,000
1500 $5,256,000 $1,404,000 31,200 $60.00 $1,872,000 * Based on 6 compost channels (each @ 100 m long) for 500 t weekly production of SMS, 9 channels for 750 t/week and 18 channels for 1500 t/week ** Based on a 7 -year payback/depreciation for capital costs – also includes labour and depreciation *** Assumes final mass of compost is 40% of initial mass of SMS Other considerations – There are several other items that must be considered in establishing the feasibility of composting at a particular site. Following is a brief listing:
• In some cases it may be practical to have a bagging operation on site to add more value to the product or supply a niche market. An estimated value of bagged high quality compost is $3.50 per 15 kg bag, f.o.b. the farm. This value must cover the extra costs of the bag, bagging, branding

Anaerobic Digestion and Composting of SMS Page 39
(product name), and extra labour. There are always additional costs in developing a product and marketing it. Some large operations may be able to develop their own product brand.
• Further enhancing the compost through granulation or prilling may also increase its value.
• No attempt was made to assess other composting options. Windrow composting is another option. It requires more land and there should be a system in place to catch (and handle) leachate resulting from precipitation. A pull-type windrow turner will cost an estimated $35,000.00 (may need more than one) and a tractor (at least 150 hp) with a creeper gear is required. Composting using this method may be limited to certain times of year, when the weather permits.
• No value was given to the SMS (net cost to composting) entering the composter. Of greater importance, however, no consideration was given to the existing value or cost of how SMS is presently handled. There are substantial costs and liabilities involved with handling the SMS through stockpiling, trucking and selling or giving the product away. Trucks are needed to move the SMS, and large equipment is needed to stack and move it on site. If it is used on farmland owned by the mushroom plant, there are costs in field application. There may even be land purchase or rental costs if the amount of SMS that is available exceeds the land base allowed under the Nutrient Management Plan for the site. It is likely that the practicality and economics of composting will be more suited to mushroom plants that have no land base, as their current disposal costs are likely higher.
• One of the limitations of this analysis is that the true value of composted SMS has only been tested in the marketplace on a small scale. In the event that large amounts of composted SMS are put into the marketplace, prices may drop. It may be difficult to find a market for all of the SMS if it were composted. This market is still developing and there may be niche market opportunities, with specialized blends that serve specific needs such as golf courses, organic crops, specialty crops, public land and landscaping.
Summary
Results of this study confirm that both composting and anaerobic digestion can be used to further break down the organic matter in Spent Mushroom Substrate (SMS). For composting, the SMS was added as-is to the channels of a covered in-vessel system having mechanical turning and forced aeration. The composting process resulted in finished compost having an excellent feel and appearance. It contained salt levels high enough to potentially limit the range of applications.

Anaerobic Digestion and Composting of SMS Page 40
Anaerobic digestion was carried out by first mixing the SMS with tap water to create a slurry. The resulting biogas had a methane content of close to 50% (i.e. lower than desired).
Specific findings of the study: • Composting proceeded for several months and chemical changes
continued for most of the time. Heating occurred for more than two months, though the material resembled finished compost in about one month. Based on the final appearance of the compost, a marketable product could be removed from the system in as little as four weeks.
• Based on the final appearance of the compost, turning at least weekly was better than not turning at all or turning on a monthly basis. Weekly turning ensured a homogeneous end product with no sign of the straw present in the other channels.
• The mass of compost was measured at 150 days after the start of composting – some time after the compost process was believed to be complete. At that time, the final mass was 38 to 54% of the original, depending on the channel. A design value in the range of 40 to 50% appears reasonable.
• The C:N ratios of the SMS and finished compost were in the range of 10.6 to 12.2 – these somewhat low values (ideal might be between 20 and 25) did not appear to pose any practical problems.
• Based on a “Conservation of Ash” approach, levels of dry matter, N and C dropped as the composting proceeded while P and K remained relatively constant. The drop in levels of DM, N and C were similar in each of the three channels, regardless of turning frequency.
• The electrical conductivity (EC) of the compost in Channel 3 (assumed to be representative of the recommended management system) was 6.4 mS/cm. The EC of the fresh SMS was 5.6 mS/cm. Values between five and 10 are considered to be “High” and should be diluted if used as a soil amendment, depending on the sensitivity of the plantings. The germination test performed on the compost yielded a value of 97% for Channel 3 (using cucumber seeds). The lowest value received was 86%. The relatively high germination percentages do not appear to support the EC results.
• Finished compost samples contained levels of copper in the range 117 to 123 :g/g, which exceeded the Canadian compost guideline of 100 :g/g. Molybdenum levels in the range 5.4 to 7.65 :g/g were also higher than the standard of 5.0 :g/g. Other metals were well within current guidelines.
• Both composting and anaerobic digestion were effective at reducing or eliminating odours and at greatly reducing numbers of indicator bacteria.
• In the original SMS, 65.4% of the dry matter was in the form of volatile solids (VS). During the final 50 days of the study, once it was believed that a steady state had been achieved, the digester was loaded at an average rate of 6.7 kg/day of VS.
• The biogas production (steady state period) averaged 0.72 m3/day, and methane represented 49.3% of the total gas yield.

Anaerobic Digestion and Composting of SMS Page 41
• The methane yield from the steady state system averaged 53 L CH4/kg VS. This value is considerably less that what would be expected if livestock manure were the digested material (i.e. between 288 and 562 L CH4/kg VS, depending on manure type). Testing using hog manure in the same digester during the fall of 2005 yielded approximately 410 L CH4/kg VS.
• Based on recovering 20% of the theoretical energy yield from methane in the production of electricity and a further 40% in the recovery of heat energy, the SMS biogas production was equivalent to 2.1 kWh/day. Unfortunately, electrical energy inputs to the system (for heating and agitation) averaged 90 kWh/day. Recovering energy from SMS in the form of methane using an anaerobic digester does not appear to be practical, since the energy inputs are so much higher than the outputs.
An economic analysis was performed to assess the feasibility of
composting SMS to recover further value. The anaerobic digestion option was not considered, due to the poor energy picture. Only a covered in-vessel system was considered, complete with mechanical turning and forced aeration. Whether or not composting can pay for itself depends on two main factors:
a) The value received from sales of compost is critical. If bulk compost can be sold as a premium product for $60/t (it is currently possible), then the venture can be profitable at various sizes of operation. If the selling price is $30/t, the annual cost of production will exceed the annual revenues, based on the assumptions used.
b) The current cost of disposal/sale/use of SMS. For some operations the total cost to dispose of SMS may be high, while for others it may represent an income stream. If it takes a considerable amount of infrastructure and labour to handle SMS, this needs to be considered in the analysis. Some operations use the SMS for crop production on their own land base, and others are able to sell the SMS. This will have a huge impact on the feasibility of composting.
Acknowledgements
This study was made possible thanks to financial support from the Canadian Mushroom Growers Association. The Ontario Ministry of Agriculture, Food and Rural Affairs, through its partnership with the University of Guelph, provided the facilities and a portion of the personnel cost. Geoffrey Van Heeswijk provided invaluable technical assistance during the running of the study. Finally a special thanks goes out to Hank Vander Pol and Rol-Land Farms for supplying the SMS and for assisting in so many other ways with the project.

Anaerobic Digestion and Composting of SMS Page 42
References Anonymous. 2005. Spent Mushroom Substrate. Retrieved from
<http://www.mushroom-sms.com> on May 10, 2006. Barker, J.C. 2001. Methane Fuel Gas from Livestock Wastes: A Summary.
Publication No. EBAE 071-80, North Carolina Cooperative Extension Service.
Beattie, V.E., Sneddon, I.A., Walker, N., and Weatherup, R.N. 2001.
Environmental Enrichment of Intensive Pig Housing Using Spent Mushroom Compost. Animal Science, 72:35-42.
Beyer, D.M. 1999. Spent Mushroom Substrate Fact Sheet. Retrieved from
<http://mushroomspawn.cas.psu.edu/Spent.htm> on April 20, 2005. Canadian Mushroom Grower’s Association. 2000. Best Environmental
Management Practices for Mushroom Growers in Canada. CMGA, Guelph, ON.
CCME & AAFC. 1995. Support Document for Compost Quality Criteria- National
Standards of Canada. The Canadian Council of Ministers of the Environment and Agriculture and Agri-food Canada. Environment Canada and Bureau de Nonnalisation du Quebec.
Ecological Agriculture Projects. 1994. Sustainable Farming. Retrieved from
<http://www.eap.mcgill.ca/MagRack/SF/Winter.htm> on April 20, 2005. Fulhage, C., Sievers, D., and Fischer, J. 1993. Generating Methane Gas from
Manure. Department of Agricultural Engineering, University of Missouri Extension.
Garcia-Gomez, A., Szmidt, R.A.K., and Roig, A. 2002. Enhancing the Compost
Rate of Spent Mushroom Substrate by Rock Dust. Compost Science and Utilization, 10(2):99-104.
Gingerich, J. 2006. Personal communication - June 5, 2006. Cold Springs Farm,
Thamesford, Ontario. Guo, M.X. 2005. Groundwater Quality Under the Influence of Spent Mushroom
Substrate Weathering. Journal of Environmental Monitoring, 7(10):1007-1012.
Guo, M. and Chorover, J. 2004. Solute Release from Weathering of Spent

Anaerobic Digestion and Composting of SMS Page 43
Mushroom Substrate under Controlled Conditions. Compost and Science Utilization, 12(3):225-234.
Guo, M., Chorover, J., and Fox, R.H. 2001. Effects of Spent Mushroom Substrate
Weathering on the Chemistry of Underlying Soils. Journal of Environmental Quality, 30:2127-2134.
Hardy, C., Hedges, S., and Simonds, D. 2000. Integrated Bio-Systems:
Mushrooming Possibilities. Yale Forestry & Environmental Studies Bulletin, Connecticut, USA.
Heinemann, P.H., Pretia, G., Wysocki, C.J., Graves, R.E, Walker, S.P., Beyer,
D.M., Holcomb, E.J., Heuser, C.W., and Miller, F.C. 2003. In-Vessel Processing of Spent Mushroom Substrate for Odour Control. Applied Engineering in Agriculture, 19(4):461-471.
Integrated Biosystems Research. 2000. Mushrooms. Retrieved from
<http://thor.prohosting.com/~montfort/ibs/mushroom.htm> on April 20, 2005.
OMAFRA. 2005. Factsheet: Temporary Field Storage of Solid Manure or
Prescribed Materials. Ontario Ministry of Agriculture, Food and Rural Affairs. Retrieved from <http://www.omafra.gov.on.ca/english/engineer/facts/05-009.htm> on May 26, 2006.
Radio National. 2000. Fear and Hope in the South Pacific. Retrieved from
<http://www.abc.net.au/rn/science/ss/stories/s174565.htm> on April 20, 2005.
Smith, T. 2006. Personal communication - June 1, 2006. Global Earth Systems,
Utopia, Ontario. Stewart D.P.C., Cameron, K.C., Cornforth, I.S. 1998b. Inorganic-N Release from
Spent Mushroom Compost Under Laboratory and Field Conditions. Soil Biology and Biochemisty, 30(13):1689-1699.
Stewart D.P.C., Cameron, K.C., Cornforth, I.S., and Sedcole, J.R. 1998a. Effects
of Spent Mushroom Substrate on Soil Physical Conditions and Plant Growth in an Intensive Horticultural System. Australian Journal of Soil Research, 36:899-912.
The Chinese University of Hong Kong. 2003. A study of Enzyme Production by

Anaerobic Digestion and Composting of SMS Page 44
Mushrooms to Turn Waste Materials into Food and Value-added Compounds. Retrieved from <http://www.cuhk.edu.hk/rtao/research/rhl/mushroom.htm> on April 20, 2005.
Uzun, I. 2004. Use of Spent Mushroom Compost in Sustainable Fruit Production.
Journal of Fruit and Ornamental Plant Research, 12:157-165. Vander Pol, H. 2006. Personal communication - June 2, 2006. Rol-Land Farms,
Blenheim, Ontario. Williams, B.C., McMullan, J.T., and McCahey, S. 2001. An Initial Assessment of
Spent Mushroom Compost as a Potential Energy Feedstock. Bioresource Technology, 79:227-230.
Zhang, C.K., Gong, F., and Li, D.S. 1995. A Note on the Utilization of Spent
Mushroom Composts in Animal Feeds. Bioresource Technology, 52:89-91.