feasibility study for bioethanol co-location with a …december 2002 • nrel/sr-510-32999...
TRANSCRIPT

December 2002 • NREL/SR-510-32999
BBI International Cotopaxi, Colorado
Feasibility Study for Bioethanol Co-Location with a Coal Fired Power Plant November 29, 2001—July 28, 2002
National Renewable Energy Laboratory 1617 Cole Boulevard Golden, Colorado 80401-3393 NREL is a U.S. Department of Energy Laboratory Operated by Midwest Research Institute • Battelle • Bechtel
Contract No. DE-AC36-99-GO10337

December 2002 • NREL/SR-510-32999
Feasibility Study for Bioethanol Co-Location with a Coal Fired Power Plant November 29, 2001—July 28, 2002
BBI International Cotopaxi, Colorado
NREL Technical Monitor: Robert Wallace Prepared under Subcontract No. ACO-2-31092-01
National Renewable Energy Laboratory 1617 Cole Boulevard Golden, Colorado 80401-3393 NREL is a U.S. Department of Energy Laboratory Operated by Midwest Research Institute • Battelle • Bechtel
Contract No. DE-AC36-99-GO10337

NOTICE This report was prepared as an account of work sponsored by an agency of the United States government. Neither the United States government nor any agency thereof, nor any of their employees, makes any warranty, express or implied, or assumes any legal liability or responsibility for the accuracy, completeness, or usefulness of any information, apparatus, product, or process disclosed, or represents that its use would not infringe privately owned rights. Reference herein to any specific commercial product, process, or service by trade name, trademark, manufacturer, or otherwise does not necessarily constitute or imply its endorsement, recommendation, or favoring by the United States government or any agency thereof. The views and opinions of authors expressed herein do not necessarily state or reflect those of the United States government or any agency thereof.
Available electronically at http://www.osti.gov/bridge
Available for a processing fee to U.S. Department of Energy and its contractors, in paper, from:
U.S. Department of Energy Office of Scientific and Technical Information P.O. Box 62 Oak Ridge, TN 37831-0062 phone: 865.576.8401 fax: 865.576.5728 email: [email protected]
Available for sale to the public, in paper, from:
U.S. Department of Commerce National Technical Information Service 5285 Port Royal Road Springfield, VA 22161 phone: 800.553.6847 fax: 703.605.6900 email: [email protected] online ordering: http://www.ntis.gov/ordering.htm
Printed on paper containing at least 50% wastepaper, including 20% postconsumer waste

i
Abstract A key issue for bioethanol commercialization is the current high capital cost for cellulosic based facilities. Lowering the capital cost will ease debt and equity requirements and will expand the market opportunities as more organizations such as farmer cooperatives will be able to raise the required equity for plant construction. Farmer cooperatives are one of the major drivers behind the current expansion of corn-based ethanol production as farmers strive to add value to their agricultural products. Co-location with coal-fired power plants presents an opportunity to lower the capital cost of bioethanol plants by eliminating the lignin-fired boiler included in most greenfield designs. The lignin-fired boiler can represent up to 30% of the bioethanol capital cost. Integration of the ethanol operations with the power plant could benefit both facilities (purchasing of steam from the power plant and sharing of overhead costs such as maintenance for example). A Midwest location was selected for this project due to the abundance of corn stover as well as the potential for energy crops such as switchgrass. Coal fired power plants are also very common in the Midwest, which should result in numerous co-location opportunities. Agricultural residues clearly dominate available biomass resources for near-term bioethanol production. Considering that corn stover alone represents 80% of the available agricultural residue in the United States, corn stover is the most abundant and most likely feedstock for near-term bioethanol production. Estimates of ethanol production potential from corn stover easily exceed 3 billion gallons per year and this feedstock is concentrated in the Midwest, unlike other feedstocks, which are more dispersed. This study looks at the feasibility of co-locating 30, 50 and 70 million gallon per year bioethanol facilities with coal fired power plants in Indiana and Nebraska. Corn stover is the feedstock for ethanol production in both cases.

ii

iii
Table of Contents
I. EXECUTIVE SUMMARY ...................................................................................1 Site Selection ............................................................................................................... 1 Feedstock Supply......................................................................................................... 2 Design and Cost Estimate............................................................................................ 3 Financial Evaluation .................................................................................................... 4 Environmental Issues................................................................................................... 5 Socioeconomic Impacts ............................................................................................... 5 Market Issues ............................................................................................................... 6 Conclusions.................................................................................................................. 7 Recommendations........................................................................................................ 8
II. SITE SELECTION ............................................................................................9 Site Selection Criteria ................................................................................................ 10
Feedstock Proximity........................................................................................... 10 Coal Fired Power Plant Generation.................................................................... 11 Relative Value of Lignin to Cost of Coal Fuel................................................... 11 Existing and Planned Ethanol Plant/Ag Facility ................................................ 12 Utilities ............................................................................................................... 12 Transportation Infrastructure.............................................................................. 12 Major North American Freight Railroads .......................................................... 12 Ethanol Market ................................................................................................... 13 Community Services .......................................................................................... 13 Other Advantages ............................................................................................... 13
Site Evaluations and Scoring ..................................................................................... 13 Duck Creek Generation Plant .................................................................................... 14 Big Stone Power Plant ............................................................................................... 17 RM Schahfer Generating Station............................................................................... 21 Nebraska Public Power District................................................................................. 25 Nordic Energy Power Plant ....................................................................................... 28 American Crystal Sugar............................................................................................. 29 Independence Power Plant......................................................................................... 30 Williams Bio-Energy Ethanol Plant .......................................................................... 33 Coors Brewery ........................................................................................................... 36 Tesoro Refinery ......................................................................................................... 37 Preliminary Screening Results................................................................................... 38 Additional Site Information....................................................................................... 38 Summary and Recommendations .............................................................................. 41
III. FEEDSTOCK SUPPLY .................................................................................43 Corn Stover Production and Availability .................................................................. 43 Local Corn Stover Production ................................................................................... 45 Ethanol Production Potential ..................................................................................... 48 Corn Stover Price....................................................................................................... 49

iv
Competition for Corn Stover ..................................................................................... 52 Potential for Co-Products .......................................................................................... 53 Conclusions for Feedstock......................................................................................... 55
Feedstock Supply................................................................................................ 55 Pricing................................................................................................................. 55 Risk..................................................................................................................... 55
References.................................................................................................................. 56
IV. DESIGN AND COST ESTIMATES................................................................58 Plant Process Overview ............................................................................................. 59 Plant Capital Cost Analysis ....................................................................................... 61
V. FINANCIAL EVALUATION............................................................................71 Assumptions Used in the Financial Forecast............................................................. 72 Economic Modeling Results...................................................................................... 80 Maximum Feedstock Cost ......................................................................................... 87 Sensitivity Analysis ................................................................................................... 88 Feedstock Composition ............................................................................................. 89 Feedstock Inventory................................................................................................... 90 Ethanol Price Sensitivity............................................................................................ 90 Owner Equity............................................................................................................. 91 Capital Cost Sensitivity ............................................................................................. 91 Cash Cost of Production Sensitivity.......................................................................... 92 Labor Cost Sensitivity ............................................................................................... 92 Summary for Sensitivity Analysis ............................................................................. 93 Proformas................................................................................................................... 93
VI. ENVIRONMENTAL IMPACTS ......................................................................94 On-Site Environmental Issues ................................................................................... 95
Land Use Impacts ............................................................................................... 95 Wetlands, Endangered Species and Archeological Discoveries ........................ 95 Air Emissions ..................................................................................................... 95 Water Use ......................................................................................................... 101 Wastewater Discharge ...................................................................................... 101 Storm Water...................................................................................................... 102 Hazardous Chemicals ....................................................................................... 102 Hazardous Waste .............................................................................................. 103 Solid Waste....................................................................................................... 103 Summary of Required Permits ......................................................................... 104
Local Community Impacts ...................................................................................... 104 Co-location Impacts and Benefits............................................................................ 105 Environmental Summary and Recommendations ................................................... 106
VII. SOCIOECONOMIC ISSUES ......................................................................107 Analysis Inputs ........................................................................................................ 107 Results...................................................................................................................... 108
VIII. MARKET ISSUES FOR BIOETHANOL....................................................110

v
Market Overview ..................................................................................................... 110 Local Ethanol Markets............................................................................................. 114
Nebraska ........................................................................................................... 114 Indiana .............................................................................................................. 115
Regional Ethanol Markets ....................................................................................... 115 Nebraska ........................................................................................................... 115 Indiana .............................................................................................................. 116
National Ethanol Markets ........................................................................................ 117 Ethanol Pricing ........................................................................................................ 118 Ethanol Shipping ..................................................................................................... 121 Government Regulations ......................................................................................... 122
Federal Excise Tax Exemption......................................................................... 122 Clean Air Act Amendments of 1990 ................................................................ 123 Oxygenated Fuels Program .............................................................................. 123 Reformulated Gasoline ..................................................................................... 123
MTBE ...................................................................................................................... 124 Policy Market Drivers.............................................................................................. 126
Renewable Fuels Standard ............................................................................... 126 E85 Market ....................................................................................................... 128
Competition ............................................................................................................. 129 Comparison with Midwest Ethanol Plants .............................................................. 130 Conclusion for the Ethanol Market.......................................................................... 133
List of Figures Figure 1 – 50-mile feedstock area for Wheatfield, IN site ............................................... 46 Figure 2 – 50-mile feedstock area for Grand Island, NE site ........................................... 47 Figure 3 – Bioethanol Block Flow Diagram..................................................................... 60 Figure 4 – Historical ethanol pricing at Chicago gasoline terminal ................................. 74 Figure 5 – Year-by-year Projected Annual Net Earnings, Grand Island, NE................... 81 Figure 6 – Major air emissions sources for a bioethanol plant ......................................... 96 Figure 7 – Air permit flow chart for criteria pollutants .................................................... 99 Figure 8 – Average U.S. Market Pricing of Ethanol, Gasoline and Corn....................... 118 Figure 9 – Historical ethanol pricing in Chicago, IL and Lincoln, NE .......................... 119 Figure 10 – States Requiring the Removal of MTBE..................................................... 125 Figure 11 – U.S. ethanol plant distribution by capacity ................................................. 129
List of Tables Table 1 – Capital Cost Summary........................................................................................ 3 Table 2 – Modeling results for the Wheatfield, Indiana site............................................... 4 Table 3 – Modeling results for the Grand Island, Nebraska site ........................................ 5 Table 4 – Candidate sites for bioethanol co-location study................................................ 9 Table 5 – Site Selection Criteria ....................................................................................... 10 Table 6 – Preliminary site evalaution scoring summary................................................... 38 Table 7 – Additional site screening criteria ...................................................................... 39

vi
Table 8 – Revised site scoring for the top three sites ....................................................... 40 Table 9 – Top corn producing states in the U.S................................................................ 44 Table 10 – Annual corn and corn stover production, Wheatfield, IN Site ....................... 46 Table 11 – Annual corn and corn stover production, Grand Island, NE Site ................... 47 Table 12 – Annual ethanol production potential for Wheatfield, IN site ......................... 48 Table 13 – Annual ethanol production potential for Grand Island, NE site ..................... 49 Table 14 – Corn stover harvesting and deliver costs ........................................................ 51 Table 15 – Capital Cost Summary.................................................................................... 62 Table 16 – Capital Hard Cost Investment Summary Analysis ......................................... 62 Table 17 – Capital Soft Cost Investment Summary Analysis........................................... 63 Table 18 – Total Capital Cost Investment Summary Analysis......................................... 63 Table 19 – Capital Investment per Gallon Produced Summary Analysis ........................ 63 Table 20 – Conventional Equipment Capital Cost Analysis ............................................ 64 Table 21 – 30 Million Gallons per Year Capacity Cost Projection .................................. 65 Table 22 – 50 Million Gallons per Year Capacity Cost Projection .................................. 67 Table 23 – 70 Million Gallons per Year Capacity Cost Projection .................................. 69 Table 24 – Approximate composition and ethanol yield data for corn stover.................. 72 Table 25 – Average ethanol shipping cost ........................................................................ 73 Table 26 – Lignin residue production and price to power plant ....................................... 75 Table 27 – Average Natural Gas Price to Indiana Industrial Consumers ($/MCF).......... 76 Table 28 – Chemical costs for ethanol production (source: NREL)................................. 77 Table 29 – Assumptions used in the financial forecast for Wheatfield, Indiana .............. 78 Table 30 – Assumptions for different ethanol plant sizes................................................. 79 Table 31 – Modeling results for the Wheatfield, Indiana site........................................... 80 Table 32 – Modeling results for the Grand Island, Nebraska site .................................... 80 Table 33 – Cash cost and net production cost for the Wheatfield, IN site ....................... 82 Table 34 – Cash cost and net production cost for the Grand Island, NE site ................... 82 Table 35 – Maximum feedstock cost with 15% hurdle rate and 100% equity ................. 87 Table 36 – Estimated emissions from natural gas boiler .................................................. 98 Table 37 – Estimated emissions (tpy) for a 70 MMGPY dry mill ethanol plant............ 100 Table 38 – Estimated makeup water use for corn stover bioethanol plants.................... 101 Table 39 – Estimated wastewater effluent from a corn stover bioethanol plant............. 101 Table 40 – Summary of required permits for fuel ethanol plants ................................... 104 Table 41 – Economic Impact Analysis Inputs for Indiana Bioethanol Plant.................. 108 Table 42 – Economic Impact Analysis Inputs for Nebraska Bioethanol Plant............... 108 Table 43 – Economic Impacts of Bioethanol Production in Indiana .............................. 109 Table 44 – Economic Impact of Bioethanol Production in Nebraska ............................ 109 Table 45 – U.S. Ethanol Production Capacity ................................................................ 112 Table 46 – Nebraska Ethanol Production ....................................................................... 114 Table 47 – Ethanol Use in Nebraska and Neighboring States ........................................ 115 Table 48 – Ethanol Use in Indiana and Neighboring States ........................................... 116 Table 49 – Major National Ethanol Markets .................................................................. 117 Table 50 – Average ethanol shipping costs .................................................................... 121 Table 51 – Federal excise tax exemption schedule for 10% ethanol/gasoline blends .... 123 Table 52 – Renewable Fuels Standard............................................................................ 126 Table 53 – Comparison of cellulosic and dry mill ethanol projects ............................... 132

1
I. EXECUTIVE SUMMARY The National Renewable Energy Laboratory (NREL) has retained BBI International (BBI) to conduct a feasibility study to determine the feasibility of co-locating bioethanol plants with coal fired power plants in the Midwest. The bioethanol plants modeled in this study utilize the dilute acid/enzymatic technology under development at NREL and other organizations throughout the country. The ethanol plant performance and equipment costs were provided by NREL and are based on NREL’s projections for plant performance and costs as specified in their latest design report “Lignocellulosic Biomass to Ethanol Process Design and Economics Utilizing Co-Current Dilute Acid Prehydrolysis and Enzymatic Hydrolysis For Corn Stover” issued May 2002. BBI completed the following seven tasks to determine the viability of ethanol production from corn stover. The subcontract tasks are:
• Site Selection • Feedstock Supply • Design and Cost Estimate • Financial Evaluation • Environmental Issues • Socioeconomic Issues • Market Issues
The results for each task are summarized here and BBI’s assessment of the feasibility of ethanol production from corn stover and recommendations for further work follows. Site Selection Ten sites were evaluated to determine which two sites would be the best sites for co-location of a bioethanol plant with an existing coal-fired power plant or coal-fired industrial boiler. Corn stover is the preferred feedstock for this analysis, but rice straw, wheat straw and spent brewers grain feedstocks were also considered. The amount of feedstock available must be able to support a reasonable size bioethanol plant – 30 million gallons per year or larger. Smaller plants would not support DOE’s long-term goals for bioethanol production and industry growth. The final two sites selected for the study were the Nebraska Public Power District site in Grand Island, Nebraska and the RM Schahfer Generating Station in Wheatfield, Indiana. Nebraska Public Power District (NPPD) is actively seeking a steam co-host, especially a large ethanol plant, for a new coal fired power plant to be built near Grand Island, Nebraska. Selecting NPPD’s Grand Island site provides an opportunity to evaluate co-location opportunities from “the ground up” and to maximize the synergies between the two facilities. NPPD plans to build a power plant in the 400 to 600 MW range at the Grand Island site

2
The Northern Indiana Public Service Company’s RM Schahfer Generating Station is located on 2,800 acres just northeast of the community of Wheatfield in northwestern Indiana. The site is less than 100 miles from Chicago. Total nameplate capacity of the facility is 2,200 MW. There are several areas around the generation station that Northern Indiana Public Service Company (NIPSCO) would like to develop. Feedstock Supply There is sufficient production of corn and therefore, corn stover near the Indiana site to easily supply bioethanol plants from 30 to 70 million gallons in annual capacity. A 30 million gallon per year plant at the Wheatfield, IN site would use just 17% of the stover available on a sustainable basis within 50 miles of the site (assuming 70 gallons of ethanol are produced from each BDT of stover). A 70 million gallon per year (MMGPY) plant would use 40% of the stover available within 50 miles of the plant. “Available” stover in Indiana is assumed to be 45% of the stover that is produced with 55% left in the field for erosion control. Significantly more corn is grown in the area surrounding the Grand Island, Nebraska site. A 30 million gallon per year plant at the Grand Island site would use 12% of the stover available on a sustainable basis within 50 miles of the site (assuming 70 gallons of ethanol are produced from each BDT of stover). A 70 MMGPY plant would use 28% of the stover available within 50 miles of the plant. “Available” stover for the Nebraska site is assumed to be 56% of the stover that is produced with only 44% left in the field. The estimated cost to deliver corn stover to the Grand Island, Nebraska site is $33.86 per BDT, and the estimated cost at the Wheatfield, Indiana site is $38.62. The lower corn yield per acre in Indiana and the requirement to leave more corn stover in the field, results in higher bailing costs per ton of stover and the stover must be collected over a greater distance resulting in higher transportation costs for Indiana. Sources of competition for corn stover that could potentially create significant increased demand and drive up the price for corn stover are nonexistent in the project areas. There is so much corn stover available in these areas that increased prices due to competition are difficult to envision. Pulp and paper production and electricity are perhaps the only two existing markets that could create a sizable demand for corn stover. The production of certain commodity chemicals from corn stover could also create a large local demand. All of these applications using corn stover feedstock are conceptual at this time and predicting the impact on local corn stover pricing would be highly speculative. Competition for corn stover will be avoided in the same manner as in the current corn ethanol industry: ethanol plants are not sited near other ethanol plants where they will create a large increase in the local corn price. It is well known that creating a large local demand for corn will drive up the local price of corn so project developers look for sites with a large excess of corn. Plants that use corn stover will not be located next to other users of corn stover because both business would suffer due to higher corn stover prices.

3
Lenders usually will not fund the “second” project that is too close to another project that uses the same feedstock. The bioethanol plant itself will create the greatest risk related to feedstock competition. Unless the bioethanol plant has a secondary or backup feedstock, it will be 100% dependant on corn stover supply and the plant may find itself at the mercy of the feedstock suppliers and corn growers. This will be a key issue for lenders. Long-term contracts for the corn stover can help to mitigate this risk, but contracts can be broken. Another option that would help would be for the owners of the corn stover, i.e. farmers, to have significant ownership in the bioethanol facility. It would then be in their best interest to make sure the plant always had an adequate supply of corn stover at a reasonable price. Finally the only other possible source of serious competition for corn stover would be the loss of corn acreage to another crop or another use. Conversion of #2 yellow corn to silage is one example. Silage requires the removal of the most of the corn plant and there would be little stover available. The National Corn Growers Association is predicting an increase in the number of corn acres in the future, however, driven primarily by the demand for fuel ethanol so this is not a likely scenario. Corn stover is currently not harvested on the scale required for a large ethanol plant and the long-term impacts of harvesting corn stover are also not well known. The lack of an ongoing, large scale corn stover harvesting, storage and delivery operation will be a serious issue for lenders that project developers must address. Design and Cost Estimate Ethanol plant sizes of 30, 50 and 70 MMGPY of anhydrous ethanol production match today’s industry norms and were modeled to determine the impact of plant size on project costs. Bioethanol plant capital cost estimates were provided by NREL and the NREL equipment costs were used in the analysis as the basis for the BBI cost estimates. BBI assigned equipment installation factors to the equipment costs to arrive at the installed cost. The equipment installation factors are derived from actual costs for corn ethanol wet and dry mills. Table 1 shows the estimated capital costs for the bioethanol facilities.
Table 1 – Capital Cost Summary
Capital Investment Summary Plant Capacity 30MMGPY 50MMGPY 70MMGPY
Capital Hard Cost Investment $ 65,521,275 $ 92,403,780 $ 116,581,752 Capital Soft Cost Investment $ 7,280,142 $ 12,600,516 $ 18,978,425 Total Capital Cost Investment $ 72,801,417 $ 105,004,296 $ 135,560,177

4
Financial Evaluation The approach for the financial analysis was to use conservative assumptions throughout to arrive at an estimate of the minimum return that can be reasonably expected for the project based on the capital costs estimated by BBI and the plant performance criteria provided by NREL. Ethanol plant sizes of 30, 50 and 70 MMGPY of anhydrous ethanol production were modeled to determine the impact of plant size on profitability. Bioethanol plant capital costs were estimated by BBI and operating cost estimates were provided by NREL. NREL also provided the estimated ethanol and byproduct yields, energy consumption and utility and chemical usage for the ethanol plant. The NREL design is for an nth plant design and, therefore, does not include additional costs that will likely be incurred by the first generation of bioethanol plants to mitigate the risks associated with commercializing new technologies. The ethanol plant is assumed to be designed for a 20-year project life and equipment is depreciated over 20 years in the project proforma. Construction of the project is assumed to take 14 months followed by four months of startup. During startup, ethanol production is assumed to be 25% of nameplate capacity during the first month, and then 50%, 75% and finally 100% in the second, third and fourth months of startup. Internal Rate of Return (IRR) was used to measure the profitability of the proposed projects. The results for Indiana are summarized in Table 2 and the results for Nebraska are shown in Table 3.
Table 2 – Modeling results for the Wheatfield, Indiana site
30 MMGPY 50 MMGPY 70 MMGPY
Internal Rate of Return (IRR) -5.7% 3.3% 10.7%
Average Annual Net Earnings $2,783,000 $6,190,000 $10,794,000
Capital Cost per Gallon ($/gal) $2.18 $1.85 $1.67
Ethanol Plant Capital Cost $65,521,000 $92,404,000 $116,582,000
Owner’s Costs $8,173,000 $10,732,000 $13,297,000
Total Project Investment $73,694,000 $103,136,000 $129,879,000
40% Equity $29,477,600 $41,254,400 $51,951,600

5
Table 3 – Modeling results for the Grand Island, Nebraska site
30 MMGPY 50 MMGPY 70 MMGPY
Internal Rate of Return (IRR) 18.6% 23.6% 29.3%
Average Annual Net Earnings $7,522,000 $12,754,000 $19,188,000
Capital Cost per Gallon ($/gal) $2.18 $1.85 $1.67
Ethanol Plant Capital Cost $65,521,000 $92,404,000 $116,582,000
Owner’s Costs $8,096,000 $10,602,000 $13,117,000
Total Project Investment $73,617,000 $103,006,000 $129,699,000
40% Equity $29,446,800 $41,202,400 $51,879,600 The projected IRRs for the Nebraska project are significantly higher than the Indiana project because of the state producer payment in Nebraska, the lower estimated feedstock cost and the lower energy (steam and electricity) costs at the Nebraska site. Environmental Issues Based on the assumptions stated in this report, and the air permitting regulations in place at the time of this report, the feasibility of obtaining air permits for the proposed bioethanol facilities is excellent. The most significant issue is the boiler emissions for larger bioethanol facilities and remaining a Minor Source. Permitting a Major Source facility will be more difficult, more time consuming and more expensive. Operational monitoring and reporting requirements will also be more expensive. The timeframe from the preparation of the air permit application to the issuance of an air license is estimated to be approximately 6 to 12 months for a Minor source and more than a year for a Major Source. Obtaining other permits for the proposed bioethanol facilities should be no more difficult than permitting a corn dry mill ethanol plant. Environmental impacts and community impacts would also be very similar to those for a dry mill. Locating the bioethanol facility away from residential areas can minimize community impacts. An industrial park or land zoned “industrial” may not be suitable if it is near towns and communities. Wetlands and areas with known endangered species and archeologically sensitive areas should also be avoided when siting the ethanol facility. Socioeconomic Impacts The construction spending associated with building a 50 MMGPY bioethanol plant will add approximately $250 million to the final demand in the local economy and generate

6
$81 million in new household income and provide for more than 2,500 direct and indirect jobs during construction. During commercial operations the 50 MMGPY bioethanol plant will create from 534 to 610 new jobs depending where the plant is located. New household income will be approximately $17 million annually and annual state and local taxes are estimated to be $1 million on new earnings. Market Issues The primary market drivers for fuel ethanol in the U.S. are MTBE replacement, a Renewable Fuels Standard, federal and state tax incentives, octane requirements and the Reformulated Gasoline program. Ethanol pricing is affected primarily by the rack price of gasoline and state and federal incentives. However, an oversupply in local markets can necessitate a discounted price or higher transportation costs to get the product to a market with unsatisfied demand. The phase out of MTBE will have a significant positive impact on the ethanol market, as ethanol is the most likely product that will be used to replace MTBE as it is phased out. MTBE and ethanol extend the volume of gasoline, enhance octane, and provide oxygen. Ethanol, as an octane enhancer, can substitute for benzene and other aromatic hydrocarbons. This substitution reduces the emissions of benzene and butadiene, both of which are highly carcinogenic. To date, the use of ethanol as an octane enhancer in both California and the Northeast has been limited due to lack of regional availability and readily available MTBE. As MTBE is phased out (and BBI believes it will be), ethanol is very likely to be the preferred product to substitute for MTBE. In addition, a series of lawsuits filed in numerous states against oil companies who have used MTBE (resulting in contaminated groundwater) has made many wary of its continued use. The Senate version of the energy bill provides for a required ramp up of use of renewable fuels like ethanol. The bill if signed into law, would require 2.3 billion gallons in 2004 and gradually increases to 5 billion gallons in 2012. It is important to note that in addition to ethanol, other renewable fuels such as biodiesel are also included in the Senate Bill. Credit trading will impact renewable fuels use on the East and West coasts and a premium for the use of cellulosic ethanol may also impact the ethanol market. The refining capacity in the United States continues to decline, while gasoline consumption continues to increase. The slightest upset in refining capacity (fire, shutdown, closure) sends gasoline prices soaring. U.S. refining capacity is not keeping pace with increasing demand. Ethanol plays a key role in helping refiners extend their product by as much as 10%. The need for clean octane continues to grow in many parts of the country. Clean air standards will remain in place whether we have an oxygenate requirement in

7
reformulated gasoline or not. Ethanol provides as much as three octane points to the gasoline into which it is blended. In addition to the octane, it helps refiners meet clean air requirements by reducing, through dilution, various toxic components in gasoline. The ability of petroleum marketers to increase profits $0.01 per gallon of gasoline sold or more makes ethanol a solid business choice. So while it may take some time for a full switch to ethanol to occur, it is becoming increasingly apparent that in the next decade ethanol will be the octane enhancer, fuel extender and MTBE replacement in our gasoline. Conclusions Given the costs and performance for bioethanol plants described herein, production of fuel ethanol from corn stover would be very competitive with today’s production from corn via dry milling. NREL expects the performance used in this feasibility study will be achieved in the next ten years or less, so this comparison is somewhat misleading. It is likely that ethanol production from corn will continue to improve in efficiency and yields during the next ten years also. High gravity fermentation, better enzymes and yeast, ethanol production from distillers grain and production of new high value co-products from corn are just a few of the dry mill technology improvements under investigation. The technology for ethanol production from corn stover is where corn dry milling technology was 20 years ago. We expect cellulosic ethanol technology to improve rapidly and exceed the performance used in this report in less than ten years. Financing the first generation of bioethanol plants is the most challenging hurdle to overcome in the near-term. Current projections for energy use provided by NREL are significantly higher than for a dry mill. This is one area where rapid improvements are likely if the bioethanol technology follows the path of the dry mill industry. Increasing the ethanol concentration in the beer would be a good the first step in this direction. The capital cost of dry mills has also decreased dramatically over the past decade. This is a second area for significant improvement in bioethanol technology. Co-location provides significant benefits for ethanol production from corn stover, primarily by eliminating the costly lignin boiler. Lignin is not expected to generate significant revenue if its value is determined solely by the local cost of coal. The ethanol plant location can have a significant impact on the projected profitability. Low feedstock cost, low energy costs and other incentives such as a state producer payment can provide a significant advantage for a bioethanol plant. This is the primary advantage of the Nebraska site over the Indiana site.

8
Recommendations BBI offers the following recommendations for NREL’s consideration:
1. Continue development of the core technologies required to achieve the performance goals used in this feasibility study. Pretreatment, enzymes and fermentation are the obvious areas to focus on.
2. Conduct a feasibility study focused on identifying the best near-term opportunity
for a commercial cellulosic ethanol plant. This study should have no restrictions on feedstock or location. The size of the proposed ethanol plant should be based on the availability of feedstock, infrastructure and equity/financing constraints. The sooner a biomass ethanol plant is up and running, the sooner the improvements in energy use, yields and capital costs will begin.
3. Identify the risks associated with the first generation of bioethanol plants
(feedstock, technology and market risks) and develop a plan to mitigate those risks. Without this effort, financing the first plants will remain nearly unattainable.

9
II. SITE SELECTION
Co-location of bioethanol plants with coal-fired power plants may provide an opportunity for early deployment of bioethanol technologies. “Bioethanol” as used herein is defined as ethanol produced from lignocellulosic biomass and does not include ethanol produced from starch or sugar feedstocks. Co-location with coal-fired power plants presents an opportunity to lower the capital cost of the bioethanol plant by eliminating the lignin-fired boiler included in most greenfield designs. The lignin-fired boiler can represent up to 30% of the bioethanol plant capital cost. Integration of the ethanol operations with the power plant could benefit both facilities (purchasing of steam from the power plant and sharing of overhead costs such as maintenance for example). Midwest locations are of interest to NREL and DOE because of the vast corn stover resource available for bioethanol and bioenergy production concentrated in the Midwest. BBI has identified 10 potential sites for the project (Table 4). These sites are believed to encompass the majority of variables that will be encountered when co-locating bioethanol plants with coal-fired power plants in the Midwest. Sites at major electric generating stations have been identified as well as potential sites at smaller industrial sites with coal-fired boilers. Seven of the sites would use corn stover as the feedstock for ethanol production, one wheat straw, one rice straw and one spent brewers grain.
Table 4 – Candidate sites for bioethanol co-location study
Two sites are to be selected for further study. The site selection criteria that will be used to narrow down the sites to the top two are shown in Table 5. A superior ethanol plant site encompasses many factors. Proximity of feedstocks, good road and rail access, utility availability and space for equipment and truck movement are necessary. Other considerations include a qualified and/or trainable labor force, as well as community facilities that are capable of attracting and retaining top management personnel who may come from outside the area. The site selection criteria used to screen the ten sites include the following general categories.
1 Duck Creek Power Station, Canton, IL2 Big Stone Power Plant, Milbank, SD3 RM Schahfer Generating Station, Wheatfield, IN4 Nebraska Public Power (new plant), Grand Island, NE5 Nordic Energy Power Plant & Ethanol Plant, Northeast, OH6 American Crystal Sugar Plant, Crookston, MN7 Independence Power Plant, Newport, AR8 Williams BioEnergy Ethanol Plant, Pekin, IL9 Coors Brewery, Golden, CO
10 Tesoro Refinery, Mandan, ND

10
• Adequate biomass feedstock within a reasonable transportation distance • Access to a large coal fired power plant • Cost of coal (higher is better for the bioethanol plant lignin value) • Existing or planned ethanol or agricultural processing facility at the site • Infrastructure that may reduce the bioethanol plant cost (steam supply or
wastewater treatment, for example) • Access to good road and rail transportation • Access to a local ethanol market • Community services needed to support the ethanol plant • Other advantages of the site
Each site selection criteria is assigned a maximum score that indicates the relative importance of that criterion when selecting an appropriate site for an ethanol plant. Each criterion is described below.
Table 5 – Site Selection Criteria
Site Selection Criteria
Feedstock Proximity Feedstock is a very important site selection criterion. Without adequate feedstock, you do not have a project. Agricultural residues such as corn stover and rice straw can be
Site Selection Criteria PointsFeedstock Proximity
Achieve 70-MMgal w/stover < 50 miles 12Achieve 50-MMgal w/stover < 50 miles 8Achieve 30-MMgal w/stover < 50 miles 4
Power Plant SizeCoal Fired Power Plant > 800 MW 8Coal Fired Power Plant > 400 MW 6Coal Fired Power Plant > 200 MW 4
Relative Value of Lignin Fuel to Coal 8Existing Ethanol Plant/Ag Facility 8Planned Ethanol Facility 4Low-cost Steam Available 8Existing Wastewater Treatment 8Mainline Rail 10Two Mainline Rails 5Shortline Rail 5Interstate Road Access < 10 miles 5Ethanol Market < 100 miles 10Community Services < 10 miles 8Other Advantages 10

11
harvested and transported up to approximately 50 miles at a reasonable cost. The amount of biomass feedstock within 50-miles of each site will, therefore be estimated and the resulting ethanol production potential calculated. The 50-mile feedstock collection area is approximately equal in size to a USDA Agricultural District. The corn, wheat or rice production in the site’s Agricultural District will be used to estimate the corresponding amount of biomass available. Each ton of corn, wheat or rice produced is assumed to result in 1.2 dry tons of biomass (corn stover, wheat straw or rice straw). The ethanol production potential for the corn stover and wheat straw sites is based on using 25% of the corn stover or wheat straw produced within the Agricultural District at a yield of 70 gallons of ethanol per dry ton of biomass. For the Newport, Arkansas site 90% of the rice straw is assumed to be available for ethanol production at the same ethanol yield of 70 gallons per ton of rice straw. For feedstock proximity, sites receive a score of 12 points if the ethanol production potential is greater than 70 million gallons per year (MMGPY), 8 points for 50 MMGPY and 4 points for 30 MMGPY. If the ethanol production potential for the site is less than 30 MMGPY, the site receives a score of zero points. If the ethanol production potential is too small (less than about 10 MMGPY), the site will not be considered for further study.
Coal Fired Power Plant Generation The coal-fired power plant generation capacity is important because it will determine the relative impact of using lignin for a boiler fuel. Very large power plants could burn the lignin from a bioethanol plant with little impact on boiler operations. Potential sites at power plants larger than 800 megawatts (MW) receive 8 points with 6 and 4 points awarded for power plants larger then 400 and 200 MW, respectively. For sites co-located with plants smaller than 200 MW, zero points are awarded.
Relative Value of Lignin to Cost of Coal Fuel For this project the lignin byproduct from bioethanol production is assumed to be sold to the power plant for fuel use. The price received for the lignin will be determined in part by the power plant’s coal fuel cost. A higher cost for coal should result in a higher price for the lignin and a more profitable bioethanol plant. Other factors could impact the value of the lignin, however. For example, use of a renewable fuel or possible reduction of SOx or NOx emissions may increase the value of the lignin above its fuel value. These factors will be discussed with power plant personnel later in the project. A maximum score of 8 points will be awarded to sites with a coal cost of $1.50 per MMBTU or higher. For sites with coal costs below $1.50/MMBTU, the score is calculated as the ratio of the local cost of coal (per million BTUs), divided by $1.50, times the maximum score of 8 points.

12
Existing and Planned Ethanol Plant/Ag Facility The presence of a corn ethanol plant or another agricultural processing facility at a co-location site may provide an advantage as a result of synergies with the existing facility. Sites with an existing ethanol or agricultural processing facility receive 8 points and sites with plans for future ethanol plants receive 4 points.
Utilities Sites with low cost steam available receive 8 points and those with an existing wastewater treatment facility receive an additional 8 points. Low cost steam and an existing wastewater treatment plant would provide benefits through lower capital costs and possibility lower operating costs for the bioethanol facility. It is BBI’s experience that most power plants do not have “excess” steam available for a co-located ethanol plant.
Transportation Infrastructure Access to rail for shipping ethanol to more distant markets can provide a distinct advantage over ethanol plants without rail access. An existing rail siding at a proposed site as well as access to two rail lines are positive site attributes. A site on a mainline rail line is better than a location on a short line rail line. All of the proposed sites have a rail siding so a score for rail siding was not included in the site evaluation matrix. A site on a main line rail receives 10 points and if the site has access to two rail lines, then another 5 points is awarded. A site on a short line rail receives 5 points.
Class I or “mainline” railroads are line haul freight railroads with annual operating revenue in excess of $262 million. There are only nine Class I railroads operating in the U.S. (source: Association of American Railroads Policy & Economics Department).
Major North American Freight Railroads UP Union Pacific Railroad BNSF The Burlington Northern and Santa Fe Railway NS Norfolk Southern CSX CSX Transportation CN Canadian National Railway CP Canadian Pacific Railway
$10,539$9,200
$6,159 $6,075
$3,653$2,470
$641 $556 $522
UP BNSF NS CSX CN CP TFM FXE KCS
Major North American Railroads by 2000 Revenue(million)

13
TFM TFM (a subsidiary of Grupo Transportación Ferroviaria Mexicana) FXE Ferrocarril Mexicano (a subsidiary of Grupo Ferroviario Mexicano) KCS Kansas City Southern Railway Access to good roads is important to an ethanol plant because most, if not all, of the feedstock will be delivered by truck and ethanol may be shipped to local markets by truck. Sites within 10 miles of an interstate highway receive 4 points.
Ethanol Market A large local ethanol market, such as Chicago or Denver, can provide a distinct advantage for an ethanol plant through lower shipping costs. A site within 100 miles of a large ethanol market receives 10 points.
Community Services Community services within 10 miles of the ethanol plant site are important to provide quick response to the needs of the plant and to attract and retain top employees. Desirable community services include electrical maintenance, machine shop, welding, plumbing, hospital, airport, good schools and fire protection. Sites with all of the recommended community services available within 10 miles receive a score of 8 points (one point for each service listed here).
Other Advantages Sites can receive up to 10 points for situations not covered by the above site evaluation criteria that may provide an economic advantage for the site. Examples include cooperatives formed to use corn stover (aligns with DOE’s goals) or a power plant that already provides steam to an ethanol plant or other industrial user (shows willingness to look beyond just power generation and seek other business opportunities). Site Evaluations and Scoring Each of the ten sites and their respective site selection scores will be examined in the next sections of the report, followed by the site selection summary and recommendations.

14
Duck Creek Generation Plant
Duck Creek Generation Plant The Duck Creek Generation Plant in west central Illinois is owned and operated by AES Corporation. AES is a leading global power company comprised of competitive generation, distribution, and retail supply businesses in Argentina, Australia, Bangladesh, Brazil, Canada, Chile, China, Dominican Republic, El Salvador, Georgia, Hungary, India, Italy, Kazakhstan, the Netherlands, Mexico, Pakistan, Panama, the United Kingdom, the United States, and Venezuela. AES’s generating assets include interests in 173 facilities totaling over 59,000 megawatts of capacity in 27 countries. AES also distributes electricity in 9 countries through 19 distribution businesses. In addition, through its various retail electricity supply businesses, the company sells electricity to over 153,000 end-use customers.
The Duck Creek Generation Plant is a 440 MW coal fired power plant located about seven miles south of Canton, Illinois. AES owns about 9,000 acres of land at the site. The site is about 190 miles south of Chicago and an equal distance north of St. Louis. Canton has a population of about 15,000. Bituminous coal is used in the coal-fired boilers at the Duck Creek Generation Plant. The average
utility coal fuel cost in Illinois is $1.44 per million BTUs (source: Energy Information Administration/State Electricity Profiles. Illinois, November 2001).
Feedstock Proximity
The Duck Creek Generation Plant is located in Illinois agricultural District 30 West – the yellow area on the Illinois map shown here.
Within District 30, corn production in 2000 was 164 million bushels. The average yield was 152 bushels per acre. At 1.2 pounds of stover per pound of corn produced, the corn stover produced is estimated to be 5.5 million tons.
At a conversion rate of 70 gallons of ethanol per dry ton of stover, the ethanol production potential in the District is 96 million gallons of ethanol annually. Only 25% of the available stover is assumed to be used for ethanol production.
The Duck Creek site can easily support 50 million gallons of annual ethanol production within 50 miles of the site. The site receives the maximum score of 12 for feedstock proximity.

15
Power Plant Generating Capacity The Duck Creek Generation Plant has a total nameplate generation capacity of 440 MW. The site receives a score of 6 points for generation over 400 MW. Relative Value of Lignin Fuel to Coal The average cost of coal to utility power plants in Illinois is $1.44 per million BTUs (source: Energy Information Administration/State Electricity Profiles). The Duck Creek site receives a score of 1.44/1.50*8 = 7.7 points. Existing and Planned Ethanol Plant/Ag Facility There are no existing ethanol or agricultural processing facilities at the Duck Creek site. There is a 30 million gallon per year dry mill ethanol plant in the planning stages to be located less than one mile to the west of the Duck Creek plant. The Central Illinois Energy Cooperative has completed a feasibility study and business plan for the ethanol project and is now raising the equity and debt financing for the project. Central Illinois Energy Cooperative plans to purchase over 100 acres for the ethanol plant with plans for future value added agricultural processing at the site. The cooperative has expressed an interest in ethanol production from corn stover. The site scores zero points for an existing ethanol or agricultural processing facility at the site and 4 points for the corn dry mill ethanol plant under development. Utilities Steam is not available from the Duck Creek power plant (Central Illinois Energy Cooperative Business Plan, BBI International, December 2001). An existing wastewater treatment facility is also not available. The site scores zero for both low cost steam and wastewater treatment. Transportation Coal is delivered to the Duck Creek power plant via a Burlington Northern rail line. The site scores 10 points for access to mainline rail. A second railroad is not available at the site. The site has good road access via state highways, but the nearest interstate highway (Interstate 74) is 20 miles to the north. The site scores 0 points for access to an interstate highway less than 10 miles away.

16
Ethanol Market The Chicago and St. Louis ethanol markets are nearly 200 miles from the Duck Creek site. The site score 0 points for access to a major ethanol market within 100 miles. Community Services All desired community services are available in Canton, Illinois, about 7 miles from the Duck Creek site. The site scores 8 points for community services. Other Advantages The Central Illinois Energy Cooperative is planning to build a 30 million gallon per year corn dry mill ethanol plant near the Duck Creek power plant, but points have already been awarded for the planned ethanol facility. There are no additional advantages to the site. Duck Creek Site Score The Duck Creek site scored 48 points. The strengths of the site are the abundance of corn stover in the area, mainline rail service and a relatively high cost of coal, which should result in a higher value for the bioethanol plant’s lignin. A 30 MMGPY dry mill ethanol plant is being developed near the Duck Creek power plant. The Duck Creek site suffers from a lack of nearby interstate highway access and the distance to the nearest major ethanol market. There is no steam or wastewater treatment available at the site.
Site Selection Criteria Duck CreekFeedstock Proximity
Achieve 70-MMgal w/stover < 50 miles 12Achieve 50-MMgal w/stover < 50 miles --Achieve 30-MMgal w/stover < 50 miles --
Power Plant SizeCoal Fired Power Plant > 800 MW --Coal Fired Power Plant > 400 MW 6Coal Fired Power Plant > 200 MW --
Relative Value of Lignin Fuel to Coal 7.7Existing Ethanol Plant/Ag Facility 0Planned Ethanol Facility 4Low-cost Steam Available 0Existing Wastewater Treatment 0Mainline Rail 10Two Mainline Rails 0Shortline Rail 0Interstate Road Access < 10 miles 0Ethanol Market < 100 miles 0Community Services < 10 miles 8Other Advantages 0Total Points 48

17
Big Stone Power Plant The Big Stone Power Plant near Milbank, South Dakota is co-owned and operated by Otter Tail Power Company. Otter Tail Power Company is a division of Otter Tail Corporation headquartered in Fergus Falls, Minnesota. Otter Tail Power Company owns over 650 megawatts of coal, hydro, and internal combustion generation and operates over 1,100 megawatts of generation in the upper Midwest.
The Big Stone facility is a 475 MW coal fired power plant located near Milbank, South Dakota. The site is in the northeast corner of the state and is about 180 miles due west of Minneapolis. Milbank has a population of about 5,000. Bituminous coal is the fuel for the coal-fired boilers at the Big Stone Plant. The average utility coal fuel cost is $0.94 per million BTUs
in South Dakota (source: Energy Information Administration/State Electricity Profiles. South Dakota, November 2001). Feedstock Proximity The Big Stone Plant is located in South Dakota agricultural District 30 Northeast. The site is very near the Minnesota boarder so one-half of the feedstock area is assumed to be in South Dakota and one-half in Minnesota – see the yellow area on the map shown here.
Big Stone Plant

18
South Dakota District 30 corn production in 2000 was 67 million bushels. The average yield was 126 bushels per acre. In Minnesota District 40, corn production in 2000 was 186 million bushels and the average yield was 146 bushels per acre. Using one-half of the corn production in South Dakota District 30 and one-half in Minnesota District 40, and 1.2 pounds of stover per pound of corn produced, the corn stover produced in the feedstock area is estimated to be 4.25 million tons. At a conversion rate of 70 gallons of ethanol per ton of stover, the ethanol production potential for the Big Stone site is 74 million gallons of ethanol when only 25% of the stover is used for ethanol production. The Big Stone site can easily support 50 million gallons of annual ethanol production within 50 miles of the site. The site receives the maximum score of 12 for feedstock proximity. Power Plant Size The Big Stone Plant has a total nameplate generation capacity of 475 MW, all of it coal fired. The site receives a score of 6 points for generation over 400 MW. Relative Value of Lignin Fuel to Coal The average cost of coal to utility power plants in South Dakota is $0.94 per million BTUs (source: Energy Information Administration/State Electricity Profiles). The Big Stone site receives a score of 0.94/1.50*8 = 5 points. Existing and Planned Ethanol Plant/Ag Facility There is a corn dry mill ethanol plant under construction at the Big Stone Plant site. The Northern Lights Ethanol, LLC ethanol plant was designed by Broin and Associates and will produce 40 million gallons of ethanol annually from corn feedstock. Northern Lights has negotiated a contract to purchase steam from the Big Stone Power Plant. The ethanol plant will have its own natural gas fired boiler and has the option to produce its own steam whenever it is more economical than purchasing steam for the power plant. The Northern Lights ethanol plant is schedule to be in commercial operation by August 2002. The site scores 8 points for the Northern Lights ethanol plant at the site. Utilities The Big Stone plant will be providing about 100,000 pounds per hour (pph) of steam to the Northern Lights ethanol plant. This is equivalent to about 10 MW of power production or 2% of the 475 MW nameplate capacity. The ability of the power plant to provide additional steam to a bioethanol facility will require further study. For now it is assumed that the power plant could provide another 100,000 pph or more steam to another facility at the site. The site receives 8 points for the availability of low cost steam.

19
The Northern Lights ethanol plant will have a wastewater treatment system, but it is unlikely that it will have adequate capacity for a bioethanol plant. Expansion of the existing wastewater facility will be explored if the Big Stone site is selected for further study. The site score zero for wastewater treatment. Transportation Coal is delivered to the Big Stone power plant via a Burlington Northern rail line. The site scores 10 points for access to mainline rail. A second railroad at the site is not available. The site has good road access via state highways, but the site is 22 miles to the east of Interstate 29. The site scores 0 points for access to an interstate highway less than 10 miles away. Ethanol Market The Minneapolis ethanol market is 180 miles to the east of the Big Stone site. The site scores 0 points for access to a major ethanol market within 100 miles. Community Services All desired community services are available in Milbank, South Dakota and the surrounding area. The site scores 8 points for community services. Other Advantages The Big Stone power plant will provide steam to the Northern Lights ethanol plant at a price that is believed to be competitive with steam produced from natural gas. This arrangement shows the willingness of Big Stone and Otter Tail Power Company to look at non-traditional sources of revenue from their generating units. Big Stone and Northern Lights have already addressed the issue of steam pricing and reliability. This will be important information for the project. The experience and information available from Big Stone and Northern Lights results in an additional 10 points for the Big Stone site.

20
Big Stone Site Score The Big Stone site scored 67 points. The strengths of the site are the abundance of corn stover in the area, mainline rail service, the Northern Lights ethanol plant at the site, the availability of low cost steam, and the unique co-host arrangement between Big Stone and Northern Lights. This is the same arrangement that the current project seeks to evaluate. The Big Stone site suffers from a lack of nearby interstate highway access and the distance to the nearest major ethanol market. There is no wastewater treatment available at the site.
Site Selection Criteria Big StoneFeedstock Proximity
Achieve 70-MMgal w/stover < 50 miles 12Achieve 50-MMgal w/stover < 50 miles --Achieve 30-MMgal w/stover < 50 miles --
Power Plant SizeCoal Fired Power Plant > 800 MW --Coal Fired Power Plant > 400 MW 6Coal Fired Power Plant > 200 MW --
Relative Value of Lignin Fuel to Coal 5.0Existing Ethanol Plant/Ag Facility 8Planned Ethanol Facility 0Low-cost Steam Available 8Existing Wastewater Treatment 0Mainline Rail 10Two Mainline Rails 0Shortline Rail 0Interstate Road Access < 10 miles 0Ethanol Market < 100 miles 0Community Services < 10 miles 8Other Advantages 10Total Points 67

21
RM Schahfer Generating Station
RM Schahfer Generating Station The Northern Indiana Public Service Company’s RM Schahfer Generating Station is located on 2,800 acres just northeast of the community of Wheatfield in northwestern Indiana. The site is less than 100 miles from Chicago. Total nameplate capacity of the facility is 2,200 MW. There are several areas around the generation station that Northern Indiana Public Service Company (NIPSCO) would like to develop. Wheatfield is a town of about 620 population located at the intersection of State Highways 10 and 49.
The RM Schahfer generating station includes two 129 MW gas turbines, two approximately 550 MW coal fired boilers/steam turbines, and two 423 MW coal or natural gas fired boilers/steam turbines. Bituminous coal is used in the coal-fired boilers. The average coal fuel cost is $1.11 per million BTUs (source: Energy Information Administration/State Electricity Profiles. Indiana, November 2001).
The $70 million Georgia Pacific gypsum wallboard facility can be seen in the foreground of the above picture. NIPSCO is actively courting other large industrial operations to build facilities on the grounds of the 2,800-acre RM Schahfer generating station. Feedstock Proximity The RM Schahfer Generating Station is located in Indiana agricultural District D10, Northwest – the yellow area on the Indiana map shown here. Indiana District 10 contains about 4,000 square miles (55 miles wide by about 75 miles tall). This is equivalent to a 35-mile radius circle – a very reasonable feedstock collection distance. Within District 10, corn production in 2000 was 125 million bushels. The average yield was 140 bushels per acre. At 1.2 pounds of stover per pound of corn produced, the corn stover produced is estimated to be 4.2 million tons in the District. At a conversion rate of 70 gallons of ethanol per ton of stover, the ethanol production potential in the District is 73.5 million gallons of ethanol

22
when only 25% of the stover is used. Use of 25% of the stover within the feedstock area is believed to be a conservative assumption for grower participation and stover collection and use. The RM Schahfer generating station site can easily support 50 million gallons of annual ethanol production within 50 miles of the site. The site receives the maximum score of 12 for feedstock proximity. Power Plant Generating Capacity The RM Schahfer generating station has a total nameplate generation capacity of 2,200 MW. Of this 1,943 MW is coal fired. The site receives the maximum score for power plant generating capacity of 8 points. Relative Value of Lignin Fuel to Coal The average cost of coal to utility power plants in Indiana is $1.11 per million BTUs (source: Energy Information Administration/State Electricity Profiles). The RM Schahfer site receives a score of 1.11/1.50*8 = 5.9 points. Existing and Planned Ethanol Plant/Ag Facility There are no existing or planned ethanol or agricultural processing facilities at the RM Schahfer site. There is a $70 million Georgia Pacific gypsum wallboard facility at the site. The Iroquois BioEnergy Cooperative plans to build an corn dry mill plant in the area, but it is likely to be located near Rensselaer, about 20 miles to the south. The site scores zero points for both existing and planned ethanol/ag facilities at the site. Utilities Steam is not available from the RM Schahfer power plants (Iroquois BioEnergy Cooperative Ethanol Feasibility Study, BBI International, December 2001). An existing wastewater treatment facility is also not available. The site score zero for both low cost steam and wastewater treatment. Transportation Coal is delivered to the RM Schahfer power plants via Norfolk Southern, the third largest railroad company in the country. The site scores 10 points for access to mainline rail. The site has good road access with State Highway 49 directly to the west and State Highway 10 just a mile or two to the south. Interstate 65 is approximately 10 miles west of Wheatfield. The site scores 5 points for access to Interstate 65.

23
Ethanol Market The Chicago area ethanol market, one of the largest in the country, is less than 100 miles from the RM Schahfer site. The site score 10 points for access to a major ethanol market within 100 miles. Community Services Community services within 10 miles of the RM Schahfer site include electrical maintenance, machine shop and welding, good schools and fire protection. Although there is not an industrial pipefitting and plumbing service within 10 miles of the site, the power plant has demonstrated that these services are available when needed. The site lacks a hospital and airport within 10 miles. The site scores 6 points for community services. Other Advantages There is a well organized farmers’ cooperative in the area that is planning to build a 40 million gallon per year corn dry mill ethanol plant near Rensselaer, IN. The Iroquois BioEnergy Cooperative (IBEC) was originally formed to promote the use of corn stover in the area for ethanol production. When plans to build a corn stover ethanol plant did not meet the cooperative’s timeline, the cooperative switched to a traditional dry mill ethanol plant that could be built relatively quickly. The cooperative is still interested in using corn stover and has recently received a $3 million appropriation for a bioenergy project. The RM Schahfer site receives 5 points for the activities of the Iroquois BioEnergy Cooperative. The Georgia Pacific facility at the site uses fly ash from the power plant to manufacture gypsum wallboard. The Georgia Pacific facility presents the opportunity to sell gypsum from the bioethanol plant to the wallboard facility. The specifications for the required gypsum quality are not known at this time, however. The quality of the gypsum produced by the ethanol plant is also not well established and may not meet the required quality specifications. The Georgia Pacific facility represents a unique opportunity to reduce solid waste disposal cost and possibly create a new revenue stream for the bioethanol plant. An addition 5 points are awarded for the wallboard facility.

24
RM Schahfer Site Score The RM Schahfer site scored 67 points. The strengths of the site are the abundant corn stover, the size of the power plants, excellent road and rail access and its proximity to the Chicago ethanol market. There is also an active farmers’ cooperative in the area that is interested in ethanol production from corn stover. The Georgia Pacific wallboard facility located at the RM Schahfer site uses gypsum in the manufacture of wallboard. The bioethanol plant will produce gypsum that is normally treated as a solid waste stream resulting in increased operating costs. The Georgia Pacific facility represents a potential market for the bioethanol plant’s gypsum byproduct and may improve the viability of bioethanol production at the RM Schahfer site. The site received no points for an existing or planned agricultural facility at the site and there is no steam or wastewater treatment available at the site.
Site Selection Criteria RM SchahferFeedstock Proximity
Achieve 70-MMgal w/stover < 50 miles 12Achieve 50-MMgal w/stover < 50 miles --Achieve 30-MMgal w/stover < 50 miles --
Power Plant SizeCoal Fired Power Plant > 800 MW 8Coal Fired Power Plant > 400 MW --Coal Fired Power Plant > 200 MW --
Relative Value of Lignin Fuel to Coal 5.9Existing Ethanol Plant/Ag Facility 0Planned Ethanol Facility 0Low-cost Steam Available 0Existing Wastewater Treatment 0Mainline Rail 10Two Mainline Rails 0Shortline Rail 0Interstate Road Access < 10 miles 5Ethanol Market < 100 miles 10Community Services < 10 miles 6Other Advantages 10Total Points 67

25
Grand Island, NE
Nebraska Public Power District Nebraska Public Power District (NPPD) is actively seeking a steam co-host, especially a large ethanol plant, for a new coal fired power plant to be built near Grand Island, Nebraska. Selecting NPPD’s Grand Island site would provide an opportunity to evaluate co-location opportunities from “the ground up” and to maximize the synergies between the two facilities. NPPD plans to build a power plant in the 400 to 600 MW range. Nebraska Public Power District is Nebraska's largest electric utility, with a chartered territory including all or parts of 91 of Nebraska's 93 counties. NPPD is a public corporation and political subdivision of the state of Nebraska. The utility is governed by an 11-member Board of Directors, who are popularly elected from NPPD's chartered territory. NPPD's revenue is mainly derived from wholesale power supply agreements with 55 towns and 25 rural public power districts and rural cooperatives who rely totally or partially on NPPD's electrical system. By the end of 2000, NPPD will also serve about 75 communities at the retail level. About 5,000 miles of transmission lines make up the NPPD electrical grid system, which delivers power to about one million Nebraskans. NPPD uses a mix of generating facilities to meet the needs of its customers. This includes a nuclear plant, three steam plants (Canaday, GGS and Sheldon), nine hydro facilities, nine diesel plants and three peaking units. NPPD also purchases electricity from the Western Area Power Administration, which is operated by the federal government. The average mix of fuel to supply NPPD's customers in a typical year is 60 percent from coal, 20 percent from nuclear, 20 percent from hydro and 0.1 percent from gas or oil. Nebraska's electric rates are well below the national average (3.57¢/kWh for industrial customers). Feedstock Proximity The Grand Island site is located in Nebraska agricultural District 50 Central – the yellow area on the Nebraska map shown here. Within District 50, corn production in 2000 was 145 million bushels. The average yield was 138 bushels per acre. At 1.2 pounds of stover per pound of corn produced, the corn stover produced is estimated to be 4.9 million tons.

26
At a conversion rate of 70 gallons of ethanol per dry ton of stover, the ethanol production potential in the District is 85 million gallons of ethanol annually. Only 25% of the available stover is assumed to be used for ethanol production. The Grand Island site can easily support 50 million gallons of annual ethanol production within 50 miles of the site. The site receives the maximum score of 12 for feedstock proximity. Power Plant Generating Capacity Nebraska Public Power District plans to build a 400 to 600 MW coal fired power plant near Grand Island, NE. The site receives a score of 6 points for generation over 400 MW. Relative Value of Lignin Fuel to Coal The average cost of coal to utility power plants in Nebraska is $0.55 per million BTUs (source: Energy Information Administration/State Electricity Profiles). The Grand Island site receives a score of 0.55/1.50*8 = 2.9 points. Existing and Planned Ethanol Plant/Ag Facility There are no existing ethanol or agricultural processing facilities at the Grand Island site. The site scores zero points for both existing and planned ethanol or agricultural processing facility at the site. Utilities Low cost steam would be available form the new co-generation power plant. Nebraska has the lowest cost coal of all the sites in the study and would, presumably, be able to provide steam at a very competitive price. Nebraska also has the lowest industrial electricity price of all the sites in the study. The Grand Island site scores 8 points for low cost steam. An existing wastewater treatment facility is not available. The site scores zero for wastewater treatment. Transportation Both the Union Pacific Railroad & BNSF Railroads serve Grand Island. The site scores 10 points for access to mainline rail and 5 points for access to a second rail line. Serving Grand Island directly are Interstate 80, U.S. Highways 30, 34 and 281 and Nebraska Highway 2, with key lateral connections to U.S. Highway 6 and Nebraska Highways 92, 14 and 11. No other community in the state of Nebraska can offer this

27
network of highways to all points in the state. The site scores 5 points for access to an interstate highway less than 10 miles away. Ethanol Market There are no large ethanol markets within 100 miles of Grand Island. The site score 0 points for access to a major ethanol market within 100 miles. Community Services All desired community services are available in Grand Island, a city of over 40,000 population. The site scores 8 points for community services. Other Advantages Very low electricity rates in Nebraska will make the ethanol plant more competitive. Combined with the anticipated low steam cost, the bioethanol facility energy costs should be very low. Designing two new facilities should result in the maximum synergies and lowest costs for each facility. Issues related to the use of lignin fuel could be addressed in the power plant design rather than in a retrofit. The Grand Island site receives 5 additional points for these advantages. Grand Island Site Score The Grand Island site scored 62 points. The strengths of the site are the abundance of corn stover in the area, two mainline rail companies and low energy costs. The Grand Island site is obviously contingent upon the plans of Nebraska Public Power to build a co-generation power plant at the site. It does afford the opportunity to evaluate the integration of ethanol with a new coal fired power plant.
Site Selection Criteria Grand IslandFeedstock Proximity
Achieve 70-MMgal w/stover < 50 miles 12Achieve 50-MMgal w/stover < 50 miles --Achieve 30-MMgal w/stover < 50 miles --
Power Plant SizeCoal Fired Power Plant > 800 MW --Coal Fired Power Plant > 400 MW 6Coal Fired Power Plant > 200 MW --
Relative Value of Lignin Fuel to Coal 2.9Existing Ethanol Plant/Ag Facility 0Planned Ethanol Facility 0Low-cost Steam Available 8Existing Wastewater Treatment 0Mainline Rail 10Two Mainline Rails 5Shortline Rail 0Interstate Road Access < 10 miles 5Ethanol Market < 100 miles 0Community Services < 10 miles 8Other Advantages 5Total Points 62

28
Nordic Energy site
Nordic Energy Power Plant Like the Grand Island site, the Nordic Energy power plant is a new coal fired power plant scheduled for start of construction by 2003. Nordic Energy, a Michigan power company, recently announced plans for an 850 MW coal fired power plant in Ashtabula Township in Northeast Ohio. Nordic Energy also plans to build an ethanol plant on the same site and use excess steam from the power plant for the ethanol plant. Construction of the ethanol plant, which will produce 80 million gallons a year, is expected to begin in 2002 and be in operation by 2003. Nordic Electric is one of the largest retail power marketers in the Midwest. Feedstock Proximity The Nordic Energy site is located in Ohio agricultural District 30 Northeast – the yellow area on the Ohio map shown here. Within District 30, corn production in 2000 was 21 million bushels. The average yield was 130 bushels per acre. At 1.2 pounds of stover per pound of corn produced, the corn stover produced is estimated to be 700,000 tons. At a conversion rate of 70 gallons of ethanol per dry ton of stover, the ethanol production potential in the District is 12 million gallons of ethanol annually. Only 25% of the available stover is assumed to be used for ethanol production. The Nordic Energy site cannot support a reasonable sized bioethanol plant due to the low corn production in the area. The site will not be considered further in this study. The lack of feedstock cannot be compensated for by other site attributes.

29
American Crystal Sugar The American Crystal Sugar site is west of the American Crystal Sugar plant located just outside of Crookston, MN. Crookston is about 25 miles southeast of Grand Forks, ND. The American Crystal Sugar plant has three 100,000 pph boilers and two are now idle due to process and plant efficiency improvements. The boilers are coal fired. The American Crystal Sugar site presents many possible opportunities to integrate a bioethanol facility with the existing sugar beet plant. The beet plant has rail siding, a wastewater treatment facility, electrical substation, and maintenance and administrative facilities. The bioethanol plant could also represent a new market for Crystal Sugars’ off spec sugar, hard molasses and beet pulp. At the right price, these materials could supplement the ethanol plant’s normal feedstock and reduce operating expenses. American Crystal Sugar is a cooperative owned by 2,300 farmers throughout northwest Minnesota and eastern North Dakota. They grow, harvest and process sugarbeets, producing 10 percent of the U.S. sugar supply. American Crystal Sugar operates five sugarbeet processing plants in the Red River Valley. American Crystal’s activities have an annual economic impact of $1.1 billion in Minnesota and eastern North Dakota communities. Feedstock Proximity The American Crystal Sugar site is located in Minnesota agricultural District 10 Northwest – the yellow area on the Minnesota map shown here. Within District 10, corn production in 2000 was 14 million bushels. The average yield was 100 bushels per acre. At 1.2 pounds of stover per pound of corn produced, the corn stover produced is estimated to be 470,000 tons. At a conversion rate of 70 gallons of ethanol per dry ton of stover, the ethanol production potential in the District is 8 million gallons of ethanol annually. Only 25% of the available stover is assumed to be used for ethanol production. The American Crystal Sugar site cannot support a reasonable sized bioethanol plant and will not be considered further in this study.
American Crystal Sugar site

30
Independence Power Plant The Entergy Independence Power Plant is located on 1,800 acres near the town of Newport, Arkansas. The site is about 80 miles west of Memphis, TN. Total nameplate capacity of the facility is 1,700 MW with two 850 MW coal-fired boilers and steam turbines. Newport, in northeast Arkansas, is a major rice growing region of the state. Rice straw would be the biomass feedstock at this site. Newport has a population of 7,500. Entergy Corporation, headquartered in New Orleans, Louisiana is a major global energy company engaged in power production, distribution operations, and related diversified services, with more than 15,000 employees.
Entergy owns, manages, or invests in power plants generating more than 30,000 MW of electricity domestically and internationally, and delivers electricity to about 2.6 million customers in portions of Arkansas, Louisiana, Mississippi, and Texas. Entergy ranks among the largest U.S. utility companies with total 2000 revenues of $10 billion, $25.5 billion in 2000 assets and more than 30,000 megawatts of plant generation capability.
Feedstock Proximity The Independence Power Plant is located in Arkansas agricultural District 30, Northeast – the yellow area on the Arkansas map shown here. Within District 30, rice production in 2000 was 65 million bushels (56 pounds per bushel). The average yield was 110 bushels per acre. At 1.2 pounds of rice straw per pound of rice produced, the rice straw produced is estimated to be 2.2 million tons. At a conversion rate of 70 gallons of ethanol per ton of rice straw, the ethanol production potential in the District is 138 million gallons of ethanol when 90% of the rice straw is used. The Independence Power Plant site can support 138 million gallons of annual ethanol production within about 50 miles of the site. The site receives a score of 12 for feedstock proximity.
Independence Power Plant

31
Power Plant Generating Capacity The Independence Power Plant has a total nameplate generation capacity of 1,700 MW. The site receives the maximum score for power plant generating capacity of 8 points. Relative Value of Lignin Fuel to Coal The average cost of coal to utility power plants in Arkansas is $1.46 per million BTUs (source: Energy Information Administration/State Electricity Profiles). The Independence Power Plant site receives a score of 1.46/1.50*8 = 7.8 points. Existing and Planned Ethanol Plant/Ag Facility There are no existing or planned ethanol or agricultural processing facilities at the Independence Power Plant site. The site scores zero points for both existing and planned ethanol or agricultural facilities at the site. Utilities The availability of steam from the power plant is unknown at this time and would require further investigation by Independence Power Plant personnel. An existing wastewater treatment facility is also not available. The site score zero for both low cost steam and wastewater treatment. Transportation Coal is delivered to the Independence Power Plant power plants via Union Pacific Railroad. The site scores 10 points for access to mainline rail. The site has good road access via state highways and the site is within 10 miles of Interstate 30. The site scores 5 points for access to Interstate 30. Ethanol Market There are no large ethanol markets within 100 miles of the Independence Power Plant site. The site score zero points for access to a major ethanol market within 100 miles. Community Services All desired community services are available within 10 miles of the Independence Power Plant. The site scores 8 points for community services. Other Advantages There are no “other” advantages of the Independence Power Plant site.

32
Independence Power Plant Site Score The Independence Power Plant site scored 51 points. The strengths of the site are the significant amount of rice straw available, the size of the power plants, excellent road and rail access and a relatively high fuel cost. There are no existing or planned agricultural facilities at the site and there is no steam or wastewater treatment available at the site.
Site Selection Criteria IndependenceFeedstock Proximity
Achieve 70-MMgal w/stover < 50 miles 12Achieve 50-MMgal w/stover < 50 miles --Achieve 30-MMgal w/stover < 50 miles --
Power Plant SizeCoal Fired Power Plant > 800 MW 8Coal Fired Power Plant > 400 MW --Coal Fired Power Plant > 200 MW --
Relative Value of Lignin Fuel to Coal 7.8Existing Ethanol Plant/Ag Facility 0Planned Ethanol Facility 0Low-cost Steam Available 0Existing Wastewater Treatment 0Mainline Rail 10Two Mainline Rails 0Shortline Rail 0Interstate Road Access < 10 miles 5Ethanol Market < 100 miles 0Community Services < 10 miles 8Other Advantages 0Total Points 51

33
Williams Bio-Energy
Williams Bio-Energy Ethanol Plant Williams Bio-Energy is the second largest producer and marketer of ethanol in the U.S. Its Pekin, Illinois wet mill facility produces approximately 100 million gallons of ethanol annually. Williams also is a majority owner of the 30 MMGPY Nebraska Energy dry mill ethanol plant in Aurora, NE. Through marketing agreements with other ethanol plants, Williams markets close to 400 million gallons of ethanol each year.
The Williams Bio-Energy plant in Pekin has its own coal-fired co-generation power plant. There are two stoker type coal fired boilers that each produce 150,000 pph of steam and a third fluidized bed boiler produces 280,000 pph of steam. Total steam production is equivalent to about 60 MW of power, although most of the steam is used for process heating in the ethanol plant rather than for electricity production. The co-generation plant has two turbine generator sets rated at 7.5 MW each. Williams produces about two-thirds of its electricity needs. Pekin is located just south of Peoria in central Illinois. Pekin has a population of about 33,000 and is 170 miles southwest of Chicago.
The average utility coal fuel cost is $1.44 per million BTUs in Illinois (source: Energy Information Administration/State Electricity Profiles. November 2001). Feedstock Proximity The Williams Bio-Energy Pekin plant is located in Illinois agricultural District 40 Central – see the yellow area on the map shown here. Illinois District 40 corn production in 2000 was 243 million bushels. The average yield was 159 bushels per acre. Using 1.2 pounds of stover per pound of corn produced, the corn stover produced in the feedstock area is estimated to be 8.2 million tons. At a conversion rate of 70 gallons of ethanol per ton of stover, the ethanol production potential for the Williams Bio-Energy Pekin site is 143 million gallons of ethanol when only 25% of the stover is used for ethanol production.

34
The Williams Bio-Energy Pekin site can easily support 50 million gallons of annual ethanol production within 50 miles of the site. The site receives the maximum score of 12 for feedstock proximity. Power Plant Size The Williams Bio-Energy Pekin plant produces 15 MW of electrical power and about 45 MW of equivalent steam power for process heating needs within the ethanol plant. The site receives a score of 0 points because the generation capacity is under 200 MW. Relative Value of Lignin Fuel to Coal The average cost of coal to utility power plants in Illinois is $1.44 per million BTUs (source: Energy Information Administration/State Electricity Profiles). The Williams Bio-Energy Pekin site receives a score of 1.44/1.50*8 = 7.7 points. Existing and Planned Ethanol Plant/Ag Facility There is a 100 MMGPY corn wet mill ethanol plant at the Pekin site. The site scores 8 points for the existing ethanol plant at the site. Utilities The Williams Bio-Energy Pekin plant provides its own process steam, but excess steam is not available. The site receives zero points for the availability of low cost steam. The Williams Bio-Energy Pekin ethanol plant has a wastewater treatment system, but it is unlikely that it will have adequate capacity for a large bioethanol plant. The site score zero for wastewater treatment. Transportation Coal is delivered to the Williams Bio-Energy Pekin plant via a Burlington Northern rail line. The site scores 10 points for access to mainline rail. A second railroad at the site is not available. The site has good road access via several state highways and Interstate 474. The site scores 5 points for access to an interstate highway less than 10 miles away. Ethanol Market The Chicago ethanol market is 170 miles to the north and the St. Louis market is about the same distance to the south. The site score 0 points for access to a major ethanol market within 100 miles.

35
Community Services All desired community services are available in Milbank, South Dakota and the surrounding area. The site scores 8 points for community services. Other Advantages Williams Bio-Energy is actively involved in the development of bioethanol production from corn gluten feed; an animal feed byproduct of the wet mill process. The Williams Bio-Energy site receives 5 points for Williams’ interest in ethanol production from biomass. Williams Bio-Energy Site Score The Williams Bio-Energy site scored 56 points. The strengths of the site are the highest concentration of corn stover of all the sites evaluated, mainline rail service, a relative high cost of coal, and the wet mill and co-generation plant at the site. The Williams Bio-Energy site suffers from a small capacity of the co-generation plant, no excess steam or wastewater treatment capacity and the nearest major ethanol market is also over 100 miles away.
Site Selection Criteria WilliamsFeedstock Proximity
Achieve 70-MMgal w/stover < 50 miles 12Achieve 50-MMgal w/stover < 50 miles --Achieve 30-MMgal w/stover < 50 miles --
Power Plant SizeCoal Fired Power Plant > 800 MW --Coal Fired Power Plant > 400 MW --Coal Fired Power Plant > 200 MW 0
Relative Value of Lignin Fuel to Coal 7.7Existing Ethanol Plant/Ag Facility 8Planned Ethanol Facility 0Low-cost Steam Available 0Existing Wastewater Treatment 0Mainline Rail 10Two Mainline Rails 0Shortline Rail 0Interstate Road Access < 10 miles 5Ethanol Market < 100 miles 0Community Services < 10 miles 8Other Advantages 5Total Points 56

36
Coors Brewery The Coors Brewery located in Golden, Colorado, is the largest brewery (on a single site) in the world producing about 20 million barrels of beer annually. The facility also produces about 75,000 tons of spent brewers grain that could be converted to ethanol with cellulosic technologies. The Coors Brewery has a 35 MW coal-fired co-generation plant that provides steam and electricity to the brewery. The brewery also has a large wastewater treatment system and an existing fuel ethanol distillation system that produces about 1 million gallons of ethanol annually. Feedstock Proximity The Coors Brewery site is located in an urban area with limited access to local agricultural residues. There is a significant amount of corn produced in eastern Colorado (about 150 million bushels annually), but the transportation distance and cost would be prohibitive to bring corn stover to the Coors site. The ethanol potential using the brewery’s spent brewers grain is only about 5 million gallons per year. The Coors Brewery site cannot support a reasonable sized bioethanol plant (10 MMGPY and larger) and will not be considered further in this study.
Coors Site

37
Tesoro Refinery The Tesoro Refinery site is located in Mandan, North Dakota. Mandan is just west of Bismarck on Interstate 94 in south central North Dakota. The refinery has its own 8 MW power plant, with low cost steam available, and a dedicated pipeline to Minneapolis that can be used to ship ethanol/gasoline blends to the Minneapolis market at a very low cost. Feedstock Proximity The Tesoro Refinery site is located in North Dakota agricultural District 80 Central – the yellow area on the North Dakota map shown below. Wheat is the primary crop in the area, but some corn is also grown in the district. Within District 80, corn production in 2000 was 4.2 million bushels. The average yield was 96 bushels per acre. At 1.2 pounds of stover per pound of corn produced, the corn stover produced is estimated to be 141,000 tons. Wheat production in District 80 was 20.6 million bushels in 2000. The average yield was 33 bushels per acre (a bushel of wheat weights 60 pounds). At 1.2 pounds of wheat straw per pound of wheat produced, the wheat straw produced is estimated to be 743,000 tons. At a conversion rate of 70 gallons of ethanol per dry ton of corn stover and wheat straw, the ethanol production potential in the District is 2.5 million gallons of ethanol from corn stover and 13 million gallons from wheat straw. Only 25% of the available stover and wheat straw is assumed to be used for ethanol production. The Tesoro Refinery site cannot support a reasonable sized bioethanol plant and will not be considered further in this study. The lack of feedstock cannot be compensated for by other site attributes.
Tesoro Refinery site

38
Preliminary Screening Results The initial scoring and analysis of the sites presented in the previous sections of this report resulted in the following site ranking:
Table 6 – Preliminary site evalaution scoring summary
The Big Stone Power Plant site in Milbank, South Dakota and the RM Schahfer Generating Station in Wheatfield, IN had the highest scores with 67 points each. The next highest score was the Coors Brewery with 66 points, but this site was eliminated from further consideration because the ethanol production potential at the site is only about 5 million gallons per year; much too small to meet the goals of this study. The proposed coal fired power plant in Grand Island, Nebraska had the next highest scores with 62 points. This is a planned coal fired power plant and presents the opportunity to study integration issues and synergies with a new coal fired power plant rather than an existing plant. The Big Stone Power Plant, RM Schahfer Generating Station and Nebraska Public Power sites were all felt to be excellent sites for the co-location study with each bringing something different to the project. To narrow the final selection down to the required two study sites, additional information as described below was gathered for the top three sites. Additional Site Information Three additional site evaluation criteria were used to select the final two sites from the three top sites. The new criteria are:
• The power plant’s willingness to work with BBI and NREL on the project • Availability of state ethanol incentives that may make bioethanol more
commercially viable in the near-term
Site Ranking Site Score1 Big Stone Power Plant, Milbank, SD 671 RM Schahfer Generating Station, Wheatfield, IN 673 Nebraska Public Power (new plant), Grand Island, NE 624 Williams BioEnergy Ethanol Plant, Pekin, IL 565 Independence Power Plant, Newport, AR 516 Duck Creek Power Station, Canton, IL 48
Inadequate Feedstock for a Large Ethanol Plant:7 Coors Brewery, Golden, CO 668 Nordic Energy Power Plant & Ethanol Plant, Northeast, OH 609 American Crystal Sugar Plant, Crookston, MN 48
10 Tesoro Refinery, Mandan, ND 45

39
• Remaining life of the power plant The results for these three criteria are shown in the following table for the Big Stone Power Plant, RM Schahfer Generating Station and Nebraska Public Power sites.
Table 7 – Additional site screening criteria Big Stone Power
Plant RM Schahfer Generating Station
Nebraska Public Power District
Location Milbank, SD Wheatfield, IN Grand Island, NE
Willing to work with us?
Broin – yes. Big Stone less than enthusiastic
Yes. Northern Indiana Power Company has an active program to bring industry to the site
Yes. Very interested in a large ethanol plant co-host
State Incentives?
Yes. 20¢/gal state producer payment of up to $1 million/year with $10 million lifetime cap per plant Plus 2¢/gal state gasoline excise tax exemption for E10
No state producer payment or state excise tax exemption for ethanol.
Yes. 18¢/gal state producer payment for new plants. Limited to 15.6 million gallons annually or $2.808 million/year for 8 years If too many plants are built, the state may not have enough funds to fully fund all payments per above formula
Remaining power plant life? (based on a 45-year plant life)
Year Commissioned & Years Remaining 1975 – 475 MW 18 years
Year Commissioned & Years Remaining 1976 – 540 MW 19 years 1979 – 556 MW 22 years 1983 – 424 MW 26 years 1986 – 424 MW 29 years
New power plant. Expected life would be 45 years

40
The revised site scoring is shown in the following table. The Nebraska Public Power District site now has the highest score with 89 points. Nebraska Public Power has expressed a strong interest to work on the project, Nebraska has a very generous state producer payment for ethanol plants and the remaining life of the power plant would far exceed the design life of the ethanol plant. RM Schahfer Generating Station has the second highest score with 87 points. The power plant and a local biomass (corn stover) cooperative have expressed a strong interest to work on the project and the remaining life of the power station exceeds the design life of the ethanol plant. Indiana currently does not have state incentives for ethanol use. The Big Stone Power Plant in South Dakota is ranked third with reduced scores for all three criteria. Big Stone management did not respond to inquiries about their willingness to work on the project, South Dakota does have state incentives for ethanol production, but only scored three points (out of ten) because of the amount of payments – approximately $10 million over the life of the project in South Dakota versus $22 million in Nebraska and $30 million in Minnesota.
Table 8 – Revised site scoring for the top three sites
Possible Points
Big Stone Power Plant
RM Schahfer Generating
Station
Nebraska Public Power
District
Previous Site Score 67 67 62
Additional Site Information
Willing to work with us 10 5 10 10
State Incentives for Ethanol (note 1) 10 3 0 7
Remaining Power Plant Life (note 2) 10 6.5 10 10
Revised Site Score 82 87 89
Notes:
(1) Up to 10 points are awarded for state producer payments totaling $30 million (MN program). South Dakota provides $10 million so Big Stone receives 10/30*10 points = 3 points. Nebraska provides $22.5 million so NPPD receives 22.5/30*10 = 7 points.
(2) 10 points are awarded if the remaining power plant life is greater than the ethanol plant life (assumed to be 20 years). The ethanol plant is assumed to be built 5 years from now, so 5 years are subtracted from the current remaining life of the power plant. Remaining life for Big Stone is 18 years so its score is (18-5)/20*10 points = 6.5 points.

41
Summary and Recommendations Ten sites were evaluated to determine which two sites would be the best sites for co-location of a bioethanol plant with an existing coal-fired power plant or coal-fired industrial boiler. Corn stover is the preferred feedstock, but rice straw, wheat straw and spent brewers grain feedstocks were also considered. The amount of feedstock available must be able to support a reasonable size bioethanol plant – 30 million gallons per year or larger. Smaller plants would not likely support DOE’s long-term goals for bioethanol production and industry growth. The Big Stone Power Plant, RM Schahfer Generating Station and Nebraska Public Power sites scored the highest in the preliminary site screening while also meeting the project’s minimum feedstock and ethanol plant size criteria. These three sites were felt to be excellent sites for the co-location study with each bringing something different to the project. To narrow the final selection down to the required two study sites, additional information about the top three sites was collected and new site scores determined. The top two sites are the Nebraska Public Power District site in Grand Island, NE and the RM Schahfer Generating Station in Wheatfield, IN. BBI recommends and NREL has concurred that the study sites will be the Nebraska and Indiana sites.

42
Feasibility Study for Bioethanol Co-Location with a Coal Fired Power Plant NREL Subcontract # ACO-2-31092-01BBI International 1 2 3 4 5 6 7 8 9 10
Site Information
Duck Creek Power Station, Canton, IL
Big Stone Power Plant, Milbank, SD
RM Schahfer Generating Station, Wheatfield, IN
Nebraska Public Power, Grand Island, NE
Nordic Energy Power Plant & Ethanol Plant Northeast, OH
American Crystal Sugar Plant in Crookston, MN
Independence Power Plant in Newport, AR
Williams BioEnergy Ethanol Plant in Pekin, IL
Coors Brewery, Golden, CO
Tesoro Refinery in Mandan, ND
Power Plant Capacity, MW 440 MW 475 2200 MW 400-600 MW 850 MW 36 (equiv) MW 842 MW 35 MW 8 MW gas firedAverage Utility Fuel Cost ($/MMBTU) $1.44 $0.94 $1.11 $0.55 $1.36 $1.10 $1.46 $1.44 $0.98 $0.73Average Industrial Electric Rate (¢/kWh) 5.02¢ 4.55¢ 3.89¢ 3.57¢ 4.33¢ 4.56¢ 4.12¢ 5.02¢ 4.38¢ 4.04¢Biomass Feedstock Corn Stover Corn Stover Corn Stover Corn Stover Corn Stover Corn Stover Rice Straw Corn Stover Spent Grain Corn StoverUSDA Agricultural District D30 West ½ SD, ½ MN D10 N. West D50 Central D30 N. East D10 N. West D30 Northeast D40 Central NA D80 South Bushels of Corn per acre in Ag District 152 136 140 138 130 100 6152 lb/acre 159 NA 96 Bushels of Corn Produced (56 lb/bushel) 164,000,000 126,500,000 125,000,000 145,000,000 21,500,000 14,000,000 65,357,143 243,000,000 NA 4,200,000 Tons of Biomass Produced 5,510,400 4,250,400 4,200,000 4,872,000 722,400 470,400 2,196,000 8,164,800 75,000 141,120 Ethanol Potential from 25% of Corn Stover or 80% of Rice Straw 96,432,000 74,382,000 73,500,000 85,260,000 12,642,000 8,232,000 138,348,000 142,884,000 5,250,000 2,469,600
Site Selection Criteria PointsFeedstock Proximity
Achieve 70-MMgal w/stover < 50 miles 12 12 12 12 12 -- -- 12 12 -- --Achieve 50-MMgal w/stover < 50 miles 8 -- -- -- -- -- -- -- -- -- --Achieve 30-MMgal w/stover < 50 miles 4 -- -- -- -- 0 0 -- -- 0 0
Power Plant SizeCoal Fired Power Plant > 800 MW 8 -- -- 8 -- 8 -- 8 -- -- --Coal Fired Power Plant > 400 MW 6 6 6 -- 6 -- -- -- -- -- --Coal Fired Power Plant > 200 MW 4 -- -- -- -- -- 0 -- 0 0 0
Relative Value of Lignin Fuel to Coal 8 7.7 5.0 5.9 2.9 7.3 5.9 7.8 7.7 5.2 3.9Existing Ethanol Plant/Ag Facility 8 0 8 0 0 0 8 0 8 8 0Planned Ethanol Facility 4 4 0 0 0 4 0 0 0 4 0Low-cost Steam Available 8 0 8 0 8 8 8 0 0 8 8Existing Wastewater Treatment 8 0 0 0 0 0 8 0 0 8 0Mainline Rail 10 10 10 10 10 10 10 10 10 10 10Two Mainline Rails 5 0 0 0 5 0 0 0 0 0 0Shortline Rail 5 0 0 0 0 0 0 0 0 0 0Interstate Road Access < 10 miles 5 0 0 5 5 5 0 5 5 5 5Ethanol Market < 100 miles 10 0 0 10 0 10 0 0 0 10 10Community Services < 10 miles 8 8 8 6 8 8 8 8 8 8 8Other Advantages 10 0 10 10 5 0 0 0 5 0 0Total Points 48 67 67 62 60 48 51 56 66 45
Additional Site InformationWilling to work on the project 10 5 10 10State Incentives for Ethanol 10 3 0 7Remaining Power Plant Life 10 6.5 10 10Revised Site Score 82 87 89
March 20, 2002

43
III. FEEDSTOCK SUPPLY Corn is the largest crop grown in the United States and it follows that corn stover is the most abundant crop residue available for conversion to ethanol. Corn stover is not harvested on a large scale, however and estimates of its availability and cost vary widely. The long-term impacts of harvesting corn stover are also not well known. The lack of an ongoing, large scale corn stover harvesting, storage and delivery operation will be a serious issue for lenders that developers of a large bioethanol project must address. Estimates of corn stover availability vary widely depending on the assumption about what fraction of stover can be collected in a sustainable manner. Some residue is required to be left in the field for protection against water and wind erosion of the soil. The amount is dependent on many factors including tillage practice, topography (especially the slope and extent of sloped land), soil type and crop rotation. Current planning for projects requiring corn stover harvest is based on a general assumption of leaving about half the stover in the field. Soil scientists suggest that, on average, this would be sufficient to maintain a high level of protection from soil erosion. The project sites selected for evaluation (see Task 2) were selected in part due to the large amount of corn stover available within a relatively short distance from the sites. Other biomass feedstocks are available in the area, but none are of sufficient quantity to impact the viability of the proposed bioethanol plants. Mixing feedstocks would also introduce unneeded risk and complexity into the project at this time. We will, therefore limit our feedstock analysis to corn stover only. The feedstock supply analysis will examine the following issues for each site:
• Corn stover supply • Delivered cost of corn stover • Potential ethanol yield from corn stover • Potential for the production of co-products • Possible competition for corn stover
Corn Stover Production and Availability Glassner et al. (1999) estimated that 200 million annual dry tons of corn stover is available and 20-60% can be sustainably harvested. Wyman and Hinman (1990) state that 58% of corn stover can be harvested on a sustainable basis. However, with current equipment and no-till farming, 76%-82% can be harvested, although 70% is the limit for commercial balers (Glassner et al. 1998). Based on these assumptions, Glassner et al. estimated the corn stover availability in the U.S. to be 153 million dry tons per year. This estimate is high because it assumes that all acreage is planted using no-till farming techniques. Kadam (2000) concludes that about 100 million dry tons per year of corn stover is available on a sustainable basis in the Midwest.

44
The two project sites to be evaluated for bioethanol production are near Wheatfield, Indiana and Grand Island, Nebraska. Nebraska and Indiana were the number three and four corn producing states in the U.S. in 2001 (USDA National Agricultural Statistics Service). Corn stover production is typically equal to the weight of corn produced, i.e. a ton of corn will yield a ton of corn stover. Farms with high corn yields (greater than 150 bushels per acre) may bring down the ratio to 0.9, while lower yields can result in a ratio of 1.1. Corn yields within 50 miles of the project site in Nebraska averaged 148 bushels per acre from 1996 through 2001. Within 50 miles of the project site in Indiana, the average yield for the past five years was 136 bushels per acre. A ratio of 1.0 will be used for the corn stover production estimates. The annual corn stover production shown in Table 9 is based on a ratio of one ton of stover produced (above ground) per ton of corn harvested.
Table 9 – Top corn producing states in the U.S.
State Corn Production (bushels/year)
Stover Production (tons/year) 1
Iowa 1,664,400,000 46,603,200 Illinois 1,649,200,000 46,177,600 Nebraska 1,014,300,000 28,400,400 Indiana 884,520,000 24,766,560 Minnesota 806,000,000 22,568,000
1) Stover production is assumed to be equal to the weight of corn produced. Stover units are short tons (2001 USDA data) The amount of corn stover that can be harvested on a sustainable basis is conservatively estimated by Walsh et al (2000) at 16.0 million annual tons for Nebraska and 11.2 million tons for Indiana. These quantities are the total quantities that can be collected after taking into consideration quantities that must be left to maintain soil quality (i.e., maintain organic matter and prevent erosion). From the stover production estimates in Table 9 and the sustainable amount of stover available per Walsh et al, we can surmise that 56% of the stover can be collected in Nebraska (16/28.4*100) and 45% of the stover produced in Indiana could be collected on a sustain able basis. We will now estimate the amount of corn stover available on a sustainable basis near the project sites in Nebraska and Indiana. The study sites, shown in the maps below, are near Wheatfield, Indiana and Grand Island, Nebraska.

45
0000 Local Corn Stover Production Corn stover production near the project sites will be estimated by determining the average annual corn production within 50 miles of the sites from 1996 through 2001 and then applying the ratios discussed in the previous section: one ton of stover produced per ton of corn produced and 56% of the stover available in Nebraska on a sustainable basis and 45% available in Indiana. 50-mile radius maps for each site are shown below and the corn production and estimated stover available in the counties within 50 miles of the sites is shown in Table 10 and Table 11.
Wheatfield, IN Site
Grand Island, NE Site

46
Figure 1 – 50-mile feedstock area for Wheatfield, IN site
Table 10 – Annual corn and corn stover production, Wheatfield, IN Site
50 miles
+ Will,Kankakee& Iroquois
counties in IL
CountyCorn Production
(bushels/year)Stover Production
(tons/year)Stover Available
(tons/year)Benton 17,270,200 483,566 217,605 Fulton 10,767,267 301,483 135,668 Jasper 20,293,567 568,220 255,699 La Porte 15,381,383 430,679 193,805 Lake 8,862,400 248,147 111,666 Marshall 11,615,583 325,236 146,356 Newton 15,163,350 424,574 191,058 Porter 8,643,650 242,022 108,910 Pulaski 14,234,733 398,573 179,358 Starke 7,604,650 212,930 95,819 White 19,594,067 548,634 246,885 Indiana Total 149,430,850 4,184,064 1,882,829
Iroquois 44,809,333 1,254,661 564,598 Kankakee 24,957,167 698,801 314,460 Will 15,798,483 442,358 199,061 Illinois Total 85,564,983 2,395,820 1,078,119
IN + IL Total 234,995,833 6,579,883 2,960,948

47
Figure 2 – 50-mile feedstock area for Grand Island, NE site
Table 11 – Annual corn and corn stover production, Grand Island, NE Site
Note: Corn production is the average annual production from 1996 through 2001. ton = short ton or 2,000 lbs
CountyCorn Production
(bushels/year)Stover Production
(tons/year)Stover Available
(tons/year)Adams 27,520,283 770,568 431,518 Buffalo 30,190,167 845,325 473,382 Clay 23,552,733 659,477 369,307 Greeley 8,914,800 249,614 139,784 Hall 29,928,417 837,996 469,278 Hamilton 35,578,283 996,192 557,867 Howard 14,049,450 393,385 220,295 Kearney 29,452,167 824,661 461,810 Nance 10,078,533 282,199 158,031 Polk 19,470,017 545,160 305,290 Sherman 9,317,867 260,900 146,104 York 35,085,400 982,391 550,139 Total 273,138,117 7,647,867 4,282,806

48
The estimated amount of corn stover available on a sustainable basis within 50 miles of the Wheatfield, Indiana site is nearly 3 million tons per year (45% of the estimated annual corn stover production). The 50-mile radius includes eleven Indiana counties and three counties to the west in Illinois as shown in Table 10. The estimated amount of corn stover available on a sustainable basis within 50 miles of the Grand Island, Nebraska site is 4.3 million tons per year (56% of the estimated annual corn stover production). The 50-mile radius includes twelve counties surrounding Grand Island as shown in Table 11. Ethanol Production Potential The amount of ethanol that could be produced from the available stover within 50 miles of each site is shown in Table 12 and Table 13. Ethanol yields of 70, 80 and 90 gallons per bone dry ton (BDT) of stover were used to determine the ethanol production potential due to the uncertainty of the ethanol yield from a commercial bioethanol plant using corn stover feedstock.
Table 12 – Annual ethanol production potential for Wheatfield, IN site
Note: corn stover moisture is assumed to be 16%
CountyStover Available
(tons/year)Ethanol Potential @
70 gal/BDTEthanol Potential @
80 gal/BDTEthanol Potential @
90 gal/BDTBenton 217,605 12,795,146 14,623,024 16,450,902 Fulton 135,668 7,977,253 9,116,860 10,256,468 Jasper 255,699 15,035,098 17,182,969 19,330,840 La Porte 193,805 11,395,759 13,023,725 14,651,691 Lake 111,666 6,565,975 7,503,971 8,441,968 Marshall 146,356 8,605,753 9,835,147 11,064,540 Newton 191,058 11,234,223 12,839,112 14,444,001 Porter 108,910 6,403,907 7,318,751 8,233,595 Pulaski 179,358 10,546,229 12,052,833 13,559,438 Starke 95,819 5,634,133 6,439,009 7,243,885 White 246,885 14,516,852 16,590,688 18,664,524 Indiana Total 1,882,829 110,710,328 126,526,089 142,341,850
Iroquois 564,598 33,198,339 37,940,959 42,683,579 Kankakee 314,460 18,490,266 21,131,732 23,773,199 Will 199,061 11,704,780 13,376,892 15,049,003 Illinois Total 1,078,119 63,393,385 72,449,583 81,505,781
IN + IL Total 2,960,948 174,103,713 198,975,672 223,847,631

49
Table 13 – Annual ethanol production potential for Grand Island, NE site
Note: corn stover moisture is assumed to be 16% The ethanol production potential based solely on the previous calculations of the amount of corn stover that can be sustainably collected within 50 miles of each site is approximately 174 million gallons per year for the Indiana site with a 70 gallon per BDT ethanol yield and nearly 224 million gallons per year with a 90 gallon per BDT yield. For the Nebraska site the corresponding ethanol production potentials are 252 and 324 million gallons of ethanol each year. Corn Stover Price Like in the corn ethanol industry, corn stover is likely to be the single largest variable operating cost for a corn stover-to-ethanol plant. The percentage of total variable costs will be lower because corn stover should be priced much lower than corn. Until a large-scale corn stover operation is implemented and operated for several years, corn stover pricing is somewhat speculative, however. Harvesting corn stover efficiently will require overcoming several challenges. Among other things, corn stover on the ground is inherently contaminated with dirt and other foreign materials; climatic and soil conditions may not allow timely field drying of stover for safe storage; and corn stover collection may compete with other crop harvesting operations. Efforts are underway to identify the most efficient ways of harvesting, drying, and transporting stover from the field to bioethanol facilities. With present practices and machinery, corn stover would likely be collected and baled separately, immediately after the corn grain harvest. Stover bales would then be stored and transported to ethanol plants in a manner similar to current handling of forage crops. As stover harvest becomes common, however, new equipment and new farming practices might allow grain and stover to be harvested simultaneously. Walsh et al (2000) describes the method of estimating the cost of collecting agricultural residues using an engineering approach. For each harvest operation, an equipment
CountyStover Available
(tons/year)Ethanol Potential @
70 gal/BDTEthanol Potential @
80 gal/BDTEthanol Potential @
80 gal/BDTAdams 431,518 25,373,261 28,998,012 32,622,764 Buffalo 473,382 27,834,851 31,811,258 35,787,665 Clay 369,307 21,715,243 24,817,421 27,919,599 Greeley 139,784 8,219,303 9,393,489 10,567,675 Hall 469,278 27,593,521 31,535,453 35,477,385 Hamilton 557,867 32,802,608 37,488,695 42,174,782 Howard 220,295 12,953,368 14,803,849 16,654,330 Kearney 461,810 27,154,426 31,033,630 34,912,834 Nance 158,031 9,292,246 10,619,710 11,947,174 Polk 305,290 17,951,044 20,515,479 23,079,914 Sherman 146,104 8,590,924 9,818,199 11,045,474 York 550,139 32,348,177 36,969,346 41,590,514 Total 4,282,806 251,828,973 287,804,541 323,780,109

50
complement is defined and using typical engineering specifications, the time per acre required to complete each operation and the cost per hour of using each piece of equipment is calculated. For corn stover, the analysis assumes one mow, one rake, one bale with a large round baler, and pickup, transport, and unloading of the bales at the side of the field where they are stored until transport to the user facility. The operations assumed are conservative – mowing might be eliminated and the raking operation is also eliminated in some circumstances. The method used by Walsh to estimate corn stover collection costs is consistent with that used by USDA to estimate the costs of producing agricultural crops. Walsh estimates that nearly 90% of all corn stover available in the U.S. can be delivered for a price between $30 and $40 per dry ton. Currently, several companies purchase corn stover to produce bedding, insulating materials, particle board, paper, and chemicals. These firms typically pay $10 to $15 per dry ton to farmers to compensate for any lost nutrient or environmental impacts that result from harvesting corn stover. The premium paid to farmers depends, in part, on transportation distance with farmers whose fields are at greater distances from the user facility receiving lower payments. Studies have estimated that the cost of transporting giant round bales of switchgrass are $5 to $10 per dry ton for haul distances of less than 50 miles (Bhat et al, 1992; Graham et al, 1996; Noon et al, 1996). Corn stover bales are of similar size, weight, and density as switchgrass bales, and a similar transportation cost is assumed. For a more detailed explanation of the methodology used to estimate agricultural residue prices, see Walsh et al, 1998. Site specific feedstock costs were estimated by comparing the corn density near the proposed project sites and adjusting the estimated bailing and transportation costs for the corn stover density. Baling cost per acre is $19.64 for corn stover according to estimates by the Nebraska Cooperative Extension. The cost includes moving the bales to the edge of the field where they may be stored until needed at the ethanol plant. Alternatively, the bales may be moved from the field edge to a satellite or central storage area. Storage of bales at the edge of the field results in the lowest storage cost as no extra loading and unloading is required. Storage at the ethanol facility would also result in lower storage costs, but more land will be required. Storage at a satellite storage area would result in the highest storage cost because the bales would have to be unloaded and then loaded at the satellite facility. BBI estimates the cost of storage from a low of zero at the edge of the field (there may be a “cost” due to bale degradation, however) to a high of $10 per ton at a remote satellite facility where additional bail handling is required. We have assumed a cost of $5 per ton for storage of corn stover bales. Average corn yields per acre within 50 miles of the sites from 1996 through 2001 was 148 bushels per acre in Nebraska and 136 bushels per acre in Indiana (USDA data). Using the percent of stover available on a sustainable basis estimated earlier (56% in Nebraska and 45% in Indiana) results in 2.32 tons per acre of stover collected at the Nebraska site and 1.71 tons per acre at the Indiana site.

51
Corn stover is expected to be harvested immediately following the corn harvest. Custom harvesters are expected to do most of the bailing and corn stover transportation. Stover bale weight will impact transportation costs with more dense bales desirable. We have assumed large round bales will be produced with an average weight of 1,200 pounds each. Transportation is envisioned to be similar to the Harlan, Iowa corn stover project where 17 bales per truck were transported to a central storage area. The Nebraska Cooperative Extension estimates stover transportation costs to be $2.50 per mile per load for a minimum of 10 miles. The average transportation distance to supply 2,000 BDT of stover per day to a bioethanol plant is 20 miles for the Nebraska site and 24 miles for the Indiana site. In calculating the average transportation distance we have assumed that only half of the corn acres are available for corn stover collection and the corn stover is collected from the remaining acres closest to the plant. And finally, the Nebraska Cooperative Extension estimates the value of the soil nutrients removed from the field at $9.59 per ton of stover removed. We have assumed a payment to growers of $10 per ton. The costs of harvesting, storage and delivering corn stover to the two project sites are summarized in Table 14.
Table 14 – Corn stover harvesting and deliver costs
Grand
Island, NE Wheatfield,
IN Corn yield per acre (bu) 148 136 Stover yield per acre (tons/acre) 4.144 3.808 % Stover baled 56% 45% Stover collection per acre (tons/acre) 2.32 1.71
Stover bale weight (lbs.) 1,200
1,200 Bales per truck 17 17 Tons stover per truck (tons/truck) 10.2 10.2 Stover transportation cost per mile ($/mile) $2.50 $2.50 Stover transportation cost/mile/ton ($/mile/ton) $0.245 $0.245 Baling and moving bales off field ($/acre) $19.64 $19.64 Baling and moving bales off field ($/ton) $8.46 $11.46 Average transportation distance (miles) 20.3 24.4 Transportation cost ($/ton) $4.98 $5.98 Stover storage cost ($/ton) $5.00 $5.00 Payment to growers ($/ton) $10.00 $10.00 Total delivered cost ($/ton) $28.44 $32.44 Corn stover moisture (%) 16% 16% Total delivered cost - dry basis ($/BDT) $33.86 $38.62

52
The estimated cost to deliver corn stover to the Grand Island, Nebraska site is $33.86 per BDT, and the estimated cost at the Wheatfield, Indiana site is $38.62. The lower corn yield per acre in Indiana and the requirement to leave more corn stover in the field, results in higher bailing costs per ton of stover and the stover must be collected over a greater distance resulting in higher transportation costs for Indiana. Initially the price for corn stover could be higher, but it is believed by many that the delivered cost will come down as the practice of corn stover collection becomes more efficient. Corn stover prices from $25 to $45 per delivered BDT will be evaluated in the financial section of this report. Competition for Corn Stover Sources of competition for corn stover that could potentially create significant increased demand and drive up the price for corn stover are nonexistent in the project areas. There is so much corn stover available in these areas that increased prices due to competition are difficult to envision. Pulp and paper production and electricity are perhaps the only two existing markets that could create a sizable demand for corn stover. The production of certain commodity chemicals from corn stover could also create a large local demand. All of these applications using corn stover feedstock are conceptual at this time and predicting the impact on local corn stover pricing would be highly speculative. Competition for corn stover will be avoided in the same manner as in the current corn ethanol industry: ethanol plants are not sited near other ethanol plants where they will create a large increase in the local corn price. This is not good business for the ethanol plant. It is well known that creating a large local demand for corn will drive up the local price of corn so project developers look for sites with a large excess of corn. Plants that use corn stover will not be located next to other users of corn stover because both business will suffer due to higher corn stover prices. Lenders usually will not fund the “second” project within a limited distance of another project that uses the same feedstock when other sites without local feedstock competition are available. The bioethanol plant itself will create the greatest risk related to feedstock competition. Unless the bioethanol plant has a secondary or backup feedstock, it will be 100% dependant on corn stover supply and the plant may find itself at the mercy of the feedstock suppliers and corn growers. This will be a key issue for lenders. Long-term contracts for the corn stover can help to mitigate this risk, but contracts can be broken. Another option that would help would be for the owners of the corn stover, i.e. farmers, to have a majority ownership of the bioethanol facility. It would then be in their best interest to make sure the plant always had an adequate supply of corn stover at a reasonable price. Finally the only other possible source of serious competition for corn stover would be the loss of corn acreage to another crop or another use. Conversion of #2 yellow corn to silage is one example. Silage requires the removal of the most of the corn plant and there would be little stover available. The National Corn Growers Association is predicting an

53
increase in the number of corn acres in the future, however, driven primarily by the demand for fuel ethanol so this is not a likely scenario. Potential for Co-Products When using the dilute acid pretreatment/enzymatic hydrolysis process for producing ethanol from corn stover, the potential co-products include lignin residue, gypsum and carbon dioxide. Production of other co-products would require potentially major process changes to the basic process under development by NREL and used for this study. Production of co-products such as pulp, furfural and other products has been evaluated extensively by NREL and others and are beyond the scope of this study. The quality and heating value of the lignin residue will impact is value and desirability as a boiler fuel. For example, if the residue contains significant amounts of sulfur (from the dilute acid pretreatment of corn stover), its value may be diminished as a boiler fuel. An alternative use for the lignin residue may be a fertilizer for local fields. The value of the lignin residue as fertilizer is unknown and extensive field tests would be required to estimate its value. BBI has assumed that the residue will be used as boiler fuel because this is believed to be the most likely near-term use for the lignin. The neutralization of sulfuric acid with lime in the proposed bioethanol process creates a gypsum by-product stream. A high quality gypsum (>90% purity) would have value at the Wheatfield, Indiana site where there is a gypsum wallboard manufacturing facility. The quality of the gypsum by-product is expected to fall far short of the minimum quality required by the wallboard facility, however. Another possible use for the gypsum is as a soil conditioner. Assigning a value to the gypsum without extensive field tests would be speculative, however. A conservative approach to determining the feasibility of the two proposed ethanol facilities would be to assume that the gypsum is land filled at a cost rather than as a source of revenue. The production of ethanol by yeast creates a carbon dioxide by-product. Currently in the U.S., about one third of fermentation carbon dioxide (CO2) produced from ethanol plants is captured and two thirds is vented to the atmosphere. The carbon dioxide captured is in most cases from very large ethanol plants. Capture of CO2 from medium sized and smaller plants is usually not justified unless special market conditions are present. If justified the ethanol plant can easily capture raw carbon dioxide. However, it must be processed further if it is to be used for commercial purposes. Dry ice and liquid carbon dioxide are principally used as expendable refrigerants in the food industry. Carbon dioxide, whether solid, liquid, or gaseous, is recognized as safe for use in foods. Food applications include:
• Beef, pork, and poultry slaughter operations • Frozen food storage and transportation • Supplemental cooling for refrigerated products • Meat, sausage and bakery processing

54
• Airline catering • Gift food packaging • Carbonation of beverages
Non-food applications include:
• Various chemical processes • Dermatologists • Blood banks • Pharmaceutical manufacturing • Shrink fitting • Cryogenic blasting • pH control
A CO2 processing company would prefer to use high pressure CO2 rather than liquid CO2 since it reduces the capital costs for equipment and processing costs. Typically, a CO2
processing company will construct a processing facility next to the ethanol plant. The raw CO2 is then piped to the processing facility for finishing. In order for the processing facility to be economically viable, there must be a close market for the finished CO2. Packing plants, soft drink bottlers, food processors, are just a few of the numerous users of fermentation CO2. The opportunity to capture carbon dioxide should not be included in the economics of determining the viability of a plant, but rather regarded as potential incremental revenue unless there is a market or an existing CO2 plant. Revenue from CO2 sales is normally between $7.00 and $10.00 per ton of CO2 (2 to 3 ¢/gallon of ethanol). BOC Gases, the largest CO2 producer in the U.S., purchases the CO2 from the New Energy ethanol plant in South Bend, Indiana, and would not be interested in the CO2 from an ethanol plant located near Wheatfield, IN. Air Gas (Bruce Warner) has expressed interest in purchasing the project’s CO2 for $10 per ton. The sale of CO2 will not be included in the economic analysis, however because there are other ethanol projects proposed for the Wheatfield area that would likely capture the remaining CO2 demand long before a corn stover bioethanol plant is built. Nebraska has eight operating ethanol plants with a combined annual capacity of 400 million gallons of ethanol. The CO2 market in the state is very small and there is a significant over supply of CO2 in the region.

55
Conclusions for Feedstock
Feedstock Supply There is sufficient production of corn and therefore, corn stover near the Indiana site to easily supply bioethanol plants from 30 to 70 million gallons in annual capacity. A 30 million gallon per year plant at the Wheatfield, IN site would use just 17% of the stover available on a sustainable basis within 50 miles of the site (assuming 70 gallons of ethanol are produced from each BDT of stover). A 70 MMGPY plant would use 40% of the stover available within 50 miles of the plant. “Available” stover in Indiana is assumed to be 45% of the stover that is produced; 55% is left in the field for erosion control. Significantly more corn is grown in the area surrounding the Grand Island, Nebraska site. A 30 million gallon per year plant at the Grand Island site would use 12% of the stover available on a sustainable basis within 50 miles of the site (assuming 70 gallons of ethanol are produced from each BDT of stover). A 70 MMGPY plant would use 28% of the stover available within 50 miles of the plant. “Available” stover for the Nebraska site is assumed to be 56% of the stover that is produced; only 44% is left in the field. At this time there is little, if any, competition for corn stover in the Midwest. Potential competing uses include animal feed, animal bedding, boiler fuel, production of other liquid fuels, composite products (particleboard), pulp and paper and chemicals. Kadam (2000) concludes that only a small portion of the available stover could be used for other purposes. The projected near-term demand for non-ethanol use is less than 10% of the total available corn stover. Pulp and paper, strawboard, and chemicals are the only possible end uses that may demand corn stover in any significant quantity in the future. Another industrial plant that uses a large quantity of corn stover would not likely locate near another large user of corn stover. The corn stover price for both facilities may increase, creating a lose-lose situation for both facilities.
Pricing The estimated cost to deliver corn stover to the Grand Island, Nebraska site is $33.86 per BDT, and the estimated cost at the Wheatfield, Indiana site is $38.62. The lower corn yield per acre in Indiana and the requirement to leave more corn stover in the field, results in higher bailing costs per ton of stover and the stover must be collected over a greater distance resulting in higher transportation costs for Indiana.
Risk Corn stover is currently not harvested on the scale required for a large ethanol plant and the long-term impacts of harvesting corn stover are also not well known. The lack of an ongoing, large scale corn stover harvesting, storage and delivery operation will be a serious issue for lenders that project developers must address.

56
References
1. Bhat, M.B., English, B.C., and Ojo, M., “Regional Costs of Transporting Biomass Feedstocks”, Liquid Fuels From Renewable Resources, John S. Cundiff (ed.), American Society of Agricultural Engineers, St. Joseph, MI, December 1992.
2. Brown, R. C. 1994. “The Potential for Biomass Production and Conversion in Iowa: Final Report.” Iowa Energy Center, Des Moines, IA.
3. DiPardo, J. 2000. “Outlook for Biomass Ethanol Production and Demand.” Energy Information Administration (EIA), Washington, DC.
4. Glassner, D.; Hettenhaus, J. 1997. “Enzyme Hydrolysis of Cellulose: Short-Term Commercialization Prospects for Conversion of Lignocellulosics to Ethanol.” Report to the Biofuels Program, National Renewable Energy Laboratory, Golden, CO.
5. Glassner, D., J. Hettenhaus, and T. Schechinger. 1998. Corn stover collection project—a pilot for establishing infrastructure for agricultural residue and other crop collection for biomass processing to ethanol. Proc. Bioenergy 1998 Conference, October 4-8, 1998, Madison, WI.
6. Glassner, D., J. Hettenhaus, and T. Schechinger. 1999. Corn stover potential: recasting the corn sweetener industry. In: J. Janick (ed.), Perspectives on New Crops and New Uses. ASHS Press, Alexandria, VA, pp. 74–82.
7. Gogerty, R. 1996. Crop Leftovers: More Uses, More Value. Resource: Engineering & Technology for a Sustainable World, 3(7), 6-9.
8. Graham, R.L., Liu, W., Jager, H.I., English, B.C., Noon, C.E., and Daly, M.J., “A Regional-Scale GIS-Based Modeling System for Evaluating the Potential Costs and Supplies of Biomass From Biomass Crops.” Proceedings of Bioenergy '96 - The Seventh National Bioenergy Conference, Nashville, TN, September 15-20, 1996, Southeastern Regional Biomass Energy Program, pp. 444-450, 1996.
9. Iowa State Univ. 1993. “Corn StoverA Low Cost Alternative for Flood-Shortened Feed Supplies.” University Extension, Iowa State Univ., Ames, IA.
10. Kadam, K. 2000. “Validation of Corn Stover Availability Assumptions for the Near-term Economic Large Volume Bioethanol Project” Technical Memo, National Renewable Energy Laboratory, Golden, CO.
11. Kadam, K. 2000. “Potential Applications of Corn Stover” Technical Memo, National Renewable Energy Laboratory, Golden, CO.
12. Noon, C.E., Daly, M.J., Graham, R.L., and Zahn, F.B., “Transportation and Site Location Analysis for Regional Integrated Biomass Assessment (RIBA).” Proceedings of Bioenergy '96 - The Seventh National Bioenergy Conference, Nashville, TN, September 15-20, 1996, Southeastern Regional Biomass Energy Program, pp. 487-493, 1996.
13. USDA. 2001 Crop Production. National Agricultural Statistical Service, U.S. Department of Agriculture (USDA), Washington, DC.
14. Walsh, M. E., Perlack, R. L., Turhollow, A., de la Torre Ugarte, D., Becker, D. A., Graham, R. L., Slinsky, S. E., and Ray, D. E. January, 2000. “Biomass Feedstock Availability in the United States: 1999 State Level Analysis.” Oak Ridge National Laboratory, Oak Ridge, TN.

57
15. Walsh, M.E., Perlack, R.L., Becker, D.A., Turhollow, A., and Graham, R.L., “Evolution of the Fuel Ethanol Industry: Feedstock Availability and Price”, Oak Ridge National Laboratory, Oak Ridge, TN, April 21, 1998.
16. Wyman, C. E. and Hinman, N. D. 1990. “Ethanol: Fundamentals of production from renewable feedstocks and use as a transportation fuel.” Appl. Biochem. Biotechnol., 24/25, 735.

58
IV. DESIGN AND COST ESTIMATES This section of the report presents an analysis of the projected capital cost estimates for 30, 50 and 70 million gallon per year ethanol plants co-located with coal-fired power plants. The two sites considered in this analysis are in Wheatfield, Indiana and Grand Island, Nebraska. With respect to the overall design of this facility and the two sites analyzed during this processes, there were two primary assumptions incorporated. First, when considering the Wheatfield site, the ethanol plant is to be co-located with the existing RM Schahfer Generating station, which does not have sufficient steam capacity to support the new ethanol plant. As a result a conventional natural gas fired boiler system was incorporated into the overall plant design and cost estimate at the Wheatfield site. At the Grand Island, NE site the ethanol plant is to be co-located with a new coal fired power plant, which can be designed with sufficient steam capacity to supply the ethanol plant; however due to the extended shutdown periods required by coal fired power plants, a stand-by conventional boiler system was also included into the Grand Island capital estimate. It is not unusual for a power plant boiler to be down six to eight weeks each year, while a properly operated and maintained ethanol plant should be down no more than about two weeks out of the year. Because both ethanol plants are assumed to have a natural gas boiler, the capital costs at each site were estimated based on the same plant design and layout. With respect to the natural gas boiler systems, actual cost estimates were obtained from Victory Energy a supplier of energy systems. These estimates were incorporated in the actual equipment cost numbers for this estimate. In performing this analysis, the capital cost estimates were based on data compiled by BBI for the development and construction of seven conventional dry milling ethanol plants of similar capacities. When reviewing the cellulosic plant design, it can be seen that with the exception of the Pretreatment and Conditioning processes for the cellulosic process, the overall plant designs are very similar. The Pretreatment and Conditioning processes are more like the front end of a wet mill so wet mill equipment installation cost factors were used for estimating the installed cost of the Pretreatment and Conditioning process equipment. The project development costs (owner’s costs or soft costs) for a cellulosic plant were judged to be very similar to a dry mill plant and the typical dry mill soft costs were used to estimate the total project costs for the cellulosic plants. Ethanol plant sizes of 30, 50 and 70 million gallons per year (MMGPY) of anhydrous ethanol production match today’s industry norms and were modeled to determine the impact of plant size on project costs. Bioethanol plant capital cost estimates were provided by NREL and the NREL equipment costs were used in the analysis as the basis for the BBI cost estimates.

59
Plant Process Overview The process being analyzed here can be described as using co-current dilute acid prehydrolysis of the lignocellulosic biomass with enzymatic saccharification of the remaining cellulose and co-fermentation of the resulting glucose and xylose to ethanol. The process design also includes feedstock handling and storage, ethanol distillation and dehydration, wastewater treatment, product storage and all other required utilities. A lignin boiler is not included in the design, as the lignin residue is assumed to be sold to the coal fired power plant. A primary or backup natural gas fired boiler is included in the design, however. In all, the process is divided into eight areas (see Figure 3). The feedstock, in this case corn stover, is delivered to the feed handling area (A100) for storage and size reduction. From there the stover is conveyed to pretreatment and detoxification (A200). In this area, the biomass is treated with dilute sulfuric acid catalyst at a high temperature for a short time, liberating the hemicellulose sugars and other compounds. Separation with washing removes the sugars and acid from the solids for neutralization. Overliming of the liquid stream is required to remove compounds liberated in the pretreatment that are toxic to the fermenting organism. Enzymatic hydrolysis (or saccharification) coupled with co-fermentation (A300) of the detoxified hydrolyzate slurry is carried out in continuous hydrolysis tanks and anaerobic fermentation tanks in series. A purchased cellulase enzyme preparation is added to the hydrolyzate in the hydrolysis tanks that are maintained at a temperature to optimize the enzyme’s activity. The fermenting organism, Zymomonas mobilis, is first grown in a series of progressively larger batch anaerobic fermentations to make enough cells to inoculate the main fermenters. The inoculum, along with other nutrients, is added to the first ethanol fermenter along with the partially saccharified slurry at a reduced temperature. The cellulose will continue to be hydrolyzed, although at a slower rate, at the lower temperature. After several days of separate and combined saccharification and co-fermentation, most of the cellulose and xylose will have been converted to ethanol. The resulting beer is sent to product recovery. Product recovery (A500) involves distilling the beer to separate the ethanol from the water and residual solids. A mixture of nearly azeotropic water and ethanol is purified to pure ethanol using vapor-phase molecular sieves. Solids from the distillation bottoms are separated, dewatered and shipped as wet cake to the power plant. Concentration of the distillation bottoms liquid is performed by evaporation. The evaporated condensate is returned to the process and the concentrated syrup is sent to the power plant. Part of the evaporator condensate, along with other wastewater, is treated by anaerobic and aerobic digestion (A600). The biogas (high in methane) from anaerobic digestion is sent to the combustor for energy recovery. The treated water is suitable for recycling and is returned to the process.

60
Corn Stover Feedstock Area 100 Feedstock Receiving, Storage and Handling
Area 200 Pretreatment & Conditioning
Area 300 Saccharification &Fermentation
Area 900 Plant Utilities (Boiler, Cooling Water, Etc.)
Area 500 Distillation, Dehydration and Evaporation
Area 600 Waste Treatment
Area 700 (Ethanol Storage/Loadout, yard sys., etc.)
FFuueell EEtthhaannooll
SSoolliidd RReessiidduuee ((LLiiggnniinn ccaakkee))
SSyyrruupp
MMeetthhaannee RReeccyyccllee PPrroocceessss HH22OO
Figure 3 – Bioethanol Block Flow Diagram

61
Plant Capital Cost Analysis As stated above, three separate plant capacities were analyzed with respect to projected capital cost. These capacities were 30, 50 and 70 million gallon per year. For this analysis, NREL supplied a complete plant equipment listing which included the size, material of construction, number of units required and pricing data for each piece of equipment. The capital cost estimates provided in this section were generated using the NREL equipment list and pricing data as the basis. BBI assigned equipment installation factors to the equipment costs to arrive at the installed cost. The equipment installation factors are derived from actual costs for corn ethanol dry mills. The equipment specific to the Pretreatment and Conditioning processes were identified and analyzed separately due to the abnormally high cost associated with them. This equipment was given a separate set of equipment installation factors in the cost estimate, which are more in line with the type of equipment and that of a wet mill type facility. With respect to the estimates generated in this analysis, data obtained from various dry mill plant installations was used to develop a set of specific equipment installation factors for each element of project development and construction. The estimate was divided into three parts:
• Capital Investment Hard Cost Allocation • Capital Investment Soft Cost Allocation • Total Capital Investment Cost Allocation
The “Capital Investment Hard Cost Allocation,” is the cost associated with constructing the ethanol plant and includes costs such as equipment costs, mechanical installation, electrical installation and various other construction costs. “Capital Investment Soft Cost Allocation” is the cost associated with the ethanol plant owner’s project expense that would be capitalized once the project is transferred to operations. Some line items included in the Soft Cost Allocation are financing and project development costs, owner’s project administration expenses, owner’s supplied construction assets (land), pre-startup operations expenses and beginning inventories. The “Total Capital Investment Cost Allocation” is the summation of the hard and soft costs described above giving a total project capital investment figure. Table 21, Table 22 and Table 23 at the end of this section show the breakdown of the hard and soft costs. Each of the line items included within each cost area was assigned an installation factor that was developed from cost data for recently constructed ethanol dry mill projects. Table 15 presents a summary of the results of this process.

62
Table 15 – Capital Cost Summary
Capital Investment Summary Plant Capacity 30MMGPY 50MMGPY 70MMGPY
Capital Hard Cost Investment $ 65,521,275 $ 92,403,780 $ 116,581,752 Capital Soft Cost Investment $ 7,280,142 $ 12,600,516 $ 18,978,425 Total Capital Cost Investment $ 72,801,417 $ 105,004,296 $ 135,560,177
To continue this analysis, NREL supplied a set of project capital cost estimates for each of the stated ethanol plant capacities. These cost estimates were developed by utilizing the equipment pricing data and various construction multipliers to generate each of the cost estimates. Each estimate was again divided into three parts for analysis. In the Table 16, which compares the construction hard cost investment, there is an average 33% variance between the BBI and NREL estimates. This difference is largely due to the difference in the construction multipliers. The NREL construction multipliers are based on a composite of construction projects that may or may not be related to this type of installation whereas the estimates developed by BBI use multipliers from data from dry and wet mill ethanol projects, which incorporate similar equipment.
Table 16 – Capital Hard Cost Investment Summary Analysis
Capital Hard Cost Investment Summary Plant Capacity 30MMGPY 50MMGPY 70MMGPY
Conventional Hard Cost Factors $ 65,521,275 $ 92,403,780 $ 116,581,752 NREL Hard Cost Factors $ 49,464,986 $ 69,469,877 $ 86,894,816 Variance 32.5% 33.0% 34.2%
In Table 17, which is a comparison of the project soft cost investment, there is again a large differential between the BBI and NREL soft cost estimates; however, in this case the order is reversed. The NREL soft cost estimates average 71% higher than those figures generated in the BBI analysis. Again, the BBI analysis is based on historical dry mill ethanol project data.

63
Table 17 – Capital Soft Cost Investment Summary Analysis
Capital Soft Cost Investment Summary Plant Capacity 30MMGPY 50MMGPY 70MMGPY
Conventional Soft Cost Factors $ 7,280,142 $ 12,600,516 $ 18,978,425 NREL Soft Cost Factors $ 31,064,011 $ 43,627,083 $ 54,569,945 Variance -76.6% -71.1% -65.2%
In Table 18, which is a comparison of the project total cost investment, the two estimates fall within the range of 10% differential with this estimate averaging a lower total capital investment cost. Based on these figures, it can be concluded that both methods of project estimating present an estimate within the range of plus/minus 20% of the actual project cost. However, the distribution of those funds does differ greatly and should be continually reviewed as the project is developed.
Table 18 – Total Capital Cost Investment Summary Analysis
Total Capital Cost Investment Summary Plant Capacity 30MMGPY 50MMGPY 70MMGPY
Conventional Cost Factors $ 72,801,417 $ 105,004,296 $ 135,560,177 NREL Cost Factors $ 80,528,998 $ 113,096,960 $ 141,464,761 Variance -9.6% -7.2% -4.2%
The ethanol industry has seen a major decline in the project capital investment per gallon of production for dry mill plants over the past 15 years. In Table 19, the conventional dry milling ethanol production facility average investment cost per gallon is compared to the estimated corn stover ethanol plant capital cost per gallon presented here.
Table 19 – Capital Investment per Gallon Produced Summary Analysis
Capital Investment per Gallon Produced Plant Capacity 30MMGPY 50MMGPY 70MMGPY
Conventional Dry Mill Facility $ 1.62 $ 1.47 $ 1.38 Bioethanol Facility $ 2.43 $ 2.10 $ 1.94
As demonstrated in the table above the corn stover bioethanol facility has a capital investment cost that averages approximately 44% higher than that of a conventional corn

64
dry milling facility. This factor will play a major role in determining the viability of this type of facility. To better understand the basis for this difference, a detailed review of each estimate was preformed. During that review one major component was found to be the driving force for the higher capital cost of the bioethanol facility. In Table 20, the corn stover plant equipment cost is compared to the conventional dry milling equipment cost. The estimated equipment cost for the cellulosic facility runs on average 56% higher than that of the conventional dry mill process.
Table 20 – Conventional Equipment Capital Cost Analysis
Conventional Equipment Capital Cost Analysis Plant Capacity 30MMGPY 50MMGPY 70MMGPY
Conventional Dry Mill Facility $9,750,054 $ 16,250,090 $ 22,750,126 Bioethanol Facility $ 17,241,658 $ 24,788,065 $ 31,840,279 Variance 76.8% 52.5% 40.0%
The reason for the higher corn stover plant equipment cost is the dilute acid/enzymatic ethanol process itself. The average alcohol concentration in the fermentation process in the bioethanol process is approximately 7% by volume, whereas the average alcohol concentration in a corn dry mill ethanol plant is about 14%. With the additional water in the bioethanol process, the number of pieces equipment and the size of the equipment are directly impacted resulting in higher capital cost not just for the equipment but for the construction as a whole through increased quantities of concrete, steel, piping, instrumentation, etc. The capital cost of the bioethanol process can be reduced by additional research and process improvements that decrease the amount of water carried into the fermentation and distillation process areas. Details of the BBI capital cost estimates presented in this section for the corn stover ethanol process are presented in the following tables.

65
Table 21 – 30 Million Gallons per Year Capacity Cost Projection Project Name NREL Bioethanol Co-Location Project Project Location Indiana & Nebraska Sites Plant Design Capacity 30,000,000
Capital Investment Hard Cost Allocation – 30 MMGPY Conventional Equipment Calculations Installed Cost Installation Factor
Major Equipment & Field Tanks $11,581,203 40.0% Equipment Freight & Handling $289,530 1.0% Instrumentation & Controls $781,731 2.7% Electrical $2,229,381 7.7% Protective Coverings $289,530 1.0% Mechanical $3,011,113 10.4% Steel Structures $810,684 2.8% Concrete $1,505,556 5.2% Buildings $984,402 3.4% Civil/Site $1,273,932 4.4% Equipment Rental/Consumables $376,389 1.3%
Subtotal Construction $23,133,452 80% Construction Contingency $2,026,710 7.0%
Total Construction Cost $25,160,163 87% Process Licensing Fees $347,436 1.2% Detailed Engineering $1,737,180 6.0% DCS Engineering $57,906 0.2% Procurement Services $57,906 0.2% Construction Management $868,590 3.0% Field Expenses $173,718 0.6% EPC Fees $550,107 1.9%
Subtotal Project Services $3,792,844 13% Total Conventional Equipment EPC Cost $28,953,006 100.0% Pretreatment and Conditioning Equipment Calculations
Major Equipment & Field Tanks $16,090,038 44.0% Equipment Freight & Handling $365,683 1.0% Instrumentation & Controls $2,194,096 6.0% Electrical $2,925,461 8.0% Protective Coverings $731,365 2.0% Mechanical $5,485,240 15.0% CSA $1,023,912 2.8%
Subtotal Construction $28,815,796 79% Construction Contingency $2,559,779 7.0%
Total Construction Cost $36,568,269 86% Process Licensing Fees $347,436 1.2% Detailed Engineering $1,737,180 6.0% DCS Engineering $57,906 0.2% Procurement Services $57,906 0.2% Construction Management $868,590 3.0% Field Expenses $463,248 1.6% EPC Fees $579,060 2.0%
Subtotal Project Services $4,111,327 14% Total Pretreatment & Conditioning EPC Cost $36,568,269 100.0%

66
Capital Investment Soft Cost Allocation – 30 MMGPY Financing and Development Cost
Legal, document preparation, etc. $749,355 10.3% Bank legal $129,195 1.8% Other due diligence $79,523 1.1% Consultants $519,961 7.1% Closing - legal and misc. closing costs $22,328 0.3% Title insurance & recording fees $48,937 0.7%
Subtotal $1,549,300 21.3% Owner's Project Admin Expenses (capitalized)
Preliminary permitting and site design $61,172 0.8% Site office $83,805 1.2% Owner utilities allowance $58,725 0.8% Owners project manager & bank's engineer $207,984 2.9% Legal and accounting $42,820 0.6% Travel $39,762 0.5% Insurance - liability, workman's comp. $21,410 0.3% Builders risk insurance $69,736 1.0% Project construction interest $1,340,887 18.4% Project construction commitment fee $654,539 9.0% Directors fee's and travel expenses $67,289 0.9%
Subtotal $2,648,129 36.4% Owner Supplied Construction & Assets
Owners discretionary project cost $526,231 7.2% Land $152,930 2.1% Spare parts inventory, hand tools $214,101 2.9% Vehicles, forklift & maintenance equipment $94,816 1.3% Office equipment $91,758 1.3% Prepaid insurance premium $137,637 1.9% Sales tax $30,586 0.4%
Subtotal $1,248,059 17.1% Pre-startup operations - capitalized expenses
Plant management $433,097 5.9% Other staff $238,570 3.3% Operations training contract $122,344 1.7% Utilities, telephone, travel, supplies & misc. $30,586 0.4% Plant utilities - miscellaneous startup prep $348,680 4.8%
Subtotal $1,173,276 16.1% Beginning Inventories
Corn Stover $469,800 6.5% Chemicals $137,961 1.9% Denaturant $53,617 0.7%
Subtotal $661,378 9.1% Total Capital Investment Soft Cost $7,280,142 100%
Capital Investment Summary – 30 MMGPY Total Project EPC Cost (Hard Cost Allocation) $65,521,275 90% Total Capital Investment Soft Cost $7,280,142 10%
Total Capital Investment Cost $72,801,417 100% Capital Investment per Gallon $2.43

67
Table 22 – 50 Million Gallons per Year Capacity Cost Projection
Project Name NREL Bioethanol Co-Location Project Project Location Indiana & Nebraska Sites Plant Design Capacity 50,000,000
Capital Investment Hard Cost Allocation Conventional Equipment Calculations Installed Cost Installation Factor
Major Equipment & Field Tanks $16,958,161 40.0% Equipment Freight & Handling $423,954 1.0% Instrumentation & Controls $1,144,676 2.7% Electrical $3,264,446 7.7% Protective Coverings $423,954 1.0% Mechanical $4,409,122 10.4% Steel Structures $1,187,071 2.8% Concrete $2,204,561 5.2% Buildings $1,441,444 3.4% Civil/Site $1,865,398 4.4% Equipment Rental/Consumables $551,140 1.3%
Subtotal Construction $33,873,926 80% Construction Contingency $2,967,678 7.0%
Total Construction Cost $36,841,604 87% Process Licensing Fees $508,745 1.2% Detailed Engineering $2,543,724 6.0% DCS Engineering $84,791 0.2% Procurement Services $84,791 0.2% Construction Management $1,271,862 3.0% Field Expenses $254,372 0.6% EPC Fees $805,513 1.9%
Subtotal Project Services $5,553,798 13% Total Conventional Equipment EPC Cost $42,395,401 100.0% Pretreatment and Conditioning Equipment Calculations
Major Equipment & Field Tanks $22,003,687 44.0% Equipment Freight & Handling $500,084 1.0% Instrumentation & Controls $3,000,503 6.0% Electrical $4,000,670 8.0% Protective Coverings $1,000,168 2.0% Mechanical $7,501,257 15.0% CSA $1,400,235 2.8%
Subtotal Construction $39,406,603 79% Construction Contingency $3,500,587 7.0%
Total Construction Cost $42,907,189 86% Process Licensing Fees $600,101 1.2% Detailed Engineering $3,000,503 6.0% DCS Engineering $100,017 0.2% Procurement Services $100,017 0.2% Construction Management $1,500,251 3.0% Field Expenses $800,134 1.6% EPC Fees $1,000,168 2.0%
Subtotal Project Services $7,101,190 14% Total Pretreatment & Conditioning EPC Cost $50,008,379 100.0%
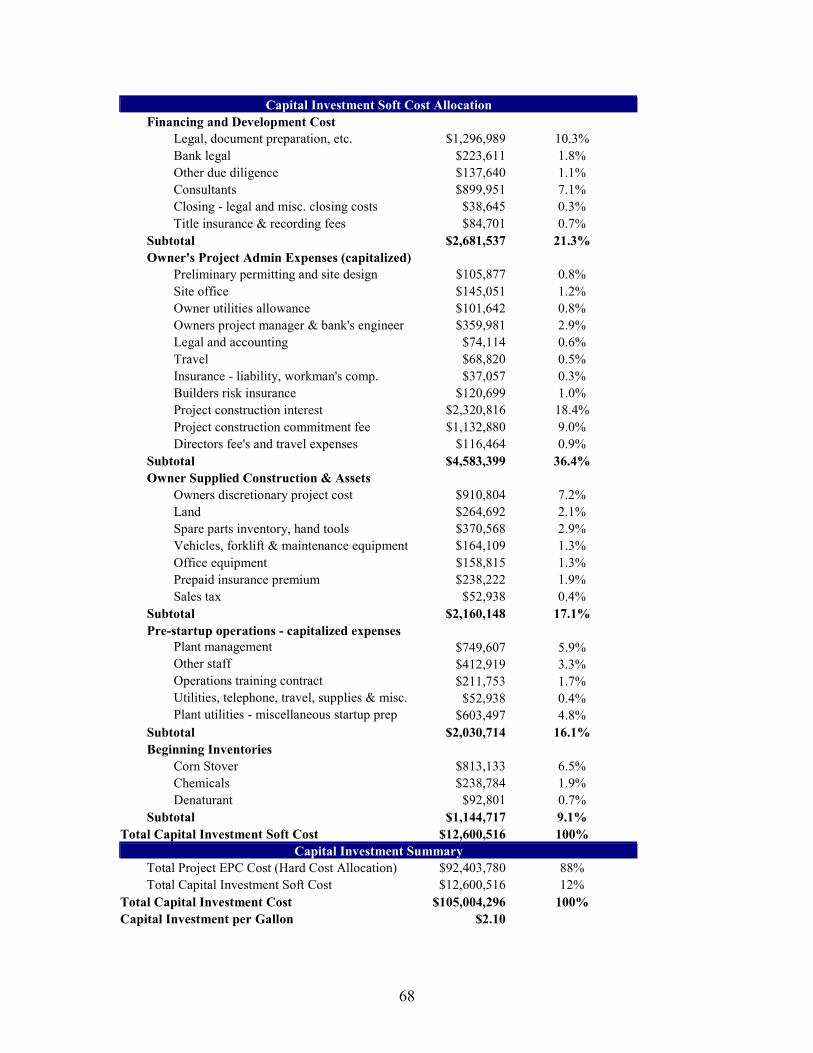
68
Capital Investment Soft Cost Allocation Financing and Development Cost
Legal, document preparation, etc. $1,296,989 10.3% Bank legal $223,611 1.8% Other due diligence $137,640 1.1% Consultants $899,951 7.1% Closing - legal and misc. closing costs $38,645 0.3% Title insurance & recording fees $84,701 0.7%
Subtotal $2,681,537 21.3% Owner's Project Admin Expenses (capitalized)
Preliminary permitting and site design $105,877 0.8% Site office $145,051 1.2% Owner utilities allowance $101,642 0.8% Owners project manager & bank's engineer $359,981 2.9% Legal and accounting $74,114 0.6% Travel $68,820 0.5% Insurance - liability, workman's comp. $37,057 0.3% Builders risk insurance $120,699 1.0% Project construction interest $2,320,816 18.4% Project construction commitment fee $1,132,880 9.0% Directors fee's and travel expenses $116,464 0.9%
Subtotal $4,583,399 36.4% Owner Supplied Construction & Assets
Owners discretionary project cost $910,804 7.2% Land $264,692 2.1% Spare parts inventory, hand tools $370,568 2.9% Vehicles, forklift & maintenance equipment $164,109 1.3% Office equipment $158,815 1.3% Prepaid insurance premium $238,222 1.9% Sales tax $52,938 0.4%
Subtotal $2,160,148 17.1% Pre-startup operations - capitalized expenses
Plant management $749,607 5.9% Other staff $412,919 3.3% Operations training contract $211,753 1.7% Utilities, telephone, travel, supplies & misc. $52,938 0.4% Plant utilities - miscellaneous startup prep $603,497 4.8%
Subtotal $2,030,714 16.1% Beginning Inventories
Corn Stover $813,133 6.5% Chemicals $238,784 1.9% Denaturant $92,801 0.7%
Subtotal $1,144,717 9.1% Total Capital Investment Soft Cost $12,600,516 100%
Capital Investment Summary Total Project EPC Cost (Hard Cost Allocation) $92,403,780 88% Total Capital Investment Soft Cost $12,600,516 12%
Total Capital Investment Cost $105,004,296 100% Capital Investment per Gallon $2.10

69
Table 23 – 70 Million Gallons per Year Capacity Cost Projection
Project Name NREL Bioethanol Co-Location Project Project Location Indiana & Nebraska Sites Plant Design Capacity 70,000,000
Capital Investment Hard Cost Allocation Conventional Equipment Calculations Installed Cost Installation Factor
Major Equipment & Field Tanks $22,229,280 40.0% Equipment Freight & Handling $555,732 1.0% Instrumentation & Controls $1,500,476 2.7% Electrical $4,279,136 7.7% Protective Coverings $555,732 1.0% Mechanical $5,779,613 10.4% Steel Structures $1,556,050 2.8% Concrete $2,889,806 5.2% Buildings $1,889,489 3.4% Civil/Site $2,445,221 4.4% Equipment Rental/Consumables $722,452 1.3%
Subtotal Construction $44,402,986 80% Construction Contingency $3,890,124 7.0%
Total Construction Cost $48,293,110 87% Process Licensing Fees $666,878 1.2% Detailed Engineering $3,334,392 6.0% DCS Engineering $111,146 0.2% Procurement Services $111,146 0.2% Construction Management $1,667,196 3.0% Field Expenses $333,439 0.6% EPC Fees $1,055,891 1.9%
Subtotal Project Services $7,280,089 13% Total Conventional Equipment EPC Cost $55,573,200 100.0% Pretreatment and Conditioning Equipment Calculations
Major Equipment & Field Tanks $26,843,763 44.0% Equipment Freight & Handling $610,086 1.0% Instrumentation & Controls $3,660,513 6.0% Electrical $4,880,684 8.0% Protective Coverings $1,220,171 2.0% Mechanical $9,151,283 15.0% CSA $1,708,239 2.8%
Subtotal Construction $48,074,740 79% Construction Contingency $4,270,599 7.0%
Total Construction Cost $52,345,338 86% Process Licensing Fees $732,103 1.2% Detailed Engineering $3,660,513 6.0% DCS Engineering $122,017 0.2% Procurement Services $122,017 0.2% Construction Management $1,830,257 3.0% Field Expenses $976,137 1.6% EPC Fees $1,220,171 2.0%
Subtotal Project Services $8,663,215 14% Total Pretreatment & Conditioning EPC Cost $61,008,553 100.0%

70
Capital Investment Soft Cost Allocation Financing and Development Cost
Legal, document preparation, etc. $1,953,476 10.3% Bank legal $336,795 1.8% Other due diligence $207,308 1.1% Consultants $1,355,473 7.1% Closing - legal and misc. closing costs $58,206 0.3% Title insurance & recording fees $127,574 0.7%
Subtotal $4,038,831 21.3% Owner's Project Admin Expenses (capitalized)
Preliminary permitting and site design $159,467 0.8% Site office $218,470 1.2% Owner utilities allowance $153,089 0.8% Owners project manager & bank's engineer $542,189 2.9% Legal and accounting $111,627 0.6% Travel $103,654 0.5% Insurance - liability, workman's comp. $55,814 0.3% Builders risk insurance $181,793 1.0% Project construction interest $3,495,526 18.4% Project construction commitment fee $1,706,301 9.0% Directors fee's and travel expenses $175,414 0.9%
Subtotal $6,903,345 36.4% Owner Supplied Construction & Assets
Owners discretionary project cost $1,371,818 7.2% Land $398,669 2.1% Spare parts inventory, hand tools $558,136 2.9% Vehicles, forklift & maintenance equipment $247,174 1.3% Office equipment $239,201 1.3% Prepaid insurance premium $358,802 1.9% Sales tax $79,734 0.4%
Subtotal $3,253,534 17.1% Pre-startup operations - capitalized expenses
Plant management $1,129,029 5.9% Other staff $621,923 3.3% Operations training contract $318,935 1.7% Utilities, telephone, travel, supplies & misc. $79,734 0.4% Plant utilities - miscellaneous startup prep $908,964 4.8%
Subtotal $3,058,585 16.1% Beginning Inventories
Corn Stover $1,224,710 6.5% Chemicals $359,647 1.9% Denaturant $139,773 0.7%
Subtotal $1,724,130 9.1% Total Capital Investment Soft Cost $18,978,425 100%
Capital Investment Summary Total Project EPC Cost (Hard Cost Allocation) $116,581,752 86% Total Capital Investment Soft Cost $18,978,425 14%
Total Capital Investment Cost $135,560,177 100% Capital Investment per Gallon $1.94

71
V. FINANCIAL EVALUATION
This section of the report presents the projected financial performance of 30, 50 and 70 million gallon per year ethanol plants co-located with coal-fired power plants. BBI’s financial model for ethanol production was used to project the financial performance of the co-located ethanol plants in Wheatfield, Indiana and Grand Island, Nebraska. At the Wheatfield site the ethanol plant is to be co-located with the existing RM Schahfer Generating station. At the Grand Island site the ethanol plant is to be co-located with a new coal fired power plant being considered by Nebraska Public Power. The approach for the study was to use conservative assumptions throughout the financial analysis to arrive at an estimate of the minimum return that can be reasonably expected for the project based on the capital costs and plant performance criteria provided by NREL. This scenario is referred to as the “base case” throughout this report. Sensitivity analyses were then run to determine the variables that have the greatest potential impact on the projected profitability of the project. Internal Rate of Return (IRR) was used to measure the projected profitability of the project. Ethanol plant sizes of 30, 50 and 70 million gallons per year (MMGPY) of anhydrous ethanol production were modeled to determine the most appropriate plant size for the project. Bioethanol plant capital and operating cost estimates were provided by NREL, as were the estimated ethanol and byproduct yields, energy consumption and utility and chemical usage of the ethanol plant. The NREL design is for an nth plant design and, therefore, does not include additional costs that will likely be incurred by the first generation of bioethanol plants to mitigate the risks associated with commercializing new technologies. The ethanol plant is assumed to be designed for a 20-year project life and equipment is depreciated over 20 years in the project proforma. BBI’s financial model includes all significant plant inputs and outputs that affect the profitability. These include ethanol production costs and revenues, byproduct revenues, capital costs including project development, financing, construction, start-up, working capital and inventory costs. The model calculates the month-by-month project costs for the first 24 months of the project following the close of financing. The model also produces a 10-year operating forecast for the project. The complete proformas for each plant location and size are included at the end of this section of the report.

72
Assumptions Used in the Financial Forecast Fuel ethanol is to be produced from corn stover feedstock using a dilute acid prehydrolysis and enzymatic saccharification and co-fermentation process under development by DOE/NREL and others. The latest NREL design report for this process can be found on the Internet at http://www.afdc.doe.gov/pdfs/6483a.doc. Please refer to this report for specifics of the process design and plant performance specifications, which have been provided by NREL and used in the following analysis. The composition of the corn stover feedstock and the approximate ethanol yields used in the analysis are shown in Table 24.
Table 24 – Approximate composition and ethanol yield data for corn stover
Component Percent by weight
Theoretical Ethanol Yield
(gal/BDT)
Projected Actual Ethanol Yield
(gal/BDT) Cellulose 37.5% 66.24 Xylan 21.1% 37.27 Arabinan 2.9% 5.12 Mannan 1.6% 2.76 Galactan 1.9% 3.28 Lignin and other 35.0% 0 100% 115 89.7 % of Theoretical 80%
The overall yield of ethanol from a dry ton of corn stover is assumed to be 89.7 gallons or 80% of the theoretical yield based on the corn stover composition shown in Table 24. This is a key assumption for the financial analysis as the ethanol yield has a significant impact on the economics as demonstrated in the sensitivity analysis later in this section. Other important variables and the values used in the financial analysis are discussed below and summarized in Table 29 and Table 30, which follow.
• Ethanol Price. The ethanol price used in the financial forecast is $1.21 per gallon of denatured ethanol. The shipping costs are 5.9¢ per gallon for Indiana and 6.9¢ per gallon for Nebraska. The ethanol marketing or sales cost is about 1.2¢ per gallon. We have used the 10-year average Chicago ethanol price of $1.21 per gallon for the sales price in the financial analysis (see Figure 4). The average price in Omaha, Nebraska for the past 10 years was also $1.21 per gallon. Ethanol prices in the financial analysis are inflated 2% annually.
The ethanol shipping cost is an important variable for the financial analysis. The 6¢ to 7¢ per gallon used for the average ethanol shipping cost was calculated as

73
shown in Table 25 below. For the Grand Island, Nebraska site we have assumed no local market, 75% of the ethanol sold in the regional market and 25% sold in the national market (west coast). For the Wheatfield, Indiana site we have assumed that 50% of the ethanol will be sold in the local Chicago market and 25% in the regional and national markets. The shipping costs for the local, regional and national markets are based on BBI’s experience in conducting feasibility studies and preparing business plans for ethanol plants.
Table 25 – Average ethanol shipping cost
Ethanol prices are relatively volatile and follow the changes in the wholesale price of unleaded regular gasoline with additional volatility due to local, regional and national supply and demand for ethanol. Both ethanol and gasoline are commodities and the price is difficult to predict, but the 10-year average price is a price that lenders will generally accept in business plan proformas.
In addition to long term average pricing, the minimum ethanol price in a specific market is an important number from the lenders perspective. Ethanol projects must be able to “cash flow” at low ethanol prices or provide another mechanism for maintaining cash flow when ethanol prices drop below $1.00 per gallon. The cash flow breakeven point for ethanol price will be determined in the sensitivity analysis.
Nebraska Site ¢/gal Market % ¢/galLocal shipping cost 3.0 0% 0.00Shipping cost to regional markets 5.0 75% 3.75Shipping cost to national markets 12.6 25% 3.15Average Shipping Cost 6.90
Indiana Site ¢/gal Market % ¢/galLocal shipping cost 3.0 50% 1.50Shipping cost to regional markets 5.0 25% 1.25Shipping cost to national markets 12.6 25% 3.15Average Shipping Cost 5.90

74
Figure 4 – Historical ethanol pricing at Chicago gasoline terminal
(Source: Oxy Fuel News)
• Feedstock Price. The base case feedstock price for corn stover in Nebraska is $33.86 per dry ton delivered to the ethanol facility, and $38.62 per BDT in Indiana. Please see the Feedstock Supply Report for a discussion of the feedstock price. A reasonable range that will be evaluated for feedstock pricing sensitivity is $25 to $45 per BDT.
• Feedstock Inventory. Corn stover for ethanol production will likely be harvested
in the fall after the normal corn harvest. A large amount of corn stover will have to be stored for use throughout the year. A 70 MMGPY plant will require 780,000 BDT of corn stover each year. The ownership of the corn stover after harvest will impact the feedstock inventory cost for the project. At $35 per BDT the annual feedstock cost would be about $27 million for a 70 MMGPY plant. The ethanol plant will not be able to pay for a full year’s worth of corn stover in the fall, but rather it is more likely that the farmers will retain ownership until the stover is delivered to the ethanol plant. If farmers retain ownership of the corn stover until it is delivered to the ethanol plant, inventory costs to the plant would be similar to corn dry mill ethanol plants, which typically have 10 days of corn storage. The impact of the number of days of corn stover inventory will be determined in the sensitivity study.
• Lignin Residue Price. Conversion of corn stover feedstock to ethanol will produce
a byproduct residue, which will be primarily lignin and other unconverted material from the corn stover. This lignin byproduct residue is assumed to be sold to the coal fired power plant to be used as boiler fuel. The base case assumes that the lignin residue is dewatered to about 52% moisture and then sold for the same
Chicago Ethanol Prices
$0.80
$1.00
$1.20
$1.40
$1.60
$1.80
$2.00
1990
1991
1992
1993
1994
1995
1996
1997
1998
1999
2000
2001
2002
Etha
nol p
rice/
gal

75
price as coal in the area on a BTU basis. The amount of lignin residue produced and the calculated value is shown in Table 26 below. Lignin residue prices from $0 to $20 per dry ton will be evaluated in the sensitivity study.
Table 26 – Lignin residue production and price to power plant
• Sale of Carbon Dioxide. The sale of carbon dioxide (CO2) is very site specific and depends upon the local supply and demand for CO2. There is a significant oversupply of CO2 in the central Nebraska area and a growing supply in the northwest Indiana area. The sale of CO2 will, therefore not be included in the financial analysis. The revenue from CO2 is usually relatively minor in any event.
• State Producer Payment. There is no state producer payment for ethanol
production in Indiana. Nebraska has a producer payment of 18¢ per gallon on the first 15,625,000 gallons of ethanol produced each year for eight years. The Nebraska producer payment will be included in the financial analysis for the Grand Island, Nebraska site. State producer payments are subject to the whims of state legislatures and the financial conditions of state budgets, however and the producer payments can change during the period of expected payments.
• Federal Small Producer Tax Credit. The financial forecast includes the Federal
Small Producer Tax Credit for the 30 MMGPY plant, but not the larger 50 and 70 MMGPY plants. The Small Producer Tax Credit is 10¢ per gallon on the first 15 million gallons of ethanol produced annually ($1.5 million annually) by plants of 30 MMGPY size or smaller. The credit is currently scheduled to expire at the end of 2007, but it is likely that the credit will be extended beyond 2007. The credit also currently only applies to plants that produce 30 million gallons per year and smaller, but legislation pending in the U.S. Congress would allow plants up to 60 MMGPY to qualify for the credit. To simplify the financial calculations when included in the financial forecast, the Federal Small Producer Tax Credit is
Lignin Residue 30 MMGPY 50 MMGPY 70 MMGPYProduction, wet basis (kg/hr) 36,265 60,441 84,618 Moisture % 51.5% 51.5% 51.5%Production, dry basis (kg/hr) 17,588 29,314 41,040 Annual production, dry basis (ton/year) 162,887 271,478 380,069 Lignin residue yield, dry basis (lb/BDT) 974 974 974 Lignin residue LHV (BTU/wet lb) 2,892 2,892 2,892
Average Indiana utility coal price ($/MMBTU) $1.11 $1.11 $1.11Lignin Residue Value - Indiana ($/wet ton) $6.42 $6.42 $6.42Lignin Residue Value - Indiana ($/dry ton) $13.24 $13.24 $13.24
Average Nebraska utility coal price ($/MMBTU) $0.55 $0.55 $0.55Lignin Residue Value - Nebraska ($/wet ton) $3.18 $3.18 $3.18Lignin Residue Value - Nebraska ($/dry ton) $6.56 $6.56 $6.56
Bioethanol Plant Size

76
assumed to be a payment to the project. The “value” of the tax credit when viewed as income is reduced to about 7¢ per gallon rather than the full 10¢ per gallon tax credit (the credit is considered taxable income and taxes must be paid on the amount credited).
• Financing. BBI recommends at least 40% equity for financing ethanol plants.
Plants have been financed with less equity, but the larger debt payments can be problematic when ethanol prices are low or grain prices rise. The impact of higher and lower levels of equity will be determined.
• Steam Supply. Steam for the ethanol plant in Wheatfield, Indiana is assumed to be
produced by the ethanol plant’s natural gas boiler. The coal fired power plant does not have excess steam available to sell to the ethanol plant. The cost of a natural gas boiler has been added to the capital cost estimate provided by NREL for the Wheatfield site analysis. Natural gas for the boiler is assumed to be purchased on the open market at the average price for industrial users in Indiana. Historical natural gas pricing for Indiana is shown in Table 27. The average historical natural gas price to industrial users in Indiana was $4.08 per MCF from 1993 through 2000. A conservative $4.50 per MCF has been used in the financial model for the cost of natural gas. The natural gas cost is escalated 2% each year.
Table 27 – Average Natural Gas Price to Indiana Industrial Consumers ($/MCF)
Year 1993 1994 1995 1996 1997 1998 1999 2000 Avg.
Indiana $3.71 $4.60 $3.41 $3.62 $4.33 $4.28 $4.16 $4.51 $ 4.08
Source: http://www.eia.doe.gov
Steam supply for the Grand Island ethanol plant is assumed to be provided by the new coal fired power plant being considered by Nebraska Public Power. The cost of coal for utility power plants in Nebraska is very low at about $0.55 per million BTU, which should result in a low steam price to the ethanol plant. Nebraska Public Power was unable to provide a firm price, but $3.00 per 1,000 pounds of steam is believed to be a conservative estimate given the fuel costs for the project. The steam price is escalated at 2% per year.
• Electricity Price. The price of electricity for the Wheatfield, Indiana project is estimated to be 4.o¢ per kWh based on discussions with Northern Indiana Public Service Company. The price for the Grand Island, Nebraska ethanol plant is estimated at 3.0¢ per kWh based on discussions with Nebraska Public Power. The price of electricity is escalated at 2% per year.
• Chemical Costs. The chemical costs for the ethanol plant were provided by NREL
and are listed in Table 28 below. Cellulase enzyme required to convert cellulose

77
in the corn stover to glucose is assumed to be purchased for 10.08¢ per gallon of ethanol produced. Chemical costs are escalated 1% per year.
Table 28 – Chemical costs for ethanol production (source: NREL)
Chemical ¢/gallonClarifier Polymer 0.94Sulfuric Acid 1.09Hydrated Lime 2.23Corn Steep Liquor 2.81Purchased Cellulase Enzyme 10.08Diammonium Phosphate 0.31Propane 0.00Boiler Chemicals 0.04Cooling Tower Chemicals 0.05Wastewater Chemicals 0.24Wastewater Polymer 0.01Total Chemical Cost 17.81

78
Table 29 – Assumptions used in the financial forecast for Wheatfield, Indiana
Model Input Indiana Nebraska Ethanol yield (gal/BDT) 89.7 89.7
Ethanol selling price ($/gal) $1.21 $1.21
Ethanol transportation cost ($/gal) $0.059 $0.069
Ethanol sales commission (% of price) 1% 1%
Delivered corn stover price ($/BDT) $38.62 $33.86
Lignin residue yield (dry lb/BDT) 974 974
Lignin residue price ($/dry ton) $13.24 $6.56
CO2 sold No No
Electricity use (kWh/gallon ethanol) 1.42 1.42
Electricity price ($/kWh) $0.040 $0.030
Natural gas use (BTU/gallon ethanol) 40,915 NA
Natural gas price ($/MCF) $4.50 NA
Steam use (BTU/gallon ethanol) NA 36,824
Steam price ($/1000 lbs) NA $3.00
Makeup water (gal/BDT of feedstock) 536 536
Makeup water price ($/1000 gallon) $0.50 $0.50
Wastewater (gal/BDT of feedstock) 343 343
Wastewater cost ($/1000 gallon) $1.00 $1.00
Solid waste (ton/BDT of feedstock) 0.0865 0.0865
Solid waste disposal price ($/ton) $10.00 $10.00
Denaturant use (% of ethanol sold) 5% 5%
Denaturant price ($/gallon) $0.70 $0.70
Cellulase enzymes $0.1008 $0.1008
Other chemicals ($/gallon ethanol) $0.0773 $0.0773
Maintenance materials (% of capital cost) 2.0% 2.0%
Property tax & insurance (% of equip. cost) 2.0% 2.0%
Debt/equity ratio 60% / 40% 60% / 40%
Debt interest rate 8% 8%
Loan term 10 years 10 years
Land 75 acres 75 acres
Cost of land per acre $3,000 $3,000
State Incentives None $2.8 million/year

79
Assumptions that change according to the plant size are shown in Table 30 below with the corresponding values for 30, 50 and 70 million gallon per year plants.
Table 30 – Assumptions for different ethanol plant sizes Model Input 30 MMGPY 50 MMGPY 70 MMGPY Ethanol plant capital cost (note 1) $51,949,000 $73,281,000 $92,478,000
Number of employees 49 60 71
Administration building $250,000 $300,000 $350,000
Rail improvements $500,000 $750,000 $1,000,000
Site Development Cost $1,000,000 $1,200,000 $1,400,000
Organizational Costs $500,000 $600,000 $700,000
Spare Parts $500,000 $600,000 $700,000
Startup Costs $1,000,000 $1,200,000 $1,400,000
Monthly Office/Lab expenses $6,000 $8,000 $10,000
Federal Small Producer Tax Credit Yes No NoNote 1. Includes cost of natural gas boiler for both sites – see Design and Cost Estimates section There is no provision for payment of income taxes in the financial forecast, as the structure and ownership of the project has not been determined and will eventually affect the calculation of taxes. Federal income taxes will only be payable by the ethanol business entity if it is structured as a corporation. A Limited Liability Company (LLC) or a farmer cooperative business structure would have no tax liability. The LLC and farmer cooperative are by far the more popular forms of business structure for ethanol projects currently under development.

80
Economic Modeling Results Ethanol plants of 30, 50 and 70 million gallon per year of anhydrous fuel ethanol production capacity were modeled using BBI’s proprietary financial model. Internal Rate of Return (IRR) was used to measure the profitability of the proposed projects. The results for Indiana are summarized in Table 31 and the results for Nebraska are shown in Table 32. More detailed results are shown on the following pages and the 11-year economic forecasts for each plant size are included in the appendix.
Table 31 – Modeling results for the Wheatfield, Indiana site
30 MMGPY 50 MMGPY 70 MMGPY
Internal Rate of Return (IRR) -5.7% 3.3% 10.7% Average Annual Net Earnings $2,783,000 $6,190,000 $10,794,000 Capital Cost per Gallon ($/gal) $2.18 $1.85 $1.67 Ethanol Plant Capital Cost $65,521,000 $92,404,000 $116,582,000 Owner’s Costs $8,173,000 $10,732,000 $13,297,000 Total Project Investment $73,694,000 $103,136,000 $129,879,000 40% Equity $29,477,600 $41,254,400 $51,951,600
Table 32 – Modeling results for the Grand Island, Nebraska site
30 MMGPY 50 MMGPY 70 MMGPY
Internal Rate of Return (IRR) 18.6% 23.6% 29.3% Average Annual Net Earnings $7,522,000 $12,754,000 $19,188,000 Capital Cost per Gallon ($/gal) $2.18 $1.85 $1.67 Ethanol Plant Capital Cost $65,521,000 $92,404,000 $116,582,000 Owner’s Costs $8,096,000 $10,602,000 $13,117,000 Total Project Investment $73,617,000 $103,006,000 $129,699,000 40% Equity $29,446,800 $41,202,400 $51,879,600

81
The Capital Cost per Gallon and the Ethanol Plant Capital Cost shown in the above tables includes the installed equipment cost for the ethanol plant plus the cost of a natural gas boiler, ethanol plant engineering, construction management, and a 7% contingency. Both the capital costs and the Owner’s costs are discussed in detail in the Design and Cost Estimate Report. The Internal Rate of Return (IRR) is the present value of the equity investment plus the net increase in cash for years one through ten of the project. The average annual net earnings are also calculated over the 11-year forecast period. The equity investment is assumed to be 40% of the total project cost. Construction of the project is assumed to take 14 months followed by four months of startup. During startup, ethanol production is assumed to be 25% of nameplate capacity during the first month, and then 50%, 75% and finally 100% in the second, third and fourth months of startup. The first principal payment on the debt is assumed to take place in month 19 of the project. The projected IRRs for the Nebraska project are significantly higher than the Indiana project because of the state producer payment in Nebraska, the lower estimated feedstock cost and the lower energy (steam and electricity) costs at the Nebraska site. The 70 MMGPY plant in Grand Island, Nebraska has the highest projected IRR at 29.3%. The 50 MMGPY plant has a projected IRR of 23.6% and the 30 MMGPY plant has a projected IRR of 18.6%. IRRs above 25% should attract significant investor interest. The year-by-year annual net earnings for the Grand Island, Nebraska site for each plant size is shown in Figure 5. The net earnings drop slightly in year 9 because the state producer payment ends in that year.
Figure 5 – Year-by-year Projected Annual Net Earnings, Grand Island, NE
Projected Annual Net Earnings
-$5
$0
$5
$10
$15
$20
$25
$30
0 1 2 3 4 5 6 7 8 9 10
Mill
ions
YEAR
Annu
al N
et E
arni
ngs
30 MMGPY 40 MMGPY 60 MMGPY

82
The estimated total project investment at the Grand Island, NE site ranges from about $74 million for the 30 MMGPY plant to $130 million for the 70 MMGPY plant. The estimated total project cost for the 50 MMGPY plant is $103 million. The capital cost estimates for the Wheatfield, Indiana site are essentially the same as the Nebraska site. A summary of the ethanol plant construction and production cost inputs and the proforma income statement for the second year of operation is presented in the following tables. The cash cost of production and net production costs for each plant size at each site are shown in the following tables. The cash cost of production is defined as the variable costs plus fixed costs minus production credits for co-products. The only co-product credit we have included in the calculations is the lignin residue revenue. The net production cost is defined as the cash cost plus capital depreciation and amortization plus net interest on debt financing.
Table 33 – Cash cost and net production cost for the Wheatfield, IN site
Table 34 – Cash cost and net production cost for the Grand Island, NE site
Anhydrous Ethanol Production (Gal/Year) 30,000,000 50,000,000 70,000,000
Grand Island, Nebraska SiteVariable Production Costs $0.813 $0.802 $0.797Fixed Production Costs $0.123 $0.096 $0.084Co-Product Credits ($0.036) ($0.036) ($0.036)
Cash Cost of Production $0.900 $0.862 $0.844
Interest on Debt Financing $0.114 $0.096 $0.086Depreciation & Amortization $0.108 $0.091 $0.082
Net Production Cost $1.123 $1.049 $1.013
Anhydrous Ethanol Production (Gal/Year) 30,000,000 50,000,000 70,000,000
Wheatfield, Indiana SiteVariable Production Costs $0.956 $0.945 $0.940Fixed Production Costs $0.123 $0.096 $0.084Co-Product Credits ($0.073) ($0.073) ($0.073)
Cash Cost of Production $1.007 $0.969 $0.951
Interest on Debt Financing $0.114 $0.096 $0.086Depreciation & Amortization $0.108 $0.091 $0.082
Net Production Cost $1.229 $1.156 $1.119

83
NREL Bioethanol Co-Location Study -- Wheatfield, IN Site
Denatured Ethanol Production (Gal/Year) 31,500,000 52,500,000 73,500,000Anhydrous Ethanol Production (Gal/Year) 30,000,000 50,000,000 70,000,000Project Costs
Ethanol Plant Cost per Gallon $2.18 $1.85 $1.67Ethanol Plant Engineering & Construction $65,521,000 $92,404,000 $116,582,000Inventory - Biomass $369,000 $615,000 $861,000Inventory - Chemicals/Denaturant $129,000 $216,000 $302,000Inventory - Ethanol & Lignin $869,000 $1,449,000 $2,028,000Spare Parts $500,000 $600,000 $700,000Startup Costs $1,000,000 $1,200,000 $1,400,000Land $225,000 $225,000 $225,000Administration Building & Furnishing $250,000 $300,000 $350,000Rail Improvements $500,000 $750,000 $1,000,000Site Development Costs $1,000,000 $1,200,000 $1,400,000Tools and Laboratory Equipment $250,000 $250,000 $250,000Organizational Costs $500,000 $600,000 $700,000Capitalized Fees and Interest $2,057,000 $2,865,000 $3,591,000Working Capital $524,000 $462,000 $490,000
Estimated Total Project Cost $73,694,000 $103,136,000 $129,879,000% Equity Assumed 40% 40% 40%Equity $29,477,600 $41,254,400 $51,951,600Number of Employees 49 60 71Average Annual Wages $48,214 $46,350 $45,063Annual Payroll $2,362,500 $2,781,000 $3,199,500
Product ValuesConversion Rate (gal ethanol/BDT) 89.70 89.70 89.70Delivered Biomass Feedstock ($/BDT) 38.62 38.62 38.62Ethanol ($/gal) 1.21 1.21 1.21Ethanol Shipping Cost ($/gal) 0.059 0.059 0.059Ethanol Sales Commission (% of sales price) 1.0% 1.0% 1.0%Lignin Residue ($/wet ton) 6.42 6.42 6.42CO2 ($/ton) 0.00 0.00 0.00Natural Gas ($/MMBTU) 4.50 4.50 4.50Electricity ($/kWh) 0.04 0.04 0.04Denaturant ($/gal) 0.70 0.70 0.70Purchased Cellulase Enzyme ($/gal ethanol) 0.10 0.10 0.10Other Chemical Costs ($/gal ethanol) 0.08 0.08 0.08Makeup Water ($/1000 gal) 0.50 0.50 0.50Wastewater ($/1000 gal) 1.00 1.00 1.00Solid Waste Disposal ($/ton) 10.00 10.00 10.00
Summary of Production Cost Inputs -- Wheatfield, Indiana Site

84
NREL Bioethanol Co-Location Study -- Wheatfield, IN Site
Denatured Ethanol Production (Gal/Year) 31,500,000 52,500,000 73,500,000Revenue $/Gal $/Gal $/Gal
Ethanol $1.220 $1.220 $1.220Lignin Residue $0.073 $0.073 $0.073Carbon Dioxide $0.000 $0.000 $0.000State Producer Payment $0.000 $0.000 $0.000Federal Small Producer Tax Credit $0.035 $0.000 $0.000
Total Revenue $1.327 $1.292 $1.292
Production & Operating Expenses Feedstocks $0.435 $0.435 $0.435Purchased Cellulase Enzymes $0.102 $0.102 $0.102Other Chemicals $0.078 $0.078 $0.078Natural Gas $0.188 $0.188 $0.188Electricity $0.058 $0.058 $0.058Denaturants $0.036 $0.036 $0.036Makeup Water $0.003 $0.003 $0.003Effluent Disposal $0.004 $0.004 $0.004Solid Waste Disposal $0.010 $0.010 $0.010Direct Labor & Benefits $0.043 $0.032 $0.027
Total Production Costs $0.956 $0.945 $0.940
Gross Profit $0.371 $0.348 $0.352
Administrative & Operating Expenses Maintenance Materials & Services $0.035 $0.030 $0.027Repairs & Maintenance, Wages & Benefits $0.017 $0.012 $0.010Consulting Services $0.001 $0.000 $0.000Property Taxes & Insurance $0.045 $0.038 $0.034Admin. Salaries, Wages & Benefits $0.021 $0.013 $0.010Legal & Accounting/Community Affairs $0.001 $0.001 $0.001Office/Lab Supplies & Expenses $0.002 $0.002 $0.002Travel, Training & Miscellaneous $0.001 $0.001 $0.001
Total Administrative & Operating Expenses $0.123 $0.096 $0.084
EBITDA $0.248 $0.251 $0.269Less:
Interest - Operating Line of Credit $0.001 $0.000 $0.000Interest - Senior Debt $0.114 $0.096 $0.086Interest - Subordinated Debt $0.000 $0.000 $0.000Depreciation & Amortization $0.108 $0.091 $0.082
Annual Net Earnings Before Income Taxes $0.024 $0.064 $0.100
11-Year Annual Average Net Income $2,783,234 $6,189,636 $10,793,590Internal Rate of Return (IRR) -5.7% 3.3% 10.7%
Note - $/GAL figures are based on annual anhydrous ethanol production
Proforma Income Statement for Year 2 -- Wheatfield, Indiana Site

85
NREL Bioethanol Co-Location Study -- Grand Island, NE Site
Denatured Ethanol Production (Gal/Year) 31,500,000 52,500,000 73,500,000Anhydrous Ethanol Production (Gal/Year) 30,000,000 50,000,000 70,000,000Project Costs
Ethanol Plant Cost per Gallon $2.18 $1.85 $1.67Ethanol Plant Engineering & Construction $65,521,000 $92,404,000 $116,582,000Inventory - Biomass $324,000 $539,000 $755,000Inventory - Chemicals/Denaturant $129,000 $216,000 $302,000Inventory - Ethanol & Lignin $837,000 $1,395,000 $1,954,000Spare Parts $500,000 $600,000 $700,000Startup Costs $1,000,000 $1,200,000 $1,400,000Land $225,000 $225,000 $225,000Administration Building & Furnishing $250,000 $300,000 $350,000Rail Improvements $500,000 $750,000 $1,000,000Site Development Costs $1,000,000 $1,200,000 $1,400,000Tools and Laboratory Equipment $250,000 $250,000 $250,000Organizational Costs $500,000 $600,000 $700,000Capitalized Fees and Interest $2,057,000 $2,865,000 $3,591,000Working Capital $524,000 $462,000 $490,000
Estimated Total Project Cost $73,617,000 $103,006,000 $129,699,000% Equity Assumed 40% 40% 40%Equity $29,446,800 $41,202,400 $51,879,600Number of Employees 49 60 71Average Annual Wages $48,214 $46,350 $45,063Annual Payroll $2,362,500 $2,781,000 $3,199,500
Product ValuesConversion Rate (gal ethanol/BDT) 89.70 89.70 89.70Delivered Biomass Feedstock ($/BDT) 33.86 33.86 33.86Ethanol ($/gal) 1.21 1.21 1.21Ethanol Shipping Cost ($/gal) 0.069 0.069 0.069Ethanol Sales Commission (% of sales price) 1.0% 1.0% 1.0%Lignin Residue ($/wet ton) 3.18 3.18 3.18CO2 ($/ton) 0.00 0.00 0.00Steam ($/1000 lbs) 3.00 3.00 3.00Electricity ($/kWh) 0.03 0.03 0.03Denaturant ($/gal) 0.70 0.70 0.70Purchased Cellulase Enzyme ($/gal ethanol) 0.10 0.10 0.10Other Chemical Costs ($/gal ethanol) 0.08 0.08 0.08Makeup Water ($/1000 gal) 0.50 0.50 0.50Wastewater ($/1000 gal) 1.00 1.00 1.00Solid Waste Disposal ($/ton) 10.00 10.00 10.00
Summary of Production Cost Inputs -- Grand Island, Nebraska Site
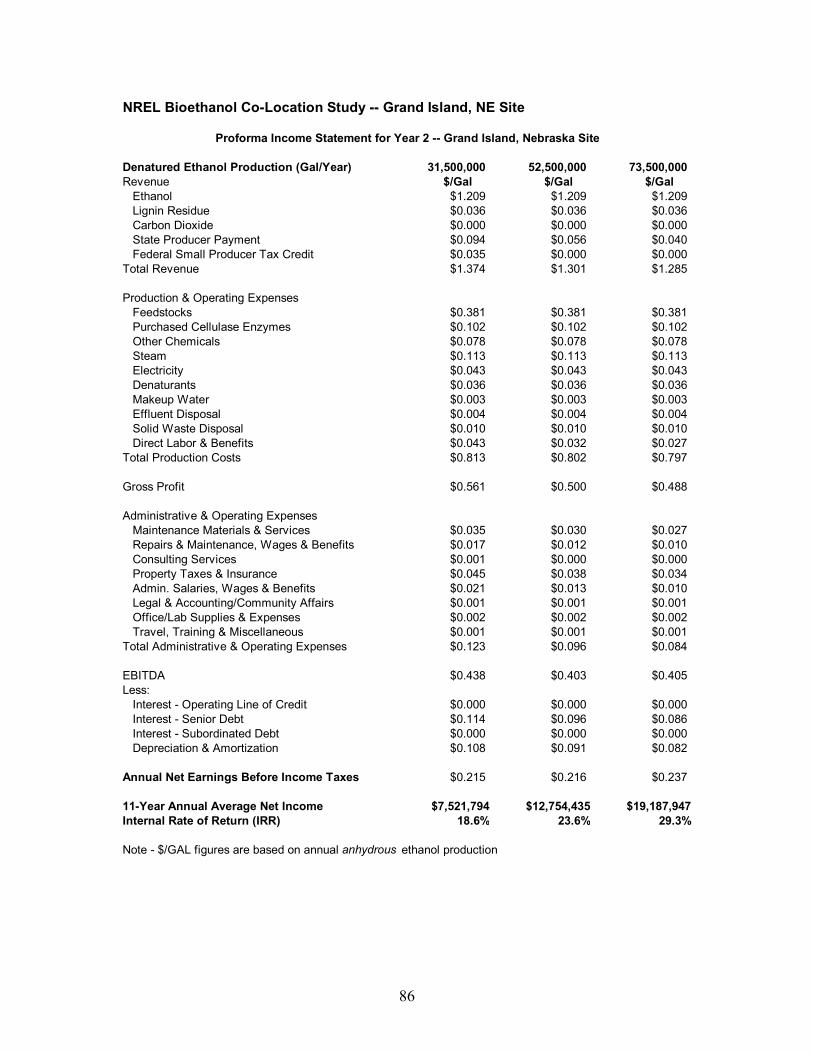
86
NREL Bioethanol Co-Location Study -- Grand Island, NE Site
Denatured Ethanol Production (Gal/Year) 31,500,000 52,500,000 73,500,000Revenue $/Gal $/Gal $/Gal
Ethanol $1.209 $1.209 $1.209Lignin Residue $0.036 $0.036 $0.036Carbon Dioxide $0.000 $0.000 $0.000State Producer Payment $0.094 $0.056 $0.040Federal Small Producer Tax Credit $0.035 $0.000 $0.000
Total Revenue $1.374 $1.301 $1.285
Production & Operating Expenses Feedstocks $0.381 $0.381 $0.381Purchased Cellulase Enzymes $0.102 $0.102 $0.102Other Chemicals $0.078 $0.078 $0.078Steam $0.113 $0.113 $0.113Electricity $0.043 $0.043 $0.043Denaturants $0.036 $0.036 $0.036Makeup Water $0.003 $0.003 $0.003Effluent Disposal $0.004 $0.004 $0.004Solid Waste Disposal $0.010 $0.010 $0.010Direct Labor & Benefits $0.043 $0.032 $0.027
Total Production Costs $0.813 $0.802 $0.797
Gross Profit $0.561 $0.500 $0.488
Administrative & Operating Expenses Maintenance Materials & Services $0.035 $0.030 $0.027Repairs & Maintenance, Wages & Benefits $0.017 $0.012 $0.010Consulting Services $0.001 $0.000 $0.000Property Taxes & Insurance $0.045 $0.038 $0.034Admin. Salaries, Wages & Benefits $0.021 $0.013 $0.010Legal & Accounting/Community Affairs $0.001 $0.001 $0.001Office/Lab Supplies & Expenses $0.002 $0.002 $0.002Travel, Training & Miscellaneous $0.001 $0.001 $0.001
Total Administrative & Operating Expenses $0.123 $0.096 $0.084
EBITDA $0.438 $0.403 $0.405Less:
Interest - Operating Line of Credit $0.000 $0.000 $0.000Interest - Senior Debt $0.114 $0.096 $0.086Interest - Subordinated Debt $0.000 $0.000 $0.000Depreciation & Amortization $0.108 $0.091 $0.082
Annual Net Earnings Before Income Taxes $0.215 $0.216 $0.237
11-Year Annual Average Net Income $7,521,794 $12,754,435 $19,187,947Internal Rate of Return (IRR) 18.6% 23.6% 29.3%
Note - $/GAL figures are based on annual anhydrous ethanol production
Proforma Income Statement for Year 2 -- Grand Island, Nebraska Site

87
Maximum Feedstock Cost The maximum feedstock cost that the ethanol plant could pay while maintaining a minimum IRR or hurdle rate of 15% with 100% equity is as follows. A 15% IRR with 100% equity is judged by BBI to be the minimum hurdle rate required to attract investor interest in the project. With 60% debt financing the 15% hurdle rate is equal to an IRR of about 22%.
Table 35 – Maximum feedstock cost with 15% hurdle rate and 100% equity
The maximum feedstock cost that the plant can pay while maintaining the 15% minimum IRR is significantly higher for the Grand Island, NE site compared to the Wheatfield, IN site. The maximum feedstock cost for the Grand Island site is $7 to $11 per BDT higher than the Wheatfield site.
Anhydrous Ethanol Production (Gal/Year) 30,000,000 50,000,000 70,000,000
Wheatfield, Indiana SiteMaximum feedstock cost ($/BDT) -- with 15% IRR and 100% equity $20.00 $27.00 $32.00
Grand Island, Nebraska SiteMaximum feedstock cost ($/BDT) -- with 15% IRR and 100% equity $31.10 $35.20 $39.00

88
Sensitivity Analysis The impact on the projected Internal Rate of Return (IRR) will be determined for the following variables:
• Ethanol plant capacity • Cost of feedstock • Feedstock composition • Feedstock inventory (number of days of inventory) • Ethanol price • Owner equity • Capital cost • Annual manufacturing cost (cash cost of production) • Annual direct labor cost
Ethanol Plant Capacity The impact of ethanol plant sizes from 30 MMGPY to 70 MMGPY on the IRR is shown in the following chart for both the Indiana and Nebraska sites. Plant Size Sensitivity
0%5%
10%15%20%25%30%
30 50 70Plant Size (MMGPY)
IRR
Indiana Nebraska

89
Cost of Feedstock Based on several studies of corn stover harvest and delivery costs, the delivered price for corn stover could vary from $25 to $45 per BDT. The impact on the IRR over this range of feedstock costs for the Grand Island, Nebraska site is shown in the following chart.
Feedstock Composition Changes in the cellulose and hemicellulose content of corn stover will impact the ethanol yield from the feedstock. The impact of ethanol yields from 80 gallons per BDT to 100 gallons per BDT is shown in the chart below for the Grand Island, Nebraska site.
Biomass Feedstock Price Sensitivity
0%
10%
20%
30%
40%
50%
$25.00 $30.00 $35.00 $40.00 $45.00Delivered Biomass Price ($/BDT)
IRR
30 MMGPY 50 MMGPY 70 MMGPY
Ethanol Yield Sensitivity
0%
10%
20%
30%
40%
80 85 90 95 100Ethanol Yield (Gal/BDT)
IRR
30 MMGPY 50 MMGPY 70 MMGPY

90
Feedstock Inventory The number of days of feedstock inventory will impact the project’s inventory cost and the initial capital cost of the project. Corn dry mills typically carry ten days of corn inventory. The number of corn stover inventory days will be varied from 10 days to 90 days and the impact on the projected IRR is shown in the chart below.
Ethanol Price Sensitivity Fuel ethanol prices historically range from about $1.00 per gallon to well over $1.40 per gallon. The impact on the IRR over a range of $1.05 to $1.45 is shown in the following chart for the Nebraska site.
Corn Stover Inventory Sensitivity
0%
10%
20%
30%
40%
50%
10 30 50 70 90# Days of Inventory
IRR
30 MMGPY 50 MMGPY 70 MMGPY
Ethanol Price Sensitivity
0%10%20%30%40%50%60%70%
$1.05 $1.15 $1.25 $1.35 $1.45Ethanol Price ($/gal)
IRR
30 MMGPY 50 MMGPY 70 MMGPY

91
Owner Equity The impact of varying levels of percent equity is shown in the following chart for the Nebraska project site.
Capital Cost Sensitivity The impact of varying the capital cost from 80% of the original capital cost estimate to 130% of the original estimate is shown in the chart below for the Nebraska project site.
% Equity Impact on IRR
0%
10%
20%
30%
40%
50%
100% 80% 60% 40% 20%
% Equity
IRR
30 MMGPY 50 MMGPY 70 MMGPY
Capital Cost Sensitivity
0%
10%
20%
30%
40%
50%
80% 90% 100% 110% 120% 130%% of Original Capital Cost Estimate
IRR
30 MMGPY 50 MMGPY 70 MMGPY

92
Cash Cost of Production Sensitivity The impact of varying the cash cost of production by plus or minus 10¢ per gallon of ethanol is shown in the chart below for the Nebraska project site.
Labor Cost Sensitivity The impact of varying the labor costs from 80% of the original labor cost estimates to 130% of the original estimates is shown in the chart below for the Nebraska project site.
Cash Cost of Production Sensitivity
0%
10%
20%
30%
40%
50%
-$0.10 -$0.05 $0.00 $0.05 $0.10Change to Original Cash Cost of Production
IRR
30 MMGPY 50 MMGPY 70 MMGPY
Labor Cost Sensitivity
0%5%
10%15%20%25%30%35%
80% 90% 100% 110% 120% 130%% of Original Labor Cost Estimate
IRR
30 MMGPY 50 MMGPY 70 MMGPY

93
Summary for Sensitivity Analysis The profitability of the ethanol plant as measured by the IRR is most sensitive to the ethanol price, feedstock price and the percent equity investment. Secondary variables with a relatively high impact include plant capacity, capital cost and cash cost or production (annual manufacturing cost). Variables with relatively minor impact of the IRR include the ethanol yield, number of days of corn stover inventory and the labor cost. Proformas The proformas for the Wheatfield, Indiana and Grand Island, Nebraska project sites for ethanol plants of 30, 50 and 70 MMGPY are included in Appendix A.

94
VI. ENVIRONMENTAL IMPACTS
Potential environmental impacts of siting and operating a commercial-scale bioethanol facility are identified and evaluated in this section of the report. Potential on-site issues will be examined and potential off-site impacts that might require additional investigation will be identified. In this section we will examine the following environmental and community impacts: On-Site Environmental Issues
• Land-use impacts o Wetlands o Archeological o Endangered species
• Air emissions • Water use • Wastewater discharge • Storm water discharge • Hazardous chemicals • Hazardous waste • Solid waste
Local Community Impacts
• Visual • Noise • Odor • Traffic
Co-location Environmental Impacts and Benefits
• Power plant air permit • Green power • NOx reductions • GHG reductions
Socioeconomic impacts (jobs, income and taxes) due to the proposed bioethanol plants will be evaluated in the next section.

95
On-Site Environmental Issues
Land Use Impacts Land use impacts should be relatively minor if the ethanol facility is sited in the proper location. In locals with zoning laws, the site should be zoned industrial. Rural areas are preferred. A corn stover ethanol plant will require approximately the same amount of land as a corn dry mill with additional land for storage of corn stover bales. A good rule of thumb for the amount of land required for a dry mill ethanol plant is ¾ acre for each million gallons of ethanol production capacity. A 30 MMGPY plant would require about 22 acres, a 50 MMGPY plant about 38 acres and a 70 MMGPY plant about 52 acres. Many ethanol project owners purchase significantly more land than indicate here, however. The most important items to consider when regarding the size of the site, is the flow of traffic within the plant and plans for future expansion. The amount of land required for stover bale storage will be determined by the inventory at the site. BBI recommends at least 15 days inventory to avoid possible disruptions in operations.
Wetlands, Endangered Species and Archeological Discoveries Wetlands and areas with known endangered species and likely archeologically active areas should be avoided when siting the ethanol facility. The U.S. Army Corps of Engineers has approval responsibility for impacts to "waters of the United States" under Section 404 of the federal Clean Water Act. The Corps has generally held to a broad interpretation of the expression waters of the United States, taking it to include all rivers, lakes, ponds, streams and wetlands. For projects with very minor impacts, the primary review is typically performed by the state. The schedule for approval of Section 404 permits is greatly dependent on the magnitude of the anticipated impacts. Smaller impacts are readily approved and more significant impacts may take as much as 6 months to a year to obtain. In certain instances, the approval process may exceed a year. The discovery of an endangered species on or near your site can cause significant delays in a construction project. Discussions with appropriate state agencies and review of endangered species information can help to avoid, but not guarantee that this will not be an issue for an ethanol project. An archeological survey will be require prior to the start of construction and should be performed before final site selection for the project.
Air Emissions Air emissions from a corn stover-to-ethanol plant will be similar to the emissions from a corn dry mill ethanol plant. Both facilities will use significant quantities of feedstock that will be delivered by truck (particulate matter – PM emissions). Both grind the feedstock to an appropriate size (PM emissions) prior to “cooking” and saccharification followed

96
by fermentation of the resulting sugars (VOC emissions). Both processes produce a solid residue (potential VOC and PM emissions) and require steam (combustion emissions) to operate the facility. Ethanol product storage and loadout are sources of VOC emissions. If a cooling tower is included in the plant design, it will be a source of particulate emissions. The typical process arrangement and sources of emissions are shown below.
Figure 6 – Major air emissions sources for a bioethanol plant
Due to the interest in building ethanol plants in Nebraska, the Nebraska Department of Environmental Quality has put together information and guidelines specifically for prospective ethanol producers. Other ethanol friendly states, such as Iowa, provide similar ethanol permitting packages. Specific information regarding permits for air, water, emergency planning/right to know and hazardous waste permits is included in the Nebraska packet. A construction air permit is required prior to beginning construction for an ethanol plant and is transferred to the operational air permit shortly after the plant begins operation and post operational testing has been completed. In states that are familiar with permitting ethanol plants like Nebraska, the construction air permit may take 6 – 12 months to obtain. In states that are unfamiliar with ethanol plants or locations in non-attainment areas, the construction permit could take up to a year or longer to obtain. To ensure that the air permit does not delay the project, follow these recommendations:
• Start early, 12 months prior to start of construction if possible.
VOC, PM, CONOx Emissions
VOC, PM, CONOx Emissions
H2S Emissions?H2S Emissions?
PM EmissionsPM Emissions
VOC EmissionsVOC Emissions
Feed Handling Pretreatment & Conditioning
Saccharification &Co-fermentation
Distillation &Dehydration
Gypsum
VOC EmissionsVOC Emissions
Ethanol Storage
Corn Stover
HydrolyzateMilled Stover
ProductB
eer
WastewaterTreatment
Excess Condensate
Natural Gas Boiler
VOC, PM, CONOx Emissions
VOC, PM, CONOx Emissions
H2S Emissions?H2S Emissions?
PM EmissionsPM Emissions
VOC EmissionsVOC Emissions
Feed Handling Pretreatment & Conditioning
Saccharification &Co-fermentation
Distillation &Dehydration
Gypsum
VOC EmissionsVOC Emissions
Ethanol Storage
Corn Stover
HydrolyzateMilled Stover
ProductB
eer
WastewaterTreatment
Excess Condensate
Natural Gas Boiler

97
• Discuss your project with the state air permitting agency before you submit your application and again after submission.
• Make sure the permit application is complete and accurate. • Include emission calculations and citations with the permit application. • Do your research – the ethanol plant design and equipment selection can impact
your permit and the required testing, record keeping and reporting requirements. • Use a qualified air permitting professional familiar with the state. • Understand the draft and final permits.
The air operating permit program in Nebraska and other states is the result of the Federal Clean Air Act Amendments of 1990. The Federal operating permit program is referred to as the “Title V” operating permit program. The Federal Title V program only regulates major sources of air pollution and state programs typically regulate minor sources of pollution. A source’s major/minor status is determined by its emissions, with the larger emitting sources being considered Major and the smaller emitting sources considered Minor. A Major Source is one that has the potential to emit any air pollutant in quantities greater than 100 tons per year (tpy). Lower thresholds exist for Hazardous Air Pollutants (HAPs) like benzene, mercury and lead. In general a Minor Source is a facility that emits less than 100 tpy of PM, NOx, SOx, VOC or CO; less than 2.5 tpy of any one HAP or 10 tpy of a combination of HAPs; and less than 0.6 tpy of lead. A flow diagram for the air permitting process is shown in Figure 7. The ethanol plant design engineer’s goal should be to end up in one of the two “Source is Minor for Title V and PSD” boxes. If a proposed ethanol plant is a Minor Source, the air permit should be straightforward to obtain and the monitoring and reporting requirements of the permit will be less demanding than a permit for a Major Source. Ethanol plants have been in the news recently because many are emitting significantly more VOCs and CO than stated in their permit applications. In fact some relatively small plants may be Major Sources for VOCs and CO rather than Minor Sources. Emissions from the distillers grain dryer are in some cases much higher than originally thought. Thermal oxidizers can greatly reduce the dryer emissions and have become standard equipment for new dry mill ethanol plants. Although the proposed bioethanol plants would not likely dry the lignin residue, the current situation describe here points out the need to fully understand the proposed lignocellulosic ethanol process and the resulting emissions. The single largest emissions source for the proposed bioethanol plants will be the natural gas boiler. Estimated emissions from the boiler were obtained from the Illinois EPA on-line natural gas fired boiler emissions calculator. The on-line calculator uses emission factors from the USEPA for natural gas fired boilers. Priority boiler emissions for 30, 50 and 70 MMGPY bioethanol plants are shown in Table 36.

98
Table 36 – Estimated emissions from natural gas boiler
Plant Size CO NOx VOC PM SO2 30 MMGPY 52 27 3 5 <1 50 MMGPY 86 45 6 8 <1 70 MMGPY 120 63 8 11 <1
Source: NOx emissions based on 0.044 pounds NOx per million BTUs of boiler input. Other data from Natural Gas Boiler Calculations, Illinois EPA, http://www.epa.state.il.us/air/aer/calculator Based on just the boiler emission shown in Table 36, the 30 and 50 MMGPY bioethanol plant would be a Minor Source and the 70 MMGPY plant would be Major Source for CO emissions. In addition to the boiler emissions, other emissions sources for a bioethanol plant will include the fermentation CO2 scrubber vent, other process vents, ethanol and denaturant storage, fugitive emissions, truck and rail loadout, feedstock handling, feedstock milling and truck traffic. The VOC emissions from the CO2 scrubber vent and truck and rail loadout can be significant and the process design in these areas is important in limiting the emissions. Process vents should be routed to an appropriate VOC capture or destruction device (thermal oxidizer or boiler) to limit emissions. Feedstock handling and feedstock milling will create PM emissions and the efficiency of dust collection systems in these areas is an important factor in limiting PM emissions. Truck traffic will increase PM emissions and a dust mitigation program may be needed to suppress road dust.

99
Figure 7 – Air permit flow chart for criteria pollutants (source: T. Potas, Environmental Resource Group)
Source Exempt under state regs?
No permitrequired
Yes No
Source CategoryIdentified in 40 CFR
52.21
Yes No
PTE < 100 tons/year?
No Yes
Source is Minor for Title V & PSD
Source is Major for Title V & PSD
PTE < 250 tons/year?
NoYes
Source is Major for Title V & Minor for PSD
Source is Major for Title V & PSD
PTE < 100 tons/year?
NoYes
Source is Minor for Title V & PSD

100
The estimated emissions for a 70 MMGPY dry mill ethanol plant are shown in Table 37. The “Process Vents” and “Truck and Rail Loadout” vents are routed to the Thermal Oxidizer (T.O.), which reduces the VOC emissions by 99%. The importance of treating these sources of emissions is apparent. The “CO2 Scrubber” vent is the discharge from the scrubber that recovers ethanol from the fermenter vents. This vent is not routed to the thermal oxidizer because of the volume of CO2 in the gas stream. The VOC recovery efficiency of the scrubber is an important consideration for this emissions source. A 70 MMGPY bioethanol plant would have emissions similar to those shown in Table 37 with the exception of the “DDGS Dryer/T.O.” emissions source. In a bioethanol plant a lignin residue or natural gas boiler would replace this emissions source. For the design considered in this study, we have assumed that both the Indiana and Nebraska bioethanol plants would include a natural gas boiler. The emissions from a natural gas boiler should not be greater than the DDGS Dryer/T.O. emissions shown in the table. If this is the case, a 70 MMGPY bioethanol plant should be a Minor Source of air emissions. The design and emissions control equipment in the bioethanol facility will have a significant impact on the emissions and could change the classification to a Major Source, however.
Table 37 – Estimated emissions (tpy) for a 70 MMGPY dry mill ethanol plant
Emissions Source CO NOX VOC PM HAPs DDGS Dryer/T.O. 62 68 12 11 <1 Process Vents 3 1 CO2 Scrubber 32 <1 Fuel Storage 3 <1 Truck & Rail Loadout 14 Other Equipment 4 Feedstock Handling 16 Hammer Mill 6 Truck Traffic 10 Totals (tons/year) 62 68 68 32 <1
Source: derived from data from ICM, Inc of Colwich, KS An important consideration when establishing the size of a bioethanol facility is the amount of air emissions. The facility should be designed to be a Minor Source if possible. The largest emissions sources are likely be the boiler stack and the fermentation CO2 scrubber vent. Control of VOC emissions form truck and rail loadout and other process vents is also important. PM emissions from feedstock handling and milling should be limited by properly designed dust collection systems. With proper attention to the process design and equipment selection, a 70 MMGPY bioethanol facility should be a Minor Source and obtaining a construction air permit should not be a major obstacle to project development.

101
Water Use Makeup water required for a bioethanol plant is 536 gallons for each BDT of corn stover processed according to the process design provided to BBI by NREL. Table 38 shows the estimated amount of water required by the proposed bioethanol plants.
Table 38 – Estimated makeup water use for corn stover bioethanol plants
Plant Size Gal/BDT GPM Acre-ft/day 30 MMGPY 536 350 1.55 50 MMGPY 536 600 2.65 70 MMGPY 536 830 3.67
The source of makeup water for both sites will be a new well (or wells). Municipal water is not available at the sites. Well permits are required prior to drilling the wells. Water supply does not appear to be an issue at ether site and potential impacts of the water use shown in the above table is judged to be minimal.
Wastewater Discharge The amount of wastewater effluent from the proposed bioethanol facilities is shown in Table 39 based on data received from NREL. Approximately 343 gallons of wastewater is produced for every BDT of corn stover processed or 64% of the makeup water. The wastewater effluent is assumed to be treated with a combination of aerobic and anaerobic water treatment processes and the water quality is assumed to meet local water discharge requirements.
Table 39 – Estimated wastewater effluent from a corn stover bioethanol plant
Plant Size Gal/BDT GPM Acre-ft/day 30 MMGPY 536 350 1.55 50 MMGPY 536 600 2.65 70 MMGPY 536 830 3.67
The amount of wastewater produced can vary significantly with the ethanol process design and the quality of the makeup water. The values shown above are estimates only. A municipal water treatment system is not available at either site. Wastewater disposal options include discharge to surface water, use the effluent for irrigation or discharge to an evaporation pond. A National Pollutant Discharge Elimination System (NPDES) permit is required for direct discharge of wastewater to a receiving stream. The NPDES application should be submitted to the state DEQ at least six months prior to the anticipated discharge of wastewater. Discussion with the state permitting people prior to beginning the ethanol facility design is highly recommended.

102
For direct discharges to surface waters, the NPDES permit imposes limitations for biochemical oxygen demand (BOD), total suspended solids (TSS), pH, dissolved oxygen, toxicity and possibly nitrogen compounds, metals and other pollutants of concern that could degrade the receiving stream. It is critical that the receiving stream be evaluated prior to siting the new ethanol facility. If the receiving stream is impaired due to pollutants of if there isn’t adequate stream data, the issuance of the NPDES permit could be delayed indefinitely while data is collected and Total Maximum Daily Load for the stream is developed. An NPDES permit is also required for land application of discharge effluent through an irrigation system. The land application site must be an appropriate distance from drinking water wells, surface waters and public areas. The NPDES permit in this case will likely imposes limitations for nitrogen compounds, chloride, conductivity, BOD and TSS. An ethanol facility that does not discharge wastewater is not required to have an NPDES permit. Use of an evaporation pond typically results in the buildup of sludge in the pond that is periodically removed, however. The disposal of the resulting solid waste would likely be regulated by the state DEQ.
Storm Water Two permits are required for storm water discharge – one during construction and one for operations. Both permits require the development and implementation of a Storm Water Pollution Prevention Plan. Notice of construction start and finish is required. The construction storm water discharge permit can generally be obtained in Nebraska within 7 days after submitting the application. The operations storm water discharge permit is typically approved within 30 days of submission.
Hazardous Chemicals The use of certain hazardous chemicals above regulated quantities will trigger Superfund Amendments and Reauthorization Act (SARA) requirements and Emergency Planning and Community Right-to-Know Act (EPCRA) requirements. There are four major sections of SARA Title III:
• Emergency Planning • Emergency Chemical Release Notification • Community Right-to-Know Reporting • Toxic Chemical Release Reporting
Ethanol plants typically are required to file a Risk Management Plan and other requirements of SARA Title II may also apply.

103
Hazardous Waste It is not expected that hazardous waste will be produced directly by the corn stover-to-ethanol process. Maintenance operations could produce hazardous waste however, and the following waste streams should be considered as potential sources. A waste determination should be performed when in doubt.
• Distillation still bottom sludges • Distillation fusel oils • Sludges from floor drains • Wastewater treatment sludges • Strong acids and bases • Maintenance and office wastes including:
o Parts washer solvent and sludges o Spent oil o Cleaning products o Fluorescent light bulbs and high intensity discharge lamps o Empty aerosol cans o Paint wastes and paint solvents o Batteries o Computer monitors
Maintenance materials and procedures as well as common office materials can impact the generation of hazardous waste and this should be considered when specifying these materials.
Solid Waste The bioethanol production process as specified by NREL for this project will have only one significant source of solid waste. The detoxification process following pretreatment includes overliming which creates a product stream that is primarily gypsum and other compounds. As currently envisioned the process will not produce gypsum at a purity sufficient for use in other applications such as wall board manufacture. NREL estimates the gypsum stream will be about 80% gypsum. The Georgia Pacific gypsum wallboard plant at the Indiana site requires 95% gypsum for its feedstock. It may be possible to use bioethanol process gypsum byproduct as a soil amendment, but its value in this application is uncertain. We have assumed that the gypsum stream is non-hazardous and will be land filled. The resulting environmental impacts should be minimal. A solid waste disposal permit may be required. NREL’s typical or standard lignocellulosic design for the conversion of corn stover to ethanol includes a boiler to combust the lignin residue. The boiler would produce an ash waste stream requiring disposal. The Indiana and Nebraska bioethanol plants are assumed to sell their lignin residue to the adjacent coal fired power plant, so there is no ash waste stream associated with the bioethanol plant. The bioethanol plant’s natural gas fired boiler will not produce an ash waste stream.

104
Summary of Required Permits
The permits discussed in this section plus additional permits that normally are required for fuel ethanol plants are shown in Table 40. There may be other permits required for specific locals or for “non-standard” plant designs.
Table 40 – Summary of required permits for fuel ethanol plants
Pre-Construction Wetland Replacement Plan Application Archeological Survey Highway Access Permit Construction Air Permit Storm Water Construction Permit Site Zoning Letter
Building Permits Mechanical Electrical Structures Septic Tank & Drain Field Permit Fire Protection Permit Above Ground Storage Tank Permit Well Application Permit Joint Utility Location
Pre-Startup NPDES Storm Water Permit Storm Water Pollution Plan NPDES Wastewater Permit Risk Management Plan BATF Permit
Post-Startup Operation Air Permit
Local Community Impacts Community impacts that require evaluation include visual impacts, noise and possible odors from the ethanol plant as well as increased truck traffic due to corn stover deliveries and shipment of ethanol product.

105
Siting of the ethanol facility has the greatest influence on the resulting community impacts. Ethanol plants are industrial facilities and should not be located near residential communities. Locations that required feedstock and products to be routed through town should be avoided. Visual impacts are difficult to eliminate because of the size of the facility, but a good site will minimize visual impacts. Scrubbers, carbon absorbers and thermal oxidizers can minimize odor concerns. Special attention should be paid to the wastewater treatment system and the possible generation of hydrogen sulfide with its rotten egg smell, which is detectable at just a few parts per billion. The proposed site for the Wheatfield, IN bioethanol plant is on the property of the RM Schahfer Generating Station, which is an industrial site in a relatively rural area. There are homes near the proposed site that would be impacted to some degree by the bioethanol facility. The proposed site for the Grand Island, NE bioethanol plant is also in a rural area with the same concerns. Co-location Impacts and Benefits Use of the bioethanol lignin residue for boiler fuel in the adjacent coal fired power plant could have both positive and negative impacts on the power plant operations. Most of the comments here are based on feedback from senior management at the RM Schahfer Generating Station in Wheatfield, Indiana. First and foremost the power plant is not going to use the lignin residue if it will endanger personnel in any way or negatively impact the efficiency or capacity of the power plant. NIPSCO management said a venture involving the use of lignin must improve their bottom line if they are to consider its use. Steam is unlikely to be available for ethanol production from existing coal fired power plants. The reason is that the boiler and turbine generators are the most expensive part of the power plant and excess capacity is rarely, if ever, built into these systems. Also, the boiler is sized to match the needs of the turbine generator so “excess” steam would not be available and finally, NOx requirements in the air permit could limit the amount of steam generated in a coal-fired facility. Last but not least, there were major concerns about burning lignin in the RM Schahfer boilers. For obvious reasons, the generating facility is very concerned about the composition and physical characteristics of the fuel being burned in their boiler. The boilers do not have grates, so the lignin must burn quickly and completely. The moisture content of the lignin residue might be too high to accomplish fast and complete combustion. The power plant boilers have had plugging problems when burning wet coal with about 25% moisture. The bioethanol lignin residue as currently designed would have about 50% moisture. There are also concerns about how the lignin would be conveyed to the boiler. Since the RM Schahfer Generating Stations sells its gypsum to Georgia Pacific, there is concern that the introduction of lignin into the boilers could diminish gypsum sales to GP. Impacts on boiler bottom ash and fly ash are also possible concerns.

106
Potential operational and environmental impacts would have to be well understood before a new fuel such as lignin residue is introduced into the RM Schahfer power plant boilers. Other power plant owners would certainly have the same concerns. A significant testing and research program may be needed before the power plant would use lignin residue for fuel. Large quantities of lignin, which are currently very difficult and expensive to produce, would likely be required for such a program. Environmental Summary and Recommendations The air quality permitting for an ethanol plant has gone through a dramatic transformation over the last 18 months. Recent discoveries by the EPA which indicate that air emissions from many ethanol facilities are greater than previously thought will likely result in more stringent regulations. The EPA is currently working with ethanol producers to better define these emissions. Ethanol producers are rapidly implementing new technologies, such as thermal oxidizers, to control emissions in order to come into compliance. Based on the assumptions stated in this report, and the air permitting regulations in place at the time of this report, the feasibility of obtaining air permits for the proposed bioethanol facilities is excellent. The most significant issue is the boiler emissions for larger bioethanol facilities and remaining a Minor Source. Permitting a Major Source facility will be more difficult, more time consuming and more expensive. Operational monitoring and reporting requirements will also be more expensive. The timeframe from the preparation of the air permit application to the issuance of an air license is estimated to be approximately 6 to 12 months for a Minor source and more than a year for a Major Source. Obtaining other permits for the proposed bioethanol facilities should be no more difficult than permitting a corn dry mill ethanol plant. Environmental impacts and community impacts would also be very similar to those for a dry mill. Locating the bioethanol facility away from residential areas can minimize community impacts. An industrial park or land zoned “industrial” may not be suitable if it is near towns and communities. Wetlands and areas with known endangered species and archeologically sensitive areas should also be avoided when siting the ethanol facility.

107
VII. SOCIOECONOMIC ISSUES
Construction and operation of bioethanol plants in Indiana and Nebraska will create significant economic activity in local communities where the new production facilities are located. The ethanol plant construction and operation will involve expenditures, income, employment and payment of taxes. The expenditures of any business become the income of other businesses or individuals, which in turn is re-spent in the economy to provide income for others. Thus the initial economic activity has a multiplier effect that ripples through the economy. Economic impact analysis is an analytical method that provides a measure of the economic effects of an activity within a specified region. BBI has estimated the economic impacts of ethanol production from corn stover for 30, 50 and 70 MMGPY bioethanol plant sizes. The final demand impact, household earnings impact and job impacts were estimated by applying the appropriate final demand multipliers calculated by the U.S. Bureau of Economic Analysis for output, earnings, and employment to the estimates of new capital spending and annual operating expenditures associated with the proposed bioethanol plants. The resulting economic impacts are reported as estimated changes in the economic base (final demand), income, jobs and taxes resulting from ethanol production in Indiana and Nebraska. Analysis Inputs The inputs required for the economic analysis are the ethanol project direct impacts divided into construction phase impacts and operations phase impacts. This distinction is important because the construction phase impacts are a one-time event while the operations phase impacts are ongoing impacts. Construction phase impacts for the bioethanol plant are assumed to occur over a 16-month construction and startup period, while the operations phase will normally last many years and is characterized by expressing the impacts on an annual basis. This distinction is important because the construction and operations impacts are usually very different in character as well as magnitude. Construction may bring temporary workers into the area that take up temporary residences near the site and therefore have a different impact than the permanent workers and contractors of the operations phase. The following tables list the analysis inputs for 30, 50 and 70 MMGPY plants based on the estimated cost to construct and operate the proposed corn stover feedstock bioethanol plants at the Indiana and Nebraska sites. The construction and operating costs in the table are discussed in the cost estimate and financial sections of this report. Operating expenditures include all payments made directly by the ethanol plant owner. These payments include all production and administrative costs projected for the first full year of commercial operation for the project.

108
Table 41 – Economic Impact Analysis Inputs for Indiana Bioethanol Plant Construction Phase Impacts 30 MMGPY 50 MMGPY 70 MMGPY
Bioethanol Plant Capital Cost (millions) $73.7 $103.1 $129.9 Operations Phase Impacts
Operating Expenditures (millions) $32.4 $52.1 $71.7 Bioethanol Plant Direct Jobs 49 60 71
Table 42 – Economic Impact Analysis Inputs for Nebraska Bioethanol Plant Construction Phase Impacts 30 MMGPY 50 MMGPY 70 MMGPY
Bioethanol Plant Capital Cost (millions) $73.6 $103.0 $129.7 Operations Phase Impacts
Operating Expenditures (millions) $28.1 $44.9 $61.6 Bioethanol Plant Direct Jobs 49 60 71
Results The economic impact analysis results for the Indiana and Nebraska bioethanol plants are presented in the two tables below. There are three primary measures of economic impact presented in the tables, which should be considered separately. These are income, employment and taxes. Income and employment include both indirect and induced impacts. Taxes are estimated for both local and state level based on average tax rates in the Midwest. The results are separated into the construction phase and operations phase impacts. Construction phase and operations phase impacts should be considered separately and should not be added together. Although the impacts are expressed in the same manner, they are not directly comparable. The construction spending associated with building a 50 MMGPY bioethanol plant will add approximately $250 million to the final demand in the local economy and generate $81 million in new household income and provide for more than 2,500 direct and indirect jobs during construction. During operations the 50 MMGPY bioethanol plant will create from 534 to 610 new jobs depending upon where the plant is located. New household income will be approximately $17 million annually and annual state and local taxes are estimated to be $1 million on new earnings. The results for the 30 and 70 MMGPY plants are shown in Table 43 and Table 44.

109
Table 43 – Economic Impacts of Bioethanol Production in Indiana
Construction Phase Impacts 30 MMGPY 50 MMGPY 70 MMGPY
Bioethanol Plant Capital Cost (millions) $73.7 $103.1 $129.9 Final Demand Impact (millions) $178.8 $250.3 $315.2 Earnings Impact (millions) $58.1 $81.3 $102.3 Employment Impacts (indirect jobs) 1,813 2,538 3,196
Operations Phase Impacts 30 MMGPY 50 MMGPY 70 MMGPY
Local Spending (millions) $32.4 $52.1 $71.7 Final Demand Impact (millions) $63.5 $102.2 $140.6 Earnings Impact (millions) $11.3 $18.2 $25.0 Employment Impacts (direct jobs) 49 60 71 Employment Impacts (indirect jobs) 342 550 757 Total Jobs 391 610 828 State & Local Tax on Earnings (millions) $0.7 $1.1 $1.5
Table 44 – Economic Impact of Bioethanol Production in Nebraska Construction Phase Impacts 30 MMGPY 50 MMGPY 70 MMGPY
Bioethanol Plant Capital Cost (millions) $73.6 $103.0 $129.7 Final Demand Impact (millions) $178.6 $250.0 $314.7 Earnings Impact (millions) $58.0 $81.1 $102.2 Employment Impacts (indirect jobs) 1,811 2,535 3,192
Operations Phase Impacts 30 MMGPY 50 MMGPY 70 MMGPY
Operating Expenditures (millions) $28.1 $44.9 $61.6 Final Demand Impact (millions) $55.1 $88.1 $120.9 Earnings Impact (millions) $9.8 $15.7 $21.5 Employment Impacts (direct jobs) 49 60 71 Employment Impacts (indirect jobs) 297 474 651 Total Jobs 346 534 722 State & Local Tax on Earnings (millions) $0.6 $1.0 $1.3

110
VIII. MARKET ISSUES FOR BIOETHANOL For each of the project sites we examined the local, regional and national ethanol markets and considered the potential impacts of current policy, legislative, regulatory and market debates. We also compared bioethanol production from corn stover with ethanol produced from dry mill ethanol projects proposed for Nebraska and Indiana and other sites in the Midwest. Modes of ethanol transportation and costs were also evaluated for the Nebraska and Indiana sites. Market Overview Currently there are 66 commercial fermentation ethanol production facilities in the United States with 10 new plants under construction (Table 45). Fuel ethanol production capacity in the United States has just recently exceeded two billion gallons annually. Capacity under construction is 345 million annual gallons. Ethanol’s primary purpose is to serve as an octane extender for gasoline, a clean air additive in the form of an oxygenate, and as an aid in the reduction of America’s dependence on imported oil, thereby reducing our balance of trade. In order to accomplish these tasks in the face of resistance from the oil industry, Congress established an incentive in the form of a tax credit during the mid-70’s designed to encourage the oil industry to blend ethanol. The tax incentive continues today and was recently extended to 2007. It is BBI’s opinion that the federal tax incentive will be extended beyond 2007. The current $0.053 per gallon tax credit is an exemption from the Federal Gasoline Excise Tax paid by gasoline marketers. This tax credit allows gasoline marketers to supply a higher octane, cleaner burning gasoline to their customers and reduce their tax liability in the process. While petroleum-based products are normally the first choice of the oil industry, ethanol is gaining market share as federal clean air standards and short gasoline supplies continue to tighten for gasoline marketers. New restrictions on automobile emissions, reductions in carbon monoxide, smog mitigation programs in major cities, and a general trend toward the reduction of greenhouse gas emissions, continue to drive the demand for ethanol. Discoveries of ground water contamination by methyl tertiary butyl ether (MTBE), ethanol’s primary competitor, have spurred even greater interest in ethanol blends. The refining capacity in the United States continues to decline while gasoline consumption continues to increase. The slightest upset in refining capacity (fire, shutdown, closure) sends gasoline prices soaring. U.S. refining capacity is not keeping pace with increasing demand. Ethanol plays a key role in helping refiners extend their product by as much as 10%.

111
MTBE currently has about two-thirds of the oxygenate market in the United States. Since incidences of ground water contamination have occurred in thousands of wells in California and in the Northeast, where MTBE is the predominant oxygenate, there have been demands for the discontinuation of its use. In March 2000 the EPA issued an Advance Notice of Proposed Rulemaking that could result in a total ban of the use of MTBE. Ethanol, a fully biodegradable product, will likely fill the void left in California and other parts of the country where the use of MTBE is banned. Ethanol demand is expected to increase at a very aggressive pace with current market, environmental and political forces all driving demand for ethanol higher. Today’s two billion gallon per year demand is expected to grow to at least five billion gallons by the year 2012. If the use of MTBE is phased out on a national level in the next few years and the RFG oxygenate requirement remains unchanged, a doubling of ethanol demand would occur much sooner.

112
Table 45 – U.S. Ethanol Production Capacity COMPANY LOCATION FEEDSTOCK CAPACITY (mmgy)**
A.E. Staley Loudon TN Corn 60
ACE Ethanol* Stanley WI Corn 15 Adkins Energy* Lena IL Corn 40 Ag Processing, Inc.* Hastings NE Corn 52 Agri-Energy, LLC* Luverne MN Corn 20 Alchem LLP Grafton ND Corn 10.5 Al-Corn Clean Fuel* Claremont MN Corn 30 Archer Daniels Midland Decatur IL Corn 950 Archer Daniels Midland Peoria IL Corn included above Archer Daniels Midland Cedar Rapids IA Corn included above Archer Daniels Midland Clinton IA Corn included above Archer Daniels Midland Walhalla ND Corn 28 Broin Enterprises Scotland SD Corn 8 Cargill, Inc. Blair NE Corn 75 Cargill, Inc. Eddyville IA Corn 35 Central Minnesota Ethanol Co-op* Little Falls MN Corn 19 Chief Ethanol Hastings NE Corn 62 Chippewa Valley Ethanol* Benson MN Corn 21 Corn Plus* Winnebago MN Corn 44
Dakota Ethanol LLC* Wentworth SD Corn 45 DENCO, LLC.* Morris MN Corn 20 ESE Alcohol Leoti KS Seed Corn 1.5 Ethanol2000* Bingham Lake MN Corn 28 EXOL, Inc.* Albert Lea MN Corn 38
Glacial Lakes Energy LLC* Watertown SD Corn 40 Golden Cheese Co of California Corona CA Whey 5 Golden Triangle* Craig MO Corn 20 Gopher State Ethanol St. Paul MN Corn 15 Grain Processing Corp. Muscatine IA Corn 10 Heartland Corn Products* Winthrop MN Corn 35 Heartland Grain Fuels LP* Aberdeen SD Corn 8 Heartland Grain Fuels LP* Huron SD Corn 14 High Plains Corporation York NE Corn 50 High Plains Corporation Colwich KS Milo / Corn 20 High Plains Corporation Portales NM Milo 15 J.R. Simplot Company Caldwell ID Potato Waste 3 J.R. Simplot Company Burley ID Potato Waste 3 Land O' Lakes* Melrose MN Cheese Whey 2.5 Manildra Ethanol Corporation Hamburg IA Corn / Wheat Starch 8 Merrick/Coors Golden CO Waste Beer 1.5 Midwest Grain Products, Inc. Pekin IL Corn / Wheat Starch 65 Midwest Grain Products, Inc. Atchison KS Corn / Wheat Starch 25

113
COMPANY LOCATION FEEDSTOCK CAPACITY (mmgy)**Miller Brewing Olympia WA Brewery Waste 0.7 Minnesota Corn Processors* Columbus NE Corn 100 Minnesota Corn Processors* Marshall MN Corn 40 Minnesota Energy* Buffalo Lake MN Corn 18 New Energy Corp. South Bend IN Corn 85 Northeast Missouri Grain Processors* Macon MO Corn 21 Northern Lights Ethanol, LLC* Big Stone City SD Corn 40 Permeate Refining Hopkinton IA Sugars & Starches 1.5 Plover Ethanol Plover WI Seed Corn / Whey /
Potato Waste 3
Pro-Corn LLC* Preston MN Corn 36
Quad-County Corn Processors* Galva IA Corn 18 Reeve Agri-Energy Garden City KS Corn / Milo 12
Siouxland Energy & Livestock Coop* Sioux Center IA Corn 14 Sunrise Energy* Blairstown NE Corn 7 Sutherland Sutherland NE Corn 15
Tall Corn Ethanol LLC* Coon Rapids IA Corn 40 Tri-State Ethanol Company* Rosholt MN Corn 15
U.S. Energy Partners LLC Russell KS Milo / Wheat Gluten 40 U.S. Liquids Louisville KY Beverage Waste 4 U.S. Liquids Bartow FL Beverage Waste 4 U.S. Liquids R. Cucamonga CA Beverage Waste 4 Williams Bio-Energy Pekin IL Corn 100 Nebraska Energy (Williams Energy) Aurora NE Corn 35 Wyoming Ethanol Torrington WY Corn 5
TOTAL CAPACITY 2,600
U.S. ETHANOL PLANTS UNDER CONSTRUCTION
COMPANY LOCATION FEEDSTOCK CAPACITY (mmgy)**
Badger State Ethanol* Monroe WI Corn 40 Great Plains Ethanol LLC Chancellor SD Corn 40 Husker Ag Processing LLC* Plainview NE Corn 20 James Valley Ethanol, LLC Groton SD Corn 45 KAAPA Ethanol, LLC* Axtell NE Corn 40 Little Sioux Corn Processors* Marcus IA Corn 40 Michigan Ethanol LLC* Caro MI Corn 40
Midwest Grain Processors* Lakota IA Corn 45 Northeast Iowa Grain Processors* Earlville IA Corn 15 Pine Lake Ethanol* Steamboat Rocks IA Corn 20
TOTAL CAPACITY 345
* Farmer-owned cooperative. ** Million gallons per year. Updated August 12, 2002 Source: BBI International

114
Local Ethanol Markets
Nebraska Current fuel ethanol production in Nebraska is 375 million gallons per year while instate use is estimated at about 22 million gallons per year (MMGPY). Nebraska is obviously a net exporter of ethanol. A new 70 MMGPY plant would represent a 19% increase in the state’s ethanol production. Ethanol production in Nebraska is shown in Table 46 below. Local markets are likely to be very small and a significant portion if not all of the ethanol from a plant in Grand Island would be shipped out of Nebraska. This should not be a problem for the project as ethanol is shipped to virtually all states in the continental U.S. and there are significant markets to the south and west where the project would enjoy a freight advantage.
Table 46 – Nebraska Ethanol Production
Company Location Feedstock Ethanol Production (MMGPY)
Chief Ethanol Fuels Hastings Corn & milo 65 Ag Processing, Inc. Hastings Corn & milo 45 Minnesota Corn Processors Columbus Corn 80 High Plains Corporation York Corn & milo 50 Cargill Blair Corn 85 Nebraska Energy, L.L.C. Aurora Corn & milo 35 Sutherland Ethanol Company, LLC. Sutherland Corn 15
State Total 375 Source: BBI International
Proposed Project

115
Indiana There is one ethanol plant in Indiana – the New Energy Corporation plant in South Bend with a nameplate capacity of 85 million gallons per year. In-state use is estimated at about 95 million gallons per year. Indiana is a small net exporter of ethanol. A new 70 MMGPY plant would represent about an 82% increase in the state’s ethanol production. Local markets for project in Wheatfield, IN are the Chicago and Indianapolis markets. There are significant regional and national markets to the east of the project where IBEC would enjoy a freight advantage. Regional Ethanol Markets Typically a regional market is one that is outside of the immediate local market, yet is within the state as well as neighboring states. This market will likely be serviced by rail, and is within a 450-mile radius of the plant.
Nebraska The regional markets for an ethanol plant in south central Nebraska would include Denver, Kansas City, St. Louis, Chicago, Madison, Milwaukee, Minneapolis, Des Moines, Cedar Rapids, and Omaha. There are other cities within this circle that might also be classified as regional accounts. The plant is well positioned to ship product south to Texas and to the West Coast.
Table 47 – Ethanol Use in Nebraska and Neighboring States
State Total Ethanol Consumed in 1999 (gallons)
Nebraska 22,127,000 Colorado 47,925,000 Kansas 5,252,000 Missouri 15,257,000 Iowa 70,900,000 South Dakota 19,124,000 Wyoming -
Total 180,586,999 Source: U.S. Department of Transportation Highway Statistics 1999
Generally, the regional market is good business to develop. The freight is reasonable, the competition, while aggressive, is not too severe, and the turn-around time on the rail cars is an advantage. In addition, it is often easier to obtain letters of intent to purchase product from regional buyers than from national buyers. These letters, while not binding,

116
do tend to raise the comfort level of the financial lending institutions. Not surprising in a regional market, letters of intent to purchase are taken quite seriously by the buyer. The regional market for a Grand Island, NE plant in this case is still in an oversupply situation, however. The ethanol production in Iowa alone is more than the ethanol consumed in the regional market in the above table. Also not included is the rising production from facilities both existing and coming on line in North and South Dakota of approximately 100 million gallons per year. Regional pricing tends to follow national pricing less the freight difference. As with national markets, the use of a group-marketing program or a broker is advantageous, especially in the first one to three years of operation.
Indiana The regional markets for an ethanol plant in northwest Indiana would include the greater Chicago area, Milwaukee, Madison, Minneapolis, Kansas City, St. Louis, Memphis, all of Ohio, Pittsburgh and Detroit. There are other cities within this circle that might also be classified as regional accounts. A plant in Wheatfield, IN would be well positioned to ship product to the east and should have a freight advantage in this regard. Other than New Energy in South Bend, Indiana, the only ethanol production east of Wheatfield is A.E Staley in Louden, TN (45 MMGPY) and Parallel Products in Bartow, FL and Louisville, KY (8 MMGPY combined). Shipping product to the west may be less desirable because there are several very large ethanol plants just to the west in Central Illinois.
Table 48 – Ethanol Use in Indiana and Neighboring States
State Total Ethanol Consumed in 1999 (gallons)
Indiana 95,281,000 Michigan 35,898,000 Ohio 207,956,000 Kentucky 3,298,000 Illinois 215,565,000
Total 557,999,999 Source: U.S. Department of Transportation Highway Statistics 1999

117
National Ethanol Markets Recently, California has been the focus of a major ethanol campaign as MTBE is now being phased out. California requested a waiver from the EPA’s minimum oxygen requirements for reformulated gasoline in ozone non-attainment areas. The waiver was categorically denied in June 2001, setting off the current expansion plans in the ethanol industry. Shortly, thereafter, Governor Davis announced that he would push back the phase-out of MTBE one year, from January 2003 to January 2004, over concerns of insufficient supply of ethanol. However, most refiners and gasoline marketers in the state (BP Amoco, Shell Oil, Exxon Mobil and Phillips Petroleum) intend to proceed with the replacement of MTBE with ethanol as scheduled (by the end of 2003). ChevronTexaco is the only remaining major refiner in California that hasn’t made a definitive public statement regarding their timetable for eliminating the use of MTBE in California. California is the largest gasoline market in the United States and represents an oxygenate market equivalent to approximately 750 million gallons of ethanol per year. The state has consumed a third of all MTBE used in the U.S. and represents a fifth of all worldwide consumption. It is expected that the requirements to replace MTBE will draw significant U.S. supplies of ethanol to the West Coast. While there is a great deal of focus on California, another emerging ethanol market is in the Northeast. As in California, the primary drivers are the health and water concerns surrounding the use of MTBE. The market potential for ethanol in the Northeast is estimated at about one billion gallons annually. The ultimate size of the California and Northeast markets will depend on how the RFG oxygenate and MTBE debate plays out in the political arena. Major national ethanol markets are shown in the table below.
Table 49 – Major National Ethanol Markets
State Total Ethanol Consumed in 2000 (gallons)
Arizona 15,701,000 California (2000 / Projected) 59,585,000 / 650,000,000 Oregon 12,566,000 Washington 29,996,000 Nevada 25,843,000 Colorado 54,102,000 New Mexico 23,910,000 Michigan 85,007,000 Ohio 211,878,000 Pennsylvania 36,568,000 Texas 58,595,000 Total (2000 / Projected) 613,851,000 / 1,638,510,000
Source: U.S. Department of Transportation Highway Statistics 2000

118
Ethanol Pricing Historical ethanol, corn and gasoline prices are shown in the following chart. Ethanol prices tend to track the wholesale gasoline price plus the federal tax incentive of 54¢ per gallon (now 53¢ per gallon). In 1996 the ethanol price increased dramatically when high corn prices caused many ethanol plants to curtail operations or shutdown.
Figure 8 – Average U.S. Market Pricing of Ethanol, Gasoline and Corn
0.0
0.2
0.4
0.6
0.8
1.0
1.2
1.4
1.6
1989 1990 1991 1992 1993 1994 1995 1996 1997 1998 1999 2000
$/G
allo
n
Ethanol $/Gal Corn $/Gal Ethanol Wholesale Gasoline $/Gal
Wholesale Gasoline Data Source: DOE U.S. Refiner Prices of Petroleum Products for Resale Corn and Sorghum Data Source: USDA. Ethanol Data Source: Hart’s Oxy-Fuel News Prepared by BBI International. Historical local ethanol pricing is shown in the chart below for the Lincoln, NE and Chicago markets. Weekly spot ethanol pricing published in Oxy Fuel News is shown in the chart. The average ethanol price in the Lincoln market from January 1990 through May of 2002 was $1.22 per gallon. The average price during the same period in the Chicago market was $1.21 per gallon. The trend in ethanol pricing is up as shown by the linear trend line on the chart below. The market price and value of fuel ethanol depends on a number of variables discussed here. These include its value from volume contribution to gasoline blends, octane enhancement, tax credits, and when applicable, its value as an oxygenate for regulatory compliance. On the other hand, ethanol value is reduced due to its need for special handling (it has a high affinity for water) and its impact on increasing fuel volatility. Ethanol’s energy content is also lower than gasoline although this is not reflected in industry value calculations or price formulas. As with any transportation motor fuel or motor fuel component, ethanol prices are also affected by supply and demand. Ethanol pricing and value are not always well synchronized, however.

119
Figure 9 – Historical ethanol pricing in Chicago, IL and Lincoln, NE
It is important to recognize historical ethanol pricing trends since, to some degree, they contribute to today’s ethanol pricing mechanisms and a consequent discounting of ethanol’s market value. In the late 1970s and early 1980s, ethanol was originally promoted as a product extender. At that time gasoline prices were relatively high and there were a number of state tax credits (especially in agriculturally oriented Midwestern states) that enabled ethanol to compete with gasoline. Also, at the time there was only, what we call today, conventional gasoline. Later ethanol was promoted not only as an economical way to extend gasoline supply but also to increase octane. In this manner ethanol was priced comparable to gasoline (net of available tax credits). This enabled marketers to add ethanol to unleaded regular and sell it as a mid-grade or to blend a mixture of unleaded regular and premium sell it as a premium grade. However ethanol production increased dramatically in the 1980s and in order to encourage more widespread use of ethanol, ethanol producers priced much of their product below the price of gasoline (net of tax credits) to encourage blenders and marketers to use it in all three grades (i.e., regular, mid-grade, premium) so as to develop sufficient demand for this increased ethanol supply. This set the stage for a certain amount of octane giveaway on the unleaded regular grade. During this timeframe the pricing mechanism was basically as follows:
GP + (10 x FETC) + (10 x SC) - MI = Ethanol Price where:
GP = wholesale or rack gasoline price
Historical Ethanol Prices
$0.80
$1.00
$1.20
$1.40
$1.60
$1.80
$2.00
1990
1991
1992
1993
1994
1995
1996
1997
1998
1999
2000
2001
2002
Etha
nol p
rice/
gal
Chicago Lincoln Linear (Chicago)

120
FETC = Federal Excise Tax Credit SC = state credit MI = margin improvement
Using today’s federal gasoline excise tax credit, a $0.02 state tax incentive and a wholesale gasoline price of $0.60 and a margin improvement of $0.01 per blended gallon (i.e. $0.10 per gallon of ethanol), an example of the formula would be as follows:
$0.60 + (10 x $.053) + (10 x $0.02) - $0.10 = $1.23 The example formula allows the blender to improve their product margin by $0.01 per gallon on the unleaded grade. During periods of extreme ethanol oversupply, it has not been uncommon for ethanol producers to increase the margin incentives to $0.02 or more per blended gallon to induce more companies to initiate blending programs. This was usually done on a regional basis with higher margins being offered in states with tax credits. Such markets were also often in states near ethanol plants with lower attendant freight costs. As a result, some of today’s strongest major ethanol markets are Midwest states that offer, or formerly offered, state tax incentives. In more distant outlying markets without credits, marketers have traditionally priced ethanol closer to its value for upgrading unleaded regular to mid-grade or premium grade due to the absence of credits and greater freight charges. In those few instances when ethanol has been in tight supply, it is traditionally priced at parity to unleaded gasoline or slightly higher at which time it would be used to upgrade unleaded regular to mid-grade or to create premium grades similar to the above-mentioned outlying markets. As ethanol began to see use for its oxygen content to comply with oxygenated and reformulated gasoline programs, the ethanol price was sometimes adjusted upward to reflect its oxygen value. This was done by pricing ethanol off of, but at a discount to, MTBE. Unfortunately since ethanol has not captured the majority of the RFG market, this approach is not as common as the preceding formula although there is some variation depending on market, base fuel, and application. Nonetheless, ethanol pricing must still reflect the need for special handling and in the case of volatility controlled fuels, its negative impact on vapor pressure. Today, fuel ethanol pricing in the U.S. generally reflects the local cost of unleaded gasoline plus the value of the federal excise tax exemption of $0.053 per blended gallon plus the value of any local incentive available to the purchaser minus a $0.01 to $0.02 per gallon incentive to utilize the product. The producer normally absorbs freight charges. Ethanol pricing in clean air attainment areas is not fully reflective of its full value as an octane enhancer or of its value as an oxygenate additive. Premium pricing based on oxygen content is effective during the mandate periods in certain non-attainment areas such as the Pacific Northwest.

121
Fuel ethanol production profits are most often a function of the price of gasoline and other competing additives versus the relative "net cost" of feedstock (defined as the cost of feedstock less the value of co-products to the ethanol) plus other variable costs. Wet millers normally have a production cost advantage over dry milling operations due to the higher cumulative value of the wet mill's co-products (corn gluten feed, corn gluten meal and corn oil) over the DDGS co-product of the dry milling process. This advantage has been in the range of $0.10 per gallon of ethanol produced but that has narrowed considerably due to the decreasing trend in prices of the wet milling co-products. In either case, product and feedstock transportation cost advantages and the ability to minimize other variable expenses are essential to successfully competing in the fuel ethanol market. Ethanol Shipping Ethanol is typically shipped to markets throughout the country by barge, rail or truck with rail and truck being the most common. Few ethanol plants have access to water and are large enough to carry the inventory needed to fill a barge, let alone a multiple barge tow. A barge has a capacity of 450,000 gallons and up to 15 can be connected on the large waterways for a total volume of 6.75 million gallons. A rail car holds about 30,000 gallons of ethanol and a large semi trailer just under 8,000 gallons. The shipping costs for the Nebraska and Indiana sites will be estimated here. Neither site in this study has access to water. To determine the approximate division of product shipped by truck and rail, the percentage of ethanol shipped to local, regional and national markets must be determined. Based on the local and regional markets discussed above, BBI recommends the following market apportionment: Nebraska – 0% local (the local market is saturated), 75% regional (Denver, Kansas City, etc.) and 25% national (west coast). Indiana – 50% local (Chicago), 25% regional (Ohio) and 25% national (east coast). The average shipping costs for this market distribution are shown in Table 50.
Table 50 – Average ethanol shipping costs
Nebraska Site ¢/gal Market % ¢/galLocal shipping cost 3.0 0% 0.00Shipping cost to regional markets 5.0 75% 3.75Shipping cost to national markets 12.6 25% 3.15Average Shipping Cost 6.90 Indiana Site ¢/gal Market % ¢/galLocal shipping cost 3.0 50% 1.50Shipping cost to regional markets 5.0 25% 1.25Shipping cost to national markets 12.6 25% 3.15Average Shipping Cost 5.90

122
The shipping rates per gallon of ethanol were estimated as follows. Local shipping is assumed to be by truck up to 150 miles from the ethanol plant. The average local shipping costs are calculated as follows: 4 hrs round trip delivery time x $60/hr ÷ 8,000 gallons = $0.03/gallon Regional shipping costs are assumed to be by rail up to 450 miles from the ethanol plant. Rail shipping cost will vary with the size of the shipment (number of rail cars) with 100 car “unit trains” having the lowest overall shipping cost. The use of unit trains for shipping ethanol will be impacted by the size of the ethanol facility, the storage capacity of the receiving facility, the grade the unit train must traverse and the needs of the customer. Shipping to national markets is assumed to be to the west coast for the Nebraska site and to the east coast for the Indiana site, resulting in similar shipping distances and costs. Regional and national market rail shipping costs per gallon were estimated as follows: $1,500 per rail car ÷ 30,240 gallons = $0.05/gallon for regional markets $3,800 per rail car ÷ 30,240 gallons = $0.126/gallon for national markets The Wheatfield, IN site has about a 1¢ per gallon in overall shipping cost advantage because it is close to the Chicago ethanol market, currently the largest ethanol market in the country. There are no significant local markets near the Grand Island, NE site, but a large regional market is available for this site mitigating some of the impact of the lack of a local market. If more than 25% of the Grand Island project ethanol is shipped to the west coast, the overall shipping cost for this project will be higher than shown here. Without knowing the marketing alliances that are typically formed by new ethanol producers, it is difficult to know exactly where the ethanol product will be shipped, however. Government Regulations The fuel ethanol industry is dependent upon tax policies and environmental regulations which favor the use of the product in motor fuel blends in North America. Government incentives and state and federal regulations that will impact the proposed projects are briefly described below.
Federal Excise Tax Exemption Ethanol blends have been either wholly or partially exempt from the federal excise tax (FET) on gasoline since 1978. The exemption has ranged from $0.04 to $0.06 per gallon during that 22-year period. Current law provides a $0.053 per gallon exemption from the $0.183 per gallon federal excise tax on gasoline if the taxable product is blended in a mixture containing at least eight per cent alcohol or an approved derivative.

123
The federal excise tax exemption was revised and extended for the fifth time since its inception as part of highway funding reauthorization legislation (Transportation Efficiency Act of the 21st Century) enacted in June 1998. The new expiration date is December 31, 2007, with the incentive level being calculated in accordance with the following schedule:
Table 51 – Federal excise tax exemption schedule for 10% ethanol/gasoline blends
FET Exemption Schedule (year)
Excise Tax Exemption ($/gal of blended product)
2001 – 2002 $0.053
2003 – 2004 $0.052
2005 – 2007 $0.051
Clean Air Act Amendments of 1990 In November 1990, a comprehensive amendment to the Clean Air Act of 1977 established a series of requirements and restrictions for gasoline content designed to reduce air pollution in identified problem areas of the United States. The two principal components affecting motor fuel content are the Oxygenated Fuels Program, which is administered by the states under federal guidelines, and a federally supervised Reformulated Fuel Program.
Oxygenated Fuels Program The law requires the sale of oxygenated fuels in certain carbon monoxide non-attainment Metropolitan Statistical Areas (MSA) during at least four winter months, typically November through February. Any additional MSA not in compliance for a period of two consecutive years in subsequent years may also be included in the program. The EPA Administrator is afforded flexibility in requiring a shorter or longer period of use dependent upon available supplies of oxygenated fuels or the level of non-attainment.
Reformulated Gasoline The Clean Air Amendments established special standards effective January 1, 1995 for the most polluted ozone non-attainment areas: Los Angeles Basin, Baltimore, Chicago Area, Houston Area, Milwaukee Area, New York-New Jersey, Hartford Region, Philadelphia Area and San Diego, with provisions to add other areas in the future if conditions warrant (Sacramento was added later). At the outset of the program there were a total of 96 Metropolitan Statistical Areas not in compliance with Clean Air standards for ozone.

124
The legislation requires a minimum of 2.0% oxygen in reformulated gasoline as a means of reducing ozone pollution and replacing octane lost by reducing aromatics. The Reformulated Gasoline Program also includes a provision which allows individual states to "opt into" the federal program by request of the governor, to adopt standards promulgated by California which are stricter than federal standards, or to offer alternative programs designed to reduce ozone levels. Nearly all of the Northeast and middle Atlantic areas from Washington, D.C., to Boston not under the federal mandate have “opted into” the federal standards. These government mandates in recent years have created a variety of U.S. gasoline grades to meet different regional environmental requirements. Reformulated gasoline accounts for about 30% of nationwide gasoline consumption. Oxygenated gasoline for carbon monoxide control accounts for less than 10 percent of the nationwide total even during the October to March gasoline season. It is important to note that the mandate to supply these different grades regionally and seasonally has imposed a significant reduction in gasoline distribution flexibility, because gasoline can no longer be interchanged from one region to another, or held over from winter to summer. This lack of flexibility was one of the important contributors to the gasoline price spike experienced during 2000. MTBE Methyl Tertiary Butyl Ether or “MTBE” is a high octane, water tolerant ether produced by the reaction of refinery isobutylene with methanol supplied from sources outside the refinery. It provides one way to use methanol indirectly in motor fuel without the problems associated with use of methanol directly. Because it is a refinery-based product and also does not absorb water (a characteristic that has historically prevented ethanol shipment in pipelines), MTBE has been the oxygenate of choice to satisfy environmental and octane enhancing needs outside the ethanol producing area of the Midwest. MTBE's blending characteristics are very similar to hydrocarbons, making it acceptable for blending at the refinery and subsequent shipment through pipelines. The first MTBE plant in the U.S. commenced operations in 1979. The EPA originally permitted a 7% by volume concentration of MTBE in unleaded gasoline and later raised the limit to 15%. The total demand for MTBE in the U.S. for 1998 was reported at 203,200 barrels per day; 99.5% for use as a fuel additive and the balance of 0.5% for use as a chemical intermediate and solvent. MTBE’s use as a major additive in U.S. gasoline is ending because of ground water contamination issues discovered in most states. The EPA has announced its intention to list MTBE as a toxic substance and begin the process of requiring its removal from gasoline. California and 17 other states have enacted regulations or legislation requiring its removal during the 2003 to 2005 period (see map below). California requested a waiver from the EPA’s minimum oxygen requirements for reformulated gasoline in ozone non-attainment areas. The waiver was categorically

125
denied in June 2001, setting off the current expansion plans in the ethanol industry. Shortly, thereafter, Governor Davis announced that he would push back the phase-out of MTBE one year, from January 2003 to January 2004, over concerns of insufficient supply of ethanol. However, most refiners and gasoline marketers in the state (BP Amoco, Shell Oil, Exxon Mobil and Phillips Petroleum) are fully intending to proceed with the replacement of MTBE with ethanol as scheduled (by the end of 2003). ChevronTexaco is the only remaining major refiner in California that hasn’t made a definitive public statement regarding their timetable for eliminating the use of MTBE in California gasoline. California is the largest gasoline market in the United States and represents an oxygenate market equivalent to approximately 750 million gallons of ethanol per year. The state has consumed a third of all MTBE used in the U.S. and represents a fifth of all worldwide consumption. It is expected that the requirements to replace MTBE will draw significant U.S. supplies of ethanol to the West Coast.
Figure 10 – States Requiring the Removal of MTBE
Source: BBI International Concurrent with the activities surrounding MTBE is the request that Congress enact legislation modifying the Clean Air Act Amendments to eliminate the minimum oxygen requirement in RFG altogether, and to substitute some sort of requirement for the continued use of ethanol at current levels. A number of bills have been introduced to either eliminate MTBE and/or the oxygen standard in RFG and some to only eliminate MTBE and require that oxygen or a renewable content be present under the revised standards. The eventual outcome from all of this is widely expected to create substantial new opportunities for fuel ethanol – the issue is what the level of demand will be once the

126
requirements of the enabling legislation are known. The EPA has gone on record as supporting the current and potentially expanded use of ethanol in RFG. Policy Market Drivers
Renewable Fuels Standard The U.S. Senate version of the Energy Policy Act of 2002 (S 517) includes Section 820 commonly called the Renewable Fuels Standard (RFS). The House version of the energy bill does not include RFS language. At the time of this writing, this difference must be resolved in Conference Committee. As a nation, we have consistently acted on our commitment to having cleaner air in our urban areas. It is likely that some form of cleaner gasoline will be mandated through this legislation either through a Renewable Fuels Standard or through some form of continuation of the RFG Programs. The following section provides a summary of the important aspects of Senate Bill S 517, Section 820 that are relevant to ethanol marketing. The final language of the Conference Committee energy bill will significantly impact the future of an ethanol plant and should be carefully assessed when the bill becomes law and the language is finalized. The Senate RFS provides for a required ramp up of renewable fuels use starting in 2004 with 2.3 billion gallons and gradually increasing to 5 billion gallons in 2012. After 2012, the 2012 ratio of 5 billion gallons to actual gas consumption is used for subsequent years. Table 52 shows the amounts of renewable fuels that would be required each year under the Senate RFS.
Table 52 – Renewable Fuels Standard
Senate Renewable Fuels Standard Schedule as of 6/9/02
Year 2004 2005 2006 2007 2008 2009 2010 2011 2012Billion gallons per year 2.3 2.6 2.9 3.2 3.5 3.9 4.3 4.7 5.0
The Senate RFS language requires that "...gasoline sold or dispensed to consumers in the United States, on an annual average basis, contains the applicable volume of renewable fuel.... but shall not restrict where renewables can be used, or impose any per-gallon obligation for the use of renewables." The bill also states that the regulations "shall contain compliance provisions for refiners, blenders, and importers…” The direct requirements apply only to gasoline. Biodiesel can be used for credit trading so biodiesel producers will have to sell their credits (at whatever price the market will bear) to benefit. Cellulosic derived ethanol is credited higher at 1.5 gallon versus one gallon of non-cellulosic ethanol. It will take a number of years for cellulosic ethanol and biodiesel

127
production to ramp up enough to impact the RFS. These two sources could have some impact on the RFS in later years of the program. These provisions also provide opportunities for starch based ethanol plants to add future cellulosic ethanol production with significant economic benefits. The bill also provides provisions for credit trading which is summarized here. The Senate bill states: "...that any person who refines, blends, or imports gasoline that contains a quantity of renewable fuel that is greater than the quantity required under paragraph (2)... may use the credits or transfer all or a portion of the credits to another person, for the purpose of complying with paragraph (2)" (Note: Paragraph (2) has the compliance ramp-up table). Credit is good in the calendar year it is generated and in the next calendar year and may be good for an additional year if the RFS Program "Administrator" allows it in the regulations. So a company not in compliance can ramp up renewable fuel use in the next year (and maybe two years) and/or purchase credits from persons using renewable fuels at a rate over the required rate. The regulations do not apply to small refineries with average daily production of under 75,000 barrels per day until Jan. 1, 2008. Such small refineries can announce their early participation and opt-in and sell their credits for the following year. The "Administrator” can also set up regulations applying to the "Regulation of excessive seasonal variations." Ethanol plants that are located near a robust ethanol market may benefit from a stronger market from these provisions when refiners and blenders purchase ethanol and also benefit when prices are good in the credit trading market. An important consideration regarding the RFS and the credit trading provisions contained in the legislation is the potential for ethanol sales in the Northeast. While some have suggested that many refiners and marketers in the Northeast may opt to trade credits rather than purchase ethanol, that logic fails to take into account some of the primary drivers behind ethanol use. The refining capacity in the United States continues to decline, while gasoline consumption continues to increase. The slightest upset in refining capacity (fire, shutdown, closure) sends gasoline prices soaring. This is because the U.S. refining capacity is barely keeping pace with increasing demand. Ethanol plays a key role in helping refiners extend their product by as much as 10%. Even though the Northeast currently has some excess refining capacity, refining shortfalls in other regions of the country continue to put pressure on the Northeast refiners. This ethanol market driver, while significant in other areas of the U.S., may not be as pronounced in the Northeast. Second, the need for clean octane continues to grow in many parts of the country. Clean air standards will remain in place whether we have an oxygenate requirement in reformulated gasoline or not. Ethanol provides as much as three octane points to the gasoline into which it is blended. In addition to the octane, it helps refiners meet clean air requirements by reducing, through dilution, other various toxic components in gasoline.

128
Third, is the issue of MTBE, which will undoubtedly be phased out. Refiners know that, and are making plans to quickly move away from MTBE all across the country. The obvious remaining liquid fuel choice is ethanol. Finally, the ability of petroleum marketers to increase margins makes ethanol a sound business choice. So while it may take some time for a full switch to ethanol to occur, it is becoming increasingly apparent that in the years ahead ethanol will be the octane enhancer, fuel extender, and MTBE replacement in America’s gasoline. The Senate RFS contains two other important provisions that can impact the market for a future ethanol plant. The bill eliminates (within 270 days after the bill passes) the oxygen requirements for Reformulated Gasoline (Section 833). The bill also proposes the elimination of MTBE in four years with the exception that a state can choose to continue to use MTBE at a 0.5% level (Section 834). The phase out of MTBE will likely have a significant positive impact on the ethanol market, because ethanol is the most likely product that would be used to replace MTBE as it is phased out. MTBE and ethanol extend the volume of gasoline, enhance octane, and provide oxygen. Ethanol as an octane enhancer can substitute for benzene and other aromatic hydrocarbons. This substitution reduces the emissions of benzene and butadiene, both of which are carcinogenic. To date, the use of ethanol as an octane enhancer on the West Coast and in the Northeast has been limited due to lack of regional availability and the ready availability of MTBE. If ethanol is locally available at a competitive price, it is likely to be a preferred product to substitute for MTBE as it is phased out. In addition, a series of lawsuits filed in numerous states against oil companies who have used MTBE and as a result contaminated groundwater have made many wary of its continued use. Ethanol would provide several significant benefits to blenders and refiners. It could be used to substitute for MTBE, reducing emissions and increasing octane, and also to meet the requirements of the RFS as it ramps up. The phase out of MTBE is likely to serve as a bridge in the marketing of ethanol as the RFS requirements ramp up.
E85 Market The other developing market for ethanol is the E85 market. E85 is a blend of approximately 15% gasoline and 85% ethanol. The use of E85 requires the installation of additional infrastructure to dispense the product. The installation of E85 infrastructure is largely a political and marketing issue. The State of Minnesota has made a significant commitment to installing E85 infrastructure and currently has over 40 E85 stations. E85 represents a significant market potential but due to the difficulty in predicting the rate at which gasoline marketers will incorporate the equipment into their retail outlets and uncertainties regarding the continuation of CAFE credits, it is difficult to predict how fast the market might grow. It is important to note that legislation currently under consideration as part of the energy bill provides a very favorable environment for the growth of E85.

129
Competition The largest ethanol producer in the U.S. (and the world) is Archer Daniels Midland (ADM), with four large wet mill plants in Illinois and Iowa with a total production capacity of about 950 million gallons per year. ADM also owns a small dry mill ethanol plant in Walhalla, North Dakota. The ADM wet milling process produces ethanol at a relatively low average cost per gallon due to economies of scale and the fact that the costs are spread over a greater number of value-added products made from corn (gluten feed, gluten meal, corn germ, corn oil, corn sweetener, etc.). ADM also captures additional profits from peripheral activities to ethanol production, such as ethanol transportation and corn handling. However, their older plants lack some of the newer technologies, which enable newer plants to compete on a cost basis despite their smaller size. The remaining producers in the ethanol industry are smaller players. Including ADM, there are only six facilities in the U.S. capable of producing 100 million gallons per year or more. With a design capacity of 70 million gallons per year, the proposed bioethanol plant will be larger than all but eight of the current 66 operating ethanol plants. The plant would also be larger than all 10 ethanol plants under construction. The bioethanol plant will have a significant advantage due to economies of scale. See the figure below for a breakdown in the ethanol industry by plant size.
Figure 11 – U.S. ethanol plant distribution by capacity
US Ethanol Plant CapacitiesSource: BBI International, 2002
0
2
4
6
8
10
12
14
16
18
20
<10 10-19 20-29 30-39 40-49 50-59 60-69 70-79 80-89 90-99 >100
Plant Capacity (Million Annual Gallons)
Num
ber o
f Pla
nts

130
Comparison with Midwest Ethanol Plants The financial forecast for the 50 and 70 MMGPY bioethanol plant at the Grand Island, NE site with corn stover feedstock presented in the previous sections is compared to corn dry mill ethanol projects under development in Nebraska, Illinois and Indiana. The results are shown in Table 53. The capital cost expressed on a dollar per gallon basis to design and build the cellulosic ethanol plant is much higher than the 40 MMGPY plants under development in the Midwest. The capital cost for the cellulosic plant is $1.85 for the 50 MMGPY plant and $1.67 for the 70 MMGPY plant. The 40 MMGPY corn dry mills are about $1.20 per gallon. These costs are for the ethanol plant and do not include the owner’s costs. Owner’s costs are about 10% of the ethanol plant cost. Product values and financial assumptions are very similar for each of the projects with the exception of the feedstock price and by-product (lignin or DDGS) values. The 5-year average corn price has been used for each of the Midwest projects resulting in a feedstock cost of $1.97 in Nebraska and $2.07 in Indiana. The estimated cost of corn stover in Nebraska is $33.86 per BDT. The lignin residue has a relatively low value at $3.18 per wet ton versus $80 to $85 per ton for DDGS in the Midwest. Ethanol sales price was set at $1.21 per gallon in Nebraska and $1.20 per gallon in Indiana and Illinois. Ethanol shipping costs are $0.07 per gallon in Nebraska and Indiana and $0.05 per gallon in Illinois. Discussions with CO2 companies indicate that the CO2 could likely be sold from the Indiana dry mill plant, but not the other plants. CO2 markets must be evaluated on a case-by-case basis. The financial forecast for the corn stover project in Grand Island, NE shows a 21.0¢ per gallon net income before taxes for the 50 MMGPY plant size and 23.1¢ per gallon net income for the 70 MMGPY plant size. This compares very favorably to the dry mill projects shown. The cellulosic plant is not as competitive as the Nebraska dry mill at 28.3¢ per gallon net income, but more competitive than the Indiana and Illinois dry mills at 17.2¢ and 18.5¢, respectively. It should be noted that the Nebraska plants include the current state producer payment of 18¢ per gallon on the first 16,625,000 gallons produced each year for eight years. The key differences in the cellulosic ethanol financials and the dry mill financials is the feedstock cost which is heavily in favor of the corn stover plant with feedstock at 38¢ per gallon of ethanol versus 74 to 78¢ for corn feedstock. On the other hand, the cellulosic plant is projected to have much higher chemical costs (18¢ per gallon versus 8¢ per gallon). The higher capital cost for the cellulosic plant also translates into higher costs for interest and depreciation (17-19¢ per gallon versus 12¢ per gallon), as well as slightly higher property taxes and maintenance costs.

131
At this time there is more uncertainty in the cellulosic financial forecasts because many of the capital cost estimates and performance criteria (ethanol yield for example) are unproven at commercial scale. Cellulase enzyme is not currently available for 10¢ per gallon of ethanol as assumed in the projections. The forecast for the corn stover plant is based in large part on DOE/NREL goals for improvements to the current dilute acid pretreatment/enzymatic hydrolysis technology. The corn dry mill estimates are based on operating plants and state of the art dry mill plants under construction. The costs and performance criteria used for the dry mill estimates are typically guaranteed by the dry mill process design and construction companies and the level of risk associated with these projections is quite small.

132
Table 53 – Comparison of cellulosic and dry mill ethanol projects
Grand Island, NE Corn Stover
Grand Island, NE Corn Stover
NebraskaDry Mill
IndianaDry Mill
IllinoisDry Mill
Anhydrous Ethanol Production (GPY) 50,000,000 70,000,000 40,000,000 40,000,000 40,000,000Project Costs
Cost per Gallon $1.85 $1.67 $1.20 $1.20 $1.19Ethanol Plant Engineering & Construction $92,404,000 $116,582,000 $48,000,000 $48,000,000 $47,750,000Project Development/Owner's Costs $10,602,000 $13,117,000 $5,040,000 $6,720,000 $7,260,000
Total Project Cost $103,006,000 $129,699,000 $53,040,000 $54,720,000 $55,010,000
Product ValuesConversion Rate (Gal Ethanol/ton or Bu) 89.70 89.70 2.67 2.67 2.67Feedstock ($/BDT or $/Bu) 33.86 33.86 1.97 2.07 2.09Ethanol ($/Gal) 1.21 1.21 1.21 1.20 1.20Ethanol Shipping Cost ($/Gal) 0.07 0.07 0.07 0.07 0.05Lignin Residue or Distillers Grain ($/Ton) 3.18 3.18 85.00 85.00 80.00CO2 ($/Ton) 0.00 0.00 0.00 8.00 0.00Denaturant ($/Gal) 0.70 0.70 0.70 0.70 0.70Steam ($/1000 lbs) or Natural Gas ($/MCF) 3.00 3.00 4.00 4.50 3.80Electricity ($/kWh) 0.03 0.03 0.035 0.035 0.035
Proforma Income Statement for Year 2Sales $/Gal $/Gal $/Gal $/Gal $/Gal
Ethanol $1.209 $1.209 $1.209 $1.199 $1.221Lignin or DDGS $0.036 $0.036 $0.270 $0.270 $0.251Carbon Dioxide $0.000 $0.000 $0.000 $0.024 $0.000State Producer Payment $0.056 $0.040 $0.070 $0.000 $0.000
Total Sales $1.302 $1.286 $1.549 $1.493 $1.472
Production & Operating Expenses Feedstocks $0.381 $0.381 $0.738 $0.775 $0.783Chemicals, Enzymes & Yeast $0.180 $0.180 $0.081 $0.081 $0.081Steam or Natural Gas $0.113 $0.113 $0.163 $0.174 $0.143Electricity $0.043 $0.043 $0.036 $0.036 $0.029Denaturants $0.036 $0.036 $0.036 $0.036 $0.036Makeup Water Supply $0.003 $0.003 $0.002 $0.002 $0.003Effluent Treatment & Disposal $0.004 $0.004 $0.002 $0.004 $0.003Solid Waste Disposal $0.010 $0.010 $0.000 $0.000 $0.000Production Labor & Benefits $0.032 $0.027 $0.024 $0.026 $0.023
Total Production Costs $0.802 $0.797 $1.081 $1.134 $1.100
Gross Profit $0.500 $0.489 $0.468 $0.359 $0.372
Administrative & Operating Expenses Maintenance Materials & Services $0.030 $0.027 $0.021 $0.021 $0.023Repairs & Maintenance, Wages & Benefits $0.012 $0.010 $0.007 $0.007 $0.006Consulting Services $0.000 $0.000 $0.000 $0.000 $0.000Property Taxes & Insurance $0.038 $0.034 $0.018 $0.018 $0.018Admin. Salaries, Wages & Benefits $0.013 $0.010 $0.013 $0.013 $0.013Legal & Accounting/Community Affairs $0.001 $0.001 $0.001 $0.001 $0.001Office/Lab Supplies & Expenses $0.002 $0.002 $0.002 $0.002 $0.001Travel, Training & Miscellaneous $0.001 $0.001 $0.001 $0.001 $0.001
Total Administrative Expenses $0.096 $0.084 $0.062 $0.062 $0.063
EBITDA $0.404 $0.405 $0.407 $0.298 $0.309Less:Interest - Senior Debt $0.096 $0.086 $0.062 $0.064 $0.064Depreciation & Amortization $0.091 $0.082 $0.062 $0.062 $0.060
Annual Net Earnings Before Income Taxes $0.216 $0.237 $0.283 $0.172 $0.185

133
Conclusion for the Ethanol Market As described previously, ethanol pricing is affected primarily by the rack price of gasoline and state and federal incentives. However, an oversupply in local markets can necessitate a discounted price or higher transportation costs to get the product to a market with unsatisfied demand. The primary market drivers for fuel ethanol in the U.S. are MTBE replacement, a Renewable Fuels Standard, federal and state tax incentives, octane requirements and the Reformulated Gasoline program. The phase out of MTBE will have a significant positive impact on the ethanol market, as ethanol is the most likely product that will be used to replace MTBE as it is phased out. MTBE and ethanol extend the volume of gasoline, enhance octane, and provide oxygen. Ethanol, as an octane enhancer, can substitute for benzene and other aromatic hydrocarbons. This substitution reduces the emissions of benzene and butadiene, both of which are highly carcinogenic. To date, the use of ethanol as an octane enhancer in both California and the Northeast has been limited due to lack of regional availability and readily available MTBE. As MTBE is phased out (and BBI believes it will be), ethanol is very likely to be the preferred product to substitute for MTBE. In addition, a series of lawsuits filed in numerous states against oil companies who have used MTBE (resulting in contaminated groundwater) has made many wary of its continued use. The Senate version of the energy bill provides for a required ramp up of use of renewable fuels like ethanol. The bill if signed into law, would require 2.3 billion gallons in 2004 and gradually increases to 5 billion gallons in 2012. It is important to note that in addition to ethanol, other renewable fuels such as biodiesel are also included in the Senate Bill. Credit trading will impact renewable fuels use on the East and West coasts and a premium for the use of cellulosic ethanol may also impact the ethanol market. The refining capacity in the United States continues to decline, while gasoline consumption continues to increase. The slightest upset in refining capacity (fire, shutdown, closure) sends gasoline prices soaring. U.S. refining capacity is not keeping pace with increasing demand. Ethanol plays a key role in helping refiners extend their product by as much as 10%. The need for clean octane continues to grow in many parts of the country. Clean air standards will remain in place whether we have an oxygenate requirement in reformulated gasoline or not. Ethanol provides as much as three octane points to the gasoline into which it is blended. In addition to the octane, it helps refiners meet clean air requirements by reducing, through dilution, various toxic components in gasoline.

134
The ability of petroleum marketers to increase profits $0.01 per gallon of gasoline sold or more makes ethanol a solid business choice. So while it may take some time for a full switch to ethanol to occur, it is becoming increasingly apparent that in the next decade ethanol will be the octane enhancer, fuel extender and MTBE replacement in our gasoline.

APPENDIX

NREL Bioethanol Co-Location Study -- Wheatfield, IN SiteProduction Assumptions
Denatured Fuel Ethanol (gal/yr) 31,500,000Anhydrous Ethanol Production (gal/yr) 30,000,000Operating Days Per Year 350
1st year 2nd year 3rd Year 4th Year 5th Year 6th Year 7th Year 8th Year 9th Year 10th Year AnnualProduct Yields & Energy Consumption Operations Operations Operations Operations Operations Operations Operations Operations Operations Operations EscalationEthanol Yield (gal/BDT) 89.700 89.700 89.700 89.700 89.700 89.700 89.700 89.700 89.700 89.700Net Ethanol Selling Price ($/gal) $1.210 $1.234 $1.259 $1.284 $1.310 $1.336 $1.363 $1.390 $1.418 $1.446 2.00%Ethanol Sales Commission (%) 1.000% 1.000% 1.000% 1.000% 1.000% 1.000% 1.000% 1.000% 1.000% 1.000% 0.00%Ethanol Transportation ($/gal) $0.0590 $0.0602 $0.0614 $0.0626 $0.0639 $0.0651 $0.0664 $0.0678 $0.0691 $0.0705 2.00%State Producer Payment ($/gal) $0.000 $0.000 $0.000 $0.000 $0.000 $0.000 $0.000 $0.000 $0.000 $0.000Federal Small Producer Payment ($/gal) $0.035 $0.035 $0.035 $0.035 $0.035 $0.035 $0.035 $0.035 $0.035 $0.035
Delivered Biomass Price ($/BDT) $38.620 $39.006 $39.396 $39.790 $40.188 $40.590 $40.996 $41.406 $41.820 $42.238 1.00%Biomass Transportation & Storage ($/BDT) $0.000 $0.000 $0.000 $0.000 $0.000 $0.000 $0.000 $0.000 $0.000 $0.000 1.50%Biomass Usage (BDT/yr) 334,448 334,448 334,448 334,448 334,448 334,448 334,448 334,448 334,448 334,448Biomass Test Weight (lb/BDT) 2,000 2,000 2,000 2,000 2,000 2,000 2,000 2,000 2,000 2,000
Lignin Residue Yield (wet lb/BDT) 2,008.376 2,008.376 2008.376 2008.376 2008.376 2008.376 2008.376 2008.376 2008.376 2008.376Lignin Residue Price ($/wet ton) $6.420 $6.484 $6.549 $6.615 $6.681 $6.748 $6.815 $6.883 $6.952 $7.022 1.00%Lignin Residue Transportation ($/wet ton) $0.000 $0.000 $0.000 $0.000 $0.000 $0.000 $0.000 $0.000 $0.000 $0.000 2.00%Lignin Sales Commission (% of sales) 0.000% 0.000% 0.000% 0.000% 0.000% 0.000% 0.000% 0.000% 0.000% 0.000% 0.00%
Carbon Dioxide (CO2) Sold (lb/gal) 5.000 5.000 5.000 5.000 5.000 5.000 5.000 5.000 5.000 5.000CO2 Price ($/ton) $0.000 $0.000 $0.000 $0.000 $0.000 $0.000 $0.000 $0.000 $0.000 $0.000 1.00%
Electricity Use (kWh/BDT) 127.374 127.374 127.374 127.374 127.374 127.374 127.374 127.374 127.374 127.374Electricity Price ($/kWh) $0.0400 $0.0408 $0.0416 $0.0424 $0.0433 $0.0442 $0.0450 $0.0459 $0.0469 $0.0478 2.00%Natural Gas Use (MMBTU/BDT) 3.6701 3.6701 3.6701 3.6701 3.6701 3.6701 3.6701 3.6701 3.6701 3.6701Natural Gas Price ($/MMBTU) $4.5000 $4.5900 $4.6818 $4.7754 $4.8709 $4.9684 $5.0677 $5.1691 $5.2725 $5.3779 2.00%
Fresh Water Use (1000 gal/BDT) 0.536 0.536 0.536 0.536 0.536 0.536 0.536 0.536 0.536 0.536Fresh Water Price ($/1000 gal) $0.5000 $0.5050 $0.5101 $0.5152 $0.5203 $0.5255 $0.5308 $0.5361 $0.5414 $0.5468 1.00%Wastewater Effluent (1000 gal/BDT) 0.343 0.343 0.343 0.343 0.343 0.343 0.343 0.343 0.343 0.343Wastewater Effluent Price ($/1000 gal) $1.0000 $1.0100 $1.0201 $1.0303 $1.0406 $1.0510 $1.0615 $1.0721 $1.0829 $1.0937 1.00%
Solid Waste Disposal (ton/BDT) 0.087 0.087 0.087 0.087 0.087 0.087 0.087 0.087 0.087 0.087Solid Waste Disposal Price ($/Ton) $10.0000 $10.1000 $10.2010 $10.3030 $10.4060 $10.5101 $10.6152 $10.7214 $10.8286 $10.9369 1.00%
Denaturant Use (% of ethanol sold) 5.000% 5.000% 5.000% 5.000% 5.000% 5.000% 5.000% 5.000% 5.000% 5.000%Denaturant Price ($/gal) $0.7000 $0.7140 $0.7283 $0.7428 $0.7577 $0.7729 $0.7883 $0.8041 $0.8202 $0.8366 2.00%Purchased Cellulase Enzyme ($/gal etoh) $0.1008 $0.1018 $0.1028 $0.1039 $0.1049 $0.1059 $0.1070 $0.1081 $0.1092 $0.1102 1.00%Other Chemical Costs ($/gal ethanol) $0.0773 $0.0781 $0.0789 $0.0796 $0.0804 $0.0812 $0.0821 $0.0829 $0.0837 $0.0845 1.00%
Number of Employees 49 49 49 49 49 49 49 49 49 49Average Salary Including Benefits $48,214 $49,420 $50,655 $51,922 $53,220 $54,550 $55,914 $57,312 $58,744 $60,213 2.50%Maintenance Materials & Services 2.000% 2.030% 2.060% 2.091% 2.123% 2.155% 2.187% 2.220% 2.253% 2.287% 1.50%Property Tax & Insurance 2.000% 2.020% 2.040% 2.061% 2.081% 2.102% 2.123% 2.144% 2.166% 2.187% 1.00%All Other Expense Categories 2.00%
1 30 MMGPY Appendix - Indiana Financial Forecast

NREL Bioethanol Co-Location Study -- Wheatfield, IN SiteFinancial Assumptions
Ethanol Plant Engineering & Construction Costs Capital Equipment Cost & Installation $51,949,000 Engineering Expense $4,979,617 Receivable Payable Inventories Construction Management $4,005,921 (#Days) (#Days) (#Days) Contingency $4,586,489 Fuel Ethanol 10 8Total $65,521,000 $2.18 per gallon Lignin Residue 10 8
Denaturants 10 10Owner's Costs Enzymes & Chemicals 15 15
Inventory - Biomass $369,000 Biomass 10 20Inventory - Chemicals/Denaturant $129,000 Utilities 15Inventory - Ethanol & Lignin $869,000Spare Parts $500,000Startup Costs $1,000,000Land $225,000Administration Building & Furnishing $250,000Rail Improvements $500,000 Tax Incentives ($/gal) State PlantSite Development Costs $1,000,000 Producer OperatingTools and Laboratory Equipment $250,000 Year Federal State Payment Month RateOrganizational Costs $500,000 1 $0.052 $0.000 $0.000 13 0.00%Capitalized Fees and Interest $2,057,000 2 $0.052 $0.000 $0.000 14 0.00%Working Capital $524,000 3 $0.051 $0.000 $0.000 15 50.00%
Total Estimated Project Cost $73,694,000 4 $0.051 $0.000 $0.000 16 75.00%5 $0.051 $0.000 $0.000 17 100.00%
Senior Debt 6 $0.051 $0.000 $0.000 18 100.00% Principal $44,216,400 60.00% 7 $0.051 $0.000 $0.000 19 100.00% Interest Rate 8.0% fixed 8 $0.051 $0.000 $0.000 20 100.00% Lender Fees $442,164 1.000% 9 $0.051 $0.000 $0.000 21 100.00% Placement Fees $0 0.000% 10 $0.051 $0.000 $0.000 22 100.00% Amortization Period 10 years 23 100.00% Cash Sweep 0.000% State producer payment, ¢/gal $0.000 24 100.00%
Annual payment cap $0Subordinated Debt State incentive duration, years 0 Principal $0 0.00% Interest Rate 0.00% Lender Fees $0 0.000% Income Tax Rate 0.00% Placement Fees $0.00 0.000% Investment Interest 3.00% Amortization Period 0 years Operating Line Interest 10.00%
Common Equity Investment Total Equity Amount $29,477,600 40.00% Placement Fees $0 0.000% Preferred Shares $0 0.000% Common Shares $29,477,600 100.000%
Grants Amount $0 0.00%
Blenders Credit
Accounts
2 30 MMGPY Appendix - Indiana Financial Forecast

NREL Bioethanol Co-Location Study -- Wheatfield, IN SiteProforma Balance Sheet
Construction 1st Year 2nd Year 3rd Year 4th Year 5th Year 6th Year 7th Year 8th Year 9th Year 10th Year(1 Year) Operations Operations Operations Operations Operations Operations Operations Operations Operations Operations
ASSETSCurrent Assets: Cash & Cash Equivalents 0 0 270,733 1,315,747 2,716,290 4,480,240 6,615,561 9,130,302 12,032,587 15,330,611 19,032,632 Accounts Receivable - Trade 0 1,087,058 1,107,733 1,129,265 1,151,222 1,173,612 1,196,443 1,219,724 1,243,465 1,267,674 1,292,360 Inventories Feedstock 0 738,079 745,460 752,915 760,444 768,048 775,729 783,486 791,321 799,234 807,226 Purchased Enzymes 0 129,600 130,896 132,205 133,527 134,862 136,211 137,573 138,949 140,338 141,742 Other Chemicals 0 99,386 100,380 101,383 102,397 103,421 104,455 105,500 106,555 107,620 108,697 Denaturant 0 30,000 30,600 31,212 31,836 32,473 33,122 33,785 34,461 35,150 35,853 Finished Product Inventory 0 842,567 886,186 903,412 920,978 938,889 957,154 975,779 994,772 1,014,139 1,033,888 Total Inventories 0 1,839,632 1,893,522 1,921,127 1,949,182 1,977,694 2,006,672 2,036,123 2,066,057 2,096,482 2,127,406 Prepaid Expenses 0 0 0 0 0 0 0 0 0 0 0 Other Current Assets 0 0 0 0 0 0 0 0 0 0 0Total Current Assets 0 2,926,689 3,271,988 4,366,140 5,816,694 7,631,546 9,818,676 12,386,150 15,342,109 18,694,766 22,452,397
Land 225,000 225,000 225,000 225,000 225,000 225,000 225,000 225,000 225,000 225,000 225,000Property, Plant & Equipment Property, Plant & Equipment, at cost 58,160,880 68,021,027 68,121,027 68,221,027 68,321,027 68,421,027 68,521,027 68,621,027 68,721,027 68,821,027 68,921,027 Less Accumulated Depreciation & Amortiz. 0 1,480,790 4,524,235 7,572,680 10,626,125 13,684,570 16,748,015 19,816,460 22,889,905 25,968,350 29,051,795Net Property, Plant & Equipment 58,160,880 66,540,237 63,596,792 60,648,347 57,694,902 54,736,457 51,773,012 48,804,567 45,831,122 42,852,677 39,869,232Capitalized Fees & Interest 967,808 2,052,853 1,847,567 1,642,282 1,436,997 1,231,712 1,026,426 821,141 615,856 410,571 205,285Total Assets 59,353,689 71,744,779 68,941,347 66,881,769 65,173,593 63,824,714 62,843,114 62,236,858 62,014,087 62,183,013 62,751,914
LIABILITIES & EQUITIESCurrent Liabilities: Accounts Payable 0 484,580 503,710 509,053 514,455 519,918 525,442 531,028 536,676 542,387 548,163 Notes Payable 0 376,454 0 0 0 0 0 0 0 0 0 Current Maturities of Long Term Debt 0 3,173,311 3,436,694 3,721,938 4,030,857 4,365,417 4,727,744 5,120,144 5,545,114 6,005,356 2,110,575 Current maturities of Subordinated Debt 0 0 0 0 0 0 0 0 0 0 0Total Current Liabilities 0 4,034,345 3,940,404 4,230,991 4,545,313 4,885,335 5,253,186 5,651,172 6,081,790 6,547,743 2,658,737
Long Term Debt (excluding current maturities 30,644,732 39,063,839 35,627,145 31,905,206 27,874,349 23,508,932 18,781,188 13,661,044 8,115,930 2,110,575 0Subordinated Debt (excluding current maturiti 0 0 0 0 0 0 0 0 0 0 0Deferred Income Taxes 0 0 0 0 0 0 0 0 0 0 0Total Liabilities 30,644,732 43,098,184 39,567,549 36,136,197 32,419,662 28,394,267 24,034,375 19,312,216 14,197,720 8,658,318 2,658,737
Capital Shares & Equities Preferred Shares 0 0 0 0 0 0 0 0 0 0 0 Common Shares 29,477,600 29,477,600 29,477,600 29,477,600 29,477,600 29,477,600 29,477,600 29,477,600 29,477,600 29,477,600 29,477,600 Grants 0 0 0 0 0 0 0 0 0 0 0 Retained Earnings (768,644) (831,005) (103,801) 1,267,972 3,276,331 5,952,847 9,331,140 13,447,042 18,338,767 24,047,096 30,615,577Total Capital Shares & Equities 28,708,956 28,646,595 29,373,799 30,745,572 32,753,931 35,430,447 38,808,740 42,924,642 47,816,367 53,524,696 60,093,177
Total Liabilities & Equities 59,353,689 71,744,779 68,941,347 66,881,769 65,173,593 63,824,714 62,843,114 62,236,858 62,014,087 62,183,013 62,751,914
3 30 MMGPY Appendix - Indiana Financial Forecast

NREL Bioethanol Co-Location Study -- Wheatfield, IN SiteProforma Income Statements
Construction 1st Year 2nd Year 3rd Year 4th Year 5th Year 6th Year 7th Year 8th Year 9th Year 10th Year(Year 0) Operations Operations Operations Operations Operations Operations Operations Operations Operations Operations
Sales Ethanol 0 26,833,908 36,592,857 37,324,714 38,071,208 38,832,633 39,609,285 40,401,471 41,209,500 42,033,690 42,874,364 Lignin Residue 0 1,600,488 2,177,792 2,199,570 2,221,566 2,243,782 2,266,220 2,288,882 2,311,771 2,334,888 2,358,237 Carbon Dioxide 0 0 0 0 0 0 0 0 0 0 0State Producer Payment 0 0 0 0 0 0 0 0 0 0 0Federal Small Producer Payment 0 824,644 1,050,000 1,050,000 1,050,000 1,050,000 1,050,000 1,050,000 1,050,000 1,050,000 1,050,000Total Sales 0 29,259,039 39,820,649 40,574,285 41,342,775 42,126,414 42,925,505 43,740,353 44,571,271 45,418,579 46,282,601
Production & Operating Expenses Feedstocks 0 10,694,462 13,045,552 13,176,007 13,307,767 13,440,845 13,575,254 13,711,006 13,848,116 13,986,597 14,126,463 Purchased Cellulase Enzymes 0 2,331,000 3,054,240 3,084,782 3,115,630 3,146,787 3,178,254 3,210,037 3,242,137 3,274,559 3,307,304 Other Chemicals 0 1,787,563 2,342,190 2,365,612 2,389,268 2,413,161 2,437,292 2,461,665 2,486,282 2,511,145 2,536,256 Utilities - Natural Gas 0 4,257,717 5,633,996 5,746,675 5,861,609 5,978,841 6,098,418 6,220,386 6,344,794 6,471,690 6,601,124 Electricity 0 1,313,500 1,738,080 1,772,842 1,808,298 1,844,464 1,881,354 1,918,981 1,957,360 1,996,508 2,036,438 Denaturants 0 809,375 1,071,000 1,092,420 1,114,268 1,136,554 1,159,285 1,182,471 1,206,120 1,230,242 1,254,847 Makeup Water 0 69,132 90,581 91,487 92,402 93,326 94,259 95,202 96,154 97,115 98,087 Wastewater Disposal 0 88,376 115,796 116,954 118,124 119,305 120,498 121,703 122,920 124,149 125,391 Solid Waste Disposal 0 223,082 292,298 295,221 298,173 301,155 304,167 307,208 310,280 313,383 316,517 Direct Labor & Benefits 0 1,264,950 1,296,574 1,328,988 1,362,213 1,396,268 1,431,175 1,466,954 1,503,628 1,541,219 1,579,749Total Production Costs 0 22,839,156 28,680,307 29,070,989 29,467,753 29,870,706 30,279,955 30,695,613 31,117,792 31,546,607 31,982,176Gross Profit 0 6,419,883 11,140,343 11,503,295 11,875,021 12,255,709 12,645,549 13,044,740 13,453,479 13,871,972 14,300,426
Administrative & Operating Expenses Maintenance Materials & Services 0 800,880 1,054,565 1,070,383 1,086,439 1,102,736 1,119,277 1,136,066 1,153,107 1,170,403 1,187,959 Maintenance - Wages & Benefits 0 494,100 506,453 519,114 532,092 545,394 559,029 573,005 587,330 602,013 617,063 Consulting Services 114,000 24,000 24,480 24,970 25,469 25,978 26,498 27,028 27,568 28,120 28,682 Property Taxes & Insurance 233,544 1,167,718 1,348,658 1,302,092 1,254,357 1,205,434 1,155,301 1,103,939 1,051,327 997,444 942,268 Admin. Salaries, Wages & Benefits 148,500 603,450 618,536 634,000 649,850 666,096 682,748 699,817 717,312 735,245 753,626 Legal & Accounting/Community Affairs 144,000 36,000 36,720 37,454 38,203 38,968 39,747 40,542 41,353 42,180 43,023 Office/Lab Supplies & Expenses 72,000 72,000 73,440 74,909 76,407 77,935 79,494 81,084 82,705 84,359 86,047 Travel, Training & Miscellaneous 56,600 34,650 35,343 36,050 36,771 37,506 38,256 39,022 39,802 40,598 41,410
EBITD (768,644) 3,187,085 7,442,148 7,804,324 8,175,433 8,555,662 8,945,200 9,344,239 9,752,975 10,171,610 10,600,346Less: Interest - Operating Line of Credit 0 0 37,645 0 0 0 0 0 0 0 0 Interest - Senior Debt 0 1,768,656 3,428,569 3,178,821 2,908,343 2,615,416 2,298,177 1,954,606 1,582,520 1,179,550 743,135 Interest - Subordinated Debt 0 0 0 0 0 0 0 0 0 0 0 Depreciation & Amortization 0 1,480,790 3,248,730 3,253,730 3,258,730 3,263,730 3,268,730 3,273,730 3,278,730 3,283,730 3,288,730
Pre-Tax Income (768,644) (62,362) 727,204 1,371,773 2,008,360 2,676,516 3,378,293 4,115,902 4,891,725 5,708,329 6,568,481Current Income Taxes 0 0 0 0 0 0 0 0 0 0 0
Net Earnings (Loss) for the Year (768,644) (62,362) 727,204 1,371,773 2,008,360 2,676,516 3,378,293 4,115,902 4,891,725 5,708,329 6,568,481
4 30 MMGPY Appendix - Indiana Financial Forecast

NREL Bioethanol Co-Location Study -- Wheatfield, IN SiteProforma Statements of Cash Flows
Construction 1st Year 2nd Year 3rd Year 4th Year 5th Year 6th Year 7th Year 8th Year 9th Year 10th Year(1 Year) Operations Operations Operations Operations Operations Operations Operations Operations Operations Operations
Cash provided by (used in) Operating Activities Net Earnings (loss) (768,644) (62,362) 727,204 1,371,773 2,008,360 2,676,516 3,378,293 4,115,902 4,891,725 5,708,329 6,568,481 Non cash charges to operations Depreciation & Amortization 0 1,480,790 3,248,730 3,253,730 3,258,730 3,263,730 3,268,730 3,273,730 3,278,730 3,283,730 3,288,730
(768,644) 1,418,429 3,975,934 4,625,503 5,267,090 5,940,246 6,647,023 7,389,632 8,170,455 8,992,059 9,857,212
Changes in non-cash working capital balances Accounts Receivable 0 1,087,058 20,675 21,532 21,957 22,390 22,831 23,281 23,741 24,209 24,686 Inventories 0 1,839,632 53,890 27,605 28,055 28,512 28,978 29,451 29,934 30,424 30,924 Prepaid Expenses 0 0 0 0 0 0 0 0 0 0 0 Accounts Payable 0 (484,580) (19,129) (5,343) (5,403) (5,463) (5,524) (5,586) (5,648) (5,711) (5,775) Income Taxes Payable 0 0 0 0 0 0 0 0 0 0 0
0 2,442,109 55,436 43,795 44,609 45,439 46,285 47,147 48,026 48,922 49,835
Investing Activities Land Purchase 225,000 0 0 0 0 0 0 0 0 0 0 Fixed Asset Purchases 58,160,880 9,860,147 100,000 100,000 100,000 100,000 100,000 100,000 100,000 100,000 100,000 Capitalized Fees & Interest 967,808 1,085,044 0 0 0 0 0 0 0 0 0
59,353,689 10,945,191 100,000 100,000 100,000 100,000 100,000 100,000 100,000 100,000 100,000
Financing Activities Long Term Debt Advances 30,644,732 13,571,668 0 0 0 0 0 0 0 0 0 Repayment of Long Term Debt 0 (1,979,250) (3,173,311) (3,436,694) (3,721,938) (4,030,857) (4,365,417) (4,727,744) (5,120,144) (5,545,114) (6,005,356) Subordinated Debt Advances 0 0 0 0 0 0 0 0 0 0 0 Repayment of Subordinated Debt 0 0 0 0 0 0 0 0 0 0 0 Equity Investment 29,477,600 0 0 0 0 0 0 0 0 0 0 Grants 0 0 0 0 0 0 0 0 0 0 0 Cash Sweep for Debt Service 0 0 0 0 0 0 0 0 0 0 0 Distributions to Shareholders 0 0 0 0 0 0 0 0 0 0 0
Net Increase (Decrease) in Cash 0 (376,454) 647,187 1,045,014 1,400,543 1,763,950 2,135,322 2,514,741 2,902,285 3,298,023 3,702,021Cash (Indebtedness), Beginning of Year 0 0 (376,454) 270,733 1,315,747 2,716,290 4,480,240 6,615,561 9,130,302 12,032,587 15,330,611
Cash (Bank Indebtedness), End of Year 0 (376,454) 270,733 1,315,747 2,716,290 4,480,240 6,615,561 9,130,302 12,032,587 15,330,611 19,032,632
5 30 MMGPY Appendix - Indiana Financial Forecast

NREL Bioethanol Co-Location Study -- Wheatfield, IN SiteInterim Funding ScheduleMonths 1-24
Cash InterestMonth Project Fees & Other Required By Current Month Equity/Grant Subordinated Payment Loan (Equity)
Development Expenses Operations Disbursements Investment Debt (Earnings) Balance--------- --------- ---------- ----------- ----------- ----------- ----------- ------------- ------------
1 5,047,931 508,581 12,375 5,568,886 (29,477,600) 0 (59,772) (23,968,486)2 4,822,931 66,417 12,375 4,901,722 0 0 (47,667) (19,114,430)3 4,822,931 66,417 12,375 4,901,722 0 0 (35,532) (14,248,240)4 4,822,931 66,417 12,375 4,901,722 0 0 (23,366) (9,369,884)5 4,822,931 66,417 12,375 4,901,722 0 0 (29,788) (4,497,950)6 4,822,931 66,417 12,375 4,901,722 0 0 2,692 406,4647 4,947,931 66,417 12,375 5,026,722 0 0 36,221 5,469,4088 4,867,573 66,417 12,375 4,946,365 0 0 69,438 10,485,2119 4,867,573 70,817 12,375 4,950,765 0 0 102,907 15,538,883
10 4,867,573 70,817 12,375 4,950,765 0 0 136,598 20,626,24611 4,742,573 70,817 12,375 4,825,765 0 0 169,680 25,621,69112 4,930,073 70,817 12,375 5,013,265 0 0 204,233 30,839,18913 5,180,073 19,250 202,875 5,402,198 0 0 241,609 36,482,99614 4,680,073 19,250 202,875 4,902,198 0 0 275,901 41,661,09615 0 19,250 564,303 583,553 0 0 281,631 42,526,28016 0 6,600 352,544 359,144 0 0 285,903 43,171,32717 0 6,600 0 6,600 0 0 287,853 43,465,78018 0 6,600 0 6,600 0 0 289,816 43,762,19619 0 6,600 0 6,600 0 0 289,816 44,058,61220 0 6,600 0 6,600 0 0 289,816 44,355,02721 0 6,600 0 6,600 0 0 289,816 44,651,44322 0 6,600 0 6,600 0 0 289,816 44,947,85923 0 6,600 0 6,600 0 0 289,816 45,244,27524 0 6,600 0 6,600 0 0 289,816 45,540,691
----------- ------------ --------- ---------- ----------- ----------- ------------- -----------------Total 68,246,027 1,373,914 1,433,972 71,091,038 (29,477,600) 0 3,927,253 45,540,691
6 30 MMGPY Appendix - Indiana Financial Forecast

NREL Bioethanol Co-Location Study -- Wheatfield, IN SiteEngineering & Construction Cost Summary
Rolling Stock, Site Prep. & Rail Construction &Tools & Admin. Improve- Equipment & Engineering Procurement Monthly
Month Land Spare Parts Building ments Installation Fees Fees Contingency Total
1 225,000 0 142,857 0 3,710,643 355,687 286,137 327,606 5,047,9312 0 0 142,857 0 3,710,643 355,687 286,137 327,606 4,822,9313 0 0 142,857 0 3,710,643 355,687 286,137 327,606 4,822,9314 0 0 142,857 0 3,710,643 355,687 286,137 327,606 4,822,9315 0 0 142,857 0 3,710,643 355,687 286,137 327,606 4,822,9316 0 0 142,857 0 3,710,643 355,687 286,137 327,606 4,822,9317 0 0 142,857 125,000 3,710,643 355,687 286,137 327,606 4,947,9318 0 0 62,500 125,000 3,710,643 355,687 286,137 327,606 4,867,5739 0 0 62,500 125,000 3,710,643 355,687 286,137 327,606 4,867,573
10 0 0 62,500 125,000 3,710,643 355,687 286,137 327,606 4,867,57311 0 0 62,500 0 3,710,643 355,687 286,137 327,606 4,742,57312 0 250,000 0 0 3,710,643 355,687 286,137 327,606 4,930,07313 0 500,000 0 0 3,710,643 355,687 286,137 327,606 5,180,07314 0 0 0 0 3,710,643 355,687 286,137 327,606 4,680,07315 0 0 0 0 0 0 0 0 016 0 0 0 0 0 0 0 0 017 0 0 0 0 0 0 0 0 018 0 0 0 0 0 0 0 0 0
_________ _________ _________ _________ _________ _________ _________ _________ _________TOTAL 225,000 750,000 1,250,000 500,000 51,949,000 4,979,617 4,005,921 4,586,489 68,246,027
7 30 MMGPY Appendix - Indiana Financial Forecast

NREL Bioethanol Co-Location Study -- Wheatfield, IN SiteProduction & Sales, Months 13-23
Month 13 Month 14 Month 15 Month 16 Month 17 Month 18 Month 19 Month 20 Month 21 Month 22 Month 23Fuel Ethanol
Gallons Produced 0 0 1,250,000 1,875,000 2,500,000 2,500,000 2,500,000 2,500,000 2,500,000 2,500,000 2,500,000Gallons Sent to Inventory 0 0 342,857 342,857 0 0 0 0 0 0 0Denaturant Added 0 0 62,500 93,750 125,000 125,000 125,000 125,000 125,000 125,000 125,000Net Gallons Sold (Denatured) 0 0 952,500 1,608,750 2,625,000 2,625,000 2,625,000 2,625,000 2,625,000 2,625,000 2,625,000Selling Price/Gallon (FOB Plant) $1.1389 $1.1389 $1.1389 $1.1389 $1.1389 $1.1389 $1.1389 $1.1389 $1.1389 $1.1389 $1.1389State Producer Payment $0.000 $0.000 $0.000 $0.000 $0.000 $0.000 $0.000 $0.000 $0.000 $0.000 $0.000Federal Small Producer Payment $0.035 $0.035 $0.035 $0.035 $0.035 $0.035 $0.035 $0.035 $0.035 $0.035 $0.035
Total Revenue - Fuel Ethanol 0 0 1,118,140 1,888,512 3,081,488 3,081,488 3,081,488 3,081,488 3,081,488 3,081,488 3,081,488
Lignin Residue Dry Tons Produced 0 0 13,994 20,991 27,987 27,987 27,987 27,987 27,987 27,987 27,987Tons Sent to Inventory 0 0 4,798 4,798 0 0 0 0 0 0 0Net Tons Sold 0 0 9,196 16,193 27,987 27,987 27,987 27,987 27,987 27,987 27,987Selling Price/Dry Ton $6.42 $6.42 $6.42 $6.42 $6.42 $6.42 $6.42 $6.42 $6.42 $6.42 $6.42
Total Revenue - Lignin Residue 0 0 59,040 103,961 179,686 179,686 179,686 179,686 179,686 179,686 179,686
CO2
Tons Produced 0 0 3,125 4,688 6,250 6,250 6,250 6,250 6,250 6,250 6,250Tons Sent to Inventory 0 0 0 0 0 0 0 0 0 0 0Net Tons Sold 0 0 3,125 4,688 6,250 6,250 6,250 6,250 6,250 6,250 6,250Selling Price/Ton $0.00 $0.00 $0.00 $0.00 $0.00 $0.00 $0.00 $0.00 $0.00 $0.00 $0.00
Total Revenue - CO2 0 0 0 0 0 0 0 0 0 0 0
Total Revenue - All Products 0 0 1,177,179 1,992,473 3,261,173 3,261,173 3,261,173 3,261,173 3,261,173 3,261,173 3,261,173
8 30 MMGPY Appendix - Indiana Financial Forecast
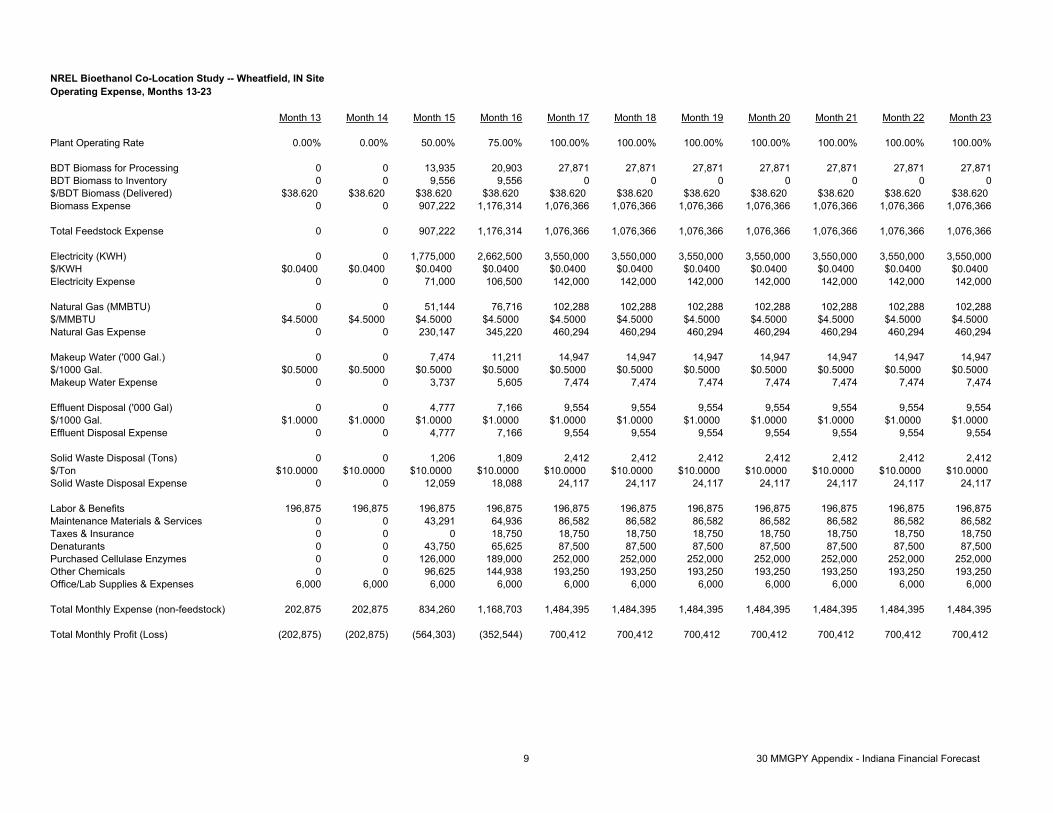
NREL Bioethanol Co-Location Study -- Wheatfield, IN SiteOperating Expense, Months 13-23
Month 13 Month 14 Month 15 Month 16 Month 17 Month 18 Month 19 Month 20 Month 21 Month 22 Month 23
Plant Operating Rate 0.00% 0.00% 50.00% 75.00% 100.00% 100.00% 100.00% 100.00% 100.00% 100.00% 100.00%
BDT Biomass for Processing 0 0 13,935 20,903 27,871 27,871 27,871 27,871 27,871 27,871 27,871BDT Biomass to Inventory 0 0 9,556 9,556 0 0 0 0 0 0 0$/BDT Biomass (Delivered) $38.620 $38.620 $38.620 $38.620 $38.620 $38.620 $38.620 $38.620 $38.620 $38.620 $38.620Biomass Expense 0 0 907,222 1,176,314 1,076,366 1,076,366 1,076,366 1,076,366 1,076,366 1,076,366 1,076,366
Total Feedstock Expense 0 0 907,222 1,176,314 1,076,366 1,076,366 1,076,366 1,076,366 1,076,366 1,076,366 1,076,366
Electricity (KWH) 0 0 1,775,000 2,662,500 3,550,000 3,550,000 3,550,000 3,550,000 3,550,000 3,550,000 3,550,000$/KWH $0.0400 $0.0400 $0.0400 $0.0400 $0.0400 $0.0400 $0.0400 $0.0400 $0.0400 $0.0400 $0.0400Electricity Expense 0 0 71,000 106,500 142,000 142,000 142,000 142,000 142,000 142,000 142,000
Natural Gas (MMBTU) 0 0 51,144 76,716 102,288 102,288 102,288 102,288 102,288 102,288 102,288$/MMBTU $4.5000 $4.5000 $4.5000 $4.5000 $4.5000 $4.5000 $4.5000 $4.5000 $4.5000 $4.5000 $4.5000Natural Gas Expense 0 0 230,147 345,220 460,294 460,294 460,294 460,294 460,294 460,294 460,294
Makeup Water ('000 Gal.) 0 0 7,474 11,211 14,947 14,947 14,947 14,947 14,947 14,947 14,947$/1000 Gal. $0.5000 $0.5000 $0.5000 $0.5000 $0.5000 $0.5000 $0.5000 $0.5000 $0.5000 $0.5000 $0.5000Makeup Water Expense 0 0 3,737 5,605 7,474 7,474 7,474 7,474 7,474 7,474 7,474
Effluent Disposal ('000 Gal) 0 0 4,777 7,166 9,554 9,554 9,554 9,554 9,554 9,554 9,554$/1000 Gal. $1.0000 $1.0000 $1.0000 $1.0000 $1.0000 $1.0000 $1.0000 $1.0000 $1.0000 $1.0000 $1.0000Effluent Disposal Expense 0 0 4,777 7,166 9,554 9,554 9,554 9,554 9,554 9,554 9,554
Solid Waste Disposal (Tons) 0 0 1,206 1,809 2,412 2,412 2,412 2,412 2,412 2,412 2,412$/Ton $10.0000 $10.0000 $10.0000 $10.0000 $10.0000 $10.0000 $10.0000 $10.0000 $10.0000 $10.0000 $10.0000Solid Waste Disposal Expense 0 0 12,059 18,088 24,117 24,117 24,117 24,117 24,117 24,117 24,117
Labor & Benefits 196,875 196,875 196,875 196,875 196,875 196,875 196,875 196,875 196,875 196,875 196,875Maintenance Materials & Services 0 0 43,291 64,936 86,582 86,582 86,582 86,582 86,582 86,582 86,582Taxes & Insurance 0 0 0 18,750 18,750 18,750 18,750 18,750 18,750 18,750 18,750Denaturants 0 0 43,750 65,625 87,500 87,500 87,500 87,500 87,500 87,500 87,500Purchased Cellulase Enzymes 0 0 126,000 189,000 252,000 252,000 252,000 252,000 252,000 252,000 252,000Other Chemicals 0 0 96,625 144,938 193,250 193,250 193,250 193,250 193,250 193,250 193,250Office/Lab Supplies & Expenses 6,000 6,000 6,000 6,000 6,000 6,000 6,000 6,000 6,000 6,000 6,000
Total Monthly Expense (non-feedstock) 202,875 202,875 834,260 1,168,703 1,484,395 1,484,395 1,484,395 1,484,395 1,484,395 1,484,395 1,484,395
Total Monthly Profit (Loss) (202,875) (202,875) (564,303) (352,544) 700,412 700,412 700,412 700,412 700,412 700,412 700,412
9 30 MMGPY Appendix - Indiana Financial Forecast

NREL Bioethanol Co-Location Study -- Wheatfield, IN SiteInterim Period Fees & ExpensesMonths 1-24
Lender/ Legal/ Political/Placement Organizational Accounting Community Financial Construction Hiring & Contingency @ Monthly
Month Fees Costs Expenses Relations Consultants Consultants Training Travel 10% Total
1 442,164 $41,667 10,000 2,000 2,000 7,500 0 1,000 2,250 508,5812 0 $41,667 10,000 2,000 2,000 7,500 0 1,000 2,250 66,4173 0 $41,667 10,000 2,000 2,000 7,500 0 1,000 2,250 66,4174 0 $41,667 10,000 2,000 2,000 7,500 0 1,000 2,250 66,4175 0 $41,667 10,000 2,000 2,000 7,500 0 1,000 2,250 66,4176 0 $41,667 10,000 2,000 2,000 7,500 0 1,000 2,250 66,4177 0 $41,667 10,000 2,000 2,000 7,500 0 1,000 2,250 66,4178 0 $41,667 10,000 2,000 2,000 7,500 0 1,000 2,250 66,4179 0 $41,667 10,000 2,000 2,000 7,500 4,000 1,000 2,650 70,817
10 0 $41,667 10,000 2,000 2,000 7,500 4,000 1,000 2,650 70,81711 0 $41,667 10,000 2,000 2,000 7,500 4,000 1,000 2,650 70,81712 0 $41,667 10,000 2,000 2,000 7,500 4,000 1,000 2,650 70,81713 0 0 2,000 1,000 2,000 7,500 4,000 1,000 1,750 19,25014 0 0 2,000 1,000 2,000 7,500 4,000 1,000 1,750 19,25015 0 0 2,000 1,000 2,000 7,500 4,000 1,000 1,750 19,25016 0 0 2,000 1,000 2,000 0 0 1,000 600 6,60017 0 0 2,000 1,000 2,000 0 0 1,000 600 6,60018 0 0 2,000 1,000 2,000 0 0 1,000 600 6,60019 0 0 2,000 1,000 2,000 0 0 1,000 600 6,60020 0 0 2,000 1,000 2,000 0 0 1,000 600 6,60021 0 0 2,000 1,000 2,000 0 0 1,000 600 6,60022 0 0 2,000 1,000 2,000 0 0 1,000 600 6,60023 0 0 2,000 1,000 2,000 0 0 1,000 600 6,60024 0 0 2,000 1,000 2,000 0 0 1,000 600 6,600
_______ _______ _______ _______ _______ _______ _______ _______ _______ _______TOTAL 442,164 500,000 144,000 36,000 48,000 112,500 28,000 24,000 39,250 1,373,914
10 30 MMGPY Appendix - Indiana Financial Forecast

Interim Period Labor SummaryMonths 1-24
General Plant Environ. & Commodity Admin. Lab Shift Team Shift YardPosition Manager Manager Safety Mgr. Controller Manager Assistant Microbiologist Technician Leader Operator LaborNumber Employed (1) (1) (1) (1) (1) (3) (1) (2) (4) (12) (12)Annual Salary 110,000 80,000 60,000 65,000 60,000 24,000 45,000 28,000 44,000 30,000 25,000
______ ______ ______ ______ ______ ______ ______ ______ ______ ______ ______Month
1 9,167 0 0 0 0 0 0 0 0 0 02 9,167 0 0 0 0 0 0 0 0 0 03 9,167 0 0 0 0 0 0 0 0 0 04 9,167 0 0 0 0 0 0 0 0 0 05 9,167 0 0 0 0 0 0 0 0 0 06 9,167 0 0 0 0 0 0 0 0 0 07 9,167 0 0 0 0 0 0 0 0 0 08 9,167 0 0 0 0 0 0 0 0 0 09 9,167 0 0 0 0 0 0 0 0 0 0
10 9,167 0 0 0 0 0 0 0 0 0 011 9,167 0 0 0 0 0 0 0 0 0 012 9,167 0 0 0 0 0 0 0 0 0 013 9,167 6,667 5,000 5,417 5,000 6,000 3,750 4,667 14,667 30,000 25,00014 9,167 6,667 5,000 5,417 5,000 6,000 3,750 4,667 14,667 30,000 25,00015 9,167 6,667 5,000 5,417 5,000 6,000 3,750 4,667 14,667 30,000 25,00016 9,167 6,667 5,000 5,417 5,000 6,000 3,750 4,667 14,667 30,000 25,00017 9,167 6,667 5,000 5,417 5,000 6,000 3,750 4,667 14,667 30,000 25,00018 9,167 6,667 5,000 5,417 5,000 6,000 3,750 4,667 14,667 30,000 25,00019 9,167 6,667 5,000 5,417 5,000 6,000 3,750 4,667 14,667 30,000 25,00020 9,167 6,667 5,000 5,417 5,000 6,000 3,750 4,667 14,667 30,000 25,00021 9,167 6,667 5,000 5,417 5,000 6,000 3,750 4,667 14,667 30,000 25,00022 9,167 6,667 5,000 5,417 5,000 6,000 3,750 4,667 14,667 30,000 25,00023 9,167 6,667 5,000 5,417 5,000 6,000 3,750 4,667 14,667 30,000 25,00024 9,167 6,667 5,000 5,417 5,000 6,000 3,750 4,667 14,667 30,000 25,000
11 30 MMGPY Appendix - Indiana Financial Forecast

Interim Period Labor SummaryMonths 1-24
PositionNumber EmployedAnnual Salary
Month123456789
101112131415161718192021222324
Maintenance Boiler Maintenance Instrument Monthly Benefits TotalManager Operator Worker Welder Electrician Technician Total at
(1) (1) (4) (1) (1) (2) (49) 35.00%50,000 40,000 33,000 35,000 35,000 37,000______ ______ ______ ______ ______ ______ ______ ______ ______
0 0 0 0 0 0 9,167 3,208 12,3750 0 0 0 0 0 9,167 3,208 12,3750 0 0 0 0 0 9,167 3,208 12,3750 0 0 0 0 0 9,167 3,208 12,3750 0 0 0 0 0 9,167 3,208 12,3750 0 0 0 0 0 9,167 3,208 12,3750 0 0 0 0 0 9,167 3,208 12,3750 0 0 0 0 0 9,167 3,208 12,3750 0 0 0 0 0 9,167 3,208 12,3750 0 0 0 0 0 9,167 3,208 12,3750 0 0 0 0 0 9,167 3,208 12,3750 0 0 0 0 0 9,167 3,208 12,375
4,167 3,333 11,000 2,917 2,917 6,167 145,833 51,042 196,8754,167 3,333 11,000 2,917 2,917 6,167 145,833 51,042 196,8754,167 3,333 11,000 2,917 2,917 6,167 145,833 51,042 196,8754,167 3,333 11,000 2,917 2,917 6,167 145,833 51,042 196,8754,167 3,333 11,000 2,917 2,917 6,167 145,833 51,042 196,8754,167 3,333 11,000 2,917 2,917 6,167 145,833 51,042 196,8754,167 3,333 11,000 2,917 2,917 6,167 145,833 51,042 196,8754,167 3,333 11,000 2,917 2,917 6,167 145,833 51,042 196,8754,167 3,333 11,000 2,917 2,917 6,167 145,833 51,042 196,8754,167 3,333 11,000 2,917 2,917 6,167 145,833 51,042 196,8754,167 3,333 11,000 2,917 2,917 6,167 145,833 51,042 196,8754,167 3,333 11,000 2,917 2,917 6,167 145,833 51,042 196,875
12 30 MMGPY Appendix - Indiana Financial Forecast

NREL Bioethanol Co-Location Study -- Wheatfield, IN SiteProduction Assumptions
Denatured Fuel Ethanol (gal/yr) 52,500,000Anhydrous Ethanol Production (gal/yr) 50,000,000Operating Days Per Year 350
1st year 2nd year 3rd Year 4th Year 5th Year 6th Year 7th Year 8th Year 9th Year 10th Year AnnualProduct Yields & Energy Consumption Operations Operations Operations Operations Operations Operations Operations Operations Operations Operations EscalationEthanol Yield (gal/BDT) 89.700 89.700 89.700 89.700 89.700 89.700 89.700 89.700 89.700 89.700Net Ethanol Selling Price ($/gal) $1.210 $1.234 $1.259 $1.284 $1.310 $1.336 $1.363 $1.390 $1.418 $1.446 2.00%Ethanol Sales Commission (%) 1.000% 1.000% 1.000% 1.000% 1.000% 1.000% 1.000% 1.000% 1.000% 1.000% 0.00%Ethanol Transportation ($/gal) $0.0590 $0.0602 $0.0614 $0.0626 $0.0639 $0.0651 $0.0664 $0.0678 $0.0691 $0.0705 2.00%State Producer Payment ($/gal) $0.000 $0.000 $0.000 $0.000 $0.000 $0.000 $0.000 $0.000 $0.000 $0.000Federal Small Producer Payment ($/gal) $0.000 $0.000 $0.000 $0.000 $0.000 $0.000 $0.000 $0.000 $0.000 $0.000
Delivered Biomass Price ($/BDT) $38.620 $39.006 $39.396 $39.790 $40.188 $40.590 $40.996 $41.406 $41.820 $42.238 1.00%Biomass Transportation & Storage ($/BDT) $0.000 $0.000 $0.000 $0.000 $0.000 $0.000 $0.000 $0.000 $0.000 $0.000 1.50%Biomass Usage (BDT/yr) 557,414 557,414 557,414 557,414 557,414 557,414 557,414 557,414 557,414 557,414Biomass Test Weight (lb/BDT) 2,000 2,000 2,000 2,000 2,000 2,000 2,000 2,000 2,000 2,000
Lignin Residue Yield (wet lb/BDT) 2,008.376 2,008.376 2008.376 2008.376 2008.376 2008.376 2008.376 2008.376 2008.376 2008.376Lignin Residue Price ($/wet ton) $6.420 $6.484 $6.549 $6.615 $6.681 $6.748 $6.815 $6.883 $6.952 $7.022 1.00%Lignin Residue Transportation ($/wet ton) $0.000 $0.000 $0.000 $0.000 $0.000 $0.000 $0.000 $0.000 $0.000 $0.000 2.00%Lignin Sales Commission (% of sales) 0.000% 0.000% 0.000% 0.000% 0.000% 0.000% 0.000% 0.000% 0.000% 0.000% 0.00%
Carbon Dioxide (CO2) Sold (lb/gal) 5.000 5.000 5.000 5.000 5.000 5.000 5.000 5.000 5.000 5.000CO2 Price ($/ton) $0.000 $0.000 $0.000 $0.000 $0.000 $0.000 $0.000 $0.000 $0.000 $0.000 1.00%
Electricity Use (kWh/BDT) 127.374 127.374 127.374 127.374 127.374 127.374 127.374 127.374 127.374 127.374Electricity Price ($/kWh) $0.0400 $0.0408 $0.0416 $0.0424 $0.0433 $0.0442 $0.0450 $0.0459 $0.0469 $0.0478 2.00%Natural Gas Use (MMBTU/BDT) 3.6701 3.6701 3.6701 3.6701 3.6701 3.6701 3.6701 3.6701 3.6701 3.6701Natural Gas Price ($/MMBTU) $4.5000 $4.5900 $4.6818 $4.7754 $4.8709 $4.9684 $5.0677 $5.1691 $5.2725 $5.3779 2.00%
Fresh Water Use (1000 gal/BDT) 0.536 0.536 0.536 0.536 0.536 0.536 0.536 0.536 0.536 0.536Fresh Water Price ($/1000 gal) $0.5000 $0.5050 $0.5101 $0.5152 $0.5203 $0.5255 $0.5308 $0.5361 $0.5414 $0.5468 1.00%Wastewater Effluent (1000 gal/BDT) 0.343 0.343 0.343 0.343 0.343 0.343 0.343 0.343 0.343 0.343Wastewater Effluent Price ($/1000 gal) $1.0000 $1.0100 $1.0201 $1.0303 $1.0406 $1.0510 $1.0615 $1.0721 $1.0829 $1.0937 1.00%
Solid Waste Disposal (ton/BDT) 0.087 0.087 0.087 0.087 0.087 0.087 0.087 0.087 0.087 0.087Solid Waste Disposal Price ($/Ton) $10.0000 $10.1000 $10.2010 $10.3030 $10.4060 $10.5101 $10.6152 $10.7214 $10.8286 $10.9369 1.00%
Denaturant Use (% of ethanol sold) 5.000% 5.000% 5.000% 5.000% 5.000% 5.000% 5.000% 5.000% 5.000% 5.000%Denaturant Price ($/gal) $0.7000 $0.7140 $0.7283 $0.7428 $0.7577 $0.7729 $0.7883 $0.8041 $0.8202 $0.8366 2.00%Purchased Cellulase Enzyme ($/gal etoh) $0.1008 $0.1018 $0.1028 $0.1039 $0.1049 $0.1059 $0.1070 $0.1081 $0.1092 $0.1102 1.00%Other Chemical Costs ($/gal ethanol) $0.0773 $0.0781 $0.0789 $0.0796 $0.0804 $0.0812 $0.0821 $0.0829 $0.0837 $0.0845 1.00%
Number of Employees 60 60 60 60 60 60 60 60 60 60Average Salary Including Benefits $46,350 $47,509 $48,696 $49,914 $51,162 $52,441 $53,752 $55,096 $56,473 $57,885 2.50%Maintenance Materials & Services 2.000% 2.030% 2.060% 2.091% 2.123% 2.155% 2.187% 2.220% 2.253% 2.287% 1.50%Property Tax & Insurance 2.000% 2.020% 2.040% 2.061% 2.081% 2.102% 2.123% 2.144% 2.166% 2.187% 1.00%All Other Expense Categories 2.00%
1 50 MMGPY Appendix - Indiana Financial Forecast

NREL Bioethanol Co-Location Study -- Wheatfield, IN SiteFinancial Assumptions
Ethanol Plant Engineering & Construction Costs Capital Equipment Cost & Installation $73,281,000 Engineering Expense $7,022,687 Receivable Payable Inventories Construction Management $5,632,300 (#Days) (#Days) (#Days) Contingency $6,468,265 Fuel Ethanol 10 8Total $92,404,000 $1.85 per gallon Lignin Residue 10 8
Denaturants 10 10Owner's Costs Enzymes & Chemicals 15 15
Inventory - Biomass $615,000 Biomass 10 20Inventory - Chemicals/Denaturant $216,000 Utilities 15Inventory - Ethanol & Lignin $1,449,000Spare Parts $600,000Startup Costs $1,200,000Land $225,000Administration Building & Furnishing $300,000Rail Improvements $750,000 Tax Incentives ($/gal) State PlantSite Development Costs $1,200,000 Producer OperatingTools and Laboratory Equipment $250,000 Year Federal State Payment Month RateOrganizational Costs $600,000 1 $0.052 $0.000 $0.000 13 0.00%Capitalized Fees and Interest $2,865,000 2 $0.052 $0.000 $0.000 14 0.00%Working Capital $462,000 3 $0.051 $0.000 $0.000 15 50.00%
Total Estimated Project Cost $103,136,000 4 $0.051 $0.000 $0.000 16 75.00%5 $0.051 $0.000 $0.000 17 100.00%
Senior Debt 6 $0.051 $0.000 $0.000 18 100.00% Principal $61,881,600 60.00% 7 $0.051 $0.000 $0.000 19 100.00% Interest Rate 8.0% fixed 8 $0.051 $0.000 $0.000 20 100.00% Lender Fees $618,816 1.000% 9 $0.051 $0.000 $0.000 21 100.00% Placement Fees $0 0.000% 10 $0.051 $0.000 $0.000 22 100.00% Amortization Period 10 years 23 100.00% Cash Sweep 0.000% State producer payment, ¢/gal $0.000 24 100.00%
Annual payment cap $0Subordinated Debt State incentive duration, years 0 Principal $0 0.00% Interest Rate 0.00% Lender Fees $0 0.000% Income Tax Rate 0.00% Placement Fees $0.00 0.000% Investment Interest 3.00% Amortization Period 0 years Operating Line Interest 10.00%
Common Equity Investment Total Equity Amount $41,254,400 40.00% Placement Fees $0 0.000% Preferred Shares $0 0.000% Common Shares $41,254,400 100.000%
Grants Amount $0 0.00%
Accounts
Blenders Credit
2 50 MMGPY Appendix - Indiana Financial Forecast

NREL Bioethanol Co-Location Study -- Wheatfield, IN SiteProforma Balance Sheet
Construction 1st Year 2nd Year 3rd Year 4th Year 5th Year 6th Year 7th Year 8th Year 9th Year 10th Year(1 Year) Operations Operations Operations Operations Operations Operations Operations Operations Operations Operations
ASSETSCurrent Assets: Cash & Cash Equivalents 0 83,323 3,154,554 6,904,903 11,276,380 16,282,965 21,938,821 28,258,294 35,255,905 42,946,343 51,344,456 Accounts Receivable - Trade 0 1,760,721 1,846,221 1,882,109 1,918,704 1,956,020 1,994,072 2,032,874 2,072,441 2,112,789 2,153,933 Inventories Feedstock 0 1,230,132 1,242,434 1,254,858 1,267,406 1,280,080 1,292,881 1,305,810 1,318,868 1,332,057 1,345,377 Purchased Cellulase Enzymes 0 216,000 218,160 220,342 222,545 224,770 227,018 229,288 231,581 233,897 236,236 Other Chemicals 0 165,643 167,299 168,972 170,662 172,369 174,092 175,833 177,592 179,367 181,161 Denaturant 0 50,000 51,000 52,020 53,060 54,122 55,204 56,308 57,434 58,583 59,755 Finished Product Inventory 0 1,404,278 1,476,977 1,505,687 1,534,963 1,564,816 1,595,257 1,626,299 1,657,953 1,690,232 1,723,147 Total Inventories 0 3,066,053 3,155,870 3,201,879 3,248,637 3,296,157 3,344,453 3,393,539 3,443,428 3,494,136 3,545,676 Prepaid Expenses 0 0 0 0 0 0 0 0 0 0 0 Other Current Assets 0 0 0 0 0 0 0 0 0 0 0Total Current Assets 0 4,910,097 8,156,645 11,988,890 16,443,720 21,535,141 27,277,345 33,684,706 40,771,775 48,553,268 57,044,066
Land 225,000 225,000 225,000 225,000 225,000 225,000 225,000 225,000 225,000 225,000 225,000Property, Plant & Equipment Property, Plant & Equipment, at cost 81,703,645 95,504,252 95,604,252 95,704,252 95,804,252 95,904,252 96,004,252 96,104,252 96,204,252 96,304,252 96,404,252 Less Accumulated Depreciation & Amortiz. 0 2,090,999 6,366,679 10,647,359 14,933,039 19,223,719 23,519,399 27,820,079 32,125,759 36,436,439 40,752,119Net Property, Plant & Equipment 81,703,645 93,413,253 89,237,573 85,056,893 80,871,213 76,680,533 72,484,853 68,284,173 64,078,493 59,867,813 55,652,133Capitalized Fees & Interest 1,350,469 2,865,889 2,579,300 2,292,711 2,006,122 1,719,533 1,432,945 1,146,356 859,767 573,178 286,589Total Assets 83,279,113 101,414,239 100,198,518 99,563,494 99,546,056 100,160,208 101,420,143 103,340,235 105,935,034 109,219,259 113,207,787
LIABILITIES & EQUITIESCurrent Liabilities: Accounts Payable 0 807,634 839,516 848,421 857,426 866,530 875,737 885,046 894,460 903,979 913,605 Notes Payable 0 0 0 0 0 0 0 0 0 0 0 Current Maturities of Long Term Debt 0 4,441,103 4,809,712 5,208,916 5,641,253 6,109,474 6,616,558 7,165,729 7,760,481 8,404,597 2,953,785 Current maturities of Subordinated Debt 0 0 0 0 0 0 0 0 0 0 0Total Current Liabilities 0 5,248,736 5,649,228 6,057,337 6,498,679 6,976,005 7,492,295 8,050,775 8,654,941 9,308,576 3,867,389
Long Term Debt (excluding current maturities 42,911,528 54,670,504 49,860,792 44,651,876 39,010,623 32,901,149 26,284,591 19,118,862 11,358,382 2,953,785 0Subordinated Debt (excluding current maturiti 0 0 0 0 0 0 0 0 0 0 0Deferred Income Taxes 0 0 0 0 0 0 0 0 0 0 0Total Liabilities 42,911,528 59,919,240 55,510,020 50,709,213 45,509,302 39,877,154 33,776,886 27,169,637 20,013,322 12,262,361 3,867,389
Capital Shares & Equities Preferred Shares 0 0 0 0 0 0 0 0 0 0 0 Common Shares 41,254,400 41,254,400 41,254,400 41,254,400 41,254,400 41,254,400 41,254,400 41,254,400 41,254,400 41,254,400 41,254,400 Grants 0 0 0 0 0 0 0 0 0 0 0 Retained Earnings (886,815) 240,599 3,434,098 7,599,881 12,782,354 19,028,654 26,388,857 34,916,197 44,667,312 55,702,498 68,085,998Total Capital Shares & Equities 40,367,585 41,494,999 44,688,498 48,854,281 54,036,754 60,283,054 67,643,257 76,170,597 85,921,712 96,956,898 109,340,398
Total Liabilities & Equities 83,279,113 101,414,239 100,198,518 99,563,494 99,546,056 100,160,208 101,420,143 103,340,235 105,935,034 109,219,259 113,207,787
3 50 MMGPY Appendix - Indiana Financial Forecast

NREL Bioethanol Co-Location Study -- Wheatfield, IN SiteProforma Income Statements
Construction 1st Year 2nd Year 3rd Year 4th Year 5th Year 6th Year 7th Year 8th Year 9th Year 10th Year(Year 0) Operations Operations Operations Operations Operations Operations Operations Operations Operations Operations
Sales Ethanol 0 44,723,179 60,988,095 62,207,857 63,452,014 64,721,054 66,015,475 67,335,785 68,682,501 70,056,151 71,457,274 Lignin Residue 0 2,667,479 3,629,654 3,665,951 3,702,610 3,739,636 3,777,033 3,814,803 3,852,951 3,891,480 3,930,395 Carbon Dioxide 0 0 0 0 0 0 0 0 0 0 0State Producer Payment 0 0 0 0 0 0 0 0 0 0 0Federal Small Producer Payment 0 0 0 0 0 0 0 0 0 0 0Total Sales 0 47,390,659 64,617,749 65,873,808 67,154,624 68,460,691 69,792,508 71,150,588 72,535,452 73,947,631 75,387,669
Production & Operating Expenses Feedstocks 0 17,824,103 21,742,586 21,960,012 22,179,612 22,401,409 22,625,423 22,851,677 23,080,194 23,310,996 23,544,105 Purchased Cellulase Enzymes 0 3,885,000 5,090,400 5,141,304 5,192,717 5,244,644 5,297,091 5,350,062 5,403,562 5,457,598 5,512,174 Other Chemicals 0 2,979,271 3,903,650 3,942,687 3,982,113 4,021,934 4,062,154 4,102,775 4,143,803 4,185,241 4,227,094 Utilities - Natural Gas 0 7,096,195 9,389,993 9,577,792 9,769,348 9,964,735 10,164,030 10,367,310 10,574,657 10,786,150 11,001,873 Electricity 0 2,189,167 2,896,800 2,954,736 3,013,831 3,074,107 3,135,589 3,198,301 3,262,267 3,327,513 3,394,063 Denaturants 0 1,348,958 1,785,000 1,820,700 1,857,114 1,894,256 1,932,141 1,970,784 2,010,200 2,050,404 2,091,412 Makeup Water 0 115,220 150,969 152,479 154,003 155,543 157,099 158,670 160,256 161,859 163,478 Wastewater Disposal 0 147,293 192,994 194,924 196,873 198,842 200,830 202,839 204,867 206,916 208,985 Solid Waste Disposal 0 371,804 487,163 492,035 496,955 501,925 506,944 512,014 517,134 522,305 527,528 Direct Labor & Benefits 0 1,561,950 1,600,999 1,641,024 1,682,049 1,724,101 1,767,203 1,811,383 1,856,668 1,903,084 1,950,662Total Production Costs 0 37,518,961 47,240,554 47,877,692 48,524,617 49,181,497 49,848,504 50,525,815 51,213,608 51,912,065 52,621,373Gross Profit 0 9,871,698 17,377,195 17,996,115 18,630,007 19,279,194 19,944,004 20,624,773 21,321,844 22,035,566 22,766,296
Administrative & Operating Expenses Maintenance Materials & Services 0 1,129,749 1,487,604 1,509,918 1,532,567 1,555,556 1,578,889 1,602,572 1,626,611 1,651,010 1,675,775
Enzymes & Chemicals 0 583,200 597,780 612,725 628,043 643,744 659,837 676,333 693,242 710,573 728,337 Consulting Services 114,000 24,000 24,480 24,970 25,469 25,978 26,498 27,028 27,568 28,120 28,682 Property Taxes & Insurance 327,715 1,638,573 1,891,493 1,825,215 1,757,320 1,687,781 1,616,570 1,543,659 1,469,022 1,392,629 1,314,452 Admin. Salaries, Wages & Benefits 148,500 635,850 651,746 668,040 684,741 701,859 719,406 737,391 755,826 774,721 794,090 Legal & Accounting/Community Affairs 144,000 36,000 36,720 37,454 38,203 38,968 39,747 40,542 41,353 42,180 43,023 Office/Lab Supplies & Expenses 96,000 96,000 97,920 99,878 101,876 103,913 105,992 108,112 110,274 112,479 114,729 Travel, Training & Miscellaneous 56,600 34,650 35,343 36,050 36,771 37,506 38,256 39,022 39,802 40,598 41,410
EBITD (886,815) 5,693,676 12,554,109 13,181,865 13,825,017 14,483,889 15,158,809 15,850,114 16,558,147 17,283,256 18,025,798Less: Interest - Operating Line of Credit 0 0 0 0 0 0 0 0 0 0 0 Interest - Senior Debt 0 2,475,264 4,798,340 4,448,813 4,070,276 3,660,319 3,216,337 2,735,505 2,214,763 1,650,801 1,040,029 Interest - Subordinated Debt 0 0 0 0 0 0 0 0 0 0 0 Depreciation & Amortization 0 2,090,999 4,562,269 4,567,269 4,572,269 4,577,269 4,582,269 4,587,269 4,592,269 4,597,269 4,602,269
Pre-Tax Income (886,815) 1,127,413 3,193,500 4,165,783 5,182,473 6,246,300 7,360,203 8,527,341 9,751,114 11,035,186 12,383,500Current Income Taxes 0 0 0 0 0 0 0 0 0 0 0
Net Earnings (Loss) for the Year (886,815) 1,127,413 3,193,500 4,165,783 5,182,473 6,246,300 7,360,203 8,527,341 9,751,114 11,035,186 12,383,500
4 50 MMGPY Appendix - Indiana Financial Forecast

NREL Bioethanol Co-Location Study -- Wheatfield, IN SiteProforma Statements of Cash Flows
Construction 1st Year 2nd Year 3rd Year 4th Year 5th Year 6th Year 7th Year 8th Year 9th Year 10th Year(1 Year) Operations Operations Operations Operations Operations Operations Operations Operations Operations Operations
Cash provided by (used in) Operating Activities Net Earnings (loss) (886,815) 1,127,413 3,193,500 4,165,783 5,182,473 6,246,300 7,360,203 8,527,341 9,751,114 11,035,186 12,383,500 Non cash charges to operations Depreciation & Amortization 0 2,090,999 4,562,269 4,567,269 4,572,269 4,577,269 4,582,269 4,587,269 4,592,269 4,597,269 4,602,269
(886,815) 3,218,412 7,755,769 8,733,052 9,754,741 10,823,569 11,942,472 13,114,609 14,343,383 15,632,455 16,985,769
Changes in non-cash working capital balances Accounts Receivable 0 1,760,721 85,500 35,887 36,595 37,316 38,052 38,802 39,568 40,348 41,144 Inventories 0 3,066,053 89,817 46,009 46,758 47,520 48,296 49,086 49,890 50,707 51,540 Prepaid Expenses 0 0 0 0 0 0 0 0 0 0 0 Accounts Payable 0 (807,634) (31,882) (8,905) (9,004) (9,105) (9,207) (9,309) (9,414) (9,519) (9,626) Income Taxes Payable 0 0 0 0 0 0 0 0 0 0 0
0 4,019,140 143,435 72,991 74,348 75,732 77,142 78,579 80,043 81,537 83,058
Investing Activities Land Purchase 225,000 0 0 0 0 0 0 0 0 0 0 Fixed Asset Purchases 81,703,645 13,800,607 100,000 100,000 100,000 100,000 100,000 100,000 100,000 100,000 100,000 Capitalized Fees & Interest 1,350,469 1,515,420 0 0 0 0 0 0 0 0 0
83,279,113 15,316,028 100,000 100,000 100,000 100,000 100,000 100,000 100,000 100,000 100,000
Financing Activities Long Term Debt Advances 42,911,528 18,970,072 0 0 0 0 0 0 0 0 0 Repayment of Long Term Debt 0 (2,769,994) (4,441,103) (4,809,712) (5,208,916) (5,641,253) (6,109,474) (6,616,558) (7,165,729) (7,760,481) (8,404,597) Subordinated Debt Advances 0 0 0 0 0 0 0 0 0 0 0 Repayment of Subordinated Debt 0 0 0 0 0 0 0 0 0 0 0 Equity Investment 41,254,400 0 0 0 0 0 0 0 0 0 0 Grants 0 0 0 0 0 0 0 0 0 0 0 Cash Sweep for Debt Service 0 0 0 0 0 0 0 0 0 0 0 Distributions to Shareholders 0 0 0 0 0 0 0 0 0 0 0
Net Increase (Decrease) in Cash 0 83,323 3,071,231 3,750,349 4,371,478 5,006,584 5,655,856 6,319,473 6,997,611 7,690,438 8,398,113Cash (Indebtedness), Beginning of Year 0 0 83,323 3,154,554 6,904,903 11,276,380 16,282,965 21,938,821 28,258,294 35,255,905 42,946,343
Cash (Bank Indebtedness), End of Year 0 83,323 3,154,554 6,904,903 11,276,380 16,282,965 21,938,821 28,258,294 35,255,905 42,946,343 51,344,456
5 50 MMGPY Appendix - Indiana Financial Forecast

NREL Bioethanol Co-Location Study -- Wheatfield, IN SiteInterim Funding ScheduleMonths 1-24
Cash InterestMonth Project Fees & Other Required By Current Month Equity/Grant Subordinated Payment Loan (Equity)
Development Expenses Operations Disbursements Investment Debt (Earnings) Balance--------- --------- ---------- ----------- ----------- ----------- ----------- ------------- ------------
1 6,996,732 693,566 12,375 7,702,673 (41,254,400) 0 (83,879) (33,635,606)2 6,771,732 74,750 12,375 6,858,857 0 0 (66,942) (26,843,691)3 6,771,732 74,750 12,375 6,858,857 0 0 (49,962) (20,034,795)4 6,771,732 74,750 12,375 6,858,857 0 0 (32,940) (13,208,878)5 6,771,732 74,750 12,375 6,858,857 0 0 (42,333) (6,392,354)6 6,771,732 74,750 12,375 6,858,857 0 0 3,110 469,6137 6,959,232 74,750 12,375 7,046,357 0 0 50,106 7,566,0778 6,862,804 74,750 12,375 6,949,929 0 0 96,773 14,612,7799 6,862,804 79,150 12,375 6,954,329 0 0 143,781 21,710,888
10 6,862,804 79,150 12,375 6,954,329 0 0 191,101 28,856,31911 6,675,304 79,150 12,375 6,766,829 0 0 237,488 35,860,63512 6,850,304 79,150 12,375 6,941,829 0 0 285,350 43,087,81313 7,200,304 19,250 239,750 7,459,304 0 0 336,981 50,884,09814 6,600,304 19,250 239,750 6,859,304 0 0 384,956 58,128,35815 0 19,250 886,609 905,859 0 0 393,561 59,427,77816 0 6,600 553,916 560,516 0 0 399,922 60,388,21617 0 6,600 0 6,600 0 0 402,632 60,797,44818 0 6,600 0 6,600 0 0 405,360 61,209,40919 0 6,600 0 6,600 0 0 405,360 61,621,36920 0 6,600 0 6,600 0 0 405,360 62,033,32921 0 6,600 0 6,600 0 0 405,360 62,445,29022 0 6,600 0 6,600 0 0 405,360 62,857,25023 0 6,600 0 6,600 0 0 405,360 63,269,21024 0 6,600 0 6,600 0 0 405,360 63,681,171
----------- ------------ --------- ---------- ----------- ----------- ------------- -----------------Total 95,729,252 1,650,566 2,031,400 99,448,343 (41,254,400) 0 5,487,227 63,681,171
6 50 MMGPY Appendix - Indiana Financial Forecast

NREL Bioethanol Co-Location Study -- Wheatfield, IN SiteEngineering & Construction Cost Summary
Rolling Stock, Site Prep. & Rail Construction &Tools & Admin. Improve- Equipment & Engineering Procurement Monthly
Month Land Spare Parts Building ments Installation Fees Fees Contingency Total
1 225,000 0 171,429 0 5,234,357 501,621 402,307 462,019 6,996,7322 0 0 171,429 0 5,234,357 501,621 402,307 462,019 6,771,7323 0 0 171,429 0 5,234,357 501,621 402,307 462,019 6,771,7324 0 0 171,429 0 5,234,357 501,621 402,307 462,019 6,771,7325 0 0 171,429 0 5,234,357 501,621 402,307 462,019 6,771,7326 0 0 171,429 0 5,234,357 501,621 402,307 462,019 6,771,7327 0 0 171,429 187,500 5,234,357 501,621 402,307 462,019 6,959,2328 0 0 75,000 187,500 5,234,357 501,621 402,307 462,019 6,862,8049 0 0 75,000 187,500 5,234,357 501,621 402,307 462,019 6,862,804
10 0 0 75,000 187,500 5,234,357 501,621 402,307 462,019 6,862,80411 0 0 75,000 0 5,234,357 501,621 402,307 462,019 6,675,30412 0 250,000 0 0 5,234,357 501,621 402,307 462,019 6,850,30413 0 600,000 0 0 5,234,357 501,621 402,307 462,019 7,200,30414 0 0 0 0 5,234,357 501,621 402,307 462,019 6,600,30415 0 0 0 0 0 0 0 0 016 0 0 0 0 0 0 0 0 017 0 0 0 0 0 0 0 0 018 0 0 0 0 0 0 0 0 0
_________ _________ _________ _________ _________ _________ _________ _________ _________TOTAL 225,000 850,000 1,500,000 750,000 73,281,000 7,022,687 5,632,300 6,468,265 95,729,252
7 50 MMGPY Appendix - Indiana Financial Forecast

NREL Bioethanol Co-Location Study -- Wheatfield, IN SiteProduction & Sales, Months 13-23
Month 13 Month 14 Month 15 Month 16 Month 17 Month 18 Month 19 Month 20 Month 21 Month 22 Month 23Fuel Ethanol
Gallons Produced 0 0 2,083,333 3,125,000 4,166,667 4,166,667 4,166,667 4,166,667 4,166,667 4,166,667 4,166,667Gallons Sent to Inventory 0 0 571,429 571,429 0 0 0 0 0 0 0Denaturant Added 0 0 104,167 156,250 208,333 208,333 208,333 208,333 208,333 208,333 208,333Net Gallons Sold (Denatured) 0 0 1,587,500 2,681,250 4,375,000 4,375,000 4,375,000 4,375,000 4,375,000 4,375,000 4,375,000Selling Price/Gallon (FOB Plant) $1.1389 $1.1389 $1.1389 $1.1389 $1.1389 $1.1389 $1.1389 $1.1389 $1.1389 $1.1389 $1.1389State Producer Payment $0.000 $0.000 $0.000 $0.000 $0.000 $0.000 $0.000 $0.000 $0.000 $0.000 $0.000Federal Small Producer Payment $0.000 $0.000 $0.000 $0.000 $0.000 $0.000 $0.000 $0.000 $0.000 $0.000 $0.000
Total Revenue - Fuel Ethanol 0 0 1,808,004 3,053,676 4,982,688 4,982,688 4,982,688 4,982,688 4,982,688 4,982,688 4,982,688
Lignin Residue Dry Tons Produced 0 0 23,323 34,984 46,646 46,646 46,646 46,646 46,646 46,646 46,646Tons Sent to Inventory 0 0 7,996 7,996 0 0 0 0 0 0 0Net Tons Sold 0 0 15,326 26,988 46,646 46,646 46,646 46,646 46,646 46,646 46,646Selling Price/Dry Ton $6.42 $6.42 $6.42 $6.42 $6.42 $6.42 $6.42 $6.42 $6.42 $6.42 $6.42
Total Revenue - Lignin Residue 0 0 98,399 173,268 299,476 299,476 299,476 299,476 299,476 299,476 299,476
CO2
Tons Produced 0 0 5,208 7,813 10,417 10,417 10,417 10,417 10,417 10,417 10,417Tons Sent to Inventory 0 0 0 0 0 0 0 0 0 0 0Net Tons Sold 0 0 5,208 7,813 10,417 10,417 10,417 10,417 10,417 10,417 10,417Selling Price/Ton $0.00 $0.00 $0.00 $0.00 $0.00 $0.00 $0.00 $0.00 $0.00 $0.00 $0.00
Total Revenue - CO2 0 0 0 0 0 0 0 0 0 0 0
Total Revenue - All Products 0 0 1,906,403 3,226,944 5,282,164 5,282,164 5,282,164 5,282,164 5,282,164 5,282,164 5,282,164
8 50 MMGPY Appendix - Indiana Financial Forecast

NREL Bioethanol Co-Location Study -- Wheatfield, IN SiteOperating Expense, Months 13-23
Month 13 Month 14 Month 15 Month 16 Month 17 Month 18 Month 19 Month 20 Month 21 Month 22 Month 23
Plant Operating Rate 0.00% 0.00% 50.00% 75.00% 100.00% 100.00% 100.00% 100.00% 100.00% 100.00% 100.00%
BDT Biomass for Processing 0 0 23,226 34,838 46,451 46,451 46,451 46,451 46,451 46,451 46,451BDT Biomass to Inventory 0 0 15,926 15,926 0 0 0 0 0 0 0$/BDT Biomass (Delivered) $38.620 $38.620 $38.620 $38.620 $38.620 $38.620 $38.620 $38.620 $38.620 $38.620 $38.620Biomass Expense 0 0 1,512,037 1,960,523 1,793,943 1,793,943 1,793,943 1,793,943 1,793,943 1,793,943 1,793,943
Total Feedstock Expense 0 0 1,512,037 1,960,523 1,793,943 1,793,943 1,793,943 1,793,943 1,793,943 1,793,943 1,793,943
Electricity (KWH) 0 0 2,958,333 4,437,500 5,916,667 5,916,667 5,916,667 5,916,667 5,916,667 5,916,667 5,916,667$/KWH $0.0400 $0.0400 $0.0400 $0.0400 $0.0400 $0.0400 $0.0400 $0.0400 $0.0400 $0.0400 $0.0400Electricity Expense 0 0 118,333 177,500 236,667 236,667 236,667 236,667 236,667 236,667 236,667
Natural Gas (MMBTU) 0 0 85,240 127,859 170,479 170,479 170,479 170,479 170,479 170,479 170,479$/MMBTU $4.5000 $4.5000 $4.5000 $4.5000 $4.5000 $4.5000 $4.5000 $4.5000 $4.5000 $4.5000 $4.5000Natural Gas Expense 0 0 383,578 575,367 767,156 767,156 767,156 767,156 767,156 767,156 767,156
Makeup Water ('000 Gal.) 0 0 12,456 18,684 24,912 24,912 24,912 24,912 24,912 24,912 24,912$/1000 Gal. $0.5000 $0.5000 $0.5000 $0.5000 $0.5000 $0.5000 $0.5000 $0.5000 $0.5000 $0.5000 $0.5000Makeup Water Expense 0 0 6,228 9,342 12,456 12,456 12,456 12,456 12,456 12,456 12,456
Effluent Disposal ('000 Gal) 0 0 7,962 11,943 15,924 15,924 15,924 15,924 15,924 15,924 15,924$/1000 Gal. $1.0000 $1.0000 $1.0000 $1.0000 $1.0000 $1.0000 $1.0000 $1.0000 $1.0000 $1.0000 $1.0000Effluent Disposal Expense 0 0 7,962 11,943 15,924 15,924 15,924 15,924 15,924 15,924 15,924
Solid Waste Disposal (Tons) 0 0 2,010 3,015 4,020 4,020 4,020 4,020 4,020 4,020 4,020$/Ton $10.0000 $10.0000 $10.0000 $10.0000 $10.0000 $10.0000 $10.0000 $10.0000 $10.0000 $10.0000 $10.0000Solid Waste Disposal Expense 0 0 20,098 30,146 40,195 40,195 40,195 40,195 40,195 40,195 40,195
Labor & Benefits 231,750 231,750 231,750 231,750 231,750 231,750 231,750 231,750 231,750 231,750 231,750Maintenance Materials & Services 0 0 61,068 91,601 122,135 122,135 122,135 122,135 122,135 122,135 122,135Taxes & Insurance 0 0 0 18,750 18,750 18,750 18,750 18,750 18,750 18,750 18,750Denaturants 0 0 72,917 109,375 145,833 145,833 145,833 145,833 145,833 145,833 145,833Purchased Cellulase Enzymes 0 0 210,000 315,000 420,000 420,000 420,000 420,000 420,000 420,000 420,000Other Chemicals 0 0 161,042 241,563 322,083 322,083 322,083 322,083 322,083 322,083 322,083Office/Lab Supplies & Expenses 8,000 8,000 8,000 8,000 8,000 8,000 8,000 8,000 8,000 8,000 8,000
Total Monthly Expense (non-feedstock) 239,750 239,750 1,280,975 1,820,337 2,340,949 2,340,949 2,340,949 2,340,949 2,340,949 2,340,949 2,340,949
Total Monthly Profit (Loss) (239,750) (239,750) (886,609) (553,916) 1,147,272 1,147,272 1,147,272 1,147,272 1,147,272 1,147,272 1,147,272
9 50 MMGPY Appendix - Indiana Financial Forecast

NREL Bioethanol Co-Location Study -- Wheatfield, IN SiteInterim Period Fees & ExpensesMonths 1-24
Lender/ Legal/ Political/Placement Organizational Accounting Community Financial Construction Hiring & Contingency @ Monthly
Month Fees Costs Expenses Relations Consultants Consultants Training Travel 10% Total
1 618,816 $50,000 10,000 2,000 2,000 7,500 0 1,000 2,250 693,5662 0 $50,000 10,000 2,000 2,000 7,500 0 1,000 2,250 74,7503 0 $50,000 10,000 2,000 2,000 7,500 0 1,000 2,250 74,7504 0 $50,000 10,000 2,000 2,000 7,500 0 1,000 2,250 74,7505 0 $50,000 10,000 2,000 2,000 7,500 0 1,000 2,250 74,7506 0 $50,000 10,000 2,000 2,000 7,500 0 1,000 2,250 74,7507 0 $50,000 10,000 2,000 2,000 7,500 0 1,000 2,250 74,7508 0 $50,000 10,000 2,000 2,000 7,500 0 1,000 2,250 74,7509 0 $50,000 10,000 2,000 2,000 7,500 4,000 1,000 2,650 79,150
10 0 $50,000 10,000 2,000 2,000 7,500 4,000 1,000 2,650 79,15011 0 $50,000 10,000 2,000 2,000 7,500 4,000 1,000 2,650 79,15012 0 $50,000 10,000 2,000 2,000 7,500 4,000 1,000 2,650 79,15013 0 0 2,000 1,000 2,000 7,500 4,000 1,000 1,750 19,25014 0 0 2,000 1,000 2,000 7,500 4,000 1,000 1,750 19,25015 0 0 2,000 1,000 2,000 7,500 4,000 1,000 1,750 19,25016 0 0 2,000 1,000 2,000 0 0 1,000 600 6,60017 0 0 2,000 1,000 2,000 0 0 1,000 600 6,60018 0 0 2,000 1,000 2,000 0 0 1,000 600 6,60019 0 0 2,000 1,000 2,000 0 0 1,000 600 6,60020 0 0 2,000 1,000 2,000 0 0 1,000 600 6,60021 0 0 2,000 1,000 2,000 0 0 1,000 600 6,60022 0 0 2,000 1,000 2,000 0 0 1,000 600 6,60023 0 0 2,000 1,000 2,000 0 0 1,000 600 6,60024 0 0 2,000 1,000 2,000 0 0 1,000 600 6,600
_______ _______ _______ _______ _______ _______ _______ _______ _______ _______TOTAL 618,816 600,000 144,000 36,000 48,000 112,500 28,000 24,000 39,250 1,650,566
10 50 MMGPY Appendix - Indiana Financial Forecast

Interim Period Labor SummaryMonths 1-24
General Plant Environ. & Commodity Admin. Lab Shift Team Shift YardPosition Manager Manager Safety Mgr. Controller Manager Assistant Microbiologist Technician Leader Operator LaborNumber Employed (1) (1) (1) (1) (1) (4) (1) (2) (4) (16) (16)Annual Salary 110,000 80,000 60,000 65,000 60,000 24,000 45,000 28,000 44,000 30,000 25,000
______ ______ ______ ______ ______ ______ ______ ______ ______ ______ ______Month
1 9,167 0 0 0 0 0 0 0 0 0 02 9,167 0 0 0 0 0 0 0 0 0 03 9,167 0 0 0 0 0 0 0 0 0 04 9,167 0 0 0 0 0 0 0 0 0 05 9,167 0 0 0 0 0 0 0 0 0 06 9,167 0 0 0 0 0 0 0 0 0 07 9,167 0 0 0 0 0 0 0 0 0 08 9,167 0 0 0 0 0 0 0 0 0 09 9,167 0 0 0 0 0 0 0 0 0 0
10 9,167 0 0 0 0 0 0 0 0 0 011 9,167 0 0 0 0 0 0 0 0 0 012 9,167 0 0 0 0 0 0 0 0 0 013 9,167 6,667 5,000 5,417 5,000 8,000 3,750 4,667 14,667 40,000 33,33314 9,167 6,667 5,000 5,417 5,000 8,000 3,750 4,667 14,667 40,000 33,33315 9,167 6,667 5,000 5,417 5,000 8,000 3,750 4,667 14,667 40,000 33,33316 9,167 6,667 5,000 5,417 5,000 8,000 3,750 4,667 14,667 40,000 33,33317 9,167 6,667 5,000 5,417 5,000 8,000 3,750 4,667 14,667 40,000 33,33318 9,167 6,667 5,000 5,417 5,000 8,000 3,750 4,667 14,667 40,000 33,33319 9,167 6,667 5,000 5,417 5,000 8,000 3,750 4,667 14,667 40,000 33,33320 9,167 6,667 5,000 5,417 5,000 8,000 3,750 4,667 14,667 40,000 33,33321 9,167 6,667 5,000 5,417 5,000 8,000 3,750 4,667 14,667 40,000 33,33322 9,167 6,667 5,000 5,417 5,000 8,000 3,750 4,667 14,667 40,000 33,33323 9,167 6,667 5,000 5,417 5,000 8,000 3,750 4,667 14,667 40,000 33,33324 9,167 6,667 5,000 5,417 5,000 8,000 3,750 4,667 14,667 40,000 33,333
11 50 MMGPY Appendix - Indiana Financial Forecast

Interim Period Labor SummaryMonths 1-24
PositionNumber EmployedAnnual Salary
Month123456789
101112131415161718192021222324
Maintenance Boiler Maintenance Instrument Monthly Benefits TotalManager Operator Worker Welder Electrician Technician Total at
(1) (1) (6) (1) (1) (2) (60) 35.00%50,000 40,000 33,000 35,000 35,000 37,000______ ______ ______ ______ ______ ______ ______ ______ ______
0 0 0 0 0 0 9,167 3,208 12,3750 0 0 0 0 0 9,167 3,208 12,3750 0 0 0 0 0 9,167 3,208 12,3750 0 0 0 0 0 9,167 3,208 12,3750 0 0 0 0 0 9,167 3,208 12,3750 0 0 0 0 0 9,167 3,208 12,3750 0 0 0 0 0 9,167 3,208 12,3750 0 0 0 0 0 9,167 3,208 12,3750 0 0 0 0 0 9,167 3,208 12,3750 0 0 0 0 0 9,167 3,208 12,3750 0 0 0 0 0 9,167 3,208 12,3750 0 0 0 0 0 9,167 3,208 12,375
4,167 3,333 16,500 2,917 2,917 6,167 171,667 60,083 231,7504,167 3,333 16,500 2,917 2,917 6,167 171,667 60,083 231,7504,167 3,333 16,500 2,917 2,917 6,167 171,667 60,083 231,7504,167 3,333 16,500 2,917 2,917 6,167 171,667 60,083 231,7504,167 3,333 16,500 2,917 2,917 6,167 171,667 60,083 231,7504,167 3,333 16,500 2,917 2,917 6,167 171,667 60,083 231,7504,167 3,333 16,500 2,917 2,917 6,167 171,667 60,083 231,7504,167 3,333 16,500 2,917 2,917 6,167 171,667 60,083 231,7504,167 3,333 16,500 2,917 2,917 6,167 171,667 60,083 231,7504,167 3,333 16,500 2,917 2,917 6,167 171,667 60,083 231,7504,167 3,333 16,500 2,917 2,917 6,167 171,667 60,083 231,7504,167 3,333 16,500 2,917 2,917 6,167 171,667 60,083 231,750
12 50 MMGPY Appendix - Indiana Financial Forecast

NREL Bioethanol Co-Location Study -- Wheatfield, IN SiteProduction Assumptions
Denatured Fuel Ethanol (gal/yr) 73,500,000Anhydrous Ethanol Production (gal/yr) 70,000,000Operating Days Per Year 350
1st year 2nd year 3rd Year 4th Year 5th Year 6th Year 7th Year 8th Year 9th Year 10th Year AnnualProduct Yields & Energy Consumption Operations Operations Operations Operations Operations Operations Operations Operations Operations Operations EscalationEthanol Yield (gal/BDT) 89.700 89.700 89.700 89.700 89.700 89.700 89.700 89.700 89.700 89.700Net Ethanol Selling Price ($/gal) $1.210 $1.234 $1.259 $1.284 $1.310 $1.336 $1.363 $1.390 $1.418 $1.446 2.00%Ethanol Sales Commission (%) 1.000% 1.000% 1.000% 1.000% 1.000% 1.000% 1.000% 1.000% 1.000% 1.000% 0.00%Ethanol Transportation ($/gal) $0.0590 $0.0602 $0.0614 $0.0626 $0.0639 $0.0651 $0.0664 $0.0678 $0.0691 $0.0705 2.00%State Producer Payment ($/gal) $0.000 $0.000 $0.000 $0.000 $0.000 $0.000 $0.000 $0.000 $0.000 $0.000Federal Small Producer Payment ($/gal) $0.000 $0.000 $0.000 $0.000 $0.000 $0.000 $0.000 $0.000 $0.000 $0.000
Delivered Biomass Price ($/BDT) $38.620 $39.006 $39.396 $39.790 $40.188 $40.590 $40.996 $41.406 $41.820 $42.238 1.00%Biomass Transportation & Storage ($/BDT) $0.000 $0.000 $0.000 $0.000 $0.000 $0.000 $0.000 $0.000 $0.000 $0.000 1.50%Biomass Usage (BDT/yr) 780,379 780,379 780,379 780,379 780,379 780,379 780,379 780,379 780,379 780,379Biomass Test Weight (lb/BDT) 2,000 2,000 2,000 2,000 2,000 2,000 2,000 2,000 2,000 2,000
Lignin Residue Yield (wet lb/BDT) 2,008.376 2,008.376 2008.376 2008.376 2008.376 2008.376 2008.376 2008.376 2008.376 2008.376Lignin Residue Price ($/wet ton) $6.420 $6.484 $6.549 $6.615 $6.681 $6.748 $6.815 $6.883 $6.952 $7.022 1.00%Lignin Residue Transportation ($/wet ton) $0.000 $0.000 $0.000 $0.000 $0.000 $0.000 $0.000 $0.000 $0.000 $0.000 2.00%Lignin Sales Commission (% of sales) 0.000% 0.000% 0.000% 0.000% 0.000% 0.000% 0.000% 0.000% 0.000% 0.000% 0.00%
Carbon Dioxide (CO2) Sold (lb/gal) 5.000 5.000 5.000 5.000 5.000 5.000 5.000 5.000 5.000 5.000CO2 Price ($/ton) $0.000 $0.000 $0.000 $0.000 $0.000 $0.000 $0.000 $0.000 $0.000 $0.000 1.00%
Electricity Use (kWh/BDT) 127.374 127.374 127.374 127.374 127.374 127.374 127.374 127.374 127.374 127.374Electricity Price ($/kWh) $0.0400 $0.0408 $0.0416 $0.0424 $0.0433 $0.0442 $0.0450 $0.0459 $0.0469 $0.0478 2.00%Natural Gas Use (MMBTU/BDT) 3.6701 3.6701 3.6701 3.6701 3.6701 3.6701 3.6701 3.6701 3.6701 3.6701Natural Gas Price ($/MMBTU) $4.5000 $4.5900 $4.6818 $4.7754 $4.8709 $4.9684 $5.0677 $5.1691 $5.2725 $5.3779 2.00%
Fresh Water Use (1000 gal/BDT) 0.536 0.536 0.536 0.536 0.536 0.536 0.536 0.536 0.536 0.536Fresh Water Price ($/1000 gal) $0.5000 $0.5050 $0.5101 $0.5152 $0.5203 $0.5255 $0.5308 $0.5361 $0.5414 $0.5468 1.00%Wastewater Effluent (1000 gal/BDT) 0.343 0.343 0.343 0.343 0.343 0.343 0.343 0.343 0.343 0.343Wastewater Effluent Price ($/1000 gal) $1.0000 $1.0100 $1.0201 $1.0303 $1.0406 $1.0510 $1.0615 $1.0721 $1.0829 $1.0937 1.00%
Solid Waste Disposal (ton/BDT) 0.087 0.087 0.087 0.087 0.087 0.087 0.087 0.087 0.087 0.087Solid Waste Disposal Price ($/Ton) $10.0000 $10.1000 $10.2010 $10.3030 $10.4060 $10.5101 $10.6152 $10.7214 $10.8286 $10.9369 1.00%
Denaturant Use (% of ethanol sold) 5.000% 5.000% 5.000% 5.000% 5.000% 5.000% 5.000% 5.000% 5.000% 5.000%Denaturant Price ($/gal) $0.7000 $0.7140 $0.7283 $0.7428 $0.7577 $0.7729 $0.7883 $0.8041 $0.8202 $0.8366 2.00%Purchased Cellulase Enzyme ($/gal etoh) $0.1008 $0.1018 $0.1028 $0.1039 $0.1049 $0.1059 $0.1070 $0.1081 $0.1092 $0.1102 1.00%Other Chemical Costs ($/gal ethanol) $0.0773 $0.0781 $0.0789 $0.0796 $0.0804 $0.0812 $0.0821 $0.0829 $0.0837 $0.0845 1.00%
Number of Employees 71 71 71 71 71 71 71 71 71 71Average Salary Including Benefits $45,063 $46,190 $47,345 $48,528 $49,742 $50,985 $52,260 $53,566 $54,905 $56,278 2.50%Maintenance Materials & Services 2.000% 2.030% 2.060% 2.091% 2.123% 2.155% 2.187% 2.220% 2.253% 2.287% 1.50%Property Tax & Insurance 2.000% 2.020% 2.040% 2.061% 2.081% 2.102% 2.123% 2.144% 2.166% 2.187% 1.00%All Other Expense Categories 2.00%
1 70 MMGPY Appendix - Indiana Financial Forecast

NREL Bioethanol Co-Location Study -- Wheatfield, IN SiteFinancial Assumptions
Ethanol Plant Engineering & Construction Costs Capital Equipment Cost & Installation $92,478,000 Engineering Expense $8,860,213 Receivable Payable Inventories Construction Management $7,083,090 (#Days) (#Days) (#Days) Contingency $8,160,723 Fuel Ethanol 10 8Total $116,582,000 $1.67 per gallon Lignin Residue 10 8
Denaturants 10 10Owner's Costs Enzymes & Chemicals 15 15
Inventory - Biomass $861,000 Biomass 10 20Inventory - Chemicals/Denaturant $302,000 Utilities 15Inventory - Ethanol & Lignin $2,028,000Spare Parts $700,000Startup Costs $1,400,000Land $225,000Administration Building & Furnishing $350,000Rail Improvements $1,000,000 Tax Incentives ($/gal) State PlantSite Development Costs $1,400,000 Producer OperatingTools and Laboratory Equipment $250,000 Year Federal State Payment Month RateOrganizational Costs $700,000 1 $0.052 $0.000 $0.000 13 0.00%Capitalized Fees and Interest $3,591,000 2 $0.052 $0.000 $0.000 14 0.00%Working Capital $490,000 3 $0.051 $0.000 $0.000 15 50.00%
Total Estimated Project Cost $129,879,000 4 $0.051 $0.000 $0.000 16 75.00%5 $0.051 $0.000 $0.000 17 100.00%
Senior Debt 6 $0.051 $0.000 $0.000 18 100.00% Principal $77,927,400 60.00% 7 $0.051 $0.000 $0.000 19 100.00% Interest Rate 8.0% fixed 8 $0.051 $0.000 $0.000 20 100.00% Lender Fees $779,274 1.000% 9 $0.051 $0.000 $0.000 21 100.00% Placement Fees $0 0.000% 10 $0.051 $0.000 $0.000 22 100.00% Amortization Period 10 years 23 100.00% Cash Sweep 0.000% State producer payment, ¢/gal $0.000 24 100.00%
Annual payment cap $0Subordinated Debt State incentive duration, years 0 Principal $0 0.00% Interest Rate 0.00% Lender Fees $0 0.000% Income Tax Rate 0.00% Placement Fees $0.00 0.000% Investment Interest 3.00% Amortization Period 0 years Operating Line Interest 10.00%
Common Equity Investment Total Equity Amount $51,951,600 40.00% Placement Fees $0 0.000% Preferred Shares $0 0.000% Common Shares $51,951,600 100.000%
Grants Amount $0 0.00%
Accounts
Blenders Credit
2 70 MMGPY Appendix - Indiana Financial Forecast

NREL Bioethanol Co-Location Study -- Wheatfield, IN SiteProforma Balance Sheet
Construction 1st Year 2nd Year 3rd Year 4th Year 5th Year 6th Year 7th Year 8th Year 9th Year 10th Year(1 Year) Operations Operations Operations Operations Operations Operations Operations Operations Operations Operations
ASSETSCurrent Assets: Cash & Cash Equivalents 0 1,655,153 8,531,969 16,375,413 25,104,793 34,740,198 45,302,003 56,810,869 69,287,735 82,753,806 97,230,551 Accounts Receivable - Trade 0 2,465,010 2,584,710 2,634,952 2,686,185 2,738,428 2,791,700 2,846,024 2,901,418 2,957,905 3,015,507 Inventories Feedstock 0 1,722,185 1,739,407 1,756,801 1,774,369 1,792,113 1,810,034 1,828,134 1,846,415 1,864,880 1,883,528 Purchased Cellulase Enzymes 0 302,400 305,424 308,478 311,563 314,679 317,825 321,004 324,214 327,456 330,730 Other Chemicals 0 231,900 234,219 236,561 238,927 241,316 243,729 246,167 248,628 251,114 253,626 Denaturant 0 70,000 71,400 72,828 74,285 75,770 77,286 78,831 80,408 82,016 83,656 Finished Product Inventory 0 1,965,989 2,067,768 2,107,962 2,148,948 2,190,742 2,233,360 2,276,819 2,321,134 2,366,324 2,412,405 Total Inventories 0 4,292,474 4,418,218 4,482,630 4,548,091 4,614,620 4,682,234 4,750,955 4,820,800 4,891,790 4,963,946 Prepaid Expenses 0 0 0 0 0 0 0 0 0 0 0 Other Current Assets 0 0 0 0 0 0 0 0 0 0 0Total Current Assets 0 8,412,637 15,534,897 23,492,995 32,339,070 42,093,245 52,775,938 64,407,847 77,009,953 90,603,502 105,210,004
Land 225,000 225,000 225,000 225,000 225,000 225,000 225,000 225,000 225,000 225,000 225,000Property, Plant & Equipment Property, Plant & Equipment, at cost 102,927,451 120,282,026 120,382,026 120,482,026 120,582,026 120,682,026 120,782,026 120,882,026 120,982,026 121,082,026 121,182,026 Less Accumulated Depreciation & Amortiz. 0 2,640,810 8,027,000 13,418,190 18,814,380 24,215,570 29,621,760 35,032,950 40,449,140 45,870,330 51,296,520Net Property, Plant & Equipment 102,927,451 117,641,217 112,355,027 107,063,837 101,767,647 96,466,457 91,160,267 85,849,077 80,532,887 75,211,697 69,885,507Capitalized Fees & Interest 1,691,832 3,593,175 3,233,858 2,874,540 2,515,223 2,155,905 1,796,588 1,437,270 1,077,953 718,635 359,318Total Assets 104,844,283 129,872,029 131,348,781 133,656,373 136,846,939 140,940,607 145,957,792 151,919,194 158,845,792 166,758,834 175,679,828
LIABILITIES & EQUITIESCurrent Liabilities: Accounts Payable 0 1,130,687 1,175,322 1,187,790 1,200,396 1,213,143 1,226,032 1,239,065 1,252,244 1,265,570 1,279,046 Notes Payable 0 0 0 0 0 0 0 0 0 0 0 Current Maturities of Long Term Debt 0 5,592,673 6,056,863 6,559,579 7,104,021 7,693,651 8,332,221 9,023,791 9,772,761 10,583,895 3,719,697 Current maturities of Subordinated Debt 0 0 0 0 0 0 0 0 0 0 0Total Current Liabilities 0 6,723,361 7,232,185 7,747,369 8,304,417 8,906,794 9,558,252 10,262,856 11,025,005 11,849,466 4,998,743
Long Term Debt (excluding current maturities 53,888,393 68,846,478 62,789,616 56,230,036 49,126,015 41,432,364 33,100,144 24,076,353 14,303,592 3,719,697 0Subordinated Debt (excluding current maturiti 0 0 0 0 0 0 0 0 0 0 0Deferred Income Taxes 0 0 0 0 0 0 0 0 0 0 0Total Liabilities 53,888,393 75,569,839 70,021,801 63,977,405 57,430,432 50,339,158 42,658,396 34,339,208 25,328,597 15,569,162 4,998,743
Capital Shares & Equities Preferred Shares 0 0 0 0 0 0 0 0 0 0 0 Common Shares 51,951,600 51,951,600 51,951,600 51,951,600 51,951,600 51,951,600 51,951,600 51,951,600 51,951,600 51,951,600 51,951,600 Grants 0 0 0 0 0 0 0 0 0 0 0 Retained Earnings (995,710) 2,350,590 9,375,381 17,727,367 27,464,907 38,649,849 51,347,796 65,628,386 81,565,595 99,238,071 118,729,485Total Capital Shares & Equities 50,955,890 54,302,190 61,326,981 69,678,967 79,416,507 90,601,449 103,299,396 117,579,986 133,517,195 151,189,671 170,681,085
Total Liabilities & Equities 104,844,283 129,872,029 131,348,781 133,656,373 136,846,939 140,940,607 145,957,792 151,919,194 158,845,792 166,758,834 175,679,828
3 70 MMGPY Appendix - Indiana Financial Forecast

NREL Bioethanol Co-Location Study -- Wheatfield, IN SiteProforma Income Statements
Construction 1st Year 2nd Year 3rd Year 4th Year 5th Year 6th Year 7th Year 8th Year 9th Year 10th Year(Year 0) Operations Operations Operations Operations Operations Operations Operations Operations Operations Operations
Sales Ethanol 0 62,612,451 85,383,333 87,091,000 88,832,820 90,609,476 92,421,666 94,270,099 96,155,501 98,078,611 100,040,183 Lignin Residue 0 3,734,471 5,081,516 5,132,331 5,183,654 5,235,491 5,287,846 5,340,724 5,394,131 5,448,073 5,502,553 Carbon Dioxide 0 0 0 0 0 0 0 0 0 0 0State Producer Payment 0 0 0 0 0 0 0 0 0 0 0Federal Small Producer Payment 0 0 0 0 0 0 0 0 0 0 0Total Sales 0 66,346,922 90,464,849 92,223,331 94,016,474 95,844,967 97,709,511 99,610,823 101,549,632 103,526,684 105,542,737
Production & Operating Expenses Feedstocks 0 24,953,744 30,439,621 30,744,017 31,051,457 31,361,972 31,675,592 31,992,348 32,312,271 32,635,394 32,961,748 Purchased Cellulase Enzymes 0 5,439,000 7,126,560 7,197,826 7,269,804 7,342,502 7,415,927 7,490,086 7,564,987 7,640,637 7,717,043 Other Chemicals 0 4,170,979 5,465,110 5,519,761 5,574,959 5,630,708 5,687,015 5,743,886 5,801,324 5,859,338 5,917,931 Utilities - Natural Gas 0 9,934,673 13,145,990 13,408,909 13,677,087 13,950,629 14,229,642 14,514,235 14,804,519 15,100,610 15,402,622 Electricity 0 3,064,833 4,055,520 4,136,630 4,219,363 4,303,750 4,389,825 4,477,622 4,567,174 4,658,518 4,751,688 Denaturants 0 1,888,542 2,499,000 2,548,980 2,599,960 2,651,959 2,704,998 2,759,098 2,814,280 2,870,565 2,927,977 Makeup Water 0 161,307 211,356 213,470 215,605 217,761 219,938 222,138 224,359 226,603 228,869 Wastewater Disposal 0 206,210 270,191 272,893 275,622 278,379 281,162 283,974 286,814 289,682 292,579 Solid Waste Disposal 0 520,525 682,029 688,849 695,738 702,695 709,722 716,819 723,987 731,227 738,539 Direct Labor & Benefits 0 1,858,950 1,905,424 1,953,059 2,001,886 2,051,933 2,103,231 2,155,812 2,209,707 2,264,950 2,321,574Total Production Costs 0 52,198,765 65,800,801 66,684,395 67,581,480 68,492,288 69,417,053 70,356,016 71,309,423 72,277,523 73,260,569Gross Profit 0 14,148,157 24,664,048 25,538,935 26,434,994 27,352,679 28,292,458 29,254,807 30,240,209 31,249,161 32,282,167
Administrative & Operating Expenses Maintenance Materials & Services 0 1,425,703 1,877,303 1,905,463 1,934,045 1,963,056 1,992,501 2,022,389 2,052,725 2,083,516 2,114,768 Maintenance - Wages & Benefits 0 672,300 689,108 706,335 723,994 742,093 760,646 779,662 799,153 819,132 839,611 Consulting Services 114,000 24,000 24,480 24,970 25,469 25,978 26,498 27,028 27,568 28,120 28,682 Property Taxes & Insurance 412,610 2,063,049 2,380,898 2,296,858 2,210,796 2,122,679 2,032,474 1,940,146 1,845,661 1,748,984 1,650,080 Admin. Salaries, Wages & Benefits 148,500 668,250 684,956 702,080 719,632 737,623 756,064 774,965 794,339 814,198 834,553 Legal & Accounting/Community Affairs 144,000 36,000 36,720 37,454 38,203 38,968 39,747 40,542 41,353 42,180 43,023 Office/Lab Supplies & Expenses 120,000 120,000 122,400 124,848 127,345 129,892 132,490 135,139 137,842 140,599 143,411 Travel, Training & Miscellaneous 56,600 34,650 35,343 36,050 36,771 37,506 38,256 39,022 39,802 40,598 41,410
EBITD (995,710) 9,104,206 18,812,840 19,704,877 20,618,739 21,554,884 22,513,783 23,495,914 24,501,765 25,531,834 26,586,629Less: Interest - Operating Line of Credit 0 0 0 0 0 0 0 0 0 0 0 Interest - Senior Debt 0 3,117,096 6,042,542 5,602,383 5,125,692 4,609,434 4,050,328 3,444,817 2,789,048 2,078,851 1,309,707 Interest - Subordinated Debt 0 0 0 0 0 0 0 0 0 0 0 Depreciation & Amortization 0 2,640,810 5,745,508 5,750,508 5,755,508 5,760,508 5,765,508 5,770,508 5,775,508 5,780,508 5,785,508
Pre-Tax Income (995,710) 3,346,300 7,024,790 8,351,987 9,737,540 11,184,942 12,697,947 14,280,590 15,937,209 17,672,476 19,491,414Current Income Taxes 0 0 0 0 0 0 0 0 0 0 0
Net Earnings (Loss) for the Year (995,710) 3,346,300 7,024,790 8,351,987 9,737,540 11,184,942 12,697,947 14,280,590 15,937,209 17,672,476 19,491,414
4 70 MMGPY Appendix - Indiana Financial Forecast

NREL Bioethanol Co-Location Study -- Wheatfield, IN SiteProforma Statements of Cash Flows
Construction 1st Year 2nd Year 3rd Year 4th Year 5th Year 6th Year 7th Year 8th Year 9th Year 10th Year(1 Year) Operations Operations Operations Operations Operations Operations Operations Operations Operations Operations
Cash provided by (used in) Operating Activities Net Earnings (loss) (995,710) 3,346,300 7,024,790 8,351,987 9,737,540 11,184,942 12,697,947 14,280,590 15,937,209 17,672,476 19,491,414 Non cash charges to operations Depreciation & Amortization 0 2,640,810 5,745,508 5,750,508 5,755,508 5,760,508 5,765,508 5,770,508 5,775,508 5,780,508 5,785,508
(995,710) 5,987,110 12,770,298 14,102,494 15,493,047 16,945,450 18,463,455 20,051,097 21,712,717 23,452,983 25,276,922
Changes in non-cash working capital balances Accounts Receivable 0 2,465,010 119,700 50,242 51,233 52,243 53,273 54,323 55,395 56,487 57,602 Inventories 0 4,292,474 125,744 64,412 65,461 66,528 67,615 68,720 69,845 70,990 72,156 Prepaid Expenses 0 0 0 0 0 0 0 0 0 0 0 Accounts Payable 0 (1,130,687) (44,635) (12,467) (12,606) (12,747) (12,889) (13,033) (13,179) (13,327) (13,476) Income Taxes Payable 0 0 0 0 0 0 0 0 0 0 0
0 5,626,796 200,809 102,187 104,088 106,024 107,998 110,010 112,061 114,151 116,282
Investing Activities Land Purchase 225,000 0 0 0 0 0 0 0 0 0 0 Fixed Asset Purchases 102,927,451 17,354,575 100,000 100,000 100,000 100,000 100,000 100,000 100,000 100,000 100,000 Capitalized Fees & Interest 1,691,832 1,901,343 0 0 0 0 0 0 0 0 0
104,844,283 19,255,919 100,000 100,000 100,000 100,000 100,000 100,000 100,000 100,000 100,000
Financing Activities Long Term Debt Advances 53,888,393 24,039,007 0 0 0 0 0 0 0 0 0 Repayment of Long Term Debt 0 (3,488,248) (5,592,673) (6,056,863) (6,559,579) (7,104,021) (7,693,651) (8,332,221) (9,023,791) (9,772,761) (10,583,895) Subordinated Debt Advances 0 0 0 0 0 0 0 0 0 0 0 Repayment of Subordinated Debt 0 0 0 0 0 0 0 0 0 0 0 Equity Investment 51,951,600 0 0 0 0 0 0 0 0 0 0 Grants 0 0 0 0 0 0 0 0 0 0 0 Cash Sweep for Debt Service 0 0 0 0 0 0 0 0 0 0 0 Distributions to Shareholders 0 0 0 0 0 0 0 0 0 0 0
Net Increase (Decrease) in Cash 0 1,655,153 6,876,816 7,843,444 8,729,380 9,635,404 10,561,805 11,508,866 12,476,865 13,466,071 14,476,745Cash (Indebtedness), Beginning of Year 0 0 1,655,153 8,531,969 16,375,413 25,104,793 34,740,198 45,302,003 56,810,869 69,287,735 82,753,806
Cash (Bank Indebtedness), End of Year 0 1,655,153 8,531,969 16,375,413 25,104,793 34,740,198 45,302,003 56,810,869 69,287,735 82,753,806 97,230,551
5 70 MMGPY Appendix - Indiana Financial Forecast

NREL Bioethanol Co-Location Study -- Wheatfield, IN SiteInterim Funding ScheduleMonths 1-24
Cash InterestMonth Project Fees & Other Required By Current Month Equity/Grant Subordinated Payment Loan (Equity)
Development Expenses Operations Disbursements Investment Debt (Earnings) Balance--------- --------- ---------- ----------- ----------- ----------- ----------- ------------- ------------
1 8,752,288 862,357 12,375 9,627,020 (51,951,600) 0 (105,811) (42,430,392)2 8,527,288 83,083 12,375 8,622,746 0 0 (84,519) (33,892,165)3 8,527,288 83,083 12,375 8,622,746 0 0 (63,174) (25,332,592)4 8,527,288 83,083 12,375 8,622,746 0 0 (41,775) (16,751,621)5 8,527,288 83,083 12,375 8,622,746 0 0 (54,193) (8,183,068)6 8,527,288 83,083 12,375 8,622,746 0 0 2,931 442,6107 8,777,288 83,083 12,375 8,872,746 0 0 62,102 9,377,4588 8,664,788 83,083 12,375 8,760,246 0 0 120,918 18,258,6229 8,664,788 87,483 12,375 8,764,646 0 0 180,155 27,203,423
10 8,664,788 87,483 12,375 8,764,646 0 0 239,787 36,207,85611 8,414,788 87,483 12,375 8,514,646 0 0 298,150 45,020,65212 8,577,288 87,483 12,375 8,677,146 0 0 357,985 54,055,78313 9,027,288 19,250 276,625 9,323,163 0 0 422,526 63,801,47214 8,327,288 19,250 276,625 8,623,163 0 0 482,831 72,907,46515 0 19,250 1,173,798 1,193,048 0 0 494,003 74,594,51716 0 6,600 696,313 702,913 0 0 501,983 75,799,41317 0 6,600 0 6,600 0 0 505,373 76,311,38718 0 6,600 0 6,600 0 0 508,787 76,826,77319 0 6,600 0 6,600 0 0 508,787 77,342,16020 0 6,600 0 6,600 0 0 508,787 77,857,54621 0 6,600 0 6,600 0 0 508,787 78,372,93322 0 6,600 0 6,600 0 0 508,787 78,888,31923 0 6,600 0 6,600 0 0 508,787 79,403,70624 0 6,600 0 6,600 0 0 508,787 79,919,093
----------- ------------ --------- ---------- ----------- ----------- ------------- -----------------Total 120,507,026 1,911,024 2,534,736 124,989,912 (51,951,600) 0 6,880,781 79,919,093
6 70 MMGPY Appendix - Indiana Financial Forecast

NREL Bioethanol Co-Location Study -- Wheatfield, IN SiteEngineering & Construction Cost Summary
Rolling Stock, Site Prep. & Rail Construction &Tools & Admin. Improve- Equipment & Engineering Procurement Monthly
Month Land Spare Parts Building ments Installation Fees Fees Contingency Total
1 225,000 0 200,000 0 6,605,571 632,872 505,935 582,909 8,752,2882 0 0 200,000 0 6,605,571 632,872 505,935 582,909 8,527,2883 0 0 200,000 0 6,605,571 632,872 505,935 582,909 8,527,2884 0 0 200,000 0 6,605,571 632,872 505,935 582,909 8,527,2885 0 0 200,000 0 6,605,571 632,872 505,935 582,909 8,527,2886 0 0 200,000 0 6,605,571 632,872 505,935 582,909 8,527,2887 0 0 200,000 250,000 6,605,571 632,872 505,935 582,909 8,777,2888 0 0 87,500 250,000 6,605,571 632,872 505,935 582,909 8,664,7889 0 0 87,500 250,000 6,605,571 632,872 505,935 582,909 8,664,788
10 0 0 87,500 250,000 6,605,571 632,872 505,935 582,909 8,664,78811 0 0 87,500 0 6,605,571 632,872 505,935 582,909 8,414,78812 0 250,000 0 0 6,605,571 632,872 505,935 582,909 8,577,28813 0 700,000 0 0 6,605,571 632,872 505,935 582,909 9,027,28814 0 0 0 0 6,605,571 632,872 505,935 582,909 8,327,28815 0 0 0 0 0 0 0 0 016 0 0 0 0 0 0 0 0 017 0 0 0 0 0 0 0 0 018 0 0 0 0 0 0 0 0 0
_________ _________ _________ _________ _________ _________ _________ _________ _________TOTAL 225,000 950,000 1,750,000 1,000,000 92,478,000 8,860,213 7,083,090 8,160,723 120,507,026
7 70 MMGPY Appendix - Indiana Financial Forecast

NREL Bioethanol Co-Location Study -- Wheatfield, IN SiteProduction & Sales, Months 13-23
Month 13 Month 14 Month 15 Month 16 Month 17 Month 18 Month 19 Month 20 Month 21 Month 22 Month 23Fuel Ethanol
Gallons Produced 0 0 2,916,667 4,375,000 5,833,333 5,833,333 5,833,333 5,833,333 5,833,333 5,833,333 5,833,333Gallons Sent to Inventory 0 0 800,000 800,000 0 0 0 0 0 0 0Denaturant Added 0 0 145,833 218,750 291,667 291,667 291,667 291,667 291,667 291,667 291,667Net Gallons Sold (Denatured) 0 0 2,222,500 3,753,750 6,125,000 6,125,000 6,125,000 6,125,000 6,125,000 6,125,000 6,125,000Selling Price/Gallon (FOB Plant) $1.1389 $1.1389 $1.1389 $1.1389 $1.1389 $1.1389 $1.1389 $1.1389 $1.1389 $1.1389 $1.1389State Producer Payment $0.000 $0.000 $0.000 $0.000 $0.000 $0.000 $0.000 $0.000 $0.000 $0.000 $0.000Federal Small Producer Payment $0.000 $0.000 $0.000 $0.000 $0.000 $0.000 $0.000 $0.000 $0.000 $0.000 $0.000
Total Revenue - Fuel Ethanol 0 0 2,531,205 4,275,146 6,975,763 6,975,763 6,975,763 6,975,763 6,975,763 6,975,763 6,975,763
Lignin Residue Dry Tons Produced 0 0 32,652 48,978 65,304 65,304 65,304 65,304 65,304 65,304 65,304Tons Sent to Inventory 0 0 11,195 11,195 0 0 0 0 0 0 0Net Tons Sold 0 0 21,457 37,783 65,304 65,304 65,304 65,304 65,304 65,304 65,304Selling Price/Dry Ton $6.42 $6.42 $6.42 $6.42 $6.42 $6.42 $6.42 $6.42 $6.42 $6.42 $6.42
Total Revenue - Lignin Residue 0 0 137,759 242,576 419,267 419,267 419,267 419,267 419,267 419,267 419,267
CO2
Tons Produced 0 0 7,292 10,938 14,583 14,583 14,583 14,583 14,583 14,583 14,583Tons Sent to Inventory 0 0 0 0 0 0 0 0 0 0 0Net Tons Sold 0 0 7,292 10,938 14,583 14,583 14,583 14,583 14,583 14,583 14,583Selling Price/Ton $0.00 $0.00 $0.00 $0.00 $0.00 $0.00 $0.00 $0.00 $0.00 $0.00 $0.00
Total Revenue - CO2 0 0 0 0 0 0 0 0 0 0 0
Total Revenue - All Products 0 0 2,668,964 4,517,722 7,395,029 7,395,029 7,395,029 7,395,029 7,395,029 7,395,029 7,395,029
8 70 MMGPY Appendix - Indiana Financial Forecast

NREL Bioethanol Co-Location Study -- Wheatfield, IN SiteOperating Expense, Months 13-23
Month 13 Month 14 Month 15 Month 16 Month 17 Month 18 Month 19 Month 20 Month 21 Month 22 Month 23
Plant Operating Rate 0.00% 0.00% 50.00% 75.00% 100.00% 100.00% 100.00% 100.00% 100.00% 100.00% 100.00%
BDT Biomass for Processing 0 0 32,516 48,774 65,032 65,032 65,032 65,032 65,032 65,032 65,032BDT Biomass to Inventory 0 0 22,297 22,297 0 0 0 0 0 0 0$/BDT Biomass (Delivered) $38.620 $38.620 $38.620 $38.620 $38.620 $38.620 $38.620 $38.620 $38.620 $38.620 $38.620Biomass Expense 0 0 2,116,852 2,744,732 2,511,520 2,511,520 2,511,520 2,511,520 2,511,520 2,511,520 2,511,520
Total Feedstock Expense 0 0 2,116,852 2,744,732 2,511,520 2,511,520 2,511,520 2,511,520 2,511,520 2,511,520 2,511,520
Electricity (KWH) 0 0 4,141,667 6,212,500 8,283,333 8,283,333 8,283,333 8,283,333 8,283,333 8,283,333 8,283,333$/KWH $0.0400 $0.0400 $0.0400 $0.0400 $0.0400 $0.0400 $0.0400 $0.0400 $0.0400 $0.0400 $0.0400Electricity Expense 0 0 165,667 248,500 331,333 331,333 331,333 331,333 331,333 331,333 331,333
Natural Gas (MMBTU) 0 0 119,335 179,003 238,671 238,671 238,671 238,671 238,671 238,671 238,671$/MMBTU $4.5000 $4.5000 $4.5000 $4.5000 $4.5000 $4.5000 $4.5000 $4.5000 $4.5000 $4.5000 $4.5000Natural Gas Expense 0 0 537,009 805,514 1,074,019 1,074,019 1,074,019 1,074,019 1,074,019 1,074,019 1,074,019
Makeup Water ('000 Gal.) 0 0 17,439 26,158 34,877 34,877 34,877 34,877 34,877 34,877 34,877$/1000 Gal. $0.5000 $0.5000 $0.5000 $0.5000 $0.5000 $0.5000 $0.5000 $0.5000 $0.5000 $0.5000 $0.5000Makeup Water Expense 0 0 8,719 13,079 17,439 17,439 17,439 17,439 17,439 17,439 17,439
Effluent Disposal ('000 Gal) 0 0 11,147 16,720 22,293 22,293 22,293 22,293 22,293 22,293 22,293$/1000 Gal. $1.0000 $1.0000 $1.0000 $1.0000 $1.0000 $1.0000 $1.0000 $1.0000 $1.0000 $1.0000 $1.0000Effluent Disposal Expense 0 0 11,147 16,720 22,293 22,293 22,293 22,293 22,293 22,293 22,293
Solid Waste Disposal (Tons) 0 0 2,814 4,220 5,627 5,627 5,627 5,627 5,627 5,627 5,627$/Ton $10.0000 $10.0000 $10.0000 $10.0000 $10.0000 $10.0000 $10.0000 $10.0000 $10.0000 $10.0000 $10.0000Solid Waste Disposal Expense 0 0 28,137 42,205 56,273 56,273 56,273 56,273 56,273 56,273 56,273
Labor & Benefits 266,625 266,625 266,625 266,625 266,625 266,625 266,625 266,625 266,625 266,625 266,625Maintenance Materials & Services 0 0 77,065 115,598 154,130 154,130 154,130 154,130 154,130 154,130 154,130Taxes & Insurance 0 0 0 18,750 18,750 18,750 18,750 18,750 18,750 18,750 18,750Denaturants 0 0 102,083 153,125 204,167 204,167 204,167 204,167 204,167 204,167 204,167Purchased Cellulase Enzymes 0 0 294,000 441,000 588,000 588,000 588,000 588,000 588,000 588,000 588,000Other Chemicals 0 0 225,458 338,188 450,917 450,917 450,917 450,917 450,917 450,917 450,917Office/Lab Supplies & Expenses 10,000 10,000 10,000 10,000 10,000 10,000 10,000 10,000 10,000 10,000 10,000
Total Monthly Expense (non-feedstock) 276,625 276,625 1,725,910 2,469,303 3,193,945 3,193,945 3,193,945 3,193,945 3,193,945 3,193,945 3,193,945
Total Monthly Profit (Loss) (276,625) (276,625) (1,173,798) (696,313) 1,689,565 1,689,565 1,689,565 1,689,565 1,689,565 1,689,565 1,689,565
9 70 MMGPY Appendix - Indiana Financial Forecast

NREL Bioethanol Co-Location Study -- Wheatfield, IN SiteInterim Period Fees & ExpensesMonths 1-24
Lender/ Legal/ Political/Placement Organizational Accounting Community Financial Construction Hiring & Contingency @ Monthly
Month Fees Costs Expenses Relations Consultants Consultants Training Travel 10% Total
1 779,274 $58,333 10,000 2,000 2,000 7,500 0 1,000 2,250 862,3572 0 $58,333 10,000 2,000 2,000 7,500 0 1,000 2,250 83,0833 0 $58,333 10,000 2,000 2,000 7,500 0 1,000 2,250 83,0834 0 $58,333 10,000 2,000 2,000 7,500 0 1,000 2,250 83,0835 0 $58,333 10,000 2,000 2,000 7,500 0 1,000 2,250 83,0836 0 $58,333 10,000 2,000 2,000 7,500 0 1,000 2,250 83,0837 0 $58,333 10,000 2,000 2,000 7,500 0 1,000 2,250 83,0838 0 $58,333 10,000 2,000 2,000 7,500 0 1,000 2,250 83,0839 0 $58,333 10,000 2,000 2,000 7,500 4,000 1,000 2,650 87,483
10 0 $58,333 10,000 2,000 2,000 7,500 4,000 1,000 2,650 87,48311 0 $58,333 10,000 2,000 2,000 7,500 4,000 1,000 2,650 87,48312 0 $58,333 10,000 2,000 2,000 7,500 4,000 1,000 2,650 87,48313 0 0 2,000 1,000 2,000 7,500 4,000 1,000 1,750 19,25014 0 0 2,000 1,000 2,000 7,500 4,000 1,000 1,750 19,25015 0 0 2,000 1,000 2,000 7,500 4,000 1,000 1,750 19,25016 0 0 2,000 1,000 2,000 0 0 1,000 600 6,60017 0 0 2,000 1,000 2,000 0 0 1,000 600 6,60018 0 0 2,000 1,000 2,000 0 0 1,000 600 6,60019 0 0 2,000 1,000 2,000 0 0 1,000 600 6,60020 0 0 2,000 1,000 2,000 0 0 1,000 600 6,60021 0 0 2,000 1,000 2,000 0 0 1,000 600 6,60022 0 0 2,000 1,000 2,000 0 0 1,000 600 6,60023 0 0 2,000 1,000 2,000 0 0 1,000 600 6,60024 0 0 2,000 1,000 2,000 0 0 1,000 600 6,600
_______ _______ _______ _______ _______ _______ _______ _______ _______ _______TOTAL 779,274 700,000 144,000 36,000 48,000 112,500 28,000 24,000 39,250 1,911,024
10 70 MMGPY Appendix - Indiana Financial Forecast

Interim Period Labor SummaryMonths 1-24
General Plant Environ. & Commodity Admin. Lab Shift Team Shift YardPosition Manager Manager Safety Mgr. Controller Manager Assistant Microbiologist Technician Leader Operator LaborNumber Employed (1) (1) (1) (1) (1) (5) (1) (2) (4) (20) (20)Annual Salary 110,000 80,000 60,000 65,000 60,000 24,000 45,000 28,000 44,000 30,000 25,000
______ ______ ______ ______ ______ ______ ______ ______ ______ ______ ______Month
1 9,167 0 0 0 0 0 0 0 0 0 02 9,167 0 0 0 0 0 0 0 0 0 03 9,167 0 0 0 0 0 0 0 0 0 04 9,167 0 0 0 0 0 0 0 0 0 05 9,167 0 0 0 0 0 0 0 0 0 06 9,167 0 0 0 0 0 0 0 0 0 07 9,167 0 0 0 0 0 0 0 0 0 08 9,167 0 0 0 0 0 0 0 0 0 09 9,167 0 0 0 0 0 0 0 0 0 0
10 9,167 0 0 0 0 0 0 0 0 0 011 9,167 0 0 0 0 0 0 0 0 0 012 9,167 0 0 0 0 0 0 0 0 0 013 9,167 6,667 5,000 5,417 5,000 10,000 3,750 4,667 14,667 50,000 41,66714 9,167 6,667 5,000 5,417 5,000 10,000 3,750 4,667 14,667 50,000 41,66715 9,167 6,667 5,000 5,417 5,000 10,000 3,750 4,667 14,667 50,000 41,66716 9,167 6,667 5,000 5,417 5,000 10,000 3,750 4,667 14,667 50,000 41,66717 9,167 6,667 5,000 5,417 5,000 10,000 3,750 4,667 14,667 50,000 41,66718 9,167 6,667 5,000 5,417 5,000 10,000 3,750 4,667 14,667 50,000 41,66719 9,167 6,667 5,000 5,417 5,000 10,000 3,750 4,667 14,667 50,000 41,66720 9,167 6,667 5,000 5,417 5,000 10,000 3,750 4,667 14,667 50,000 41,66721 9,167 6,667 5,000 5,417 5,000 10,000 3,750 4,667 14,667 50,000 41,66722 9,167 6,667 5,000 5,417 5,000 10,000 3,750 4,667 14,667 50,000 41,66723 9,167 6,667 5,000 5,417 5,000 10,000 3,750 4,667 14,667 50,000 41,66724 9,167 6,667 5,000 5,417 5,000 10,000 3,750 4,667 14,667 50,000 41,667
11 70 MMGPY Appendix - Indiana Financial Forecast

Interim Period Labor SummaryMonths 1-24
PositionNumber EmployedAnnual Salary
Month123456789
101112131415161718192021222324
Maintenance Boiler Maintenance Instrument Monthly Benefits TotalManager Operator Worker Welder Electrician Technician Total at
(1) (1) (8) (1) (1) (2) (71) 35.00%50,000 40,000 33,000 35,000 35,000 37,000______ ______ ______ ______ ______ ______ ______ ______ ______
0 0 0 0 0 0 9,167 3,208 12,3750 0 0 0 0 0 9,167 3,208 12,3750 0 0 0 0 0 9,167 3,208 12,3750 0 0 0 0 0 9,167 3,208 12,3750 0 0 0 0 0 9,167 3,208 12,3750 0 0 0 0 0 9,167 3,208 12,3750 0 0 0 0 0 9,167 3,208 12,3750 0 0 0 0 0 9,167 3,208 12,3750 0 0 0 0 0 9,167 3,208 12,3750 0 0 0 0 0 9,167 3,208 12,3750 0 0 0 0 0 9,167 3,208 12,3750 0 0 0 0 0 9,167 3,208 12,375
4,167 3,333 22,000 2,917 2,917 6,167 197,500 69,125 266,6254,167 3,333 22,000 2,917 2,917 6,167 197,500 69,125 266,6254,167 3,333 22,000 2,917 2,917 6,167 197,500 69,125 266,6254,167 3,333 22,000 2,917 2,917 6,167 197,500 69,125 266,6254,167 3,333 22,000 2,917 2,917 6,167 197,500 69,125 266,6254,167 3,333 22,000 2,917 2,917 6,167 197,500 69,125 266,6254,167 3,333 22,000 2,917 2,917 6,167 197,500 69,125 266,6254,167 3,333 22,000 2,917 2,917 6,167 197,500 69,125 266,6254,167 3,333 22,000 2,917 2,917 6,167 197,500 69,125 266,6254,167 3,333 22,000 2,917 2,917 6,167 197,500 69,125 266,6254,167 3,333 22,000 2,917 2,917 6,167 197,500 69,125 266,6254,167 3,333 22,000 2,917 2,917 6,167 197,500 69,125 266,625
12 70 MMGPY Appendix - Indiana Financial Forecast

NREL Bioethanol Co-Location Study -- Grand Island, NE SiteProduction Assumptions
Denatured Fuel Ethanol (gal/yr) 31,500,000Anhydrous Ethanol Production (gal/yr) 30,000,000Operating Days Per Year 350
1st year 2nd year 3rd Year 4th Year 5th Year 6th Year 7th Year 8th Year 9th Year 10th Year AnnualProduct Yields & Energy Consumption Operations Operations Operations Operations Operations Operations Operations Operations Operations Operations EscalationEthanol Yield (gal/BDT) 89.700 89.700 89.700 89.700 89.700 89.700 89.700 89.700 89.700 89.700Net Ethanol Selling Price ($/gal) $1.210 $1.234 $1.259 $1.284 $1.310 $1.336 $1.363 $1.390 $1.418 $1.446 2.00%Ethanol Sales Commission (%) 1.000% 1.000% 1.000% 1.000% 1.000% 1.000% 1.000% 1.000% 1.000% 1.000% 0.00%Ethanol Transportation ($/gal) $0.0690 $0.0704 $0.0718 $0.0732 $0.0747 $0.0762 $0.0777 $0.0793 $0.0808 $0.0825 2.00%State Producer Payment ($/gal) $0.094 $0.094 $0.094 $0.094 $0.094 $0.094 $0.094 $0.094 $0.000 $0.000Federal Small Producer Payment ($/gal) $0.035 $0.035 $0.035 $0.035 $0.035 $0.035 $0.035 $0.035 $0.035 $0.035
Delivered Biomass Price ($/BDT) $33.860 $34.199 $34.541 $34.886 $35.235 $35.587 $35.943 $36.303 $36.666 $37.032 1.00%Biomass Transportation & Storage ($/BDT) $0.000 $0.000 $0.000 $0.000 $0.000 $0.000 $0.000 $0.000 $0.000 $0.000 1.50%Biomass Usage (BDT/yr) 334,448 334,448 334,448 334,448 334,448 334,448 334,448 334,448 334,448 334,448Biomass Test Weight (lb/BDT) 2,000 2,000 2,000 2,000 2,000 2,000 2,000 2,000 2,000 2,000
Lignin Residue Yield (wet lb/BDT) 2,008.376 2,008.376 2008.376 2008.376 2008.376 2008.376 2008.376 2008.376 2008.376 2008.376Lignin Residue Price ($/wet ton) $3.181 $3.213 $3.245 $3.278 $3.310 $3.343 $3.377 $3.411 $3.445 $3.479 1.00%Lignin Residue Transportation ($/wet ton) $0.000 $0.000 $0.000 $0.000 $0.000 $0.000 $0.000 $0.000 $0.000 $0.000 2.00%Lignin Sales Commission (% of sales) 0.000% 0.000% 0.000% 0.000% 0.000% 0.000% 0.000% 0.000% 0.000% 0.000% 0.00%
Carbon Dioxide (CO2) Sold (lb/gal) 5.000 5.000 5.000 5.000 5.000 5.000 5.000 5.000 5.000 5.000CO2 Price ($/ton) $0.000 $0.000 $0.000 $0.000 $0.000 $0.000 $0.000 $0.000 $0.000 $0.000 1.00%
Electricity Use (kWh/BDT) 127.374 127.374 127.374 127.374 127.374 127.374 127.374 127.374 127.374 127.374Electricity Price ($/kWh) $0.0300 $0.0306 $0.0312 $0.0318 $0.0325 $0.0331 $0.0338 $0.0345 $0.0351 $0.0359 2.00%Natural Gas Use (MMBTU/BDT) 3.3031 3.3031 3.3031 3.3031 3.3031 3.3031 3.3031 3.3031 3.3031 3.3031Natural Gas Price ($/MMBTU) $3.0000 $3.0600 $3.1212 $3.1836 $3.2473 $3.3122 $3.3785 $3.4461 $3.5150 $3.5853 2.00%
Fresh Water Use (1000 gal/BDT) 0.536 0.536 0.536 0.536 0.536 0.536 0.536 0.536 0.536 0.536Fresh Water Price ($/1000 gal) $0.5000 $0.5050 $0.5101 $0.5152 $0.5203 $0.5255 $0.5308 $0.5361 $0.5414 $0.5468 1.00%Wastewater Effluent (1000 gal/BDT) 0.343 0.343 0.343 0.343 0.343 0.343 0.343 0.343 0.343 0.343Wastewater Effluent Price ($/1000 gal) $1.0000 $1.0100 $1.0201 $1.0303 $1.0406 $1.0510 $1.0615 $1.0721 $1.0829 $1.0937 1.00%
Solid Waste Disposal (ton/BDT) 0.087 0.087 0.087 0.087 0.087 0.087 0.087 0.087 0.087 0.087Solid Waste Disposal Price ($/Ton) $10.0000 $10.1000 $10.2010 $10.3030 $10.4060 $10.5101 $10.6152 $10.7214 $10.8286 $10.9369 1.00%
Denaturant Use (% of ethanol sold) 5.000% 5.000% 5.000% 5.000% 5.000% 5.000% 5.000% 5.000% 5.000% 5.000%Denaturant Price ($/gal) $0.7000 $0.7140 $0.7283 $0.7428 $0.7577 $0.7729 $0.7883 $0.8041 $0.8202 $0.8366 2.00%Purchased Cellulase Enzyme ($/gal etoh) $0.1008 $0.1018 $0.1028 $0.1039 $0.1049 $0.1059 $0.1070 $0.1081 $0.1092 $0.1102 1.00%Other Chemical Costs ($/gal ethanol) $0.0773 $0.0781 $0.0789 $0.0796 $0.0804 $0.0812 $0.0821 $0.0829 $0.0837 $0.0845 1.00%
Number of Employees 49 49 49 49 49 49 49 49 49 49Average Salary Including Benefits $48,214 $49,420 $50,655 $51,922 $53,220 $54,550 $55,914 $57,312 $58,744 $60,213 2.50%Maintenance Materials & Services 2.000% 2.030% 2.060% 2.091% 2.123% 2.155% 2.187% 2.220% 2.253% 2.287% 1.50%Property Tax & Insurance 2.000% 2.020% 2.040% 2.061% 2.081% 2.102% 2.123% 2.144% 2.166% 2.187% 1.00%All Other Expense Categories 2.00%
1 30 MMGPY Appendix - Nebraska Financial Forecast

NREL Bioethanol Co-Location Study -- Grand Island, NE SiteFinancial Assumptions
Ethanol Plant Engineering & Construction Costs Capital Equipment Cost & Installation $51,949,000 Engineering Expense $4,979,617 Receivable Payable Inventories Construction Management $4,005,921 (#Days) (#Days) (#Days) Contingency $4,586,489 Fuel Ethanol 10 8Total $65,521,000 $2.18 per gallon Lignin Residue 10 8
Denaturants 10 10Owner's Costs Enzymes & Chemicals 15 15
Inventory - Biomass $324,000 Biomass 10 20Inventory - Chemicals/Denaturant $129,000 Utilities 15Inventory - Ethanol & Lignin $837,000Spare Parts $500,000Startup Costs $1,000,000Land $225,000Administration Building & Furnishing $250,000Rail Improvements $500,000 Tax Incentives ($/gal) State PlantSite Development Costs $1,000,000 Producer OperatingTools and Laboratory Equipment $250,000 Year Federal State Payment Month RateOrganizational Costs $500,000 1 $0.052 $0.000 $0.094 13 0.00%Capitalized Fees and Interest $2,057,000 2 $0.052 $0.000 $0.094 14 0.00%Working Capital $524,000 3 $0.051 $0.000 $0.094 15 50.00%
Total Estimated Project Cost $73,617,000 4 $0.051 $0.000 $0.094 16 75.00%5 $0.051 $0.000 $0.094 17 100.00%
Senior Debt 6 $0.051 $0.000 $0.094 18 100.00% Principal $44,170,200 60.00% 7 $0.051 $0.000 $0.094 19 100.00% Interest Rate 8.0% fixed 8 $0.051 $0.000 $0.094 20 100.00% Lender Fees $441,702 1.000% 9 $0.051 $0.000 $0.000 21 100.00% Placement Fees $0 0.000% 10 $0.051 $0.000 $0.000 22 100.00% Amortization Period 10 years 23 100.00% Cash Sweep 0.000% State producer payment, ¢/gal $0.180 24 100.00%
Annual payment cap $2,812,500Subordinated Debt State incentive duration, years 8 Principal $0 0.00% Interest Rate 0.00% Lender Fees $0 0.000% Income Tax Rate 0.00% Placement Fees $0.00 0.000% Investment Interest 3.00% Amortization Period 0 years Operating Line Interest 10.00%
Common Equity Investment Total Equity Amount $29,446,800 40.00% Placement Fees $0 0.000% Preferred Shares $0 0.000% Common Shares $29,446,800 100.000%
Grants Amount $0 0.00%
Blenders Credit
Accounts
2 30 MMGPY Appendix - Nebraska Financial Forecast

NREL Bioethanol Co-Location Study -- Grand Island, NE SiteProforma Balance Sheet
Construction 1st Year 2nd Year 3rd Year 4th Year 5th Year 6th Year 7th Year 8th Year 9th Year 10th Year(1 Year) Operations Operations Operations Operations Operations Operations Operations Operations Operations Operations
ASSETSCurrent Assets: Cash & Cash Equivalents 0 4,111,062 10,568,644 17,362,858 24,566,060 32,187,145 40,235,117 48,719,083 57,648,247 64,219,404 71,254,435 Accounts Receivable - Trade 0 1,130,122 1,067,161 1,088,196 1,109,649 1,131,527 1,153,840 1,176,596 1,199,804 1,223,473 1,247,612 Inventories Feedstock 0 647,109 653,581 660,116 666,717 673,385 680,118 686,920 693,789 700,727 707,734 Purchased Enzymes 0 129,600 130,896 132,205 133,527 134,862 136,211 137,573 138,949 140,338 141,742 Other Chemicals 0 99,386 100,380 101,383 102,397 103,421 104,455 105,500 106,555 107,620 108,697 Denaturant 0 30,000 30,600 31,212 31,836 32,473 33,122 33,785 34,461 35,150 35,853 Finished Product Inventory 0 804,629 853,729 870,557 887,719 905,222 923,072 941,277 959,843 978,778 998,089 Total Inventories 0 1,710,724 1,769,185 1,795,474 1,822,197 1,849,363 1,876,979 1,905,054 1,933,596 1,962,613 1,992,114 Prepaid Expenses 0 0 0 0 0 0 0 0 0 0 0 Other Current Assets 0 0 0 0 0 0 0 0 0 0 0Total Current Assets 0 6,951,907 13,404,990 20,246,528 27,497,905 35,168,035 43,265,937 51,800,734 60,781,647 67,405,490 74,494,161
Land 225,000 225,000 225,000 225,000 225,000 225,000 225,000 225,000 225,000 225,000 225,000Property, Plant & Equipment Property, Plant & Equipment, at cost 58,160,880 68,021,027 68,121,027 68,221,027 68,321,027 68,421,027 68,521,027 68,621,027 68,721,027 68,821,027 68,921,027 Less Accumulated Depreciation & Amortiz. 0 1,480,790 4,524,235 7,572,680 10,626,125 13,684,570 16,748,015 19,816,460 22,889,905 25,968,350 29,051,795Net Property, Plant & Equipment 58,160,880 66,540,237 63,596,792 60,648,347 57,694,902 54,736,457 51,773,012 48,804,567 45,831,122 42,852,677 39,869,232Capitalized Fees & Interest 969,324 2,049,255 1,844,329 1,639,404 1,434,478 1,229,553 1,024,627 819,702 614,776 409,851 204,925Total Assets 59,355,204 75,766,399 79,071,111 82,759,279 86,852,286 91,359,045 96,288,576 101,650,002 107,452,545 110,893,018 114,793,318
LIABILITIES & EQUITIESCurrent Liabilities: Accounts Payable 0 440,359 457,770 462,654 467,592 472,586 477,637 482,745 487,910 493,134 498,416 Notes Payable 0 0 0 0 0 0 0 0 0 0 0 Current Maturities of Long Term Debt 0 3,169,995 3,433,104 3,718,049 4,026,646 4,360,855 4,722,804 5,114,795 5,539,320 5,999,081 2,108,369 Current maturities of Subordinated Debt 0 0 0 0 0 0 0 0 0 0 0Total Current Liabilities 0 3,610,354 3,890,873 4,180,703 4,494,238 4,833,442 5,200,441 5,597,539 6,027,230 6,492,214 2,606,786
Long Term Debt (excluding current maturities 30,677,048 39,023,023 35,589,919 31,871,870 27,845,224 23,484,369 18,761,565 13,646,770 8,107,450 2,108,369 0Subordinated Debt (excluding current maturiti 0 0 0 0 0 0 0 0 0 0 0Deferred Income Taxes 0 0 0 0 0 0 0 0 0 0Total Liabilities 30,677,048 42,633,377 39,480,793 36,052,573 32,339,462 28,317,811 23,962,006 19,244,309 14,134,680 8,600,584 2,606,786
Capital Shares & Equities Preferred Shares 0 0 0 0 0 0 0 0 0 0 0 Common Shares 29,446,800 29,446,800 29,446,800 29,446,800 29,446,800 29,446,800 29,446,800 29,446,800 29,446,800 29,446,800 29,446,800 Grants 0 0 0 0 0 0 0 0 0 0 0 Retained Earnings (768,644) 3,686,222 10,143,519 17,259,906 25,066,024 33,594,434 42,879,770 52,958,893 63,871,065 72,845,634 82,739,732Total Capital Shares & Equities 28,678,156 33,133,022 39,590,319 46,706,706 54,512,824 63,041,234 72,326,570 82,405,693 93,317,865 102,292,434 112,186,532
Total Liabilities & Equities 59,355,204 75,766,399 79,071,111 82,759,279 86,852,286 91,359,045 96,288,576 101,650,002 107,452,545 110,893,018 114,793,318
3 30 MMGPY Appendix - Nebraska Financial Forecast

NREL Bioethanol Co-Location Study -- Grand Island, NE SiteProforma Income Statements
Construction 1st Year 2nd Year 3rd Year 4th Year 5th Year 6th Year 7th Year 8th Year 9th Year 10th Year(Year 0) Operations Operations Operations Operations Operations Operations Operations Operations Operations Operations
Sales Ethanol 0 26,598,295 36,271,557 36,996,988 37,736,928 38,491,666 39,261,500 40,046,730 40,847,664 41,664,618 42,497,910 Lignin Residue 0 793,034 1,079,086 1,089,877 1,100,776 1,111,784 1,122,902 1,134,131 1,145,472 1,156,927 1,168,496 Carbon Dioxide 0 0 0 0 0 0 0 0 0 0 0State Producer Payment 0 2,208,867 2,812,500 2,812,500 2,812,500 2,812,500 2,812,500 2,812,500 2,812,500 0 0Federal Small Producer Payment 0 824,644 1,050,000 1,050,000 1,050,000 1,050,000 1,050,000 1,050,000 1,050,000 1,050,000 1,050,000Total Sales 0 30,424,840 41,213,143 41,949,365 42,700,204 43,465,950 44,246,901 45,043,360 45,855,636 43,871,544 44,716,406
Production & Operating Expenses Feedstocks 0 9,376,346 11,437,659 11,552,035 11,667,556 11,784,231 11,902,074 12,021,094 12,141,305 12,262,718 12,385,346 Purchased Cellulase Enzymes 0 2,331,000 3,054,240 3,084,782 3,115,630 3,146,787 3,178,254 3,210,037 3,242,137 3,274,559 3,307,304 Other Chemicals 0 1,787,563 2,342,190 2,365,612 2,389,268 2,413,161 2,437,292 2,461,665 2,486,282 2,511,145 2,536,256 Utilities - Natural Gas 0 2,554,630 3,380,397 3,448,005 3,516,965 3,587,305 3,659,051 3,732,232 3,806,876 3,883,014 3,960,674 Electricity 0 985,125 1,303,560 1,329,631 1,356,224 1,383,348 1,411,015 1,439,236 1,468,020 1,497,381 1,527,328 Denaturants 0 809,375 1,071,000 1,092,420 1,114,268 1,136,554 1,159,285 1,182,471 1,206,120 1,230,242 1,254,847 Makeup Water 0 69,132 90,581 91,487 92,402 93,326 94,259 95,202 96,154 97,115 98,087 Wastewater Disposal 0 88,376 115,796 116,954 118,124 119,305 120,498 121,703 122,920 124,149 125,391 Solid Waste Disposal 0 223,082 292,298 295,221 298,173 301,155 304,167 307,208 310,280 313,383 316,517 Direct Labor & Benefits 0 1,264,950 1,296,574 1,328,988 1,362,213 1,396,268 1,431,175 1,466,954 1,503,628 1,541,219 1,579,749Total Production Costs 0 19,489,579 24,384,296 24,705,137 25,030,823 25,361,439 25,697,070 26,037,802 26,383,724 26,734,925 27,091,499Gross Profit 0 10,935,262 16,828,848 17,244,229 17,669,380 18,104,511 18,549,831 19,005,559 19,471,913 17,136,619 17,624,907
Administrative & Operating Expenses Maintenance Materials & Services 0 800,880 1,054,565 1,070,383 1,086,439 1,102,736 1,119,277 1,136,066 1,153,107 1,170,403 1,187,959 Maintenance - Wages & Benefits 0 494,100 506,453 519,114 532,092 545,394 559,029 573,005 587,330 602,013 617,063 Consulting Services 114,000 24,000 24,480 24,970 25,469 25,978 26,498 27,028 27,568 28,120 28,682 Property Taxes & Insurance 233,544 1,167,718 1,348,658 1,302,092 1,254,357 1,205,434 1,155,301 1,103,939 1,051,327 997,444 942,268 Admin. Salaries, Wages & Benefits 148,500 603,450 618,536 634,000 649,850 666,096 682,748 699,817 717,312 735,245 753,626 Legal & Accounting/Community Affairs 144,000 36,000 36,720 37,454 38,203 38,968 39,747 40,542 41,353 42,180 43,023 Office/Lab Supplies & Expenses 72,000 72,000 73,440 74,909 76,407 77,935 79,494 81,084 82,705 84,359 86,047 Travel, Training & Miscellaneous 56,600 34,650 35,343 36,050 36,771 37,506 38,256 39,022 39,802 40,598 41,410
EBITD (768,644) 7,702,464 13,130,654 13,545,257 13,969,792 14,404,464 14,849,482 15,305,058 15,771,409 13,436,257 13,924,827Less: Interest - Operating Line of Credit 0 0 0 0 0 0 0 0 0 0 0 Interest - Senior Debt 0 1,766,808 3,424,987 3,175,499 2,905,304 2,612,684 2,295,775 1,952,564 1,580,866 1,178,318 742,358 Interest - Subordinated Debt 0 0 0 0 0 0 0 0 0 0 0 Depreciation & Amortization 0 1,480,790 3,248,370 3,253,370 3,258,370 3,263,370 3,268,370 3,273,370 3,278,370 3,283,370 3,288,370
Pre-Tax Income (768,644) 4,454,866 6,457,296 7,116,388 7,806,118 8,528,410 9,285,336 10,079,123 10,912,172 8,974,569 9,894,099Current Income Taxes 0 0 0 0 0 0 0 0 0 0 0
Net Earnings (Loss) for the Year (768,644) 4,454,866 6,457,296 7,116,388 7,806,118 8,528,410 9,285,336 10,079,123 10,912,172 8,974,569 9,894,099
4 30 MMGPY Appendix - Nebraska Financial Forecast

NREL Bioethanol Co-Location Study -- Grand Island, NE SiteProforma Statements of Cash Flows
Construction 1st Year 2nd Year 3rd Year 4th Year 5th Year 6th Year 7th Year 8th Year 9th Year 10th Year(1 Year) Operations Operations Operations Operations Operations Operations Operations Operations Operations Operations
Cash provided by (used in) Operating Activities Net Earnings (loss) (768,644) 4,454,866 6,457,296 7,116,388 7,806,118 8,528,410 9,285,336 10,079,123 10,912,172 8,974,569 9,894,099 Non cash charges to operations Depreciation & Amortization 0 1,480,790 3,248,370 3,253,370 3,258,370 3,263,370 3,268,370 3,273,370 3,278,370 3,283,370 3,288,370
(768,644) 5,935,656 9,705,667 10,369,758 11,064,488 11,791,781 12,553,706 13,352,494 14,190,543 12,257,939 13,182,469
Changes in non-cash working capital balances Accounts Receivable 0 1,130,122 (62,960) 21,035 21,453 21,878 22,313 22,756 23,208 23,669 24,139 Inventories 0 1,710,724 58,461 26,288 26,723 27,166 27,616 28,075 28,542 29,017 29,501 Prepaid Expenses 0 0 0 0 0 0 0 0 0 0 0 Accounts Payable 0 (440,359) (17,411) (4,884) (4,939) (4,994) (5,051) (5,108) (5,165) (5,224) (5,283) Income Taxes Payable 0 0 0 0 0 0 0 0 0 0 0
0 2,400,487 (21,910) 42,440 43,237 44,050 44,879 45,723 46,585 47,462 48,357
Investing Activities Land Purchase 225,000 0 0 0 0 0 0 0 0 0 0 Fixed Asset Purchases 58,160,880 9,860,147 100,000 100,000 100,000 100,000 100,000 100,000 100,000 100,000 100,000 Capitalized Fees & Interest 969,324 1,079,931 0 0 0 0 0 0 0 0 0
59,355,204 10,940,078 100,000 100,000 100,000 100,000 100,000 100,000 100,000 100,000 100,000
Financing Activities Long Term Debt Advances 30,677,048 13,493,152 0 0 0 0 0 0 0 0 0 Repayment of Long Term Debt 0 (1,977,182) (3,169,995) (3,433,104) (3,718,049) (4,026,646) (4,360,855) (4,722,804) (5,114,795) (5,539,320) (5,999,081) Subordinated Debt Advances 0 0 0 0 0 0 0 0 0 0 0 Repayment of Subordinated Debt 0 0 0 0 0 0 0 0 0 0 0 Equity Investment 29,446,800 0 0 0 0 0 0 0 0 0 0 Grants 0 0 0 0 0 0 0 0 0 0 0 Cash Sweep for Debt Service 0 0 0 0 0 0 0 0 0 0 0 Distributions to Shareholders 0 0 0 0 0 0 0 0 0 0 0
Net Increase (Decrease) in Cash 0 4,111,062 6,457,582 6,794,215 7,203,201 7,621,085 8,047,972 8,483,966 8,929,164 6,571,157 7,035,031Cash (Indebtedness), Beginning of Year 0 0 4,111,062 10,568,644 17,362,858 24,566,060 32,187,145 40,235,117 48,719,083 57,648,247 64,219,404
Cash (Bank Indebtedness), End of Year 0 4,111,062 10,568,644 17,362,858 24,566,060 32,187,145 40,235,117 48,719,083 57,648,247 64,219,404 71,254,435
5 30 MMGPY Appendix - Nebraska Financial Forecast

NREL Bioethanol Co-Location Study -- Grand Island, NE SiteInterim Funding ScheduleMonths 1-24
Cash InterestMonth Project Fees & Other Required By Current Month Equity/Grant Subordinated Payment Loan (Equity)
Development Expenses Operations Disbursements Investment Debt (Earnings) Balance--------- --------- ---------- ----------- ----------- ----------- ----------- ------------- ------------
1 5,047,931 508,119 12,375 5,568,424 (29,446,800) 0 (59,696) (23,938,072)2 4,822,931 66,417 12,375 4,901,722 0 0 (47,591) (19,083,940)3 4,822,931 66,417 12,375 4,901,722 0 0 (35,456) (14,217,674)4 4,822,931 66,417 12,375 4,901,722 0 0 (23,290) (9,339,242)5 4,822,931 66,417 12,375 4,901,722 0 0 (29,583) (4,467,103)6 4,822,931 66,417 12,375 4,901,722 0 0 2,897 437,5177 4,947,931 66,417 12,375 5,026,722 0 0 36,428 5,500,6678 4,867,573 66,417 12,375 4,946,365 0 0 69,647 10,516,6799 4,867,573 70,817 12,375 4,950,765 0 0 103,116 15,570,56110 4,867,573 70,817 12,375 4,950,765 0 0 136,809 20,658,13411 4,742,573 70,817 12,375 4,825,765 0 0 169,893 25,653,79212 4,930,073 70,817 12,375 5,013,265 0 0 204,447 30,871,50413 5,180,073 19,250 202,875 5,402,198 0 0 241,825 36,515,52714 4,680,073 19,250 202,875 4,902,198 0 0 276,118 41,693,84415 0 19,250 292,691 311,941 0 0 280,039 42,285,82416 0 6,600 0 6,600 0 0 281,949 42,574,37317 0 6,600 0 6,600 0 0 283,873 42,864,84618 0 6,600 0 6,600 0 0 285,810 43,157,25619 0 6,600 0 6,600 0 0 285,810 43,449,66620 0 6,600 0 6,600 0 0 285,810 43,742,07521 0 6,600 0 6,600 0 0 285,810 44,034,48522 0 6,600 0 6,600 0 0 285,810 44,326,89423 0 6,600 0 6,600 0 0 285,810 44,619,30424 0 6,600 0 6,600 0 0 285,810 44,911,714
----------- ------------ --------- ---------- ----------- ----------- ------------- -----------------Total 68,246,027 1,373,452 809,816 70,466,420 (29,446,800) 0 3,892,093 44,911,714
6 30 MMGPY Appendix - Nebraska Financial Forecast

NREL Bioethanol Co-Location Study -- Grand Island, NE SiteEngineering & Construction Cost Summary
Rolling Stock, Site Prep. & Rail Construction &Tools & Admin. Improve- Equipment & Engineering Procurement Monthly
Month Land Spare Parts Building ments Installation Fees Fees Contingency Total
1 225,000 0 142,857 0 3,710,643 355,687 286,137 327,606 5,047,9312 0 0 142,857 0 3,710,643 355,687 286,137 327,606 4,822,9313 0 0 142,857 0 3,710,643 355,687 286,137 327,606 4,822,9314 0 0 142,857 0 3,710,643 355,687 286,137 327,606 4,822,9315 0 0 142,857 0 3,710,643 355,687 286,137 327,606 4,822,9316 0 0 142,857 0 3,710,643 355,687 286,137 327,606 4,822,9317 0 0 142,857 125,000 3,710,643 355,687 286,137 327,606 4,947,9318 0 0 62,500 125,000 3,710,643 355,687 286,137 327,606 4,867,5739 0 0 62,500 125,000 3,710,643 355,687 286,137 327,606 4,867,57310 0 0 62,500 125,000 3,710,643 355,687 286,137 327,606 4,867,57311 0 0 62,500 0 3,710,643 355,687 286,137 327,606 4,742,57312 0 250,000 0 0 3,710,643 355,687 286,137 327,606 4,930,07313 0 500,000 0 0 3,710,643 355,687 286,137 327,606 5,180,07314 0 0 0 0 3,710,643 355,687 286,137 327,606 4,680,07315 0 0 0 0 0 0 0 0 016 0 0 0 0 0 0 0 0 017 0 0 0 0 0 0 0 0 018 0 0 0 0 0 0 0 0 0
_________ _________ _________ _________ _________ _________ _________ _________ _________TOTAL 225,000 750,000 1,250,000 500,000 51,949,000 4,979,617 4,005,921 4,586,489 68,246,027
7 30 MMGPY Appendix - Nebraska Financial Forecast

NREL Bioethanol Co-Location Study -- Grand Island, NE SiteProduction & Sales, Months 13-23
Month 13 Month 14 Month 15 Month 16 Month 17 Month 18 Month 19 Month 20 Month 21 Month 22 Month 23Fuel Ethanol
Gallons Produced 0 0 1,250,000 1,875,000 2,500,000 2,500,000 2,500,000 2,500,000 2,500,000 2,500,000 2,500,000Gallons Sent to Inventory 0 0 342,857 342,857 0 0 0 0 0 0 0Denaturant Added 0 0 62,500 93,750 125,000 125,000 125,000 125,000 125,000 125,000 125,000Net Gallons Sold (Denatured) 0 0 952,500 1,608,750 2,625,000 2,625,000 2,625,000 2,625,000 2,625,000 2,625,000 2,625,000Selling Price/Gallon (FOB Plant) $1.1289 $1.1289 $1.1289 $1.1289 $1.1289 $1.1289 $1.1289 $1.1289 $1.1289 $1.1289 $1.1289State Producer Payment $0.094 $0.094 $0.094 $0.094 $0.094 $0.094 $0.094 $0.094 $0.094 $0.094 $0.094Federal Small Producer Payment $0.035 $0.035 $0.035 $0.035 $0.035 $0.035 $0.035 $0.035 $0.035 $0.035 $0.035
Total Revenue - Fuel Ethanol 0 0 1,197,912 2,023,244 3,301,331 3,301,331 3,301,331 3,301,331 3,301,331 3,301,331 3,301,331
Lignin Residue Dry Tons Produced 0 0 13,994 20,991 27,987 27,987 27,987 27,987 27,987 27,987 27,987Tons Sent to Inventory 0 0 4,798 4,798 0 0 0 0 0 0 0Net Tons Sold 0 0 9,196 16,193 27,987 27,987 27,987 27,987 27,987 27,987 27,987Selling Price/Dry Ton $3.18 $3.18 $3.18 $3.18 $3.18 $3.18 $3.18 $3.18 $3.18 $3.18 $3.18
Total Revenue - Lignin Residue 0 0 29,254 51,512 89,034 89,034 89,034 89,034 89,034 89,034 89,034
CO2
Tons Produced 0 0 3,125 4,688 6,250 6,250 6,250 6,250 6,250 6,250 6,250Tons Sent to Inventory 0 0 0 0 0 0 0 0 0 0 0Net Tons Sold 0 0 3,125 4,688 6,250 6,250 6,250 6,250 6,250 6,250 6,250Selling Price/Ton $0.00 $0.00 $0.00 $0.00 $0.00 $0.00 $0.00 $0.00 $0.00 $0.00 $0.00
Total Revenue - CO2 0 0 0 0 0 0 0 0 0 0 0
Total Revenue - All Products 0 0 1,227,165 2,074,757 3,390,365 3,390,365 3,390,365 3,390,365 3,390,365 3,390,365 3,390,365
8 30 MMGPY Appendix - Nebraska Financial Forecast

NREL Bioethanol Co-Location Study -- Grand Island, NE SiteOperating Expense, Months 13-23
Month 13 Month 14 Month 15 Month 16 Month 17 Month 18 Month 19 Month 20 Month 21 Month 22 Month 23
Plant Operating Rate 0.00% 0.00% 50.00% 75.00% 100.00% 100.00% 100.00% 100.00% 100.00% 100.00% 100.00%
BDT Biomass for Processing 0 0 13,935 20,903 27,871 27,871 27,871 27,871 27,871 27,871 27,871BDT Biomass to Inventory 0 0 9,556 9,556 0 0 0 0 0 0 0$/BDT Biomass (Delivered) $33.860 $33.860 $33.860 $33.860 $33.860 $33.860 $33.860 $33.860 $33.860 $33.860 $33.860Biomass Expense 0 0 795,405 1,031,331 943,701 943,701 943,701 943,701 943,701 943,701 943,701
Total Feedstock Expense 0 0 795,405 1,031,331 943,701 943,701 943,701 943,701 943,701 943,701 943,701
Electricity (KWH) 0 0 1,775,000 2,662,500 3,550,000 3,550,000 3,550,000 3,550,000 3,550,000 3,550,000 3,550,000$/KWH $0.0300 $0.0300 $0.0300 $0.0300 $0.0300 $0.0300 $0.0300 $0.0300 $0.0300 $0.0300 $0.0300Electricity Expense 0 0 53,250 79,875 106,500 106,500 106,500 106,500 106,500 106,500 106,500
Natural Gas (MMBTU) 0 0 46,029 69,044 92,059 92,059 92,059 92,059 92,059 92,059 92,059$/MMBTU $3.0000 $3.0000 $3.0000 $3.0000 $3.0000 $3.0000 $3.0000 $3.0000 $3.0000 $3.0000 $3.0000Natural Gas Expense 0 0 138,088 207,132 276,176 276,176 276,176 276,176 276,176 276,176 276,176
Makeup Water ('000 Gal.) 0 0 7,474 11,211 14,947 14,947 14,947 14,947 14,947 14,947 14,947$/1000 Gal. $0.5000 $0.5000 $0.5000 $0.5000 $0.5000 $0.5000 $0.5000 $0.5000 $0.5000 $0.5000 $0.5000Makeup Water Expense 0 0 3,737 5,605 7,474 7,474 7,474 7,474 7,474 7,474 7,474
Effluent Disposal ('000 Gal) 0 0 4,777 7,166 9,554 9,554 9,554 9,554 9,554 9,554 9,554$/1000 Gal. $1.0000 $1.0000 $1.0000 $1.0000 $1.0000 $1.0000 $1.0000 $1.0000 $1.0000 $1.0000 $1.0000Effluent Disposal Expense 0 0 4,777 7,166 9,554 9,554 9,554 9,554 9,554 9,554 9,554
Solid Waste Disposal (Tons) 0 0 1,206 1,809 2,412 2,412 2,412 2,412 2,412 2,412 2,412$/Ton $10.0000 $10.0000 $10.0000 $10.0000 $10.0000 $10.0000 $10.0000 $10.0000 $10.0000 $10.0000 $10.0000Solid Waste Disposal Expense 0 0 12,059 18,088 24,117 24,117 24,117 24,117 24,117 24,117 24,117
Labor & Benefits 196,875 196,875 196,875 196,875 196,875 196,875 196,875 196,875 196,875 196,875 196,875Maintenance Materials & Services 0 0 43,291 64,936 86,582 86,582 86,582 86,582 86,582 86,582 86,582Taxes & Insurance 0 0 0 18,750 18,750 18,750 18,750 18,750 18,750 18,750 18,750Denaturants 0 0 43,750 65,625 87,500 87,500 87,500 87,500 87,500 87,500 87,500Purchased Cellulase Enzymes 0 0 126,000 189,000 252,000 252,000 252,000 252,000 252,000 252,000 252,000Other Chemicals 0 0 96,625 144,938 193,250 193,250 193,250 193,250 193,250 193,250 193,250Office/Lab Supplies & Expenses 6,000 6,000 6,000 6,000 6,000 6,000 6,000 6,000 6,000 6,000 6,000
Total Monthly Expense (non-feedstock) 202,875 202,875 724,451 1,003,990 1,264,778 1,264,778 1,264,778 1,264,778 1,264,778 1,264,778 1,264,778
Total Monthly Profit (Loss) (202,875) (202,875) (292,691) 39,436 1,181,886 1,181,886 1,181,886 1,181,886 1,181,886 1,181,886 1,181,886
9 30 MMGPY Appendix - Nebraska Financial Forecast

NREL Bioethanol Co-Location Study -- Grand Island, NE SiteInterim Period Fees & ExpensesMonths 1-24
Lender/ Legal/ Political/Placement Organizational Accounting Community Financial Construction Hiring & Contingency @ Monthly
Month Fees Costs Expenses Relations Consultants Consultants Training Travel 10% Total
1 441,702 $41,667 10,000 2,000 2,000 7,500 0 1,000 2,250 508,1192 0 $41,667 10,000 2,000 2,000 7,500 0 1,000 2,250 66,4173 0 $41,667 10,000 2,000 2,000 7,500 0 1,000 2,250 66,4174 0 $41,667 10,000 2,000 2,000 7,500 0 1,000 2,250 66,4175 0 $41,667 10,000 2,000 2,000 7,500 0 1,000 2,250 66,4176 0 $41,667 10,000 2,000 2,000 7,500 0 1,000 2,250 66,4177 0 $41,667 10,000 2,000 2,000 7,500 0 1,000 2,250 66,4178 0 $41,667 10,000 2,000 2,000 7,500 0 1,000 2,250 66,4179 0 $41,667 10,000 2,000 2,000 7,500 4,000 1,000 2,650 70,81710 0 $41,667 10,000 2,000 2,000 7,500 4,000 1,000 2,650 70,81711 0 $41,667 10,000 2,000 2,000 7,500 4,000 1,000 2,650 70,81712 0 $41,667 10,000 2,000 2,000 7,500 4,000 1,000 2,650 70,81713 0 0 2,000 1,000 2,000 7,500 4,000 1,000 1,750 19,25014 0 0 2,000 1,000 2,000 7,500 4,000 1,000 1,750 19,25015 0 0 2,000 1,000 2,000 7,500 4,000 1,000 1,750 19,25016 0 0 2,000 1,000 2,000 0 0 1,000 600 6,60017 0 0 2,000 1,000 2,000 0 0 1,000 600 6,60018 0 0 2,000 1,000 2,000 0 0 1,000 600 6,60019 0 0 2,000 1,000 2,000 0 0 1,000 600 6,60020 0 0 2,000 1,000 2,000 0 0 1,000 600 6,60021 0 0 2,000 1,000 2,000 0 0 1,000 600 6,60022 0 0 2,000 1,000 2,000 0 0 1,000 600 6,60023 0 0 2,000 1,000 2,000 0 0 1,000 600 6,60024 0 0 2,000 1,000 2,000 0 0 1,000 600 6,600
_______ _______ _______ _______ _______ _______ _______ _______ _______ _______TOTAL 441,702 500,000 144,000 36,000 48,000 112,500 28,000 24,000 39,250 1,373,452
10 30 MMGPY Appendix - Nebraska Financial Forecast

Interim Period Labor SummaryMonths 1-24
General Plant Environ. & Commodity Admin. Lab Shift Team Shift YardPosition Manager Manager Safety Mgr. Controller Manager Assistant Microbiologist Technician Leader Operator LaborNumber Employed (1) (1) (1) (1) (1) (3) (1) (2) (4) (12) (12)Annual Salary 110,000 80,000 60,000 65,000 60,000 24,000 45,000 28,000 44,000 30,000 25,000
______ ______ ______ ______ ______ ______ ______ ______ ______ ______ ______Month
1 9,167 0 0 0 0 0 0 0 0 0 02 9,167 0 0 0 0 0 0 0 0 0 03 9,167 0 0 0 0 0 0 0 0 0 04 9,167 0 0 0 0 0 0 0 0 0 05 9,167 0 0 0 0 0 0 0 0 0 06 9,167 0 0 0 0 0 0 0 0 0 07 9,167 0 0 0 0 0 0 0 0 0 08 9,167 0 0 0 0 0 0 0 0 0 09 9,167 0 0 0 0 0 0 0 0 0 010 9,167 0 0 0 0 0 0 0 0 0 011 9,167 0 0 0 0 0 0 0 0 0 012 9,167 0 0 0 0 0 0 0 0 0 013 9,167 6,667 5,000 5,417 5,000 6,000 3,750 4,667 14,667 30,000 25,00014 9,167 6,667 5,000 5,417 5,000 6,000 3,750 4,667 14,667 30,000 25,00015 9,167 6,667 5,000 5,417 5,000 6,000 3,750 4,667 14,667 30,000 25,00016 9,167 6,667 5,000 5,417 5,000 6,000 3,750 4,667 14,667 30,000 25,00017 9,167 6,667 5,000 5,417 5,000 6,000 3,750 4,667 14,667 30,000 25,00018 9,167 6,667 5,000 5,417 5,000 6,000 3,750 4,667 14,667 30,000 25,00019 9,167 6,667 5,000 5,417 5,000 6,000 3,750 4,667 14,667 30,000 25,00020 9,167 6,667 5,000 5,417 5,000 6,000 3,750 4,667 14,667 30,000 25,00021 9,167 6,667 5,000 5,417 5,000 6,000 3,750 4,667 14,667 30,000 25,00022 9,167 6,667 5,000 5,417 5,000 6,000 3,750 4,667 14,667 30,000 25,00023 9,167 6,667 5,000 5,417 5,000 6,000 3,750 4,667 14,667 30,000 25,00024 9,167 6,667 5,000 5,417 5,000 6,000 3,750 4,667 14,667 30,000 25,000
11 30 MMGPY Appendix - Nebraska Financial Forecast

Interim Period Labor SummaryMonths 1-24
PositionNumber EmployedAnnual Salary
Month123456789101112131415161718192021222324
Maintenance Boiler Maintenance Instrument Monthly Benefits TotalManager Operator Worker Welder Electrician Technician Total at
(1) (1) (4) (1) (1) (2) (49) 35.00%50,000 40,000 33,000 35,000 35,000 37,000______ ______ ______ ______ ______ ______ ______ ______ ______
0 0 0 0 0 0 9,167 3,208 12,3750 0 0 0 0 0 9,167 3,208 12,3750 0 0 0 0 0 9,167 3,208 12,3750 0 0 0 0 0 9,167 3,208 12,3750 0 0 0 0 0 9,167 3,208 12,3750 0 0 0 0 0 9,167 3,208 12,3750 0 0 0 0 0 9,167 3,208 12,3750 0 0 0 0 0 9,167 3,208 12,3750 0 0 0 0 0 9,167 3,208 12,3750 0 0 0 0 0 9,167 3,208 12,3750 0 0 0 0 0 9,167 3,208 12,3750 0 0 0 0 0 9,167 3,208 12,375
4,167 3,333 11,000 2,917 2,917 6,167 145,833 51,042 196,8754,167 3,333 11,000 2,917 2,917 6,167 145,833 51,042 196,8754,167 3,333 11,000 2,917 2,917 6,167 145,833 51,042 196,8754,167 3,333 11,000 2,917 2,917 6,167 145,833 51,042 196,8754,167 3,333 11,000 2,917 2,917 6,167 145,833 51,042 196,8754,167 3,333 11,000 2,917 2,917 6,167 145,833 51,042 196,8754,167 3,333 11,000 2,917 2,917 6,167 145,833 51,042 196,8754,167 3,333 11,000 2,917 2,917 6,167 145,833 51,042 196,8754,167 3,333 11,000 2,917 2,917 6,167 145,833 51,042 196,8754,167 3,333 11,000 2,917 2,917 6,167 145,833 51,042 196,8754,167 3,333 11,000 2,917 2,917 6,167 145,833 51,042 196,8754,167 3,333 11,000 2,917 2,917 6,167 145,833 51,042 196,875
12 30 MMGPY Appendix - Nebraska Financial Forecast

NREL Bioethanol Co-Location Study -- Grand Island, NE SiteProduction Assumptions
Denatured Fuel Ethanol (gal/yr) 52,500,000Anhydrous Ethanol Production (gal/yr) 50,000,000Operating Days Per Year 350
1st year 2nd year 3rd Year 4th Year 5th Year 6th Year 7th Year 8th Year 9th Year 10th Year AnnualProduct Yields & Energy Consumption Operations Operations Operations Operations Operations Operations Operations Operations Operations Operations EscalationEthanol Yield (gal/BDT) 89.700 89.700 89.700 89.700 89.700 89.700 89.700 89.700 89.700 89.700Net Ethanol Selling Price ($/gal) $1.210 $1.234 $1.259 $1.284 $1.310 $1.336 $1.363 $1.390 $1.418 $1.446 2.00%Ethanol Sales Commission (%) 1.000% 1.000% 1.000% 1.000% 1.000% 1.000% 1.000% 1.000% 1.000% 1.000% 0.00%Ethanol Transportation ($/gal) $0.0690 $0.0704 $0.0718 $0.0732 $0.0747 $0.0762 $0.0777 $0.0793 $0.0808 $0.0825 2.00%State Producer Payment ($/gal) $0.056 $0.056 $0.056 $0.056 $0.056 $0.056 $0.056 $0.056 $0.000 $0.000Federal Small Producer Payment ($/gal) $0.000 $0.000 $0.000 $0.000 $0.000 $0.000 $0.000 $0.000 $0.000 $0.000
Delivered Biomass Price ($/BDT) $33.860 $34.199 $34.541 $34.886 $35.235 $35.587 $35.943 $36.303 $36.666 $37.032 1.00%Biomass Transportation & Storage ($/BDT) $0.000 $0.000 $0.000 $0.000 $0.000 $0.000 $0.000 $0.000 $0.000 $0.000 1.50%Biomass Usage (BDT/yr) 557,414 557,414 557,414 557,414 557,414 557,414 557,414 557,414 557,414 557,414Biomass Test Weight (lb/BDT) 2,000 2,000 2,000 2,000 2,000 2,000 2,000 2,000 2,000 2,000
Lignin Residue Yield (wet lb/BDT) 2,008.376 2,008.376 2008.376 2008.376 2008.376 2008.376 2008.376 2008.376 2008.376 2008.376Lignin Residue Price ($/wet ton) $3.181 $3.213 $3.245 $3.278 $3.310 $3.343 $3.377 $3.411 $3.445 $3.479 1.00%Lignin Residue Transportation ($/wet ton) $0.000 $0.000 $0.000 $0.000 $0.000 $0.000 $0.000 $0.000 $0.000 $0.000 2.00%Lignin Sales Commission (% of sales) 0.000% 0.000% 0.000% 0.000% 0.000% 0.000% 0.000% 0.000% 0.000% 0.000% 0.00%
Carbon Dioxide (CO2) Sold (lb/gal) 5.000 5.000 5.000 5.000 5.000 5.000 5.000 5.000 5.000 5.000CO2 Price ($/ton) $0.000 $0.000 $0.000 $0.000 $0.000 $0.000 $0.000 $0.000 $0.000 $0.000 1.00%
Electricity Use (kWh/BDT) 127.374 127.374 127.374 127.374 127.374 127.374 127.374 127.374 127.374 127.374Electricity Price ($/kWh) $0.0300 $0.0306 $0.0312 $0.0318 $0.0325 $0.0331 $0.0338 $0.0345 $0.0351 $0.0359 2.00%Natural Gas Use (MMBTU/BDT) 3.3031 3.3031 3.3031 3.3031 3.3031 3.3031 3.3031 3.3031 3.3031 3.3031Natural Gas Price ($/MMBTU) $3.0000 $3.0600 $3.1212 $3.1836 $3.2473 $3.3122 $3.3785 $3.4461 $3.5150 $3.5853 2.00%
Fresh Water Use (1000 gal/BDT) 0.536 0.536 0.536 0.536 0.536 0.536 0.536 0.536 0.536 0.536Fresh Water Price ($/1000 gal) $0.5000 $0.5050 $0.5101 $0.5152 $0.5203 $0.5255 $0.5308 $0.5361 $0.5414 $0.5468 1.00%Wastewater Effluent (1000 gal/BDT) 0.343 0.343 0.343 0.343 0.343 0.343 0.343 0.343 0.343 0.343Wastewater Effluent Price ($/1000 gal) $1.0000 $1.0100 $1.0201 $1.0303 $1.0406 $1.0510 $1.0615 $1.0721 $1.0829 $1.0937 1.00%
Solid Waste Disposal (ton/BDT) 0.087 0.087 0.087 0.087 0.087 0.087 0.087 0.087 0.087 0.087Solid Waste Disposal Price ($/Ton) $10.0000 $10.1000 $10.2010 $10.3030 $10.4060 $10.5101 $10.6152 $10.7214 $10.8286 $10.9369 1.00%
Denaturant Use (% of ethanol sold) 5.000% 5.000% 5.000% 5.000% 5.000% 5.000% 5.000% 5.000% 5.000% 5.000%Denaturant Price ($/gal) $0.7000 $0.7140 $0.7283 $0.7428 $0.7577 $0.7729 $0.7883 $0.8041 $0.8202 $0.8366 2.00%Purchased Cellulase Enzyme ($/gal etoh) $0.1008 $0.1018 $0.1028 $0.1039 $0.1049 $0.1059 $0.1070 $0.1081 $0.1092 $0.1102 1.00%Other Chemical Costs ($/gal ethanol) $0.0773 $0.0781 $0.0789 $0.0796 $0.0804 $0.0812 $0.0821 $0.0829 $0.0837 $0.0845 1.00%
Number of Employees 60 60 60 60 60 60 60 60 60 60Average Salary Including Benefits $46,350 $47,509 $48,696 $49,914 $51,162 $52,441 $53,752 $55,096 $56,473 $57,885 2.50%Maintenance Materials & Services 2.000% 2.030% 2.060% 2.091% 2.123% 2.155% 2.187% 2.220% 2.253% 2.287% 1.50%Property Tax & Insurance 2.000% 2.020% 2.040% 2.061% 2.081% 2.102% 2.123% 2.144% 2.166% 2.187% 1.00%All Other Expense Categories 2.00%
1 50 MMGPY Appendix - Nebraska Financial Forecast

NREL Bioethanol Co-Location Study -- Grand Island, NE SiteFinancial Assumptions
Ethanol Plant Engineering & Construction Costs Capital Equipment Cost & Installation $73,281,000 Engineering Expense $7,022,687 Receivable Payable Inventories Construction Management $5,632,300 (#Days) (#Days) (#Days) Contingency $6,468,265 Fuel Ethanol 10 8Total $92,404,000 $1.85 per gallon Lignin Residue 10 8
Denaturants 10 10Owner's Costs Enzymes & Chemicals 15 15
Inventory - Biomass $539,000 Biomass 10 20Inventory - Chemicals/Denaturant $216,000 Utilities 15Inventory - Ethanol & Lignin $1,395,000Spare Parts $600,000Startup Costs $1,200,000Land $225,000Administration Building & Furnishing $300,000Rail Improvements $750,000 Tax Incentives ($/gal) State PlantSite Development Costs $1,200,000 Producer OperatingTools and Laboratory Equipment $250,000 Year Federal State Payment Month RateOrganizational Costs $600,000 1 $0.052 $0.000 $0.056 13 0.00%Capitalized Fees and Interest $2,865,000 2 $0.052 $0.000 $0.056 14 0.00%Working Capital $462,000 3 $0.051 $0.000 $0.056 15 50.00%
Total Estimated Project Cost $103,006,000 4 $0.051 $0.000 $0.056 16 75.00%5 $0.051 $0.000 $0.056 17 100.00%
Senior Debt 6 $0.051 $0.000 $0.056 18 100.00% Principal $61,803,600 60.00% 7 $0.051 $0.000 $0.056 19 100.00% Interest Rate 8.0% fixed 8 $0.051 $0.000 $0.056 20 100.00% Lender Fees $618,036 1.000% 9 $0.051 $0.000 $0.000 21 100.00% Placement Fees $0 0.000% 10 $0.051 $0.000 $0.000 22 100.00% Amortization Period 10 years 23 100.00% Cash Sweep 0.000% State producer payment, ¢/gal $0.180 24 100.00%
Annual payment cap $2,812,500Subordinated Debt State incentive duration, years 8 Principal $0 0.00% Interest Rate 0.00% Lender Fees $0 0.000% Income Tax Rate 0.00% Placement Fees $0.00 0.000% Investment Interest 3.00% Amortization Period 0 years Operating Line Interest 10.00%
Common Equity Investment Total Equity Amount $41,202,400 40.00% Placement Fees $0 0.000% Preferred Shares $0 0.000% Common Shares $41,202,400 100.000%
Grants
Accounts
Blenders Credit
2 50 MMGPY Appendix - Nebraska Financial Forecast

NREL Bioethanol Co-Location Study -- Grand Island, NE SiteProforma Balance Sheet
Construction 1st Year 2nd Year 3rd Year 4th Year 5th Year 6th Year 7th Year 8th Year 9th Year 10th Year(1 Year) Operations Operations Operations Operations Operations Operations Operations Operations Operations Operations
ASSETSCurrent Assets: Cash & Cash Equivalents 0 6,141,963 16,904,905 28,362,404 40,530,130 53,423,757 67,059,181 81,452,514 96,620,074 109,765,887 123,719,170 Accounts Receivable - Trade 0 1,777,807 1,778,602 1,813,660 1,849,414 1,885,879 1,923,067 1,960,993 1,999,673 2,039,121 2,079,353 Inventories Feedstock 0 1,078,516 1,089,301 1,100,194 1,111,196 1,122,308 1,133,531 1,144,866 1,156,315 1,167,878 1,179,557 Purchased Cellulase Enzymes 0 216,000 218,160 220,342 222,545 224,770 227,018 229,288 231,581 233,897 236,236 Other Chemicals 0 165,643 167,299 168,972 170,662 172,369 174,092 175,833 177,592 179,367 181,161 Denaturant 0 50,000 51,000 52,020 53,060 54,122 55,204 56,308 57,434 58,583 59,755 Finished Product Inventory 0 1,341,048 1,422,882 1,450,928 1,479,532 1,508,703 1,538,453 1,568,795 1,599,739 1,631,297 1,663,482 Total Inventories 0 2,851,206 2,948,642 2,992,456 3,036,995 3,082,271 3,128,299 3,175,091 3,222,660 3,271,022 3,320,191 Prepaid Expenses 0 0 0 0 0 0 0 0 0 0 0 Other Current Assets 0 0 0 0 0 0 0 0 0 0 0Total Current Assets 0 10,770,977 21,632,149 33,168,520 45,416,539 58,391,907 72,110,547 86,588,598 101,842,408 115,076,030 129,118,713
Land 225,000 225,000 225,000 225,000 225,000 225,000 225,000 225,000 225,000 225,000 225,000Property, Plant & Equipment Property, Plant & Equipment, at cost 81,703,645 95,504,252 95,604,252 95,704,252 95,804,252 95,904,252 96,004,252 96,104,252 96,204,252 96,304,252 96,404,252 Less Accumulated Depreciation & Amortiz. 0 2,090,999 6,366,679 10,647,359 14,933,039 19,223,719 23,519,399 27,820,079 32,125,759 36,436,439 40,752,119Net Property, Plant & Equipment 81,703,645 93,413,253 89,237,573 85,056,893 80,871,213 76,680,533 72,484,853 68,284,173 64,078,493 59,867,813 55,652,133Capitalized Fees & Interest 1,353,027 2,860,973 2,574,875 2,288,778 2,002,681 1,716,584 1,430,486 1,144,389 858,292 572,195 286,097Total Assets 83,281,672 107,270,202 113,669,597 120,739,191 128,515,432 137,014,023 146,250,886 156,242,159 167,004,192 175,741,037 185,281,943
LIABILITIES & EQUITIESCurrent Liabilities: Accounts Payable 0 733,931 762,950 771,089 779,320 787,644 796,062 804,574 813,183 821,889 830,694 Notes Payable 0 0 0 0 0 0 0 0 0 0 0 Current Maturities of Long Term Debt 0 4,435,505 4,803,649 5,202,350 5,634,142 6,101,774 6,608,218 7,156,697 7,750,699 8,394,003 2,950,062 Current maturities of Subordinated Debt 0 0 0 0 0 0 0 0 0 0 0Total Current Liabilities 0 5,169,436 5,566,599 5,973,439 6,413,463 6,889,418 7,404,279 7,961,271 8,563,882 9,215,892 3,780,756
Long Term Debt (excluding current maturities 42,966,087 54,601,593 49,797,944 44,595,594 38,961,451 32,859,678 26,251,460 19,094,764 11,344,065 2,950,062 0Subordinated Debt (excluding current maturiti 0 0 0 0 0 0 0 0 0 0 0Deferred Income Taxes 0 0 0 0 0 0 0 0 0 0 0Total Liabilities 42,966,087 59,771,029 55,364,543 50,569,033 45,374,914 39,749,095 33,655,740 27,056,035 19,907,947 12,165,954 3,780,756
Capital Shares & Equities Preferred Shares 0 0 0 0 0 0 0 0 0 0 0 Common Shares 41,202,400 41,202,400 41,202,400 41,202,400 41,202,400 41,202,400 41,202,400 41,202,400 41,202,400 41,202,400 41,202,400 Grants 0 0 0 0 0 0 0 0 0 0 0 Retained Earnings (886,815) 6,296,773 17,102,654 28,967,758 41,938,118 56,062,528 71,392,746 87,983,725 105,893,846 122,372,683 140,298,787Total Capital Shares & Equities 40,315,585 47,499,173 58,305,054 70,170,158 83,140,518 97,264,928 112,595,146 129,186,125 147,096,246 163,575,083 181,501,187
Total Liabilities & Equities 83,281,672 107,270,202 113,669,597 120,739,191 128,515,432 137,014,023 146,250,886 156,242,159 167,004,192 175,741,037 185,281,943
3 50 MMGPY Appendix - Nebraska Financial Forecast
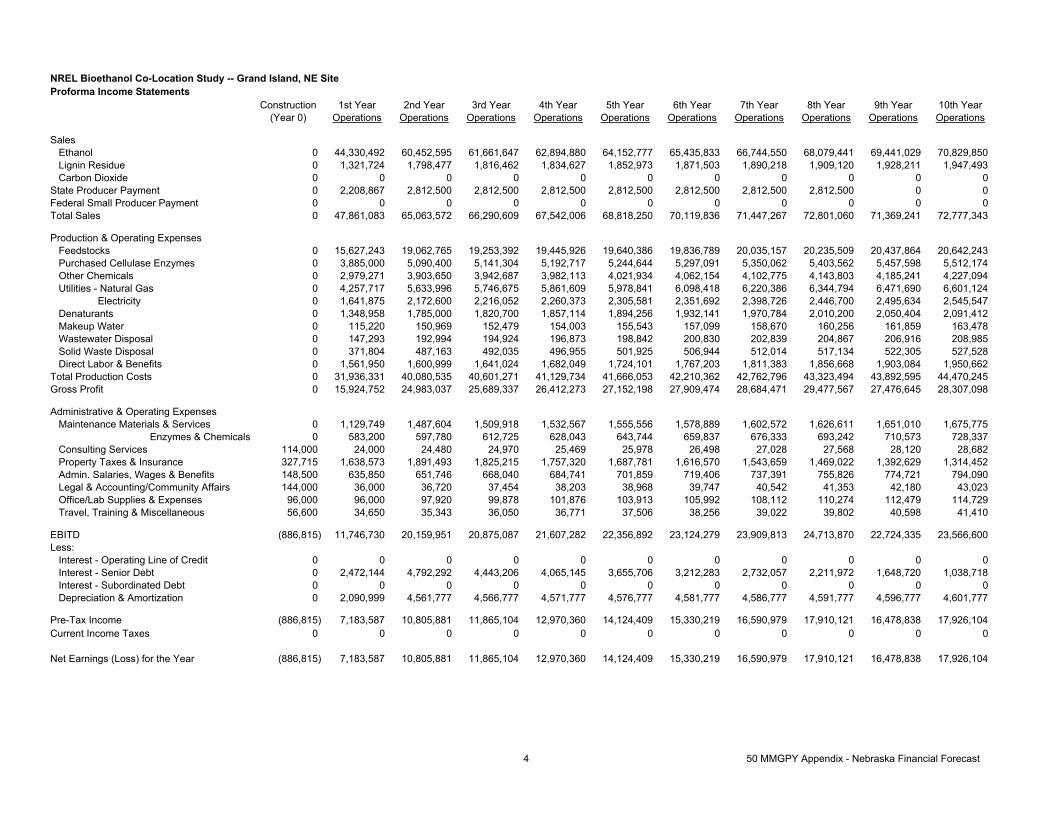
NREL Bioethanol Co-Location Study -- Grand Island, NE SiteProforma Income Statements
Construction 1st Year 2nd Year 3rd Year 4th Year 5th Year 6th Year 7th Year 8th Year 9th Year 10th Year(Year 0) Operations Operations Operations Operations Operations Operations Operations Operations Operations Operations
Sales Ethanol 0 44,330,492 60,452,595 61,661,647 62,894,880 64,152,777 65,435,833 66,744,550 68,079,441 69,441,029 70,829,850 Lignin Residue 0 1,321,724 1,798,477 1,816,462 1,834,627 1,852,973 1,871,503 1,890,218 1,909,120 1,928,211 1,947,493 Carbon Dioxide 0 0 0 0 0 0 0 0 0 0 0State Producer Payment 0 2,208,867 2,812,500 2,812,500 2,812,500 2,812,500 2,812,500 2,812,500 2,812,500 0 0Federal Small Producer Payment 0 0 0 0 0 0 0 0 0 0 0Total Sales 0 47,861,083 65,063,572 66,290,609 67,542,006 68,818,250 70,119,836 71,447,267 72,801,060 71,369,241 72,777,343
Production & Operating Expenses Feedstocks 0 15,627,243 19,062,765 19,253,392 19,445,926 19,640,386 19,836,789 20,035,157 20,235,509 20,437,864 20,642,243 Purchased Cellulase Enzymes 0 3,885,000 5,090,400 5,141,304 5,192,717 5,244,644 5,297,091 5,350,062 5,403,562 5,457,598 5,512,174 Other Chemicals 0 2,979,271 3,903,650 3,942,687 3,982,113 4,021,934 4,062,154 4,102,775 4,143,803 4,185,241 4,227,094 Utilities - Natural Gas 0 4,257,717 5,633,996 5,746,675 5,861,609 5,978,841 6,098,418 6,220,386 6,344,794 6,471,690 6,601,124 Electricity 0 1,641,875 2,172,600 2,216,052 2,260,373 2,305,581 2,351,692 2,398,726 2,446,700 2,495,634 2,545,547 Denaturants 0 1,348,958 1,785,000 1,820,700 1,857,114 1,894,256 1,932,141 1,970,784 2,010,200 2,050,404 2,091,412 Makeup Water 0 115,220 150,969 152,479 154,003 155,543 157,099 158,670 160,256 161,859 163,478 Wastewater Disposal 0 147,293 192,994 194,924 196,873 198,842 200,830 202,839 204,867 206,916 208,985 Solid Waste Disposal 0 371,804 487,163 492,035 496,955 501,925 506,944 512,014 517,134 522,305 527,528 Direct Labor & Benefits 0 1,561,950 1,600,999 1,641,024 1,682,049 1,724,101 1,767,203 1,811,383 1,856,668 1,903,084 1,950,662Total Production Costs 0 31,936,331 40,080,535 40,601,271 41,129,734 41,666,053 42,210,362 42,762,796 43,323,494 43,892,595 44,470,245Gross Profit 0 15,924,752 24,983,037 25,689,337 26,412,273 27,152,198 27,909,474 28,684,471 29,477,567 27,476,645 28,307,098
Administrative & Operating Expenses Maintenance Materials & Services 0 1,129,749 1,487,604 1,509,918 1,532,567 1,555,556 1,578,889 1,602,572 1,626,611 1,651,010 1,675,775
Enzymes & Chemicals 0 583,200 597,780 612,725 628,043 643,744 659,837 676,333 693,242 710,573 728,337 Consulting Services 114,000 24,000 24,480 24,970 25,469 25,978 26,498 27,028 27,568 28,120 28,682 Property Taxes & Insurance 327,715 1,638,573 1,891,493 1,825,215 1,757,320 1,687,781 1,616,570 1,543,659 1,469,022 1,392,629 1,314,452 Admin. Salaries, Wages & Benefits 148,500 635,850 651,746 668,040 684,741 701,859 719,406 737,391 755,826 774,721 794,090 Legal & Accounting/Community Affairs 144,000 36,000 36,720 37,454 38,203 38,968 39,747 40,542 41,353 42,180 43,023 Office/Lab Supplies & Expenses 96,000 96,000 97,920 99,878 101,876 103,913 105,992 108,112 110,274 112,479 114,729 Travel, Training & Miscellaneous 56,600 34,650 35,343 36,050 36,771 37,506 38,256 39,022 39,802 40,598 41,410
EBITD (886,815) 11,746,730 20,159,951 20,875,087 21,607,282 22,356,892 23,124,279 23,909,813 24,713,870 22,724,335 23,566,600Less: Interest - Operating Line of Credit 0 0 0 0 0 0 0 0 0 0 0 Interest - Senior Debt 0 2,472,144 4,792,292 4,443,206 4,065,145 3,655,706 3,212,283 2,732,057 2,211,972 1,648,720 1,038,718 Interest - Subordinated Debt 0 0 0 0 0 0 0 0 0 0 0 Depreciation & Amortization 0 2,090,999 4,561,777 4,566,777 4,571,777 4,576,777 4,581,777 4,586,777 4,591,777 4,596,777 4,601,777
Pre-Tax Income (886,815) 7,183,587 10,805,881 11,865,104 12,970,360 14,124,409 15,330,219 16,590,979 17,910,121 16,478,838 17,926,104Current Income Taxes 0 0 0 0 0 0 0 0 0 0 0
Net Earnings (Loss) for the Year (886,815) 7,183,587 10,805,881 11,865,104 12,970,360 14,124,409 15,330,219 16,590,979 17,910,121 16,478,838 17,926,104
4 50 MMGPY Appendix - Nebraska Financial Forecast

NREL Bioethanol Co-Location Study -- Grand Island, NE SiteProforma Statements of Cash Flows
Construction 1st Year 2nd Year 3rd Year 4th Year 5th Year 6th Year 7th Year 8th Year 9th Year 10th Year(1 Year) Operations Operations Operations Operations Operations Operations Operations Operations Operations Operations
Cash provided by (used in) Operating Activities Net Earnings (loss) (886,815) 7,183,587 10,805,881 11,865,104 12,970,360 14,124,409 15,330,219 16,590,979 17,910,121 16,478,838 17,926,104 Non cash charges to operations Depreciation & Amortization 0 2,090,999 4,561,777 4,566,777 4,571,777 4,576,777 4,581,777 4,586,777 4,591,777 4,596,777 4,601,777
(886,815) 9,274,586 15,367,659 16,431,881 17,542,137 18,701,186 19,911,996 21,177,756 22,501,898 21,075,615 22,527,881
Changes in non-cash working capital balances Accounts Receivable 0 1,777,807 795 35,058 35,754 36,464 37,188 37,927 38,680 39,448 40,232 Inventories 0 2,851,206 97,436 43,814 44,539 45,277 46,027 46,792 47,570 48,362 49,168 Prepaid Expenses 0 0 0 0 0 0 0 0 0 0 0 Accounts Payable 0 (733,931) (29,018) (8,139) (8,231) (8,324) (8,418) (8,513) (8,609) (8,706) (8,805) Income Taxes Payable 0 0 0 0 0 0 0 0 0 0 0
0 3,895,082 69,212 70,733 72,062 73,417 74,798 76,206 77,641 79,104 80,595
Investing Activities Land Purchase 225,000 0 0 0 0 0 0 0 0 0 0 Fixed Asset Purchases 81,703,645 13,800,607 100,000 100,000 100,000 100,000 100,000 100,000 100,000 100,000 100,000 Capitalized Fees & Interest 1,353,027 1,507,945 0 0 0 0 0 0 0 0 0
83,281,672 15,308,553 100,000 100,000 100,000 100,000 100,000 100,000 100,000 100,000 100,000
Financing Activities Long Term Debt Advances 42,966,087 18,837,513 0 0 0 0 0 0 0 0 0 Repayment of Long Term Debt 0 (2,766,502) (4,435,505) (4,803,649) (5,202,350) (5,634,142) (6,101,774) (6,608,218) (7,156,697) (7,750,699) (8,394,003) Subordinated Debt Advances 0 0 0 0 0 0 0 0 0 0 0 Repayment of Subordinated Debt 0 0 0 0 0 0 0 0 0 0 0 Equity Investment 41,202,400 0 0 0 0 0 0 0 0 0 0 Grants 0 0 0 0 0 0 0 0 0 0 0 Cash Sweep for Debt Service 0 0 0 0 0 0 0 0 0 0 0 Distributions to Shareholders 0 0 0 0 0 0 0 0 0 0 0
Net Increase (Decrease) in Cash 0 6,141,963 10,762,942 11,457,499 12,167,725 12,893,627 13,635,424 14,393,332 15,167,561 13,145,812 13,953,283Cash (Indebtedness), Beginning of Year 0 0 6,141,963 16,904,905 28,362,404 40,530,130 53,423,757 67,059,181 81,452,514 96,620,074 109,765,887
Cash (Bank Indebtedness), End of Year 0 6,141,963 16,904,905 28,362,404 40,530,130 53,423,757 67,059,181 81,452,514 96,620,074 109,765,887 123,719,170
5 50 MMGPY Appendix - Nebraska Financial Forecast

NREL Bioethanol Co-Location Study -- Grand Island, NE SiteInterim Funding ScheduleMonths 1-24
Cash InterestMonth Project Fees & Other Required By Current Month Equity/Grant Subordinated Payment Loan (Equity)
Development Expenses Operations Disbursements Investment Debt (Earnings) Balance--------- --------- ---------- ----------- ----------- ----------- ----------- ------------- ------------
1 6,996,732 692,786 12,375 7,701,893 (41,202,400) 0 (83,751) (33,584,258)2 6,771,732 74,750 12,375 6,858,857 0 0 (66,814) (26,792,214)3 6,771,732 74,750 12,375 6,858,857 0 0 (49,833) (19,983,190)4 6,771,732 74,750 12,375 6,858,857 0 0 (32,811) (13,157,144)5 6,771,732 74,750 12,375 6,858,857 0 0 (41,989) (6,340,275)6 6,771,732 74,750 12,375 6,858,857 0 0 3,457 522,0397 6,959,232 74,750 12,375 7,046,357 0 0 50,456 7,618,8538 6,862,804 74,750 12,375 6,949,929 0 0 97,125 14,665,9079 6,862,804 79,150 12,375 6,954,329 0 0 144,135 21,764,370
10 6,862,804 79,150 12,375 6,954,329 0 0 191,458 28,910,15711 6,675,304 79,150 12,375 6,766,829 0 0 237,847 35,914,83212 6,850,304 79,150 12,375 6,941,829 0 0 285,711 43,142,37213 7,200,304 19,250 239,750 7,459,304 0 0 337,345 50,939,02014 6,600,304 19,250 239,750 6,859,304 0 0 385,322 58,183,64615 0 19,250 493,454 512,704 0 0 391,309 59,087,65916 0 6,600 1,162 7,762 0 0 393,969 59,489,39017 0 6,600 0 6,600 0 0 396,640 59,892,63018 0 6,600 0 6,600 0 0 399,328 60,298,55919 0 6,600 0 6,600 0 0 399,328 60,704,48720 0 6,600 0 6,600 0 0 399,328 61,110,41521 0 6,600 0 6,600 0 0 399,328 61,516,34322 0 6,600 0 6,600 0 0 399,328 61,922,27123 0 6,600 0 6,600 0 0 399,328 62,328,20024 0 6,600 0 6,600 0 0 399,328 62,734,128
----------- ------------ --------- ---------- ----------- ----------- ------------- -----------------Total 95,729,252 1,649,786 1,085,491 98,501,654 (41,202,400) 0 5,434,874 62,734,128
6 50 MMGPY Appendix - Nebraska Financial Forecast

NREL Bioethanol Co-Location Study -- Grand Island, NE SiteEngineering & Construction Cost Summary
Rolling Stock, Site Prep. & Rail Construction &Tools & Admin. Improve- Equipment & Engineering Procurement Monthly
Month Land Spare Parts Building ments Installation Fees Fees Contingency Total
1 225,000 0 171,429 0 5,234,357 501,621 402,307 462,019 6,996,7322 0 0 171,429 0 5,234,357 501,621 402,307 462,019 6,771,7323 0 0 171,429 0 5,234,357 501,621 402,307 462,019 6,771,7324 0 0 171,429 0 5,234,357 501,621 402,307 462,019 6,771,7325 0 0 171,429 0 5,234,357 501,621 402,307 462,019 6,771,7326 0 0 171,429 0 5,234,357 501,621 402,307 462,019 6,771,7327 0 0 171,429 187,500 5,234,357 501,621 402,307 462,019 6,959,2328 0 0 75,000 187,500 5,234,357 501,621 402,307 462,019 6,862,8049 0 0 75,000 187,500 5,234,357 501,621 402,307 462,019 6,862,804
10 0 0 75,000 187,500 5,234,357 501,621 402,307 462,019 6,862,80411 0 0 75,000 0 5,234,357 501,621 402,307 462,019 6,675,30412 0 250,000 0 0 5,234,357 501,621 402,307 462,019 6,850,30413 0 600,000 0 0 5,234,357 501,621 402,307 462,019 7,200,30414 0 0 0 0 5,234,357 501,621 402,307 462,019 6,600,30415 0 0 0 0 0 0 0 0 016 0 0 0 0 0 0 0 0 017 0 0 0 0 0 0 0 0 018 0 0 0 0 0 0 0 0 0
_________ _________ _________ _________ _________ _________ _________ _________ _________TOTAL 225,000 850,000 1,500,000 750,000 73,281,000 7,022,687 5,632,300 6,468,265 95,729,252
7 50 MMGPY Appendix - Nebraska Financial Forecast

NREL Bioethanol Co-Location Study -- Grand Island, NE SiteProduction & Sales, Months 13-23
Month 13 Month 14 Month 15 Month 16 Month 17 Month 18 Month 19 Month 20 Month 21 Month 22 Month 23Fuel Ethanol
Gallons Produced 0 0 2,083,333 3,125,000 4,166,667 4,166,667 4,166,667 4,166,667 4,166,667 4,166,667 4,166,667Gallons Sent to Inventory 0 0 571,429 571,429 0 0 0 0 0 0 0Denaturant Added 0 0 104,167 156,250 208,333 208,333 208,333 208,333 208,333 208,333 208,333Net Gallons Sold (Denatured) 0 0 1,587,500 2,681,250 4,375,000 4,375,000 4,375,000 4,375,000 4,375,000 4,375,000 4,375,000Selling Price/Gallon (FOB Plant) $1.1289 $1.1289 $1.1289 $1.1289 $1.1289 $1.1289 $1.1289 $1.1289 $1.1289 $1.1289 $1.1289State Producer Payment $0.056 $0.056 $0.056 $0.056 $0.056 $0.056 $0.056 $0.056 $0.056 $0.056 $0.056Federal Small Producer Payment $0.000 $0.000 $0.000 $0.000 $0.000 $0.000 $0.000 $0.000 $0.000 $0.000 $0.000
Total Revenue - Fuel Ethanol 0 0 1,881,426 3,177,683 5,185,031 5,185,031 5,185,031 5,185,031 5,185,031 5,185,031 5,185,031
Lignin Residue Dry Tons Produced 0 0 23,323 34,984 46,646 46,646 46,646 46,646 46,646 46,646 46,646Tons Sent to Inventory 0 0 7,996 7,996 0 0 0 0 0 0 0Net Tons Sold 0 0 15,326 26,988 46,646 46,646 46,646 46,646 46,646 46,646 46,646Selling Price/Dry Ton $3.18 $3.18 $3.18 $3.18 $3.18 $3.18 $3.18 $3.18 $3.18 $3.18 $3.18
Total Revenue - Lignin Residue 0 0 48,756 85,854 148,389 148,389 148,389 148,389 148,389 148,389 148,389
CO2
Tons Produced 0 0 5,208 7,813 10,417 10,417 10,417 10,417 10,417 10,417 10,417Tons Sent to Inventory 0 0 0 0 0 0 0 0 0 0 0Net Tons Sold 0 0 5,208 7,813 10,417 10,417 10,417 10,417 10,417 10,417 10,417Selling Price/Ton $0.00 $0.00 $0.00 $0.00 $0.00 $0.00 $0.00 $0.00 $0.00 $0.00 $0.00
Total Revenue - CO2 0 0 0 0 0 0 0 0 0 0 0
Total Revenue - All Products 0 0 1,930,182 3,263,537 5,333,420 5,333,420 5,333,420 5,333,420 5,333,420 5,333,420 5,333,420
8 50 MMGPY Appendix - Nebraska Financial Forecast

NREL Bioethanol Co-Location Study -- Grand Island, NE SiteOperating Expense, Months 13-23
Month 13 Month 14 Month 15 Month 16 Month 17 Month 18 Month 19 Month 20 Month 21 Month 22 Month 23
Plant Operating Rate 0.00% 0.00% 50.00% 75.00% 100.00% 100.00% 100.00% 100.00% 100.00% 100.00% 100.00%
BDT Biomass for Processing 0 0 23,226 34,838 46,451 46,451 46,451 46,451 46,451 46,451 46,451BDT Biomass to Inventory 0 0 15,926 15,926 0 0 0 0 0 0 0$/BDT Biomass (Delivered) $33.860 $33.860 $33.860 $33.860 $33.860 $33.860 $33.860 $33.860 $33.860 $33.860 $33.860Biomass Expense 0 0 1,325,676 1,718,884 1,572,835 1,572,835 1,572,835 1,572,835 1,572,835 1,572,835 1,572,835
Total Feedstock Expense 0 0 1,325,676 1,718,884 1,572,835 1,572,835 1,572,835 1,572,835 1,572,835 1,572,835 1,572,835
Electricity (KWH) 0 0 2,958,333 4,437,500 5,916,667 5,916,667 5,916,667 5,916,667 5,916,667 5,916,667 5,916,667$/KWH $0.0300 $0.0300 $0.0300 $0.0300 $0.0300 $0.0300 $0.0300 $0.0300 $0.0300 $0.0300 $0.0300Electricity Expense 0 0 88,750 133,125 177,500 177,500 177,500 177,500 177,500 177,500 177,500
Natural Gas (MMBTU) 0 0 76,716 115,073 153,431 153,431 153,431 153,431 153,431 153,431 153,431$/MMBTU $3.0000 $3.0000 $3.0000 $3.0000 $3.0000 $3.0000 $3.0000 $3.0000 $3.0000 $3.0000 $3.0000Natural Gas Expense 0 0 230,147 345,220 460,294 460,294 460,294 460,294 460,294 460,294 460,294
Makeup Water ('000 Gal.) 0 0 12,456 18,684 24,912 24,912 24,912 24,912 24,912 24,912 24,912$/1000 Gal. $0.5000 $0.5000 $0.5000 $0.5000 $0.5000 $0.5000 $0.5000 $0.5000 $0.5000 $0.5000 $0.5000Makeup Water Expense 0 0 6,228 9,342 12,456 12,456 12,456 12,456 12,456 12,456 12,456
Effluent Disposal ('000 Gal) 0 0 7,962 11,943 15,924 15,924 15,924 15,924 15,924 15,924 15,924$/1000 Gal. $1.0000 $1.0000 $1.0000 $1.0000 $1.0000 $1.0000 $1.0000 $1.0000 $1.0000 $1.0000 $1.0000Effluent Disposal Expense 0 0 7,962 11,943 15,924 15,924 15,924 15,924 15,924 15,924 15,924
Solid Waste Disposal (Tons) 0 0 2,010 3,015 4,020 4,020 4,020 4,020 4,020 4,020 4,020$/Ton $10.0000 $10.0000 $10.0000 $10.0000 $10.0000 $10.0000 $10.0000 $10.0000 $10.0000 $10.0000 $10.0000Solid Waste Disposal Expense 0 0 20,098 30,146 40,195 40,195 40,195 40,195 40,195 40,195 40,195
Labor & Benefits 231,750 231,750 231,750 231,750 231,750 231,750 231,750 231,750 231,750 231,750 231,750Maintenance Materials & Services 0 0 61,068 91,601 122,135 122,135 122,135 122,135 122,135 122,135 122,135Taxes & Insurance 0 0 0 18,750 18,750 18,750 18,750 18,750 18,750 18,750 18,750Denaturants 0 0 72,917 109,375 145,833 145,833 145,833 145,833 145,833 145,833 145,833Purchased Cellulase Enzymes 0 0 210,000 315,000 420,000 420,000 420,000 420,000 420,000 420,000 420,000Other Chemicals 0 0 161,042 241,563 322,083 322,083 322,083 322,083 322,083 322,083 322,083Office/Lab Supplies & Expenses 8,000 8,000 8,000 8,000 8,000 8,000 8,000 8,000 8,000 8,000 8,000
Total Monthly Expense (non-feedstock) 239,750 239,750 1,097,960 1,545,815 1,974,920 1,974,920 1,974,920 1,974,920 1,974,920 1,974,920 1,974,920
Total Monthly Profit (Loss) (239,750) (239,750) (493,454) (1,162) 1,785,665 1,785,665 1,785,665 1,785,665 1,785,665 1,785,665 1,785,665
9 50 MMGPY Appendix - Nebraska Financial Forecast

NREL Bioethanol Co-Location Study -- Grand Island, NE SiteInterim Period Fees & ExpensesMonths 1-24
Lender/ Legal/ Political/Placement Organizational Accounting Community Financial Construction Hiring & Contingency @ Monthly
Month Fees Costs Expenses Relations Consultants Consultants Training Travel 10% Total
1 618,036 $50,000 10,000 2,000 2,000 7,500 0 1,000 2,250 692,7862 0 $50,000 10,000 2,000 2,000 7,500 0 1,000 2,250 74,7503 0 $50,000 10,000 2,000 2,000 7,500 0 1,000 2,250 74,7504 0 $50,000 10,000 2,000 2,000 7,500 0 1,000 2,250 74,7505 0 $50,000 10,000 2,000 2,000 7,500 0 1,000 2,250 74,7506 0 $50,000 10,000 2,000 2,000 7,500 0 1,000 2,250 74,7507 0 $50,000 10,000 2,000 2,000 7,500 0 1,000 2,250 74,7508 0 $50,000 10,000 2,000 2,000 7,500 0 1,000 2,250 74,7509 0 $50,000 10,000 2,000 2,000 7,500 4,000 1,000 2,650 79,150
10 0 $50,000 10,000 2,000 2,000 7,500 4,000 1,000 2,650 79,15011 0 $50,000 10,000 2,000 2,000 7,500 4,000 1,000 2,650 79,15012 0 $50,000 10,000 2,000 2,000 7,500 4,000 1,000 2,650 79,15013 0 0 2,000 1,000 2,000 7,500 4,000 1,000 1,750 19,25014 0 0 2,000 1,000 2,000 7,500 4,000 1,000 1,750 19,25015 0 0 2,000 1,000 2,000 7,500 4,000 1,000 1,750 19,25016 0 0 2,000 1,000 2,000 0 0 1,000 600 6,60017 0 0 2,000 1,000 2,000 0 0 1,000 600 6,60018 0 0 2,000 1,000 2,000 0 0 1,000 600 6,60019 0 0 2,000 1,000 2,000 0 0 1,000 600 6,60020 0 0 2,000 1,000 2,000 0 0 1,000 600 6,60021 0 0 2,000 1,000 2,000 0 0 1,000 600 6,60022 0 0 2,000 1,000 2,000 0 0 1,000 600 6,60023 0 0 2,000 1,000 2,000 0 0 1,000 600 6,60024 0 0 2,000 1,000 2,000 0 0 1,000 600 6,600
_______ _______ _______ _______ _______ _______ _______ _______ _______ _______TOTAL 618,036 600,000 144,000 36,000 48,000 112,500 28,000 24,000 39,250 1,649,786
10 50 MMGPY Appendix - Nebraska Financial Forecast

Interim Period Labor SummaryMonths 1-24
General Plant Environ. & Commodity Admin. Lab Shift Team Shift YardPosition Manager Manager Safety Mgr. Controller Manager Assistant Microbiologist Technician Leader Operator LaborNumber Employed (1) (1) (1) (1) (1) (4) (1) (2) (4) (16) (16)Annual Salary 110,000 80,000 60,000 65,000 60,000 24,000 45,000 28,000 44,000 30,000 25,000
______ ______ ______ ______ ______ ______ ______ ______ ______ ______ ______Month
1 9,167 0 0 0 0 0 0 0 0 0 02 9,167 0 0 0 0 0 0 0 0 0 03 9,167 0 0 0 0 0 0 0 0 0 04 9,167 0 0 0 0 0 0 0 0 0 05 9,167 0 0 0 0 0 0 0 0 0 06 9,167 0 0 0 0 0 0 0 0 0 07 9,167 0 0 0 0 0 0 0 0 0 08 9,167 0 0 0 0 0 0 0 0 0 09 9,167 0 0 0 0 0 0 0 0 0 0
10 9,167 0 0 0 0 0 0 0 0 0 011 9,167 0 0 0 0 0 0 0 0 0 012 9,167 0 0 0 0 0 0 0 0 0 013 9,167 6,667 5,000 5,417 5,000 8,000 3,750 4,667 14,667 40,000 33,33314 9,167 6,667 5,000 5,417 5,000 8,000 3,750 4,667 14,667 40,000 33,33315 9,167 6,667 5,000 5,417 5,000 8,000 3,750 4,667 14,667 40,000 33,33316 9,167 6,667 5,000 5,417 5,000 8,000 3,750 4,667 14,667 40,000 33,33317 9,167 6,667 5,000 5,417 5,000 8,000 3,750 4,667 14,667 40,000 33,33318 9,167 6,667 5,000 5,417 5,000 8,000 3,750 4,667 14,667 40,000 33,33319 9,167 6,667 5,000 5,417 5,000 8,000 3,750 4,667 14,667 40,000 33,33320 9,167 6,667 5,000 5,417 5,000 8,000 3,750 4,667 14,667 40,000 33,33321 9,167 6,667 5,000 5,417 5,000 8,000 3,750 4,667 14,667 40,000 33,33322 9,167 6,667 5,000 5,417 5,000 8,000 3,750 4,667 14,667 40,000 33,33323 9,167 6,667 5,000 5,417 5,000 8,000 3,750 4,667 14,667 40,000 33,33324 9,167 6,667 5,000 5,417 5,000 8,000 3,750 4,667 14,667 40,000 33,333
11 50 MMGPY Appendix - Nebraska Financial Forecast

Interim Period Labor SummaryMonths 1-24
PositionNumber EmployedAnnual Salary
Month123456789
101112131415161718192021222324
Maintenance Boiler Maintenance Instrument Monthly Benefits TotalManager Operator Worker Welder Electrician Technician Total at
(1) (1) (6) (1) (1) (2) (60) 35.00%50,000 40,000 33,000 35,000 35,000 37,000______ ______ ______ ______ ______ ______ ______ ______ ______
0 0 0 0 0 0 9,167 3,208 12,3750 0 0 0 0 0 9,167 3,208 12,3750 0 0 0 0 0 9,167 3,208 12,3750 0 0 0 0 0 9,167 3,208 12,3750 0 0 0 0 0 9,167 3,208 12,3750 0 0 0 0 0 9,167 3,208 12,3750 0 0 0 0 0 9,167 3,208 12,3750 0 0 0 0 0 9,167 3,208 12,3750 0 0 0 0 0 9,167 3,208 12,3750 0 0 0 0 0 9,167 3,208 12,3750 0 0 0 0 0 9,167 3,208 12,3750 0 0 0 0 0 9,167 3,208 12,375
4,167 3,333 16,500 2,917 2,917 6,167 171,667 60,083 231,7504,167 3,333 16,500 2,917 2,917 6,167 171,667 60,083 231,7504,167 3,333 16,500 2,917 2,917 6,167 171,667 60,083 231,7504,167 3,333 16,500 2,917 2,917 6,167 171,667 60,083 231,7504,167 3,333 16,500 2,917 2,917 6,167 171,667 60,083 231,7504,167 3,333 16,500 2,917 2,917 6,167 171,667 60,083 231,7504,167 3,333 16,500 2,917 2,917 6,167 171,667 60,083 231,7504,167 3,333 16,500 2,917 2,917 6,167 171,667 60,083 231,7504,167 3,333 16,500 2,917 2,917 6,167 171,667 60,083 231,7504,167 3,333 16,500 2,917 2,917 6,167 171,667 60,083 231,7504,167 3,333 16,500 2,917 2,917 6,167 171,667 60,083 231,7504,167 3,333 16,500 2,917 2,917 6,167 171,667 60,083 231,750
12 50 MMGPY Appendix - Nebraska Financial Forecast

NREL Bioethanol Co-Location Study -- Grand Island, NE SiteProduction Assumptions
Denatured Fuel Ethanol (gal/yr) 73,500,000Anhydrous Ethanol Production (gal/yr) 70,000,000Operating Days Per Year 350
1st year 2nd year 3rd Year 4th Year 5th Year 6th Year 7th Year 8th Year 9th Year 10th Year AnnualProduct Yields & Energy Consumption Operations Operations Operations Operations Operations Operations Operations Operations Operations Operations EscalationEthanol Yield (gal/BDT) 89.700 89.700 89.700 89.700 89.700 89.700 89.700 89.700 89.700 89.700Net Ethanol Selling Price ($/gal) $1.210 $1.234 $1.259 $1.284 $1.310 $1.336 $1.363 $1.390 $1.418 $1.446 2.00%Ethanol Sales Commission (%) 1.000% 1.000% 1.000% 1.000% 1.000% 1.000% 1.000% 1.000% 1.000% 1.000% 0.00%Ethanol Transportation ($/gal) $0.0690 $0.0704 $0.0718 $0.0732 $0.0747 $0.0762 $0.0777 $0.0793 $0.0808 $0.0825 2.00%State Producer Payment ($/gal) $0.040 $0.040 $0.040 $0.040 $0.040 $0.040 $0.040 $0.040 $0.000 $0.000Federal Small Producer Payment ($/gal) $0.000 $0.000 $0.000 $0.000 $0.000 $0.000 $0.000 $0.000 $0.000 $0.000
Delivered Biomass Price ($/BDT) $33.860 $34.199 $34.541 $34.886 $35.235 $35.587 $35.943 $36.303 $36.666 $37.032 1.00%Biomass Transportation & Storage ($/BDT) $0.000 $0.000 $0.000 $0.000 $0.000 $0.000 $0.000 $0.000 $0.000 $0.000 1.50%Biomass Usage (BDT/yr) 780,379 780,379 780,379 780,379 780,379 780,379 780,379 780,379 780,379 780,379Biomass Test Weight (lb/BDT) 2,000 2,000 2,000 2,000 2,000 2,000 2,000 2,000 2,000 2,000
Lignin Residue Yield (wet lb/BDT) 2,008.376 2,008.376 2008.376 2008.376 2008.376 2008.376 2008.376 2008.376 2008.376 2008.376Lignin Residue Price ($/wet ton) $3.181 $3.213 $3.245 $3.278 $3.310 $3.343 $3.377 $3.411 $3.445 $3.479 1.00%Lignin Residue Transportation ($/wet ton) $0.000 $0.000 $0.000 $0.000 $0.000 $0.000 $0.000 $0.000 $0.000 $0.000 2.00%Lignin Sales Commission (% of sales) 0.000% 0.000% 0.000% 0.000% 0.000% 0.000% 0.000% 0.000% 0.000% 0.000% 0.00%
Carbon Dioxide (CO2) Sold (lb/gal) 5.000 5.000 5.000 5.000 5.000 5.000 5.000 5.000 5.000 5.000CO2 Price ($/ton) $0.000 $0.000 $0.000 $0.000 $0.000 $0.000 $0.000 $0.000 $0.000 $0.000 1.00%
Electricity Use (kWh/BDT) 127.374 127.374 127.374 127.374 127.374 127.374 127.374 127.374 127.374 127.374Electricity Price ($/kWh) $0.0300 $0.0306 $0.0312 $0.0318 $0.0325 $0.0331 $0.0338 $0.0345 $0.0351 $0.0359 2.00%Natural Gas Use (MMBTU/BDT) 3.3031 3.3031 3.3031 3.3031 3.3031 3.3031 3.3031 3.3031 3.3031 3.3031Natural Gas Price ($/MMBTU) $3.0000 $3.0600 $3.1212 $3.1836 $3.2473 $3.3122 $3.3785 $3.4461 $3.5150 $3.5853 2.00%
Fresh Water Use (1000 gal/BDT) 0.536 0.536 0.536 0.536 0.536 0.536 0.536 0.536 0.536 0.536Fresh Water Price ($/1000 gal) $0.5000 $0.5050 $0.5101 $0.5152 $0.5203 $0.5255 $0.5308 $0.5361 $0.5414 $0.5468 1.00%Wastewater Effluent (1000 gal/BDT) 0.343 0.343 0.343 0.343 0.343 0.343 0.343 0.343 0.343 0.343Wastewater Effluent Price ($/1000 gal) $1.0000 $1.0100 $1.0201 $1.0303 $1.0406 $1.0510 $1.0615 $1.0721 $1.0829 $1.0937 1.00%
Solid Waste Disposal (ton/BDT) 0.087 0.087 0.087 0.087 0.087 0.087 0.087 0.087 0.087 0.087Solid Waste Disposal Price ($/Ton) $10.0000 $10.1000 $10.2010 $10.3030 $10.4060 $10.5101 $10.6152 $10.7214 $10.8286 $10.9369 1.00%
Denaturant Use (% of ethanol sold) 5.000% 5.000% 5.000% 5.000% 5.000% 5.000% 5.000% 5.000% 5.000% 5.000%Denaturant Price ($/gal) $0.7000 $0.7140 $0.7283 $0.7428 $0.7577 $0.7729 $0.7883 $0.8041 $0.8202 $0.8366 2.00%Purchased Cellulase Enzyme ($/gal etoh) $0.1008 $0.1018 $0.1028 $0.1039 $0.1049 $0.1059 $0.1070 $0.1081 $0.1092 $0.1102 1.00%Other Chemical Costs ($/gal ethanol) $0.0773 $0.0781 $0.0789 $0.0796 $0.0804 $0.0812 $0.0821 $0.0829 $0.0837 $0.0845 1.00%
Number of Employees 71 71 71 71 71 71 71 71 71 71Average Salary Including Benefits $45,063 $46,190 $47,345 $48,528 $49,742 $50,985 $52,260 $53,566 $54,905 $56,278 2.50%Maintenance Materials & Services 2.000% 2.030% 2.060% 2.091% 2.123% 2.155% 2.187% 2.220% 2.253% 2.287% 1.50%Property Tax & Insurance 2.000% 2.020% 2.040% 2.061% 2.081% 2.102% 2.123% 2.144% 2.166% 2.187% 1.00%All Other Expense Categories 2.00%
1 70 MMGPY Appendix - Nebraska Financial Forecast

NREL Bioethanol Co-Location Study -- Grand Island, NE SiteFinancial Assumptions
Ethanol Plant Engineering & Construction Costs Capital Equipment Cost & Installation $92,478,000 Engineering Expense $8,860,213 Receivable Payable Inventories Construction Management $7,083,090 (#Days) (#Days) (#Days) Contingency $8,160,723 Fuel Ethanol 10 8Total $116,582,000 $1.67 per gallon Lignin Residue 10 8
Denaturants 10 10Owner's Costs Enzymes & Chemicals 15 15
Inventory - Biomass $755,000 Biomass 10 20Inventory - Chemicals/Denaturant $302,000 Utilities 15Inventory - Ethanol & Lignin $1,954,000Spare Parts $700,000Startup Costs $1,400,000Land $225,000Administration Building & Furnishing $350,000Rail Improvements $1,000,000 Tax Incentives ($/gal) State PlantSite Development Costs $1,400,000 Producer OperatingTools and Laboratory Equipment $250,000 Year Federal State Payment Month RateOrganizational Costs $700,000 1 $0.052 $0.000 $0.040 13 0.00%Capitalized Fees and Interest $3,591,000 2 $0.052 $0.000 $0.040 14 0.00%Working Capital $490,000 3 $0.051 $0.000 $0.040 15 50.00%
Total Estimated Project Cost $129,699,000 4 $0.051 $0.000 $0.040 16 75.00%5 $0.051 $0.000 $0.040 17 100.00%
Senior Debt 6 $0.051 $0.000 $0.040 18 100.00% Principal $77,819,400 60.00% 7 $0.051 $0.000 $0.040 19 100.00% Interest Rate 8.0% fixed 8 $0.051 $0.000 $0.040 20 100.00% Lender Fees $778,194 1.000% 9 $0.051 $0.000 $0.000 21 100.00% Placement Fees $0 0.000% 10 $0.051 $0.000 $0.000 22 100.00% Amortization Period 10 years 23 100.00% Cash Sweep 0.000% State producer payment, ¢/gal $0.180 24 100.00%
Annual payment cap $2,812,500Subordinated Debt State incentive duration, years 8 Principal $0 0.00% Interest Rate 0.00% Lender Fees $0 0.000% Income Tax Rate 0.00% Placement Fees $0.00 0.000% Investment Interest 3.00% Amortization Period 0 years Operating Line Interest 10.00%
Common Equity Investment Total Equity Amount $51,879,600 40.00% Placement Fees $0 0.000% Preferred Shares $0 0.000% Common Shares $51,879,600 100.000%
Grants Amount $0 0.00%
Accounts
Blenders Credit
2 70 MMGPY Appendix - Nebraska Financial Forecast

NREL Bioethanol Co-Location Study -- Grand Island, NE SiteProforma Balance Sheet
Construction 1st Year 2nd Year 3rd Year 4th Year 5th Year 6th Year 7th Year 8th Year 9th Year 10th Year(1 Year) Operations Operations Operations Operations Operations Operations Operations Operations Operations Operations
ASSETSCurrent Assets: Cash & Cash Equivalents 0 9,287,481 25,774,700 43,282,975 61,801,922 81,354,006 101,962,027 123,649,115 146,438,728 167,542,141 189,795,940 Accounts Receivable - Trade 0 2,456,117 2,490,043 2,539,124 2,589,180 2,640,230 2,692,293 2,745,391 2,799,542 2,854,770 2,911,094 Inventories Feedstock 0 1,509,922 1,525,021 1,540,271 1,555,674 1,571,231 1,586,943 1,602,813 1,618,841 1,635,029 1,651,379 Purchased Cellulase Enzymes 0 302,400 305,424 308,478 311,563 314,679 317,825 321,004 324,214 327,456 330,730 Other Chemicals 0 231,900 234,219 236,561 238,927 241,316 243,729 246,167 248,628 251,114 253,626 Denaturant 0 70,000 71,400 72,828 74,285 75,770 77,286 78,831 80,408 82,016 83,656 Finished Product Inventory 0 1,877,467 1,992,034 2,031,299 2,071,344 2,112,184 2,153,835 2,196,313 2,239,634 2,283,816 2,328,875 Total Inventories 0 3,991,689 4,128,098 4,189,438 4,251,793 4,315,180 4,379,618 4,445,127 4,511,725 4,579,431 4,648,267 Prepaid Expenses 0 0 0 0 0 0 0 0 0 0 0 Other Current Assets 0 0 0 0 0 0 0 0 0 0 0Total Current Assets 0 15,735,287 32,392,841 50,011,538 68,642,895 88,309,416 109,033,938 130,839,632 153,749,995 174,976,342 197,355,301
Land 225,000 225,000 225,000 225,000 225,000 225,000 225,000 225,000 225,000 225,000 225,000Property, Plant & Equipment Property, Plant & Equipment, at cost 102,927,451 120,282,026 120,382,026 120,482,026 120,582,026 120,682,026 120,782,026 120,882,026 120,982,026 121,082,026 121,182,026 Less Accumulated Depreciation & Amortiz. 0 2,640,810 8,027,000 13,418,190 18,814,380 24,215,570 29,621,760 35,032,950 40,449,140 45,870,330 51,296,520Net Property, Plant & Equipment 102,927,451 117,641,217 112,355,027 107,063,837 101,767,647 96,466,457 91,160,267 85,849,077 80,532,887 75,211,697 69,885,507Capitalized Fees & Interest 1,695,374 3,587,225 3,228,503 2,869,780 2,511,058 2,152,335 1,793,613 1,434,890 1,076,168 717,445 358,723Total Assets 104,847,826 137,188,729 148,201,371 160,170,155 173,146,600 187,153,208 202,212,818 218,348,599 235,584,049 251,130,483 267,824,530
LIABILITIES & EQUITIESCurrent Liabilities: Accounts Payable 0 1,027,504 1,068,130 1,079,525 1,091,048 1,102,702 1,114,486 1,126,404 1,138,457 1,150,645 1,162,972 Notes Payable 0 0 0 0 0 0 0 0 0 0 0 Current Maturities of Long Term Debt 0 5,584,923 6,048,468 6,550,488 7,094,176 7,682,989 8,320,673 9,011,285 9,759,217 10,569,227 3,714,542 Current maturities of Subordinated Debt 0 0 0 0 0 0 0 0 0 0 0Total Current Liabilities 0 6,612,426 7,116,598 7,630,013 8,185,224 8,785,690 9,435,159 10,137,689 10,897,673 11,719,872 4,877,513
Long Term Debt (excluding current maturities 53,963,935 68,751,063 62,702,595 56,152,107 49,057,931 41,374,943 33,054,270 24,042,985 14,283,768 3,714,542 0Subordinated Debt (excluding current maturiti 0 0 0 0 0 0 0 0 0 0 0Deferred Income Taxes 0 0 0 0 0 0 0 0 0 0 0Total Liabilities 53,963,935 75,363,490 69,819,193 63,782,120 57,243,155 50,160,633 42,489,429 34,180,674 25,181,442 15,434,414 4,877,513
Capital Shares & Equities Preferred Shares 0 0 0 0 0 0 0 0 0 0 0 Common Shares 51,879,600 51,879,600 51,879,600 51,879,600 51,879,600 51,879,600 51,879,600 51,879,600 51,879,600 51,879,600 51,879,600 Grants 0 0 0 0 0 0 0 0 0 0 0 Retained Earnings (995,710) 9,945,639 26,502,578 44,508,435 64,023,844 85,112,975 107,843,788 132,288,325 158,523,007 183,816,470 211,067,417Total Capital Shares & Equities 50,883,890 61,825,239 78,382,178 96,388,035 115,903,444 136,992,575 159,723,388 184,167,925 210,402,607 235,696,070 262,947,017
Total Liabilities & Equities 104,847,826 137,188,729 148,201,371 160,170,155 173,146,600 187,153,208 202,212,818 218,348,599 235,584,049 251,130,483 267,824,530
3 70 MMGPY Appendix - Nebraska Financial Forecast

NREL Bioethanol Co-Location Study -- Grand Island, NE SiteProforma Income Statements
Construction 1st Year 2nd Year 3rd Year 4th Year 5th Year 6th Year 7th Year 8th Year 9th Year 10th Year(Year 0) Operations Operations Operations Operations Operations Operations Operations Operations Operations Operations
Sales Ethanol 0 62,062,689 84,633,633 86,326,306 88,052,832 89,813,888 91,610,166 93,442,370 95,311,217 97,217,441 99,161,790 Lignin Residue 0 1,850,413 2,517,868 2,543,047 2,568,477 2,594,162 2,620,104 2,646,305 2,672,768 2,699,495 2,726,490 Carbon Dioxide 0 0 0 0 0 0 0 0 0 0 0State Producer Payment 0 2,208,867 2,812,500 2,812,500 2,812,500 2,812,500 2,812,500 2,812,500 2,812,500 0 0Federal Small Producer Payment 0 0 0 0 0 0 0 0 0 0 0Total Sales 0 66,121,969 89,964,001 91,681,853 93,433,809 95,220,551 97,042,770 98,901,174 100,796,485 99,916,937 101,888,280
Production & Operating Expenses Feedstocks 0 21,878,140 26,687,871 26,954,749 27,224,297 27,496,540 27,771,505 28,049,220 28,329,713 28,613,010 28,899,140 Purchased Cellulase Enzymes 0 5,439,000 7,126,560 7,197,826 7,269,804 7,342,502 7,415,927 7,490,086 7,564,987 7,640,637 7,717,043 Other Chemicals 0 4,170,979 5,465,110 5,519,761 5,574,959 5,630,708 5,687,015 5,743,886 5,801,324 5,859,338 5,917,931 Utilities - Natural Gas 0 5,960,804 7,887,594 8,045,346 8,206,252 8,370,378 8,537,785 8,708,541 8,882,712 9,060,366 9,241,573 Electricity 0 2,298,625 3,041,640 3,102,473 3,164,522 3,227,813 3,292,369 3,358,216 3,425,381 3,493,888 3,563,766 Denaturants 0 1,888,542 2,499,000 2,548,980 2,599,960 2,651,959 2,704,998 2,759,098 2,814,280 2,870,565 2,927,977 Makeup Water 0 161,307 211,356 213,470 215,605 217,761 219,938 222,138 224,359 226,603 228,869 Wastewater Disposal 0 206,210 270,191 272,893 275,622 278,379 281,162 283,974 286,814 289,682 292,579 Solid Waste Disposal 0 520,525 682,029 688,849 695,738 702,695 709,722 716,819 723,987 731,227 738,539 Direct Labor & Benefits 0 1,858,950 1,905,424 1,953,059 2,001,886 2,051,933 2,103,231 2,155,812 2,209,707 2,264,950 2,321,574Total Production Costs 0 44,383,083 55,776,775 56,497,406 57,228,644 57,970,666 58,723,653 59,487,790 60,263,263 61,050,265 61,848,991Gross Profit 0 21,738,886 34,187,226 35,184,446 36,205,165 37,249,884 38,319,117 39,413,384 40,533,221 38,866,671 40,039,290
Administrative & Operating Expenses Maintenance Materials & Services 0 1,425,703 1,877,303 1,905,463 1,934,045 1,963,056 1,992,501 2,022,389 2,052,725 2,083,516 2,114,768 Maintenance - Wages & Benefits 0 672,300 689,108 706,335 723,994 742,093 760,646 779,662 799,153 819,132 839,611 Consulting Services 114,000 24,000 24,480 24,970 25,469 25,978 26,498 27,028 27,568 28,120 28,682 Property Taxes & Insurance 412,610 2,063,049 2,380,898 2,296,858 2,210,796 2,122,679 2,032,474 1,940,146 1,845,661 1,748,984 1,650,080 Admin. Salaries, Wages & Benefits 148,500 668,250 684,956 702,080 719,632 737,623 756,064 774,965 794,339 814,198 834,553 Legal & Accounting/Community Affairs 144,000 36,000 36,720 37,454 38,203 38,968 39,747 40,542 41,353 42,180 43,023 Office/Lab Supplies & Expenses 120,000 120,000 122,400 124,848 127,345 129,892 132,490 135,139 137,842 140,599 143,411 Travel, Training & Miscellaneous 56,600 34,650 35,343 36,050 36,771 37,506 38,256 39,022 39,802 40,598 41,410
EBITD (995,710) 16,694,935 28,336,019 29,350,388 30,388,910 31,452,089 32,540,441 33,654,492 34,794,777 33,149,345 34,343,752Less: Interest - Operating Line of Credit 0 0 0 0 0 0 0 0 0 0 0 Interest - Senior Debt 0 3,112,776 6,034,168 5,594,619 5,118,588 4,603,046 4,044,715 3,440,043 2,785,183 2,075,969 1,307,892 Interest - Subordinated Debt 0 0 0 0 0 0 0 0 0 0 0 Depreciation & Amortization 0 2,640,810 5,744,913 5,749,913 5,754,913 5,759,913 5,764,913 5,769,913 5,774,913 5,779,913 5,784,913
Pre-Tax Income (995,710) 10,941,349 16,556,938 18,005,857 19,515,410 21,089,130 22,730,814 24,444,537 26,234,682 25,293,463 27,250,947Current Income Taxes 0 0 0 0 0 0 0 0 0 0 0
Net Earnings (Loss) for the Year (995,710) 10,941,349 16,556,938 18,005,857 19,515,410 21,089,130 22,730,814 24,444,537 26,234,682 25,293,463 27,250,947
4 70 MMGPY Appendix - Nebraska Financial Forecast

NREL Bioethanol Co-Location Study -- Grand Island, NE SiteProforma Statements of Cash Flows
Construction 1st Year 2nd Year 3rd Year 4th Year 5th Year 6th Year 7th Year 8th Year 9th Year 10th Year(1 Year) Operations Operations Operations Operations Operations Operations Operations Operations Operations Operations
Cash provided by (used in) Operating Activities Net Earnings (loss) (995,710) 10,941,349 16,556,938 18,005,857 19,515,410 21,089,130 22,730,814 24,444,537 26,234,682 25,293,463 27,250,947 Non cash charges to operations Depreciation & Amortization 0 2,640,810 5,744,913 5,749,913 5,754,913 5,759,913 5,764,913 5,769,913 5,774,913 5,779,913 5,784,913
(995,710) 13,582,159 22,301,851 23,755,769 25,270,322 26,849,043 28,495,726 30,214,449 32,009,595 31,073,375 33,035,859
Changes in non-cash working capital balances Accounts Receivable 0 2,456,117 33,926 49,081 50,056 51,050 52,063 53,097 54,152 55,227 56,324 Inventories 0 3,991,689 136,410 61,340 62,354 63,387 64,438 65,509 66,598 67,707 68,836 Prepaid Expenses 0 0 0 0 0 0 0 0 0 0 0 Accounts Payable 0 (1,027,504) (40,626) (11,395) (11,524) (11,653) (11,785) (11,918) (12,052) (12,189) (12,327) Income Taxes Payable 0 0 0 0 0 0 0 0 0 0 0
0 5,420,302 129,710 99,026 100,887 102,784 104,717 106,688 108,697 110,745 112,833
Investing Activities Land Purchase 225,000 0 0 0 0 0 0 0 0 0 0 Fixed Asset Purchases 102,927,451 17,354,575 100,000 100,000 100,000 100,000 100,000 100,000 100,000 100,000 100,000 Capitalized Fees & Interest 1,695,374 1,891,851 0 0 0 0 0 0 0 0 0
104,847,826 19,246,426 100,000 100,000 100,000 100,000 100,000 100,000 100,000 100,000 100,000
Financing Activities Long Term Debt Advances 53,963,935 23,855,465 0 0 0 0 0 0 0 0 0 Repayment of Long Term Debt 0 (3,483,414) (5,584,923) (6,048,468) (6,550,488) (7,094,176) (7,682,989) (8,320,673) (9,011,285) (9,759,217) (10,569,227) Subordinated Debt Advances 0 0 0 0 0 0 0 0 0 0 0 Repayment of Subordinated Debt 0 0 0 0 0 0 0 0 0 0 0 Equity Investment 51,879,600 0 0 0 0 0 0 0 0 0 0 Grants 0 0 0 0 0 0 0 0 0 0 0 Cash Sweep for Debt Service 0 0 0 0 0 0 0 0 0 0 0 Distributions to Shareholders 0 0 0 0 0 0 0 0 0 0 0
Net Increase (Decrease) in Cash 0 9,287,481 16,487,219 17,508,275 18,518,947 19,552,084 20,608,020 21,687,088 22,789,613 21,103,413 22,253,799Cash (Indebtedness), Beginning of Year 0 0 9,287,481 25,774,700 43,282,975 61,801,922 81,354,006 101,962,027 123,649,115 146,438,728 167,542,141
Cash (Bank Indebtedness), End of Year 0 9,287,481 25,774,700 43,282,975 61,801,922 81,354,006 101,962,027 123,649,115 146,438,728 167,542,141 189,795,940
5 70 MMGPY Appendix - Nebraska Financial Forecast

NREL Bioethanol Co-Location Study -- Grand Island, NE SiteInterim Funding ScheduleMonths 1-24
Cash InterestMonth Project Fees & Other Required By Current Month Equity/Grant Subordinated Payment Loan (Equity)
Development Expenses Operations Disbursements Investment Debt (Earnings) Balance--------- --------- ---------- ----------- ----------- ----------- ----------- ------------- ------------
1 8,752,288 861,277 12,375 9,625,940 (51,879,600) 0 (105,634) (42,359,294)2 8,527,288 83,083 12,375 8,622,746 0 0 (84,341) (33,820,890)3 8,527,288 83,083 12,375 8,622,746 0 0 (62,995) (25,261,139)4 8,527,288 83,083 12,375 8,622,746 0 0 (41,596) (16,679,989)5 8,527,288 83,083 12,375 8,622,746 0 0 (53,715) (8,110,958)6 8,527,288 83,083 12,375 8,622,746 0 0 3,412 515,2007 8,777,288 83,083 12,375 8,872,746 0 0 62,586 9,450,5328 8,664,788 83,083 12,375 8,760,246 0 0 121,405 18,332,1839 8,664,788 87,483 12,375 8,764,646 0 0 180,646 27,277,474
10 8,664,788 87,483 12,375 8,764,646 0 0 240,281 36,282,40111 8,414,788 87,483 12,375 8,514,646 0 0 298,647 45,095,69412 8,577,288 87,483 12,375 8,677,146 0 0 358,486 54,131,32613 9,027,288 19,250 276,625 9,323,163 0 0 423,030 63,877,51814 8,327,288 19,250 276,625 8,623,163 0 0 483,338 72,984,01915 0 19,250 659,099 678,349 0 0 491,082 74,153,45016 0 6,600 0 6,600 0 0 494,400 74,654,45117 0 6,600 0 6,600 0 0 497,740 75,158,79118 0 6,600 0 6,600 0 0 501,103 75,666,49419 0 6,600 0 6,600 0 0 501,103 76,174,19620 0 6,600 0 6,600 0 0 501,103 76,681,89921 0 6,600 0 6,600 0 0 501,103 77,189,60122 0 6,600 0 6,600 0 0 501,103 77,697,30423 0 6,600 0 6,600 0 0 501,103 78,205,00724 0 6,600 0 6,600 0 0 501,103 78,712,709
----------- ------------ --------- ---------- ----------- ----------- ------------- -----------------Total 120,507,026 1,909,944 1,323,724 123,777,820 (51,879,600) 0 6,814,490 78,712,709
6 70 MMGPY Appendix - Nebraska Financial Forecast

NREL Bioethanol Co-Location Study -- Grand Island, NE SiteEngineering & Construction Cost Summary
Rolling Stock, Site Prep. & Rail Construction &Tools & Admin. Improve- Equipment & Engineering Procurement Monthly
Month Land Spare Parts Building ments Installation Fees Fees Contingency Total
1 225,000 0 200,000 0 6,605,571 632,872 505,935 582,909 8,752,2882 0 0 200,000 0 6,605,571 632,872 505,935 582,909 8,527,2883 0 0 200,000 0 6,605,571 632,872 505,935 582,909 8,527,2884 0 0 200,000 0 6,605,571 632,872 505,935 582,909 8,527,2885 0 0 200,000 0 6,605,571 632,872 505,935 582,909 8,527,2886 0 0 200,000 0 6,605,571 632,872 505,935 582,909 8,527,2887 0 0 200,000 250,000 6,605,571 632,872 505,935 582,909 8,777,2888 0 0 87,500 250,000 6,605,571 632,872 505,935 582,909 8,664,7889 0 0 87,500 250,000 6,605,571 632,872 505,935 582,909 8,664,788
10 0 0 87,500 250,000 6,605,571 632,872 505,935 582,909 8,664,78811 0 0 87,500 0 6,605,571 632,872 505,935 582,909 8,414,78812 0 250,000 0 0 6,605,571 632,872 505,935 582,909 8,577,28813 0 700,000 0 0 6,605,571 632,872 505,935 582,909 9,027,28814 0 0 0 0 6,605,571 632,872 505,935 582,909 8,327,28815 0 0 0 0 0 0 0 0 016 0 0 0 0 0 0 0 0 017 0 0 0 0 0 0 0 0 018 0 0 0 0 0 0 0 0 0
_________ _________ _________ _________ _________ _________ _________ _________ _________TOTAL 225,000 950,000 1,750,000 1,000,000 92,478,000 8,860,213 7,083,090 8,160,723 120,507,026
7 70 MMGPY Appendix - Nebraska Financial Forecast

NREL Bioethanol Co-Location Study -- Grand Island, NE SiteProduction & Sales, Months 13-23
Month 13 Month 14 Month 15 Month 16 Month 17 Month 18 Month 19 Month 20 Month 21 Month 22 Month 23Fuel Ethanol
Gallons Produced 0 0 2,916,667 4,375,000 5,833,333 5,833,333 5,833,333 5,833,333 5,833,333 5,833,333 5,833,333Gallons Sent to Inventory 0 0 800,000 800,000 0 0 0 0 0 0 0Denaturant Added 0 0 145,833 218,750 291,667 291,667 291,667 291,667 291,667 291,667 291,667Net Gallons Sold (Denatured) 0 0 2,222,500 3,753,750 6,125,000 6,125,000 6,125,000 6,125,000 6,125,000 6,125,000 6,125,000Selling Price/Gallon (FOB Plant) $1.1289 $1.1289 $1.1289 $1.1289 $1.1289 $1.1289 $1.1289 $1.1289 $1.1289 $1.1289 $1.1289State Producer Payment $0.040 $0.040 $0.040 $0.040 $0.040 $0.040 $0.040 $0.040 $0.040 $0.040 $0.040Federal Small Producer Payment $0.000 $0.000 $0.000 $0.000 $0.000 $0.000 $0.000 $0.000 $0.000 $0.000 $0.000
Total Revenue - Fuel Ethanol 0 0 2,598,277 4,388,429 7,160,606 7,160,606 7,160,606 7,160,606 7,160,606 7,160,606 7,160,606
Lignin Residue Dry Tons Produced 0 0 32,652 48,978 65,304 65,304 65,304 65,304 65,304 65,304 65,304Tons Sent to Inventory 0 0 11,195 11,195 0 0 0 0 0 0 0Net Tons Sold 0 0 21,457 37,783 65,304 65,304 65,304 65,304 65,304 65,304 65,304Selling Price/Dry Ton $3.18 $3.18 $3.18 $3.18 $3.18 $3.18 $3.18 $3.18 $3.18 $3.18 $3.18
Total Revenue - Lignin Residue 0 0 68,259 120,195 207,745 207,745 207,745 207,745 207,745 207,745 207,745
CO2
Tons Produced 0 0 7,292 10,938 14,583 14,583 14,583 14,583 14,583 14,583 14,583Tons Sent to Inventory 0 0 0 0 0 0 0 0 0 0 0Net Tons Sold 0 0 7,292 10,938 14,583 14,583 14,583 14,583 14,583 14,583 14,583Selling Price/Ton $0.00 $0.00 $0.00 $0.00 $0.00 $0.00 $0.00 $0.00 $0.00 $0.00 $0.00
Total Revenue - CO2 0 0 0 0 0 0 0 0 0 0 0
Total Revenue - All Products 0 0 2,666,536 4,508,624 7,368,351 7,368,351 7,368,351 7,368,351 7,368,351 7,368,351 7,368,351
8 70 MMGPY Appendix - Nebraska Financial Forecast

NREL Bioethanol Co-Location Study -- Grand Island, NE SiteOperating Expense, Months 13-23
Month 13 Month 14 Month 15 Month 16 Month 17 Month 18 Month 19 Month 20 Month 21 Month 22 Month 23
Plant Operating Rate 0.00% 0.00% 50.00% 75.00% 100.00% 100.00% 100.00% 100.00% 100.00% 100.00% 100.00%
BDT Biomass for Processing 0 0 32,516 48,774 65,032 65,032 65,032 65,032 65,032 65,032 65,032BDT Biomass to Inventory 0 0 22,297 22,297 0 0 0 0 0 0 0$/BDT Biomass (Delivered) $33.860 $33.860 $33.860 $33.860 $33.860 $33.860 $33.860 $33.860 $33.860 $33.860 $33.860Biomass Expense 0 0 1,855,946 2,406,438 2,201,970 2,201,970 2,201,970 2,201,970 2,201,970 2,201,970 2,201,970
Total Feedstock Expense 0 0 1,855,946 2,406,438 2,201,970 2,201,970 2,201,970 2,201,970 2,201,970 2,201,970 2,201,970
Electricity (KWH) 0 0 4,141,667 6,212,500 8,283,333 8,283,333 8,283,333 8,283,333 8,283,333 8,283,333 8,283,333$/KWH $0.0300 $0.0300 $0.0300 $0.0300 $0.0300 $0.0300 $0.0300 $0.0300 $0.0300 $0.0300 $0.0300Electricity Expense 0 0 124,250 186,375 248,500 248,500 248,500 248,500 248,500 248,500 248,500
Natural Gas (MMBTU) 0 0 107,402 161,103 214,804 214,804 214,804 214,804 214,804 214,804 214,804$/MMBTU $3.0000 $3.0000 $3.0000 $3.0000 $3.0000 $3.0000 $3.0000 $3.0000 $3.0000 $3.0000 $3.0000Natural Gas Expense 0 0 322,206 483,308 644,411 644,411 644,411 644,411 644,411 644,411 644,411
Makeup Water ('000 Gal.) 0 0 17,439 26,158 34,877 34,877 34,877 34,877 34,877 34,877 34,877$/1000 Gal. $0.5000 $0.5000 $0.5000 $0.5000 $0.5000 $0.5000 $0.5000 $0.5000 $0.5000 $0.5000 $0.5000Makeup Water Expense 0 0 8,719 13,079 17,439 17,439 17,439 17,439 17,439 17,439 17,439
Effluent Disposal ('000 Gal) 0 0 11,147 16,720 22,293 22,293 22,293 22,293 22,293 22,293 22,293$/1000 Gal. $1.0000 $1.0000 $1.0000 $1.0000 $1.0000 $1.0000 $1.0000 $1.0000 $1.0000 $1.0000 $1.0000Effluent Disposal Expense 0 0 11,147 16,720 22,293 22,293 22,293 22,293 22,293 22,293 22,293
Solid Waste Disposal (Tons) 0 0 2,814 4,220 5,627 5,627 5,627 5,627 5,627 5,627 5,627$/Ton $10.0000 $10.0000 $10.0000 $10.0000 $10.0000 $10.0000 $10.0000 $10.0000 $10.0000 $10.0000 $10.0000Solid Waste Disposal Expense 0 0 28,137 42,205 56,273 56,273 56,273 56,273 56,273 56,273 56,273
Labor & Benefits 266,625 266,625 266,625 266,625 266,625 266,625 266,625 266,625 266,625 266,625 266,625Maintenance Materials & Services 0 0 77,065 115,598 154,130 154,130 154,130 154,130 154,130 154,130 154,130Taxes & Insurance 0 0 0 18,750 18,750 18,750 18,750 18,750 18,750 18,750 18,750Denaturants 0 0 102,083 153,125 204,167 204,167 204,167 204,167 204,167 204,167 204,167Purchased Cellulase Enzymes 0 0 294,000 441,000 588,000 588,000 588,000 588,000 588,000 588,000 588,000Other Chemicals 0 0 225,458 338,188 450,917 450,917 450,917 450,917 450,917 450,917 450,917Office/Lab Supplies & Expenses 10,000 10,000 10,000 10,000 10,000 10,000 10,000 10,000 10,000 10,000 10,000
Total Monthly Expense (non-feedstock) 276,625 276,625 1,469,690 2,084,972 2,681,504 2,681,504 2,681,504 2,681,504 2,681,504 2,681,504 2,681,504
Total Monthly Profit (Loss) (276,625) (276,625) (659,099) 17,214 2,484,877 2,484,877 2,484,877 2,484,877 2,484,877 2,484,877 2,484,877
9 70 MMGPY Appendix - Nebraska Financial Forecast

NREL Bioethanol Co-Location Study -- Grand Island, NE SiteInterim Period Fees & ExpensesMonths 1-24
Lender/ Legal/ Political/Placement Organizational Accounting Community Financial Construction Hiring & Contingency @ Monthly
Month Fees Costs Expenses Relations Consultants Consultants Training Travel 10% Total
1 778,194 $58,333 10,000 2,000 2,000 7,500 0 1,000 2,250 861,2772 0 $58,333 10,000 2,000 2,000 7,500 0 1,000 2,250 83,0833 0 $58,333 10,000 2,000 2,000 7,500 0 1,000 2,250 83,0834 0 $58,333 10,000 2,000 2,000 7,500 0 1,000 2,250 83,0835 0 $58,333 10,000 2,000 2,000 7,500 0 1,000 2,250 83,0836 0 $58,333 10,000 2,000 2,000 7,500 0 1,000 2,250 83,0837 0 $58,333 10,000 2,000 2,000 7,500 0 1,000 2,250 83,0838 0 $58,333 10,000 2,000 2,000 7,500 0 1,000 2,250 83,0839 0 $58,333 10,000 2,000 2,000 7,500 4,000 1,000 2,650 87,483
10 0 $58,333 10,000 2,000 2,000 7,500 4,000 1,000 2,650 87,48311 0 $58,333 10,000 2,000 2,000 7,500 4,000 1,000 2,650 87,48312 0 $58,333 10,000 2,000 2,000 7,500 4,000 1,000 2,650 87,48313 0 0 2,000 1,000 2,000 7,500 4,000 1,000 1,750 19,25014 0 0 2,000 1,000 2,000 7,500 4,000 1,000 1,750 19,25015 0 0 2,000 1,000 2,000 7,500 4,000 1,000 1,750 19,25016 0 0 2,000 1,000 2,000 0 0 1,000 600 6,60017 0 0 2,000 1,000 2,000 0 0 1,000 600 6,60018 0 0 2,000 1,000 2,000 0 0 1,000 600 6,60019 0 0 2,000 1,000 2,000 0 0 1,000 600 6,60020 0 0 2,000 1,000 2,000 0 0 1,000 600 6,60021 0 0 2,000 1,000 2,000 0 0 1,000 600 6,60022 0 0 2,000 1,000 2,000 0 0 1,000 600 6,60023 0 0 2,000 1,000 2,000 0 0 1,000 600 6,60024 0 0 2,000 1,000 2,000 0 0 1,000 600 6,600
_______ _______ _______ _______ _______ _______ _______ _______ _______ _______TOTAL 778,194 700,000 144,000 36,000 48,000 112,500 28,000 24,000 39,250 1,909,944
10 70 MMGPY Appendix - Nebraska Financial Forecast

Interim Period Labor SummaryMonths 1-24
General Plant Environ. & Commodity Admin. Lab Shift Team Shift YardPosition Manager Manager Safety Mgr. Controller Manager Assistant Microbiologist Technician Leader Operator LaborNumber Employed (1) (1) (1) (1) (1) (5) (1) (2) (4) (20) (20)Annual Salary 110,000 80,000 60,000 65,000 60,000 24,000 45,000 28,000 44,000 30,000 25,000
______ ______ ______ ______ ______ ______ ______ ______ ______ ______ ______Month
1 9,167 0 0 0 0 0 0 0 0 0 02 9,167 0 0 0 0 0 0 0 0 0 03 9,167 0 0 0 0 0 0 0 0 0 04 9,167 0 0 0 0 0 0 0 0 0 05 9,167 0 0 0 0 0 0 0 0 0 06 9,167 0 0 0 0 0 0 0 0 0 07 9,167 0 0 0 0 0 0 0 0 0 08 9,167 0 0 0 0 0 0 0 0 0 09 9,167 0 0 0 0 0 0 0 0 0 0
10 9,167 0 0 0 0 0 0 0 0 0 011 9,167 0 0 0 0 0 0 0 0 0 012 9,167 0 0 0 0 0 0 0 0 0 013 9,167 6,667 5,000 5,417 5,000 10,000 3,750 4,667 14,667 50,000 41,66714 9,167 6,667 5,000 5,417 5,000 10,000 3,750 4,667 14,667 50,000 41,66715 9,167 6,667 5,000 5,417 5,000 10,000 3,750 4,667 14,667 50,000 41,66716 9,167 6,667 5,000 5,417 5,000 10,000 3,750 4,667 14,667 50,000 41,66717 9,167 6,667 5,000 5,417 5,000 10,000 3,750 4,667 14,667 50,000 41,66718 9,167 6,667 5,000 5,417 5,000 10,000 3,750 4,667 14,667 50,000 41,66719 9,167 6,667 5,000 5,417 5,000 10,000 3,750 4,667 14,667 50,000 41,66720 9,167 6,667 5,000 5,417 5,000 10,000 3,750 4,667 14,667 50,000 41,66721 9,167 6,667 5,000 5,417 5,000 10,000 3,750 4,667 14,667 50,000 41,66722 9,167 6,667 5,000 5,417 5,000 10,000 3,750 4,667 14,667 50,000 41,66723 9,167 6,667 5,000 5,417 5,000 10,000 3,750 4,667 14,667 50,000 41,66724 9,167 6,667 5,000 5,417 5,000 10,000 3,750 4,667 14,667 50,000 41,667
11 70 MMGPY Appendix - Nebraska Financial Forecast

Interim Period Labor SummaryMonths 1-24
PositionNumber EmployedAnnual Salary
Month123456789
101112131415161718192021222324
Maintenance Boiler Maintenance Instrument Monthly Benefits TotalManager Operator Worker Welder Electrician Technician Total at
(1) (1) (8) (1) (1) (2) (71) 35.00%50,000 40,000 33,000 35,000 35,000 37,000______ ______ ______ ______ ______ ______ ______ ______ ______
0 0 0 0 0 0 9,167 3,208 12,3750 0 0 0 0 0 9,167 3,208 12,3750 0 0 0 0 0 9,167 3,208 12,3750 0 0 0 0 0 9,167 3,208 12,3750 0 0 0 0 0 9,167 3,208 12,3750 0 0 0 0 0 9,167 3,208 12,3750 0 0 0 0 0 9,167 3,208 12,3750 0 0 0 0 0 9,167 3,208 12,3750 0 0 0 0 0 9,167 3,208 12,3750 0 0 0 0 0 9,167 3,208 12,3750 0 0 0 0 0 9,167 3,208 12,3750 0 0 0 0 0 9,167 3,208 12,375
4,167 3,333 22,000 2,917 2,917 6,167 197,500 69,125 266,6254,167 3,333 22,000 2,917 2,917 6,167 197,500 69,125 266,6254,167 3,333 22,000 2,917 2,917 6,167 197,500 69,125 266,6254,167 3,333 22,000 2,917 2,917 6,167 197,500 69,125 266,6254,167 3,333 22,000 2,917 2,917 6,167 197,500 69,125 266,6254,167 3,333 22,000 2,917 2,917 6,167 197,500 69,125 266,6254,167 3,333 22,000 2,917 2,917 6,167 197,500 69,125 266,6254,167 3,333 22,000 2,917 2,917 6,167 197,500 69,125 266,6254,167 3,333 22,000 2,917 2,917 6,167 197,500 69,125 266,6254,167 3,333 22,000 2,917 2,917 6,167 197,500 69,125 266,6254,167 3,333 22,000 2,917 2,917 6,167 197,500 69,125 266,6254,167 3,333 22,000 2,917 2,917 6,167 197,500 69,125 266,625
12 70 MMGPY Appendix - Nebraska Financial Forecast

REPORT DOCUMENTATION PAGE
Form Approved OMB NO. 0704-0188
Public reporting burden for this collection of information is estimated to average 1 hour per response, including the time for reviewing instructions, searching existing data sources, gathering and maintaining the data needed, and completing and reviewing the collection of information. Send comments regarding this burden estimate or any other aspect of this collection of information, including suggestions for reducing this burden, to Washington Headquarters Services, Directorate for Information Operations and Reports, 1215 Jefferson Davis Highway, Suite 1204, Arlington, VA 22202-4302, and to the Office of Management and Budget, Paperwork Reduction Project (0704-0188), Washington, DC 20503. 1. AGENCY USE ONLY (Leave blank)
2. REPORT DATE
December 2002
3. REPORT TYPE AND DATES COVERED
Subcontract Report: November 29, 2001–July 28, 2002
4. TITLE AND SUBTITLE Feasibility Study for Bioethanol Co-Location with a Coal Fired Power Plant
6. AUTHOR(S)
BBI International
5. FUNDING NUMBERS
CF: ACO-2-31092-01 BBA3.4300
7. PERFORMING ORGANIZATION NAME(S) AND ADDRESS(ES)
BBI International P. O. Box 159 Cotopaxi, Colorado 81223
8. PERFORMING ORGANIZATION
REPORT NUMBER
9. SPONSORING/MONITORING AGENCY NAME(S) AND ADDRESS(ES)
National Renewable Energy Laboratory 1617 Cole Blvd. Golden, CO 80401-3393
10. SPONSORING/MONITORING
AGENCY REPORT NUMBER NREL/SR-510-32999
11. SUPPLEMENTARY NOTES
NREL Technical Monitor: Robert Wallace 12a. DISTRIBUTION/AVAILABILITY STATEMENT
National Technical Information Service U.S. Department of Commerce 5285 Port Royal Road
Springfield, VA 22161
12b. DISTRIBUTION CODE
13. ABSTRACT (Maximum 200 words)
This study looks at the feasibility of co-locating 30, 50, and 70 million gallon per year bioethanol facilities with coal fired power plants in Indiana and Nebraska. Corn stover is the feedstock for ethanol production in both cases.
15. NUMBER OF PAGES
14. SUBJECT TERMS Bioethanol; corn stover; coal fired power plants; co-location
16. PRICE CODE
17. SECURITY CLASSIFICATION
OF REPORT Unclassified
18. SECURITY CLASSIFICATION
OF THIS PAGE Unclassified
19. SECURITY CLASSIFICATION
OF ABSTRACT Unclassified
20. LIMITATION OF ABSTRACT
UL
NSN 7540-01-280-5500 Standard Form 298 (Rev. 2-89) Prescribed by ANSI Std. Z39-18 298-102