feasibility study of developing and creating a
TRANSCRIPT

Applied Research and Innovation Branch
Feasibility Study of Developing and
Creating a Standardized Subset of Bridge
Plans
Michael McMullen
Chengyu Li
Report No. CDOT-2015-05
September 2015

i
The contents of this report reflect the views of the
author(s), who is (are) responsible for the facts
and accuracy of the data presented herein. The
contents do not necessarily reflect the official
views of the Colorado Department of
Transportation or the Federal Highway
Administration. This report does not constitute a
standard, specification, or regulation

ii
Technical Report Documentation Page
1. Report No.
CDOT-2015-06
2. Government Accession No.
3. Recipient's Catalog No.
4. Title and Subtitle
Feasibility Study of Developing and Creating a Standardized Subset of Bridge
Plans
5. Report Date
September 2015
6. Performing Organization Code
7. Author(s)
Michael L. McMullen, Chengyu Li
8. Performing Organization Report
No.
CDOT-2015-06
9. Performing Organization Name and Address
Atkins North America
4601 DTC Blvd., Suite 700,
Denver, CO 80237
10. Work Unit No. (TRAIS)
11. Contract or Grant No.
214.01
12. Sponsoring Agency Name and Address
Colorado Department of Transportation - Research
4201 E. Arkansas Ave.
Denver, CO 80222
13. Type of Report and Period
Covered
Final
14. Sponsoring Agency Code
15. Supplementary Notes
Prepared in cooperation with the US Department of Transportation, Federal Highway Administration
16. Abstract
This study investigated sizes and geometry of existing bridges in Colorado and investigated standard bridge systems used by
other entities. The study proposed standard bridge types advancing the goals of SHRP 2 R19A & B, the rapidest ABC
construction, and encompassing a wide range of span and structure lengths and widths, with the capability of a wide range of
skews while preserving, to the extent possible, simplicity, low construction cost and a competitive contracting environment,
in order to achieve the largest practical benefit to Colorado’s bridges over the coming decades. For Colorado these are pre-
decked simple made continuous precast girders, and shaft and precast cap substructures, all made integral with details
emulative of CIP construction. These are made practical by an effort to control camber and camber variations by design and
by monostrand post-tensioning camber adjustment.
Implementation is planned to be progressive, starting from worksheets for standard superstructures and substructures in
conjunction with prototype structures, expanding to encompass more acute skews, and finally, additional worksheets
incorporating the design information to accommodate the full range of anticipated structure types, spans, span arrangements,
and skews without additional detailed structural design or details for each individual bridge element. At this time, a worksheet
can be developed to allow simplified presentation of the desired structure. Minor organizational changes are proposed to
ensure continuity of the development and maintenance of these worksheets. Rough estimated implementation costs and value
of benefits are included.
17. Keywords
ABC, GRS-IBS, Prefabricated Substructure, Prefabricated
Superstructure, Camber Control, Standard Bridges,
Predecked Girders
18. Distribution Statement
This document is available on CDOT’s website
http://www.coloradodot.info/programs/research/pdfs
19. Security Class if. (of this report)
Unclassified
20. Security Class if. (of this page)
Unclassified
21. No. of Pages
119
22. Price

iii
Form DOT F 1700.7 (8-72) Reproduction of completed page authorized
COLORADO DEPARTMENT OF TRANSPORTATION
STUDY RESEARCH PANEL
Study Manager: Aziz Khan, CDOT DTD Applied Research and Innovation Branch
Study Panel Chair: ShingChun Wang, CDOT Bridge Design and Management
Joshua Laipply, CDOT Bridge Design and Management
Mahmood Hasan, CDOT Bridge Design and Management
Mohamed Zaina, CDOT Bridge Design and Management
Jessica Terry, CDOT Bridge Design and Management
Matthew Greer, Colorado Division of the Federal Highway Administration
RESEARCH TEAM
Michael McMullen, Atkins North America
Chengyu Li, Atkins North America

iv
Executive Summary The objective of this study is to determine if the development of a standardized subset of bridge plans
is feasible and cost effective. The past 30 years of successful Colorado Department of Transportation
(CDOT) bridge design can be used as a starting point to create a standardized subset of bridge plans.
This proposed subset of standardized plans is a means to implement CDOT and Federal Highway
Administration (FHWA) mandates: Every Day Counts (EDC), Accelerated Bridge Construction
(ABC), and Geosynthetic Reinforced Soil Integrated Bridge System (GRS-IBS).
The study included six major steps:
1. Literature review of past practice in Colorado and elsewhere
2. Project standardized bridge needs and usage using historical CDOT PONTIS data
3. Set standard parameters for standard design and development
4. Identify bridge elements to standardize
5. Estimate cost to develop standards and savings generated by the standards
6. Provide recommendations
State DOT’s, including CDOT, have relied on various levels of bridge standardization ranging from
standard details to work sheets and standard plan sets. Significant effort can be expended to provide
robust standardization as illustrated by the Texas DOT’s comprehensive set of bridge standard plans.
Other states limit their development to standard details or worksheets, such as those by CDOT. The
decision of how far to develop these standards should be based on projected usage and return on the
investment to develop them measured by savings in bridge design and detailing, construction, and
life cycle cost. The cost of standardization should also include maintaining the standards so that
design code and practice changes can be incorporated along with evolving material and construction
capability.
The estimated number of on-system bridges annually constructed by CDOT is 36 based on projecting
the CDOT PONTIS data forward; the study was limited to on-system (state road) bridges. The data
was then reviewed to project the range of span lengths and skew angles expected per year. About
58% of the bridges, or 21 per year, are expected to fall within span and skew angle ranges suitable
for standardization.
Three new bridge superstructure types were then developed to cover the span and skew ranges:
1. Short spans to 65 feet – precast decked slabs
2. Medium spans to 146 feet – precast deck U-girders
3. Long span to 199 feet – decked BT girders
All three superstructure types are pre-decked with the top portion including a full thickness deck slab
as part of the precast concrete member. All three types can be configured for variable top span (or
slab) widths up to 15 feet wide, eliminating cast-in-place deck construction. These superstructures
can be made continuous for live load by splicing them across piers. Preliminary merit cost design
span tables are included for these superstructure sections. All of these superstructures allow ABC and
the decked slabs are especially suitable to GRS-IBS applications. These superstructures can also
reduce the structure depth.
A conceptual-level assessment of substructure standards was also undertaken with the focus on ABC
and reduction of design and construction costs. Precast concrete pier and abutment elements such as

v
caps, columns, stems, and wingwalls have the most probability of being cost effective as well as
accelerating construction.
Utilizing historical design costs and projecting standard usage based on the historical CDOT bridge
construction data, significant design savings were identified. It is estimated that at up to 1/3 of
preliminary design and 2/3 of final design costs could be saved using well-developed and complete
bridge standards. The savings could be as high as $500,000 per year in design costs with the potential
for additional saving in construction and life cycle cost generated by the standardization. An
additional $340,000 per year could also be achieved by using elements of these standards on bridges
with spans or skews outside the standard plan ranges.
Standard plan development stages are:
1. Worksheet for moderate bridge skew
2. Expanding worksheets for larger skews
3. Integrate partial standard plans for full plan set generation
4. Yearly maintenance
Because the CDOT on-system yearly bridge construction program is not very large, only development
of a few standards to worksheet level is recommended at this time. These include decked slab bridge
superstructures, decked U-girder superstructures, decked BT-girder superstructures, and the precast
substructure worksheets to go with them. Future expansion of the standards can include extending
skew angle capability, adding integrated partial plans that provide enough data to convert worksheets
to full standard plans requiring no design and little detailing effort to complete.
The estimated cost to develop the standards varies with the level and commitment to standardization.
The estimated costs to develop and implement the recommended superstructure and substructure
worksheets are:
Type Worksheet
Level
Incl. Larger
Skews
Incl. Integrated
Partial Plans
Yearly
maintenance
Decked Slab $255,000 $330,000 $576,000 $29,000
Decked U-Girder $345,000 $468,000 $822,000 $41,000
Decked BT-
Girder $417,000 $525,000 $912,000 $46,000

vi
Figure 6-1 Decked slab girder ...................................................................................................................... 28 Figure 6-2 Decked U girder: top widths 15 feet 0 inch, 9 feet 10 inches, or 7 feet 3 inches ................................ 28 Figure 6-3 Decked BT girder: top widths 9 feet 10 inches, 7 feet 3 inches, or 4 feet 8 inches ............................ 29 Figure 6-4 Decked NExt Girder: top widths 15 feet 0 inch, 9 feet 10 inches, or 7 feet 3 inches .......................... 29 Figure 6-5 Decked U Girder with stretcher slab ............................................................................................. 30 Figure 6-6 Simple span capability versus merit cost for precast prestressed concrete decked sections (for
information only) ............................................................................................................................................... 31 Figure 6-7 Interior span capability versus merit cost for precast prestressed concrete decked sections (for
information only) ............................................................................................................................................... 32 Figure 6-8 Exterior span capability versus merit cost for precast prestressed concrete decked sections (for
information only) ............................................................................................................................................... 33 Figure 8-1 Elevation – recommended pier or abutment standard precise cap detail ........................................... 48 Figure 8-2 Section – recommended pier standard precast cap detail ................................................................ 48

vii
TABLE OF CONTENTS
1. Project Scope 1
2. CDOT Standard Plan History 3
3. Bridge Standard Usage by Other States 5
3.1. Complete standard plan or standard bridge detail sets 5
3.2. Less-complete standard plan or detail sets 7
4. Development of Data Set using CDOT On-System Bridge Characteristics for
Bridges Constructed in the Last 21 Years (1993-2013) 9
4.1. Summary information 9
4.2. Detailed categorization of 21 year data 9
4.3. Conclusions 14
5. Recommended Criteria for Standard Bridges 17
5.1. Goals to achieve maximum benefit 17
5.2. Applicable design codes and procedures 19
5.3. Recommendations for design 20
5.3.2 Service limit states 21
6. Recommended Bridge Superstructures 24
6.1. Development methodology 24
6.2. Superstructure sections developed for standardization 27
6.3. Other superstructure girder sections investigated 29
6.4. Charts of merit cost versus span capability 30
6.5. Superstructure sections considered and eliminated 34
7. Implementation Cost versus Benefits 38
7.1. Applicable structures for evaluating implementation cost 38
7.2. CDOT bridge design cost 38
7.3. Standard plan set needs 39
7.4. Estimate of potential savings 39
7.5. Estimated implementation cost 41
7.6. Payback time 42
7.7. How this proposal fits with Section 5.1 goals 43
7.8. Other worksheet needs 44
7.9. Comparison to other DOT efforts 44
7.10. Other extensions of the concept excluded 45
8. Substructure 46
8.1. Recommendations for integral behavior 46
8.2. Recommendations for pier and abutment standards 46
8.3. Recommendations for use of approach slabs 49
8.4. Recommendations for abutment backfill and wingwalls 49
9. Miscellaneous Details 51
9.1. Type 10 bridge rail curb shell 51
viii
9.2. Type 7 bridge rail shell 51
9.3. TL5 pier protection 51
10. Proposed Standard Bridge Drawings 52
10.1. Description and goals 52
10.2. General notes and summary of quantities* 52
10.3. General layout* 52
10.4. Engineering geology* 52
10.5. Construction layout* 53
10.6. Footing and piling layout* 53
10.7. Prefabricated parts list and stick figure 53
10.8. Girder standard sheets 54
10.9. Miscellaneous details related to the girders 54
10.10. Prefabricated pier shafts detail sheets 55
10.11. Precast pier caps 55
10.12. Spread foundation support at abutments 55
10.13. Wingwalls 56
10.14. Precast approach slabs 56
10.15. Backfill details 56
10.16. Aesthetic enhancement details* 56
10.17. Slope protection details* 56
10.18. Expansion joints at approach slabs* 56
10.19. Bridge rails* 57
10.20. Fences attached to bridge rails* 57
10.21. Geometry sheets 57
11. Recommendations 58
12. Glossary 61
13. References 68
Appendix A. Tabulation of Girder Analysis 73
Tables
Table 4-1 CDOT on-system bridges by deck area (square feet) 10
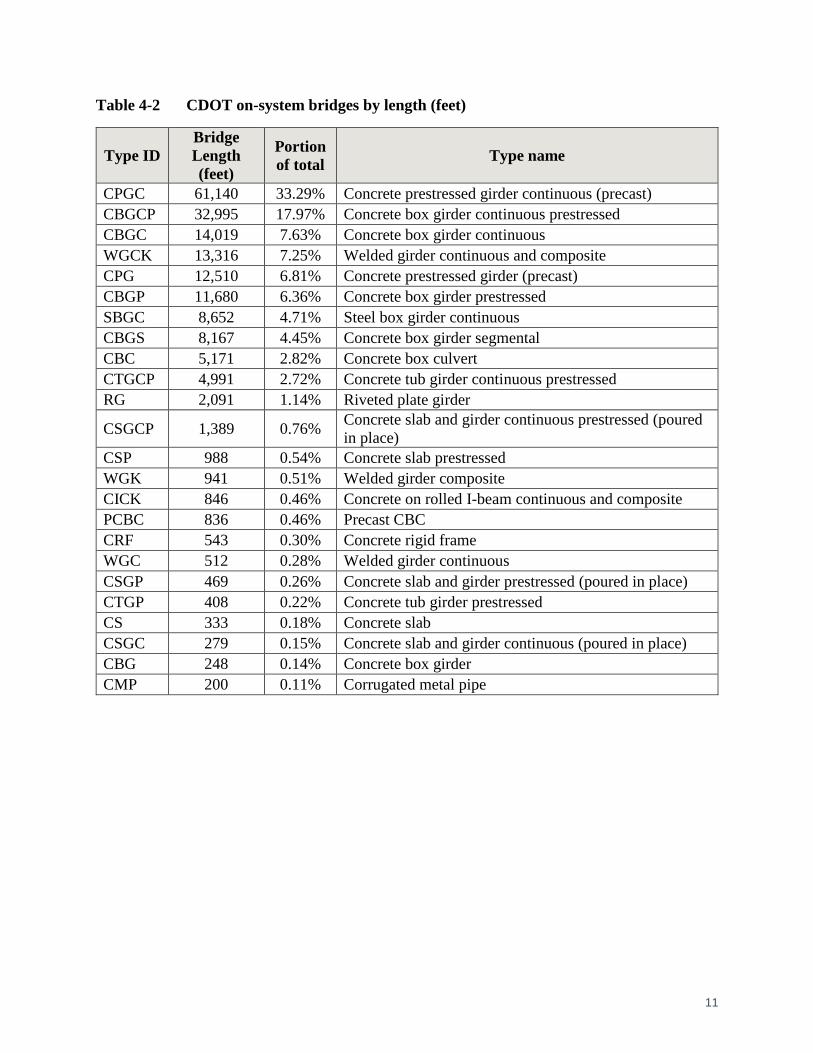
Table 4-2 CDOT on-system bridges by length (feet) 11
Table 4-3 CDOT on-system bridges by number of spans 12
Table 4-4 CDOT on-system bridges by number per structure type 13
Table 4-5 CDOT on-system bridges by width of structure 14
Table 4-6 CDOT on-system bridges by skew angle 14
Table 4-7 CDOT on-system bridge groups targeted for standardization (21 year data) 15
Table 4-8 Expected average yearly CDOT on-system bridge construction study data 15
Table 7-1 Estimated yearly CDOT on-system standard bridge construction 38
Table 7-2 Estimated maximum design cost savings per year 40
Table 7-3 Estimated superstructure standard implementation costs 42
ix
Table 7-4 Estimated time to recoup implementation costs 43
Figures
Figure 6-1 Decked Slab Girder 28
Figure 6-2 Decked U Girder: top widths 15 feet 0 inch, 9 feet 10 inches, or 7 feet 3 inches 28
Figure 6-3 Decked BT Girder: top widths 9 feet 10 inches, 7 feet 3 inches, or 4 feet 8 inches 29
Figure 6-4 Decked NExt Girder: top widths 15 feet 0 inch, 9 feet 10 inches, or 7 feet 3 inches29
Figure 6-5 Decked U Girder with stretcher slab 30
Figure 6-6 Simple span capability versus merit cost for precast prestressed concrete decked
sections 31
Figure 6-7 Interior span capability versus merit cost for precast prestressed concrete decked
sections 32
Figure 6-8 Exterior span capability versus merit cost for precast prestressed concrete decked
sections 33
Figure 8-1 Elevation – recommended pier or abutment standard precise cap detail 48
Figure 8-2 Section – recommended pier standard precast cap detail 48

1
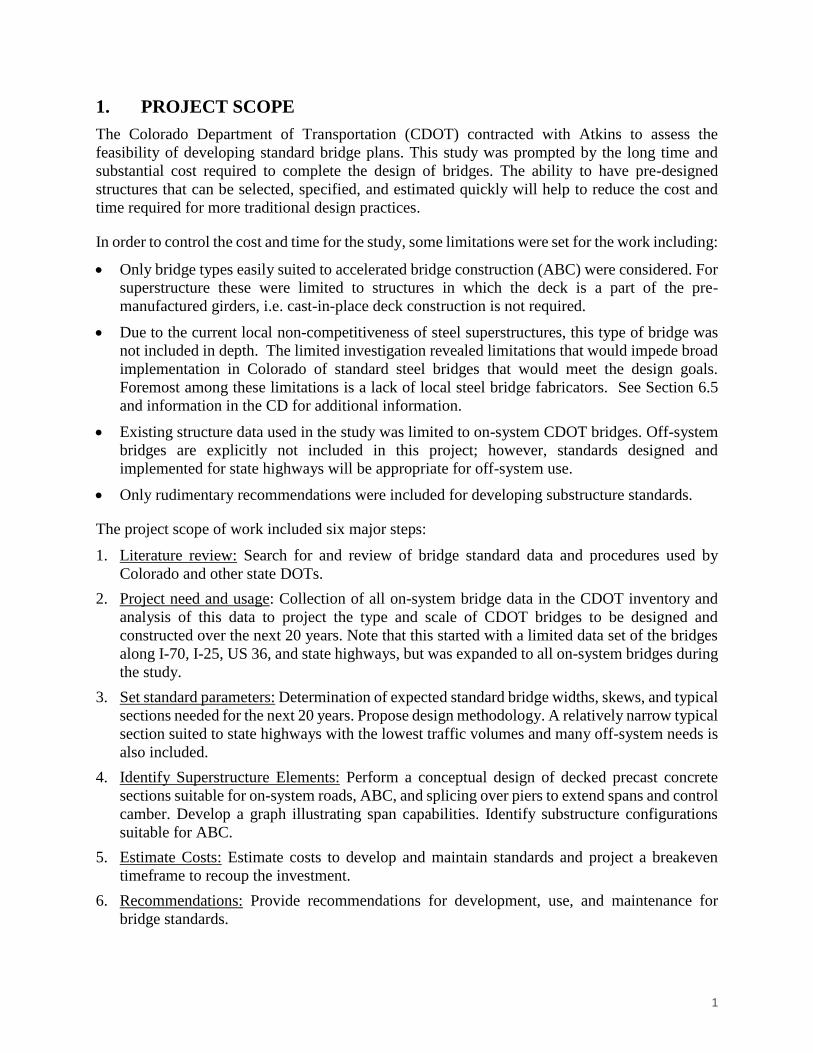
1. PROJECT SCOPE
The Colorado Department of Transportation (CDOT) contracted with Atkins to assess the
feasibility of developing standard bridge plans. This study was prompted by the long time and
substantial cost required to complete the design of bridges. The ability to have pre-designed
structures that can be selected, specified, and estimated quickly will help to reduce the cost and
time required for more traditional design practices.
In order to control the cost and time for the study, some limitations were set for the work including:
Only bridge types easily suited to accelerated bridge construction (ABC) were considered. For
superstructure these were limited to structures in which the deck is a part of the pre-
manufactured girders, i.e. cast-in-place deck construction is not required.
Due to the current local non-competitiveness of steel superstructures, this type of bridge was
not included in depth. The limited investigation revealed limitations that would impede broad
implementation in Colorado of standard steel bridges that would meet the design goals.
Foremost among these limitations is a lack of local steel bridge fabricators. See Section 6.5
and information in the CD for additional information.
Existing structure data used in the study was limited to on-system CDOT bridges. Off-system
bridges are explicitly not included in this project; however, standards designed and
implemented for state highways will be appropriate for off-system use.
Only rudimentary recommendations were included for developing substructure standards.
The project scope of work included six major steps:
1. Literature review: Search for and review of bridge standard data and procedures used by
Colorado and other state DOTs.
2. Project need and usage: Collection of all on-system bridge data in the CDOT inventory and
analysis of this data to project the type and scale of CDOT bridges to be designed and
constructed over the next 20 years. Note that this started with a limited data set of the bridges
along I-70, I-25, US 36, and state highways, but was expanded to all on-system bridges during
the study.
3. Set standard parameters: Determination of expected standard bridge widths, skews, and typical
sections needed for the next 20 years. Propose design methodology. A relatively narrow typical
section suited to state highways with the lowest traffic volumes and many off-system needs is
also included.
4. Identify Superstructure Elements: Perform a conceptual design of decked precast concrete
sections suitable for on-system roads, ABC, and splicing over piers to extend spans and control
camber. Develop a graph illustrating span capabilities. Identify substructure configurations
suitable for ABC.
5. Estimate Costs: Estimate costs to develop and maintain standards and project a breakeven
timeframe to recoup the investment.
6. Recommendations: Provide recommendations for development, use, and maintenance for
bridge standards.
2
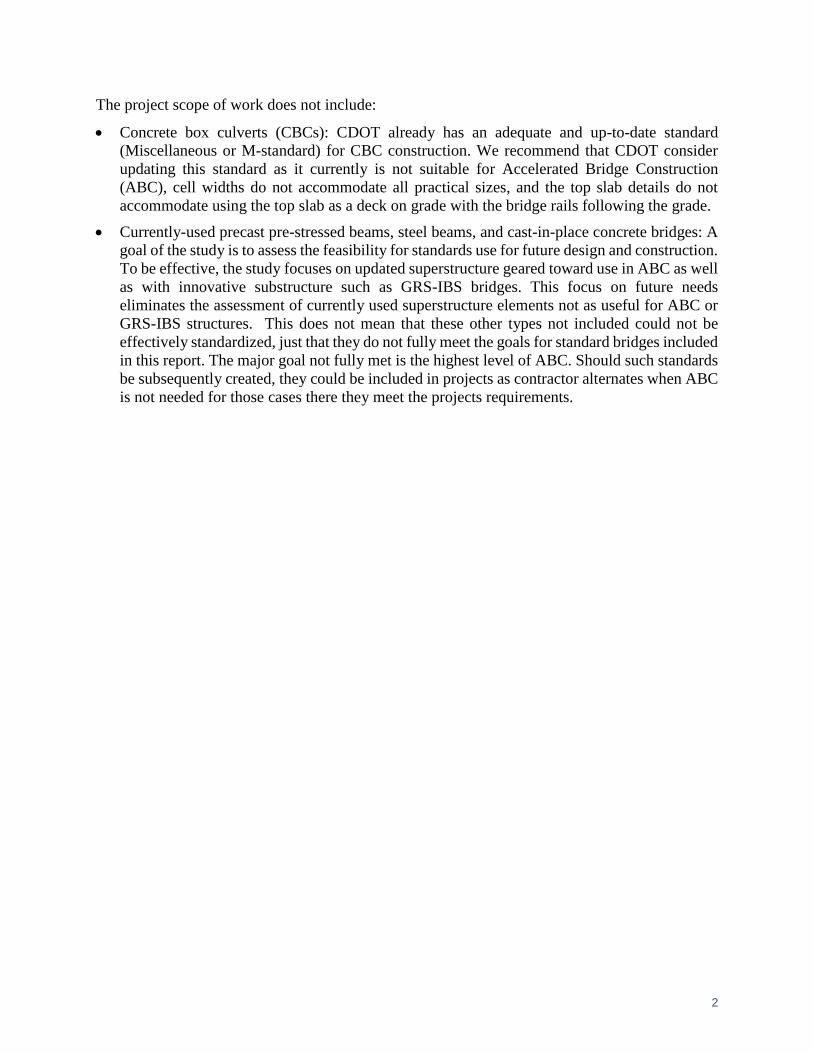
The project scope of work does not include:
Concrete box culverts (CBCs): CDOT already has an adequate and up-to-date standard
(Miscellaneous or M-standard) for CBC construction. We recommend that CDOT consider
updating this standard as it currently is not suitable for Accelerated Bridge Construction
(ABC), cell widths do not accommodate all practical sizes, and the top slab details do not
accommodate using the top slab as a deck on grade with the bridge rails following the grade.
Currently-used precast pre-stressed beams, steel beams, and cast-in-place concrete bridges: A
goal of the study is to assess the feasibility for standards use for future design and construction.
To be effective, the study focuses on updated superstructure geared toward use in ABC as well
as with innovative substructure such as GRS-IBS bridges. This focus on future needs
eliminates the assessment of currently used superstructure elements not as useful for ABC or
GRS-IBS structures. This does not mean that these other types not included could not be
effectively standardized, just that they do not fully meet the goals for standard bridges included
in this report. The major goal not fully met is the highest level of ABC. Should such standards
be subsequently created, they could be included in projects as contractor alternates when ABC
is not needed for those cases there they meet the projects requirements.

3
2. CDOT STANDARD PLAN HISTORY
The Colorado DOT currently has M-Standards (Colorado Miscellaneous Standard Plans) for
culverts, bridge worksheets for various bridge elements, and design aids in the CDOT Bridge
Design Manual. These tools have been used quite successfully, but have not been fully developed
and are outdated for design code changes and practice. The worksheets include a large selection
of precast girder types, bridge rails, joint details, bearing details (excluding integral details),
approach slabs, and some precast stay-in-place deck forms. There is little standard detailing
information available for decks (except the precast deck forms), framing plans, steel girders,
wingwalls, piers, and abutments, although there is an integral CIP concrete abutment detail and
guidelines in the CDOT Bridge Design Manual that have been followed as a standard for some
time. In the 1930’s CDOT developed standard plans for truss superstructures and timber bridge
spans that were very heavily used during the highway building program of the 1930’s, but these
structure types gradually became obsolete as more modern bridge types were developed.
In the late 1950’s and early 1960’s, during the early days of the interstate highway design program,
a large number of CDOT bridges were not detailed separately, but used modified plans from
similar bridges. The similar bridge plans were copied and archived and then the dimensions and
reinforcing information changed directly on the original drawing, effectively reusing it. This
method was effective, but required a stock of recent similar original plans that covered a significant
portion of the types, spans, and substructure arrangements being used. Even then, these projects
still required work to select the appropriate original plan set to change and to design the needed
changes. This process would be difficult to repeat now due to rapidly changing codes and CAD
programs. Circumstances also make it difficult to find a current bridge design similar enough to
re-use. While this practice of modifying served its purpose at the time, it did provide CDOT a basic
understanding that standardization could be beneficial.
CDOT’s next attempt at standard bridges occurred in the 1980’s when CDOT developed standard
plans for precast twin-tee superstructures. These bridges were only suitable for lightly trafficked
roads without heavy truck traffic or de-icing use and were used mostly by counties. Eventually
CDOT transferred responsibility for non-state highways to cities, towns, counties, and
municipalities, absolving their design responsibility for these off-system facilities. Because of this
transfer of responsibility, CDOT no longer maintained or upgraded these standards. This is
indicative of one of the issues with this kind of standardization; to be effective over the long term,
standardization needs a broad applicability, often achieved with a degree of conservatism by
creating a structure to meet the most stringent needs when something simpler or less robust would
suffice. Fortunately, this can have compensating advantages in reduced maintenance, delayed
obsolescence, and a longer structure life in the face of changing use. Also, any standards created
need to be maintained to reflect changing codes, exposed deficiencies, improved presentation, and
extended applicability.
In the early 1990’s, CDOT initiated a bottom-up effort to automate detailing to take advantage of
CAD to speed production. This advanced to the point of automating the detailing and some of the
design of integral abutments and their wingwalls, which is a considerable part of the detailing
effort on a bridge. This automation effort failed principally for two reasons:
1. The constant changing of the CAD program (AutoCad) it was based on, and
4
2. The cost of training, documentation, and coordination with design consultants that would have
been required.
These two factors made the cost of automated detailing more than the savings that could be
produced.
In 2005, CDOT undertook an effort to create an automated bridge-detailing system using software
from CEC Engineering of Columbus Ohio. The software seemed to be effective at producing
drawings, but was not integrated with any design programs, and required considerable effort to
provide required input data. CDOT estimated that it might save 30 percent on plan production time
when an inexperienced CAD detailer was used, but there would be little savings with a more
experienced detailer. Ultimately, the automation effort ended without producing any production
plans and was terminated when CDOT changed their CAD platform to MicroStation; CEC’s
software only worked with AutoCAD.
For a computer aided design and detailing (CADD) program for bridges, the relationship between
the programming and program maintenance effort and the benefit might shift if detailing standards
(fonts, sheet borders, dimensioning standards, layering, line color and width, etc.) and the types of
structures and details were standardized nationally rather than State by State or organization by
organization.
M-Standard culverts existed in one form or another as one, two, or three span units starting in the
1930’s. In the late 1970’s and early 1980’s there was an effort to update the design based on rigid
frame action and the then-new AASHTO Load Factor Design code method, but a code change
made the software obsolete. It was only recently that the culvert M-standards were finally updated
to the LRFD code. In the interim, there were some changes to better accommodate skew and to
reduce the scour vulnerability of wingwalls.
Worksheets grew from the plan copying efforts of the 1960’s. Commonly used details were placed
on separate sheets that could be reproduced and used or altered as needed. Since that time if the
details needed for plan sheets had been used repeatedly, or it was anticipated that they might be
used repeatedly and detailed so that little customization would be needed, then the details were
prepared as a worksheet. Some of the worksheets developed failed to see repeated use. Generally
worksheets created as part of an actual project design achieved continued reuse, probably because
actual project needs shaped what was designed and how it was presented, and also because the
details were thoroughly checked. Most often, a worksheet was created for the second use of a
detail, when it was clear from the first use that the detail was useful and the worksheet could save
effort. The first effort shaped what the detail needed to be, and the second how to develop the
worksheet so as not to require significant effort to use it in differing structures.
There has been little effort to transform bridge design worksheets into M-standards, as there has
not been a shift from seeing these worksheets as “a detail that can be used” to “a detail that should,
when possible, always be used.” Details that approach the level of confidence that they do not need
to be constantly evaluated for the impact of code changes and applicability in different situations,
are rare, but perhaps include bridge rails, fences, and stay in place concrete deck forms.

5
3. BRIDGE STANDARD USAGE BY OTHER STATES
In December 2013 and January 2014, an internet search for DOT standard plans was completed
along with later discussions with several state bridge engineers. Not all DOTs have standards
available on their websites or in the public domain so a complete review of all state materials was
not possible. This discussion focuses on the DOT standards that are most relevant to this study.
Additional information studied is included in the attached CD.
Standard plans are fully designed and detailed and only need plan sheet assembly to make a
completed design package. Standard details are fully designed and detailed pieces and parts for
bridges that are included in an assembly of bridge plans, but other manually generated sheets are
needed to make a complete plan set. Worksheets are highly detailed plan sheets that convey desired
details but do not have completed designs or details. These sheets require an engineering design
and often require data to be entered to complete the sheet.
Most US states have standard details such as joints, rails, and precast girders. Even those states
with fairly complete standard drawings generally do not have standard drawings for quantity
summaries, general layouts, foundation plans, geology information, construction layouts,
hydraulics information, and geometry information. Note that very little information was available
for agencies outside the US.
3.1. Complete standard plan or standard bridge detail sets
Complete standard plans sets are fully designed and detailed and ready for construction with
design, layout, or modification. Few states or provinces had complete sets of bridge standard plans;
the following states and provinces have complete standard plans sets:
Alberta, Canada
Alberta has standards for slab bridges only.
Iowa
The Iowa DOT has standards for slab bridges, rolled beam bridges, and precast concrete beam
bridges in three-span configuration for 24-foot, 30-foot, 40-foot, and 44-foot curb-to-curb widths.
Some of these standards cover incremental skews from 0 degrees to 45 degrees. Most of these
bridges are integral. Stainless or epoxy-coated reinforcement can be selected depending upon the
level of durability desired. There are around 1,200 sheets of standard plan pages.
Kansas
The Kansas DOT has standards for haunched post-tensioned CIP concrete slab bridges for 28-foot,
32-foot, 36-foot, 40-foot, and 44-foot roadway widths, and up to 30-degree skews. These standards
are three-span continuous bridges in four incremental lengths from 165 feet (50 feet by 65 feet by
50 feet) to 234 feet (71 feet by 92 feet by 71 feet). Not all span-length combinations are available
yet. A manual is available describing the system, limits, and how to assemble the plans. The system
is not useful for ABC and requires considerable falsework.
Haunching of the slabs may slightly limit future functionality of the outer parts of the spans where
clearances are critical. Since the standards are cast-in-place construction, they can accommodate
significant vertical curve and superelevation variations as well as modest curvature, though details

6
may require adjustment. The spans covered in the standards must be used for layout otherwise, a
full design and detail revisions will be needed.
These standards, while efficient for the shorter spans lengths, are eclipsed by precast prestressed
concrete sections such as decked BT or decked U girders (described later in this report). Even the
shorter CIP span lengths can be replaced by precast prestressed concrete slabs made continuous
for live load at the piers.
Ohio
The Ohio DOT does not have any standard bridge plans at this time but has a very complete set of
standard details (except for deck slabs or piers for non-slab structures). The Ohio DOT also has
standard plans for box culverts. Research indicated that local agencies other than the DOT may be
using the firm CEC Engineering for automated detailing of smaller bridges, but DOT CAD
standards are now in MicroStation while the CEC Engineering program and scripts only work with
AutoCAD.
Oklahoma
The Oklahoma DOT has standard details for many girder sections and bridge elements and
includes guide drawings to help show the designer or detailer how to assemble bridge plans from
these standard details. There are no foundation or column standard details. Skew is not addressed
on most of the details.
Pennsylvania
The Pennsylvania DOT has standard details for many girder sections and bridge elements. It also
has BRADD, an integrated bridge design and detailing software package. BRADD is currently
limited to only simple span structures, but the state did recently upgrade the package for integral
construction. The Pennsylvania DOT recently mandated that BRADD be used for all possible
structures.
Texas
The Texas DOT has standard details for precast prestressed concrete I-girder bridges with 24-foot,
26-foot, 30-foot, 38-foot, and 44-foot roadway widths; 0, 15, 30, and 45-degree skews; and spans
from 40 feet to 125 feet.
The Texas DOT also has standard details for decked slab bridges with 24-foot roadway width; 0,
15, and 30-degree skews; and spans from 30 feet to 60 feet. These decked slab bridge structures
have discrete connectors between slab girders and therefore are not waterproof. Other states with
a similar connection detail prohibit its use under heavy truck traffic due to fatigue in connectors
and asphalt deterioration at the joint between girders. The Texas DOT only uses the decked-slab
bridge on 24-foot wide roads with low traffic volume and its warm climate and lack of de-icer use
slows down the deterioration. For sketches of these connection details see pg. 98 of NCHRP
Project 12-69, “Guidelines for Design and Construction of Decked Precast, Prestressed Concrete
Girder Bridges”, July 30, 2009. These decked slab bridge structures depend on asphalt to achieve
road surface profile and cross slope.
In addition, Texas DOT has standard details for many structure elements, especially girder types,
that, when assembled with supplementary details, can form a large part of a bridge’s plan set.

7
Harris County, Texas has standards based on Texas DOT slab sections and decked box sections
that can be assembled into bridge plan sets. These standard plans are for spans from less than 35
feet to 110 feet in length and cover 0 and 30-degree skews. They require the bridge layout,
foundation plan, and framing plan to be completed by the designer, but the remainder of the plan
set is standard sheets. The deck connections have robust full-length keys and appear to be suited
to higher levels of traffic and more leak resistant than the Texas DOT deck slab connections. They
will not emulate cast-in-place construction so they will not be waterproof. The prestressing data is
not pre-designed in these standards and must be added by the designer. The standards
accommodate drilled-shaft or pile foundations.
About 20 percent of Texas DOT bridges built per year use standard plans. This is a large number
of bridges per year due to the size of their program. The authors of this report believe the
percentage of bridges build using standard plans in Colorado could be considerably higher than
this with greater flexibility on the span lengths, number of spans, span ratios, skews, and bridge
widths.
Wisconsin
The Wisconsin DOT (WisDOT) does not have any standard bridge designs at this time but does
have a very complete set of standard details. Research indicated that Wisconsin is working on
improving its automated design and detailing for precast concrete and steel bridges using their
standard details as a framework.
WisDOT personnel have written and maintained almost all of their design and detailing software
(except for RC pier) over a period of 20 years. It is used internally, but not by design consultants,
for most of WisDOT’s bridge plan production,. Since developing this software, WisDOT has seen
an annual reduction in plan preparation costs of around $2,000,000. The software does not fully
complete General Layout, Engineering Geology, and Hydraulics sheets; these sheets need
additional manual work by detailers to complete. The bridge geometry program calculates and
provides critical elevation information. The current focus is on 3D design and modelling with
automated plan production, with the 3D data shared with contractors (software called BRIM). The
WisDOT does not follow a stringent schedule for updating the software.
The Wisconsin State Bridge Engineer, who has been chair of the AASHTO T-19e computer
technology committee, suggested that state DOTs considering automated plan generation should
start with 3D capability or accommodate future upgrades to 3D with their software choices.
3.2. Less-complete standard plan or detail sets
Alabama
The Alabama DOT does not have any standard bridge plans at this time but does have standard
details for superstructure precast-concrete girder spans, excluding piers and abutments.
Idaho
The Idaho Transportation Department (ITD) does not have any standard bridge designs at this
time. ITD does have worksheets for decked girders for accelerated bridge construction (ABC), but
no substructure standard details.

8
Massachusetts
The Massachusetts DOT does not have standard bridge plans, but recently completed several
sections of its Bridge Design Manual, which includes many typical details, including those for
ABC. These details are available in MicroStation format and can be pasted into drawings as they
are produced. Another section of the manual is planned for completion soon.
Rhode Island
The Rhode Island DOT does not have any standard bridge designs at this time, but it does have
worksheets for most bridge elements (including piers and abutments) that require design data to
be filled in by the designer.
Utah
The Utah DOT does not have any standard bridge designs at this time, but it has worksheets for
bridge elements geared to ABC such as precast prestressed-concrete decked girders, precast
concrete piers, precast concrete approach slabs, etc.
West Virginia
The West Virginia DOT does not have any standard bridge designs at this time, but it does have a
very complete set of standard details. The DOT also has worksheets for glulam bridges that require
layout and girder size dimensions to be filled in.
9
4. DEVELOPMENT OF DATA SET USING CDOT ON-SYSTEM
BRIDGE CHARACTERISTICS FOR BRIDGES CONSTRUCTED IN THE
LAST 21 YEARS (1993-2013)
A twenty-one year history of CDOT’s on-system bridge inventory was defined to help project
future bridge design needs, costs, and type. Data was retrieved in early 2014 from the CDOT
PONTIS database with the help of CDOT staff; the PONTIS data was not verified for accuracy.
Some variability in coding and accuracy of the data was noticed but was deemed too small to affect
the overall utility to the study and was assumed not to have a significant effect on the study
conclusions and recommendations.
This section summaries and categorizes this data into bridge groupings for study use and only
includes on-system bridges. Note that it was not possible to summarize the number of spans by
length for this study using the PONTIS because, for multi-span bridges, only the maximum span
length is recorded.
4.1. Summary information
Total number of on-system bridges constructed = 748
Replacements = 333
Grade separations = 257
Total spans = 1,905
Total area = 11,401,530 square feet
Total length = 183,658 linear feet, 34.8 miles
Shortest major structure = 14 feet
Longest major structure = 6,396 feet
Structures greater than 800 feet long = 32 (five years had no structures constructed greater than
800 feet long)
Longest span = 447 feet (this may be a coding error; if so the longest span is 379 feet) (nine
years had no spans constructed greater than 200 feet)
Average span = 96.4 feet
Widest bridge = 716 feet wide out to out
Narrowest bridge = 24 feet wide out to out
Average width = 62 feet wide out to out
4.2. Detailed categorization of 21 year data
The following tables (Table 4-1 through Table 4-6) summarize the 21-Year PONTIS data into
categories that illustrate the size and details of the CDOT bridge construction history.

10
Table 4-1 CDOT on-system bridges by deck area (square feet)
Type ID
Deck Area
(square
feet)
Portion
of total Type name
CPGC 4,033,478 42.43% Concrete prestressed girder continuous (precast)
CBGC 948,982 9.98% Concrete box girder continuous
CBGP 912,838 9.60% Concrete box girder prestressed
CPG 752,626 7.92% Concrete prestressed girder (precast)
WGCK 602,424 6.34% Welded girder continuous and composite
SBGC 443,211 4.66% Steel box girder continuous
CBC 411,661 4.33% Concrete box culvert
CBGS 333,887 3.51% Concrete box girder segmental
CTGCP 228,163 2.40% Concrete tub girder continuous prestressed
CBGCP 210,832 2.22% Concrete box girder continuous prestressed
RG 87,258 0.92% Riveted plate girder
CSGCP 70,018 0.74% Concrete slab and girder continuous prestressed (poured
in place)
CSP 67,715 0.71% Concrete slab prestressed
PCBC 60,120 0.63% Precast CBC
CSGP 43,604 0.46% Concrete slab and girder prestressed (poured in place)
CICK 40,385 0.42% Concrete on rolled I-beam continuous and composite
WGC 39,977 0.42% Welded girder continuous
WGK 34,803 0.37% Welded girder composite
CRF 27,178 0.29% Concrete rigid frame
CBG 21,759 0.23% Concrete box girder
CTGP 21,048 0.22% Concrete tub girder prestressed
CS 17,223 0.18% Concrete slab
CMP 16,354 0.17% Corrugated metal pipe
CSCP 12,674 0.13% Concrete slab continuous prestressed
CIK 11,631 0.12% Concrete on rolled I-beam composite
CSC 11,392 0.12% Concrete slab continuous
RCPC 11,375 0.12% Reinforced concrete pipe culvert
11
Table 4-2 CDOT on-system bridges by length (feet)
Type ID
Bridge
Length
(feet)
Portion
of total Type name
CPGC 61,140 33.29% Concrete prestressed girder continuous (precast)
CBGCP 32,995 17.97% Concrete box girder continuous prestressed
CBGC 14,019 7.63% Concrete box girder continuous
WGCK 13,316 7.25% Welded girder continuous and composite
CPG 12,510 6.81% Concrete prestressed girder (precast)
CBGP 11,680 6.36% Concrete box girder prestressed
SBGC 8,652 4.71% Steel box girder continuous
CBGS 8,167 4.45% Concrete box girder segmental
CBC 5,171 2.82% Concrete box culvert
CTGCP 4,991 2.72% Concrete tub girder continuous prestressed
RG 2,091 1.14% Riveted plate girder
CSGCP 1,389 0.76% Concrete slab and girder continuous prestressed (poured
in place)
CSP 988 0.54% Concrete slab prestressed
WGK 941 0.51% Welded girder composite
CICK 846 0.46% Concrete on rolled I-beam continuous and composite
PCBC 836 0.46% Precast CBC
CRF 543 0.30% Concrete rigid frame
WGC 512 0.28% Welded girder continuous
CSGP 469 0.26% Concrete slab and girder prestressed (poured in place)
CTGP 408 0.22% Concrete tub girder prestressed
CS 333 0.18% Concrete slab
CSGC 279 0.15% Concrete slab and girder continuous (poured in place)
CBG 248 0.14% Concrete box girder
CMP 200 0.11% Corrugated metal pipe

12
Table 4-3 CDOT on-system bridges by number of spans
Type ID No. of
Spans
Portion
of total Type name
CPGC 560 29.40% Concrete prestressed girder continuous (precast)
CBC 282 14.80% Concrete box culvert
CBGCP 267 14.02% Concrete box girder continuous prestressed
CBGC 136 7.14% Concrete box girder continuous
CBGP 113 5.93% Concrete box girder prestressed
CPG 110 5.77% Concrete prestressed girder (precast)
WGCK 90 4.72% Welded girder continuous and composite
SBGC 53 2.78% Steel box girder continuous
PCBC 52 2.73% Precast CBC
CBGS 43 2.26% Concrete box girder segmental
CTGCP 33 1.73% Concrete tub girder continuous prestressed
CMP 29 1.52% Corrugated metal pipe
CSGCP 17 0.89% Concrete slab and girder continuous prestressed (poured in
place)
RG 15 0.79% Riveted plate girder
CSP 14 0.73% Concrete slab prestressed
CICK 13 0.68% Concrete on rolled I-beam continuous and composite
CRF 13 0.68% Concrete rigid frame
RCPC 9 0.47% Reinforced concrete pipe culvert
CS 8 0.42% Concrete slab
CSGP 7 0.37% Concrete slab and girder prestressed (poured in place)
WGK 6 0.31% Welded girder composite
WGC 5 0.26% Welded girder continuous
CBG 4 0.21% Concrete box girder
CSGC 4 0.21% Concrete slab and girder continuous (poured in place)
CI 4 0.21% Concrete on rolled I-beam
CTGP 3 0.16% Concrete tub girder prestressed
CSCP 3 0.16% Concrete slab continuous prestressed
CSC 3 0.16% Concrete slab continuous
SAC 3 0.16% Steel arch culvert
CIK 2 0.10% Concrete on rolled I-beam composite

13
Table 4-4 CDOT on-system bridges by number per structure type
Type ID No. of
Structures
Portion
of total Type name
CPGC 185 32.98% Concrete prestressed girder continuous (precast)
CBC 116 20.68% Concrete box culvert
CPG 96 17.11% Concrete prestressed girder (precast)
CBGP 85 15.15% Concrete box girder prestressed
CBGCP 73 13.01% Concrete box girder continuous prestressed
CBGC 47 8.38% Concrete box girder continuous
WGCK 23 4.10% Welded girder continuous and composite
PCBC 23 4.10% Precast CBC
SBGC 16 2.85% Steel box girder continuous
CSP 9 1.60% Concrete slab prestressed
CRF 9 1.60% Concrete rigid frame
CSGCP 7 1.25% Concrete slab and girder continuous prestressed (poured in
place)
WGK 6 1.07% Welded girder composite
CS 5 0.89% Concrete slab
CMP 5 0.89% Corrugated metal pipe
CTGCP 4 0.71% Concrete tub girder continuous prestressed
CBG 4 0.71% Concrete box girder
CBGS 3 0.53% Concrete box girder segmental
CSGP 3 0.53% Concrete slab and girder prestressed (poured in place)
CICK 3 0.53% Concrete on rolled I-beam continuous and composite
CTGP 3 0.53% Concrete tub girder prestressed
SAC 3 0.53% Steel arch culvert
RG 2 0.36% Riveted plate girder
WGC 2 0.36% Welded girder continuous
CSCP 2 0.36% Concrete slab continuous prestressed
CIK 2 0.36% Concrete on rolled I-beam composite
RCPC 2 0.36% Reinforced concrete pipe culvert
CI 2 0.36% Concrete on rolled I-beam
CSC 1 0.18% Concrete slab continuous
CSGC 1 0.18% Concrete slab and girder continuous (poured in place)
WG 1 0.18% Welded girder
SBG 1 0.18% Steel box girder
CDTPG 1 0.18% Concrete double-tee prestressed girder
CAC 1 0.18% Concrete arch culvert

14
Table 4-5 CDOT on-system bridges by width of structure
Width (feet) Number of
structures
Number of
spans
Total length
(feet)
Total area
(square feet)
0-16 13 22 431 0
16-32 36 106 12,671 375,378
32-47 271 734 82,787 3,402,324
47-63 212 289 30,102 1,666,074
63-78 87 197 16,415 1,164,258
78-94 73 177 13,615 1,173,479
94-109 46 126 8,052 792,188
109-125 33 72 6,455 760,058
125-140 27 66 5,652 746,772
140-156 16 36 2,695 394,336
156-171 11 24 1,413 230,461
171<< 21 56 3,367 697,013
Table 4-6 CDOT on-system bridges by skew angle
Skew angle
(degrees)
Number of
structures
Number of
spans
Total length
(feet)
Total area
(square feet)
0-7 (0) 361 948 92,518 5,361,936
8-22 (15) 125 260 24,055 1,808,261
23-37 (30) 113 281 22,508 1,512,798
38-52 (45) 86 212 18,930 1,255,332
53-67 (60) 30 68 6,958 409,873
>67 3 5 449 21,170
Varies 29 132 18,389 1,041,987
4.3. Conclusions
The following tables break down the structures by span ranges appropriate for the three
recommended types and by skew and maximum span to help in determining the likely use of each
recommended type and degree of skew, and thereby the cost/benefit of various levels or stages of
implementation. This only includes structures suitable for standard bridges, i.e. structures less than
800 feet long, greater than 20 feet long, skew less than 50 degrees, less than 78-foot width, and
greater than 16-foot width.
The PONTIS data categorization was used to determine characteristics of constructed CDOT
bridges to identify expected bridge needs by span and define groups of bridges appropriate for
future standard development and use. Table 4-7 summarizes the bridge group data segregated by
span length and skew angle. To refine the data further, two groupings of skew angle were chosen.
The groups chosen are expected to have the highest probability of standardization; they provide
convenient groupings for developing standard structure elements.

15
Table 4-7 CDOT on-system bridge groups targeted for standardization (21 year data)
Group Max. span
length (feet)
Skew angle
(Degrees)
Total No. of
Spans
Total Length
(feet)
Total Area
(square feet)
Short
Spans 0*-65
0-25 192 5,062 254,252
26-50 37 1,066 51,741
Medium
Spans 66-146
0-25 414 42,413 2,106,292
26-50 193 18,865 891,154
Long
Spans 147-199
0-25 74 11,535 517,337
26-50 37 5,599 28,222
21 YEAR TOTAL 947 84,540 3,849,000
*Single spans less than 20 feet are considered minor structures and are typically concrete box
culverts. While the study still considers these bridges in the group data, development of
superstructure sections has been limited to spans greater than 20 feet in length.
Note that only 42 bridges have span lengths greater than 199 feet. Structures with this length span
are usually difficult to standardize, so bridges with these span lengths are not considered for
standardization.
Future annual construction numbers for CDOT on-system bridges are assumed to follow the same
pattern as the 21-year data period. These projections will be used to determine feasible standard
bridge sections and estimate the costs to develop, implement, and maintain them. Table 4-8
summarizes the expected average yearly bridge construction needs and defines the bridge data
used to complete the study.
Table 4-8 Expected average yearly CDOT on-system bridge construction study data
Group Max. span length
(feet)
Skew angle
(Degrees)
Total Deck Area (square
feet)
Short Spans 0*-65 0-25 12,107
26-50 2,464
Medium Spans 66-146 0-25 100,300
26-50 42,436
Long Spans 147-199 0-25 24,635
26-50 1,344
ANNUAL TOTAL 183,286
Bridge types developed and studied
Precast prestressed concrete structures were chosen as the focus for developing structure types and
standard plans. Most bridge structures built by CDOT are precast prestressed concrete, which is
greatly influenced by the robust precast industry in Denver and the lack of major steel bridge
fabricators in Colorado. While cast-in-place concrete structures may be economical in certain
situations, their use is currently uncommon and frequently difficult to implement due to major
impacts to road clearances or rivers due to the falsework required to construct them.

16
Bridge widths studied
Most structures have widths between 32 feet and 94 feet, though structures much wider also are
built. For the purposes of this report, some of these may simply be categorized in a fashion that is
not helpful as the road may be much narrower.
Since it is impractical to analyze an infinite number of girder spacings to include in a pre-designed
standard, a discrete number of spacings are necessary to make a standard. Similarly, a pre-designed
standard cannot accommodate an indefinite number of bridge widths, and the widths are related to
the girder spacing. A desire to accommodate the fastest type of ABC is one of the factors driving
this report. Fast normally means very few pieces and stages of construction. This indicates that
pre-decked construction should be accommodated, and that the widest practical widths should be
used.
Several states use 16 feet as a maximum shipping width for precast sections as wider sections
disrupt traffic too much. We have adopted this limit as well, and it is at the core of the section and
bridge widths investigated. Predecked sections with overlapping loop connections between
girders, with the loops lapping 6 inches, will have a 15.5-foot width module. This is what was
chosen. Girder spacing widths were chosen to be a modular fit to the maximum width selected. To
allow interior and exterior girders to be identical, exterior girders to be symmetrical, and allow for
loops at the outside of exterior girders to facilitate future widening, the bridge width needs to be
12 inches wider than the module so that cast-in-place concrete can cover the loops.
Standard structure widths are expected to be 32 feet, 47.5 feet, 63 feet, 78.5 feet, and 94 feet with
total live loads of 2 lanes, 2.55 lanes, 3.25 lanes, 3.9 lanes, and 4.55 lanes after adjustment for the
number of lanes and multi-presence factor. Note the total live load, per code, is spread among all
the girders for purposes of live-load deflection limits. Therefore, wider bridges have progressively
less live-load deflection per unit width or per girder than narrower ones.

17
5. RECOMMENDED CRITERIA FOR STANDARD BRIDGES
The use and benefit of standard bridge plans is enhanced by carefully planning their use for current
and expected future practices and needs. Perhaps most important is to ensure that the standards
cover enough situations to achieve a high usage. Nearly as important is making the standards
compatible with upcoming technology and practices, such as accelerated bridge construction, to
ensure the standards have a long useful life. The development of new standard bridge sections will
also require assessment of the applicability of current design practices and perhaps some changes
to these practices
5.1. Goals to achieve maximum benefit
Four major goals were defined as important to achieve maximum bridge standard usage and life:
A. wide applicability,
B. durability,
C. flexibility for construction, and
D. low maintenance.
5.1.1 Wide applicability
First and foremost, the standards must be applicable to a substantial portion of new bridges
designed and built. This wide applicability can be achieved by:
including a broad range of span and deck width capabilities; capability for longer spans in
particular reduces cost of substructure,
using superstructures as shallow as practical; this also helps limit approach heights, approach
changes, and improves vertical clearance,
including capability for modest to moderate skews,
including capability for modest roadway curve, though not necessarily by curving the deck or
girders,
ensuring standards are understandable/usable by contractors and engineers,
ensuring contractors and engineers can make any needed modifications or variations to
ancillary features, such as backwalls, diaphragms, forming, approach slabs, bridge rails,
wingwalls, backfill, slope protection, roadway rails for pier protection, drains, and approaches,
ensuring standards can be fabricated by a competitive number of existing local fabricators, and
ensuring cost-effective and competitive construction by making the standards meet
construction capability of most local contractors
5.1.2 Durability
Long structure life is essential for standard bridge designs because they will be constructed many
times. It is essential that these bridges achieve at least a 75-year service life, with the ability to
extend this life to 100 years using high performance materials such as stainless steel reinforcing.

18
This is not just resistance to the environment the bridge must operate in, but also resistance to
functional obsolescence. Durability can be achieved by
using robust connections between precast concrete members that emulate cast-in-place
concrete construction,
eliminating expansion or other potentially leaky joints in the deck slab,
providing adequate reinforcing cover for the design service life,
providing additional concrete cover in precast decks to allow grinding for fit up or traffic wear,
designing for the weight of an overlay, even if not used,
using common materials (not experimental),
ensuring bridges can be widened,
designing using widths and span lengths that can resist functional obsolescence and allowing
for these widths and spans with the standards, and
using higher live-load operating or permit vehicle capacity for interior girders for truck routes.
5.1.3 Flexibility for construction
Over time, the requirements and expectations for bridge construction have changed. Long drawn-
out bridge construction with lengthy road closures and detours are no longer acceptable.
Maintaining traffic and limiting traffic impacts during construction have become nearly
universally critical to project success. Construction equipment and materials have also evolved;
changing the limits of what is possible on the construction site. For example, larger cranes and
higher capacity trailers permit the use of larger and longer precast concrete members. The bridge
standards need to accommodate this evolution of construction methods and requirements. This can
be achieved by
making the bridges capable of accelerated bridge construction, preferably the fastest types of
accelerated construction.
eliminating cast-in-place deck construction by developing pre-decked girders that will allow
quick construction access on structure.
making the bridges accommodate lateral staging to maintain traffic.
using a maximum piece width of 16 feet when possible to minimize the number of pieces and
the length of joints between pieces, and thereby the onsite labor and time required.
allowing the maximum girder shipping weight possible in Colorado as set by the current CDOT
U-girders (Note that Florida is in the process of adopting spliced U girder construction and has
a larger piece weight limit due to new hauling equipment capable of hauling pieces as heavy
as 340 kips. Hauling equipment capabilities on the Colorado road system were the limiting
factor for Colorado’s current U-girder weight limit).
making the bridges capable of opening to traffic prior to installation of waterproofing
membrane and asphalt overlay.

19
5.1.4 Low maintenance
The cost of maintaining a bridge over a 75 or 100-year life can be substantial, and this recurring
cost reduces the CDOT’s ability to make improvements throughout the transportation network.
Designing and constructing bridges that reduce maintenance needs will benefit CDOT. The
standards can be designed to reduce maintenance needs by
minimizing the number of pieces and connections (less to maintain).
eliminating joints and bearings by using integral construction.
providing robust piers and girders capable of surviving typical truck impacts in the zone of
intrusion with repairable damage (not necessarily the full CT load, which represents the impact
of the engine or frame of a truck). Columns with capability of resisting impact forces of 125
kips or more have typically survived glancing blows by a heavy truck or impacts with the upper
body of a truck hanging over a rigid rail. This is approximately the loading specified by other
national codes for impact to girders or to the upper parts of columns.
designing the decks for durability without using waterproofing membrane or overlays when
the approach road is not surfaced in hot bituminous pavement.
including durable bridge rails and curbs capable of surviving most vehicle impacts without
needing repair and capable of long life in the splash zone.
providing erosion-resistant backfill around wingwalls.
making differential settlement between approach and abutment either controlled or easily
repairable in the normal cycle of maintenance.
making aesthetic enhancements as durable and maintenance free as the rest of the bridge.
5.2. Applicable design codes and procedures
Current CDOT practice for bridge design is to use the most current AASHTO LRFD Bridge
Design Specifications along with the CDOT Bridge Design Manual. Both of these guides evolve
over time, and the updates that are made may affect the future applicability of standard bridge
plans unless these plans are updated as well. Concerns and recommendations to accommodate the
design code specification and manual updates are described herein.
AASHTO LRFD Bridge Design Specifications
This code changes rapidly, occasionally making previous design efforts obsolete. Sometimes these
changes are only applicable to a few states but are broadly applied by including them in the design
specifications. Judgment needs to be applied regarding what changes are worthwhile and add value
to the standards and the structures built using them. In particular, application of some serviceability
criteria is at the discretion of the owner. At the time of this report, AASHTO is evaluating the
calibration of the serviceability limits and may change these provisions without evidence that
structures will be improved. AASHTO’s evaluation of AASHTO LRFD code provisions usually
considers the effect on current structure types but not the new structure types or on extension of
practice beyond past practice (for example longer spans or larger span to depth ratios).
It will, therefore, be useful to be alert for situations in final design where the AASHTO design
code seems to preclude a good solution or extension of practice without an operational reason or

20
for which the code solution is worse than the problem. Many of these situations occur in integral
construction that conflicts with code specifications implicitly based on the use of expansion joints,
and the concept that more and bigger bearings and joints are better. The situation also occurs in
pretensioned design that assumes that a small flexural or shear crack is somehow much worse than
bigger cracks allowed in conventionally reinforced concrete sections. Another situation occurs
when the code seems to require custom site-specific design, when a simpler approach may be
possible. An example of this is lateral and longitudinal force-based design of substructure. A
displacement-based approach can be much more appropriate when most of the forces are internal
and not externally applied.
The current code is the best place to start standard design until a requirement does not make sense
in the context of these standard plans.
CDOT Bridge Design Manual
This manual has not been maintained or updated to current practices and design codes. CDOT is
just starting to update this manual to current design practice and design specifications. Because
this update will occur over several years, it is recommended that the standard bridge plan
development effort closely coordinate with the bridge design manual update effort so that
worthwhile design manual changes are incorporated in the bridge standards.
the changes to the Bridge Design Manual accommodate the development and use of the
standard bridge plans.
Note that to be compatible with the AASHTO Manual for Bridge Evaluation, which was changed
for consistency with the LRFD Code’s calibration, the bridge design manual may require an
adjustment in live-load distribution factor for designs using a high order method to determine the
live-load distribution.
5.3. Recommendations for design
To streamline the design effort to develop standards it is recommended that only exterior girders
be designed and interior girders made identical to exterior girders. This is recommended because
exterior girders typically see a higher live load distributed to them than interior girders.
There are several AASHTO LRFD code provisions needing close scrutiny for applicability when
developing the standard design. These are described herein.
5.3.1. Strength II limit state and exterior girders
The Strength II limit state may result in excessive live loads distributed to exterior girders on
bridges with significant shoulders when the multiple lane distribution factor governs. This issue
may apply to Service II and Service III as well. This is because the LRFD distribution factors were
calibrated for interior girders for a highly improbable coincident loading of two adjacent permit
vehicles at the critical location, probably in traffic lanes. The probability of these vehicles
occupying the shoulder should be much lower, resulting in substantially lower live-load or
distribution factors for this case. If this limit state is relaxed, the exterior girders at Strength II or
Service II limit states should be designed for the worst of the interior girder multiple lane

21
distribution (to be adequate in case of a future widening), or the exterior girder single lane
distribution factor.
Loads from thermogradient and volume changes
Historically, thermogradient has not been used for structure design in Colorado (except for
segmental structures). It is questionable whether thermogradient needs to be applied to ductile
structures for the strength limit state. Either thermogradient, when combined with other loads, will
not result in cracking, in which case the use of this load for generation of moments to calculate
reinforcement needs will be irrelevant, or the structure will crack, which is not prohibited under
strength cases, then the moment will be relieved. We recommend that thermogradient not be
required except for analysis of the construction joint at the surface of the deck at pier closures for
the case of a bare deck without the future overlay.
There is a similar rationale for including uniform temperature changes in design loading for ductile
structures (some column types may not be ductile). For standard bridge designs, there is typically
uncertainty in column length, loads induced by thermal gradient (TU), elastic shortening (ES),
creep (CR), and/or shrinkage (SH). This uncertainty, along with a desire for a robust design,
encourages designers to distribute externally applied loads to the integral superstructure and then
to abutments, to be supported there. The pier columns are then designed to be capable of sufficient
drift or displacement under the volume change loads from ES, TU, SH, and CR without significant
distress to the columns, i.e., inelastic or displacement-based design for the columns.
Skew angle
To ensure that the proposed standards are applicable for a wide range of skew angles, they should
be designed for both extremes of the proposed range of skew angles using highest loading
generated in the range of skew angles. Note that in some situations with large skew angles, the
moments on exterior girders increase with skew, rather than decreasing as indicated by the code
distribution formulas. In addition, increases in shear due to skew also may be applicable to added
dead loads due to the transverse stiffness of the deck.
Horizontal shear
The strength limit state for horizontal shear may be the limiting factor for span capabilities for
some of the potential standard girder sections. This code provision has changed repeatedly and
may change again. It currently seems a little dysfunctional in that it allows a 20% larger maximum
shear at the construction joint between the girder and deck than it does in a monolithic area of the
girder or deck.
5.3.2 Service limit states
Serviceability is important to ensuring durable structures. Ignoring serviceability may lead to
vibration, fatigue, sag, or excessive cracking. Careful and appropriate design for serviceability is
recommended to provide durable structures that are appropriately designed for expected
serviceability concerns. The two most common serviceability criteria affecting design are live-
load deflection and service tensile stress.
22
Live-load deflection
The initial live-load deflection limit purpose is thought to be vibration control. However, other
benefits (possibly unanticipated) include rideability improvements and less dead-load deflection
from creep due to increased stiffness provided to control live-load deflection. This deflection limit
is optional but is still followed by CDOT and has been successfully used for a long time. AASHTO
is currently reviewing a change in this provision to limit loaded vehicles to the actual number and
location of striped lanes when determining live-load deflection.
Many bridge types, especially those integral with their supports with integral abutments, exhibit
lower deflection than a line girder analysis would indicate due to the stiffness of supports, bearings,
and the interaction of the soil at abutments.
Bridges, especially shallow ones with robust bridge rails, are stiffer than assumed due to the
composite action of the bridge rails with the structure. This can be of considerable benefit to
shallow structures of narrow deck width. For instance, a 13-inch slab superstructure with a Type10
bridge rail is nearly 2.2 times stiffer than the slab section alone; with a 36-inch Type 7 bridge rail
it is nearly eight times stiffer. This indicates that for the shallowest sections the added dead loads
and live loads may deflect the structure much less than expected by standard design methods. The
AASHTO LRFD code allows the added dead-load and live-load deflections to be calculated using
the added stiffness of the bridge rails, which benefits the exterior girders. Using the added stiffness
provided by the bridge rails may not significantly affect calculated interior girder deflections far
from the bridge rails.
It is recommended that the live-load deflection limit be applied based on interior girders. In the
instance where the live-load deflection on an exterior girder is greater than this, the deflection on
the exterior girder will be reduced by the presence of the rail or curb, and this case will only occur
for very low traffic structures. Standard structure widths are expected to be 32 feet, 47.5 feet, 63
feet, 78.5 feet, and 94 feet with total live loads for deflection of 2 lanes, 2.55 lanes, 3.25 lanes, 3.9
lanes, and 4.55 lanes. This clearly shows less live load per unit width for the wider structures.
Tensile stress (Service III)
Tensile stresses calculated in the Service III limit state often govern flexure design for prestressed
concrete girders. The intent of the Service III limit state is to control cracking in prestressed
concrete structures. AASHTO considers this limit optional, and its use is left to the owner’s
judgment. This serviceability limit may be changed with a serviceability calibration. For instance,
the 0.8 LL load factor may be changed to 1.0 in cases where detailed loss calculations are
performed. The loading used may also be limited to vehicles occupying actual striped lanes rather
than design lanes. Adding enough tension to meet this limit can result in excessive camber, require
higher concrete strengths at strand release, or require higher f’ci in the girders. Note that the live
load at the Service III limit state of 0.8HL93 is roughly equivalent to an HS 25 loading.
Prestressed structures have been designed and constructed for an HS 20 live loading in Colorado
for many years with no signs of cracking, despite Colorado’s liberal overload policy. It is probable
that this is partly because live loads are statistically much less on exterior girders when there are
shoulders, and that prior live-load distribution factors for interior girders were very conservative.
It is also possible that the 6*Sqrt (f’c) limit applied is conservative, possibly due to continued

23
strength gain, initial over strength, and a much higher modulus of rupture, making this closer to a
fatigue endurance limit for the depths of tension zone in typical girders.
Partial prestress designs that have compression under dead load plus prestress are not likely to
have in-service problems with cracking since cracks will normally be closed. If they are designed
to not have dead-load sag, they are also not likely to have problems with long-term geometry
control, which is the main reason Colorado does not allow partial prestress design of girders. We
recommend that CDOT consider allowing partial prestress girder designs for these proposed
decked girder standards in lieu of Service III requirements so long as they are prestressed
sufficiently to preclude sag under dead load and prestress alone. This will greatly facilitate
improved camber control of these girders.
The Service III code limitations prevent the rubblization of girders caused by the accumulation of
many cracks. A tensile fatigue check at the Service III limit using the same loading as Fatigue I
should be considered. Due to the desire for very long life, it is recommended that the Service III
limit state using the Fatigue I load be applied to the transverse deck design; this may not be
necessary for deck overhangs and exterior girders when there are wide shoulders due to the low
repetition of the load. It is important to keep up on AASHTO’s policy on this issue as revisions
could render all standard girder designs obsolete.
Because cracking at cold joints usually occurs at a tensile stress of not much more than 3*Sqrt(f’c)
it may be desirable to limit the stresses at deck continuity joints at piers at interior girders when
no overlay is present and reinforcing with the potential for corrosion is used at this location. Note
that research is underway in Colorado to identify surface chloride levels that can help recognize
those future structures that may need extra protection. Some partial prestressing may limit stresses
at this location if needed. It may be practical to place some un-bonded monostrand in the deck-
girder-unit joints to add some partial stressing over the pier. Thermogradient forces may be
appropriate for including in this consideration.

24
6. RECOMMENDED BRIDGE SUPERSTRUCTURES
New superstructure sections were developed based on the goals outlined in Section 5. All of these
sections are precast concrete beams with the permanent deck part of the precast section.
6.1. Development methodology
Beam sections were sized to accommodate the bridge groupings determined in Section 4.3. Design
loads were established based on current CDOT practice and analysis and modelling was completed
using software listed below. Partial prestressing and stiffening by the bridge rails was not used.
Design and analysis software used
PSGLRFD—This prestressed girder design and analysis program was used for the bulk of the
work in this project. This is an old proprietary program developed by the first author for rapidly
prototyping simple-span, and simple-span-made-continuous, precast prestressed concrete
structures. This program can batch process a large number of runs. A prior LFD version was used
for design and rating by CDOT in the past. The prior version was used to run the designs required
to create the current CDOT design aids for prestressed girders and to create the girders themselves.
The LRFD version was created by the first author for CDOT’s U-girders. This is a DOS program
that does not run on WIN 7 and later operating systems due to lack of support for the programming
language used. Input and output is included on the CD. A table of input and output information is
in the Appendix.
LDFAC—This is an FEM program used to calculate live-load distribution factors, since most
cases do not fit the simplified methods in AASHTO LRFD and those that do are sometimes
excessively conservative. This program is recommended for final design. The 10 percent increase
of live load for high order methods was not included and neither was the 10 percent reduction for
low traffic volumes. This old program was created by NCHRP 12-26/1 and was used to verify the
distribution formulas in the AASHTO LRFD code. It was used by CDOT to evaluate live-load
distribution factors appropriate for U-girders. This is also a DOS program, but the first author
recompiled it to run with 32- and 64-bit operating systems (still DOS). This program with
documentation is included with input and output on the CD.
CONSPLICE—This is a spliced-girder design program used in this project for random
verification. It is recommended for final design. This is a commercial program available from
Bentley and was recently updated to AASHTO LRFD edition 6. Final design will need to
accommodate the variation in the parameters that affect camber, the variability of span ratios from
optimum that are to be tolerated, the variation of skews to be allowed, the location and amount of
the mild reinforcing (including stirrups), and the amount of the monostrand prestressing to adjust
camber and correct camber variability girder-to-girder. Input requires a few workarounds for
features not implemented. An updated Library (included on the CD) was generated for this project.
Input and output are voluminous. This program cannot be batch processed.
Monostrand prestressing is recommended in the girders for a number of purposes including:
A. To adjust relative camber and sweep between adjacent girders.
25
B. To prevent excessive girder sag. Since pretensioning needs to be limited to an amount that
cannot cause excess camber when the variation in behaviour causes the girders to camber the
maximum, this needs to be sufficient to add enough camber to prevent excessive sagging
should the actual variation in behaviour be the opposite of that expected.
C. To control stresses at the construction joint. Monostrand may, in some cases, need to be used
to control stresses at the construction joint in the top of the deck at the pier-closure pour.
D. To reduce cracking in pier and abutment caps and in girder-to-girder joints adjacent to caps.
Monostrand might also be used to reduce cracking in the pier and abutment caps and the girder-
to-girder deck joints near the caps, but Consplice probably will not be helpful for this analysis.
The amount of monostrand required for all these purposes is left to the final design of the standard,
but is expected to be on the order of 10% of the total tensioning.
AASHTOWARE BrR (Virtis) and BrD (Opus) --- These were not used in the preparation for
this report, but are recommended for rating and design checking of the girder types recommended.
BrR does not seem capable of the shored pre-decking of multiple-span-made-continuous steel
modules. Templates should be prepared in BrR for the rating of representative bridges that use any
standards created. A final rating should be made for any bridge actually built to reflect the actual
spans, skews, widths, conditions of PT applied, tensioning, and reinforcing, etc. These ratings
should end up higher than the minimum targets, as the standards need to reflect worst-case design
situations. Consplice is needed for the standard creation since these programs are not accurate
enough to predict camber variability.
Design and analysis criteria and parameters used
Design analysis was completed using the current AASHTO LRFD Bridge Design Specifications.
Specific parameters included:
Multi-span structures use simple-made continuous design spliced over the piers.
Modelling of continuity is approximate (a characteristic of the program used).
Negative moment is not modelled except in Consplice runs.
Span lengths are to centerlines of girder bearings.
Live load - HL93 vehicle.
Added dead loads: bridge rail – 490 lb/LF each, 36 psf for overlay between rails.
Exterior beam design used.
Moment distribution determined by LDFAC for the zero skew angle case. No separate
distribution factor used for shear. This additional analysis is left for the final design of the
worksheets.
Precast girder weights per span limited to 238 kips.
Concrete strength at release (f’ci) of at least 4,000 psi.
Final Concrete strength of at least 6,000 psi at the top of deck; except more allowed in bottom
of girder when required for girder tensioning. A number of sections require 6,000-psi concrete

26
in the deck to prevent an over reinforced condition from limiting strength. This was deemed
the highest deck strength practical for achieving low bid prices using air-entrained concrete
without a special design effort. A few design cases resulted in a higher f’ci required for the
bottom of girder due to the large prestressing force, but still less than Colorado’s prestressing
practice.
No tension allowed under prestressing and dead loading, except at pier closure.
Horizontal and vertical shear stress limited to 1,350 psi.
Shear strength rating greater than moment strength rating when practical.
Final concrete strength for cast-in-place closures, joints, and top of deck concrete of 6,000 psi.
No restriction on top tensile stress in precast girders - all sections had the top deck in
compression to very near the end of the section. This can limit the required length of negative
moment continuity reinforcing.
The top 4.5 inches (minimum) of the deck concrete is air entrained or equal, modified rapid
chloride < 1000 coulombs, low shrinkage, crack resistant.
Live-load deflection limited to Span/800 (L/800) – rail stiffness contribution not used.
Design uses the narrowest standard deck width of 32 feet. Note that for such a narrow bridge,
the bridge rail weight often will be lighter, the overlay may not be present, exterior live-load
(LL) distribution may be conservative (due to shoulders), and interior girder LL distribution
will be conservative. Wider bridges will have slightly lower loads per girder. The design should
be adequate for the interior girders of wider, more heavily trafficked roads. Unless wider girder
spacing can be achieved (to lower cost) or the camber cannot be adequately controlled, the cost
of more prestressing or reinforcing is small. This indicates that in some instances a somewhat
less expensive structure could be custom designed using the standards represented here if a
girder line can be saved by designing to the specific structure requirements of a particular
bridge. In particular, designs are possible in which the exterior girder is narrower and might
include the rail when shipped. Examples might have a nominal 10-foot width section for the
exterior and nominal 15-foot width for the interior girders.
Deck design should be such that a full-depth deck replacement is not needed for the design life
of the structure. Designing new structures with decks that need to be replaced periodically is
not cost effective in a life cycle sense, though first costs may be lower. This does not preclude
grinding or overlays to correct for wear, or partial cover removal with spot removal deeper (for
removal of chloride contaminated concrete) followed by a concrete overlay, though this is also
likely to not reflect the best life cycle costs, but should be considered prior to a need for
extensive rehabilitation.
Camber note
Camber should be within ±(L/800 +1/2 inches) at all times in service, considering variability of
dead loads, prestressing force and eccentricity, shrinkage, differential shrinkage, creep, initial and
final concrete strengths, girder properties, etc. Some of the longer spans require increased prestress
to control sag. Many sections governed by ultimate strength require a jacking force less than 75
percent of ultimate (this also can be achieved by using mild reinforcing or un-tensioned or lightly
27
tensioned strand for part of the reinforcing). Decreased prestress (less than Service III) with partial
prestressing would ease control of upward camber for some cases.
Girder section ID and file name nomenclature
ID names = “Depth in inches” + “Girder type” of DS (Decked slab girder), DU (Decked U girder),
DNX (Decked NEXT beam), or DBT (Decked BT girder) + “C” for thicker web + “Top of deck
width of girder in whole feet”. An abridged table of output data from the runs used to create the
charts is included in Appendix A.
Input and output of all final runs and most public domain reference materials is available on CD.
The information is too voluminous for inclusion in this report text.
6.2. Superstructure sections developed for standardization
Four new superstructure sections were developed to meet the requirements of Section 5. The
sections were targeted to cover short, medium, and long spans as defined in Section 4.2 and 4.3
and Tables 7 and 8. Three uses were investigated:
1. Simple spans – Camber and live-load deflection control are most difficult for this use due to
the reduced stiffness and the increased positive moment requiring more prestress force and
hence greater camber.
2. Interior spans when splicing for live-load continuity at piers.
3. End spans when splicing for live-load continuity at piers – Shear tends to be most difficult to
control in this use as the single end of fixity tends to attract composite loads at the fixed end,
increasing shears.
The results for these three uses are presented in Figures 6, 7, and 8. A full tabulation of conceptual
design and analysis results is included in Appendix A. Note that splicing to extend span ranges
(typically near inflection points) is not included in this study because this type of design and
construction is difficult to standardize due to the variability of span lengths and splicing locations.
Splicing is only needed for very long spans, which are not common enough in Colorado to justify
the cost of implementation. Splicing at the piers for only composite loads reduces the effect of one
span on the next, increasing the flexibility of the standards.
Short spans - decked slab girder (DS)
The decked slab girder is a very shallow section suitable for short spans. These girders are simple
to fabricate and are well-suited to GRS-IBS systems. The girder lengths are limited by ultimate
strength of the top of slab concrete and live-load deflections. Decked slab girder bridges may be
expensive to construct due to the number of substructure units required by the short spans, and the
volume of materials required for the deeper spans (when compared to deeper girder types). Simple
spans up to 56 feet are possible with longer non-standard spans feasible if the stiffness contribution
of rails is used. The most effective depths for this section range from 10 to 20 inches; depths of
10, 13, 17, and 20 inches were investigated. The most efficient section for spans lengths less than
30 feet are the 10 inch and 13 inch depths. The use of wide section widths is encouraged to
minimize the number of cast-in-place joints between sections. While only a 15 foot wide section
was investigated it is possible that other widths can be effective but may not see enough use to
justify standardization. Figure 6-1 illustrates the decked slab girder for the 15 foot width.

28
Figure 6-1 Decked slab girder
Short to medium spans - decked U-girder (DU)
The decked U-girder is a shallow and efficient structure suitable for short- to medium-length spans
up to 144 feet. The standard section has 5 inch webs; a thicker 7 1/2 inch web is used to increase
shear capacity for longer spans or shallow sections. Figure 6-2 illustrates a 15 foot wide decked
U-girder with thicker 7 ½ inch webs. Section widths can be varied; 7 feet 3 inch, 9 feet 10 inches,
and 15 feet 0 inch sections were investigated for this study. Section depths from 32 inches to 75
inches were investigated and these depths are recommended as the limits for this section. If the
stiffness of the bridge rails are included the span capacity of the shallow sections can be extended.
The maximum span is 144 feet and the section weight may limit the useable span length. The
decked U-girders are the most efficient section for span lengths from 30 feet to 96 feet. Fabrication
of the U section and its void is likily to be more labor intensive than the other recommended types,
and will probably increase fabrication time for this girder type compared to the other types
proposed.
Figure 6-2 Decked U girder: top widths 15 feet 0 inch, 9 feet 10 inches, or 7 feet 3 inches
Medium to long spans - decked BT girder (DBT)
The decked BT girder was developed to extend the span capability for standard decked sections.
The section is a modification of the current CDOT bulb tee girders with the top flange expanded
to a full depth slab. Section depths are recommended from 48 to 69 inches, which is considered to
be medium depth. Section weight limits are often encountered because of their use for longer
spans; this weight limitation limits the top slab width for longer girder sections. The decked BT
girder (Figure 6-3) is the most efficient section for spans above 96 feet. The maximum span
capability when using live-load continuity for multi-span bridges is 195-feet. Fabrication of the
DBT section is likely to be less labor and time intensive than the DU section, but the section results
in deeper structures, and often will require more girder lines than the DU girders. Due to the
narrower bottom flange, it is unable to carry significant construction live loads until the keyways
are filled and set.
20DS15 = 20" deep, Decked Slab, 15' wide on top
32DUC15 = 32" deep, Decked U, C=7.5" web, (_= 5" web), 15' top width

29
Figure 6-3 Decked BT girder: top widths 9 feet 10 inches, 7 feet 3 inches, or 4 feet 8 inches
6.3. Other superstructure girder sections investigated
Two other sections were investigated for standard development, the decked NExt girder and
decked U-girder with stretcher slab. The results of that investigation are presented herein.
Short to medium spans for off-system use - decked NExt girder(DNX)
These sections were investigated, and the 33-inch deep section was determined to be a low-cost
bridge alternative for off-system use where deck profile control is not critical. These sections are
simple to fabricate and cost-effective for span lengths from 30 to 70 feet; deeper sections for longer
spans will be more costly than the on-system sections. Due to difficulties controlling camber, these
sections are not recommended for fully tensioned use for on-system bridges.
Benefits of this section include robust shear capacity, no flat surfaces for birds to roost, no internal
voids, and less weight than the longest-span deck slabs. Downsides of this section are they are
deeper than the decked slab girders and decked U-girder sections for comparable span lengths,
poor aesthetics compared to slab girders or decked U girders, concentrated bearing loads increase
risk of deterioration, they are not well suited to GRS-IBS due to concentrated bearing loads,
fabricators in Colorado do not have beds for this section, and they are not easily suited to future
implementation of capless pier design.
The section span capacity is limited by weight and live-load deflection. The maximum span is 120
feet for a 41-inch deep section when using live-load continuity for multi-span bridges. While not
recommended for on-system use, the results of the conceptual design are presented in the merit vs.
span charts and appendix A. (See Figure 6-4.)
Figure 6-4 Decked NExt Girder: top widths 15 feet 0 inch, 9 feet 10 inches, or 7 feet 3
inches
33DNX15 = 33 inches deep, Decked NExt beam, 15-foot top width
60DBT10 = 59.5" deep Decked BT, 9'-10" top width
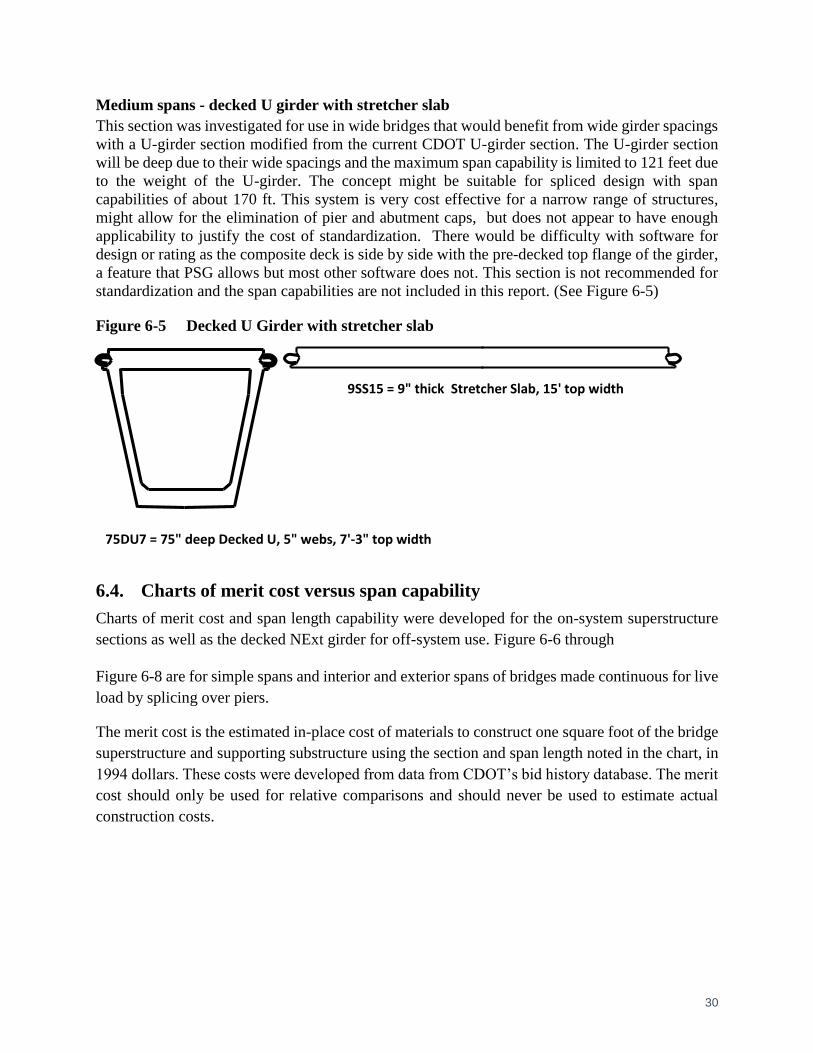
30
Medium spans - decked U girder with stretcher slab
This section was investigated for use in wide bridges that would benefit from wide girder spacings
with a U-girder section modified from the current CDOT U-girder section. The U-girder section
will be deep due to their wide spacings and the maximum span capability is limited to 121 feet due
to the weight of the U-girder. The concept might be suitable for spliced design with span
capabilities of about 170 ft. This system is very cost effective for a narrow range of structures,
might allow for the elimination of pier and abutment caps, but does not appear to have enough
applicability to justify the cost of standardization. There would be difficulty with software for
design or rating as the composite deck is side by side with the pre-decked top flange of the girder,
a feature that PSG allows but most other software does not. This section is not recommended for
standardization and the span capabilities are not included in this report. (See Figure 6-5)
Figure 6-5 Decked U Girder with stretcher slab
6.4. Charts of merit cost versus span capability
Charts of merit cost and span length capability were developed for the on-system superstructure
sections as well as the decked NExt girder for off-system use. Figure 6-6 through
Figure 6-8 are for simple spans and interior and exterior spans of bridges made continuous for live
load by splicing over piers.
The merit cost is the estimated in-place cost of materials to construct one square foot of the bridge
superstructure and supporting substructure using the section and span length noted in the chart, in
1994 dollars. These costs were developed from data from CDOT’s bid history database. The merit
cost should only be used for relative comparisons and should never be used to estimate actual
construction costs.
75DU7 = 75" deep Decked U, 5" webs, 7'-3" top width
9SS15 = 9" thick Stretcher Slab, 15' top width

31
Figure 6-6 Simple span capability versus merit cost for precast prestressed concrete decked sections (for information only)
10DS
13DS
13DS
17DS
17DS
20DS
20DS
30
.03
5.0
40
.04
5.0
50
.05
5.0
60
.0
10 30 50 70 90 110 130 150 170 190
Me
rit
($/s
f)
Span (ft)
Simple Span Merit ($/sf)
SLAB
32DU
32DUC
33DNX
38DU
38DUC
41DNX
44DU
48DBT
51DU
60DBT
63DU
69DBT
75DU
HL93 live load, exterior girder, 32' out to out,3" overlay, TY 7 rails, pieces limited to 238K.LDFAC program used for distribution factor.PSGLRFD program used for design and analysis.6 ksi integral deck, joints fully emulative of CIP.Spans are leveling pad to leveling pad.Other sections' depth in inches are indicated by the first two digits of the section ID. Merit is a measure of 1994 in-place costs of materials . For information only. Applies to prestressed girders with a deck in lieu of a top flange in place prior to tensioning.
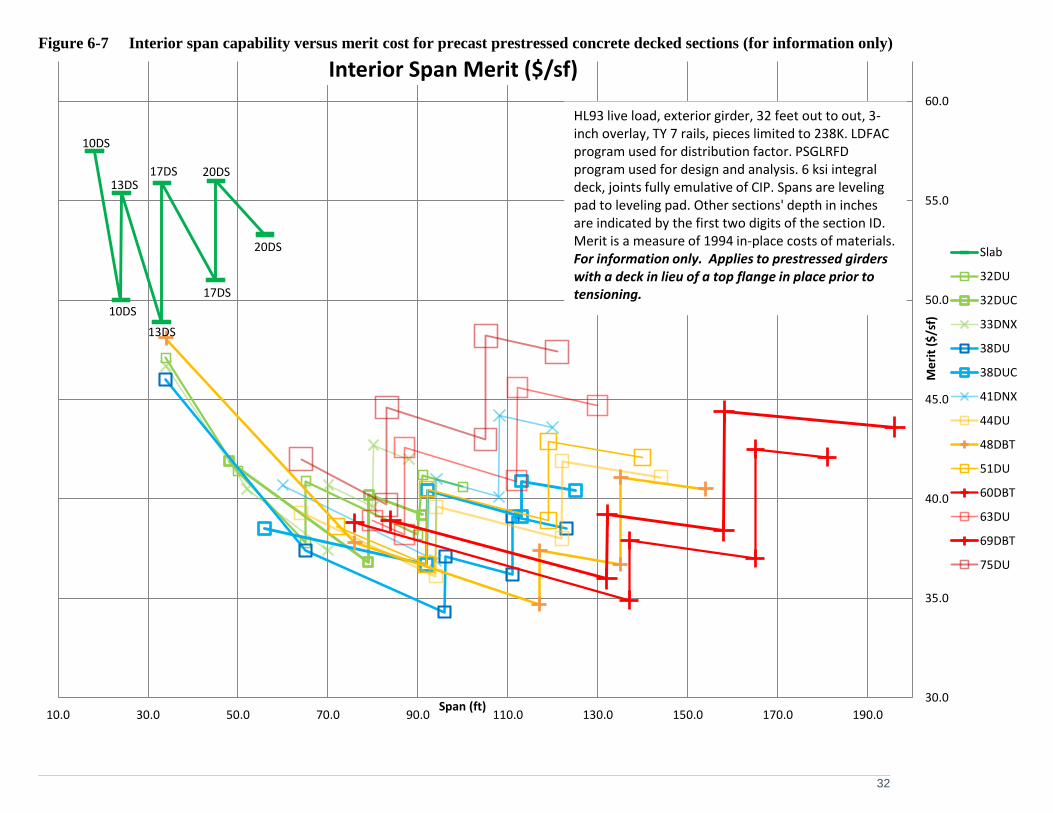
32
Figure 6-7 Interior span capability versus merit cost for precast prestressed concrete decked sections (for information only)
10DS
10DS
13DS
13DS
17DS
17DS
20DS
20DS
30.0
35.0
40.0
45.0
50.0
55.0
60.0
10.0 30.0 50.0 70.0 90.0 110.0 130.0 150.0 170.0 190.0
Me
rit
($/s
f)
Span (ft)
Interior Span Merit ($/sf)
Slab
32DU
32DUC
33DNX
38DU
38DUC
41DNX
44DU
48DBT
51DU
60DBT
63DU
69DBT
75DU
HL93 live load, exterior girder, 32 feet out to out, 3-inch overlay, TY 7 rails, pieces limited to 238K. LDFAC program used for distribution factor. PSGLRFD program used for design and analysis. 6 ksi integral deck, joints fully emulative of CIP. Spans are leveling pad to leveling pad. Other sections' depth in inches are indicated by the first two digits of the section ID. Merit is a measure of 1994 in-place costs of materials.For information only. Applies to prestressed girders with a deck in lieu of a top flange in place prior to tensioning.

33
Figure 6-8 Exterior span capability versus merit cost for precast prestressed concrete decked sections (for information only)
10DS
13DS
13DS
17DS
17DS
20DS
20DS
30.0
35.0
40.0
45.0
50.0
55.0
60.0
10.0 30.0 50.0 70.0 90.0 110.0 130.0 150.0 170.0 190.0
Me
rit
($/s
f)
Span (ft)
End Span Merit ($/sf)
Slab
32DU
32DUC
33DNX
38DU
38DUC
41DNX
44DU
48DBT
51DU
60DBT
63DU
69DBT
75DU
HL93 live load, exterior girder, 32 feet out to out,3-inch overlay, TY 7 rails, pieces limited to 238K.LDFAC program used for distribution factor.PSGLRFD program used for design and analysis.6 ksi integral deck, joints fully emulative of CIP.Spans are leveling pad to leveling pad.Other sections' depth in inches are indicated by the first two digits of the section ID. Merit is a measure of 1994 in-place costs of materials.For information only. Applies to prestressed girders with a deck in lieu of a top flange in place prior to tensioning.

34
6.5. Superstructure sections considered and eliminated
Within the categories of prestressed girders and steel girders, these were considered by their ability
to meet the desired criteria, and to have sufficient use to justify the effort to generate standards.
These are all viable and economical structure types, but the authors considered them less able to
meet all the goals of this effort compared to the fully pre-decked prestressed girders considered in
depth and recommended for implementation.
6.5.1. Precast concrete girders
All these precast girder variations are practical and feasible types, but they are not the chosen types
simply because they are not capable of the fastest ABC construction. The pre-decked option with
a part thickness deck offers the second best option for implementation, and potentially could be
implemented easily after the implementation of pre-decked girders with a full thickness deck as
details, and to a large extent design, are the same.
Partially pre-decked prestressed girders (with a part thickness deck)
These would all be simple spans made continuous for live loads. Advantages are similar to pre-
decked girders with the following differences:
Lighter sections make shipping and erection easier, or allow longer spans to be used.
More difficult camber control.
Will accommodate more variable geometry.
Cast-in-place top part of deck would be easier to achieve a good riding surface.
Several weeks of added construction time are needed to pour and cure the top part of the deck.
Does not allow construction traffic on deck immediately after girder setting (pre-decked BT
girders do not either due to a lack of stability when live load is not applied directly over the
girder before the concrete in the keyways is poured and set).
Prestressed girders with separate precast deck
These would all be simple, made continuous for live loads. Advantages are similar to pre-decked
girders with the following differences:
Lighter sections make shipping and erection easier, or allow longer spans to be used.
More difficult camber control.
Will accommodate more variation in geometry.
Several weeks of added construction time are needed to place the deck.
Requires access from below and additional crane time for panel placement.
Less structural efficiency requiring additional depth and materials required for the girder top
flange and haunch.

35
Prestressed girders with a conventional deck
These would all be simple, made continuous for live loads. Advantages are similar to pre-decked
girders with the following differences:
Will accommodate more variation in geometry.
Requires more time to form deck and overhangs.
This is the current practice. Worksheets and design aids are available, but might require
updating to LRFD
6.5.2. Steel girders
The principal reason that steel girders were not investigated in greater depth is that there are no
major fabricators in Colorado, so the odds of successful implementation are low. After review of
the draft of this report, a limited investigation of pre-decked steel girders was made. The results of
this investigation are in the CD for information only. Predecked steel girders could be implemented
as an alternative worksheet, but might see little use due to the impediments listed below and in the
CD.
Predecked steel girders
These would all be simple spans, made continuous for live loads. Advantages are similar to pre-
decked precast girders with the following differences:
Lighter sections make shipping and erection easier, or allow longer spans to be used.
Less variability in camber control.
Exacting fabrication required for diaphragms, though not many permanent ones would be
required.
Deeper sections are required.
Wide flange (WF) sections are inexpensive, but poorly configured for efficiency in composite
sections. Available heights and length of WF sections are limited and these sections may be
subject to “Buy America” provisions (some sections only rolled in Canada). Welded plate
girder sections can be used but tend to have high material and fabrication costs, and longer
time to delivery.
Requires cooperation between concrete deck and steel girder subcontractors. For WF girders
one possible solution is to eliminate all shop fabrication and deliver directly to the contractor
or pre-decking subcontractor, with only details that can be trusted to a low bid contractor with
his own forces. Considerable push back could be expected from the contracting industry.
Deck slab will be in tension unless post-tensioned or poured in a shored condition.
Horizontal shear design method at interface is much less efficient for steel girders compared
to concrete girders (a large number of studs). Concrete girder design requires enough stirrups
to carry factored shear. Steel girder design requires enough studs to crush the slab or yield
entire steel section, especially for shorter spans or cases where a stout shallow girder or
overdesigned girder is used to control live-load deflection.

36
Except for steel boxes, two girders are needed for each pre-decked piece, reducing efficiency.
Long delivery time is common with fabricated steel.
There are no local major structural steel fabricators.
Steel fabricators are not used to shipping pieces as long or heavy as the precast fabricators are.
No applicable design or rating software for steel girders constructed as simple spans and made
continuous for live load.
Entrenched industry resistant to change.
Partially pre-decked steel girders with a half thickness deck
These would all be simple spans made continuous for live load. Advantages are similar to pre-
decked steel girders with the following differences:
Lighter sections make shipping and erection easier, or allow longer spans to be used
Can accommodate complex geometry
Deck slab will be in tension unless prestressed longitudinally (generally very little in tension
for pre-decked prestressed girders)
Exacting fabrication required for diaphragms, though not many permanent ones would be
required
Steel girders with separate precast concrete deck
These would all be simple spans made continuous for live load. Advantages are similar to pre-
decked girders with the following differences:
More diaphragms will be required than for pre-decked options.
Lighter sections make shipping and erection easier, or allow longer spans to be used.
Coordination is required between panel and girder fabricators.
Can accommodate complex geometry.
Longer erection time required for girders.
Deck slab will be in tension unless prestressed longitudinally (generally very little for pre-
decked prestressed girders).
Long construction time to set precast deck panels, place reinforcing, and pouring and curing
joints and haunches.
Pier and abutment caps require steps at the seats and, except for steel box girders, girders need
to be set vertically.
Steel girders with a conventional deck
These would all be simple spans made continuous for live load. Advantages are similar to pre-
decked girders with the following differences:

37
Can accommodate variable geometry.
More diaphragms will be required than for pre-decked options.
Longer erection time required for girders.
Deck slab will be in tension unless prestressed longitudinally (generally very little for pre-
decked prestressed girders).
Long construction time to place reinforcing and pour and cure deck.
This is the current practice for steel girders, but no worksheets or design aids are available.
Pier and abutment caps require steps at the seats and, except for steel box girders, girders need
to be set vertically.

38
7. IMPLEMENTATION COST VERSUS BENEFITS
7.1. Applicable structures for evaluating implementation cost
As developed in Section 4.3 from CDOT PONTIS data, projected yearly bridge construction data
is segregated into bridge groups based on span lengths served by the recommended new standard
superstructure sections.
The three superstructure sections developed for on-system bridge standardization are:
decked slab structures (interior spans to 65 feet),
decked U girders (interior spans to 146 feet), and
decked BT girders (interior spans to 199 feet).
The PONTIS data indicates that about 36 new on-system bridges are built by CDOT each year.
About 58 percent of these, or 21 per year, could benefit significantly from standardization because
their maximum span and skew is expected to fall within the capabilities of the three recommended
standard superstructure sections. Table 7-1 shows the estimated practical number of standard
bridges that could be constructed each year. Some of these bridges, perhaps one-third, may be
difficult to standardize fully due to geometry complexity that resists standardization. However,
these bridges can partially benefit from a standardization effort by using similar standard details.
Examples of geometric complexity include superelevation transition, variable skew angles,
interaction between vertical or horizontal curves and skews, and multiple control lines. Bridges
with concrete overlays may sidestep these complexities by allowing geometric adjustments in the
overlay.
Many of the standard details developed will also be applicable to non-standard bridges, so the
standardization benefits will be felt beyond the bridge groups identified.
Table 7-1 Estimated yearly CDOT on-system standard bridge construction
Group Max. span
length (feet)
Superstructure
Section
Skew angle
(Degrees)
No. of Standard
Bridges Constructed
Short Spans 20-65 Decked slab 0-25 3
26-50 1
Medium
Spans 66-146 Decked U-girder
0-25 9
26-50 4
Long Spans 147-199 Decked BT girder 0-25 3
26-50 1
ANNUAL TOTAL 21
7.2. CDOT bridge design cost
The average cost to construct a CDOT on-system bridge is about $120 per square foot. Historically,
the engineering design cost has averaged 7.5% of the construction cost, or about $9 per square foot
of deck area. Field Inspection Review (FIR), or preliminary design, uses about 1/3 ($3/sf) of the
39
total design cost. Final Office Review (FOR) design plus the Plans, Specifications, and Estimates
(PS&E) design phase use the remaining 2/3 ($6/sf) of the cost.
The PONTIS data shows that CDOT constructs an average of 542,930 square feet of bridge yearly,
resulting in about $4,900,000 of bridge design cost per year if the design cost is limited to $9 per
square foot of area. Yearly preliminary design costs are estimated to be $1,600,000; final design
is estimated to be $3,300,000. It is likely that this cost projection is low, indicating a gradual
escalation of design cost over time.
The cost to produce standard designs for the 21 bridges per year targeted to standardization, less
the one-third not fully practical for standardization due to geometry complexity, is estimated to be
about $1,630,000 per year.
Note that the cost and difficulty to develop the standards increases with span length and skew angle
as complexity of the structure section and geometry increase.
7.3. Standard plan set needs
Developing a full CDOT bridge design using only standard bridge plans is difficult to achieve,
and likely will not provide enough cost savings to justify the cost of standard development. It is
expected that custom general layouts (site plan with bridge), geology plans and analysis, hydraulics
plans and analysis, deck elevation data, framing plans, and summaries of quantities may be needed
depending on the site and bridge configuration. Much of the data for these custom sheets can be
transcribed from relevant bridge standard sheets. Special bid items used can be added on a simple
square-foot or linear-foot basis to reduce plan preparation effort for quantity calculation. A notes
page may also be needed specifying which detail sheets are to be used with what skews, widths,
and span length.
Full integration of standards is possible with the addition of partially completed plan sheet
templates for general layouts, geology data, hydraulic data, deck elevations, framing plans,
summary of quantities, etc. These sheets would require some data and modification for use.
Section 10 provides more detail on proposed standard bridge plan sheets.
7.4. Estimate of potential savings
When standard plan types are accepted as an appropriate choice for cost, geometry, and appearance
without requiring preliminary analysis of other bridge types, and when there is no contradiction of
their acceptability, at least one-third of the preliminary bridge design work cost on jobs could be
saved; up to $166,000 per year. Final plan preparation savings may be twice this amount if all
relevant worksheets and design aids are available, even if integrated bridge plans are not available
(except for the sheets mentioned above). Integrating the bridge plans so that very little design and
detailing effort is needed other than a sheet or two to connect the structural details to members,
lengths, skews and details to be used would roughly double the savings in final plan production,
compared to using only worksheets.
These bridge standards also could generate savings in construction. It is reasonable to expect a 10
percent savings in construction costs and another 10 percent savings in long-term life cycle costs

40
if cost effective construction and durability enhancements are effectively incorporated in the
standards. Life cycle cost benefits should be discounted in this savings assessment to a significant
degree, since most of the benefits are late in the life of a structure. The current bridge worksheets
and design aids have generated at least this level of savings. Preliminary design completed for this
study indicates a potential of significant savings in time, labor, traffic control, materials (especially
concrete), and to a lesser extent, reinforcing steel compared to current average practices. There
will be reductions in crane time (though cranes may be larger on the average) and number of joints
and bearings by implementing best practices (no joints or bearings when possible). Quality will
also improve by using plant-produced products and materials, which are more consistent in quality
and easier to reject if deficient. These savings can be much larger than plan preparation savings,
especially in the case of the decked U-structures that may see the most use, based on the number
and area of structures that might benefit from these standards.
Table 7-2 lists the estimated savings in design, construction, and life-cycle costs for bridges
identified in the three standard span categories. The savings are proportioned among the structure
types based on projected deck area construction per year. Costs of the design and detailing effort
can be divided per bridge, per span, per total length, and per total deck area since the different
structure types are not similar in these factors. Cost savings have not been increased to reflect that
use of standard worksheets and designs may allow use of less skilled and experienced design and
plan preparation labor.
Table 7-2 Estimated maximum design cost saving per year
Structure
Type FIR Cost
FIR + FOR
Cost
FIR + FOR +
Construction
Cost
FIR + FOR +
Construction
Life Cycle
Cost
Added saving
from Partially
Integrating
Standard
Plans
Decked Slab $27,000 $82,000 $199,000 $316,000 $55,000
Decked U-
girder $115,000 $349,000 $1,496,000 $2,643,000 $234,000
Decked BT-
girder $24,000 $72,000 $281,000 $490,000 $49,000
TOTAL $166,000 $503,000 $1,976,000 $3,449,000 $338,000
FIR cost saving per year
This is the expected bridge program cost savings per year for all the structures of the bridge type
it might apply to for design and plan preparation taken only through the Selection Report and FIR
plan preparation. This assumes that the standard types are accepted as the only type that needs to
be investigated when they are applicable. Relatively little needs to be complete in the
implementation except design work sufficient to determine the cost and size of sections needed (as
far as plan sheets) to gain this savings, but design aids such as the charts or tabulation of design
capabilities would be needed as well as the worksheet defining the cross sections. It might be
difficult for plan preparation to proceed beyond this point unless at least the framework of the
girder and pier worksheets was complete, as these sections are not included in the current
worksheets.

41
FIR + FOR cost saving per year
This is the expected bridge program cost savings per year for all the structures of the bridge type
it might apply to for design and plan preparation taken from the beginning of type selection through
the FOR. This assumes all needed worksheets are available for the type selected, and that no
structural design or detailing of the actual structural elements is therefore required. Most of the
saving is the plan preparation and design that will not be required because it is included in the new
worksheets. All the plan worksheets for the bridge type need to be fully implemented for this
saving to be valid, except for work to integrate the plan sheets together (would be handled by
current methods). Note the critical path for plan preparation between the FIR and FOR is often
controlled by the time to complete the bridge designs, prepare the final bridge plans, and calculate
the bridge bid quantities. Often the QA/QC of the plans also adds to this time frame.
FIR + FOR + construction cost saving per year
This is the expected bridge program cost savings per year for all the structures of the bridge type
it might apply to for design and plan preparation and construction taken from the beginning of type
selection through Construction. This assumes all needed worksheets are available for the bridge
type selected and that no structural design or detailing of the actual structural elements is required.
Experience suggests there will be a considerable saving in the construction costs due to the
selection of structures that have standardized details and construction cost and time for a given
bridge size will be minimized. The construction cost savings is estimated to be 10% of the
construction cost based on the savings experienced by prior worksheet efforts to standardize
design. Savings in approach construction costs due to the thinner sections has not been included.
FIR + FOR + construction + life cycle cost saving per year
This is the expected bridge program cost saving per year for all the structures of the bridge type it
might apply to for design, plan preparation, construction, maintenance, and longer life taken from
the beginning of type selection through eventual structure replacement. This assumes all needed
worksheets are available for the bridge type selected, and that no structural design or detailing of
the actual structural elements is required. The construction cost saving is estimated to be 10% of
the construction cost based on the savings experienced by prior worksheet efforts to standardize
design; the saving from reduced maintenance and longer life is also estimated to be 10% of the
construction cost. Saving in approach construction cost, due to the thinner sections, has not been
included.
Additional savings from partial integration of plans cost saving per year
This is the expected additional bridge program cost saving per year for all the structures of the
bridge type it might apply to for plan preparation of a standardized sheet(s) to identify the features,
sections, member lengths and locations, skews, etc. to be used, and including all the required
design information on the substructure and girder worksheets. This should include a simplification
of quantities in some fashion, by changes in bid items, or some sort of automation of quantity
calculations from the information in the work sheet. This saving consists entirely of savings in
detailing time and effort. Note this integration would also save time between the FIR and FOR.
7.5. Estimated implementation cost
The cost to implement each major option to the worksheet level for 0 to 25-degree skew angles is
approximately the cost to design and prepare plans for three bridges of the standard type, and the
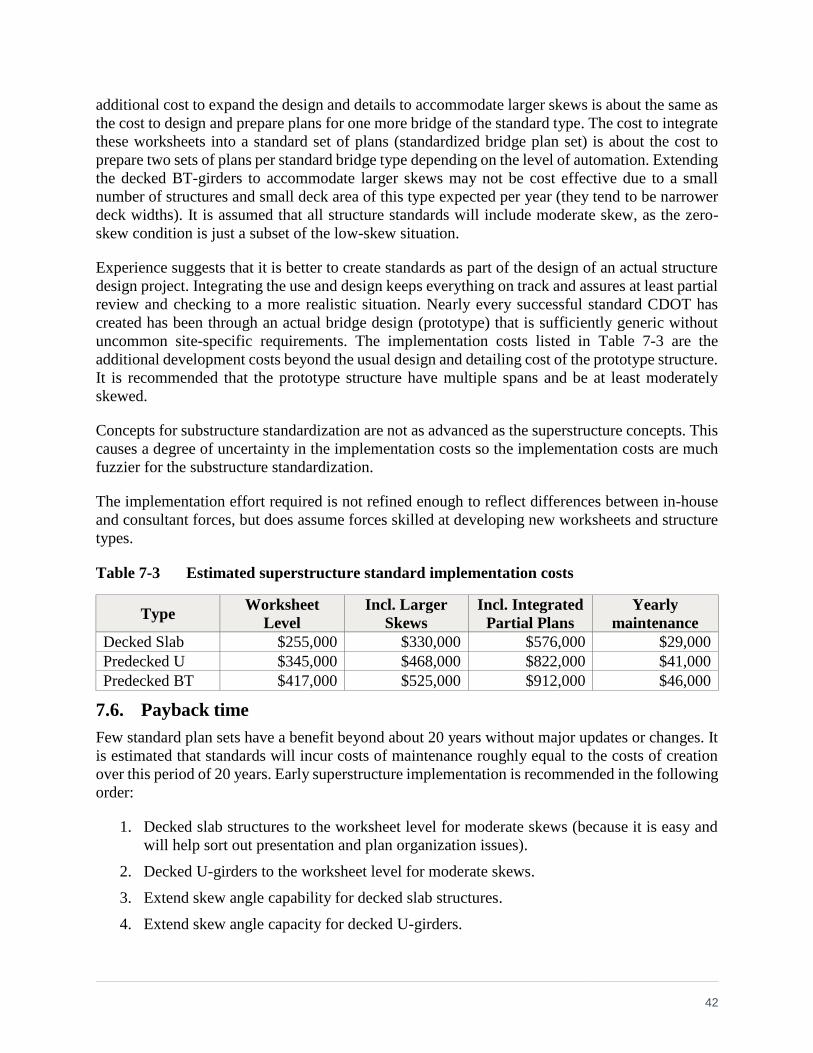
42
additional cost to expand the design and details to accommodate larger skews is about the same as
the cost to design and prepare plans for one more bridge of the standard type. The cost to integrate
these worksheets into a standard set of plans (standardized bridge plan set) is about the cost to
prepare two sets of plans per standard bridge type depending on the level of automation. Extending
the decked BT-girders to accommodate larger skews may not be cost effective due to a small
number of structures and small deck area of this type expected per year (they tend to be narrower
deck widths). It is assumed that all structure standards will include moderate skew, as the zero-
skew condition is just a subset of the low-skew situation.
Experience suggests that it is better to create standards as part of the design of an actual structure
design project. Integrating the use and design keeps everything on track and assures at least partial
review and checking to a more realistic situation. Nearly every successful standard CDOT has
created has been through an actual bridge design (prototype) that is sufficiently generic without
uncommon site-specific requirements. The implementation costs listed in Table 7-3 are the
additional development costs beyond the usual design and detailing cost of the prototype structure.
It is recommended that the prototype structure have multiple spans and be at least moderately
skewed.
Concepts for substructure standardization are not as advanced as the superstructure concepts. This
causes a degree of uncertainty in the implementation costs so the implementation costs are much
fuzzier for the substructure standardization.
The implementation effort required is not refined enough to reflect differences between in-house
and consultant forces, but does assume forces skilled at developing new worksheets and structure
types.
Table 7-3 Estimated superstructure standard implementation costs
Type Worksheet
Level
Incl. Larger
Skews
Incl. Integrated
Partial Plans
Yearly
maintenance
Decked Slab $255,000 $330,000 $576,000 $29,000
Predecked U $345,000 $468,000 $822,000 $41,000
Predecked BT $417,000 $525,000 $912,000 $46,000
7.6. Payback time
Few standard plan sets have a benefit beyond about 20 years without major updates or changes. It
is estimated that standards will incur costs of maintenance roughly equal to the costs of creation
over this period of 20 years. Early superstructure implementation is recommended in the following
order:
1. Decked slab structures to the worksheet level for moderate skews (because it is easy and
will help sort out presentation and plan organization issues).
2. Decked U-girders to the worksheet level for moderate skews.
3. Extend skew angle capability for decked slab structures.
4. Extend skew angle capacity for decked U-girders.

43
An estimate of payback time based on only implementation cost divided by plan preparation
savings less maintenance costs of the standards is shown in Table 7-4.
Table 7-4 Estimated time to recoup implementation costs
Standard Plans Years to recoup
implementation cost
Decked slab girder – worksheets 0-25̊ skew 5
Decked U-girder – worksheets 0-25̊ skew 2
Decked slab girder – extend worksheets to 50̊ skew 7
Decked U-girder – extend worksheets to 50̊ skew 2
Decked BT-girder – worksheets 0-25̊ skew 13
Decked BT-girder – extend worksheets to 25̊-50̊ skew 7
Integration of decked slab girders 2
Integration of decked U- girders 1
Integration of decked BT-girders 4
Generally, payback times of approximately three years are considered “low-hanging fruit” for
return on investment and generally will be cost effective even if subject to moderate
implementation overruns or flagging implementation results. Payback times up to seven years are
considered acceptable, and payback times of 14 years and beyond are not cost effective.
Including potential construction cost savings or life cycle savings would make all of these items
“low-hanging fruit” simply because standards can be a good way to introduce and enforce best
available practice. However, construction savings may take some time to realize and are uncertain.
While life cycle savings are more certain, they should be discounted due to the long time to achieve
payback. Decked U-girders fare well simply because they have a wider range of applicability by
number of bridges, area, length, and spans relative to either decked slabs or decked BT-girders.
These factors entered into both the average plan preparation costs and the potential savings used
for each type.
7.7. How this proposal fits with Section 5.1 goals
The primary factors are as follows:
Wide applicability is achieved by shallow depth, a large range of span capabilities,
accommodating fairly long bridges (up to 700-800 ft. with current proven CDOT integral bridge
practice), accommodating a range of span lengths rather than specific span lengths,
accommodating a range of skews rather than specific skews, accommodating a range of number
of spans in a bridge rather than just one, two or three spans, and accommodating a number of
different structure widths.
Durability is achieved by integral construction and plant production of most of the bridge. This
can be enhanced by the appropriate choice of materials in the final details, for example sealers,
membranes, or corrosion resistant reinforcing as appropriate to the structure’s environment as may
be determined by ongoing surface chloride research.

44
Flexibility for construction is achieved by ABC oriented precast pieces that require little forming
and are generally self stable once placed, and structure schemes that allow for staging construction
without falsework.
Low maintenance is achieved mostly by the elimination of joints and bearings, and sufficient
cover to allow for grinding of the deck. Appropriate choice of materials can be helpful here too.
7.8. Other worksheet needs
Some ancillary details will need to be worked out as well, but are not included in implementation
costs. These details include changes to bridge rails and curbs to make them ABC compatible,
possible changes to the Colorado M-Standards for pier protection to address the 54-inch TL5 rails
and trucks bypassing or riding over approach rails, and possibly a sheet of low-cost maintainable
highly aesthetic features. These things should be accomplished regardless of any standard bridge
plan efforts but are essential to the standard plan implementation. Integrating worksheets into
partial plan sets does not seem to have substantial benefit on FIR costs, construction costs, or life
cycle costs, but might reduce the time and costs to produce plans after FIR. Since worksheets will
reflect spans, etc., it may be practical to add quantities to the worksheets to aid in cost estimating
at all levels (as is done on the current culvert and bridge rail sheets).
Note that worksheet level only includes creating or updating worksheets specific to and for a
standard bridge plan effort for the particular types, not the full spectrum of CDOT Bridge’s
worksheets, which may need work.
7.9. Comparison to other DOT efforts
As a quick check on implementation costs, the Texas Department of Transportation has about
1,200 sheets of standard bridge plans that are used for perhaps 20 percent of new bridges built in
Texas, according to the current State Bridge Engineer. At 40 to 80 hours per sheet, this represents
perhaps 72,000 man-hours of effort. At $120/man-hour, this is potentially more than $8 million to
implement and $400,000 per year to maintain. This system works for Texas because their program
is perhaps eight times the size of Colorado’s bridge program. It would not add benefit to prepare
as many plan sheets in Colorado. Specific numbers of spans and lengths and specific skews, rather
than ranges, restricts applicability when the standard results in a poor match to the specifics of a
site. However, this approach of allowing for a range of spans and skews rather than discrete values
requires more effort per sheet to broaden each sheet’s applicability. This broader applicability to
more different span lengths, a wider range of bridge widths, more variable skews, and a greater
number of spans and span ratios will allow a Colorado standard bridge effort to apply to a larger
portion of the new bridges built in the state.
The Massachusetts Department of Transportation has spent perhaps $500,000 on a multi-year
effort to develop letter-size detail sheets of standard details for inclusion in plans. It is up to a
designer or detailer to integrate these into plan sheets. This may be useful for the host of typical
sections we may have, as an aid for report writing, and general layout creation. Volume 3 of the
Massachusetts Bridge Design Manual, which will include girders, has not been completed yet.
Pennsylvania DOT’s BRADD software is purported to have more than 750,000 lines of code. It
can complete a wide range of single-span structure types, but the system is cumbersome to
maintain, took several decades to implement, and the structure types supported are not currently

45
capable of meeting SHRP T-19 (Design Guide for Bridges for Service Life) recommendations,
goals, and ABC goals. It’s implementation and maintenance costs are similar to Texas’s standard
plans. The limitations of only providing for single span bridges would severely restrict any benefit
in Colorado.
The Wisconsin DOT’s ongoing automated design-to-plans system is perhaps more effective, but
it required a champion (the current Wisconsin Bridge Engineer) and two decades to get to the
current capability. Loss of the expert champion for a project like this can be a fatal flaw. Similarly,
any lesser effort still requires continuous (but not necessarily full time) effort by a champion for
ongoing implementation, training, and maintenance. If similar efforts will become standard in the
industry, the need for a champion will fade.
The large effort required to implement and maintain automated systems indicates that a much
larger usage base is needed than Colorado can provide. A multi-state effort with common plan
formats, details, and design policies is called for, much like the AASHTO Bridgeware Virtis or
Opus projects, though multi-state regions with common bridge needs should have enough need to
justify the implementation cost.
7.10. Other extensions of the concept excluded
A number of concepts with promise were investigated to a degree, but are not part of the proposed
implementation. These concepts include capless piers, stretcher slabs to widen U-girder spacing,
varying decked girder widths to accommodate differing live-load and composite dead-load
distribution between interior and exterior girders, girders decked only to the extent needed to serve
as stay-in-place formwork, higher live-load capacity for designated truck corridors, designs to
accommodate light rail or commuter rail, structure types applicable mostly to off-system
structures, and fully tensioned closures at piers. All these concepts are useful and could be
economically implemented as a standard as part of a large project implementing at least several
structures of one of these types. Inclusion at this point would only multiply the number of options
to be dealt with and would hinder implementation.
46
8. SUBSTRUCTURE
In order to provide bridges meeting the requirements for durability, economy, and capability of
accelerated construction, the basic design behaviour and configuration of substructure units must
be defined. Some conceptual ideas presented herein can be expanded upon approval of the
proposed superstructure standards. More comprehensive assessment of potential substructure
standards cannot be completed without finalizing the direction for development of the
superstructure standards.
8.1. Recommendations for integral behavior
Provide fully integral construction: Standard practice starts with CDOT current integral-length
limits while allowing for future expansion of length limits as the practice of designing integral
structures improves. The capability of a 0 to 4 inch expansion joint at the end of approach slabs
may limit the expansion length limit, although using higher movement expansion joints can
remove this limitation. For example, one structure in service in Colorado has finger joints at this
location to allow an integral length of more than 1,000 feet.
Where columns are asymmetrical, (HP shapes) and when skew is small, orient piles so that strong-
axis bending resists longitudinal motion, and orient the strong axis to resist transverse motion when
the skew is large. Large skews on long structures also may require pile battering transverse to the
structure axis to prevent structure twisting.
Design should assume a plastic hinge at top and at point of fixity of each pier shaft with plastic
behavior at full factored load (hinged at bottom and top (K = 1)).
8.2. Recommendations for pier and abutment standards
The superstructure standards will ultimately have tabular information including reactions on the
substructure units. The standards are recommended to:
Spread foundations
Prevent the use of spread foundations for permanent supports where there is a scour risk in the
500-year flood event. Spread foundations use should also be prevented at abutments of multi-
span bridges where the residual settlement is expected to exceed 0.005 of the adjacent span
length.
Limit the peak ultimate soil bearing pressure to six TSF and provide a means to reduce bearing
pressure to less than three times the adjacent surcharge at edges of soil-bearing area (Limitation
may be achieved by inserting a thin tapered layer of geofoam under the top layer of filter
material, or by applying load eccentrically on a spread footer).
Columns, shafts, and piles
Figure 8-1 and Figure 8-2 illustrate the following points:
Interface with girder standard plan tabular information that will provide factored axial load
(Pu) capacity required for each column or pile.

47
Include a column selection table with the maximum Pu (axial capacity) and maximum
unsupported length for the various column sections.
Use Grade 50 steel compact shafts such as HP shapes or square or round steel tubes filled with
6-ksi concrete.
Columns should be capable of resisting 125K vehicle collision (CT) load or more at any
location between the ground and 14 feet above the ground (incidental impact in zone of
intrusion). Identify any shafts capable of resisting the 600K CT load in the table.
Do not include full LRFD impact loads in column design. On standard plan note requirement
for shafts adjacent to a roadway that do not meet the CT load strength, or either code minimum
offset from lane to column, or provision for a concrete barrier protecting the shaft. Satisfy
railroad impact provisions by providing their required track to column offset.
Ensure KL/r from seat to point of fixity < 114 (assumed as locations of plastic hinges)
Distribute lateral loads based on relative stiffness, i.e., most external transverse and
longitudinal loads go to abutments.
Limit factored axial load to (0.33 x Fy x As) for H piles or the greater of 0.4 x (Ac x f’c + Fy
x As) or 0.6 x FyAs to control driving stresses and minimize the reduction of flexural strength
and stiffness from axial load, allowing a high drift ratio and high lateral resistance before
distress.
Allow shafts grouted into holes drilled into the ground, or shafts driven into the ground, or
shafts grouted into sockets in precast footings at piers (detail not proposed for incorporation in
standard due to limited application)
Note that AASHTO is considering changes to allow greater design capacity of round filled
tubes. Should this happen, this increased flexural and axial capacity might be utilized in the
case of shafts concreted into holes drilled into the ground. Much research has been published
in the last year, and AASHTO voted on some LRFD modifications to facilitate this.
Provide increased durability by attaching a sacrificial zinc anode 1.5 feet below the finished
ground line
Provide column spacing to fit the structure width module (15.5-foot module + 1-foot tot for
bridge edges, i.e., 32-foot wide structure has two columns spaced at 15.5/Cos (skew), the 47.5-
feet-wide structure has three columns at the same spacing.

48
Figure 8-1 Elevation – recommended pier or abutment standard precise cap detail
Figure 8-2 Section – recommended pier standard precast cap detail
Caps for piers and abutments
Include a table of standard designs based on factored girder reaction per 15.5-foot unit bridge
width.
Tabulate dimensions and reinforcing requirements with column/shaft data for each shaft size,
with notes on applicable minimum substructure depth to apparent fixity.
Allow twice as many piles to be used (1 per 7.75 feet of bridge width, with half the Pu per pile)
at the discretion of the engineer
Provide a corrugated socket for the top of the shaft.
Slope to match the grade and cross slope of the bridge.
Be hinged at the seat.

49
Be designed as composite between lower cap and upper diaphragm/span closure.
Include a row of dowels and a hinge with the dowels anchored in closure concrete.
8.3. Recommendations for use of approach slabs
The use of approach slabs can provide some flexibility when the approach is expected to settle
relative to the abutment. Approach slabs also provide a means to add expansion joints to the ends
of integral structures. The following guidelines are recommended for the use of approach slabs.
If thermal motions require an expansion joint:
For foundations on continuous spread foundations immediately under the integral abutment
the abutment depth (H), noted below may be increased by the width of the spread foundation
to reflect the additional flexibility of the soil under the abutment.
No approach slab is necessary when abutments are a distance from the point of fixity (Lt) less
than 11H.
For concrete bridges with asphalt approaches, abutments with Lt less than 44H may not require
approach slabs with joints due to uncertainty of actual motions. If possible, install an approach
slab on a sleeper, and wait a few years and see if there is approach pavement faulting. If there
is faulting convert one end of the approach slab to a condition with an expansion joint. If there
is significant differential settlement of the approach with respect to the abutment continuing to
occur, this joint should be at the abutment end of the approach slab, to allow for corrections of
approach grades as a part of routine approach pavement maintenance.
Provide approach slabs with expansion joints for abutments of steel bridges with Lt greater
than 11H.
Provide approach slabs with expansion joints for abutments of concrete bridges with Lt greater
than 44H.
If differential settlements require an approach slab:
If there is no significant grade change at approach (< 3 feet), settlement should not be
significant (should be less than 0.5 inch) unless approach soil is very poor.
If expected residual settlement is greater than 0.5 inch, an approach slab should be used if the
approach pavement is concrete. Residual settlement should in all cases be assumed to be at
least one-sixth of the predicted ultimate settlement after any surcharging or construction timing
to reduce settlements. Approach slab lengths should be at least five times the speed (mph)
times the amount of residual settlement.
With asphalt approach pavement, do not use approach slabs for settlement mitigation alone.
Approach settlement differentials can be more effectively corrected by routine asphalt
pavement restoration. If both settlement mitigation and thermal motion mitigation are required
(Lt > 11H), an approach slab with the joint at the abutment end is required.
8.4. Recommendations for abutment backfill and wingwalls
If an expansion joint is required at the end of an approach slab, provide MSE backfill wrapped 2-
inches clear from the back of the abutment. For wingwalls, backfill the tip and front sides of

50
wingwalls using flowfill, except for a top 4 inch layer of topsoil. For GRS-IBC construction with
girders placed directly on soil, provide a 30-inch depth of Class A filter material below girders
wrapped in filter cloth in 10-inch maximum layers.
Construct wingwalls integral with the abutment endwall/diaphragm. Orient wingwalls for
minimum length by bisecting the angle between the road and abutment. Wrap-around MSE walls
can be used as wingwalls, but they require more time to install compared to precast concrete
wingwalls. Do not use excessively long wingwalls. If necessary, use short to modest length
wingwalls and continue the length with a separate retaining wall not connected to the bridge.
Reinforced concrete paving is commonly used for slope protection at abutments. To facilitate
accelerated construction and make slope protection construction less weather sensitive consider
other slope paving materials such as concrete pavers, slope mattresses, or even stepped MSE walls.

51
9. MISCELLANEOUS DETAILS
9.1. Type 10 bridge rail curb shell
To speed construction, a stay-in-place formwork of Fiber Reinforced Cementitious Composite
(FRCC) could be used and filled with concrete when girder-to-girder joints between the precast
decked sections are completed and could even be attached prior to shipping. Besides speeding
construction, no formwork would need to be removed, saving a construction step and reducing
traffic impacts. An outer shell of FRCC might be more durable and crack resistant than regular
cast in place concrete for the curbs.
9.2. Type 7 bridge rail shell
To speed construction, a stay-in-place formwork of FRCC could be used and filled with concrete
when girder-to-girder joints between the precast decked sections are completed and could even be
attached prior to shipping. Besides speeding construction, no formwork would need to be removed,
saving a construction step and reducing traffic impacts. An outer shell of FRCC might be more
durable and crack resistant than regular CIP concrete for these rails.
9.3. TL5 pier protection
The vehicle collision force (CT) loading is not always practical for pile bents or small piers, as the
600K CT load requires a large column to resist it. The large columns are often very stiff, precluding
integral construction if too short in length. The code allows the use of a 54-inch TL5 traffic rail in
lieu of the CT design load. Several crash-tested rails are available, and the appropriate sheets of
the M-Standards could be modified to include one of these shapes. Alternatively, the shorter Type
7 traffic rail could be used with provision to keep trucks from either getting behind the rail and
hitting columns from the back, or mounting the rail and sliding along it into the pier. The column
would then only be subject to the much smaller CT load from the parts of the truck leaning over
the rail into the zone of intrusion. Because this is not a provision of AASHTO LRFD, CDOT
would need to choose to accept the CT load reduction.
Many states are struggling with 54-inch TL5 rail pier protection or 600K pier collision loads, their
costs, and effect on ABC.

52
10. PROPOSED STANDARD BRIDGE DRAWINGS
10.1. Description and goals
The essence of creating standard bridges is to eliminate customization of sheets to the greatest
extent possible. Reduce information to the essential to describe the product required, while still
not requiring design effort on the part of the contractor, besides his usual means and methods. This
includes leaving erection method design to the contractor, since it tends to be site specific. If
information is duplicated elsewhere in the plans, it should not be included in the bridge standard
plans. Duplication of information should be eliminated within the bridge plans, with the possible
exception of bridge geometry input data, which is often needed for proper checking and to track if
the roadway design has changed since the bridge plans were assembled.
Sheets marked with an asterisk (*) may be optional in the development of a system of standard
drawings for precast bridges and may be developed as a template only.
10.2. General notes and summary of quantities*
In many ways, this sheet will be similar to the current worksheet however, the materials, bid items,
and notes will be different. A different template or example sheet will also be helpful. For the bid
items, some could be the same: rails, asphalt, membrane, expansion joints, backfill. Some others,
most appropriately measured and paid by square foot (SF) such as the slab girders in various
depths, approach slabs, and wingwalls, should be different. Others, such as the decked U- and BT-
girders, should have items based on their nominal width and paid by linear foot (LF). Caps and
shafts should have items based on load capacity groupings and paid by LF. End diaphragms/stay-
in-place end forms, and grout to fill joints between girders and make continuity closures should be
included in the girder work (or paid by LF). Concrete to fill shafts and concrete shafts into drilled
holes in the ground should be included in the price of the shaft or pile. Bare-deck slab girders made
continuous might benefit from some continuity unbonded tensioning in the joints between slab
girders to keep any cracking at the deck top at the construction joint tight when there is no overlay.
This can be either paid on the usual basis or included in the work.
10.3. General layout*
This sheet will include similar information to current general layout sheets. In many cases, geology
and hydraulics information could be included here unless there is too much information to show
on the sheet. Large structures may require more than one sheet to maintain a reasonable scale.
Most data on this sheet duplicates data in other areas of typical plans; therefore, for the most simple
structures, those with simple geometry, no utilities, no construction staging, no fences, or walks,
no special hydraulic features, it might be possible to treat them like standard box culverts are
treated, with site data presented on the roadway plan and profile sheets.
10.4. Engineering geology*
This sheet exists to show the juxtaposition of the test hole data to the structure. Historically, the
test hole data was shown on general layouts, but in the last two decades was moved to its own
sheet. If the general layout sheets are not too cluttered than it may be possible to return the test
hole data to the general elevation sheet.

53
For GRS-IBS spread-foundation style structures, there may be few test holes whose precise
positioning is not critical, so the engineering geology information could be presented on the
roadway plan and profile sheets.
For structures with deep foundations, or foundations on rock, there is usually at least one test hole
per substructure unit, and juxtaposition of the holes and materials to the bridge is critical, including
for determining quantities and pier shaft lengths. The scale of roadway plan and profile sheets is
frequently too small to accommodate either the number of test holes or the precision of plan and
elevation locations.
10.5. Construction layout*
This sheet may not be needed if the general layout includes information on rail types, overlay,
walks, fences, and utilities. This sheet is also not needed if there is another sheet, such as the
prefabricated parts and stick figure that dimensions skews, lengths along the girders and caps, and
identifies all the members, including wingwalls.
10.6. Footing and piling layout*
Including this sheet will be a judgment call. If there are underground utilities or obstructions near
the foundations, a custom footing and piling layout should be included. Design data normally is
included in the geology report.
10.7. Prefabricated parts list and stick figure
This sheet ties the standards for the pieces together into a standard bridge package, but maintains
some flexibility for span lengths and skews. This sheet contains the basic configuration of the
structure showing members as a stick (line element), with an ID more fully described on the
standard details for each prefabricated member and showing its orientation by skew, station,
member type, and length. For longer and wider bridges, this might require multiple sheets. This
sheet will require at least a few notes.
The CDOT geometry program has a utility “stick” that can generate at least the plan view from
the bridge geometry program’s output. It might be possible to modify the “stick” to include the
identifier labels and member lengths.
A checklist of optional items—like aesthetic enhancements, reinforcing type, coating and color,
overlay type, rail type, fence type, and drains—could be included on this sheet.
It remains unclear if just using an identifier to the appropriate detail with length will be sufficient,
or whether there needs to be a tabulation of all the pieces. Providing the tabulation would increase
the effort to complete this sheet considerably, but might offer the possibility of customizing items
like the required embedment lengths of the shaft members in various soils encountered. It is
possible that this can be covered by notes on the substructure standard sheets.
An optional typical section sheet should be considered to identify elements like sealer, surfacing,
rail types, fences on the structure, lane and shoulder widths (usually shown in roadway sheets), as
well as to illustrate the typical section. Since this sheet does not need to show skew, crown, cross
slope, etc., it may be practical to make a MicroStation kit sheet file with layers for all these things

54
that can be turned on (layer for each of the widths and rail combinations, and overlay or not, layer
for each girder type). Depending on the completeness of the checklist, this feature may be
unnecessary, except that this might be useful for selection reports, as might the stick figure.
10.8. Girder standard sheets
Each girder type requires detail sheets. In many ways, these will be similar to existing girder
worksheets and will contain:
A detailed section showing reinforcing.
Notes, similar to those used on the current girder worksheets, with perhaps a few related to
timing and amount of unbounded tensioning, and to the top of deck concrete criteria.
A basic plan view showing deck steel orientation and how it varies along length and showing
location of bar projections for rails. Possibly other details can be shown here.
An elevation that shows schematic strand paths and how stirrups vary along the length, bars
and strand projections into closures at substructure.
Dimensioned sections of the spectrum of girder sizes for the girder type, probably located on
a second sheet (potentially listing properties). There may be two widths and four depths for the
decked slab section, three widths with three depths and two web thicknesses for the decked U-
sections, and three widths and three depths for the decked BT-sections. For custom designs
(not those intended for standard bridges), a few deeper decked U- and BT-sections might be
helpful. If shipping weight limits should relax in the future or if a structure needed to carry
additional loads or deflect less, these sections could be used.
A tabulation of designs, containing for each girder section the section ID, simple, interior or
end span, length, dimensions, prestressing data, expected deflections, etc., as needed to
complete the girder design. This may take several sheets, since there is a lot of data needed to
define the girder design, with several depths and widths for each girder type and probably a
minimum of two and possibly several more lengths for each of these such that the design data
can be interpolated accurately for the actual piece lengths. A great amount of design, but little
detailing, goes into the creation of these tables.
Space for a tabulation to be filled in by the designer, either to do any interpolation needed, or
more likely to use the sheet as the current worksheets are used, for a custom design. Plan sets
that use this fill-in tabulation of girders do not need to include sheets with the tabulations of
designs for the standard girders.
Since format of the sheets, details, notes, etc., will take some effort to perfect, it is best if a structure
type’s girder sheets are carried through everything but the tab of design data for the standards, and
a prototype structure built, prior to populating the tabulation of standard designs.
10.9. Miscellaneous details related to the girders
Several sheets are needed to fully include the miscellaneous girder details not included in the girder
details sheets. Specific details to include are:
Closure pours.

55
Diaphragms/closure formwork.
Curb or concrete rail interface with girder edge.
Keyways.
Post-tensioning.
Vertical deck elevation matching methods.
Levelling pads.
Any embedded items likely to be needed.
Edge of end of girder shop alignment adjustment to deal with misalignment from changing
skews each side of a pier
10.10. Prefabricated pier shafts detail sheets
Includes tabular data for the load capacity and maximum effective length of each size pile or
HSS planned.
Only the largest of each HP series is compact for Grade 50 steel.
Round HSS will need to have a diameter-to-wall thickness of about 63.8 maximum (this may
be changed by proposed code revisions).
Square HSS will need to have a size-to-wall thickness no greater than 35.7.
Load per shaft at interior piers and abutments needs to be one of the pieces of design
information provided for each tabular girder entry.
10.11. Precast pier caps
Each size and load on a shaft has a standard cap size associated with it.
The more severe skews may need cap flexural reinforcing that increases with the severity of
the skew.
Caps probably should be detailed in two-column or three-column units so that they can
accommodate useful staging and have sizes that are easy to fabricate and handle. It is not
known at this time whether the units should be left disconnected except for the upper closure
diaphragm and deck keyways or should be connected as well.
10.12. Spread foundation support at abutments
Deep foundation support should be able to use the same cap and shaft tabulations as the piers
with the abutment reactions in the girder table.
Foundation soil details will be needed for decked slab girders supported directly on GRS
abutments. It is unnecessary and impractical to implement the retaining wall component of this
system, since it would be too site specific. Standard retaining wall designs—either Block MSE
or CIP walls—can be utilized for this element. Connection to the wall facing should be avoided
to prevent detail dependencies between the two structures (wall and bridge).
56
10.13. Wingwalls
Two types of wingwall systems are expected to be developed:
Precast concrete wingwalls made integral with the abutment and end of superstructure.
o Severe skews may require special attention as the wingwalls resist lateral loads and the
skew may contribute to additional wingwall loads.
o Walls should not be turned back to run along and close to the edge of road. Minimum wall
size occurs with a wall bisecting the acute angle between the edge of bridge approach and
the line of the abutment.
Small MSE walls
o These walls take longer to construct than the precast concrete wingwalls and require
different materials and skills to construct, but still may be a good choice in many locations.
o Taller wall systems are efficient in MSE, but are recommended to be independent walls
and not connected to the abutment.
10.14. Precast approach slabs
Consider using precast approach slabs with the same modular widths and key details as the slab
girders, with spans from perhaps 10 feet to as much as 38 feet. A sleeper slab may be required at
the end in some situations.
10.15. Backfill details
Current details can be used as a guide for developing these details.
10.16. Aesthetic enhancement details*
Details (texture, color, relief, patterns, text, logos) on:
a. Outside face of railing,
b. Outside face of girder, and
c. Face of wingwalls
Color on shafts.
10.17. Slope protection details*
Current slope paving details should be adequate.
Riprap gabions are likely to be faster and less weather sensitive. Since they are flexible, less
slope preparation should be needed than is needed for slope paving.
There are other modular slope protection schemes.
10.18. Expansion joints at approach slabs*
Existing joint details may be acceptable. A retrofit detail may be helpful for those cases where the
requirement for a joint is uncertain, or if approach pavement is later retrofitted with concrete
pavement.

57
10.19. Bridge rails*
Existing rails should work, but a variation with a precast shell for the concrete part may speed
construction considerably.
10.20. Fences attached to bridge rails*
Existing fence details should be acceptable.
10.21. Geometry sheets
Existing sheets should be fine, but since there is no capability of matching grade at mid-span, there
is no reason to include nth points.

58
11. RECOMMENDATIONS
For maximum return on implementation costs, it is recommended that CDOT develop a new series
of worksheets, rather than full standards. This will allow the details to be developed and used
quickly ensuring benefits are achieved as soon as possible. New superstructure sections capable of
use with accelerated bridge construction techniques should be developed as part of this effort.
Three new precast prestressed concrete sections are recommended for development: decked slab
girder, decked U-girder, and decked BT-girder. The worksheets should be developed in an
incremental fashion beginning with easily achieved worksheets that will have immediate use and
progressing to more complex elements with design utility at each stage.
The development and implementation order is recommended to be:
1. Worksheets for decked slab girders with moderate skew,
2. Worksheets for substructure compatible with ABC,
3. Worksheets for necessary table-driven design data for decked slab girders,
4. ABC bridge worksheets for decked U and decked BT-girders,
5. Worksheets for necessary table-driven design data for the decked U or decked BT-girders,
6. Worksheets for miscellaneous ABC details, such as:
a. Precast concrete approach slabs,
b. Precast concrete wingwalls,
c. Expansion joints at approach slab with guidance to when needed,
d. Slope protection,
e. Altered bridge rails for ABC,
f. Pier collision details—altered M-Standards sheets for 54-inch TL5 protection of piers,
g. Integration worksheets to fit these together, i.e., worksheet for element description of the
elements in a bridge and their relationship to each other, and
h. Expand worksheet capability for more severe skews, etc.
To ensure that standards and worksheets are maintained, budget for sufficient resources to
maintain standards and develop new worksheets. Assign a Champion and Assistant Champion for
the long-term monitoring and progress of the project with enough time allocated for the task.
Report on progress and prioritize needs each year.
It is best if the Champion can be filled on a long-term basis by someone with both technical and
plan production expertise. Promotion of champions to largely administrative duties can hinder
long-term viability. This effort is expected to take at least five years to complete, and requires
maintenance for a long time to keep up with best practice, the AASHTO code, CDOT’s Bridge
Design Manual, and Colorado practice changes.
Focus can be maintained by utilizing real prototype bridges for each stage. Implement or improve
a process for approval and release of worksheets (this applies to BDM as well) so completed work

59
is not delayed indefinitely. Consider adding worksheets for partial-depth decked sections using
similar to the decked superstructure sections recommended. This will require additional sheets
describing the top mats of deck reinforcing.
Coordinate with other similar states to reach common ground on automated plan details and see if
the AASHTO T-19 subcommittee on computers or AASHTO BridgeWare can provide assistance
in developing automate plan sheet detailing.
Have champions keep up with potential code changes and their impact. Have champions and their
assistants attend the AASHTO bridge subcommittee meetings to be aware of what other states are
doing and what AASHTO is planning.
See if the CDOT personnel office can be convinced that higher pay levels should not be reserved
only for those who manage, but also for technical leaders to maintain long-term stability for
technical advisors and organizational memory on technical issues.
Consider a bulletin board or location for posting Q&A about technical design issues pertaining to
CDOT Bridge, i.e., emailed questions forwarded to subject matter experts and responses posted.
Break into sections about current worksheets, future worksheets, the BDM, etc. Questions have
been asked and been answered before, but communication is mostly one-on-one and not shared
laterally. Also, questions and answers are not shared forward in time. Most issues have come up
before.
Design and build a prototype bridge. The minimum for this is to detail the framework of the
worksheets for the girders in one of the suggested types, and the framework for the precast
substructure. Make a custom design using these worksheet frameworks as a part of the design
plans. The frameworks for the worksheets can be completed using data for other designs and
updated using what is learned from this process.
Potentially useful related research:
Strength of overlapping loop connections, including higher strength steels, such as 75 and 100
ksi yield reinforcing and larger bars. This can remove excess conservatism.
Low shrinkage, low cracking, fast setting 6 ksi concrete for keyways, continuity closures, shaft
fill, and rails and curbs. Needed for fast construction and long-term durability.
Stay-in-place fiber reinforced cementitious composites (FRCC) formwork to eliminate the
need for formwork removal.
Monitor effectiveness and variability of actual camber control. This can potentially reduce or
eliminate, in some cases, the amount of monostrand prestressing needed, reducing cost and
simplifying construction.
Monitor actual live-load “in service” deflections, a critical design criterion that may have a
low correlation to actual behaviour or actual requirements. This could allow shallower
structures.
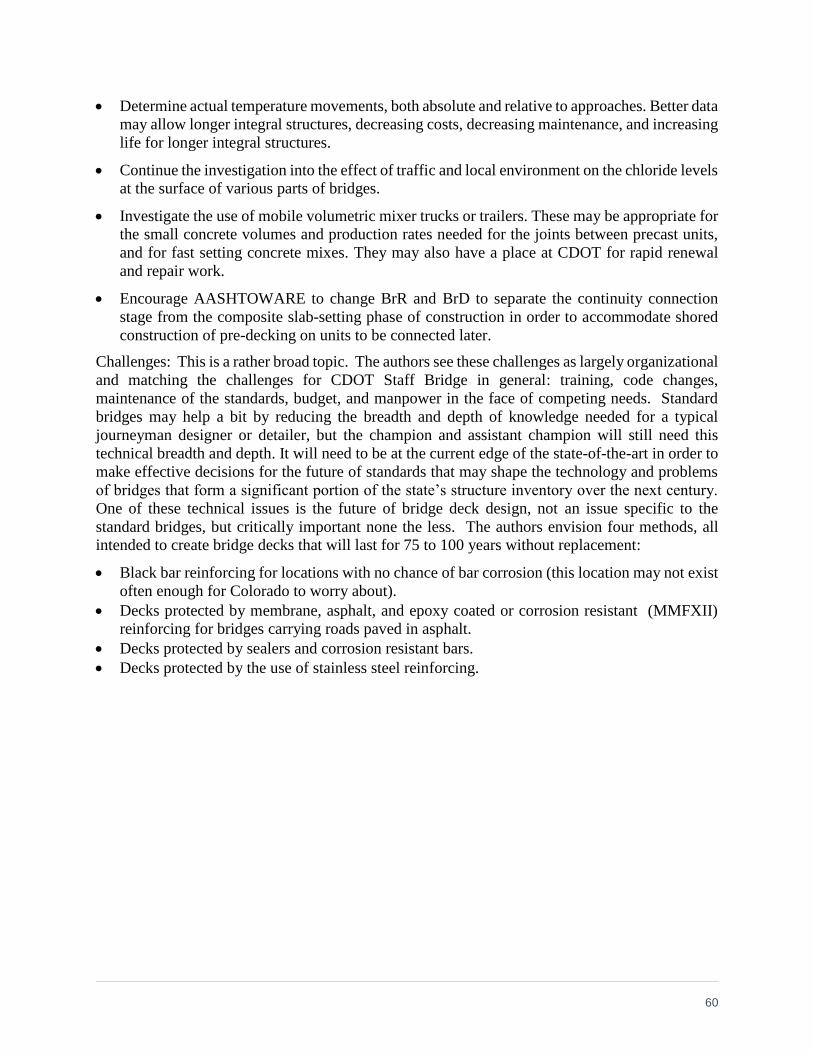
60
Determine actual temperature movements, both absolute and relative to approaches. Better data
may allow longer integral structures, decreasing costs, decreasing maintenance, and increasing
life for longer integral structures.
Continue the investigation into the effect of traffic and local environment on the chloride levels
at the surface of various parts of bridges.
Investigate the use of mobile volumetric mixer trucks or trailers. These may be appropriate for
the small concrete volumes and production rates needed for the joints between precast units,
and for fast setting concrete mixes. They may also have a place at CDOT for rapid renewal
and repair work.
Encourage AASHTOWARE to change BrR and BrD to separate the continuity connection
stage from the composite slab-setting phase of construction in order to accommodate shored
construction of pre-decking on units to be connected later.
Challenges: This is a rather broad topic. The authors see these challenges as largely organizational
and matching the challenges for CDOT Staff Bridge in general: training, code changes,
maintenance of the standards, budget, and manpower in the face of competing needs. Standard
bridges may help a bit by reducing the breadth and depth of knowledge needed for a typical
journeyman designer or detailer, but the champion and assistant champion will still need this
technical breadth and depth. It will need to be at the current edge of the state-of-the-art in order to
make effective decisions for the future of standards that may shape the technology and problems
of bridges that form a significant portion of the state’s structure inventory over the next century.
One of these technical issues is the future of bridge deck design, not an issue specific to the
standard bridges, but critically important none the less. The authors envision four methods, all
intended to create bridge decks that will last for 75 to 100 years without replacement:
Black bar reinforcing for locations with no chance of bar corrosion (this location may not exist
often enough for Colorado to worry about).
Decks protected by membrane, asphalt, and epoxy coated or corrosion resistant (MMFXII)
reinforcing for bridges carrying roads paved in asphalt.
Decks protected by sealers and corrosion resistant bars.
Decks protected by the use of stainless steel reinforcing.

61
12. GLOSSARY
Abutment: The end support of a bridge. Usually incorporates a backwall to separate the girders
from the soil in the approaching road.
Accelerated Bridge Construction (ABC): The name for an ongoing effort to speed construction,
thereby reducing user costs. This is an ongoing focus of the Federal Highway Administration
(FHWA).
American Association of State Highway and Transportation Officials (AASHTO): The
governing and code creation body for Highway design in the United States (US)
Load and Resistance Factor Design (LRFD) Bridge Design Specifications: The most modern
bridge design practice, LRFD, codified. This attempts to be a reliability based method. Gradually
more and more design aspects have their design method calibrated against desired levels of
reliability.
Approach slab: Transitions the surface of the bridge to the surface of the approaching road. This
is sometimes needed and sometimes not needed.
AutoCAD: A CAD program.
Automated design: Sometimes called Computer aided Design and Drafting (CADD).
Back wall: Separates approach road soil from girders.
Backfill: Soil used to fill a hole, including holes made to build foundation elements of a bridge.
Bearing: For bridges, a structural element to allow relative movement in one or several directions
of a supported structure relative to its support.
Box culvert: Basically a large rectangular pipe.
Bridge Automated Design and Detailing (BRADD): A CADD program for designing and
detailing single span bridges.
BT girder: Bulbed Tee Girder (BT), an I-girder shape with a very wide top flange
Camber: The humping up of a horizontal structure. Sometimes built in deliberately to follow a
road profile, but for prestressed concrete structures more often a consequence of longitudinal
forces applied along the bottom of a structure. For example, pretensioning or post-tensioning
applied to strengthen members.
Cap: A Structural element to connect columns and girders, especially when girders do not connect
directly to columns.
Cast-in-place (CIP): Concrete formed, poured and cured in its final location.
Columbus Engineering Co. (CEC) Engineering: An Engineering firm based in Columbus, Ohio.

62
Colorado Department of Transportation (CDOT): A division of the executive department of
the government of the State of Colorado USA
Bridge Design Manual (BDM): A collection of policies specific to CDOT structures, but used by
others as well
Colorado Miscellaneous Standard Plans (M-Standards): Some pre-approved standard plans
for use by CDOT for their highway structures, but used by others as well
Computer Aided Drafting (CAD): Graphics programs intended as a means of drawing plans.
Concrete box culvert: A box culvert made from concrete.
CONSPLICE: An analysis program for concrete composite, precast, prestressed, post-tensioned,
or reinforced concrete girders that allows for various combinations and the splicing of the various
sections.
Construction cost: The cost to construct a project or element of a project, usually including
overhead, but not planning costs.
Continuous: Structural members do not stop and start at each support.
Cost-benefit ratio: Simply the ratio of costs to an estimated value of the benefits provided by the
product of those costs.
Cracking: Crack formation after construction or initial placement of materials. Common or even
necessary in construction with concrete, but the size and amount of cracking contributes to
deterioration, and very and long cracks can cause a significant loss of strength.
CT load: The load from collision of a heavy truck directly into a bridge element (not a glancing
impact)
Dead load: The weight of a structure.
Deck: The structural element that supports the traffic.
Deck slab: See deck
Design variable: Designing requires computations that require input data for those computations.
This input data are design variables.
Diaphragm: A form of bracing member.
Exterior girder: The girder at the outside edge of the bridge. Since the other girders are on only
one side it is less able to share loads with adjacent girders. This can result in a larger portion of
live loads to this girder if they are positioned over the girder. This also results in a higher risk of
failure if overloaded.

63
Ultra High Performance Concrete (UHPC): Concrete with high tensile and compressive
strength, high crack resistance, ductility, and with self-consolidating concrete (SCC)
characteristics
Fiber Reinforced Cementitious Composite (FRCC): A cement based material with reinforcing
for tension fiber (usually over 1% by volume). This usually has some ductility and substantial
resistance to cracking. A common example available from lumber yards is tile backer board. This
is coming into use as a potentially thin construction material that can now be used outside of the
factories than make such things as tile backer board. UHPC is usually an FRCC, but is normally
more fluid (SCC) and has an unusually high strength as well, characteristics which are not
necessarily needed in all applications. For this report, this material is considered for stay-in-place
formwork since it can be worked and connected similarly to plywood used for concrete forms, has
a similar strength as plywood, but does not deteriorate with time like plywood, and therefore, does
not need to be removed once the concrete is set. Unlike plywood, it can be cast into various shapes.
FIR: A meeting that occurs once costs are relatively settled and design issues identified. This
meeting usually makes sure everyone agrees on scope and is designing to the same criteria. For
Bridges this means that the data that would be on a general layout is agreed to.
FOR: A meeting similar to the FIR, but all the, design, plan sheets, and quantities are included.
Foundation: Normally the element that transmits the loads to the earth.
Geometry: The detailed shape of a road or structure.
Geometry control: Usually reference data that other aspects of geometry are measured against,
but also means to assure that the final shape of a bridge conforms well enough to the desired shape.
Geosynthetic Reinforced Soil-Integrated Bridge System (GRS-IBS): A combination of
Retaining wall of the reinforced soil type (MSE) with the superstructure end sitting directly on the
soil without a cap or structural elements carrying the structure and live-load forces to a lower level.
Girder: A horizontal beam or member that carries load from where it is applied to a support by
means of internal force couples. As opposed to a truss or arch which do not have significant internal
couples in their members to carry these loads
Haunching: In this context, the girder gets deeper near the piers. Also, a term for a concrete build
up between girders and decks to adjust the geometry of the deck to differ from that of the girder.
I girder: A girder with a cross section that is roughly I shaped.
Implementation cost: For this report, the costs associated with implementing the
recommendation. Mostly labor costs with associated overhead.
Integral construction: A structure that is made in a single piece. Since failure and deterioration
usually originate from at the junctures of separate pieces, these structures have lower rates of
deterioration, require less maintenance, and are tougher due to having many ways to transmit a
load from where it is applied to the ground. These many ways can make design more difficult as

64
it can be uncertain how loads are transmitted. Often it is unimportant whether the design is precise
or not if all the elements have some ductility (ability to bend without breaking).
Interior girder: A girder that has at least one other girder on each side. These tend to share loads
applied to them with girders on both sides and be more resistant to failure than exterior girders as
a result.
Joint: A small gap between structural elements, usually to simplify analysis or to allow motions
from temperature changes, though sometimes simply a result of the pieces the structure is built
from.
Jointless: Usually refers to no joints in the deck of a bridge from the back of the abutment at one
end to the back of the abutment at the other. Integral bridges are intrinsically jointless, but often
jointless bridges contain bearings, and are therefore are not Integral.
LDFAC: Live-load Distribution Factors (LDFAC), a program to calculate how live loads should
be distributed to girders, and from girders to caps or substructure.
Life cycle cost: The total cost to build and maintain a structure from conception to ultimate
replacement or demise.
Literature review: A search for other reports on the same topic or closely related topics. A
literature review is necessary to address the purpose of making a report or a decision about what
additional problems need to be addressed. This is important to making decisions on a new topic.
Live load: For highway bridges, the loads due to the moving things the bridge is designed to carry,
mostly the weight of trucks, cars, and pedestrians.
Live-load distribution: How much of the live load flows to a particular resistance path such as a
particular girder or bearing.
Live-load deflection: Deflections from live load. Usually midspan girder deflections from the live
load specified for this. Normally restricted to a low value to control other related factors such as
vibration. Limits on this usually helps assure sufficient stiffness to avoid problems from factors
not addressed by the design codes, such as variability of dead-load deflections, flutter in wind,
unacceptable creep deflections, etc.
Mechanically stabilized earth (MSE): Soil or earth with tension reinforcement to improve
behaviour. This can allow higher loads to be applied by foundations, and can allow steeper slopes
than could naturally occur.
Merit: A measure of the weight of material used in a bridge, expressed in terms of what those
materials cost in 1994. This includes substructure costs since this is a large factor in choosing the
optimum spans. If this was reformatted for this year’s costs, the numbers would be perhaps 2.5 to
3 times larger. A useful measure of what precast girder type and span length is most cost effective.
Best used as a decision aid in choosing girder type and span lengths. It can reveal relative cost
differences between options, but is not particularly useful for estimating total costs.

65
MicroStation: A CAD program. Currently used by all states. Fills the role formerly filled by
AutoCAD in Colorado.
Moment: Is a measure the tendency of a force to cause a body to rotate about a specific point or
axis. It is what makes beams bend.
NExt beam: New England eXtreme Tee (NEXT). A new girder type being used around the
country. It fills the gap that twin tees did not fill well due to their narrow stem that did not allow
for continuity or substantial prestress force.
Off-system: A categorization of bridges that means they are not owned by the State of Colorado,
but by a division of local government. About half the highway bridges in Colorado are not owned
by the state.
On-system: A categorization of bridges that means they are owned by the State of Colorado.
About half the highway bridges in Colorado are owned by the state. The number of bridges changes
a bit from year to year.
Pier: A bridge support that supports the girders above the ground away from the approach.
Pile: A vertical member embedded in the ground at the bottom to transmit the bridge loads to the
ground.
Plan sheets: The individual drawing sheets that taken together make the project plans, usually a
larger sheet than used for specifications.
Post-tensioning: Applying a compressive force to concrete after it is cast and set up. Usually
involves a tension element inside the concrete.
Precast: Concrete that is poured and cured somewhere other than its final location.
Predecked: A member with the deck precast on top of it.
Prestressed: Concrete with compression added to it to reduce or eliminate cracking from tension.
Concrete is relatively weak in tension.
Pretensioning: A way of making prestressed concrete by stretching cables, pouring concrete
around them, and then cutting the cables where they come out of the concrete. The cables then
transfer there force to the concrete from their original anchorage, putting the concrete into
compression. Inexpensive but generally impractical outside of a fabrication plant.
PSGLRFD: A design and capacity rating program for precast prestressed girders.
Rail: For the purposes of this report, the rail is a horizontal feature to prevent trucks, cars, and
pedestrians from falling off the structure.
Rolled beam: Standardized steel beams made in a mill by rolling hot from ingots cast from molten
steel. These usually are in an “I” shape when used a bridge girders.

66
Rubblization: The accumulation of cracks to the extent the resulting concrete approaches the
consistency of gravel.
Service limit states: Design limits that do not reflect the strength of an element, but its
functionality or durability. The limits are much fuzzier to define since functionality and durability
are much harder to either define or test than strength, are highly variable, and as such are mostly
historically based
Shaft: The vertical load carrying elements of piers or abutments. In this case, this usually means
the same as pile. The term was used because as proposed the piles are not the materials or methods
usually used in Colorado, sharing more in common with columns and drilled shafts (sometimes
called caissons in Colorado), and for one foundation option these are definitely not piles as they
would be embedded on a footer rather than the ground.
Skew: The common structure definition is the angle between a perpendicular to the girders and
the line of support or cap of a pier or abutment.
Slope protection: Surface material placed on the slopes under a bridge to reduce erosion. Due to
shade and grade, this area often does not stabilize with vegetation. In addition, it is often subject
to slightly concentrated drainage flow from the approach roadway that can erode sloped soil.
Span: The spacing between supports. For structural purposes of designing the girders this is
usually measured along the girders.
Spread foundation: A slab or block at the bottom of a column or wall to spread the load
sufficiently that the load will be reliability supported.
Standard bridge plans: A standard bridge plan is one that contains all critical design information
for the bridge or element, and requires no further design or modification for use. Often preapproved
so that an engineer’s stamp is not required.
Strength limit states: Design conditions for which the structure only needs sufficient strength to
carry the load specified. Strength is usually taken as a load capability that can be reliably achieved
for which the member retains some functionality.
Substructure: The collection of structure elements that carry loads from the ground to the girders
to the primary longitudinal load carrying members.
Superelevation: Transverse slope of the deck, for drainage, or to maintain an acceptable ride and
vehicle handling when considering centripetal force of a vehicle moving along a horizontally
curved road.
Superstructure: The collection of structural elements above the substructure. Usually girders,
diaphragms, and deck.
Tensile stress: A force per unit area that tends to pull a material apart.

67
Thermogradient: A difference of temperature through the thickness of a structure. As different
parts expand or contract differently due to temperature, stresses and bending occur.
Truss: A major load-carrying member composed of smaller elements usually forming triangles,
and usually considered as only carrying axial force. This is often a simplification useful for design
and analysis purposes, as many of these are actually frames or space frames that are much more
complicated in behavior.
U girder: A girder for which a section looks like the letter U. Often called tub girders or tubs.
These tend to be more stable than I shaped girders, and when they have a slab on top, have great
strength and stiffness for resisting twisting.
Vertical curve: Curvature of a road in the up and down directions. Use to improve ride, and
prevent the bottoms of vehicles between axles from scraping the road.
Wingwall: A small wall that holds back soil at the corners of a bridge is necessary because the
level of the soil just in front of an abutment is usually several feet below the road on the approach
side of the abutment, and the two levels do not come together for at least several feet.
Worksheet: A drawing much like a standard plan sheet. It may require additional information or
details by the designer. Some worksheets have all details and most design information, and others
very little, forming only a framework for custom details. Worksheets do not constitute preapproved
plans and it is important for the engineer to verify their appropriate use, completeness, and the
accuracy of the data on them.

68
13. REFERENCES
Abendroth, R., Greimann, L., and LaVilette, M. An Integral Abutment Bridge with Precast
Concrete Piles. Center for Transportation Research and Education, Iowa State University, Iowa
Department of Transportation, May 2007.
American Association of State Highway and Transportation Officials. Load and Resistance
Factor Design (LRFD) Bridge Design Specifications, 6th Ed., 2012.
Billington, S., Barnes, R. and Breen, J. Precast Substructure Design for Standard Bridge
Systems. Center for Transportation Research, The University of Texas at Austin. Sep 1998.
Bloser, S., Shearer, D., Corradini, K., and Scheetz, B. Geosynthetically Reinforced Soil-
Integrated Bridge Systems (GRS-IBS) Specification Development. PennDOT Publication 447, for
Pennsylvania Department of Transportation, Dec 2012.
Bonde, R. W. Concrete-Filled Tubular Flange Girder Bridge, Ohio Transportation Engineering
Conference, Oct 25-26, 2011.
Brown, Krista. Camber Growth Prediction in Precast Prestressed Concrete Bridge Girders. PhD
Dissertation, University of Idaho. Dec 1988.
Bruneau, M., El-Bahey, S., Fujikura, S., and Keller, D. Structural Fuses and Concrete-Filled
Steel Shapes for Seismic and Multi Hazard Resistant Design, 2010 NZEE Conference, 2010.
Bruneau, M., Alzeni, Y., and Fouché, P. Seismic Behavior of Concrete-Filled Steel Sandwich
Walls and Concrete-Filled Steel Tube Columns, Steel Innovations Conference 2013,
Christchurch, New Zealand, Feb 2013.
Buddhavarapu, P., de Fortier Smit, A., Prozzi, J.A., and Trevino, M. Evaluation of the Benefits of
Diamond Grinding of CRCP: Final Report. Center for Transportation Research, The University
of Texas at Austin for the Texas Department of Transportation, Nov 2014.
Byle, K.A., Burns, N.H., and Carrasquillo, R.L. Time-Dependent Deformation Behavior of
Prestressed High Performance Concrete Bridge Beams. University of Texas at Austin, Research
Report 580-6, Oct 1997.
Chen, S.S., and Shirole, A.M. Integration of Information and Automation Technologies in Bridge
Engineering and Management: Extending State of the Art. May 2006.
Chen, S.S., Hu, H., Karaman, S.G., and Ali, N. PowerPoint Presentation at AASHTO SCOBS
Meeting. Bridge Data Protocols for Interoperability and Life Cycle Management: Work-in-
Progress. June 2013.
Chen, X.J., Shen, C.W., and Jacobs, L.J. Prediction of Deflection for Prestressed Concrete
Girders Using a Bayesian Approach. Wuhan University of Technology, Georgia Institute of
Technology. 2006.
Colorado Department of Transportation. Staff Bridge. Bridge Design Manual. July 24, 2012.

69
Cook, R.A., Bloomquist, D., and Sanek, J.E. Field Verification of Camber Estimates for
Prestressed Girders. BD-545 RPWO #7, University of Florida, for Florida Department of
Transportation, Apr 2005.
Federal Highway Administration. Strategic Highway Research Program. Service Life Design
Guide for Bridges (R19A).
Federal Highway Administration. Connection Details for Prefabricated Bridge Elements and
Systems. Pub FHWA-IF-09-010. March 30, 2009.
Federal Highway Administration. Computer Integrated Steel Bridge Design and Construction:
Expanding Automation. Final Report, Apr 2001.
Federal Highway Administration. Sample Guide Specifications for Construction of Geosynthetic
Reinforced Soil-Integrated Bridge System (GRS-IBS). Pub. No. FHWA-HRT-12-051, Aug 2012.
Federal Highway Administration. Geosynthetic Reinforced Soil Performance Testing—Axial
Load Deformation Relationships. Pub. No. FHWA-HRT-13-066, Aug 2013.
Federal Highway Administration. Recording and Coding Guide for the Structure Inventory and
Appraisal of the Nation’s Bridges, Report No. FHWA-ED-89-044, 1988.
Florida Department of Transportation Research Center, Florida State University.
Prefabricated/Precast Bridge Elements and Systems (PBES) for Off-System Bridges. Aug 2012.
French, C.E. and O’Neill, C. Validation of Prestressed Concrete I-Beam Deflection and Camber
Estimates. Minnesota Department of Transportation Research Services, University of
Minnesota. Jun 2012.
Graybeal, B. Design and Construction of Field-Cast UHPC Connections, Technote FHWA-
HRT-14-084, FHWA Turner-Fairbank Highway Research Center, Oct 2014.
Hawkins, N.M. and Kuchma, D.A. Application of LRFD Bridge Design Specifications to High-
Strength Structural Concrete: Shear Provisions, NCHRP Report 579, University of Illinois,
2007.
Holle, Courtney. The Precast Concrete Bent Cap Option Standards, Presentation, Texas
Department of Transportation, Bridge Division. Feb 2012.
Imbsen, R. Zokaie, T. and Mish, K. Distribution of Wheel Loads on Highway Bridges, Phase III
Final Report. Prepared for NCHRP Project 12-26/2, Dec 1993.
Iowa Department of Transportation, Office of Bridges and Structures. Draft Accelerated Bridge
Construction (ABC) Policy. Fall 2012.
Iowa State University Bridge Engineering Center. Precast Concrete Elements for Accelerated
Bridge Construction. Jan 2009.

70
Issa, C., Gerges, N.N., and Fawaz, S. The effect of concrete vertical construction joints on the
modulus of rupture, Case Studies in Construction Materials. Volume 1 (2014), pp. 25–32.
Jayaseelan, H. and Russell, B. Prestress Losses and the Estimation of Long-Term Deflections
and Camber for Prestressed Concrete Bridges. Oklahoma State University. Aug. 2007.
Kanneganti, S. and Desai, T. Electronic Automation of LRFD Design, Wisconsin Highway
Research Program, Report WHRP 10-02, Bentley Systems Inc. for Wisconsin Department of
Transportation. March 2010.
King Brown, N., Kowalsky, M. and Nau, J. Strain Limits for Concrete Filled Steel Tubes in
AASHTO Seismic Provisions. North Carolina State University, Alaska University Transportation
Center Research and Innovative Technology Administration (RITA) (USDOT), for Alaska
Department of Transportation and Public Facilities, Aug 2013.
Kulicki, John M. PowerPoint Presentation. Calibration of the Service Limit States in AASHTO
LRFD—Steel Design. SHRP R19B, 2014.
Lang, Maria. Analysis of the AASHTO LRFD Horizontal Shear Strength Equation, Master’s
Thesis, Virginia Polytechnic Institute and State University. Sep 2011.
Lehman, D. And Roeder C. Rapid Construction of Bridge Piers with Improved Seismic
Performance—An Initial Study into the Use of Concrete-Filled Steel Tubes for Bridge Piers and
Foundation Connections. University of Washington, for California Department of
Transportation, Sep 2012.
Mabrich, Alexander. PowerPoint Presentation. Advantages of Using 3D Models for Automated
Rebar Detailing in Bridge Projects. Bentley BrIM Group, Sep 2011.
Mahmood, O.I. Camber Control in Simply Supported Prestressed Concrete Bridge Girders.
University of Kentucky. 2013.
Merta, Ben. Pre-Stressed Precast Concrete Box Girder Bridges, NMRA. 2010.
Morino, S. and Tsuda, K. Design and Construction of Concrete-Filled Steel Tube Column
System in Japan, Earthquake Engineering and Engineering Seismology, Vol. 4, No. 1, Oct 2003.
Nadermann, A.M. Evaluation of Bridge Component Design and Construction Techniques: A
Look at Integral Abutment Bridge Precast Approach Slabs and Post Grouted Drilled Shafts.
Iowa State University, 2012.
New York State Department of Transportation. Innovative Field-Cast UHPC Joints for Precast
Bridge Decks (Full-Depth Precast Deck Panels). Design, Prototype Testing and Construction,
Vic H. Perry, FCSCE, MASc., P. Eng., Lafarge North America, Calgary, AB, Canada. Mathew
Royce, PE, Civil Engineer, Office of Structures, NY State DOT, Albany, NY, 2010.
Nguyen, Hang Thi Nguyet. Improving Predictions for Camber in Precast, Prestressed Concrete
Bridge Girders. Master’s Thesis, University of Washington, 2014.

71
Omar, W., Lai, T.P., Huat, L.P., and Omar, R. Improved Prediction of Pre-Camber of Post-
Tensioned Prestressed I-Beam, Universiti Teknologi Malaysia. Nov 2007.
Oesterle, R.G., Elremaily, A.F., Eriksson, R., Prussack, C., and John Ma, Z. Guidelines for
Design and Construction of Decked Precast, Prestressed Concrete Girder Bridges, NCHRP
Project 12-69, Jul 2009.
Pennsylvania Department of Transportation. BRADD (Bridge Automated Design and Drafting
Software) Software Executive Summary, 2011
Precast/Prestressed Concrete Institute. Tolerance Manual for Precast and Prestressed Concrete
Construction, 1st ed., MNL-135-00, 2000.
Precast/Prestressed Concrete Institute Northeast. Guidelines for Northeast Extreme Tee Beam
(NEXT Beam), 1st ed., 2012.
Rizkalla, S., Zia, P., and Storm, T. Predicting Camber, Deflection, and Prestress Losses in
Prestressed Concrete Members. North Carolina State University for North Carolina Department
of Transportation. Jul 2011.
Roeder, C.W. Lehman, D.E., and Stephens, M.T. Concrete Filled Steel Tubes for Accelerated
Bridge Construction, University of Washington, Nov 2013, for 2014 TRB Meeting.
Rollins, K., Marsh, A., Franke, B., Palmer, K., and Smith, J. Passive Force-Deflection Behavior
for Skewed Abutments, Presentation, Brigham Young University, FHWA Pooled Fund, Aug
2014.
Russell, H.G. Adjacent Precast Box Beam Bridges: Connection Details, NCHRP Synthesis 393,
2009.
Salomon, A.L., and Moen, C.D. Structural Design Guidelines for Concrete Bridge Decks
Reinforced With Corrosion- Resistant Reinforcing Bars. Virginia Polytechnic and State
University, for the Virginia Department of Transportation. Oct 2014.
Sethi, V. Unbonded Monostrands for Camber Adjustment. Virginia Polytechnic Institute and
State University, Feb 2006.
Shirole, Arun, Chen, Stuart, and Puckett, Jay. PowerPoint Presentation at the 2008 AASHTO
SCOH Annual Meeting. Integrated Bridge Project Delivery & Life Cycle Management. FHWA
Project: DTFH61-06-D-00037. 2008.
Stallings, J.M., and Eskildsen, S. Camber and Prestress Losses in High Performance Concrete
Bridge Girders, Research Report Project Number: 930-373, for Alabama Department of
Transportation, May 2001.
Steel Tube Institute of North America, LRFD Column Load Tables. Dec 1999.

72
Storm T., Riskalla, S., and Zia, P. Effects of production practices on camber of prestressed
concrete bridge girders, PCI Journal. Winter 2013.
Symonds, W.B., and Lammer, B. Accelerated Bridge Construction—Integral Abutments, ABC
Center Webinar, September 18, 2013.
Transportation Research Board. Strategic Highway Research Program 2. Project C19, Strategies
for Addressing or Avoiding Common Constraints to Speed Delivery of Transportation Planning
and Environmental Review Projects. Jul 2013.
Transportation Research Board, Calibration of AASHTO LRFD Concrete Bridge Design
Specifications for Serviceability, December 1983.
Transportation Research Board. Strategic Highway Research Program 2, Renewal Project R19A,
Design Guide for Bridges for Service Life, Mar 2013.
Transportation Research Board. Strategic Highway Research Program 2. Renewal Project R19B,
Bridges for Service Life Beyond 100 Years: Service Limit State Design (Prepub). Dec 2013.
Transportation Research Board. Strategic Highway Research Program 2, Renewal Project R19B,
Bridges for Service Life Beyond 100 Years: Innovative Systems, Subsystems, and Components,
Report S2-R19A-RW-1. 2014.
Transportation Research Board. Innovative Bridge Designs for Rapid Renewal. Report S2-R04-
RR-1, 2014.
Washington State Transportation Center (TRAC), University of Washington. State-of-the-Art
Report on Precast Concrete Systems for Rapid Construction of Bridges. Mar 2005.
Washington State Department of Transportation. Draft, WSDOT Strategic Plan Accelerated
Bridge Construction (ABC). Feb 2009.
Wisconsin Department of Transportation, Wisconsin Highway Research Program. New Software
Streamlines LRFD Design Process. Aug 2010.
Youngblood, M. and Noyer, S. Precast Concrete Bridge Substructure Components. Presentation,
Janssen Spaans Engineering, Inc., 2012.

73
Appendix A. Tabulation of Girder Analysis
Notes:
ID names for tables and files on the attached CD: “Depth in inches” + “Girder type” of DS (decked
slab girder), DU (Decked U girder), DNX (decked Next beam), or DBT (Decked BT girder)+ “C”
for thicker web + “Top of deck width of girder in whole feet”. A “-” after the file name or in place
of the X or T indicates a run to define a shorter span’s behaviour at the point where a lower cost
wider section becomes feasible. Similarly a “~” indicates the file name of a run made to minimize
interpolation errors in the data provided.
Width defines the spacing center to center of longitudinal joints between decked precast girders
Slab defines the thickness of the closure in the longitudinal joints between decked precast girders
Deck concrete f’c = 6,000 psi
Added (non-composite) DL = 0 psf
End cross section same as interior
Strand used is 270 ksi 0.6-inch low-lax
Simple spans are pinned connections at both ends
End spans are partly fixed at one end
Interior spans are partly fixed at both ends
Humidity is assumed as 60 percent
Abutment spread support width is assumed based on 5 TSF peak factored load bearing pressure, 3.3
TSF average with load centered 1/3 of that width from girder or footing end.
Note the charts are broken into three sections, each showing a different group of design variables
and calculation results. Each part is about 8 pages long.

74
Tabulation of girder analysis (24 page table) Part I
ID Span
(feet)
Width
(feet)
Slab
(inch)
Added
Comp
(plf)
Area
(sq
inch)
CG
(in) I (in^4)
Depth
(inch)
Webs
(inch)
Flange
width
(inch)
Flange
Thick
(inch)
F'ci
req
(psi)
F'c
req
(psi)
Strands Jacking
fract
10DS15I- 18.1 16.00 9 1012 1800.0 5.0 15000 10.0 180.00 180 9.0 4000 6000 16 0.66
10DS15I 24.0 16.00 9 1012 1800.0 5.0 15000 10.0 180.00 180 9.0 4000 6000 26 0.66
13DS15I- 24.1 16.00 12 1012 2367.0 6.5 33245 13.0 180.00 180 12.0 4000 6000 18 0.70
13DS15I 33.0 16.00 12 1012 2367.0 6.5 33245 13.0 180.00 180 12.0 4000 6000 34 0.70
17DS15I- 33.1 16.00 16 1012 3087.0 8.5 74092 17.0 180.00 180 16.0 4000 6000 24 0.73
17DS15I 45.0 16.00 16 1012 3087.0 8.5 74092 17.0 180.00 180 16.0 4000 6000 48 0.73
20DS15I- 45.1 16.00 19 1012 3600.1 10.0 120000.1 20.0 180.00 180 19.0 4000 6000 42 0.70
20DS15I 56.0 16.00 19 1012 3600.1 10.0 120000.1 20.0 180.00 180 19.0 4000 6000 70 0.70
32DU15I- 34.0 16.00 8 1012 2341.3 21.6 223128.3 32.0 15.45 180 9.0 4000 6000 12 0.75
32DU15I~ 50.0 16.00 8 1012 2341.3 21.6 223128.3 32.0 15.45 180 9.0 4000 6000 24 0.75
32DU15I 65.0 16.00 8 1012 2266.6 21.8 219173.8 32.0 10.30 180 9.0 4000 6000 34 0.68
32DU10I- 65.1 10.67 8 675 1708.6 19.9 191357.1 32.0 10.30 118 9.0 4000 6000 24 0.75
32DU10I 90.0 10.67 8 675 1708.6 19.9 191357.1 32.0 10.30 118 9.0 4000 6000 44 0.75
32DU7I- 91.1 8.00 8 506 1429.6 18.4 170213.8 32.0 10.30 87 9.0 4000 6000 38 0.75
32DU7I 100.0 8.00 8 506 1429.6 18.4 170213.8 32.0 10.30 87 9.0 4193 6000 46 0.75
32DU-15I 48.0 16.00 8 1012 2341.3 21.6 223128.3 32.0 15.45 180 9.0 4000 6000 22 0.75
32DUC15I 79.0 16.00 8 1012 2341.3 21.6 223128.3 32.0 15.45 180 9.0 4157 6000 56 0.75
32DU-10I 79.1 10.67 8 675 1783.3 19.8 193860.1 32.0 15.45 118 9.0 4000 6000 36 0.75
32DUC10I 91.0 10.67 8 675 1783.3 19.8 193860.1 32.0 15.45 118 9.0 4000 6000 46 0.75
33DN-15I 34.0 16.00 8 1012 2297.3 23.7 169760.2 33.0 26.00 180 9.0 4000 6000 14 0.70
33DN~15I 52.0 16.00 8 1012 2297.3 23.7 169760.2 33.0 26.00 180 9.0 4000 6000 26 0.70
33DNX15I 70.0 16.00 8 1012 2297.3 23.7 169760.2 33.0 26.00 180 9.0 4180 6000 48 0.70
33DN-10I 70.1 10.67 8 675 1739.3 22.2 149225.1 33.0 26.00 118 9.0 4000 6000 36 0.71
33DNX10I 80.0 10.67 8 675 1739.3 22.2 149225.1 33.0 26.00 118 9.0 4608 6000 48 0.71
33DNX7I- 80.1 8.00 8 506 1460.3 21.0 134165.5 33.0 26.00 87 9.0 4074 6000 36 0.73
33DNX7I 88.0 8.00 8 506 1460.3 21.0 134165.5 33.0 26.00 87 9.0 5071 6000 44 0.73
38DU15I- 34.0 16.00 8 1012 2219.7 26.6 334054.2 38.0 10.30 180 9.0 4000 6000 10 0.71
38DU15I~ 65.0 16.00 8 1012 2219.7 26.6 334054.2 38.0 10.30 180 9.0 4000 6000 28 0.71
38DU15I 96.0 16.00 8 1012 2219.7 26.6 334054.2 38.0 10.30 180 9.0 4000 6000 56 0.71
38DU10I- 96.1 10.67 8 675 1661.4 24.2 294461 38.0 10.30 118 9.0 4000 6000 40 0.75
38DU10I 111.0 10.67 8 675 1661.4 24.2 294461 38.0 10.30 118 9.0 4000 6000 52 0.75

75
Tabulation of girder analysis (24 page table) Part I
ID Span
(feet)
Width
(feet)
Slab
(inch)
Added
Comp
(plf)
Area
(sq
inch)
CG
(in) I (in^4)
Depth
(inch)
Webs
(inch)
Flange
width
(inch)
Flange
Thick
(inch)
F'ci
req
(psi)
F'c
req
(psi)
Strands Jacking
fract
38DU7I- 111.1 8.00 8 506 1382.4 22.4 263865.4 38.0 10.30 87 9.0 4000 6000 44 0.75
38DU7I 123.0 8.00 8 506 1382.4 22.4 263865.4 38.0 10.30 87 9.0 4310 6000 54 0.75
38DU-15I 56.0 16.00 8 1012 2450.4 25.7 336250.6 38.0 15.46 180 9.0 4000 6000 22 0.73
38DUC15I 92.0 16.00 8 1012 2450.4 25.7 336250.6 38.0 15.46 180 9.0 4000 6000 54 0.73
38DU-10I 92.1 10.67 8 664 1892.4 23.4 288525.2 38.0 15.46 118 9.0 4000 6000 40 0.73
38DUC10I 113.0 10.67 8 664 1892.4 23.4 288525.2 38.0 15.46 118 9.0 4000 6000 62 0.73
38DUC7I- 113.1 8.00 8 506 1490.1 22.1 269229.9 38.0 15.46 87 9.0 4000 6000 46 0.75
38DUC7I 125.0 8.00 8 506 1490.1 22.1 269229.9 38.0 15.46 87 9.0 4115 6000 58 0.75
41DN-15I 60.0 16.00 8 1012 2492.0 29.6 306188.4 41.0 25.00 180 9.0 4000 6000 26 0.75
41DNX15I 94.0 16.00 8 1012 2492.0 29.6 306188.4 41.0 25.00 180 9.0 4960 6000 58 0.75
41DN-10I 94.1 10.67 8 675 1934.0 27.6 268119.6 41.0 25.00 118 9.0 4000 6000 42 0.75
41DNX10I 108.0 10.67 8 675 1934.0 27.6 268119.6 41.0 25.00 118 9.0 4712 6000 58 0.75
41DNX7I- 108.1 8.00 8 506 1655.0 26.1 240413 41.0 25.00 87 9.0 4000 6000 48 0.75
41DNX7I 120.0 8.00 8 506 1655.0 26.1 240413 41.0 25.00 87 9.0 4805 6000 60 0.75
44DU15I- 64.0 16.00 8 1012 2406.6 30.3 513364.1 44.0 10.30 180 9.0 4000 6000 24 0.70
44DU15I 94.0 16.00 8 1012 2406.6 30.3 513364.1 44.0 10.30 180 9.0 4000 6000 44 0.70
44DU10I- 94.1 10.67 8 664 1848.6 27.5 448112.5 44.0 10.30 118 9.0 4000 6000 32 0.74
44DU10I 122.0 10.67 8 664 1848.6 27.5 448112.5 44.0 10.30 118 9.0 4000 6000 54 0.74
44DU7I- 122.1 8.00 8 506 1569.6 25.4 399046.8 44.0 10.30 87 9.0 4000 6000 50 0.75
44DU7I 144.0 8.00 8 506 1569.6 25.4 399046.8 44.0 10.30 87 9.0 4760 6000 70 0.75
48DB-10I 34.0 10.67 8 664 1566.0 34.1 348231 47.5 7.00 118 9.7 4000 6000 6 0.75
48DB~10I 76.0 10.67 8 664 1566.0 34.1 348231 47.5 7.00 118 9.7 4000 6000 22 0.75
48DBT10I 117.0 10.67 8 664 1566.0 34.1 348231 47.5 7.00 118 9.7 5984 6000 48 0.75
48DBT7I- 117.1 8.00 8 506 1300.5 33.0 345263.8 47.5 7.00 87 9.7 4387 6000 40 0.70
48DBT7I 135.0 8.00 8 506 1300.5 33.0 345263.8 47.5 7.00 87 9.7 5799 6000 54 0.70
48DBT5I- 135.1 5.33 8 342 1008.0 29.2 276309 47.5 7.00 56 9.7 4000 6000 38 0.73
48DBT5I 154.0 5.33 8 342 1008.0 29.2 276309 47.5 7.00 56 9.7 5302 6000 52 0.73
51DU15I- 72.0 16.00 8 1012 2452.4 35.2 718062.3 50.6 10.30 180 9.0 4000 6000 24 0.75
51DU15I 92.0 16.00 8 1012 2452.4 35.2 718062.3 50.6 10.30 180 9.0 4000 6000 36 0.75
51DU10I- 92.1 10.67 8 664 1894.4 32.0 628472.4 50.6 10.30 118 9.0 4000 6000 28 0.75
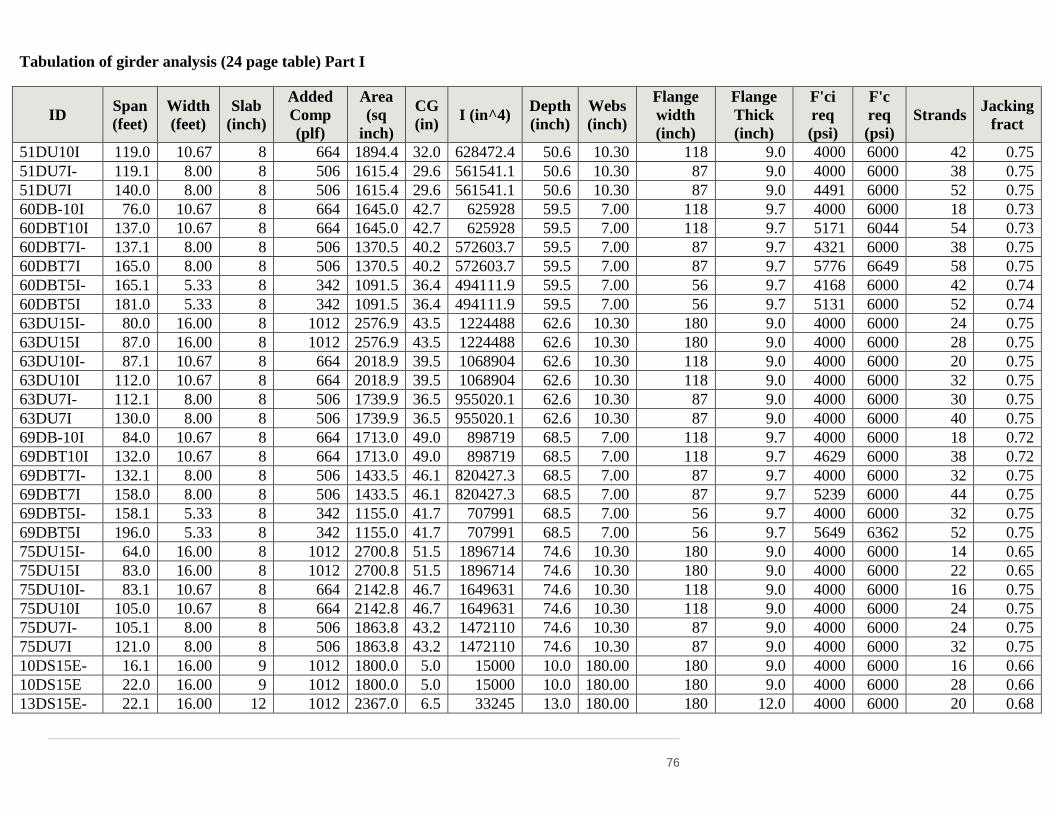
76
Tabulation of girder analysis (24 page table) Part I
ID Span
(feet)
Width
(feet)
Slab
(inch)
Added
Comp
(plf)
Area
(sq
inch)
CG
(in) I (in^4)
Depth
(inch)
Webs
(inch)
Flange
width
(inch)
Flange
Thick
(inch)
F'ci
req
(psi)
F'c
req
(psi)
Strands Jacking
fract
51DU10I 119.0 10.67 8 664 1894.4 32.0 628472.4 50.6 10.30 118 9.0 4000 6000 42 0.75
51DU7I- 119.1 8.00 8 506 1615.4 29.6 561541.1 50.6 10.30 87 9.0 4000 6000 38 0.75
51DU7I 140.0 8.00 8 506 1615.4 29.6 561541.1 50.6 10.30 87 9.0 4491 6000 52 0.75
60DB-10I 76.0 10.67 8 664 1645.0 42.7 625928 59.5 7.00 118 9.7 4000 6000 18 0.73
60DBT10I 137.0 10.67 8 664 1645.0 42.7 625928 59.5 7.00 118 9.7 5171 6044 54 0.73
60DBT7I- 137.1 8.00 8 506 1370.5 40.2 572603.7 59.5 7.00 87 9.7 4321 6000 38 0.75
60DBT7I 165.0 8.00 8 506 1370.5 40.2 572603.7 59.5 7.00 87 9.7 5776 6649 58 0.75
60DBT5I- 165.1 5.33 8 342 1091.5 36.4 494111.9 59.5 7.00 56 9.7 4168 6000 42 0.74
60DBT5I 181.0 5.33 8 342 1091.5 36.4 494111.9 59.5 7.00 56 9.7 5131 6000 52 0.74
63DU15I- 80.0 16.00 8 1012 2576.9 43.5 1224488 62.6 10.30 180 9.0 4000 6000 24 0.75
63DU15I 87.0 16.00 8 1012 2576.9 43.5 1224488 62.6 10.30 180 9.0 4000 6000 28 0.75
63DU10I- 87.1 10.67 8 664 2018.9 39.5 1068904 62.6 10.30 118 9.0 4000 6000 20 0.75
63DU10I 112.0 10.67 8 664 2018.9 39.5 1068904 62.6 10.30 118 9.0 4000 6000 32 0.75
63DU7I- 112.1 8.00 8 506 1739.9 36.5 955020.1 62.6 10.30 87 9.0 4000 6000 30 0.75
63DU7I 130.0 8.00 8 506 1739.9 36.5 955020.1 62.6 10.30 87 9.0 4000 6000 40 0.75
69DB-10I 84.0 10.67 8 664 1713.0 49.0 898719 68.5 7.00 118 9.7 4000 6000 18 0.72
69DBT10I 132.0 10.67 8 664 1713.0 49.0 898719 68.5 7.00 118 9.7 4629 6000 38 0.72
69DBT7I- 132.1 8.00 8 506 1433.5 46.1 820427.3 68.5 7.00 87 9.7 4000 6000 32 0.75
69DBT7I 158.0 8.00 8 506 1433.5 46.1 820427.3 68.5 7.00 87 9.7 5239 6000 44 0.75
69DBT5I- 158.1 5.33 8 342 1155.0 41.7 707991 68.5 7.00 56 9.7 4000 6000 32 0.75
69DBT5I 196.0 5.33 8 342 1155.0 41.7 707991 68.5 7.00 56 9.7 5649 6362 52 0.75
75DU15I- 64.0 16.00 8 1012 2700.8 51.5 1896714 74.6 10.30 180 9.0 4000 6000 14 0.65
75DU15I 83.0 16.00 8 1012 2700.8 51.5 1896714 74.6 10.30 180 9.0 4000 6000 22 0.65
75DU10I- 83.1 10.67 8 664 2142.8 46.7 1649631 74.6 10.30 118 9.0 4000 6000 16 0.75
75DU10I 105.0 10.67 8 664 2142.8 46.7 1649631 74.6 10.30 118 9.0 4000 6000 24 0.75
75DU7I- 105.1 8.00 8 506 1863.8 43.2 1472110 74.6 10.30 87 9.0 4000 6000 24 0.75
75DU7I 121.0 8.00 8 506 1863.8 43.2 1472110 74.6 10.30 87 9.0 4000 6000 32 0.75
10DS15E- 16.1 16.00 9 1012 1800.0 5.0 15000 10.0 180.00 180 9.0 4000 6000 16 0.66
10DS15E 22.0 16.00 9 1012 1800.0 5.0 15000 10.0 180.00 180 9.0 4000 6000 28 0.66
13DS15E- 22.1 16.00 12 1012 2367.0 6.5 33245 13.0 180.00 180 12.0 4000 6000 20 0.68
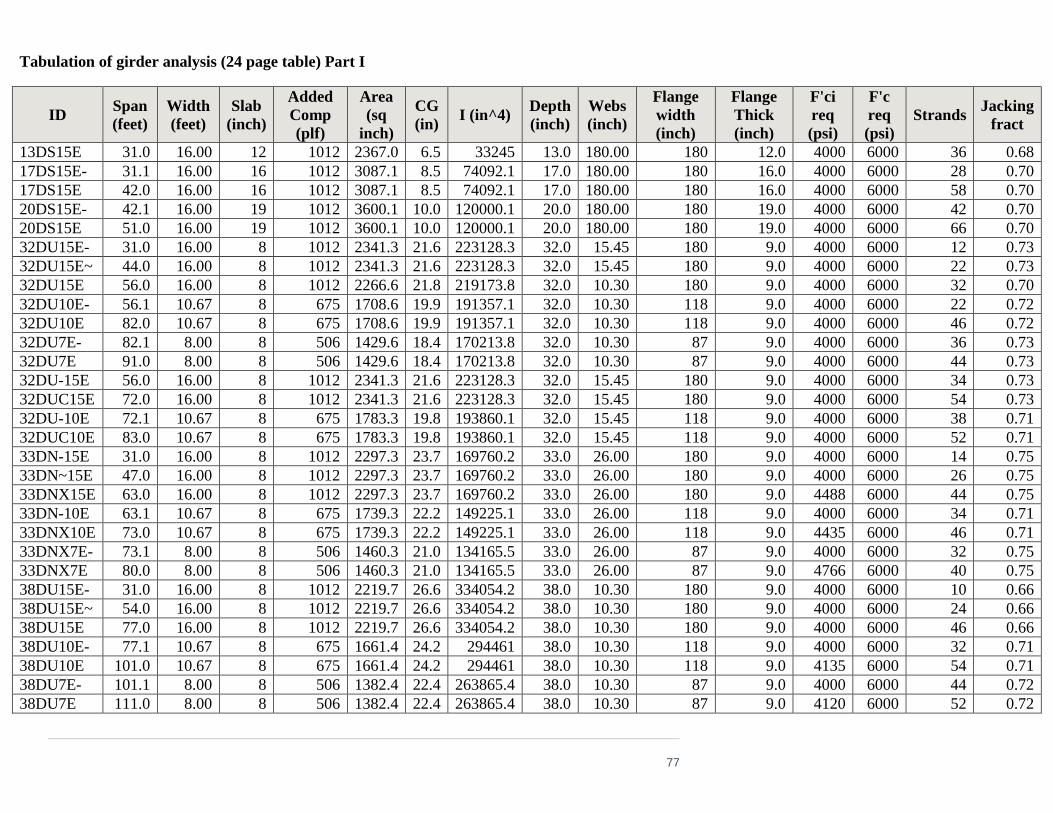
77
Tabulation of girder analysis (24 page table) Part I
ID Span
(feet)
Width
(feet)
Slab
(inch)
Added
Comp
(plf)
Area
(sq
inch)
CG
(in) I (in^4)
Depth
(inch)
Webs
(inch)
Flange
width
(inch)
Flange
Thick
(inch)
F'ci
req
(psi)
F'c
req
(psi)
Strands Jacking
fract
13DS15E 31.0 16.00 12 1012 2367.0 6.5 33245 13.0 180.00 180 12.0 4000 6000 36 0.68
17DS15E- 31.1 16.00 16 1012 3087.1 8.5 74092.1 17.0 180.00 180 16.0 4000 6000 28 0.70
17DS15E 42.0 16.00 16 1012 3087.1 8.5 74092.1 17.0 180.00 180 16.0 4000 6000 58 0.70
20DS15E- 42.1 16.00 19 1012 3600.1 10.0 120000.1 20.0 180.00 180 19.0 4000 6000 42 0.70
20DS15E 51.0 16.00 19 1012 3600.1 10.0 120000.1 20.0 180.00 180 19.0 4000 6000 66 0.70
32DU15E- 31.0 16.00 8 1012 2341.3 21.6 223128.3 32.0 15.45 180 9.0 4000 6000 12 0.73
32DU15E~ 44.0 16.00 8 1012 2341.3 21.6 223128.3 32.0 15.45 180 9.0 4000 6000 22 0.73
32DU15E 56.0 16.00 8 1012 2266.6 21.8 219173.8 32.0 10.30 180 9.0 4000 6000 32 0.70
32DU10E- 56.1 10.67 8 675 1708.6 19.9 191357.1 32.0 10.30 118 9.0 4000 6000 22 0.72
32DU10E 82.0 10.67 8 675 1708.6 19.9 191357.1 32.0 10.30 118 9.0 4000 6000 46 0.72
32DU7E- 82.1 8.00 8 506 1429.6 18.4 170213.8 32.0 10.30 87 9.0 4000 6000 36 0.73
32DU7E 91.0 8.00 8 506 1429.6 18.4 170213.8 32.0 10.30 87 9.0 4000 6000 44 0.73
32DU-15E 56.0 16.00 8 1012 2341.3 21.6 223128.3 32.0 15.45 180 9.0 4000 6000 34 0.73
32DUC15E 72.0 16.00 8 1012 2341.3 21.6 223128.3 32.0 15.45 180 9.0 4000 6000 54 0.73
32DU-10E 72.1 10.67 8 675 1783.3 19.8 193860.1 32.0 15.45 118 9.0 4000 6000 38 0.71
32DUC10E 83.0 10.67 8 675 1783.3 19.8 193860.1 32.0 15.45 118 9.0 4000 6000 52 0.71
33DN-15E 31.0 16.00 8 1012 2297.3 23.7 169760.2 33.0 26.00 180 9.0 4000 6000 14 0.75
33DN~15E 47.0 16.00 8 1012 2297.3 23.7 169760.2 33.0 26.00 180 9.0 4000 6000 26 0.75
33DNX15E 63.0 16.00 8 1012 2297.3 23.7 169760.2 33.0 26.00 180 9.0 4488 6000 44 0.75
33DN-10E 63.1 10.67 8 675 1739.3 22.2 149225.1 33.0 26.00 118 9.0 4000 6000 34 0.71
33DNX10E 73.0 10.67 8 675 1739.3 22.2 149225.1 33.0 26.00 118 9.0 4435 6000 46 0.71
33DNX7E- 73.1 8.00 8 506 1460.3 21.0 134165.5 33.0 26.00 87 9.0 4000 6000 32 0.75
33DNX7E 80.0 8.00 8 506 1460.3 21.0 134165.5 33.0 26.00 87 9.0 4766 6000 40 0.75
38DU15E- 31.0 16.00 8 1012 2219.7 26.6 334054.2 38.0 10.30 180 9.0 4000 6000 10 0.66
38DU15E~ 54.0 16.00 8 1012 2219.7 26.6 334054.2 38.0 10.30 180 9.0 4000 6000 24 0.66
38DU15E 77.0 16.00 8 1012 2219.7 26.6 334054.2 38.0 10.30 180 9.0 4000 6000 46 0.66
38DU10E- 77.1 10.67 8 675 1661.4 24.2 294461 38.0 10.30 118 9.0 4000 6000 32 0.71
38DU10E 101.0 10.67 8 675 1661.4 24.2 294461 38.0 10.30 118 9.0 4135 6000 54 0.71
38DU7E- 101.1 8.00 8 506 1382.4 22.4 263865.4 38.0 10.30 87 9.0 4000 6000 44 0.72
38DU7E 111.0 8.00 8 506 1382.4 22.4 263865.4 38.0 10.30 87 9.0 4120 6000 52 0.72

78
Tabulation of girder analysis (24 page table) Part I
ID Span
(feet)
Width
(feet)
Slab
(inch)
Added
Comp
(plf)
Area
(sq
inch)
CG
(in) I (in^4)
Depth
(inch)
Webs
(inch)
Flange
width
(inch)
Flange
Thick
(inch)
F'ci
req
(psi)
F'c
req
(psi)
Strands Jacking
fract
38DU-15E 64.0 16.00 8 1012 2450.4 25.7 336250.6 38.0 15.46 180 9.0 4000 6000 32 0.73
38DUC15E 89.0 16.00 8 1012 2450.4 25.7 336250.6 38.0 15.46 180 9.0 4278 6000 60 0.73
38DU-10E 89.1 10.67 8 664 1892.4 23.4 288525.2 38.0 15.46 118 9.0 4000 6000 42 0.75
38DUC10E 102.0 10.67 8 664 1892.4 23.4 288525.2 38.0 15.46 118 9.0 4000 6000 56 0.75
38DUC7E- 102.1 8.00 8 506 1490.1 22.1 269229.9 38.0 15.46 87 9.0 4000 6000 44 0.75
38DUC7E 114.0 8.00 8 506 1490.1 22.1 269229.9 38.0 15.46 87 9.0 4148 6000 54 0.75
41DN-15E 68.0 16.00 8 1012 2492.0 29.6 306188.4 41.0 25.00 180 9.0 4000 6000 36 0.75
41DNX15E 85.0 16.00 8 1012 2492.0 29.6 306188.4 41.0 25.00 180 9.0 5353 6000 56 0.75
41DN-10E 85.1 10.67 8 675 1934.0 27.6 268119.6 41.0 25.00 118 9.0 4000 6000 40 0.75
41DNX10E 98.0 10.67 8 675 1934.0 27.6 268119.6 41.0 25.00 118 9.0 4960 6000 54 0.75
41DNX7E- 98.1 8.00 8 506 1655.0 26.1 240413 41.0 25.00 87 9.0 4000 6000 44 0.75
41DNX7E 109.0 8.00 8 506 1655.0 26.1 240413 41.0 25.00 87 9.0 4943 6000 56 0.75
44DU15E- 68.0 16.00 8 1012 2406.6 30.3 513364.1 44.0 10.30 180 9.0 4000 6000 30 0.73
44DU15E 94.0 16.00 8 1012 2406.6 30.3 513364.1 44.0 10.30 180 9.0 4134 6000 52 0.73
44DU10E- 94.1 10.67 8 664 1848.6 27.5 448112.5 44.0 10.30 118 9.0 4000 6000 38 0.74
44DU10E 122.0 10.67 8 664 1848.6 27.5 448112.5 44.0 10.30 118 9.0 4000 6000 62 0.74
44DU7E- 122.1 8.00 8 506 1569.6 25.4 399046.8 44.0 10.30 87 9.0 4000 6000 52 0.75
44DU7E 139.0 8.00 8 506 1569.6 25.4 399046.8 44.0 10.30 87 9.0 4644 6000 68 0.75
48DB-10E 31.0 10.67 8 664 1566.0 34.1 348231 47.5 7.00 118 9.7 4000 6000 6 0.75
48DB~10E 67.0 10.67 8 664 1566.0 34.1 348231 47.5 7.00 118 9.7 4000 6000 20 0.75
48DBT10E 103.0 10.67 8 664 1566.0 34.1 348231 47.5 7.00 118 9.7 5887 6000 42 0.75
48DBT7E- 103.1 8.00 8 506 1300.5 33.0 345263.8 47.5 7.00 87 9.7 4375 6000 34 0.73
48DBT7E 119.0 8.00 8 506 1300.5 33.0 345263.8 47.5 7.00 87 9.7 5771 6000 46 0.73
48DBT5E- 119.1 5.33 8 342 1021.5 30.3 307842.6 47.5 7.00 56 9.7 4000 6000 32 0.73
48DBT5E 146.0 5.33 8 342 1021.5 30.3 307842.6 47.5 7.00 56 9.7 5921 6184 52 0.73
51DU15E- 84.0 16.00 8 1012 2452.4 35.2 718062.3 50.6 10.30 180 9.0 4000 6000 36 0.75
51DU15E 92.0 16.00 8 1012 2452.4 35.2 718062.3 50.6 10.30 180 9.0 4000 6000 42 0.75
51DU10E- 92.1 10.67 8 664 1894.4 32.0 628472.4 50.6 10.30 118 9.0 4000 6000 32 0.75
51DU10E 119.0 10.67 8 664 1894.4 32.0 628472.4 50.6 10.30 118 9.0 4520 6000 50 0.75
51DU7E- 119.1 8.00 8 506 1615.4 29.6 561541.1 50.6 10.30 87 9.0 4000 6000 42 0.75

79
Tabulation of girder analysis (24 page table) Part I
ID Span
(feet)
Width
(feet)
Slab
(inch)
Added
Comp
(plf)
Area
(sq
inch)
CG
(in) I (in^4)
Depth
(inch)
Webs
(inch)
Flange
width
(inch)
Flange
Thick
(inch)
F'ci
req
(psi)
F'c
req
(psi)
Strands Jacking
fract
51DU7E 140.0 8.00 8 506 1615.4 29.6 561541.1 50.6 10.30 87 9.0 4576 6000 56 0.75
60DB-10E 64.0 10.67 8 664 1645.0 42.7 625928 59.5 7.00 118 9.7 4000 6000 16 0.75
60DBT10E 130.0 10.67 8 664 1645.0 42.7 625928 59.5 7.00 118 9.7 5887 6752 54 0.75
60DBT7E- 130.1 8.00 8 506 1370.5 40.2 572603.7 59.5 7.00 87 9.7 4646 6000 42 0.73
60DBT7E 146.0 8.00 8 506 1370.5 40.2 572603.7 59.5 7.00 87 9.7 5795 7312 52 0.75
60DBT5E- 146.1 5.33 8 342 1091.5 36.4 494112 59.5 7.00 56 9.7 4000 6000 36 0.75
60DBT5E 168.0 5.33 8 342 1091.5 36.4 494112 59.5 7.00 56 9.7 5285 6715 50 0.75
63DU15E- 68.0 16.00 8 1012 2576.9 43.5 1224488 62.6 10.30 180 9.0 4000 6000 20 0.75
63DU15E 87.0 16.00 8 1012 2576.9 43.5 1224488 62.6 10.30 180 9.0 4000 6000 32 0.75
63DU10E- 87.1 10.67 8 664 2018.9 39.5 1068904 62.6 10.30 118 9.0 4000 6000 24 0.75
63DU10E 112.0 10.67 8 664 2018.9 39.5 1068904 62.6 10.30 118 9.0 4000 6000 36 0.75
63DU7E- 112.1 8.00 8 506 1739.9 36.5 955020.1 62.6 10.30 87 9.0 4000 6000 32 0.75
63DU7E 130.0 8.00 8 506 1739.9 36.5 955020.1 62.6 10.30 87 9.0 4000 6000 44 0.75
69DB-10E 72.0 10.67 8 664 1713.0 49.0 898719 68.5 7.00 118 9.7 4000 6000 16 0.73
69DBT10E 132.0 10.67 8 664 1713.0 49.0 898719 68.5 7.00 118 9.7 4544 6000 44 0.73
69DBT7E- 132.1 8.00 8 506 1433.5 46.1 820427.3 68.5 7.00 87 9.7 4195 6000 36 0.75
69DBT7E 158.0 8.00 8 506 1433.5 46.1 820427.3 68.5 7.00 87 9.7 5989 7384 52 0.75
69DBT5E- 158.1 5.33 8 342 1155.0 41.7 707991 68.5 7.00 56 9.7 4000 6000 36 0.75
69DBT5E 194.0 5.33 8 342 1155.0 41.7 707991 68.5 7.00 56 9.7 5804 7256 58 0.75
75DU15E- 64.0 16.00 8 1012 2700.8 51.5 1896714 74.6 10.30 180 9.0 4000 6000 16 0.75
75DU15E 83.0 16.00 8 1012 2700.8 51.5 1896714 74.6 10.30 180 9.0 4000 6000 24 0.75
75DU10E- 83.1 10.67 8 664 2142.8 46.7 1649631 74.6 10.30 118 9.0 4000 6000 18 0.75
75DU10E 105.0 10.67 8 664 2142.8 46.7 1649631 74.6 10.30 118 9.0 4000 6000 28 0.75
75DU7E- 105.1 8.00 8 506 1863.8 43.2 1472110 74.6 10.30 87 9.0 4000 6000 28 0.75
75DU7E 121.0 8.00 8 506 1863.8 43.2 1472110 74.6 10.30 87 9.0 4000 6000 34 0.75
10DS15S- 15.1 16.00 9 1012 1800.0 5.0 15000 10.0 180.00 180 9.0 4000 6000 20 0.66
10DS15S 20.0 16.00 9 1012 1800.0 5.0 15000 10.0 180.00 180 9.0 4000 6000 30 0.66
13DS15S- 20.1 16.00 12 1012 2367.1 6.5 33244.6 13.0 180.00 180 12.0 4000 6000 20 0.68
13DS15S 29.0 16.00 12 1012 2367.1 6.5 33244.6 13.0 180.00 180 12.0 4000 6000 40 0.68
17DS15S- 29.1 16.00 16 1012 3087.1 8.5 74092.1 17.0 180.00 180 16.0 4000 6000 30 0.70
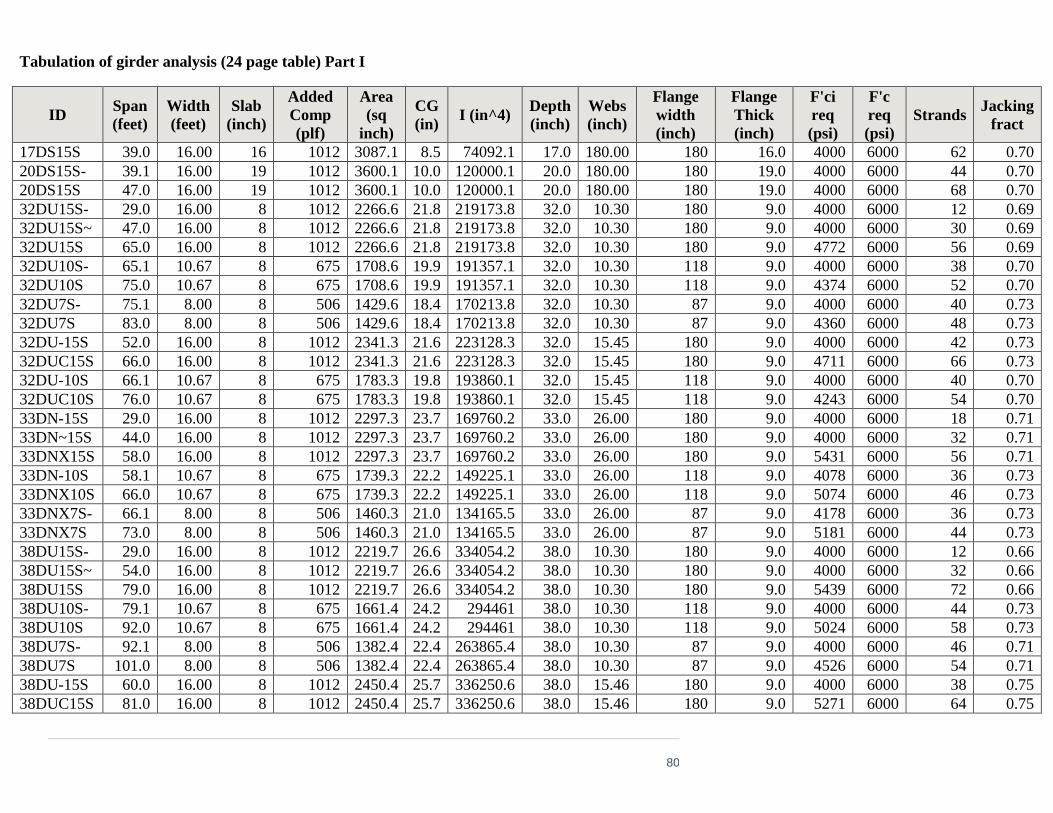
80
Tabulation of girder analysis (24 page table) Part I
ID Span
(feet)
Width
(feet)
Slab
(inch)
Added
Comp
(plf)
Area
(sq
inch)
CG
(in) I (in^4)
Depth
(inch)
Webs
(inch)
Flange
width
(inch)
Flange
Thick
(inch)
F'ci
req
(psi)
F'c
req
(psi)
Strands Jacking
fract
17DS15S 39.0 16.00 16 1012 3087.1 8.5 74092.1 17.0 180.00 180 16.0 4000 6000 62 0.70
20DS15S- 39.1 16.00 19 1012 3600.1 10.0 120000.1 20.0 180.00 180 19.0 4000 6000 44 0.70
20DS15S 47.0 16.00 19 1012 3600.1 10.0 120000.1 20.0 180.00 180 19.0 4000 6000 68 0.70
32DU15S- 29.0 16.00 8 1012 2266.6 21.8 219173.8 32.0 10.30 180 9.0 4000 6000 12 0.69
32DU15S~ 47.0 16.00 8 1012 2266.6 21.8 219173.8 32.0 10.30 180 9.0 4000 6000 30 0.69
32DU15S 65.0 16.00 8 1012 2266.6 21.8 219173.8 32.0 10.30 180 9.0 4772 6000 56 0.69
32DU10S- 65.1 10.67 8 675 1708.6 19.9 191357.1 32.0 10.30 118 9.0 4000 6000 38 0.70
32DU10S 75.0 10.67 8 675 1708.6 19.9 191357.1 32.0 10.30 118 9.0 4374 6000 52 0.70
32DU7S- 75.1 8.00 8 506 1429.6 18.4 170213.8 32.0 10.30 87 9.0 4000 6000 40 0.73
32DU7S 83.0 8.00 8 506 1429.6 18.4 170213.8 32.0 10.30 87 9.0 4360 6000 48 0.73
32DU-15S 52.0 16.00 8 1012 2341.3 21.6 223128.3 32.0 15.45 180 9.0 4000 6000 42 0.73
32DUC15S 66.0 16.00 8 1012 2341.3 21.6 223128.3 32.0 15.45 180 9.0 4711 6000 66 0.73
32DU-10S 66.1 10.67 8 675 1783.3 19.8 193860.1 32.0 15.45 118 9.0 4000 6000 40 0.70
32DUC10S 76.0 10.67 8 675 1783.3 19.8 193860.1 32.0 15.45 118 9.0 4243 6000 54 0.70
33DN-15S 29.0 16.00 8 1012 2297.3 23.7 169760.2 33.0 26.00 180 9.0 4000 6000 18 0.71
33DN~15S 44.0 16.00 8 1012 2297.3 23.7 169760.2 33.0 26.00 180 9.0 4000 6000 32 0.71
33DNX15S 58.0 16.00 8 1012 2297.3 23.7 169760.2 33.0 26.00 180 9.0 5431 6000 56 0.71
33DN-10S 58.1 10.67 8 675 1739.3 22.2 149225.1 33.0 26.00 118 9.0 4078 6000 36 0.73
33DNX10S 66.0 10.67 8 675 1739.3 22.2 149225.1 33.0 26.00 118 9.0 5074 6000 46 0.73
33DNX7S- 66.1 8.00 8 506 1460.3 21.0 134165.5 33.0 26.00 87 9.0 4178 6000 36 0.73
33DNX7S 73.0 8.00 8 506 1460.3 21.0 134165.5 33.0 26.00 87 9.0 5181 6000 44 0.73
38DU15S- 29.0 16.00 8 1012 2219.7 26.6 334054.2 38.0 10.30 180 9.0 4000 6000 12 0.66
38DU15S~ 54.0 16.00 8 1012 2219.7 26.6 334054.2 38.0 10.30 180 9.0 4000 6000 32 0.66
38DU15S 79.0 16.00 8 1012 2219.7 26.6 334054.2 38.0 10.30 180 9.0 5439 6000 72 0.66
38DU10S- 79.1 10.67 8 675 1661.4 24.2 294461 38.0 10.30 118 9.0 4000 6000 44 0.73
38DU10S 92.0 10.67 8 675 1661.4 24.2 294461 38.0 10.30 118 9.0 5024 6000 58 0.73
38DU7S- 92.1 8.00 8 506 1382.4 22.4 263865.4 38.0 10.30 87 9.0 4000 6000 46 0.71
38DU7S 101.0 8.00 8 506 1382.4 22.4 263865.4 38.0 10.30 87 9.0 4526 6000 54 0.71
38DU-15S 60.0 16.00 8 1012 2450.4 25.7 336250.6 38.0 15.46 180 9.0 4000 6000 38 0.75
38DUC15S 81.0 16.00 8 1012 2450.4 25.7 336250.6 38.0 15.46 180 9.0 5271 6000 64 0.75
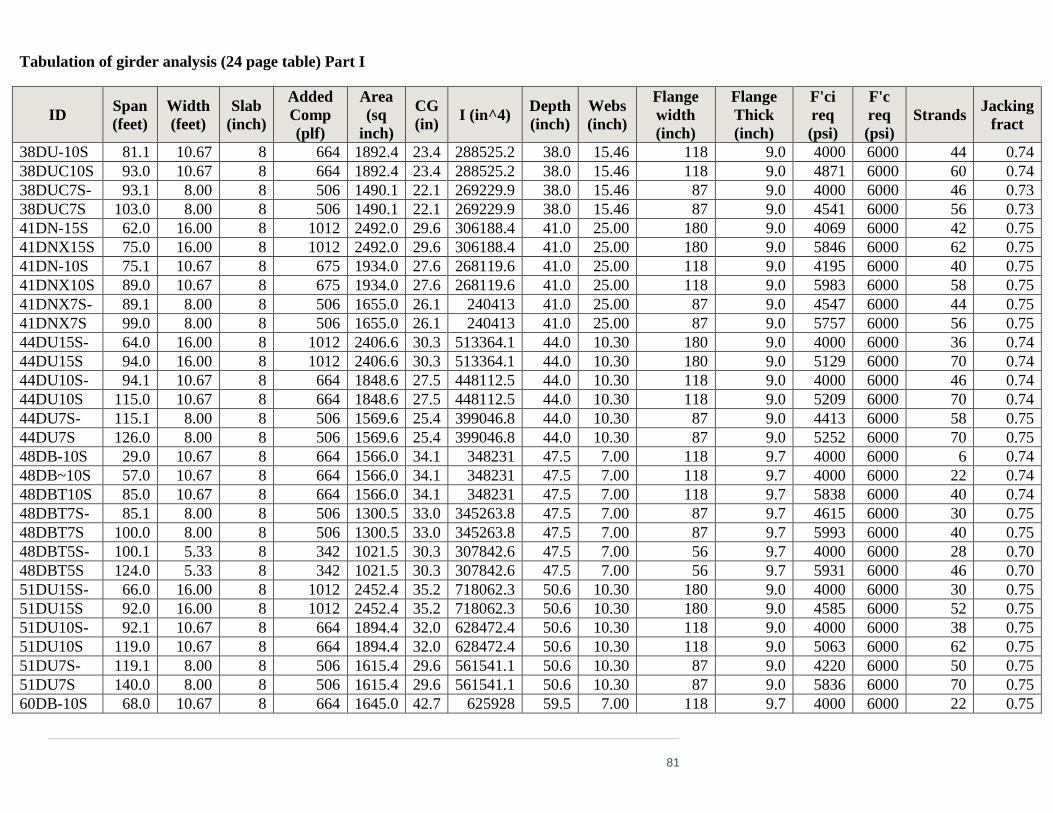
81
Tabulation of girder analysis (24 page table) Part I
ID Span
(feet)
Width
(feet)
Slab
(inch)
Added
Comp
(plf)
Area
(sq
inch)
CG
(in) I (in^4)
Depth
(inch)
Webs
(inch)
Flange
width
(inch)
Flange
Thick
(inch)
F'ci
req
(psi)
F'c
req
(psi)
Strands Jacking
fract
38DU-10S 81.1 10.67 8 664 1892.4 23.4 288525.2 38.0 15.46 118 9.0 4000 6000 44 0.74
38DUC10S 93.0 10.67 8 664 1892.4 23.4 288525.2 38.0 15.46 118 9.0 4871 6000 60 0.74
38DUC7S- 93.1 8.00 8 506 1490.1 22.1 269229.9 38.0 15.46 87 9.0 4000 6000 46 0.73
38DUC7S 103.0 8.00 8 506 1490.1 22.1 269229.9 38.0 15.46 87 9.0 4541 6000 56 0.73
41DN-15S 62.0 16.00 8 1012 2492.0 29.6 306188.4 41.0 25.00 180 9.0 4069 6000 42 0.75
41DNX15S 75.0 16.00 8 1012 2492.0 29.6 306188.4 41.0 25.00 180 9.0 5846 6000 62 0.75
41DN-10S 75.1 10.67 8 675 1934.0 27.6 268119.6 41.0 25.00 118 9.0 4195 6000 40 0.75
41DNX10S 89.0 10.67 8 675 1934.0 27.6 268119.6 41.0 25.00 118 9.0 5983 6000 58 0.75
41DNX7S- 89.1 8.00 8 506 1655.0 26.1 240413 41.0 25.00 87 9.0 4547 6000 44 0.75
41DNX7S 99.0 8.00 8 506 1655.0 26.1 240413 41.0 25.00 87 9.0 5757 6000 56 0.75
44DU15S- 64.0 16.00 8 1012 2406.6 30.3 513364.1 44.0 10.30 180 9.0 4000 6000 36 0.74
44DU15S 94.0 16.00 8 1012 2406.6 30.3 513364.1 44.0 10.30 180 9.0 5129 6000 70 0.74
44DU10S- 94.1 10.67 8 664 1848.6 27.5 448112.5 44.0 10.30 118 9.0 4000 6000 46 0.74
44DU10S 115.0 10.67 8 664 1848.6 27.5 448112.5 44.0 10.30 118 9.0 5209 6000 70 0.74
44DU7S- 115.1 8.00 8 506 1569.6 25.4 399046.8 44.0 10.30 87 9.0 4413 6000 58 0.75
44DU7S 126.0 8.00 8 506 1569.6 25.4 399046.8 44.0 10.30 87 9.0 5252 6000 70 0.75
48DB-10S 29.0 10.67 8 664 1566.0 34.1 348231 47.5 7.00 118 9.7 4000 6000 6 0.74
48DB~10S 57.0 10.67 8 664 1566.0 34.1 348231 47.5 7.00 118 9.7 4000 6000 22 0.74
48DBT10S 85.0 10.67 8 664 1566.0 34.1 348231 47.5 7.00 118 9.7 5838 6000 40 0.74
48DBT7S- 85.1 8.00 8 506 1300.5 33.0 345263.8 47.5 7.00 87 9.7 4615 6000 30 0.75
48DBT7S 100.0 8.00 8 506 1300.5 33.0 345263.8 47.5 7.00 87 9.7 5993 6000 40 0.75
48DBT5S- 100.1 5.33 8 342 1021.5 30.3 307842.6 47.5 7.00 56 9.7 4000 6000 28 0.70
48DBT5S 124.0 5.33 8 342 1021.5 30.3 307842.6 47.5 7.00 56 9.7 5931 6000 46 0.70
51DU15S- 66.0 16.00 8 1012 2452.4 35.2 718062.3 50.6 10.30 180 9.0 4000 6000 30 0.75
51DU15S 92.0 16.00 8 1012 2452.4 35.2 718062.3 50.6 10.30 180 9.0 4585 6000 52 0.75
51DU10S- 92.1 10.67 8 664 1894.4 32.0 628472.4 50.6 10.30 118 9.0 4000 6000 38 0.75
51DU10S 119.0 10.67 8 664 1894.4 32.0 628472.4 50.6 10.30 118 9.0 5063 6000 62 0.75
51DU7S- 119.1 8.00 8 506 1615.4 29.6 561541.1 50.6 10.30 87 9.0 4220 6000 50 0.75
51DU7S 140.0 8.00 8 506 1615.4 29.6 561541.1 50.6 10.30 87 9.0 5836 6000 70 0.75
60DB-10S 68.0 10.67 8 664 1645.0 42.7 625928 59.5 7.00 118 9.7 4000 6000 22 0.75

82
Tabulation of girder analysis (24 page table) Part I
ID Span
(feet)
Width
(feet)
Slab
(inch)
Added
Comp
(plf)
Area
(sq
inch)
CG
(in) I (in^4)
Depth
(inch)
Webs
(inch)
Flange
width
(inch)
Flange
Thick
(inch)
F'ci
req
(psi)
F'c
req
(psi)
Strands Jacking
fract
60DBT10S 106.0 10.67 8 664 1645.0 42.7 625928 59.5 7.00 118 9.7 5893 6000 46 0.75
60DBT7S- 106.1 8.00 8 506 1370.5 40.2 572603.7 59.5 7.00 87 9.7 4569 6000 34 0.75
60DBT7S 124.0 8.00 8 506 1370.5 40.2 572603.7 59.5 7.00 87 9.7 5973 6069 46 0.75
60DBT5S- 124.1 5.33 8 342 1092.0 36.4 494112 59.5 7.00 56 9.7 4000 6000 32 0.73
60DBT5S 148.0 5.33 8 342 1092.0 36.4 494112 59.5 7.00 56 9.7 5635 6000 48 0.73
63DU15S- 70.0 16.00 8 1012 2576.9 43.5 1224488 62.6 10.30 180 9.0 4000 6000 26 0.75
63DU15S 87.0 16.00 8 1012 2576.9 43.5 1224488 62.6 10.30 180 9.0 4000 6000 38 0.75
63DU10S- 87.1 10.67 8 664 2018.9 39.5 1068904 62.6 10.30 118 9.0 4000 6000 28 0.75
63DU10S 112.0 10.67 8 664 2018.9 39.5 1068904 62.6 10.30 118 9.0 4000 6000 44 0.75
63DU7S- 112.1 8.00 8 506 1739.9 36.5 955020.1 62.6 10.30 87 9.0 4000 6000 36 0.75
63DU7S 130.0 8.00 8 506 1739.9 36.5 955020.1 62.6 10.30 87 9.0 4134 6000 46 0.75
69DB-10S 72.0 10.67 8 664 1713.0 49.0 898719 68.5 7.00 118 9.7 4000 6000 20 0.75
69DBT10S 123.0 10.67 8 664 1713.0 49.0 898719 68.5 7.00 118 9.7 5945 6062 50 0.75
69DBT7S- 123.1 8.00 8 506 1433.5 46.1 820427.3 68.5 7.00 87 9.7 4820 6000 40 0.75
69DBT7S 142.0 8.00 8 506 1433.5 46.1 820427.3 68.5 7.00 87 9.7 6007 6097 52 0.75
69DBT5S- 142.1 5.33 8 342 1155.0 41.7 707991 68.5 7.00 56 9.7 4000 6000 36 0.75
69DBT5S 170.0 5.33 8 342 1155.0 41.7 707991 68.5 7.00 56 9.7 5568 6000 52 0.75
75DU15S- 74.0 16.00 8 1012 2700.8 51.5 1896714 74.6 10.30 180 9.0 4000 6000 24 0.75
75DU15S 83.0 16.00 8 1012 2700.8 51.5 1896714 74.6 10.30 180 9.0 4000 6000 30 0.75
75DU10S- 83.1 10.67 8 664 2142.8 46.7 1649631 74.6 10.30 118 9.0 4000 6000 22 0.75
75DU10S 105.0 10.67 8 664 2142.8 46.7 1649631 74.6 10.30 118 9.0 4000 6000 32 0.75
75DU7S- 105.1 8.00 8 506 1863.8 43.2 1472110 74.6 10.30 87 9.0 4000 6000 30 0.75
75DU7S 121.0 8.00 8 506 1863.8 43.2 1472110 74.6 10.30 87 9.0 4000 6000 38 0.75

83
Tabulation of girder analysis (24 page table) Part II
ID Span
(feet)
Pjack
(k)
Ems
(inch
)
EE (inch)
Har
p
(feet
)
LL+I
/Lane Rating
Comp
Fixity adj
Dist
(feet
)
Ser
III
sqrt
(f'c)
Final
force
(k)
10DS15I- 18.1 618.7 2.30 3.34 6.4 274.1
1 HL93 43.9 INV 56.8 OPR 153.3
PERMIT
B .34 .67
.2
12.0
0 6 541.2
10DS15I 24.0 1005.4 2.30 3.34 9.0 393.7
1.1 HL93 45.7 INV 59.2 OPR 158
PERMIT
B .34 .67
.2
12.0
0 6 853.5
13DS15I- 24.1 738.2 2.30 4.34 9.0 395.9
1 HL93 44.8 INV 58 OPR 154.8
PERMIT
B .34 .67
.2
12.0
0 6 648.5
13DS15I 33.0 1394.4 2.30 4.34 12.4 652
1.1 HL93 46.8 INV 60.9 OPR
181.7 PERMIT
B .34 .67
.2
12.0
0 6 1178.4
17DS15I- 33.1 1026.5 2.30 5.67 12.4 655.6
1 HL93 44.4 INV 57.6 OPR 172.1
PERMIT
B .34 .67
.2
12.0
0 6 902.0
17DS15I 45.0 2053.0 2.30 5.67 16.9
1100.
4
1 HL93 47.1 INV 64 OPR 146
PERMIT
B .34 .67
.2
12.0
0 6 1723.1
20DS15I- 45.1 1722.5 2.50 6.67 16.9
1104.
2
1.1 HL93 48 INV 66.8 OPR 152.1
PERMIT
B .34 .67
.2
12.0
0 6 1495.7
20DS15I 56.0 2870.9 2.50 6.67 21.0
1538.
6
1 HL93 48.7 INV 75.8 OPR 163.3
PERMIT
B .34 .67
.2
12.0
0 6 2381.9
32DU15I- 34.0 527.3 7.00 14.20 12.8 688.2
1 HL93 46.2 INV 59.9 OPR 182.3
PERMIT
B .34 .67
.2
14.0
0 6 461.0
32DU15I~ 50.0 1054.6 7.00 14.20 19.5
1296.
4
1 HL93 47.9 INV 62.1 OPR 137.3
PERMIT
B .34 .67
.2
14.0
0 6 888.2
32DU15I 65.0 1354.6 4.50 13.00 24.4
1915.
9
1 HL93 49.9 INV 66.1 OPR 138.9
PERMIT
B .34 .67
.2
14.0
0 6 1096.5
32DU10I- 65.1 1054.6 4.10 12.50 24.4
1920.
2
1 HL93 48.9 INV 63.4 OPR 133.1
PERMIT
B .34 .67
.2
13.0
0 6 873.4
32DU10I 90.0 1933.5 4.10 12.50 33.8
3050.
7
1 HL93 54.1 INV 70.1 OPR 141.8
PERMIT
B .34 .67
.2
13.0
0 6 1491.8
32DU7I- 91.1 1669.8 4.10 11.80 34.1
3103.
5
1 HL93 55.1 INV 71.5 OPR 144.3
PERMIT
B .34 .67
.2
12.0
0 6 1317.2
32DU7I 100.0 2021.4 4.10 11.80 37.5
3539.
9
1 HL93 57 INV 73.9 OPR 145.5
PERMIT
B .34 .67
.2
12.0
0 6 1547.4

84
Tabulation of girder analysis (24 page table) Part II
ID Span
(feet)
Pjack
(k)
Ems
(inch
)
EE (inch)
Har
p
(feet
)
LL+I
/Lane Rating
Comp
Fixity adj
Dist
(feet
)
Ser
III
sqrt
(f'c)
Final
force
(k)
32DU-15I 48.0 966.7 7.00 14.20 18.0
1217.
4
1 HL93 46.5 INV 60.2 OPR 134.7
PERMIT
B .34 .67
.2
14.0
0 6 819.8
32DUC15I 79.0 2460.8 7.00 14.20 29.6
2535.
8
1.1 HL93 54.2 INV 71.6 OPR
146.7 PERMIT
B .34 .67
.2
14.0
0 6 1886.8
32DU-10I 79.1 1581.9 4.10 12.50 29.6
2540.
3
1.1 HL93 54.3 INV 70.4 OPR
144.2 PERMIT
B .34 .67
.2
13.0
0 6 1261.8
32DUC10I 91.0 2021.4 4.10 12.50 34.5
3098.
7
1 HL93 53.5 INV 70.6 OPR 142.6
PERMIT
B .34 .67
.2
13.0
0 6 1565.6
33DN-15I 34.0 574.2 7.80
15.7
SLEEVE 8 12.8 688.2
1.3 HL93 55.9 INV 77.2 OPR
234.9 PERMIT
B .34 .67
.2
14.2
2 6 489.9
33DN~15I 52.0 1066.3 7.80
15.7
SLEEVE 8 19.5
1376.
3
1.1 HL93 51 INV 66.1 OPR 144.8
PERMIT
B .34 .67
.2
14.2
2 6 873.7
33DNX15I 70.0 1968.6 7.80
15.7
SLEEVE 8 26.3
2132.
7
1 HL93 50.7 INV 80.2 OPR 166.6
PERMIT
B .34 .67
.2
14.2
2 6 1464.0
33DN-10I 70.1 1497.6 8.50
13.3
SLEEVE 8 26.3
2137.
1
1 HL93 50.8 INV 75.2 OPR 156.2
PERMIT
B .34 .67
.2
12.8
3 6 1184.4
33DNX10I 80.0 1996.7 8.50
13.3
SLEEVE 8 30.0
2581.
6
1 HL93 52.1 INV 81.3 OPR 166.3
PERMIT
B .34 .67
.2
12.8
3 6 1501.7
33DNX7I- 80.1 1539.7 7.50
12.3
SLEEVE 4 30.0
2586.
1
1 HL93 52.8 INV 77.9 OPR 159.3
PERMIT
B .34 .67
.2
12.2
7 6 1204.6
33DNX7I 88.0 1881.9 7.50
12.3
SLEEVE 4 33.0
2955.
2
1 HL93 53.4 INV 81.3 OPR 164.8
PERMIT
B .34 .67
.2
12.2
7 6 1424.3
38DU15I- 34.0 416.0 4.50 17.90 12.8 688.2
1.3 HL93 55.9 INV 72.5 OPR
220.4 PERMIT
B .34 .67
.2
14.0
0 6 361.5
38DU15I~ 65.0 1164.8 4.50 17.90 24.4
1915.
9
1.1 HL93 52.8 INV 68.5 OPR
143.8 PERMIT
B .34 .67
.2
14.0
0 6 944.3
38DU15I 96.0 2329.5 4.50 17.90 36.0
3341.
8
1 HL93 54.1 INV 78.3 OPR 158.7
PERMIT
B .34 .67
.2
14.0
0 6 1709.2
38DU10I- 96.1 1757.7 5.00 17.30 36.0
3346.
7
1 HL93 55.6 INV 72.1 OPR 146
PERMIT
B .34 .67
.2
13.0
0 6 1376.4

85
Tabulation of girder analysis (24 page table) Part II
ID Span
(feet)
Pjack
(k)
Ems
(inch
)
EE (inch)
Har
p
(feet
)
LL+I
/Lane Rating
Comp
Fixity adj
Dist
(feet
)
Ser
III
sqrt
(f'c)
Final
force
(k)
38DU10I 111.0 2285.0 5.00 17.30 41.6
4101.
4
1 HL93 56.7 INV 73.9 OPR 136.6
PERMIT
B .34 .67
.2
13.0
0 6 1721.3
38DU7I- 111.1 1933.5 4.50 16.50 41.6
4106.
6
1.1 HL93 60.3 INV 78.1 OPR
144.3 PERMIT
B .34 .67
.2
12.0
0 6 1482.4
38DU7I 123.0 2372.9 4.50 16.50 46.1
4741.
7
1.1 HL93 62.4 INV 80.8 OPR
141.8 PERMIT
B .34 .67
.2
12.0
0 6 1752.5
38DU-15I 56.0 941.0 4.50 16.30 21.0
1538.
6
1 HL93 49.6 INV 64.2 OPR 138.5
PERMIT
B .34 .67
.2
14.0
0 6 791.3
38DUC15I 92.0 2309.6 4.50 16.30 34.5
3146.
9
1 HL93 54.2 INV 77.1 OPR 155.7
PERMIT
B .34 .67
.2
14.0
0 6 1760.5
38DU-10I 92.1 1710.8 4.50 17.50 34.5
3151.
7
1 HL93 55.9 INV 75.7 OPR 152.8
PERMIT
B .34 .67
.2
13.0
0 6 1379.3
38DUC10I 113.0 2651.8 4.50 17.50 42.8
4206.
1
1 HL93 57.1 INV 86.7 OPR 158.6
PERMIT
B .34 .67
.2
13.0
0 6 1985.3
38DUC7I- 113.1 2021.4 4.25 17.00 42.4
4211.
4
1 HL93 58.7 INV 76.1 OPR 139.1
PERMIT
B .34 .67
.2
12.0
0 6 1576.3
38DUC7I 125.0 2548.7 4.25 17.00 46.9
4851.
2
1.1 HL93 62.4 INV 82.3 OPR
143.3 PERMIT
B .34 .67
.2
12.0
0 6 1896.0
41DN-15I 60.0 1142.5 6.50
20
SLEEVE
16 22.5
1704.
3
1 HL93 49.7 INV 74.3 OPR 158.1
PERMIT
B .34 .67
.2
14.2
0 6 916.7
41DNX15I 94.0 2548.7 6.50
20
SLEEVE
16 35.3 3244
1.1 HL93 56.5 INV 86.7 OPR
174.7 PERMIT
B .34 .67
.2
14.2
0 6 1805.4
41DN-10I 94.1 1845.6 6.50
19
SLEEVE 8 35.3
3248.
8
1 HL93 53.9 INV 79.6 OPR 160.3
PERMIT
B .34 .67
.2
12.8
3 6 1421.2
41DNX10I 108.0 2548.7 6.50
19
SLEEVE 8 40.5
3945.
9
1 HL93 57.7 INV 91.4 OPR 171.5
PERMIT
B .34 .67
.2
12.8
3 6 1823.5
41DNX7I- 108.1 2109.2 6.50
18.5
SLEEVE 8 40.5 3951
1 HL93 58.5 INV 91.6 OPR 171.8
PERMIT
B .34 .67
.2
12.3
0 6 1588.2

86
Tabulation of girder analysis (24 page table) Part II
ID Span
(feet)
Pjack
(k)
Ems
(inch
)
EE (inch)
Har
p
(feet
)
LL+I
/Lane Rating
Comp
Fixity adj
Dist
(feet
)
Ser
III
sqrt
(f'c)
Final
force
(k)
41DNX7I 120.0 2636.6 6.50
18.5
SLEEVE 8 45.0
4578.
9
1 HL93 58.7 INV 96.4 OPR 171.1
PERMIT
B .34 .67
.2
12.3
0 6 1893.2
44DU15I- 64.0 984.3 4.25 15.00 24.0
1873.
2
1.1 HL93 54.6 INV 70.7 OPR
148.9 PERMIT
B .34 .67
.2
14.0
0 6 823.8
44DU15I 94.0 1804.6 4.25 15.00 35.3 3244
1 HL93 54.3 INV 71.8 OPR 144.7
PERMIT
B .34 .67
.2
14.0
0 6 1442.0
44DU10I- 94.1 1387.4 4.50 17.50 35.3
3248.
8
1 HL93 54.1 INV 70.1 OPR 141.2
PERMIT
B .34 .67
.2
13.4
0 6 1149.8
44DU10I 122.0 2341.3 4.50 17.50 45.8
4687.
2
1 HL93 61.3 INV 83 OPR 146.1
PERMIT
B .34 .67
.2
13.4
0 6 1818.7
44DU7I- 122.1 2197.1 4.25 19.00 45.8
4692.
6
1 HL93 61.1 INV 95.8 OPR 168.6
PERMIT
B .34 .67
.2
12.0
0 2 1687.5
44DU7I 144.0 3076.0 4.25 19.00 54.0
5931.
6
1 HL93 62.7 INV 102 OPR 167.9
PERMIT
B .34 .67
.2
12.0
0 2 2213.2
48DB-10I 34.0 263.7 4.50 24.60 12.8 688.2
1.2 HL93 54 INV 70 OPR 212.8
PERMIT
B .34 .67
.2
11.3
0 6 227.5
48DB~10I 76.0 966.7 4.50 24.60 28.5
2399.
6
1.1 HL93 54.9 INV 71.2 OPR
146.4 PERMIT
B .34 .67
.2
11.3
0 6 744.5
48DBT10I 117.0 2109.2 4.50 24.60 43.9
4417.
9
1 HL93 59 INV 86.8 OPR 155.9
PERMIT
B .34 .67
.2
11.3
0 6 1375.8
48DBT7I- 117.1 1640.5 5.00 27.00 43.9
4423.
3
1.1 HL93 61 INV 88.7 OPR 159.2
PERMIT
B .34 .67
.2
10.8
0 6 1160.2
48DBT7I 135.0 2214.7 5.00 27.00 50.6
5410.
8
1 HL93 60.8 INV 97.4 OPR 164.1
PERMIT
B .34 .67
.2
10.8
0 6 1429.9
48DBT5I- 135.1 1625.3 6.00 24.00 50.6
5416.
5
1 HL93 62.4 INV 91.6 OPR 154.4
PERMIT
B .34 .67
.2
11.1
0 6 1202.2
48DBT5I 154.0 2224.1 6.00 24.00 57.8
6529.
4
1 HL93 64 INV 99.1 OPR 165.6
PERMIT
B .34 .67
.2
11.1
0 6 1504.4
51DU15I- 72.0 1054.6 4.25 16.20 27.0
2220.
8
1 HL93 51.9 INV 67.3 OPR 139.4
PERMIT
B .34 .67
.2
14.0
0 6 879.3

87
Tabulation of girder analysis (24 page table) Part II
ID Span
(feet)
Pjack
(k)
Ems
(inch
)
EE (inch)
Har
p
(feet
)
LL+I
/Lane Rating
Comp
Fixity adj
Dist
(feet
)
Ser
III
sqrt
(f'c)
Final
force
(k)
51DU15I 92.0 1581.9 4.25 16.20 34.5
3146.
9
1 HL93 54.2 INV 70.2 OPR 141.7
PERMIT
B .34 .67
.2
14.0
0 6 1277.3
51DU10I- 92.1 1230.4 4.25 15.00 34.5
3151.
7
1.1 HL93 58.6 INV 75.9 OPR
153.3 PERMIT
B .34 .67
.2
13.0
0 6 1021.0
51DU10I 119.0 1845.6 4.25 15.00 43.9 4525
1 HL93 58.3 INV 75.6 OPR 134.7
PERMIT
B .34 .67
.2
13.0
0 6 1491.6
51DU7I- 119.1 1669.8 4.25 16.00 44.6
4530.
4
1.1 HL93 65.3 INV 87.3 OPR
155.5 PERMIT
B .34 .67
.2
12.0
0 4 1354.1
51DU7I 140.0 2285.0 4.25 16.00 52.5
5698.
2
1 HL93 64 INV 93.5 OPR 155.4
PERMIT
B .34 .67
.2
12.0
0 4 1784.2
60DB-10I 76.0 769.9 8.00 29.90 28.5
2399.
6
1 HL93 52.6 INV 68.1 OPR 140.2
PERMIT
B .34 .67
.2
11.3
0 6 632.5
60DBT10I 137.0 2309.6 8.00 29.90 51.4
5525.
2
1 HL93 63.4 INV 95.5 OPR 160.1
PERMIT
B .34 .67
.2
11.3
0 6 1583.0
60DBT7I- 137.1 1669.8 5.00 26.00 51.4
5530.
9
1 HL93 61.9 INV 83.8 OPR 140.4
PERMIT
B .34 .67
.2
10.8
0 6 1239.8
60DBT7I 165.0 2548.7 5.00 29.00 61.9 7210
1 HL93 61.2 INV 94.3 OPR 161.1
PERMIT
B .34 .67
.2
10.8
0 6 1677.5
60DBT5I- 165.1 1821.0 5.00 28.00 61.9
7216.
3
1 HL93 62.4 INV 94.7 OPR 161.9
PERMIT
B .34 .67
.2
11.1
0 6 1357.4
60DBT5I 181.0 2254.5 5.00 28.00 67.9
8243.
3
1 HL93 61 INV 97 OPR 171.8
PERMIT
B .34 .67
.2
11.1
0 6 1592.2
63DU15I- 80.0 1054.6 4.25 18.70 30.0
2581.
6
1.1 HL93 57 INV 73.9 OPR 151.1
PERMIT
B .34 .67
.2
14.0
0 6 885.1
63DU15I 87.0 1230.4 4.25 18.70 32.6
2907.
8
1.1 HL93 59.6 INV 77.2 OPR
156.6 PERMIT
B .34 .67
.2
14.0
0 6 1020.0
63DU10I- 87.1 878.8 4.25 16.80 32.6
2912.
5
1 HL93 54.7 INV 70.9 OPR 143.9
PERMIT
B .34 .67
.2
13.0
0 6 754.6
63DU10I 112.0 1406.2 4.25 16.80 42.0
4153.
7
1.1 HL93 63.1 INV 81.8 OPR
150.4 PERMIT
B .34 .67
.2
13.0
0 6 1170.7

88
Tabulation of girder analysis (24 page table) Part II
ID Span
(feet)
Pjack
(k)
Ems
(inch
)
EE (inch)
Har
p
(feet
)
LL+I
/Lane Rating
Comp
Fixity adj
Dist
(feet
)
Ser
III
sqrt
(f'c)
Final
force
(k)
63DU7I- 112.1 1318.3 4.25 15.70 42.0
4158.
9
1.2 HL93 66 INV 100.9 OPR
185.4 PERMIT
B .34 .67
.2
12.0
0 1 1094.8
63DU7I 130.0 1757.7 4.25 15.70 48.8
5128.
5
1.1 HL93 68.5 INV 111.7 OPR
191.2 PERMIT
B .34 .67
.2
12.0
0 1 1418.0
69DB-10I 84.0 759.3 5.00 24.00 31.5
2766.
8
1.1 HL93 57 INV 73.9 OPR 150.4
PERMIT
B .34 .67
.2
11.3
0 6 622.2
69DBT10I 132.0 1603.0 5.00 24.00 49.5
5240.
8
1 HL93 61.1 INV 82.8 OPR 140.8
PERMIT
B .34 .67
.2
11.3
0 6 1211.8
69DBT7I- 132.1 1406.2 6.00 26.00 49.5
5246.
5
1.1 HL93 66.3 INV 86 OPR 146.1
PERMIT
B .34 .67
.2
10.8
0 6 1090.6
69DBT7I 158.0 1933.5 6.00 26.00 59.3
6774.
1
1 HL93 62.1 INV 87.5 OPR 147.4
PERMIT
B .34 .67
.2
10.8
0 6 1436.3
69DBT5I- 158.1 1406.2 5.00 28.00 59.3
6780.
2
1.1 HL93 65.5 INV 90 OPR 151.6
PERMIT
B .34 .67
.2
11.1
0 6 1123.5
69DBT5I 196.0 2285.0 5.00 28.00 73.5
9258.
6
1.1 HL93 62 INV 98.5 OPR 180.8
PERMIT
B .34 .67
.2
11.1
0 6 1662.7
75DU15I- 64.0 533.2 4.25 21.10 24.0
1873.
2
1.1 HL93 54.9 INV 71.1 OPR
149.7 PERMIT
B .34 .67
.2
14.0
0 6 471.5
75DU15I 83.0 837.8 4.25 21.10 31.1
2720.
2
1.2 HL93 59.9 INV 77.7 OPR
158.3 PERMIT
B .34 .67
.2
14.0
0 6 727.6
75DU10I- 83.1 703.1 4.25 19.10 31.1
2724.
8
1.1 HL93 56.4 INV 73.1 OPR
148.9 PERMIT
B .34 .67
.2
13.0
0 6 612.7
75DU10I 105.0 1054.6 4.25 19.10 39.4
3792.
1
1.1 HL93 60.7 INV 78.7 OPR
150.2 PERMIT
B .34 .67
.2
13.0
0 6 904.0
75DU7I- 105.1 1054.6 4.25 18.10 39.4
3797.
2
1 HL93 57.5 INV 109 OPR 207.8
PERMIT
B .34 .67
.2
12.0
0 -1 894.2
75DU7I 121.0 1406.2 4.25 18.10 45.4
4632.
9
1.1 HL93 66.3 INV 123.9 OPR
219 PERMIT
B .34 .67
.2
12.0
0 -1 1163.4
10DS15E- 16.1 618.7 2.30 3.34 7.9 240.6
1 HL93 41.5 INV 53.8 OPR 149.8
PERMIT
L .61 .82
.46
12.0
0 6 539.2

89
Tabulation of girder analysis (24 page table) Part II
ID Span
(feet)
Pjack
(k)
Ems
(inch
)
EE (inch)
Har
p
(feet
)
LL+I
/Lane Rating
Comp
Fixity adj
Dist
(feet
)
Ser
III
sqrt
(f'c)
Final
force
(k)
10DS15E 22.0 1082.7 2.30 3.34 8.3 351.4
1.1 HL93 45.7 INV 59.2 OPR
157.8 PERMIT
L .61 .82
.46
12.0
0 6 906.6
13DS15E- 22.1 796.8 2.30 4.34 8.3 353.5
1.1 HL93 47.7 INV 61.8 OPR
164.7 PERMIT
L .61 .82
.46
12.0
0 6 693.4
13DS15E 31.0 1434.3 2.30 4.34 11.6 580.5
1 HL93 46.1 INV 60.7 OPR 173.5
PERMIT
L .61 .82
.46
12.0
0 6 1199.9
17DS15E- 31.1 1148.4 3.40 5.67 11.6 584.1
1 HL93 45.8 INV 59.3 OPR 169.8
PERMIT
L .61 .82
.46
12.0
0 6 1007.5
17DS15E 42.0 2378.8 3.40 5.67 15.8 985.3
1 HL93 46.9 INV 66.2 OPR 154.6
PERMIT
L .61 .82
.46
12.0
0 6 1972.2
20DS15E- 42.1 1722.5 2.50 6.67 16.8 989.1
1.1 HL93 47.9 INV 63.6 OPR
148.5 PERMIT
L .61 .82
.46
12.0
0 6 1482.5
20DS15E 51.0 2706.9 2.50 6.67 19.1
1336.
3
1 HL93 48.2 INV 70.6 OPR 155.4
PERMIT
L .61 .82
.46
12.0
0 6 2231.1
32DU15E- 31.0 513.2 6.50 14.80 11.6 580.5
1.1 HL93 48.3 INV 62.6 OPR
178.9 PERMIT
L .61 .82
.46
14.0
0 6 447.0
32DU15E
~ 44.0 941.0 6.50 14.80 16.5
1061.
8
1 HL93 46.6 INV 60.5 OPR 138.9
PERMIT
L .61 .82
.46
14.0
0 6 790.9
32DU15E 56.0 1312.4 4.50 12.50 21.0
1538.
6
1.1 HL93 51.8 INV 67.1 OPR
144.6 PERMIT
L .61 .82
.46
14.0
0 6 1038.9
32DU10E- 56.1 928.1 4.50 12.50 21.0
1542.
7
1 HL93 47.3 INV 61.4 OPR 132.2
PERMIT
L .61 .82
.46
13.0
0 6 771.0
32DU10E 82.0 1940.5 4.50 12.50 30.8
2673.
8
1.1 HL93 55.1 INV 71.8 OPR
146.5 PERMIT
L .61 .82
.46
13.0
0 6 1457.3
32DU7E- 82.1 1539.7 4.10 12.00 31.5
2678.
4
1 HL93 52.1 INV 67.6 OPR 137.9
PERMIT
L .61 .82
.46
12.0
0 6 1207.0
32DU7E 91.0 1881.9 4.10 12.00 34.5
3098.
7
1 HL93 53.5 INV 69.3 OPR 140
PERMIT
L .61 .82
.46
12.0
0 6 1427.8
32DU-15E 56.0 1454.2 6.50 14.80 27.0
1538.
6
1 HL93 49.5 INV 64.1 OPR 138.3
PERMIT
L .61 .82
.46
14.0
0 6 1172.5
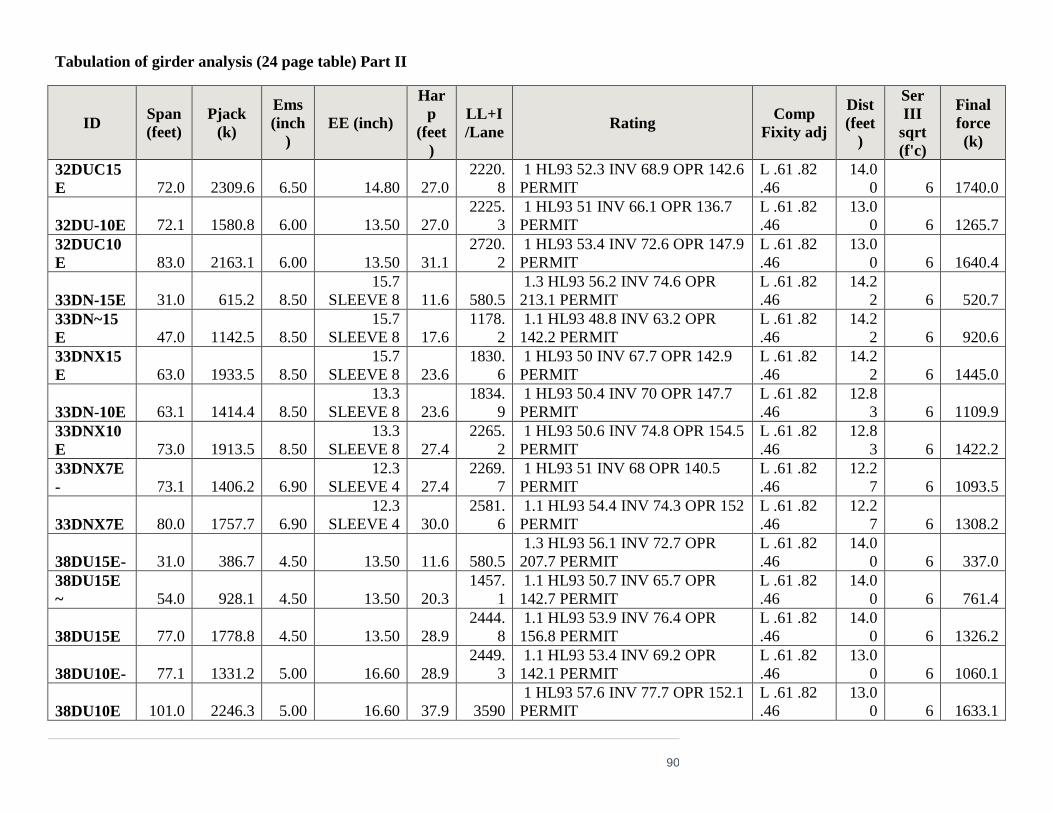
90
Tabulation of girder analysis (24 page table) Part II
ID Span
(feet)
Pjack
(k)
Ems
(inch
)
EE (inch)
Har
p
(feet
)
LL+I
/Lane Rating
Comp
Fixity adj
Dist
(feet
)
Ser
III
sqrt
(f'c)
Final
force
(k)
32DUC15
E 72.0 2309.6 6.50 14.80 27.0
2220.
8
1 HL93 52.3 INV 68.9 OPR 142.6
PERMIT
L .61 .82
.46
14.0
0 6 1740.0
32DU-10E 72.1 1580.8 6.00 13.50 27.0
2225.
3
1 HL93 51 INV 66.1 OPR 136.7
PERMIT
L .61 .82
.46
13.0
0 6 1265.7
32DUC10
E 83.0 2163.1 6.00 13.50 31.1
2720.
2
1 HL93 53.4 INV 72.6 OPR 147.9
PERMIT
L .61 .82
.46
13.0
0 6 1640.4
33DN-15E 31.0 615.2 8.50
15.7
SLEEVE 8 11.6 580.5
1.3 HL93 56.2 INV 74.6 OPR
213.1 PERMIT
L .61 .82
.46
14.2
2 6 520.7
33DN~15
E 47.0 1142.5 8.50
15.7
SLEEVE 8 17.6
1178.
2
1.1 HL93 48.8 INV 63.2 OPR
142.2 PERMIT
L .61 .82
.46
14.2
2 6 920.6
33DNX15
E 63.0 1933.5 8.50
15.7
SLEEVE 8 23.6
1830.
6
1 HL93 50 INV 67.7 OPR 142.9
PERMIT
L .61 .82
.46
14.2
2 6 1445.0
33DN-10E 63.1 1414.4 8.50
13.3
SLEEVE 8 23.6
1834.
9
1 HL93 50.4 INV 70 OPR 147.7
PERMIT
L .61 .82
.46
12.8
3 6 1109.9
33DNX10
E 73.0 1913.5 8.50
13.3
SLEEVE 8 27.4
2265.
2
1 HL93 50.6 INV 74.8 OPR 154.5
PERMIT
L .61 .82
.46
12.8
3 6 1422.2
33DNX7E
- 73.1 1406.2 6.90
12.3
SLEEVE 4 27.4
2269.
7
1 HL93 51 INV 68 OPR 140.5
PERMIT
L .61 .82
.46
12.2
7 6 1093.5
33DNX7E 80.0 1757.7 6.90
12.3
SLEEVE 4 30.0
2581.
6
1.1 HL93 54.4 INV 74.3 OPR 152
PERMIT
L .61 .82
.46
12.2
7 6 1308.2
38DU15E- 31.0 386.7 4.50 13.50 11.6 580.5
1.3 HL93 56.1 INV 72.7 OPR
207.7 PERMIT
L .61 .82
.46
14.0
0 6 337.0
38DU15E
~ 54.0 928.1 4.50 13.50 20.3
1457.
1
1.1 HL93 50.7 INV 65.7 OPR
142.7 PERMIT
L .61 .82
.46
14.0
0 6 761.4
38DU15E 77.0 1778.8 4.50 13.50 28.9
2444.
8
1.1 HL93 53.9 INV 76.4 OPR
156.8 PERMIT
L .61 .82
.46
14.0
0 6 1326.2
38DU10E- 77.1 1331.2 5.00 16.60 28.9
2449.
3
1.1 HL93 53.4 INV 69.2 OPR
142.1 PERMIT
L .61 .82
.46
13.0
0 6 1060.1
38DU10E 101.0 2246.3 5.00 16.60 37.9 3590
1 HL93 57.6 INV 77.7 OPR 152.1
PERMIT
L .61 .82
.46
13.0
0 6 1633.1

91
Tabulation of girder analysis (24 page table) Part II
ID Span
(feet)
Pjack
(k)
Ems
(inch
)
EE (inch)
Har
p
(feet
)
LL+I
/Lane Rating
Comp
Fixity adj
Dist
(feet
)
Ser
III
sqrt
(f'c)
Final
force
(k)
38DU7E- 101.1 1856.1 5.00 16.10 37.9 3595
1.1 HL93 58.3 INV 75.6 OPR
147.8 PERMIT
L .61 .82
.46
12.0
0 6 1405.5
38DU7E 111.0 2193.6 5.00 16.10 41.6
4101.
4
1 HL93 58.5 INV 75.8 OPR 140
PERMIT
L .61 .82
.46
12.0
0 6 1613.0
38DU-15E 64.0 1368.7 4.50 17.00 24.0
1873.
2
1 HL93 50.1 INV 65 OPR 136.8
PERMIT
L .61 .82
.46
14.0
0 6 1098.3
38DUC15
E 89.0 2566.2 4.50 17.00 33.4
3002.
8
1 HL93 54.7 INV 76.8 OPR 155.4
PERMIT
L .61 .82
.46
14.0
0 6 1855.1
38DU-10E 89.1 1845.6 4.50 17.20 33.4
3007.
6
1 HL93 53.8 INV 69.7 OPR 141.1
PERMIT
L .61 .82
.46
13.0
0 6 1445.1
38DUC10
E 102.0 2460.8 4.50 17.20 38.3
3640.
2
1 HL93 56 INV 76.1 OPR 147.9
PERMIT
L .61 .82
.46
13.0
0 6 1826.6
38DUC7E
- 102.1 1933.5 4.25 16.00 38.3
3645.
3
1 HL93 56.7 INV 73.5 OPR 142.7
PERMIT
L .61 .82
.46
12.0
0 6 1478.6
38DUC7E 114.0 2372.9 4.25 16.00 42.8
4258.
8
1 HL93 57.3 INV 74.3 OPR 135.3
PERMIT
L .61 .82
.46
12.0
0 6 1752.1
41DN-15E 68.0 1581.9 7.00
20
SLEEVE
16 25.5
2045.
4
1.1 HL93 53.5 INV 69.4 OPR
144.8 PERMIT
L .61 .82
.46
14.2
0 6 1209.7
41DNX15
E 85.0 2460.8 7.00
20
SLEEVE
16 31.9
2813.
6
1.1 HL93 55.2 INV 79.9 OPR
162.4 PERMIT
L .61 .82
.46
14.2
0 6 1719.3
41DN-10E 85.1 1757.7 6.50
19
SLEEVE 8 31.9
2818.
3
1 HL93 54.5 INV 74.8 OPR 152.1
PERMIT
L .61 .82
.46
12.8
3 6 1328.7
41DNX10
E 98.0 2372.9 6.50
19
SLEEVE 8 36.8
3440.
5
1 HL93 55.5 INV 82.4 OPR 164.5
PERMIT
L .61 .82
.46
12.8
3 6 1680.9
41DNX7E
- 98.1 1933.5 6.50
18.5
SLEEVE 8 36.8
3445.
4
1 HL93 55.8 INV 81.6 OPR 162.8
PERMIT
L .61 .82
.46
12.3
0 6 1448.5
41DNX7E 109.0 2460.8 6.50
18.5
SLEEVE 8 40.9
3997.
5
1 HL93 58.2 INV 88.4 OPR 165
PERMIT
L .61 .82
.46
12.3
0 6 1741.4

92
Tabulation of girder analysis (24 page table) Part II
ID Span
(feet)
Pjack
(k)
Ems
(inch
)
EE (inch)
Har
p
(feet
)
LL+I
/Lane Rating
Comp
Fixity adj
Dist
(feet
)
Ser
III
sqrt
(f'c)
Final
force
(k)
44DU15E- 68.0 1283.1 4.50 16.20 25.5
2045.
4
1.1 HL93 51.8 INV 67.1 OPR 140
PERMIT
L .61 .82
.46
14.0
0 6 1036.3
44DU15E 94.0 2224.1 4.50 16.20 35.3 3244
1 HL93 56.2 INV 72.8 OPR 146.7
PERMIT
L .61 .82
.46
14.0
0 6 1672.5
44DU10E- 94.1 1647.6 4.50 20.20 35.3
3248.
8
1.1 HL93 56.7 INV 73.5 OPR 148
PERMIT
L .61 .82
.46
13.4
0 6 1311.2
44DU10E 122.0 2688.1 4.50 20.20 45.8
4687.
2
1 HL93 59.8 INV 80.7 OPR 142
PERMIT
L .61 .82
.46
13.4
0 6 1980.3
44DU7E- 122.1 2285.0 4.25 19.00 45.8
4692.
6
1 HL93 61.1 INV 79.1 OPR 139.3
PERMIT
L .61 .82
.46
12.0
0 6 1736.2
44DU7E 139.0 2988.1 4.25 19.00 52.1
5640.
3
1 HL93 63.6 INV 83.5 OPR 139.2
PERMIT
L .61 .82
.46
12.0
0 6 2150.5
48DB-10E 31.0 263.7 4.00 25.20 11.6 580.5
1.2 HL93 54.8 INV 71.1 OPR
203.1 PERMIT
L .61 .82
.46
11.3
0 6 226.3
48DB~10E 67.0 878.8 4.00 25.20 25.1 2002
1 HL93 50.6 INV 65.5 OPR 137
PERMIT
L .61 .82
.46
11.3
0 6 673.6
48DBT10
E 103.0 1845.6 4.00 25.20 38.6
3690.
7
1 HL93 55.4 INV 76.1 OPR 146.9
PERMIT
L .61 .82
.46
11.3
0 6 1209.8
48DBT7E- 103.1 1454.2 5.00 27.00 38.6
3695.
7
1 HL93 56.8 INV 73.6 OPR 142.2
PERMIT
L .61 .82
.46
10.8
0 6 1041.4
48DBT7E 119.0 1967.5 5.00 27.00 45.0 4525
1 HL93 58.6 INV 81.8 OPR 145.8
PERMIT
L .61 .82
.46
10.8
0 6 1293.0
48DBT5E- 119.1 1368.7 6.00 26.00 44.6
4530.
4
1 HL93 58.7 INV 76.1 OPR 135.5
PERMIT
L .61 .82
.46
11.1
0 6 1028.3
48DBT5E 146.0 2224.1 6.00 26.00 54.8
6049.
6
1.1 HL93 66.7 INV 91.9 OPR
151.2 PERMIT
L .61 .82
.46
11.1
0 6 1453.6
51DU15E- 84.0 1581.9 4.25 16.20 27.8
2766.
8
1 HL93 53.4 INV 69.2 OPR 140.8
PERMIT
L .61 .82
.46
14.0
0 6 1250.3
51DU15E 92.0 1845.6 4.25 16.20 34.5
3146.
9
1 HL93 54.7 INV 70.9 OPR 143
PERMIT
L .61 .82
.46
14.0
0 6 1430.8
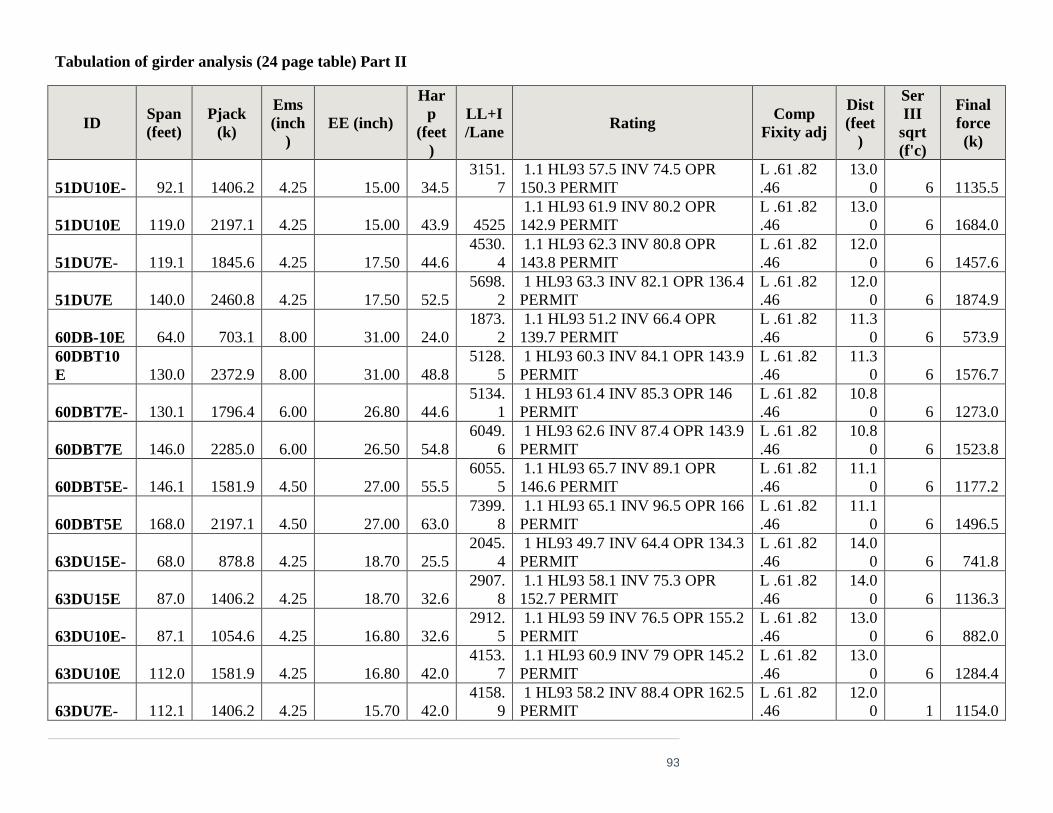
93
Tabulation of girder analysis (24 page table) Part II
ID Span
(feet)
Pjack
(k)
Ems
(inch
)
EE (inch)
Har
p
(feet
)
LL+I
/Lane Rating
Comp
Fixity adj
Dist
(feet
)
Ser
III
sqrt
(f'c)
Final
force
(k)
51DU10E- 92.1 1406.2 4.25 15.00 34.5
3151.
7
1.1 HL93 57.5 INV 74.5 OPR
150.3 PERMIT
L .61 .82
.46
13.0
0 6 1135.5
51DU10E 119.0 2197.1 4.25 15.00 43.9 4525
1.1 HL93 61.9 INV 80.2 OPR
142.9 PERMIT
L .61 .82
.46
13.0
0 6 1684.0
51DU7E- 119.1 1845.6 4.25 17.50 44.6
4530.
4
1.1 HL93 62.3 INV 80.8 OPR
143.8 PERMIT
L .61 .82
.46
12.0
0 6 1457.6
51DU7E 140.0 2460.8 4.25 17.50 52.5
5698.
2
1 HL93 63.3 INV 82.1 OPR 136.4
PERMIT
L .61 .82
.46
12.0
0 6 1874.9
60DB-10E 64.0 703.1 8.00 31.00 24.0
1873.
2
1.1 HL93 51.2 INV 66.4 OPR
139.7 PERMIT
L .61 .82
.46
11.3
0 6 573.9
60DBT10
E 130.0 2372.9 8.00 31.00 48.8
5128.
5
1 HL93 60.3 INV 84.1 OPR 143.9
PERMIT
L .61 .82
.46
11.3
0 6 1576.7
60DBT7E- 130.1 1796.4 6.00 26.80 44.6
5134.
1
1 HL93 61.4 INV 85.3 OPR 146
PERMIT
L .61 .82
.46
10.8
0 6 1273.0
60DBT7E 146.0 2285.0 6.00 26.50 54.8
6049.
6
1 HL93 62.6 INV 87.4 OPR 143.9
PERMIT
L .61 .82
.46
10.8
0 6 1523.8
60DBT5E- 146.1 1581.9 4.50 27.00 55.5
6055.
5
1.1 HL93 65.7 INV 89.1 OPR
146.6 PERMIT
L .61 .82
.46
11.1
0 6 1177.2
60DBT5E 168.0 2197.1 4.50 27.00 63.0
7399.
8
1.1 HL93 65.1 INV 96.5 OPR 166
PERMIT
L .61 .82
.46
11.1
0 6 1496.5
63DU15E- 68.0 878.8 4.25 18.70 25.5
2045.
4
1 HL93 49.7 INV 64.4 OPR 134.3
PERMIT
L .61 .82
.46
14.0
0 6 741.8
63DU15E 87.0 1406.2 4.25 18.70 32.6
2907.
8
1.1 HL93 58.1 INV 75.3 OPR
152.7 PERMIT
L .61 .82
.46
14.0
0 6 1136.3
63DU10E- 87.1 1054.6 4.25 16.80 32.6
2912.
5
1.1 HL93 59 INV 76.5 OPR 155.2
PERMIT
L .61 .82
.46
13.0
0 6 882.0
63DU10E 112.0 1581.9 4.25 16.80 42.0
4153.
7
1.1 HL93 60.9 INV 79 OPR 145.2
PERMIT
L .61 .82
.46
13.0
0 6 1284.4
63DU7E- 112.1 1406.2 4.25 15.70 42.0
4158.
9
1 HL93 58.2 INV 88.4 OPR 162.5
PERMIT
L .61 .82
.46
12.0
0 1 1154.0
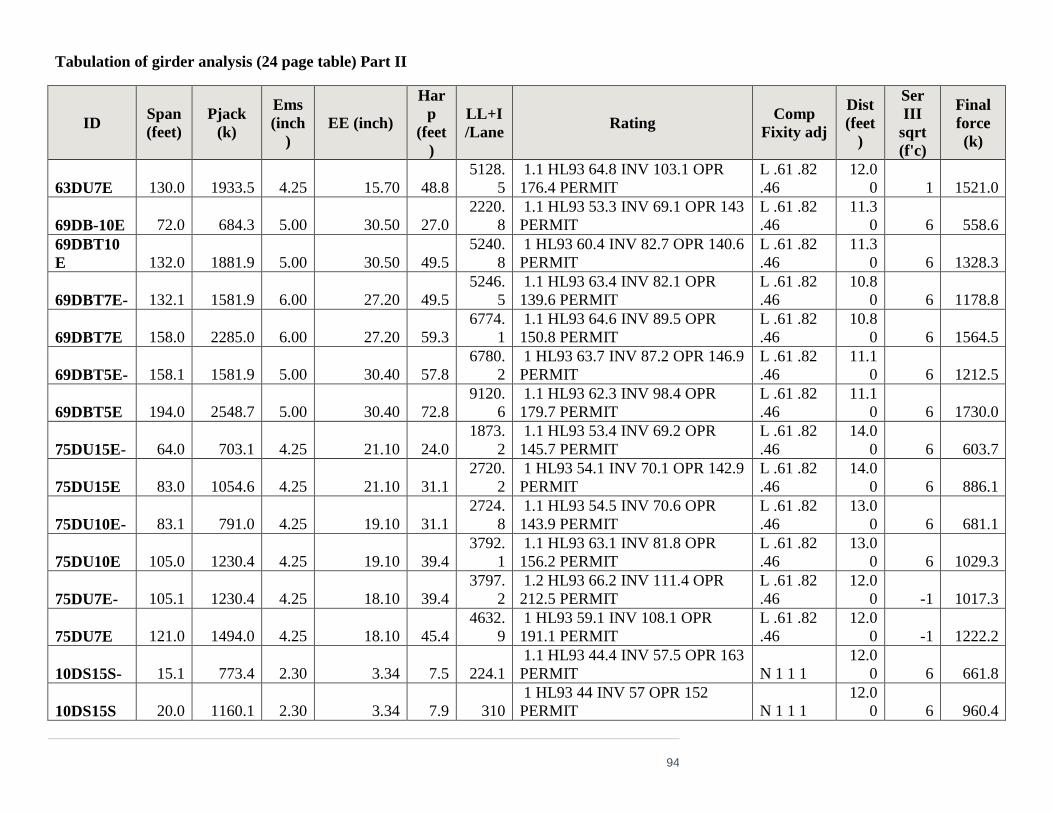
94
Tabulation of girder analysis (24 page table) Part II
ID Span
(feet)
Pjack
(k)
Ems
(inch
)
EE (inch)
Har
p
(feet
)
LL+I
/Lane Rating
Comp
Fixity adj
Dist
(feet
)
Ser
III
sqrt
(f'c)
Final
force
(k)
63DU7E 130.0 1933.5 4.25 15.70 48.8
5128.
5
1.1 HL93 64.8 INV 103.1 OPR
176.4 PERMIT
L .61 .82
.46
12.0
0 1 1521.0
69DB-10E 72.0 684.3 5.00 30.50 27.0
2220.
8
1.1 HL93 53.3 INV 69.1 OPR 143
PERMIT
L .61 .82
.46
11.3
0 6 558.6
69DBT10
E 132.0 1881.9 5.00 30.50 49.5
5240.
8
1 HL93 60.4 INV 82.7 OPR 140.6
PERMIT
L .61 .82
.46
11.3
0 6 1328.3
69DBT7E- 132.1 1581.9 6.00 27.20 49.5
5246.
5
1.1 HL93 63.4 INV 82.1 OPR
139.6 PERMIT
L .61 .82
.46
10.8
0 6 1178.8
69DBT7E 158.0 2285.0 6.00 27.20 59.3
6774.
1
1.1 HL93 64.6 INV 89.5 OPR
150.8 PERMIT
L .61 .82
.46
10.8
0 6 1564.5
69DBT5E- 158.1 1581.9 5.00 30.40 57.8
6780.
2
1 HL93 63.7 INV 87.2 OPR 146.9
PERMIT
L .61 .82
.46
11.1
0 6 1212.5
69DBT5E 194.0 2548.7 5.00 30.40 72.8
9120.
6
1.1 HL93 62.3 INV 98.4 OPR
179.7 PERMIT
L .61 .82
.46
11.1
0 6 1730.0
75DU15E- 64.0 703.1 4.25 21.10 24.0
1873.
2
1.1 HL93 53.4 INV 69.2 OPR
145.7 PERMIT
L .61 .82
.46
14.0
0 6 603.7
75DU15E 83.0 1054.6 4.25 21.10 31.1
2720.
2
1 HL93 54.1 INV 70.1 OPR 142.9
PERMIT
L .61 .82
.46
14.0
0 6 886.1
75DU10E- 83.1 791.0 4.25 19.10 31.1
2724.
8
1.1 HL93 54.5 INV 70.6 OPR
143.9 PERMIT
L .61 .82
.46
13.0
0 6 681.1
75DU10E 105.0 1230.4 4.25 19.10 39.4
3792.
1
1.1 HL93 63.1 INV 81.8 OPR
156.2 PERMIT
L .61 .82
.46
13.0
0 6 1029.3
75DU7E- 105.1 1230.4 4.25 18.10 39.4
3797.
2
1.2 HL93 66.2 INV 111.4 OPR
212.5 PERMIT
L .61 .82
.46
12.0
0 -1 1017.3
75DU7E 121.0 1494.0 4.25 18.10 45.4
4632.
9
1 HL93 59.1 INV 108.1 OPR
191.1 PERMIT
L .61 .82
.46
12.0
0 -1 1222.2
10DS15S- 15.1 773.4 2.30 3.34 7.5 224.1
1.1 HL93 44.4 INV 57.5 OPR 163
PERMIT N 1 1 1
12.0
0 6 661.8
10DS15S 20.0 1160.1 2.30 3.34 7.9 310
1 HL93 44 INV 57 OPR 152
PERMIT N 1 1 1
12.0
0 6 960.4
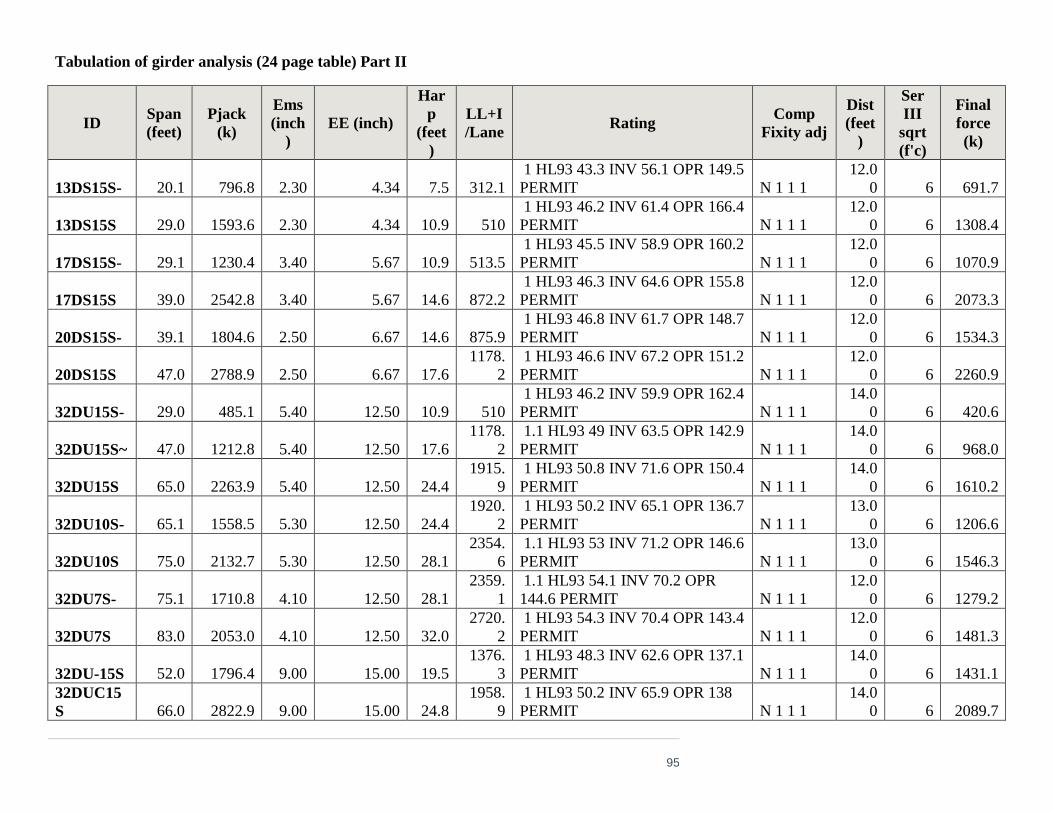
95
Tabulation of girder analysis (24 page table) Part II
ID Span
(feet)
Pjack
(k)
Ems
(inch
)
EE (inch)
Har
p
(feet
)
LL+I
/Lane Rating
Comp
Fixity adj
Dist
(feet
)
Ser
III
sqrt
(f'c)
Final
force
(k)
13DS15S- 20.1 796.8 2.30 4.34 7.5 312.1
1 HL93 43.3 INV 56.1 OPR 149.5
PERMIT N 1 1 1
12.0
0 6 691.7
13DS15S 29.0 1593.6 2.30 4.34 10.9 510
1 HL93 46.2 INV 61.4 OPR 166.4
PERMIT N 1 1 1
12.0
0 6 1308.4
17DS15S- 29.1 1230.4 3.40 5.67 10.9 513.5
1 HL93 45.5 INV 58.9 OPR 160.2
PERMIT N 1 1 1
12.0
0 6 1070.9
17DS15S 39.0 2542.8 3.40 5.67 14.6 872.2
1 HL93 46.3 INV 64.6 OPR 155.8
PERMIT N 1 1 1
12.0
0 6 2073.3
20DS15S- 39.1 1804.6 2.50 6.67 14.6 875.9
1 HL93 46.8 INV 61.7 OPR 148.7
PERMIT N 1 1 1
12.0
0 6 1534.3
20DS15S 47.0 2788.9 2.50 6.67 17.6
1178.
2
1 HL93 46.6 INV 67.2 OPR 151.2
PERMIT N 1 1 1
12.0
0 6 2260.9
32DU15S- 29.0 485.1 5.40 12.50 10.9 510
1 HL93 46.2 INV 59.9 OPR 162.4
PERMIT N 1 1 1
14.0
0 6 420.6
32DU15S~ 47.0 1212.8 5.40 12.50 17.6
1178.
2
1.1 HL93 49 INV 63.5 OPR 142.9
PERMIT N 1 1 1
14.0
0 6 968.0
32DU15S 65.0 2263.9 5.40 12.50 24.4
1915.
9
1 HL93 50.8 INV 71.6 OPR 150.4
PERMIT N 1 1 1
14.0
0 6 1610.2
32DU10S- 65.1 1558.5 5.30 12.50 24.4
1920.
2
1 HL93 50.2 INV 65.1 OPR 136.7
PERMIT N 1 1 1
13.0
0 6 1206.6
32DU10S 75.0 2132.7 5.30 12.50 28.1
2354.
6
1.1 HL93 53 INV 71.2 OPR 146.6
PERMIT N 1 1 1
13.0
0 6 1546.3
32DU7S- 75.1 1710.8 4.10 12.50 28.1
2359.
1
1.1 HL93 54.1 INV 70.2 OPR
144.6 PERMIT N 1 1 1
12.0
0 6 1279.2
32DU7S 83.0 2053.0 4.10 12.50 32.0
2720.
2
1 HL93 54.3 INV 70.4 OPR 143.4
PERMIT N 1 1 1
12.0
0 6 1481.3
32DU-15S 52.0 1796.4 9.00 15.00 19.5
1376.
3
1 HL93 48.3 INV 62.6 OPR 137.1
PERMIT N 1 1 1
14.0
0 6 1431.1
32DUC15
S 66.0 2822.9 9.00 15.00 24.8
1958.
9
1 HL93 50.2 INV 65.9 OPR 138
PERMIT N 1 1 1
14.0
0 6 2089.7
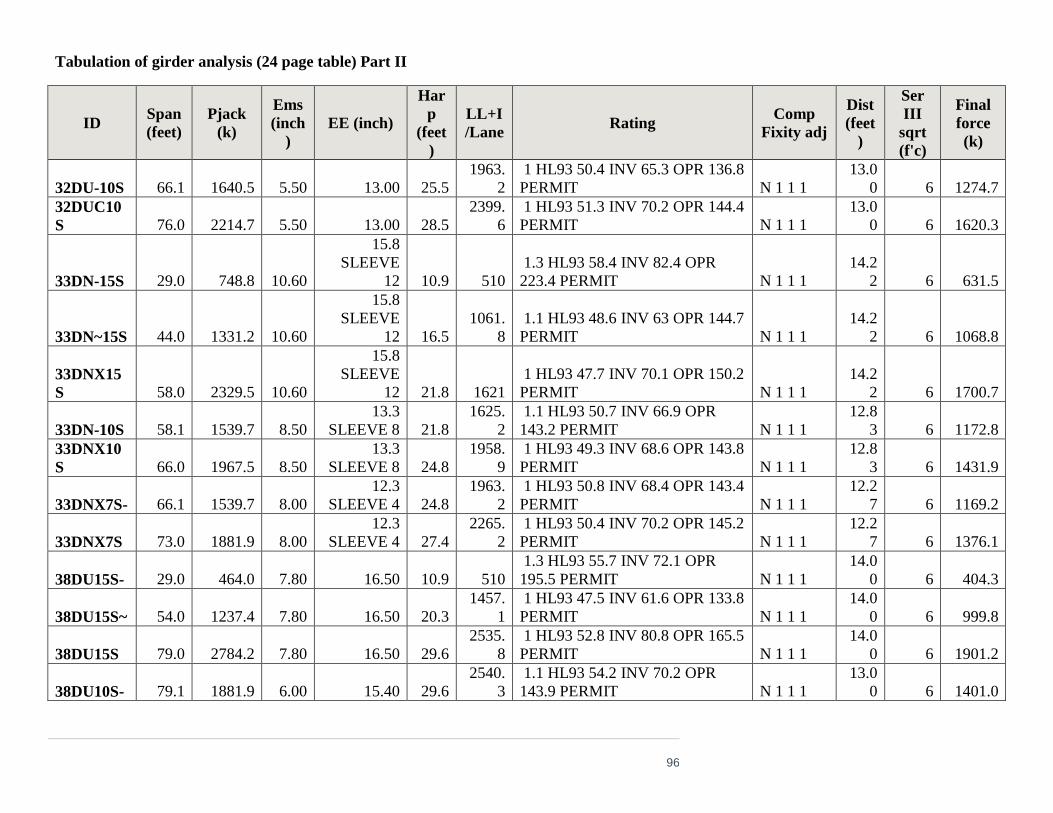
96
Tabulation of girder analysis (24 page table) Part II
ID Span
(feet)
Pjack
(k)
Ems
(inch
)
EE (inch)
Har
p
(feet
)
LL+I
/Lane Rating
Comp
Fixity adj
Dist
(feet
)
Ser
III
sqrt
(f'c)
Final
force
(k)
32DU-10S 66.1 1640.5 5.50 13.00 25.5
1963.
2
1 HL93 50.4 INV 65.3 OPR 136.8
PERMIT N 1 1 1
13.0
0 6 1274.7
32DUC10
S 76.0 2214.7 5.50 13.00 28.5
2399.
6
1 HL93 51.3 INV 70.2 OPR 144.4
PERMIT N 1 1 1
13.0
0 6 1620.3
33DN-15S 29.0 748.8 10.60
15.8
SLEEVE
12 10.9 510
1.3 HL93 58.4 INV 82.4 OPR
223.4 PERMIT N 1 1 1
14.2
2 6 631.5
33DN~15S 44.0 1331.2 10.60
15.8
SLEEVE
12 16.5
1061.
8
1.1 HL93 48.6 INV 63 OPR 144.7
PERMIT N 1 1 1
14.2
2 6 1068.8
33DNX15
S 58.0 2329.5 10.60
15.8
SLEEVE
12 21.8 1621
1 HL93 47.7 INV 70.1 OPR 150.2
PERMIT N 1 1 1
14.2
2 6 1700.7
33DN-10S 58.1 1539.7 8.50
13.3
SLEEVE 8 21.8
1625.
2
1.1 HL93 50.7 INV 66.9 OPR
143.2 PERMIT N 1 1 1
12.8
3 6 1172.8
33DNX10
S 66.0 1967.5 8.50
13.3
SLEEVE 8 24.8
1958.
9
1 HL93 49.3 INV 68.6 OPR 143.8
PERMIT N 1 1 1
12.8
3 6 1431.9
33DNX7S- 66.1 1539.7 8.00
12.3
SLEEVE 4 24.8
1963.
2
1 HL93 50.8 INV 68.4 OPR 143.4
PERMIT N 1 1 1
12.2
7 6 1169.2
33DNX7S 73.0 1881.9 8.00
12.3
SLEEVE 4 27.4
2265.
2
1 HL93 50.4 INV 70.2 OPR 145.2
PERMIT N 1 1 1
12.2
7 6 1376.1
38DU15S- 29.0 464.0 7.80 16.50 10.9 510
1.3 HL93 55.7 INV 72.1 OPR
195.5 PERMIT N 1 1 1
14.0
0 6 404.3
38DU15S~ 54.0 1237.4 7.80 16.50 20.3
1457.
1
1 HL93 47.5 INV 61.6 OPR 133.8
PERMIT N 1 1 1
14.0
0 6 999.8
38DU15S 79.0 2784.2 7.80 16.50 29.6
2535.
8
1 HL93 52.8 INV 80.8 OPR 165.5
PERMIT N 1 1 1
14.0
0 6 1901.2
38DU10S- 79.1 1881.9 6.00 15.40 29.6
2540.
3
1.1 HL93 54.2 INV 70.2 OPR
143.9 PERMIT N 1 1 1
13.0
0 6 1401.0

97
Tabulation of girder analysis (24 page table) Part II
ID Span
(feet)
Pjack
(k)
Ems
(inch
)
EE (inch)
Har
p
(feet
)
LL+I
/Lane Rating
Comp
Fixity adj
Dist
(feet
)
Ser
III
sqrt
(f'c)
Final
force
(k)
38DU10S 92.0 2480.7 6.00 15.40 34.5
3146.
9
1 HL93 55.4 INV 71.9 OPR 145.1
PERMIT N 1 1 1
13.0
0 6 1745.7
38DU7S- 92.1 1913.5 5.00 15.50 34.5
3151.
7
1 HL93 55.7 INV 72.2 OPR 145.7
PERMIT N 1 1 1
12.0
0 6 1404.9
38DU7S 101.0 2246.3 5.00 15.50 37.9 3590
1 HL93 55.1 INV 71.7 OPR 140.2
PERMIT N 1 1 1
12.0
0 6 1598.6
38DU-15S 60.0 1669.8 5.50 16.50 22.5
1704.
3
1.1 HL93 52 INV 67.4 OPR 143.5
PERMIT N 1 1 1
14.0
0 6 1288.0
38DUC15
S 81.0 2812.3 5.50 16.50 30.4
2627.
6
1 HL93 53.2 INV 71 OPR 145
PERMIT N 1 1 1
14.0
0 6 1972.8
38DU-10S 81.1 1907.7 4.50 15.50 30.4
2632.
2
1 HL93 52.3 INV 67.8 OPR 138.4
PERMIT N 1 1 1
13.0
0 6 1449.0
38DUC10
S 93.0 2601.4 4.50 15.50 34.1
3195.
3
1 HL93 56 INV 75.7 OPR 152.6
PERMIT N 1 1 1
13.0
0 6 1842.2
38DUC7S- 93.1 1967.5 4.25 17.50 34.9
3200.
2
1 HL93 54.5 INV 70.7 OPR 142.5
PERMIT N 1 1 1
12.0
0 6 1461.8
38DUC7S 103.0 2395.2 4.25 17.50 38.6
3690.
7
1 HL93 55.7 INV 72.2 OPR 139.5
PERMIT N 1 1 1
12.0
0 6 1708.1
41DN-15S 62.0 1845.6 10.80
18.9
SLEEVE 8 23.3
1788.
3
1 HL93 49.9 INV 64.6 OPR 136.7
PERMIT N 1 1 1
14.2
0 6 1416.7
41DNX15
S 75.0 2724.4 10.80
18.9
SLEEVE 8 28.1
2354.
6
1 HL93 51.1 INV 72.1 OPR 148.6
PERMIT N 1 1 1
14.2
0 6 1936.2
41DN-10S 75.1 1757.7 7.60
17.3
SLEEVE 8 28.1
2359.
1
1 HL93 52.1 INV 69.1 OPR 142.4
PERMIT N 1 1 1
12.8
3 6 1316.5
41DNX10
S 89.0 2548.7 7.60
17.3
SLEEVE 8 33.4
3002.
8
1 HL93 53.9 INV 77.9 OPR 157.8
PERMIT N 1 1 1
12.8
3 6 1746.3
41DNX7S- 89.1 1933.5 6.50
17
SLEEVE 8 33.4
3007.
6
1 HL93 53.3 INV 75.2 OPR 152.2
PERMIT N 1 1 1
12.3
0 6 1413.1
41DNX7S 99.0 2460.8 6.50
17
SLEEVE 8 37.1
3490.
1
1 HL93 55.3 INV 81.3 OPR 161.2
PERMIT N 1 1 1
12.3
0 6 1687.6

98
Tabulation of girder analysis (24 page table) Part II
ID Span
(feet)
Pjack
(k)
Ems
(inch
)
EE (inch)
Har
p
(feet
)
LL+I
/Lane Rating
Comp
Fixity adj
Dist
(feet
)
Ser
III
sqrt
(f'c)
Final
force
(k)
44DU15S- 64.0 1560.8 7.00 18.40 24.0
1873.
2
1 HL93 51 INV 66.1 OPR 139.2
PERMIT N 1 1 1
14.0
0 6 1233.7
44DU15S 94.0 3035.0 7.00 18.40 35.3 3244
1 HL93 54 INV 71.7 OPR 144.5
PERMIT N 1 1 1
14.0
0 6 2143.5
44DU10S- 94.1 1994.4 4.50 19.00 35.3
3248.
8
1 HL93 54.2 INV 70.3 OPR 141.6
PERMIT N 1 1 1
13.4
0 6 1513.6
44DU10S 115.0 3035.0 4.50 19.00 43.1
4311.
6
1 HL93 58.8 INV 79.3 OPR 143.7
PERMIT N 1 1 1
13.4
0 6 2095.5
44DU7S- 115.1 2548.7 4.25 19.00 43.1
4316.
9
1 HL93 59.7 INV 77.3 OPR 140.1
PERMIT N 1 1 1
12.0
0 6 1834.9
44DU7S 126.0 3076.0 4.25 19.00 47.3
4906.
2
1 HL93 61.8 INV 80.1 OPR 139
PERMIT N 1 1 1
12.0
0 6 2112.7
48DB-10S 29.0 260.1 7.10 24.00 10.9 510
1 HL93 44.8 INV 58.1 OPR 157.4
PERMIT N 1 1 1
11.3
0 6 225.8
48DB~10S 57.0 953.8 7.10 24.00 21.4
1579.
7
1.1 HL93 54.2 INV 70.2 OPR
150.8 PERMIT N 1 1 1
11.3
0 6 725.0
48DBT10S 85.0 1734.3 7.10 24.00 31.9
2813.
6
1 HL93 53.1 INV 69.3 OPR 140.9
PERMIT N 1 1 1
11.3
0 6 1177.3
48DBT7S- 85.1 1318.3 5.00 25.00 34.9
2818.
3
1 HL93 53 INV 68.7 OPR 139.6
PERMIT N 1 1 1
10.8
0 6 939.4
48DBT7S 100.0 1757.7 5.00 25.00 37.5
3539.
9
1 HL93 55.5 INV 72 OPR 141.8
PERMIT N 1 1 1
10.8
0 6 1165.6
48DBT5S- 100.1 1148.4 5.00 22.00 46.5
3544.
9
1 HL93 56 INV 72.5 OPR 142.8
PERMIT N 1 1 1
11.1
0 6 860.5
48DBT5S 124.0 1886.6 5.00 22.00 46.5
4796.
3
1 HL93 61.5 INV 87.4 OPR 152.7
PERMIT N 1 1 1
11.1
0 6 1227.3
51DU15S- 66.0 1318.3 4.25 16.20 24.8
1958.
9
1 HL93 51.1 INV 66.3 OPR 138.8
PERMIT N 1 1 1
14.0
0 6 1045.4
51DU15S 92.0 2285.0 4.25 16.20 34.5
3146.
9
1 HL93 54.2 INV 70.2 OPR 141.8
PERMIT N 1 1 1
14.0
0 6 1670.9
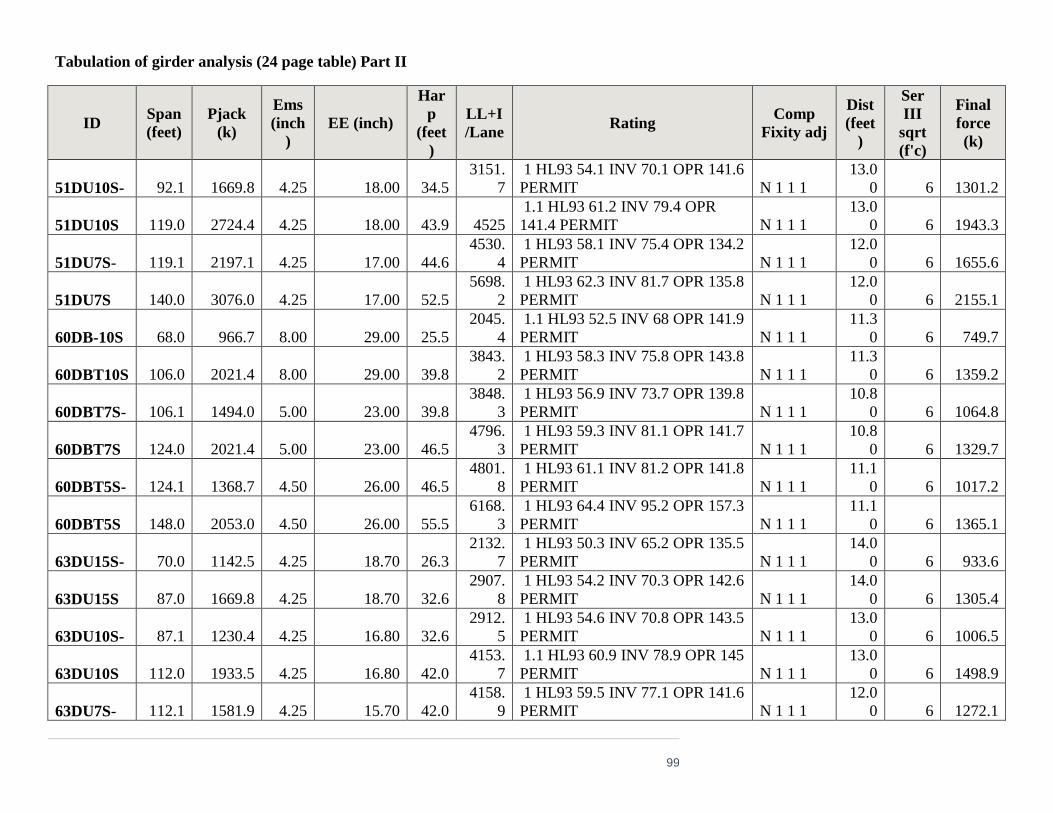
99
Tabulation of girder analysis (24 page table) Part II
ID Span
(feet)
Pjack
(k)
Ems
(inch
)
EE (inch)
Har
p
(feet
)
LL+I
/Lane Rating
Comp
Fixity adj
Dist
(feet
)
Ser
III
sqrt
(f'c)
Final
force
(k)
51DU10S- 92.1 1669.8 4.25 18.00 34.5
3151.
7
1 HL93 54.1 INV 70.1 OPR 141.6
PERMIT N 1 1 1
13.0
0 6 1301.2
51DU10S 119.0 2724.4 4.25 18.00 43.9 4525
1.1 HL93 61.2 INV 79.4 OPR
141.4 PERMIT N 1 1 1
13.0
0 6 1943.3
51DU7S- 119.1 2197.1 4.25 17.00 44.6
4530.
4
1 HL93 58.1 INV 75.4 OPR 134.2
PERMIT N 1 1 1
12.0
0 6 1655.6
51DU7S 140.0 3076.0 4.25 17.00 52.5
5698.
2
1 HL93 62.3 INV 81.7 OPR 135.8
PERMIT N 1 1 1
12.0
0 6 2155.1
60DB-10S 68.0 966.7 8.00 29.00 25.5
2045.
4
1.1 HL93 52.5 INV 68 OPR 141.9
PERMIT N 1 1 1
11.3
0 6 749.7
60DBT10S 106.0 2021.4 8.00 29.00 39.8
3843.
2
1 HL93 58.3 INV 75.8 OPR 143.8
PERMIT N 1 1 1
11.3
0 6 1359.2
60DBT7S- 106.1 1494.0 5.00 23.00 39.8
3848.
3
1 HL93 56.9 INV 73.7 OPR 139.8
PERMIT N 1 1 1
10.8
0 6 1064.8
60DBT7S 124.0 2021.4 5.00 23.00 46.5
4796.
3
1 HL93 59.3 INV 81.1 OPR 141.7
PERMIT N 1 1 1
10.8
0 6 1329.7
60DBT5S- 124.1 1368.7 4.50 26.00 46.5
4801.
8
1 HL93 61.1 INV 81.2 OPR 141.8
PERMIT N 1 1 1
11.1
0 6 1017.2
60DBT5S 148.0 2053.0 4.50 26.00 55.5
6168.
3
1 HL93 64.4 INV 95.2 OPR 157.3
PERMIT N 1 1 1
11.1
0 6 1365.1
63DU15S- 70.0 1142.5 4.25 18.70 26.3
2132.
7
1 HL93 50.3 INV 65.2 OPR 135.5
PERMIT N 1 1 1
14.0
0 6 933.6
63DU15S 87.0 1669.8 4.25 18.70 32.6
2907.
8
1 HL93 54.2 INV 70.3 OPR 142.6
PERMIT N 1 1 1
14.0
0 6 1305.4
63DU10S- 87.1 1230.4 4.25 16.80 32.6
2912.
5
1 HL93 54.6 INV 70.8 OPR 143.5
PERMIT N 1 1 1
13.0
0 6 1006.5
63DU10S 112.0 1933.5 4.25 16.80 42.0
4153.
7
1.1 HL93 60.9 INV 78.9 OPR 145
PERMIT N 1 1 1
13.0
0 6 1498.9
63DU7S- 112.1 1581.9 4.25 15.70 42.0
4158.
9
1 HL93 59.5 INV 77.1 OPR 141.6
PERMIT N 1 1 1
12.0
0 6 1272.1
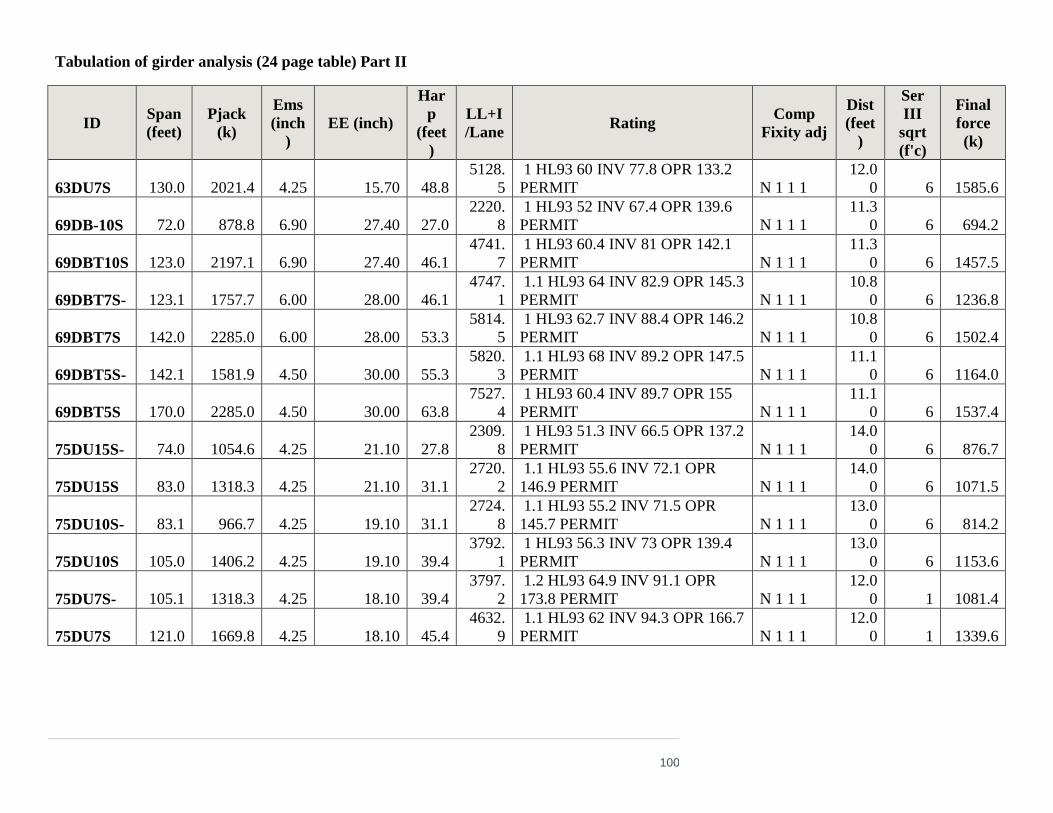
100
Tabulation of girder analysis (24 page table) Part II
ID Span
(feet)
Pjack
(k)
Ems
(inch
)
EE (inch)
Har
p
(feet
)
LL+I
/Lane Rating
Comp
Fixity adj
Dist
(feet
)
Ser
III
sqrt
(f'c)
Final
force
(k)
63DU7S 130.0 2021.4 4.25 15.70 48.8
5128.
5
1 HL93 60 INV 77.8 OPR 133.2
PERMIT N 1 1 1
12.0
0 6 1585.6
69DB-10S 72.0 878.8 6.90 27.40 27.0
2220.
8
1 HL93 52 INV 67.4 OPR 139.6
PERMIT N 1 1 1
11.3
0 6 694.2
69DBT10S 123.0 2197.1 6.90 27.40 46.1
4741.
7
1 HL93 60.4 INV 81 OPR 142.1
PERMIT N 1 1 1
11.3
0 6 1457.5
69DBT7S- 123.1 1757.7 6.00 28.00 46.1
4747.
1
1.1 HL93 64 INV 82.9 OPR 145.3
PERMIT N 1 1 1
10.8
0 6 1236.8
69DBT7S 142.0 2285.0 6.00 28.00 53.3
5814.
5
1 HL93 62.7 INV 88.4 OPR 146.2
PERMIT N 1 1 1
10.8
0 6 1502.4
69DBT5S- 142.1 1581.9 4.50 30.00 55.3
5820.
3
1.1 HL93 68 INV 89.2 OPR 147.5
PERMIT N 1 1 1
11.1
0 6 1164.0
69DBT5S 170.0 2285.0 4.50 30.00 63.8
7527.
4
1 HL93 60.4 INV 89.7 OPR 155
PERMIT N 1 1 1
11.1
0 6 1537.4
75DU15S- 74.0 1054.6 4.25 21.10 27.8
2309.
8
1 HL93 51.3 INV 66.5 OPR 137.2
PERMIT N 1 1 1
14.0
0 6 876.7
75DU15S 83.0 1318.3 4.25 21.10 31.1
2720.
2
1.1 HL93 55.6 INV 72.1 OPR
146.9 PERMIT N 1 1 1
14.0
0 6 1071.5
75DU10S- 83.1 966.7 4.25 19.10 31.1
2724.
8
1.1 HL93 55.2 INV 71.5 OPR
145.7 PERMIT N 1 1 1
13.0
0 6 814.2
75DU10S 105.0 1406.2 4.25 19.10 39.4
3792.
1
1 HL93 56.3 INV 73 OPR 139.4
PERMIT N 1 1 1
13.0
0 6 1153.6
75DU7S- 105.1 1318.3 4.25 18.10 39.4
3797.
2
1.2 HL93 64.9 INV 91.1 OPR
173.8 PERMIT N 1 1 1
12.0
0 1 1081.4
75DU7S 121.0 1669.8 4.25 18.10 45.4
4632.
9
1.1 HL93 62 INV 94.3 OPR 166.7
PERMIT N 1 1 1
12.0
0 1 1339.6

101
Tabulation of girder analysis (24 page table) Part III
ID Span
(feet)
Span/ 800
LL defl
Camber
(inch)
Comp
defl
(inch)
StressMu/
StressCrack
Weight
(k)
ult reaction
(k)
Merit
($/SF)
Pier col
(K)
Abut col
(K)
Abut Spread
(feet)
10DS15I- 18.1 1.96 0.1 0.0 1.54 33.9 190.3 57.5 380.6
10DS15I 24.0 1.07 0.3 0.0 1.74 45.0 240.0 50.0 480.0
13DS15I- 24.1 2.29 0.1 0.0 1.44 59.4 250.2 55.4 500.4
13DS15I 33.0 1.05 0.4 0.1 1.69 81.4 308.5 48.9 617.0
17DS15I- 33.1 2.27 0.1 0.0 1.44 106.4 325.6 55.9 651.2
17DS15I 45.0 1.04 0.5 0.1 1.66 144.7 391.3 51.0 782.6
20DS15I- 45.1 1.65 0.1 0.1 1.63 169.1 407.9 56.0 815.8
20DS15I 56.0 1.00 0.5 0.2 1.74 210.0 464.1 53.3 928.2
32DU15I- 34.0 7.00 0.1 0.0 1.11 82.9 278.9 47.1 557.8
32DU15I~ 50.0 2.68 0.4 0.0 1.40 121.9 349.3 41.4 698.6
32DU15I 65.0 1.48 0.9 0.1 1.65 153.5 402.7 37.8 805.4
32DU10I- 65.1 1.99 0.7 0.1 1.44 115.9 291.1 40.9 873.3
32DU10I 90.0 1.02 1.8 0.4 1.58 160.2 352.8 38.2 1058.4
32DU7I- 91.1 1.21 1.2 0.4 1.54 135.7 288.9 41.2 1155.6
32DU7I 100.0 1.01 1.5 0.5 1.56 148.9 306.1 40.6 1224.4
32DU-15I 48.0 2.94 0.4 0.0 1.37 117.1 341.3 41.9 682.6
32DUC15I 79.0 1.01 1.9 0.3 1.64 192.7 455.2 36.8 910.4
32DU-10I 79.1 1.35 1.2 0.2 1.55 146.9 330.1 40.2 990.3
32DUC10I 91.0 1.02 1.7 0.4 1.59 169.0 359.6 39.2 1078.8
33DN-15I 34.0 5.32 0.2 0.0 1.40 81.4 274.8 46.7 549.6
33DN~15I 52.0 1.87 0.6 0.1 1.65 124.4 352.0 40.5 704.0
33DNX15I 70.0 1.00 1.9 0.2 1.84 167.5 417.7 37.4 835.4
33DN-10I 70.1 1.33 1.3 0.2 1.75 127.0 307.8 40.7 923.4
33DNX10I 80.0 1.01 2.1 0.3 1.79 144.9 332.7 39.6 998.1
33DNX7I- 80.1 1.23 1.6 0.3 1.71 121.8 265.3 42.7 1061.2
33DNX7I 88.0 1.02 2.1 0.4 1.73 133.9 281.0 42.0 1124.0
38DU15I- 34.0 10.32 0.1 0.0 1.07 78.6 276.2 46.0 552.4
38DU15I~ 65.0 2.21 0.8 0.1 1.49 150.3 400.8 37.4 801.6
38DU15I 96.0 1.01 2.4 0.4 1.70 222.0 505.0 34.3 1010.0
38DU10I- 96.1 1.34 1.4 0.3 1.53 166.3 364.4 37.1 1093.2
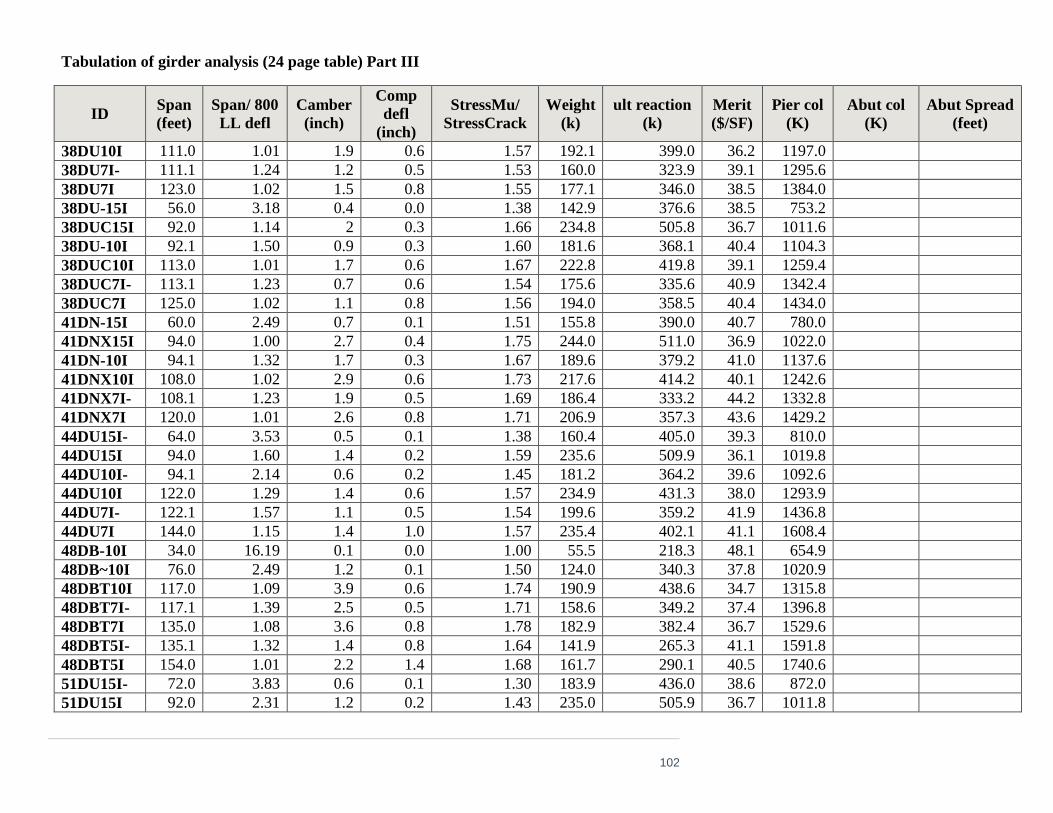
102
Tabulation of girder analysis (24 page table) Part III
ID Span
(feet)
Span/ 800
LL defl
Camber
(inch)
Comp
defl
(inch)
StressMu/
StressCrack
Weight
(k)
ult reaction
(k)
Merit
($/SF)
Pier col
(K)
Abut col
(K)
Abut Spread
(feet)
38DU10I 111.0 1.01 1.9 0.6 1.57 192.1 399.0 36.2 1197.0
38DU7I- 111.1 1.24 1.2 0.5 1.53 160.0 323.9 39.1 1295.6
38DU7I 123.0 1.02 1.5 0.8 1.55 177.1 346.0 38.5 1384.0
38DU-15I 56.0 3.18 0.4 0.0 1.38 142.9 376.6 38.5 753.2
38DUC15I 92.0 1.14 2 0.3 1.66 234.8 505.8 36.7 1011.6
38DU-10I 92.1 1.50 0.9 0.3 1.60 181.6 368.1 40.4 1104.3
38DUC10I 113.0 1.01 1.7 0.6 1.67 222.8 419.8 39.1 1259.4
38DUC7I- 113.1 1.23 0.7 0.6 1.54 175.6 335.6 40.9 1342.4
38DUC7I 125.0 1.02 1.1 0.8 1.56 194.0 358.5 40.4 1434.0
41DN-15I 60.0 2.49 0.7 0.1 1.51 155.8 390.0 40.7 780.0
41DNX15I 94.0 1.00 2.7 0.4 1.75 244.0 511.0 36.9 1022.0
41DN-10I 94.1 1.32 1.7 0.3 1.67 189.6 379.2 41.0 1137.6
41DNX10I 108.0 1.02 2.9 0.6 1.73 217.6 414.2 40.1 1242.6
41DNX7I- 108.1 1.23 1.9 0.5 1.69 186.4 333.2 44.2 1332.8
41DNX7I 120.0 1.01 2.6 0.8 1.71 206.9 357.3 43.6 1429.2
44DU15I- 64.0 3.53 0.5 0.1 1.38 160.4 405.0 39.3 810.0
44DU15I 94.0 1.60 1.4 0.2 1.59 235.6 509.9 36.1 1019.8
44DU10I- 94.1 2.14 0.6 0.2 1.45 181.2 364.2 39.6 1092.6
44DU10I 122.0 1.29 1.4 0.6 1.57 234.9 431.3 38.0 1293.9
44DU7I- 122.1 1.57 1.1 0.5 1.54 199.6 359.2 41.9 1436.8
44DU7I 144.0 1.15 1.4 1.0 1.57 235.4 402.1 41.1 1608.4
48DB-10I 34.0 16.19 0.1 0.0 1.00 55.5 218.3 48.1 654.9
48DB~10I 76.0 2.49 1.2 0.1 1.50 124.0 340.3 37.8 1020.9
48DBT10I 117.0 1.09 3.9 0.6 1.74 190.9 438.6 34.7 1315.8
48DBT7I- 117.1 1.39 2.5 0.5 1.71 158.6 349.2 37.4 1396.8
48DBT7I 135.0 1.08 3.6 0.8 1.78 182.9 382.4 36.7 1529.6
48DBT5I- 135.1 1.32 1.4 0.8 1.64 141.9 265.3 41.1 1591.8
48DBT5I 154.0 1.01 2.2 1.4 1.68 161.7 290.1 40.5 1740.6
51DU15I- 72.0 3.83 0.6 0.1 1.30 183.9 436.0 38.6 872.0
51DU15I 92.0 2.31 1.2 0.2 1.43 235.0 505.9 36.7 1011.8

103
Tabulation of girder analysis (24 page table) Part III
ID Span
(feet)
Span/ 800
LL defl
Camber
(inch)
Comp
defl
(inch)
StressMu/
StressCrack
Weight
(k)
ult reaction
(k)
Merit
($/SF)
Pier col
(K)
Abut col
(K)
Abut Spread
(feet)
51DU10I- 92.1 3.11 0.8 0.1 1.37 181.7 368.3 40.5 1104.9
51DU10I 119.0 1.86 1.2 0.4 1.48 234.8 434.5 38.9 1303.5
51DU7I- 119.1 2.27 0.8 0.3 1.47 200.4 356.9 42.9 1427.6
51DU7I 140.0 1.66 1.1 0.6 1.53 235.6 398.5 42.1 1594.0
60DB-10I 76.0 4.44 0.6 0.1 1.38 130.2 344.2 38.8 1032.6
60DBT10I 137.0 1.41 3.4 0.6 1.73 234.8 491.8 34.9 1475.4
60DBT7I- 137.1 1.72 2.5 0.5 1.60 195.7 392.5 37.9 1570.0
60DBT7I 165.0 1.16 4 1.1 1.69 235.6 444.7 37.0 1778.8
60DBT5I- 165.1 1.48 0.9 1.0 1.62 187.7 313.6 42.5 1881.6
60DBT5I 181.0 1.18 1.2 1.4 1.64 205.8 335.2 42.1 2011.2
63DU15I- 80.0 5.21 0.5 0.1 1.25 214.7 470.9 38.9 941.8
63DU15I 87.0 4.38 0.7 0.1 1.31 233.5 495.8 38.2 991.6
63DU10I- 87.1 5.89 0.4 0.1 1.21 183.2 362.7 42.6 1088.1
63DU10I 112.0 3.54 0.8 0.2 1.37 235.5 426.5 40.9 1279.5
63DU7I- 112.1 4.32 0.7 0.2 1.37 203.2 351.9 45.6 1407.6
63DU7I 130.0 3.23 1.1 0.3 1.46 235.6 389.2 44.7 1556.8
69DB-10I 84.0 5.19 0.7 0.1 1.37 149.9 368.2 38.9 1104.6
69DBT10I 132.0 2.13 2.3 0.4 1.61 235.5 485.9 36.0 1457.7
69DBT7I- 132.1 2.61 1.9 0.3 1.52 197.3 388.5 39.2 1554.0
69DBT7I 158.0 1.77 2.6 0.7 1.60 235.9 438.1 38.4 1752.4
69DBT5I- 158.1 2.31 0.5 0.6 1.54 190.2 310.6 44.4 1863.6
69DBT5I 196.0 1.37 1.1 1.4 1.62 235.8 363.5 43.6 2181.0
75DU15I- 64.0 13.01 0.1 0.0 1.09 180.1 417.3 42.0 834.6
75DU15I 83.0 7.47 0.3 0.0 1.29 233.5 488.3 39.7 976.6
75DU10I- 83.1 10.03 0.2 0.0 1.09 185.5 359.0 44.6 1077.0
75DU10I 105.0 6.19 0.4 0.1 1.24 234.4 417.3 43.0 1251.9
75DU7I- 105.1 7.56 0.5 0.1 1.27 204.0 345.6 48.2 1382.4
75DU7I 121.0 5.71 0.8 0.1 1.37 234.9 380.3 47.4 1521.2
10DS15E- 16.1 2.03 0.1 0.0 1.54 30.2 200.9 65.4 401.8 200.9 1.9
10DS15E 22.0 1.06 0.3 0.0 1.76 41.3 247.2 55.8 494.4 247.2 2.3
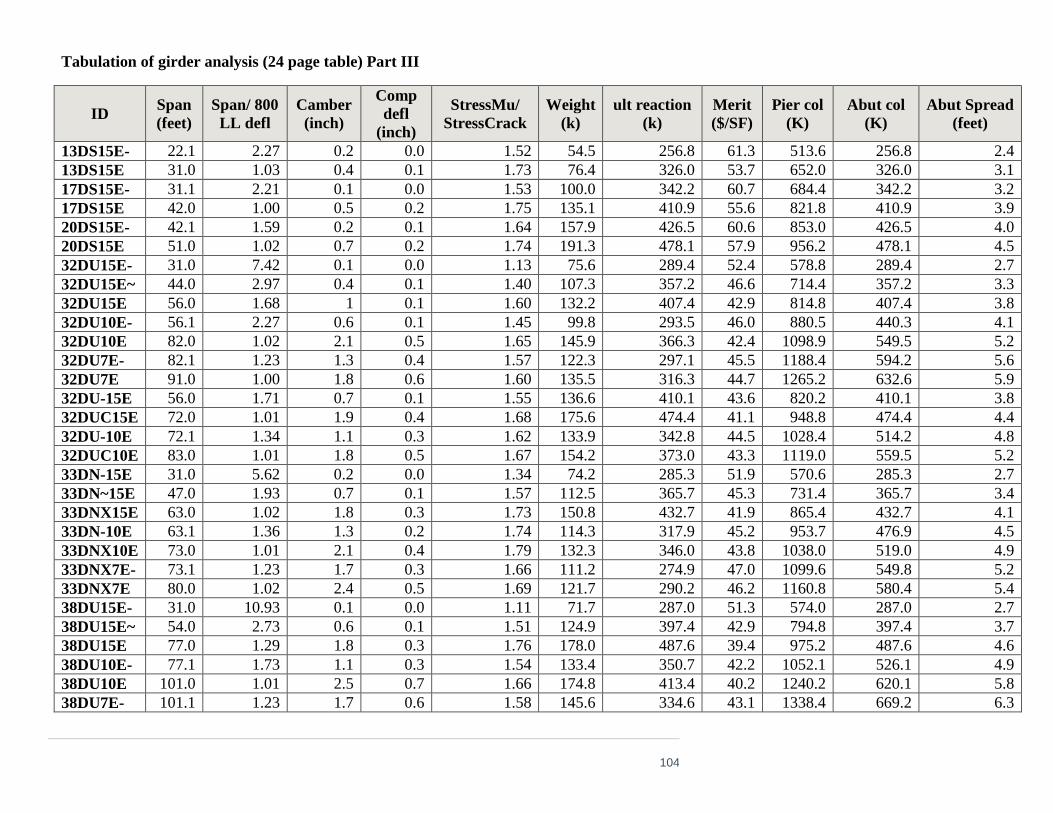
104
Tabulation of girder analysis (24 page table) Part III
ID Span
(feet)
Span/ 800
LL defl
Camber
(inch)
Comp
defl
(inch)
StressMu/
StressCrack
Weight
(k)
ult reaction
(k)
Merit
($/SF)
Pier col
(K)
Abut col
(K)
Abut Spread
(feet)
13DS15E- 22.1 2.27 0.2 0.0 1.52 54.5 256.8 61.3 513.6 256.8 2.4
13DS15E 31.0 1.03 0.4 0.1 1.73 76.4 326.0 53.7 652.0 326.0 3.1
17DS15E- 31.1 2.21 0.1 0.0 1.53 100.0 342.2 60.7 684.4 342.2 3.2
17DS15E 42.0 1.00 0.5 0.2 1.75 135.1 410.9 55.6 821.8 410.9 3.9
20DS15E- 42.1 1.59 0.2 0.1 1.64 157.9 426.5 60.6 853.0 426.5 4.0
20DS15E 51.0 1.02 0.7 0.2 1.74 191.3 478.1 57.9 956.2 478.1 4.5
32DU15E- 31.0 7.42 0.1 0.0 1.13 75.6 289.4 52.4 578.8 289.4 2.7
32DU15E~ 44.0 2.97 0.4 0.1 1.40 107.3 357.2 46.6 714.4 357.2 3.3
32DU15E 56.0 1.68 1 0.1 1.60 132.2 407.4 42.9 814.8 407.4 3.8
32DU10E- 56.1 2.27 0.6 0.1 1.45 99.8 293.5 46.0 880.5 440.3 4.1
32DU10E 82.0 1.02 2.1 0.5 1.65 145.9 366.3 42.4 1098.9 549.5 5.2
32DU7E- 82.1 1.23 1.3 0.4 1.57 122.3 297.1 45.5 1188.4 594.2 5.6
32DU7E 91.0 1.00 1.8 0.6 1.60 135.5 316.3 44.7 1265.2 632.6 5.9
32DU-15E 56.0 1.71 0.7 0.1 1.55 136.6 410.1 43.6 820.2 410.1 3.8
32DUC15E 72.0 1.01 1.9 0.4 1.68 175.6 474.4 41.1 948.8 474.4 4.4
32DU-10E 72.1 1.34 1.1 0.3 1.62 133.9 342.8 44.5 1028.4 514.2 4.8
32DUC10E 83.0 1.01 1.8 0.5 1.67 154.2 373.0 43.3 1119.0 559.5 5.2
33DN-15E 31.0 5.62 0.2 0.0 1.34 74.2 285.3 51.9 570.6 285.3 2.7
33DN~15E 47.0 1.93 0.7 0.1 1.57 112.5 365.7 45.3 731.4 365.7 3.4
33DNX15E 63.0 1.02 1.8 0.3 1.73 150.8 432.7 41.9 865.4 432.7 4.1
33DN-10E 63.1 1.36 1.3 0.2 1.74 114.3 317.9 45.2 953.7 476.9 4.5
33DNX10E 73.0 1.01 2.1 0.4 1.79 132.3 346.0 43.8 1038.0 519.0 4.9
33DNX7E- 73.1 1.23 1.7 0.3 1.66 111.2 274.9 47.0 1099.6 549.8 5.2
33DNX7E 80.0 1.02 2.4 0.5 1.69 121.7 290.2 46.2 1160.8 580.4 5.4
38DU15E- 31.0 10.93 0.1 0.0 1.11 71.7 287.0 51.3 574.0 287.0 2.7
38DU15E~ 54.0 2.73 0.6 0.1 1.51 124.9 397.4 42.9 794.8 397.4 3.7
38DU15E 77.0 1.29 1.8 0.3 1.76 178.0 487.6 39.4 975.2 487.6 4.6
38DU10E- 77.1 1.73 1.1 0.3 1.54 133.4 350.7 42.2 1052.1 526.1 4.9
38DU10E 101.0 1.01 2.5 0.7 1.66 174.8 413.4 40.2 1240.2 620.1 5.8
38DU7E- 101.1 1.23 1.7 0.6 1.58 145.6 334.6 43.1 1338.4 669.2 6.3

105
Tabulation of girder analysis (24 page table) Part III
ID Span
(feet)
Span/ 800
LL defl
Camber
(inch)
Comp
defl
(inch)
StressMu/
StressCrack
Weight
(k)
ult reaction
(k)
Merit
($/SF)
Pier col
(K)
Abut col
(K)
Abut Spread
(feet)
38DU7E 111.0 1.02 2 0.9 1.60 159.8 355.0 42.5 1420.0 710.0 6.7
38DU-15E 64.0 1.97 0.9 0.1 1.51 163.4 447.4 43.2 894.8 447.4 4.2
38DUC15E 89.0 1.01 2.6 0.5 1.70 227.2 545.3 40.4 1090.6 545.3 5.1
38DU-10E 89.1 1.32 1.4 0.4 1.58 175.6 395.0 44.1 1185.0 592.5 5.6
38DUC10E 102.0 1.01 2.3 0.7 1.63 201.1 430.2 43.1 1290.6 645.3 6.0
38DUC7E- 102.1 1.24 1.6 0.7 1.54 158.5 343.8 45.0 1375.2 687.6 6.4
38DUC7E 114.0 1.00 2 1.0 1.56 176.9 369.1 44.3 1476.4 738.2 6.9
41DN-15E 68.0 1.57 1.3 0.2 1.62 176.5 461.4 42.9 922.8 461.4 4.3
41DNX15E 85.0 1.00 2.6 0.5 1.75 220.6 528.0 41.0 1056.0 528.0 5.0
41DN-10E 85.1 1.33 1.9 0.4 1.67 171.4 390.0 45.2 1170.0 585.0 5.5
41DNX10E 98.0 1.01 3 0.7 1.73 197.4 426.1 44.2 1278.3 639.2 6.0
41DNX7E- 98.1 1.22 2.2 0.6 1.68 169.1 341.1 48.3 1364.4 682.2 6.4
41DNX7E 109.0 1.00 3.1 0.9 1.71 187.9 365.4 47.6 1461.6 730.8 6.9
44DU15E- 68.0 2.56 0.9 0.1 1.43 170.5 461.7 42.2 923.4 461.7 4.3
44DU15E 94.0 1.32 2.2 0.4 1.60 235.6 561.5 39.6 1123.0 561.5 5.3
44DU10E- 94.1 1.76 1.1 0.4 1.50 181.2 399.2 43.0 1197.6 598.8 5.6
44DU10E 122.0 1.07 2.3 1.0 1.60 234.9 472.8 41.4 1418.4 709.2 6.6
44DU7E- 122.1 1.29 1.4 0.9 1.54 199.6 392.5 45.4 1570.0 785.0 7.4
44DU7E 139.0 1.01 1.9 1.5 1.56 227.3 428.6 44.7 1714.4 857.2 8.0
48DB-10E 31.0 17.16 0.1 0.0 1.01 50.6 226.7 53.4 680.1 340.1 3.2
48DB~10E 67.0 2.68 1.1 0.1 1.47 109.3 348.9 42.4 1046.7 523.4 4.9
48DBT10E 103.0 1.15 3.4 0.6 1.72 168.0 446.6 38.9 1339.8 669.9 6.3
48DBT7E- 103.1 1.45 2.4 0.5 1.63 139.7 354.5 41.7 1418.0 709.0 6.6
48DBT7E 119.0 1.12 3.6 0.9 1.70 161.2 387.4 40.8 1549.6 774.8 7.3
48DBT5E- 119.1 1.46 1.7 0.8 1.56 126.7 268.0 45.6 1608.0 804.0 7.5
48DBT5E 146.0 1.01 3.4 1.6 1.63 155.4 307.1 44.6 1842.6 921.3 8.6
51DU15E- 84.0 2.29 1.4 0.2 1.44 214.6 526.3 40.8 1052.6 526.3 4.9
51DU15E 92.0 1.90 1.7 0.3 1.48 235.0 556.8 40.1 1113.6 556.8 5.2
51DU10E- 92.1 2.56 1.2 0.2 1.42 181.7 403.4 43.9 1210.2 605.1 5.7
51DU10E 119.0 1.54 2.2 0.6 1.54 234.8 476.0 42.2 1428.0 714.0 6.7
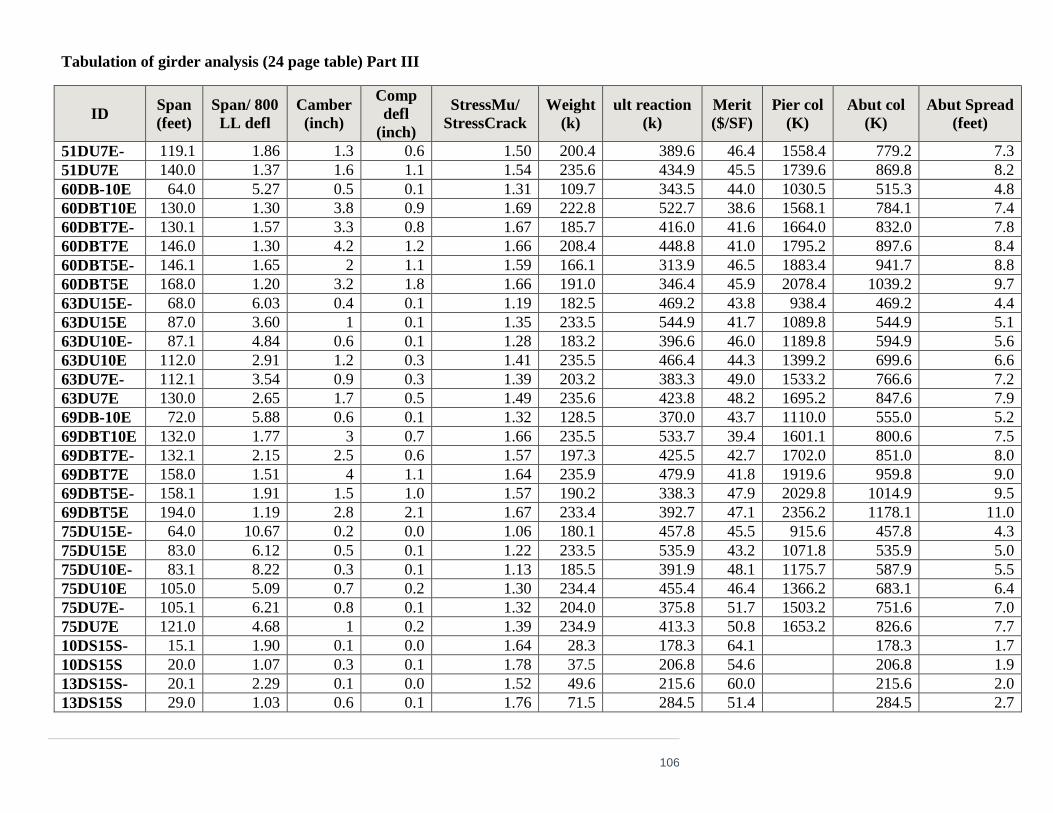
106
Tabulation of girder analysis (24 page table) Part III
ID Span
(feet)
Span/ 800
LL defl
Camber
(inch)
Comp
defl
(inch)
StressMu/
StressCrack
Weight
(k)
ult reaction
(k)
Merit
($/SF)
Pier col
(K)
Abut col
(K)
Abut Spread
(feet)
51DU7E- 119.1 1.86 1.3 0.6 1.50 200.4 389.6 46.4 1558.4 779.2 7.3
51DU7E 140.0 1.37 1.6 1.1 1.54 235.6 434.9 45.5 1739.6 869.8 8.2
60DB-10E 64.0 5.27 0.5 0.1 1.31 109.7 343.5 44.0 1030.5 515.3 4.8
60DBT10E 130.0 1.30 3.8 0.9 1.69 222.8 522.7 38.6 1568.1 784.1 7.4
60DBT7E- 130.1 1.57 3.3 0.8 1.67 185.7 416.0 41.6 1664.0 832.0 7.8
60DBT7E 146.0 1.30 4.2 1.2 1.66 208.4 448.8 41.0 1795.2 897.6 8.4
60DBT5E- 146.1 1.65 2 1.1 1.59 166.1 313.9 46.5 1883.4 941.7 8.8
60DBT5E 168.0 1.20 3.2 1.8 1.66 191.0 346.4 45.9 2078.4 1039.2 9.7
63DU15E- 68.0 6.03 0.4 0.1 1.19 182.5 469.2 43.8 938.4 469.2 4.4
63DU15E 87.0 3.60 1 0.1 1.35 233.5 544.9 41.7 1089.8 544.9 5.1
63DU10E- 87.1 4.84 0.6 0.1 1.28 183.2 396.6 46.0 1189.8 594.9 5.6
63DU10E 112.0 2.91 1.2 0.3 1.41 235.5 466.4 44.3 1399.2 699.6 6.6
63DU7E- 112.1 3.54 0.9 0.3 1.39 203.2 383.3 49.0 1533.2 766.6 7.2
63DU7E 130.0 2.65 1.7 0.5 1.49 235.6 423.8 48.2 1695.2 847.6 7.9
69DB-10E 72.0 5.88 0.6 0.1 1.32 128.5 370.0 43.7 1110.0 555.0 5.2
69DBT10E 132.0 1.77 3 0.7 1.66 235.5 533.7 39.4 1601.1 800.6 7.5
69DBT7E- 132.1 2.15 2.5 0.6 1.57 197.3 425.5 42.7 1702.0 851.0 8.0
69DBT7E 158.0 1.51 4 1.1 1.64 235.9 479.9 41.8 1919.6 959.8 9.0
69DBT5E- 158.1 1.91 1.5 1.0 1.57 190.2 338.3 47.9 2029.8 1014.9 9.5
69DBT5E 194.0 1.19 2.8 2.1 1.67 233.4 392.7 47.1 2356.2 1178.1 11.0
75DU15E- 64.0 10.67 0.2 0.0 1.06 180.1 457.8 45.5 915.6 457.8 4.3
75DU15E 83.0 6.12 0.5 0.1 1.22 233.5 535.9 43.2 1071.8 535.9 5.0
75DU10E- 83.1 8.22 0.3 0.1 1.13 185.5 391.9 48.1 1175.7 587.9 5.5
75DU10E 105.0 5.09 0.7 0.2 1.30 234.4 455.4 46.4 1366.2 683.1 6.4
75DU7E- 105.1 6.21 0.8 0.1 1.32 204.0 375.8 51.7 1503.2 751.6 7.0
75DU7E 121.0 4.68 1 0.2 1.39 234.9 413.3 50.8 1653.2 826.6 7.7
10DS15S- 15.1 1.90 0.1 0.0 1.64 28.3 178.3 64.1 178.3 1.7
10DS15S 20.0 1.07 0.3 0.1 1.78 37.5 206.8 54.6 206.8 1.9
13DS15S- 20.1 2.29 0.1 0.0 1.52 49.6 215.6 60.0 215.6 2.0
13DS15S 29.0 1.03 0.6 0.1 1.76 71.5 284.5 51.4 284.5 2.7

107
Tabulation of girder analysis (24 page table) Part III
ID Span
(feet)
Span/ 800
LL defl
Camber
(inch)
Comp
defl
(inch)
StressMu/
StressCrack
Weight
(k)
ult reaction
(k)
Merit
($/SF)
Pier col
(K)
Abut col
(K)
Abut Spread
(feet)
17DS15S- 29.1 2.20 0.2 0.1 1.56 93.6 299.7 58.4 299.7 2.8
17DS15S 39.0 0.99 0.7 0.2 1.77 125.4 359.8 53.1 359.8 3.4
20DS15S- 39.1 1.58 0.4 0.1 1.65 146.6 374.3 58.1 374.3 3.5
20DS15S 47.0 1.01 0.9 0.3 1.75 176.3 418.1 55.4 418.1 3.9
32DU15S- 29.0 7.23 0.1 0.0 1.19 68.5 250.7 49.4 250.7 2.4
32DU15S~ 47.0 2.06 0.7 0.1 1.59 111.0 334.9 41.5 334.9 3.1
32DU15S 65.0 1.02 2.2 0.5 1.78 153.5 402.7 37.8 402.7 3.8
32DU10S- 65.1 1.36 1.4 0.4 1.64 115.9 291.1 40.9 436.7 4.1
32DU10S 75.0 1.02 2.4 0.7 1.70 133.5 316.2 39.6 474.3 4.4
32DU7S- 75.1 1.24 2 0.6 1.59 111.8 257.2 42.8 514.4 4.8
32DU7S 83.0 1.01 2.6 0.8 1.61 123.6 273.0 41.9 546.0 5.1
32DU-15S 52.0 1.65 0.9 0.2 1.60 126.8 357.2 40.9 357.2 3.3
32DUC15S 66.0 0.99 2 0.5 1.69 161.0 409.5 38.4 409.5 3.8
32DU-10S 66.1 1.34 1.4 0.4 1.65 122.8 296.9 41.8 445.4 4.2
32DUC10S 76.0 1.00 2.3 0.7 1.70 141.2 322.3 40.6 483.5 4.5
33DN-15S 29.0 5.60 0.2 0.0 1.48 69.4 248.4 49.6 248.4 2.3
33DN~15S 44.0 1.85 0.7 0.1 1.70 105.3 320.0 42.6 320.0 3.0
33DNX15S 58.0 1.01 1.8 0.4 1.83 138.8 374.7 39.3 374.7 3.5
33DN-10S 58.1 1.35 1.5 0.3 1.71 105.3 276.2 42.6 414.3 3.9
33DNX10S 66.0 1.03 2.2 0.5 1.75 119.6 297.2 41.3 445.8 4.2
33DNX7S- 66.1 1.25 1.8 0.4 1.70 100.5 236.7 44.4 473.4 4.4
33DNX7S 73.0 1.02 2.5 0.6 1.72 111.0 250.9 43.5 501.8 4.7
38DU15S- 29.0 10.87 0.1 0.0 1.16 67.1 249.9 49.0 249.9 2.3
38DU15S~ 54.0 2.24 0.7 0.2 1.60 124.9 360.7 39.4 360.7 3.4
38DU15S 79.0 1.02 2.7 0.7 1.85 182.7 448.9 35.7 448.9 4.2
38DU10S- 79.1 1.36 2 0.5 1.59 136.9 323.9 38.5 485.9 4.6
38DU10S 92.0 1.01 3.1 1.0 1.63 159.2 354.7 37.4 532.1 5.0
38DU7S- 92.1 1.23 2.3 0.8 1.61 132.6 288.0 40.3 576.0 5.4
38DU7S 101.0 1.02 2.8 1.2 1.62 145.4 305.0 39.6 610.0 5.7
38DU-15S 60.0 1.87 1.2 0.2 1.54 153.1 391.9 40.3 391.9 3.7

108
Tabulation of girder analysis (24 page table) Part III
ID Span
(feet)
Span/ 800
LL defl
Camber
(inch)
Comp
defl
(inch)
StressMu/
StressCrack
Weight
(k)
ult reaction
(k)
Merit
($/SF)
Pier col
(K)
Abut col
(K)
Abut Spread
(feet)
38DUC15S 81.0 1.01 2.8 0.7 1.68 206.8 467.8 37.6 467.8 4.4
38DU-10S 81.1 1.32 1.9 0.6 1.60 159.9 340.3 41.4 510.5 4.8
38DUC10S 93.0 1.01 3.2 1.0 1.66 183.3 370.4 40.4 555.6 5.2
38DUC7S- 93.1 1.24 2.1 0.8 1.58 144.5 296.5 42.2 593.0 5.6
38DUC7S 103.0 1.02 2.7 1.3 1.60 159.9 316.0 41.5 632.0 5.9
41DN-15S 62.0 1.56 1.4 0.3 1.65 160.9 397.5 40.3 397.5 3.7
41DNX15S 75.0 1.05 2.5 0.6 1.74 194.7 444.9 38.6 444.9 4.2
41DN-10S 75.1 1.42 1.9 0.5 1.66 151.3 330.0 42.8 495.0 4.6
41DNX10S 89.0 1.02 3.4 0.9 1.73 179.3 366.2 41.4 549.3 5.1
41DNX7S- 89.1 1.22 2.6 0.8 1.68 153.6 294.0 45.5 588.0 5.5
41DNX7S 99.0 1.00 3.7 1.2 1.71 170.7 314.5 44.7 629.0 5.9
44DU15S- 64.0 2.40 1 0.2 1.46 160.4 405.0 39.3 405.0 3.8
44DU15S 94.0 1.10 3 0.9 1.65 235.6 509.9 36.1 509.9 4.8
44DU10S- 94.1 1.46 2 0.7 1.55 181.2 364.2 39.6 546.3 5.1
44DU10S 115.0 1.00 3.7 1.5 1.62 221.4 414.7 38.4 622.1 5.8
44DU7S- 115.1 1.20 2.8 1.3 1.56 188.2 345.4 42.3 690.8 6.5
44DU7S 126.0 1.01 3.5 1.9 1.58 206.0 366.9 41.8 733.8 6.9
48DB-10S 29.0 17.05 0.1 0.0 0.99 47.3 198.0 51.1 297.0 2.8
48DB~10S 57.0 3.14 0.9 0.1 1.51 93.0 290.6 40.6 435.9 4.1
48DBT10S 85.0 1.37 2.6 0.6 1.70 138.7 362.6 36.8 543.9 5.1
48DBT7S- 85.1 1.77 2 0.5 1.57 115.3 288.3 39.6 576.6 5.4
48DBT7S 100.0 1.29 3.3 0.8 1.65 135.5 317.0 38.4 634.0 5.9
48DBT5S- 100.1 1.72 1.6 0.7 1.60 106.5 219.3 43.2 657.9 6.2
48DBT5S 124.0 1.15 4.1 1.6 1.69 131.9 251.7 41.9 755.1 7.1
51DU15S- 66.0 3.14 0.9 0.2 1.38 168.6 414.3 39.4 414.3 3.9
51DU15S 92.0 1.59 2.4 0.6 1.55 235.0 505.9 36.7 505.9 4.7
51DU10S- 92.1 2.12 1.6 0.5 1.47 181.7 368.3 40.5 552.5 5.2
51DU10S 119.0 1.29 3.4 1.2 1.59 234.8 434.5 38.9 651.8 6.1
51DU7S- 119.1 1.55 2.4 1.1 1.53 200.4 356.9 42.9 713.8 6.7
51DU7S 140.0 1.14 3.8 2.0 1.57 235.6 398.5 42.1 797.0 7.5

109
Tabulation of girder analysis (24 page table) Part III
ID Span
(feet)
Span/ 800
LL defl
Camber
(inch)
Comp
defl
(inch)
StressMu/
StressCrack
Weight
(k)
ult reaction
(k)
Merit
($/SF)
Pier col
(K)
Abut col
(K)
Abut Spread
(feet)
60DB-10S 68.0 3.83 0.9 0.1 1.43 116.5 323.4 39.9 485.1 4.5
60DBT10S 106.0 1.57 3.1 0.8 1.67 181.6 418.3 36.4 627.5 5.9
60DBT7S- 106.1 1.94 2.7 0.7 1.59 151.5 333.4 39.3 666.8 6.3
60DBT7S 124.0 1.45 4.2 1.2 1.68 177.0 367.7 38.4 735.4 6.9
60DBT5S- 124.1 1.88 2.4 1.0 1.60 141.2 257.5 43.8 772.5 7.2
60DBT5S 148.0 1.35 4.2 2.0 1.68 168.4 290.4 42.9 871.2 8.2
63DU15S- 70.0 4.68 0.6 0.1 1.28 187.9 434.5 40.0 434.5 4.1
63DU15S 87.0 2.99 1.3 0.3 1.41 233.5 495.8 38.2 495.8 4.6
63DU10S- 87.1 3.99 0.9 0.2 1.33 183.2 362.7 42.6 544.1 5.1
63DU10S 112.0 2.41 2 0.6 1.47 235.5 426.5 40.9 639.8 6.0
63DU7S- 112.1 2.19 1.4 0.5 1.43 203.2 351.9 45.6 703.8 6.6
63DU7S 130.0 1.64 1.9 0.9 1.49 235.6 389.2 44.7 778.4 7.3
69DB-10S 72.0 4.86 0.8 0.1 1.37 128.5 337.1 40.3 505.7 4.7
69DBT10S 123.0 1.69 3.8 0.9 1.67 219.5 464.3 36.4 696.5 6.5
69DBT7S- 123.1 2.06 3.1 0.8 1.61 183.8 371.1 39.6 742.2 7.0
69DBT7S 142.0 1.59 4.5 1.4 1.68 212.0 407.5 38.9 815.0 7.6
69DBT5S- 142.1 2.05 2.5 1.2 1.58 171.0 288.1 44.9 864.3 8.1
69DBT5S 170.0 1.34 4.2 2.4 1.65 204.5 327.3 44.1 981.9 9.2
75DU15S- 74.0 6.43 0.5 0.1 1.22 208.2 455.2 40.6 455.2 4.3
75DU15S 83.0 5.07 0.8 0.1 1.30 233.5 488.3 39.7 488.3 4.6
75DU10S- 83.1 6.78 0.5 0.1 1.21 185.5 359.0 44.6 538.5 5.0
75DU10S 105.0 4.20 1 0.3 1.34 234.4 417.3 43.0 626.0 5.9
75DU7S- 105.1 5.11 0.9 0.3 1.34 204.0 345.6 48.2 691.2 6.5
75DU7S 121.0 3.86 1.4 0.5 1.42 234.9 380.3 47.4 760.6 7.1