feasibility study of renewable energy in singapore444754/fulltext01.pdf · feasibility study of...
TRANSCRIPT

Bachelor of Science Thesis
KTH School of Industrial Engineering and Management
Energy Technology EGI-2011-043BSC
SE-100 44 STOCKHOLM
Feasibility Study of Renewable
Energy in Singapore
Sebastian King
Per Wettergren

-2-
Bachelor of Science Thesis
EGI-2011-043BSC
Feasibility Study of Renewable
Energy in Singapore
Sebastian King
Per Wettergren
Approved
Date
Examiner
Name
Supervisor
Name
Commissioner
Contact person
Abstract
Singapore is a country that is currently highly dependent on import of oil and gas. In order to
be able to shift into a more sustainable energy system, Singapore is investing in research
regarding different technologies and systems so as to establish more sustainable energy
solutions. Seeing how air-conditioning accounts for approximately 30 % of Singapore‟s total
energy consumption, a feasibility study is being conducted on whether an integrated system
using a thermally active building system (TABS) and desiccant evaporative cooling system
(DECS) can replace the air-conditioning system. The question which is to be discussed in this
thesis is whether solar and wind power can be financially feasible in Singapore and if they can
be utilized in order to power the integrated system.
The approaching model consists of a financial feasibility study of the different technologies
and a theoretical test-bedding, where the suitability of the technologies to power the TABS
and DECS is tested. The financial feasibility is estimated by calculating the payback period
and using the net present value method. A model designed in a digital modeling software is
used for the test-bedding. Measurements from a local weather station are used for estimating
the solar radiance and wind speeds in Singapore. The results show that solar PV panels could
be feasible in Singapore but that technological improvements as well as governmental
subsidies are needed in order to make it profitable enough to attract investors. As for wind
power, the wind conditions are not favorable enough, in terms of wind speed and wind
frequencies, for small wind turbines that currently exist on the market to be able generate
enough electricity to make the investment somewhat feasible. Solar thermal collectors and
solar PV are given certain conditions suitable for powering the TABS and DECS.

-3-
Sammanfattning
Singapore är ett land som för närvarande är ytterst beroende av import av olja och gas. För att
styra utvecklingen mot ett mer hållbart energisystem investerar Singapore i forskning inom
olika tekniker och system för att kunna utnyttja mer hållbara energilösningar.
Luftkonditionering står för cirka 30 % av Singapores totala energianvändning. Därför
genomförs en fältstudie som ska undersöka ifall ett integrerat kylsystem innehållandes ett
luftavfuktningssystem samt ett termiskt kylsystem kan ersätta luftkonditioneringssystemet.
Frågan som diskuteras i denna rapport är huruvida sol- och vindkraft kan vara ekonomiskt
hållbart i Singapore och ifall de kan utnyttjas för att driva det integrerade systemet.
Den modell som används består av en ekonomisk förstudie av vind- och solkraft samt en
teoretisk undersökning på huruvida tekniken kan användas i praktiken för att driva
kylsystemet. Den ekonomiska förstudien inkluderar beräkningar av återbetalningstid samt
användning av nettonuvärdesmetoden. En modell är utformad i ett digitalt
modelleringsprogram för att testköra det integrerade kylsystemet med vind- och solkraft.
Mätningar från en lokal väderstation används för skattningar av solstrålning och
vindhastigheter i Singapore. Resultaten visar att solpaneler skulle kunna vara ekonomiskt
hållbara i Singapore men att tekniska förbättringar samt statliga subventioner behövs för att
göra det lönsamt nog att intressera investerare. Vad gäller vindkraft, är vindförhållandena inte
gynnsamma nog för att de små vindkraftverk som idag finns på marknaden ska kunna
generera tillräckligt med elektricitet för att göra investeringen någorlunda genomförbar.
Solfångare och solpaneler lämpar sig under särskilda förhållanden för att driva det integrerade
kylsystemet.

-4-
Table of Contents
Abstract .......................................................................................................................................................... 2
Sammanfattning ............................................................................................................................................ 3
1 Introduction .......................................................................................................................................... 8
1.1 Background ................................................................................................................................... 8
1.2 Purpose .......................................................................................................................................... 9
1.3 Goals .............................................................................................................................................. 9
2 Introduction - Literature Survey ...................................................................................................... 11
2.1 Singapore’s Energy System ....................................................................................................... 11
2.1.1 Singapore and its energy market – Background ............................................................ 11
2.1.2 National Electricity Market of Singapore ...................................................................... 14
2.1.3 Pricing in the wholesale market in Singapore................................................................ 15
2.1.4 Retail Market ...................................................................................................................... 16
2.1.5 Strategic Actions ................................................................................................................ 20
2.1.6 Singapore’s Energy Industry Strategies .......................................................................... 22
2.1.7 Alternative energy initiatives ............................................................................................ 24
2.1.8 Energy efficiency ............................................................................................................... 28
2.2 Technology ................................................................................................................................. 29
2.2.1 Wind Power ........................................................................................................................ 29
2.2.2 Solar Power ........................................................................................................................ 35
2.2.3 Thermally active building system (TABS) and Desiccant water cooling system
(DECS) .............................................................................................................................................. 43
3 Method ................................................................................................................................................ 46
3.1 Approach and modeling ............................................... Fel! Bokmärket är inte definierat.
3.2 Limitations .................................................................................................................................. 46
3.3 Assumptions ............................................................................................................................... 47
3.4 Parameters and variables........................................................................................................... 48
3.4.1 Costs .................................................................................................................................... 48
3.4.2 Wind Turbines ................................................................................................................... 49
3.4.3 Solar panels ......................................................................................................................... 51
3.4.4 Site analysis ......................................................................................................................... 55
3.4.5 Output from TABS & DECS .......................................................................................... 56
3.4.6 Parameters from geography weather station: ................................................................ 58
4 Results .................................................................................................................................................. 59
-5-
4.1 Solar PV ...................................................................................................................................... 59
4.2 Wind power ................................................................................................................................ 61
4.3 The Building ............................................................................................................................... 62
5 Sensitivity analysis .............................................................................................................................. 64
5.1 Solar PV ...................................................................................................................................... 64
5.2 Wind turbines ............................................................................................................................. 72
5.3 The roof ...................................................................................................................................... 75
6 Conclusion .......................................................................................................................................... 77
6.1 Financial feasibility studies ....................................................................................................... 77
6.1.1 Solar PV .............................................................................................................................. 77
6.1.2 Wind power ........................................................................................................................ 78
6.2 Running TABS and DECS on renewable energy sources ................................................... 78
6.3 Recommendations for future study ........................................................................................ 79
6.4 References ................................................................................................................................... 81
7 Appendix ............................................................................................................................................. 86
7.1 Appendix A................................................................................................................................. 86

-6-
Abbreviations
AHU Air handling unit
ASEAN Association of Southeast Asian Nations
APEC Asia Pacific Economic Cooperation
BCA Building and Construction Authority
CPC Compound parabolic collector
DECS Desiccant Evaporate Cooling Systems
EAS East Asia Summit
EDB Economic Development Board
EID Energy Investment Deduction
EMA Energy Market Authority
EPG Energy Policy Group
EPGC Experimental Power Grid Center
ERI@N Energy Research Institute @ NTU
ESC Economic Strategies Committee
EUR Euro
FPC Flat plate collector
GTP Global trade Programme
HAWT Horizontal Axis Wind Turbine
HDB Housing Development Board
IEE Intelligent Energy European
ktoe kilo tons of oil equivalent
kWp Kilowatt peak
LNG Liquefied Natural Gas
LTA Land Transport Authority
MCE Market clearing engine
MEWR Ministry of Environment and Water resources
MFA Ministry of Foreign Affairs
MOF Ministry of Finance
MOT Ministry of Transport
MTI Ministry of Trade and Industry
NEMS National Electricity Market of Singapore
NEA National Environment Agency
-7-
NTU Nanyang Technological University
NUS National University of Singapore
PDR Parabolic Dish Reflector
PTC Parabolic trough Collector
PV Photovoltaic
R&D Research and Development
REC Renewable Energy Corporation
SEP Singapore Electricity Pool
SERIS Solar Energy Research Institute of Singapore
SGD Singapore Dollar
TABS Thermally Active Building Systems
UNFOCC United Nations Framework Convention on Climate Change
USD United States Dollar
USEP Uniform Singapore Energy Price
VAWT Vertical Axis Wind Turbine
Nomenclature
η = Thermal efficiency
a = Heat loss coefficient
G = Radiation
T = Temperature
X = Specific humidity
PV = Present value of income from investment
C = Dividend from investments
r = Discount rate
t = Time
g = Annual growth
ρ = Density of air
A = Swept area of turbine
V = Wind speed
-8-
1 Introduction
Here follows a thesis introduction, which contains a brief description of the background,
purpose and goals of the thesis. This will serve as a guideline for what the thesis should
address.
1.1 Background
Singapore is highly dependent on the import of oil and gas in order to meet the nation‟s
energy needs. For the past two decades, the increasing concern about global warming due to
emissions of green house gases from combustion of fossil fuels has been putting pressure on
many governments across the globe to alter energy politics and strategies. Seeing how
Singapore is becoming a highly developed nation, the change towards a less fossil fuel
dependent energy solution is starting to emerge. In order to adapt a more self-sufficient
energy mix with renewable energy resources and a more sustainable energy system,
Singapore is investing in research on different methods to generate sustainable energy
solutions.
One of the major fields of research is carried out on wind power, generated from wind
turbines that can be placed in both urban areas and offshore. Several large wind power
companies and research institutions are stationed in the country already. However,
Singapore‟s geographical attributes make the wind a very irregular and scarce power source
and therefore, the research that is carried out in the field is rather a product of export than
something that is utilized within the nation. Another irregular resource of energy that is
significantly better adapted to tropical weather conditions and therefore could become widely
used in Singapore is solar energy. Various types of solar panels are being developed and
enhanced at a fast rate. Despite this, as far as installations within the nation are concerned,
this figure is hardly better than for wind power, which can be explained by the lack of
economical incitements.
Due to the apparent difficulties which Singapore faces in adapting wind and solar power to its
energy system, Singapore has chosen to focus on energy efficiency as a key strategy. As a
result of this strategy the government has decided to fund a research project which aims at
increasing efficiency in the process of indoor cooling, which is a major field of energy
consumption in the warm climate of Singapore. This is carried out by initiating a study on the
feasibility of an integrated system using a thermally active system (TABS) and desiccant

-9-
evaporative cooling system (DECS) that could possibly replace the conventional air-
conditioning. The system can be driven by a combination of electricity and solar thermal
energy. Systems like this are already being used commercially in Europe. However, they have
never before been tested in a tropical climate such as Singapore‟s.
1.2 Purpose
Noting that there are very few studies which analyze the potential of solar and wind power in
Singapore, this thesis intends to present a better overview of the current solar and wind power
prospective. The question to be discussed in this thesis is how wind and solar resources can be
utilized in order to power the integrated system with wind and solar power and if it is
financially viable. Therefore, this thesis aims at providing a financial and practical feasibility
study on the use of wind and solar for the integrated TABS and DECS cooling system.
Furthermore, the thesis also aims at discussing what enhancements that can be made in order
to make wind and solar energy feasible energy sources for Singapore‟s energy system.
In conclusion, our thesis aims at answering the following questions: How can wind and solar
energy be utilized for TABS and DECS? Is it financially and practically feasible to use wind
and solar power for TABS and DECS?
1.3 Goals
In order to answer the questions that are essential for the purpose of the thesis, a few goals
need to be achieved in the process. These goals can be defined as follows:
Analyze the current situation of Singapore‟s energy system when it comes to
production, distribution and usage.
Look at current incentives for improving efficiency and increasing the utilization of
alternative energy solutions.
Carry out a feasibility study on the harnessing of renewable energy in Singapore by
presenting financial calculations on investments in solar and wind energy, in terms of
costs, accumulated future income, the payback period and the net present value of the
investment.

-10-
Provide an overview of the technology, function and energy usage of a thermally
activated building system and desiccant cooling system and comparing the efficiency
of these systems to the commercial air-conditioning that is utilized today.
Optimize the utilization of a roof top for dispensing power generating equipment, i.e.
wind turbines and solar panels.
Estimate the impact on energy production and feasibility when altering certain
variables, which will be presented and discussed in a sensitivity analysis.
Suggest improvements in Singapore‟s energy strategy in order to make renewable
energy sources the prevailing alternative for power generation.

-11-
2 Introduction - Literature Survey
It is important to obtain a thorough understanding of Singapore‟s energy system and the
technologies that are addressed in the report before developing a model for the feasibility
study. Therefore, this chapter provides a literature survey.
2.1 Singapore’s Energy System
Prime Minister Lee Hsien Loong gave a short yet expressive description of Singapore‟s
energy market on November 1, 2010 at the 2010 Singapore Energy Lecture during the
Singapore International Energy Week. The following is a quote from his speech (Prime
Minister Lee Hsien Loong, 2010):
”We foster competition in producing and supplying energy so as to operate efficiently and
respond nimbly to changing conditions. Singapore was the first country in Asia to liberalise
our electricity and gas markets. Because of the competitive pressures, many of our power
plants which are originally fuel oil- powered have now switched to more efficient gas-fired
turbines, bringing down costs and passing on benefits to the rest of the economy. It has
lowered our carbon intensity as well and our electricity prices. But unfortunately it has also
resulted in concentrated dependence on piped natural gas and this is a dependence which we
are now addressing as I shall speak about later.”
2.1.1 Singapore and its energy market – Background
After more than two centuries as a British colony, the Republic of Singapore became
completely independent after separating from Malaysia in 1965. Because of many foreign
investors and one of the world‟s busiest ports, the nation has had a massive economic and
social growth for the last decades. In 1970, the nation‟s GDP/capita was 925 USD and the
population added up to 2 million people. That figure had doubled to 4 million before the new
millennia came. In 2010, the population had reached well over 5 million and the GDP/capita
was 43 867 USD (Singstat, 2011). Despite its small size, Singapore has grown into a world
metropolis and a thriving centre of industry and commerce. Singapore lies right by the
equator, which makes its climate very warm and humid (SMU, 2011). This climate affects the
population‟s energy usage. In 2008, the nation‟s total primary energy supply mounted up to
3.83 toe/capita, the population consumed electricity equivalent to 8 186 kWh/capita and the
emission was 9.16 t CO2/capita. When looking at a western nation with more saturated growth

-12-
like Sweden, we find that the total primary supply in 2008 was 5.36 toe/capita, the electricity
consumption was 14 811 kWh/capita and the emission added up to 4.96 CO2/capita. Despite
the fact that the energy consumption still is higher in Sweden, the emission per capita in
Singapore is almost twice as much in comparison. When it comes to distribution of
occupations, more than 20 % of the nation‟s GDP is derived from manufacturing, 15 % comes
from wholesale and retail trading, 13 % comes from business services, while financial
services contributes with 11 %, transport with 9 % and 6 % comes from storage (Singstat,
2011).
Singapore first started liberalizing the energy market in October 1995. This was done by
corporatizing industry assets and putting them on a commercial footing. An energy market
was established when the Singapore Electricity Pool (SEP) started to operate in 1998. The
Singapore Electricity Pool is what many refer to as a “day-ahead market” which is “The
market for energy for the following day, or more specifically, the market for energy 24 hours
in advance of a given time in any day. A day in this context may be more or less than 24
hours. For example, a utility may purchase the next morning's energy in the afternoon (less
than 24 hours ahead) or purchase the next afternoon's energy the previous morning (more
than 24 hours ahead). Energy producers offer energy on this market based on their ability to
produce energy for a specific period on the following day” (Energy Vortex, 2011). A new
legal and regulatory framework was introduced on April 1, 2001. This framework formed the
basis for a new electricity market. The Energy Market Authority of Singapore Act 2001
created the EMA. Subsequently these structural reforms to the Singapore electricity market
culminated into the opening of the wholesale market National Market of Singapore (NEMS)
in January 2003. The EMA led the establishment of the NEMS and was granted with
regulatory power to overview the restructuring initiatives which were composed of the
following (NEMS, 2003):
Separation of the ownership of the contestable and non-contestable parts of the
industry.
Establishment of a power system operator and a market operator.
Establishment of a real-time wholesale market.
Liberalization of the retail market.
Unfortunately Singapore is a city-state with limited amount natural resources and is affected
by inherent geographical and physical constraints. Therefore, Singapore has a total primary

-13-
energy supply, which practically consists solely of oil and gas. There are a few implemented
and ongoing projects which involve renewable resources. However, these projects will be
further discussed later on, mainly in chapter 2.1.7 (EMA, 2010).
Singapore has started to develop and implement solar and wind power. However, this
development and implementation has only just begun and is being done on an extremely small
scale at the moment. The amount of wind and solar power, which is generated, can therefore
be considered negligible in practice. Further on in the report we will touch upon this topic. In
2008 the IEA registered production 0 GWh electricity from wind and solar power (IEA
Energy Statistics, 2008).
During the past decades, Singapore‟s energy market has changed significantly. In the early
1990‟s Singapore started restructuring its energy mix. Singapore started to import gas, making
efforts to lower its dependency on oil and to import less oil. According to IEA statistics,
Singapore has gone from a primary energy supply of oil equivalent to 22 000 ktoe in the mid
1990‟s to around 12 000 ktoe in 2008, thus cutting the dependence on oil by nearly 50 %.
Singapore has steadily increased its gas import since the early 1990‟s. Gas is now a
significant source of energy for Singapore, which had a primary energy supply of gas adding
up to nearly 7 000 ktoe in 2008. Furthermore, statistics from 2008 show that oil has a 62.3 %
share and gas has a 37.7 % share of the total primary energy supply, which in total
accumulates to 18 523 ktoe. With regards to Singapore‟s electricity production, once again oil
and gas combined contribute to 100 % of the 41 717 GWh generated in 2008. Oil contributed
with 8 218 GWh (19.7 %) and 33 499 GWh (80.3 %) were generated from gas (IEA Energy
Statistics, 2008).
The energy industry used 4 128 GWh on its own and losses in the energy system amounted to
2 107 GWh. Thus, the final consumption added up to 35 482 GWh. The consumption was
divided among the different sectors as follows (IEA Energy Statistics, 2008):
Commercial and Public Services: 15 238 GWh
Industry: 13 024 GWh
Residential: 6 749 GWh
Transport: 418 GWh
Agriculture / Forestry: 53 GWh
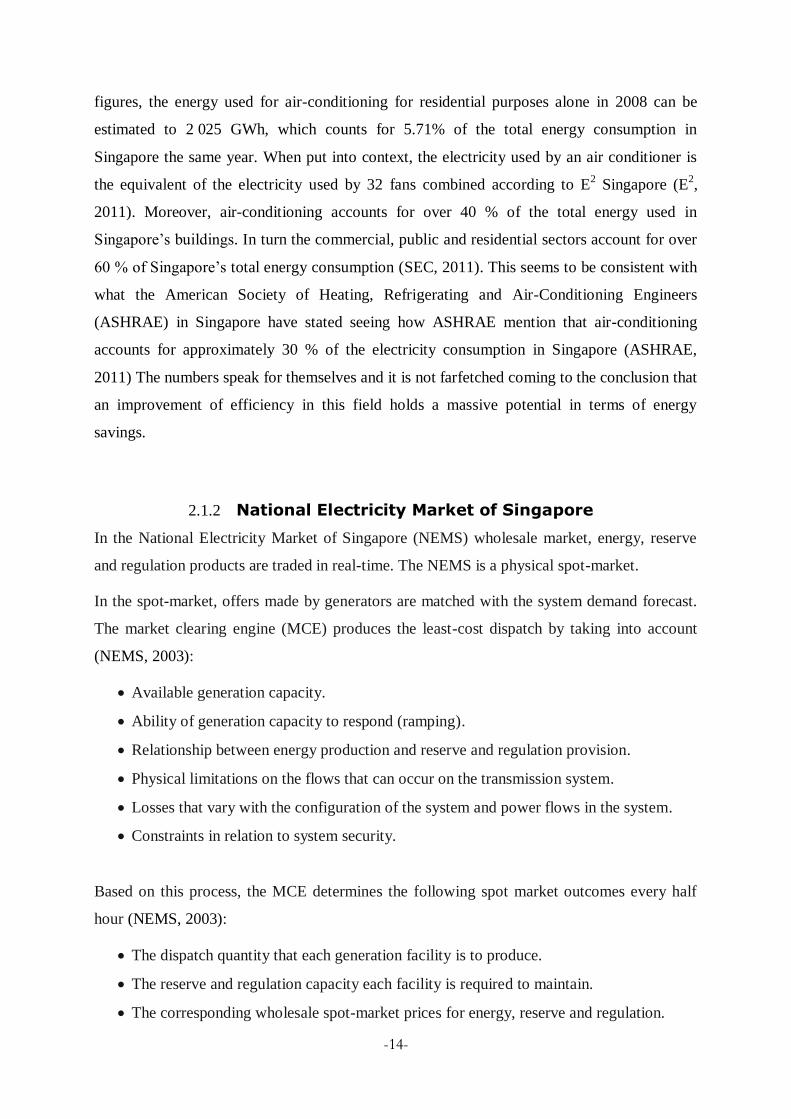
In a publication from E2 Singapore, it is stated that about 30 % of the residential energy
consumption is used for air-conditioning and 17 % is consumed by refrigerators. Given these
-14-
figures, the energy used for air-conditioning for residential purposes alone in 2008 can be
estimated to 2 025 GWh, which counts for 5.71% of the total energy consumption in
Singapore the same year. When put into context, the electricity used by an air conditioner is
the equivalent of the electricity used by 32 fans combined according to E2 Singapore (E
2,
2011). Moreover, air-conditioning accounts for over 40 % of the total energy used in
Singapore‟s buildings. In turn the commercial, public and residential sectors account for over
60 % of Singapore‟s total energy consumption (SEC, 2011). This seems to be consistent with
what the American Society of Heating, Refrigerating and Air-Conditioning Engineers
(ASHRAE) in Singapore have stated seeing how ASHRAE mention that air-conditioning
accounts for approximately 30 % of the electricity consumption in Singapore (ASHRAE,
2011) The numbers speak for themselves and it is not farfetched coming to the conclusion that
an improvement of efficiency in this field holds a massive potential in terms of energy
savings.
2.1.2 National Electricity Market of Singapore
In the National Electricity Market of Singapore (NEMS) wholesale market, energy, reserve
and regulation products are traded in real-time. The NEMS is a physical spot-market.
In the spot-market, offers made by generators are matched with the system demand forecast.
The market clearing engine (MCE) produces the least-cost dispatch by taking into account
(NEMS, 2003):
Available generation capacity.
Ability of generation capacity to respond (ramping).
Relationship between energy production and reserve and regulation provision.
Physical limitations on the flows that can occur on the transmission system.
Losses that vary with the configuration of the system and power flows in the system.
Constraints in relation to system security.
Based on this process, the MCE determines the following spot market outcomes every half
hour (NEMS, 2003):
The dispatch quantity that each generation facility is to produce.
The reserve and regulation capacity each facility is required to maintain.
The corresponding wholesale spot-market prices for energy, reserve and regulation.

-15-
The role of the NEMS is to introduce market mechanisms into the electricity industry. These
market mechanisms are intended to (NEMS, 2003);
Increase economic efficiency through competition.
Attract private investments.
Guide production and consumption decisions by sending accurate price signals.
Encourage innovation.
Provide consumer choice.
2.1.3 Pricing in the wholesale market in Singapore
The energy prices are referred to as nodal prices, which vary at different points on the
network. This price differential reflects the transmission losses and restrictions on the
transmission system. This reveals the true costs to the market of delivering electricity to each
point on the electricity network (NEMS, 2003).
This method of price determination encourages economically efficient scheduling of
generation facilities in the short term, and provides incentives to guide investment in new
power system infrastructure in the long term. Generating companies pay for reserve according
to how much risk they contribute to in the system. Regulation is paid for by loads in
proportion to their energy consumption and by dispatchable generators for up to 5 MW for
each trading period (NEMS, 2003).
As shown in Figure 1, there is now a substantial competition in the wholesale market,
consisting of five main operating companies (EMA, 2010). In Singapore, the total electric
power generated adds up to 9 581 MW. Power Seraya Ltd, Tuas Power Generation Pte Ltd
and Senoko Energy Pte Ltd are the three largest generation companies and account for 2 700
MW (28 %), 2 670 MW (28 %) and 2 635 MW (28 %) respectively and therefore account for
84 % altogether. They are followed by SembCorp Cogen Pte Ltd who generate 785 MW (8
%) and Keppel Merlimau Cogen Pte Ltd who generate 500 MW (5 %). The remaining 291
MW (3 %) of power is generated by other actors. Even if the three largest companies still
have a substantial share of the market the competition has increased and the total number of
other generator companies is now six (EMA, 2011).

-16-
Figure 1: Graph depicting market share of licensed power companies in operation (EMA, 2010)
2.1.4 Retail Market
2.1.4.1 Background
Competition is being introduced into the retail market in stages. Since July 2001, consumers
with a maximum power requirement of 2 MW and above have been considered contestable.
From June to September 2003, about 5 000 consumers with average monthly consumption of
20 000 kWh and above were made contestable. Contestability means that consumers can
purchase electricity from a retailer of their choice, directly from the wholesale market, or
indirectly from the wholesale market via the market support services licensee. Retailers pay
the Uniform Singapore Energy Price (USEP) for energy, which is the weighted-average of the
nodal prices at all off-take nodes (EMA, 2003). This pricing method is called nodal pricing,
which is being applied in order to achieve an economic use of electricity. This is made
possible since nodal pricing takes transmission losses and constraints into consideration. As
well, the locational value of electricity is reflected through the use of nodal prices. The nodal
prices vary according to where the network node is located and which generators a node
network has been assigned. On Singapore‟s transmission network there are 41 injection nodes
and 415 off-take nodes (Gooi, 2011).

-17-
In Singapore, the nodal pricing is handled by licensed electricity retailer companies. As of this
year, there are six licensed retailer companies in Singapore according to the EMA (EMA,
2011):
Keppel Electric Pte Ltd
Seraya Energy Pte Ltd
SembCorp Power Pte Ltd
Senoko Energy Supply Pte Ltd
Tuas Power Supply Pte Ltd
Island Power Supply Pte Ltd
2.1.4.2 Electricity Tariff
The Singapore electricity tariff can be divided into two separate components, resulting in
what is considered as the cost of electricity. The costs are divided into fuel costs and non-fuel
costs. The fuel cost or the cost of imported gas is tied to the price of fuel oil by commercial
contracts. The non-fuel cost is comprised of the cost of generating and delivering electricity to
homes. This cost has generally remained unchanged at around 10 ¢/kWh over the recent years
and the changes in tariff price that can be seen in Figure 2 are mainly due to changes in fuel
price. This figure also shows the tariff for the second quarter of 2011, as that is determined
during the first quarter of 2011. The fact that the tariff is correlated to fuel price is further
illustrated in Figure 3. For example, when the oil price hit all time high in 2008, the tariff for
the fourth quarter of 2008 was at its peak. We see that the financial crisis had a great impact
on oil price in 2008 and 2009 and therefore the tariffs were affected accordingly. Looking at
the overall increment of the electricity tariff, it is apparent that the curve doesn‟t have the
same gradient as the curve of the oil price. Perhaps this is due to governmental influence to
keep the tariff at a stable level. (SP Services, 2011)

-18-
Figure 2: Electricity tariff in Singapore. (SP Services, 2011)
Figure 3: Oil price and Singaporean electricity tariff. (SP Services, 2011)
21,02 21,15 18,88
22,77 25,20
30,45
22,93
18,03
21,69 24,13
25,58
-
5,00
10,00
15,00
20,00
25,00
30,00
35,00
ElectricityTariff
¢/kWh
Tariff prices Singapore

-19-
The non-fuel cost can be divided into the following detailed components (EMA, 2009):
Power generation cost, which mainly covers the costs of operating the power stations,
which consists of the cost for manpower and maintenance, as well as the capital costs
of the station.
The grid charge, which ultimately covers the transportation cost of the electricity for
when it travels through the power grid.
The cost of billing and meter reading, also known as the market support services (MSS)
fee.
Lastly, the power system operation and market administration fees, which are the fees
for the cost of operating the power system and administering the wholesale electricity
market.
According to a press release from December 29, 2010 the tariff for residential users in
Singapore has been increased from January 1, 2010. The reason for this is that the average
fuel oil price had increased to 99.45 USD per barrel, resulting in a 3.3 % increase in the tariff
from January 1, 2011 to March 31, 2011. This means that the electricity tariff for the
households will increase by 0.76 cent to a total of 0.241 SGD/kWh. In Figure 4, the
components that comprise the aggregated tariff are specified (SP Services, 2011).
Figure 4: Aggregated tariff. (SP Services, 2011)
Tariff for Apr to Jun 2011: 0.2558 SGD/kWh

-20-
2.1.5 Strategic Actions
In 2007, the government of Singapore recognized the threats of global climate change and that
it had become an environmental challenge. Singapore would as a part of a collective global
effort address the challenge by doing their fair share yet not volunteering to reduce its
emissions at the cost of economic growth. With this in consideration the government brought
together the Ministries of Trade and Industry (MTI), Foreign Affairs (MFA), Environment
and Water Resources (MEWR), Finance (MOF) and Transport (MOT) as well as the
Economic Development Board (EDB), Energy Market Authority (EMA), Land Transport
Authority (LTA), Building and Construction Authority (BCA), National Environment Agency
(NEA), and Singapore A*STAR thus establishing an inter-agency Energy Policy Group
(EPG) in order to develop a National Energy Policy (Keong, 2008). The energy policy
framework strives to sustain a stable balance between “the policy objectives of economic
competitiveness, energy security and environmental sustainability” (NEA, 2007).
The policy consist of six key strategy points which aim to make it possible to obtain the
objectives of continued economic growth while ensuring an energy security and protecting the
natural environment (NEA, 2007):
Strategy 1: Promote competitive markets
By staying committed to promoting competitive markets Singapore can maintain affordable
energy and ensure an economic competitiveness. Aside from having liberalized the electricity
and gas markets Singapore is analyzing how they can enable full contestability in the
electricity retail market. Failures, which occur in the market, will be corrected by using
market-based instruments or by imposing standards and regulations. The private sector will
also be encouraged to innovate and attain the energy security and environmental outcomes,
which the energy policy aims to obtain (NEA, 2007).
Strategy 2: Diversify energy supplies
Singapore wants to achieve energy diversification in order to safeguard itself from supply
disruptions, price increases and other threats to the dependability of supply. It is in the hands
of the government to create an accessible and flexible framework in order to develop energy
diversification. The strategy states that it is important not to write off any energy option for
Singapore. As technology develops and progresses, energy sources, which are not viable in
Singapore as of today, may potentially become feasible sources of energy in the future (NEA,

-21-
2007).
Singapore is planning on achieving an energy diversification by diversifying the source of gas
through importing liquefied natural gas (LNG) since it can come from anywhere in the world
once it is liquefied. The construction of a LNG terminal will be done by 2013. Creating a
regional power grid in order to import electricity from nearby resources is as well another way
of achieving energy diversification which is seen as a long-term plan (Prime Minister Lee
Hsien Loong, 2010).
Strategy 3: Improve energy efficiency
According to the policy improving energy efficiency is a vital key strategy since it enables for
Singapore to achieve all three objectives of the energy policy since using less energy to obtain
the same output will decrease the dependency on energy imports as well as increase the
energy security and cut business costs, reduce pollution as well as carbon dioxide emissions at
the same time. The government has therefore set up an Energy Efficiency Programme Office
and started a comprehensive national energy efficiency plan by the name of Energy Efficient
Singapore, which is led by the NEA. This aims at taking a sectorial approach looking at the
power generation, industry, transport, buildings and household sectors respectively (NEA,
2007).
Strategy 4: Build energy industry and invest in energy R&D
Singapore intends to expand its range of energy trading products by including LNG, biofuels
and carbon emission credits. At the same time Singapore is pursuing growth opportunities in
the field clean and renewable energy, by exploring such sources as solar energy, biofuels and
fuel cells. This requires strong R&D capabilities in order to support the industry development
regarding these issues. Ultimately this will as well enable Singapore to generate solutions,
which confront the specific energy needs of Singapore (NEA, 2007). There are some biofuel
initiatives that are being pursued in Singapore. However, at the moment there is only one
company that focuses on the domestic market of Singapore. The company Alpha Biofuels
converts waste oils into biodiesel and supplies companies in Singapore such as Smart Taxis,
SingTel and Starbucks (KOK, 2010). The Finnish company Neste Oil opened the world‟s
largest palm oil biodiesel plant in Singapore. Neste Oil focuses on the European and North
American markets since countries in the regions have government mandates, which promote

-22-
biofuels. Neither Singapore nor any other country in Asia has adopted such a mandate yet
(TAY, 2010)
Strategy 5: Step up international cooperation
It is important that the energy policy incorporates attempts to promote larger regional and
international energy cooperation due to the small size of Singapore and its dependence on
energy imports. Singapore is as well continuously actively involved in numerous initiatives
focused on energy in major associations such as the Association of Southeast Asia Nations
(ASEAN), the Asia-Pacific Economic Cooperation (APEC) and the East Asia Summit (EAS).
It is as well important for Singapore to be engaged at an international level since it is an
effective method of taking action against the consequences of climate change. Therefore,
Singapore is an active participant in the United Nations Framework Convention on Climate
Change (UNFOCC).
Strategy 6: Develop whole-of-government approach
Due to the complexity and the crucial importance of a sustainable strategy of a comprehensive
energy policy it is therefore vital to form a whole-of-government methodology. This process
began back in 2007 when the EPG was composed an inter-agency partnership. The role of the
EPG is to formulate and coordinate the energy policies and its strategies (NEA, 2007).
2.1.6 Singapore’s Energy Industry Strategies
In the NEA Report from 2007 the energy industry received special attention and
developmental strategies to expand the energy industry were stated. Four specific strategies
were stated and described (NEA, 2007):
1. Expand refining base:
With regards to the strong and increasing demand for oil in Asia, Singapore has realized the
substantial upside of increasing their oil refining capacity of 1.3 million barrels per day as of
present. In order to capitalize on this opportunity Singapore will promote the expansion and
upgrading of the existing refineries and invite green field investments, which will attract
foreign companies and ensure the construction of new industry facilities and create new long-
term jobs in Singapore. This strategy aims to maintain Singapore‟s share of global refining

-23-
volume, thus creating the liquidity that is required to secure oil trading in Singapore.
2. Extend beyond oil trading to energy trading:
Singapore has as well recognized the opportunity it has to utilize the experience it has in oil
trading to expand the array of energy products priced and traded in Singapore to include
LNG, carbon emission credits and biofuels. As of May 2007 companies engaged in the Global
Trader Programme (GTP) have been introduced to a concessionary tax rate of 5 % income
derived from LNG trading. The GTP also encompasses emission trading credits and biofuels
into the list of qualifying products.
3. Expand the clean energy sector:
It is expected that the global market for clean technologies will undergo a remarkable
expansion during the ensuing decade. With regards to the expected expansion Singapore has
observed clean energy as a vital area of potential growth. The experience and competencies,
which Singapore possesses in the semiconductor, industrial equipment and chemical sectors,
puts Singapore in a good position to seize opportunities which arise in the solar, fuel cell and
biofuel markets. Another requirement, which will be essential for the growth of the energy
sector, is the creation of an environment that embraces and develops technological innovation
and R&D.
4. Help sustainable energy solutions providers expand regionally:
Another key strategy is aimed at recognizing that today‟s rapid urbanization and increasing
awareness about climate change concerns will ultimately result in a vaster request for
sustainable energy solutions, which are applicable to urban environments. There are areas
where Singapore can seize upon market opportunities, one being intelligent grid management,
which can be done by fostering a group of energy services entities that have the capability to
distribute their proficiency on energy efficiency and preservation.
These many strategies have resulted in the implementations of new initiatives and projects,
which are further discussed in the following chapters.

-24-
2.1.7 Alternative energy initiatives
Because Singapore has limited natural resources and is very dependent on import of primary
energy there is limited capacity for Singapore to deploy renewable energy sources such as
wind and solar power on a sizeable scale. As a result of this, Singapore has projected that it is
highly unlikely for the country to establish an extensive implementation of alternative energy
and phase out oil and gas. This analysis was made in 2008 by Singapore‟s Ministry of
Environment and Water Resources, which was published in the National Climate Change
Strategy. However, the analysis notes that aside from waste-to-energy, solar energy and bio
fuels appear to be the most applicable renewable energy resources. When it comes to wind
power, except for a few scattered wind turbines, there is no implementation of wind power in
Singapore (MEWR, 2009). According to Dr. Giuseppe Cavallaro, there hasn‟t been any
extensive wind studies carried out in Singapore yet. However, at the moment there are some
ongoing studies that use more precise measuring tools, like the Doppler radar that can
measure the wind speeds at different heights. So far, there are no official results from these
studies and the general consensus is that wind conditions in Singapore are not favorable
enough to make wind power feasible (Cavallaro, 2011)
On the other hand the Economic Strategies Committee (ESC) has acknowledged that it is
integral for Singapore to diversify its energy mix in order to achieve the national energy
objectives which Singapore has established. Furthermore, the Singapore government decided
to invest in renewable energy research. However, Singapore decided not to set targets for
amplifying its quota of renewable energy in the Singapore energy mix. Therefore, Singapore
has made energy efficiency a key strategy when pursuing energy security and environmental
sustainability objective, due to the aforementioned difficulties Singapore has in making it
possible to instigate the implementation of renewable energy. (Ölz & Beerepoot, 2010). Prime
minister Lee Hsien claims (Prime Minister Lee Hsien Loong, 2010):
”This is very difficult to do because Singapore is what is known as an alternative energy
disadvantaged country. That means no solar, no hydro, not much wind and very difficult to do
nuclear. And therefore we have not much choice but to rely on fossil fuels and imported fossil
fuels to boot.”

-25-
2.1.7.1 Solar Energy
In the tropical climate of Singapore the most promising renewable energy source is solar
energy. Singapore has previously stated that they would invest early in solar technology test-
bedding projects in order to prepare to use solar power technology on a larger scale when
solar energy becomes more economically viable, ultimately meaning that the costs of solar
energy first has to fall closer to that of traditional energy (MEWR, 2009).
Even though Singapore sees solar power as it is most promising renewable power resource
Singapore has not yet been able to make solar power usage reach grid parity. The reason for
this being that solar power simply is not economically viable at this stage (SERIS, 2008).
On April 1, 2008, Singapore established the Solar Energy Research Institute of Singapore
(SERIS) and commenced its operations. The role of SERIS is to conduct industry-oriented
basic research and development as well as the research of solar energy conversion. The
strategy of SERIS is to hire experts from Singapore and/or overseas, initially focus on a few
industry-relevant important areas of R&D and to establish collaboration with some of the
world‟s preeminent institutes in order to achieve knowledge transfer and win-win situations
(SERIS, 2008).
SERIS offers a range of services, which are divided into R&D cooperation in solar energy,
testing and characterization, technical consulting and manpower training. Within R&D there
are four activities: silicon solar cells (wafer and thin-film), nanostructured solar cells, solar
and energy efficient buildings and PV module performance testing (SERIS, 2008).
The Germany-based firm Phoenix Solar does however believe that solar energy usage in
Singapore can reach grid parity by 2014 as a result of lower installation costs and higher costs
for electricity. According to the managing director of Phoenix Solar in Singapore, Christophe
Inglin installed solar PV at a cost of 3.50 - 4.00 SGD/Wp would be sufficient in able to allow
for grid parity. As of today the installed costs for large grid connected systems reach 5.00 -
6.00 SGD/Wp. However, the cost for installing solar modules is going down due to higher
supply and improvements as well as new innovations. At the same time there is an
anticipation that the cost of electricity will increase in line with oil prices. Professor Joachim
Luther, who is the chief executive officer of the Solar Energy Research Institute of Singapore
(SERIS), has stated that it is possible to find cost reduction opportunities and achieve a cost
reduction through a whole system approach by looking at the cost of cabling, mounting
system and inverters. He indicates that for this to be made possible the manufacturers and

-26-
system integrators must collaborate. Christophe Inglin also believes that the use of solar
energy in Singapore will become more commercially viable seeing how the government is as
well exhibiting a strong interest in developing the renewable energy sector, in particular solar
energy (Liang, 2010a).
As of the summer of 2010, Singapore is making a large investment in solar PV panels. The
Housing Development Board (HDB) awarded Norway‟s Renewable Energy Corporation
(REC) with a 2.3 million SGD contract to install their solar photovoltaic (PV) panels on the
rooftops of 3 000 public residential units. HDB states that with this installation of 1 MW solar
PV at six HDB precincts this will by far be the single largest solar panel procurement in
Singapore. The electricity generated from the solar panels will supply the power for the
lightings in the common areas such as corridors and elevators. It is however still unclear what
the project‟s completion date will be. This project is part of the second phase of HDB‟s solar
panel implementation initiative for its housing estates. The first phase resulted in a 500 kWp
solar PV installation at four HDB precincts. The solar power generated managed to offset the
amount of electricity used to power the common service areas. HDB sees a great amount of
potential in developing solar energy in particular. Since more than 80 % of Singapore‟s
approximately 4.8 billion inhabitants are living in HDB housing, HDB has the possibility to
make a major impact (Liang, 2010b).
2.1.7.2 Smart Grid
It was recently announced that Singapore will be investing 38 million SGD in order to
construct the world‟s largest experimental energy smart grid at a capacity of 1 MW. There is
still no standard definition of “smart grid” that is used globally. However, according to the
European Technology Platform for the Electricity Networks of the Future, also known as
“SmartGrids”, smart grids are “electricity networks that can intelligently integrate the
behavior and actions of all users connected to it – generators, consumers and those that do
both – in order to efficiently deliver sustainable, economic and secure electronic supplies”
(ETP, 2011). The smart grid will be made available to international companies as Singapore
welcomes companies to test-bed and implement new energy technologies. This power grid
project is as well the first of its kind in Southeast Asia and it could as well allow renewable
energy recourses like solar and wind to feed electricity into the power grid. The venture will

-27-
be led by Singapore‟s A*Star‟s Institute of Chemical and Engineering Sciences and will find
partnerships with companies which will assist in developing these smart grids at the new so
called Experimental Power Grid Centre (EPGC). During the summer Singapore firms SP
PowerGrid and CEI Contract Manufacturing signed an agreement to work at the EPGC,
which is located on Singapore‟s Jurong Island. Other companies such as the wind turbine
giant Vestas and engine manufacturer Rolls-Royce did as well sign letters of intent for future
collaboration. According to the schedule the EPGC is intended to be ready in the second half
of 2011. The deputy managing director for research at A*Star, Low Teck Seng, has explained
that A*Star hopes to see ten large companies working in a partnership with new centre as
soon as it becomes operational. He stated that (Liang, 2010c):
“What we hope to achieve is a contribution to developing Singapore as a living lab for
companies that hope to experiment with and develop new technologies that could see
applications in the new economies of the future,”
Many power grid systems around the world are not equipped for facing the new demands
which are being forced upon them, demands such as integrating renewable energy sources, the
consumers demand for more information, choice and control in their energy use. The
chairman of A*Star said the following regarding the EPGC (Liang, 2010c):
“Innovation and development of energy technologies are vital to the growth of the global
smart grid industry, which is expected to be worth $187bn by 2015,”
The smart grid would allow for more detailed feedback on the power grids status, help
operators stay ahead of potential power outages, as well as an easier balance of supply and
demand (Liang, 2010c).
2.1.7.3 CleanTech Park
Another project, which aims at developing renewable energy solutions and progression of
clean technologies, is the establishment of the 50 hectare CleanTech Park at the Nanyang
Technological University (NTU) campus. The Singapore Economic Development Board
(EDB) and JTC Corporation (JTC) jointly revealed a master plan for the project in February
2010. The CleanTech Park will be Singapore‟s first eco-business park and the choice of
location for progressive corporations, which have embraced the concept environmental

-28-
sustainability into their operations. The development of the CleanTech Park will stretch the
boundaries of green sustainability, functioning as a comprehensive integrated “living
laboratory” for test-bedding and demonstration of system-level clean technology solutions
(EDB, 2010).
The development of the CleanTech Park will be carried out over a span of 20 years consisting
of 3 phases. Phase 1 was initiated in July 2010, which is scheduled to be completed in 2018.
This phase will consist of (JTC, 2010):
The development of the infrastructure.
The development of a central green core (designated green corridors) as well as
supporting facilities and services.
The details of the following phases are yet to be clarified. However, Phase 2 is scheduled to
commence in 2019 and continue development until 2025. Thereafter Phase 3 will be carried
out from 2026 to 2030 A paragraph from a fact sheet about the CleanTech Park states that
”The close proximity to NTU will enhance the integration between the academia, research
institutes and the business industry, providing synergies for a full value chain of the clean
technology cluster, from R&D to downstream manufacturing.” (JTC, 2010).
As a result of the development of the CleanTech Park will be the foundation for a momentous
milestone in the advances of green technologies in the tropic region. Cutting edge green
technology systems will be implemented in the CleanTech Park by JTC, making it the
greenest and most sustainable eco-business park in Singapore (JTC, 2010).
2.1.8 Energy efficiency
Singapore is aspiring to become more energy efficient and sees energy efficiency as the key
strategy for Singapore. The plan is to make advances within energy efficient industry designs,
processes and technologies. This will be done by providing financial incentives and setting
new standards, which will promote more investments in energy efficient technologies,
processes and designs. Furthermore, industries will be encouraged to adopt good energy
management systems to enhance their efficiency. Investigations as to whether to set minimum

-29-
energy performance standards for various types of industrial equipment and processes will be
studied in the long term (MEWR, 2009).
In an attempt to find an energy effective air-conditioning system for the next generation of
Smart Buildings, researchers at Energy Research Institute at NTU (ERI@N) are commencing
a project that combines the two technologies of TABS and DECS. The ambition is to integrate
this alternative air-conditioning system in the highly innovative CleanTech Two Building at
the CleanTech Park for further studies of cooperative energy-efficient components. In the
combined system, the main cooling effect is derived from the TABS while the DECS is used
as an air-handling device for dehumidifying and additional cooling of the circulating air. By
applying wind turbines to drive any electrical components of the system, such as running of
the desiccative wheel, and solar thermal collectors to regenerate the dehumidifying
mechanism, the system is completely driven by renewable resources. This would have an
enormous contribution to reliefs of environmental impacts compared to the conventional air-
conditioning systems that are used in Singapore today (ERI@N, 2011).
2.2 Technology
2.2.1 Wind Power
2.2.1.1 Basic Technology of wind turbines
The main components of a wind turbine are the rotor blades, rotor hub, gearbox, electrical
control systems, generator and pole. A more detailed presentation of the components of the
turbine is presented in Figure 5, where the most important parts are the blades(1), gear box(6),
generator(7) and the tower(15). When the wind passes over the blades the blades undertake a
rotating motion. The rotating blades turn a shaft that goes into a gearbox. The rotating speed
is increased by the gearbox before going into the generator. The generator converts the
rotational energy into electrical energy by using magnetic fields and a transformer converts
the generated electricity at 700 V to the appropriate voltage for the distribution system
(BWEA, 2008).
Wind power, despite its low negative impact and unlimited supply of resources, possesses
some unwanted attributes. Noise, shadow flickering, low efficiency and aesthetics are some of

-30-
the main arguments from the critics of wind power. Therefore, the sites where turbines can be
successfully installed are very limited. (Quiet Revolution, 2011)
Figure 5: Parts of a wind turbine (Shrestha 2011)
2.2.1.2 Small Wind Turbines
The definition of a small wind turbine is a wind turbine that is designed to function in an
urban environment and that can be located on buildings or next to buildings. This implies that
the turbines are adapted for the wind conditions in a built in area and are more resistant to
wind gusts and turbulence. The turbines shall also have a visual design that is suitable for the
urban surroundings. The capacity for small wind turbines ranges between 1 - 50 kW (Cace et.
al, 2007).
There are two types of turbines – the horizontal axis wind turbines (HAWT) and the vertical
axis wind turbines (VAWT). The most common type is HAWT, which has a propeller-type
rotor that is mounted on a horizontal axis. In order to acquire a rotating motion of the rotor it

-31-
is required to be positioned into the direction of the wind. This motion can be carried out by a
tail or by active yawing by a yaw motor. HAWT are sensitive to turbulence and changes in
wind directions because of the required repositioning of the turbine into the wind flow, which
has a negative effect on the performance. Thus the most suited locations for HAWT are open
areas with smooth air flow and few obstacles (El-Samanoudy et.al, 2010).
On the VAWT the rotor shaft is placed vertically, a design which possesses some advantages
over the HAWT. The generator and the gearbox are placed close to the ground so there is no
need for a tower. Hence, they can be placed where tall devices are not allowed by the law.
The main advantage is that the VAWT do not need to be pointed into the wind since the
turbines turn in any direction with the wind so there is no need for a yaw mechanism. They
can be very useful in areas where the force of wind is closer to the ground, such as top of
buildings, hilltops and ridgelines (El-Samanoudy et.al, 2010).
The largest market of urban wind turbines is found in the U.S. About 36 % of the
manufacturing companies in the world are based in the nation and fewer than 10 U.S.
manufacturers together hold about half of the market share. In 2009, the total global sales
were estimated to 42.5 MW (21 000 units), an increase of 10 % compared to the precedent
year. In the U.S. the same year the sales reached 20.3 MW (9 800 units) and about two thirds
of the turbines sold globally 2009 were manufactured in the U.S. In 2009, the total installed
capacity in the U.S. was estimated to 100 MW. The major reason for the market growth in the
U.S. during the 2009 is considered to be the enforcement of the Business Investment Tax
Credit. The act demonstrated to investors the potential of the technology and it aided
consumers during a recession that induced difficulties in obtaining other financing
mechanisms (Stimmel, 2010). Incentives for small turbine companies exist in Europe as well.
In Netherlands profit-making companies can obtain an EID – Energy Investment Deduction-
with a maximum of 5 000 EUR per turbine for turbines with a nominal power that dosn‟t
exceed 25 kW. In the UK 50 % of the installation costs can be covered by obtaining a grant
from the Low Carbon Building Programme (LCBP) (Case et. al, 2007).
New incentives aided by governments enhance the attraction of the market to start-up
companies. There are more than 250 identified manufacturers in the world that compete for
government funds, external investments and growing consumer interest. The majority of these
companies is in a start-up stage and has not yet started to manufacture any turbines. (Stimmel,
2010).
The recession in 2008 caused a drop in value of many homes, which limited home-owners
availability of credit. Small wind turbine manufacturers claim that as a result many consumers

-32-
had to delay their decision of turbine purchasing, since many consumers rely on home equity
credits to finance small wind projects. However, as the economy recovers, manufacturers
predict resurgence in sales due to remained strong consumer interest. The media coverage
and the public exposure of the small wind turbines give the technology a mainstream label
(Stimmel, 2010).
The Siting in this context refers to the assessment of suitability for different sites in order to
determine the location which possesses the maximum potential energy yield (Quiet
Revolution, 2011). Looking at average wind speed is not enough to determine the sites‟
potential energy output. Wind frequency, variation of speed and direction over time also
needs to be taken into account. Siting can be very time-consuming and expensive. The wind
speed is affected by obstacles such as buildings, trees and other turbines and therefore the
height of the turbine and distance from obstacles are very important factors. In general, the
higher height and the further distance from obstacles the better. Thus for a small wind turbine
the most suitable site in an urban surrounding is in broad open areas and on the top of the
tallest buildings (Cace, et. al, 2010).
The results from wind testing are normally compiled in a wind chart. Traditional wind charts
typically evaluate wind conditions at a height that corresponds to the hub heights of large-
scale turbines, i.e. 50 m (Stimmel, 2010).
When installing HAWT, the factor of Unlike HAWT, the vertical dito can be installed side-
by-side, taking up a smaller area of space. This means that a higher capacity can be installed
for every unit of area if using VAWT.
Specifications in Table 1 provide information about a HAWT from ZKenergy (ZKenergy,
2011) one VAWT manufactured by Quiet Revolution (Quiet Revolution, 2011) two vertical
turbines manufactured by Cygnus Power (Cygnus, 2011). The data shows that the VAWT
mentioned requires less speed to start the rotating motion but the given HAWT can perform at
maximum capacity at a lower nominal speed. The swept are for a HAWT is calculated as the
area of a circle with a radius equal to the blade length. The swept are mentioned for the
VAWT in the table is defined as the diameter of the rotor multiplied by the length of the
blade.

-33-
Model HAWT: ZKenergy VAWT: QR 5 CP (200
W)
CP (1 kW)
Max power 1 kW 8.2 kW 200 W 1 kW
Height 5 m N/A N/A
Blade length N/A N/A 3 m
Rotor
diameter
2.7 m 3.1 m 1 m 2 m
Swept Area 5.72 m2 13.6 m
2 N/A 6 m
2
Price 20,000
GBP
Starting wind
speed
3 m/s N/A 1 m/s 1.9 m/s
Cut-inn wind
speed
3 m/s 4.5 m/s 1.3 m/s 2.5 m/s
max wind
speed
50 m/s 19 m/s 60 m/s 60 m/s
nominal
wind speed
11 m/s 15.5 m/s 12 m/s 12 m/s
Table 1: Specifications of urban wind turbines
Figure 6: Power Output QR 5
The power that a turbine can generate at a given wind speed is provided in a power curve. The
curve shows a graph over how the power output is depending on the wind speed. The shape of
the power curve looks very similar for many turbines and takes shape of an “S-curve”.
Initially, the power grows exponentially with increased wind speed, due to the “cubic effect”
0
1000
2000
3000
4000
5000
6000
7000
8000
9000
0 1 2 3 4 5 6 7 8 9 10 11 12 13 14 15 16 17
Po
wer
Ou
tpu
t (W
)
Wind speed (m/s)
Power Output QR 5

-34-
of the wind speed in the power equation. At a certain wind speed, the growth is diminishing
and a top value is reached at the nominal wind speed. Because of energy being used for speed
control of the turbine at higher wind speeds than the nominal wind speed, the power output
will decrease as the wind speed exceeds the nominal wind speed. A power curve for the
turbine QR5, manufactured by Quiet Revolution is presented in Figure 6 (Quiet Revolution,
2011).
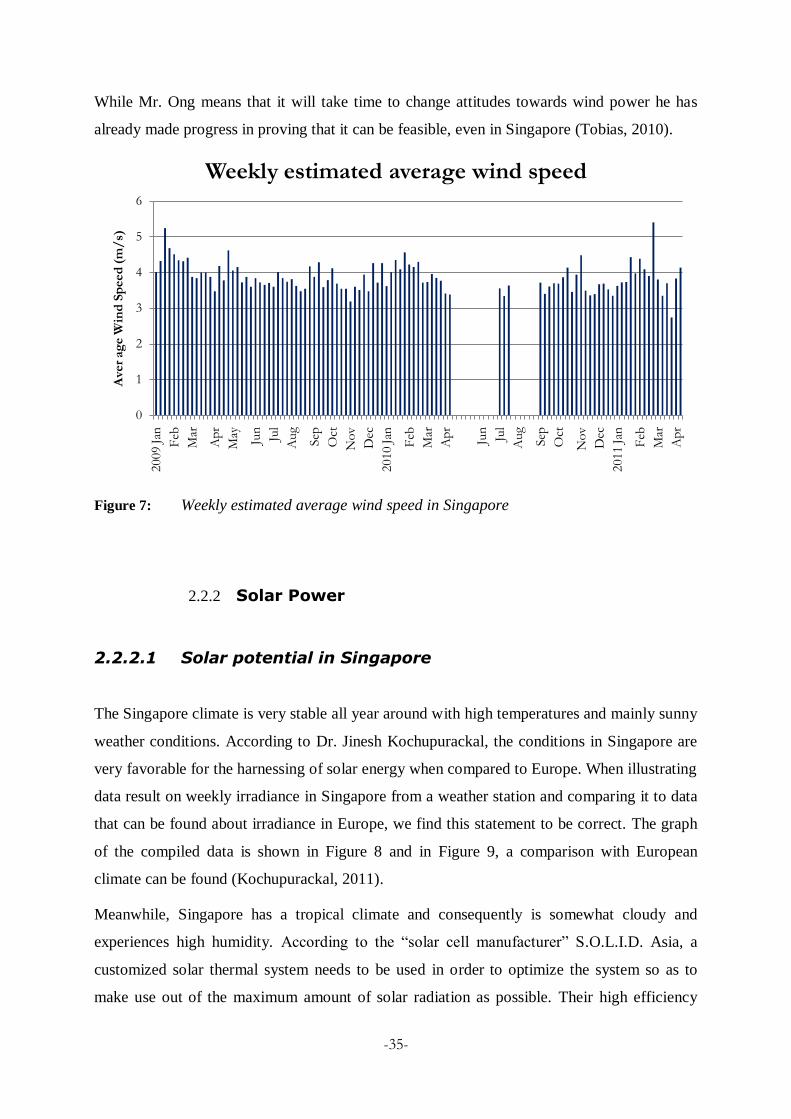
2.2.1.3 Wind power in Singapore
The wind conditions in Singapore are due to its geographical attributes not as desirable as in
Europe or the U.S. when it comes to harvesting wind power. The wind test carried out shows
an average wind speed that ranges between 2 - 3 m/s. When looking at elevated and
strategically located sites, speeds of up to eight m/s can be obtained (Tobias, 2010). The wind
speeds that were indicated by a weather station in Singapore, elevated to 90m, are compiled in
a weekly average in Figure 7.
Because of the poor wind condition, it is obvious that the tropical climate of Singapore will
need different technologies for harvesting wind power than the ones that are applied in
windier areas. The HAWT will only spin when wind at a certain speed blows in a certain
direction. These turbines are optimal for European and North American conditions, where
strong winds occur continuously. But when wind power is to be utilized in a tropical climate,
where winds appear both slower and more scattered, a more specific design needs to be used.
In Singapore, many have claimed that the wind conditions are too poor to make it worthwhile
harvesting energy from the wind. However, Ong Gin Keat, chief executive of Cygnus Power,
thinks otherwise and finds the reason for why there are many skeptics to wind power in a
climate such as Singapore‟s is that the correct wind turbines have not been used. Furthermore,
he claims that when turbines are used in the right spot and at the right elevation, the wind is
blowing just fine. Using both lift and drag forces, there are now turbines that can self-start
with wind from any direction and are capable of capturing wind as slow as 1 m/s (Tobias,
2010).
A turbine of 1 kW, manufactured by Cygnus Power that is mentioned above, has been
installed at the campus of NTU in Singapore. Along with a Cygnus Power turbine if 200 W
that is trialed by the HDB, it is one of very few wind turbines that have been installed in
Singapore (Tobias, 2010).
-35-
While Mr. Ong means that it will take time to change attitudes towards wind power he has
already made progress in proving that it can be feasible, even in Singapore (Tobias, 2010).
Figure 7: Weekly estimated average wind speed in Singapore
2.2.2 Solar Power
2.2.2.1 Solar potential in Singapore
The Singapore climate is very stable all year around with high temperatures and mainly sunny
weather conditions. According to Dr. Jinesh Kochupurackal, the conditions in Singapore are
very favorable for the harnessing of solar energy when compared to Europe. When illustrating
data result on weekly irradiance in Singapore from a weather station and comparing it to data
that can be found about irradiance in Europe, we find this statement to be correct. The graph
of the compiled data is shown in Figure 8 and in Figure 9, a comparison with European
climate can be found (Kochupurackal, 2011).
Meanwhile, Singapore has a tropical climate and consequently is somewhat cloudy and
experiences high humidity. According to the “solar cell manufacturer” S.O.L.I.D. Asia, a
customized solar thermal system needs to be used in order to optimize the system so as to
make use out of the maximum amount of solar radiation as possible. Their high efficiency
0
1
2
3
4
5
6
2009 J
an
Feb
Mar
Apr
May
Jun
Jul
Aug
Sep
Oct
No
v
Dec
2010 J
an
Feb
Mar
Apr
Jun
Jul
Aug
Sep
Oct
No
v
Dec
2011 J
an
Feb
Mar
Apr
Ave
r ag
e W
ind
Sp
eed
(m
/s)
Weekly estimated average wind speed

-36-
solar thermal collectors possess the highest potential of optimizing the specific system.
(SOLID, 2011a).
Figure 8: Weekly solar irradiance from weather station at NUS
Figure 9: Solar irradiance in Singapore, Abu Dhabi and Berlin (Luther, 2010)
0,00
50,00
100,00
150,00
200,00
250,00
No
v
Oct
Sep
Aug
Aug
Jun
May
Apr
Mar
Feb
2010 J
an
Dec
No
v
Oct
Sep
Aug
Jul
Jun
May
Apr
Mar
Feb
2009 J
an
Irraadiance(W/m2)
Weekly average solar irradiance

-37-
2.2.2.2 Solar Thermal Systems
Solar thermal systems use solar thermal collectors to harness the energy from the sun in order
to produce heat. The systems consist of three main elements: solar collectors, insulated heat
transport piping and heat storage. The solar thermal collectors appear in different shapes and
models depending on the intended purpose to be served. The solar collectors convert the solar
energy into heat (SEIA, 2009), which is transferred to a fluid that flows through the collector.
The solar energy is then carried from the circulating fluid either directly to conditioning
equipment or to thermal energy storage tank, in order to be consumed later. There are several
different types of collectors. The main attributes of distinction of the different models are the
motion (stationary, single axis tracking or two axis tracking) and the operating temperature of
the collectors (Kalogirou, 2004).
The stationary collectors are fixed in position and do not track the sun. One example of a
stationary collector is the Flat-plate collector (FPC). As revealed by the name, these collectors
consist of an absorptive surface that is completely flat. The sides and bottom of the plate are
well insulated. Just as Figure 10 shows, the energy absorbed by the plate is transferred to fluid
tubes in the plate that contain the transport fluid, which carries the energy away for use or
storage (Kalogirou, 2004).
Figure 10: Basic principle of a solar collector (CREM, 2011)
The Compound parabolic collector (CPC) can also be stationary, although, the efficiency
increases when a sun tracking mechanism is applied. It has a parabolic surface that reflects
and concentrates all incoming radiation, within the collector acceptance angle, to an absorber
that is positioned at the bottom of the collector. This feature is in many ways superior to the

-38-
FPC since the transport fluid can reach higher temperatures in a concentrator system, which
increases the thermodynamic efficiency. The concentration system also makes it possible to
match the temperature level with the intended task of the system. Also, the reflecting surface
has a simpler structure and requires less material than the absorption surface of an FPC
(Kalogirou, 2004).
A widely used conventional concentrating collector is the parabolic trough collector (PTC),
which is a single axis tracking collector. It is constructed as a long parabolic mirror, which
reflects all the incoming radiation to a metal black receiver tube that is placed in the focal
line. This tube contains the heat transfer fluid. The PTC can be placed in a north-south or east-
west direction. The different directions have different peaks of efficiency during different
hours of the day and during different seasons of the year. Over a one-year period, the
collectors placed in a north-south direction, which track the sun from east to west, usually
collect slightly more energy that the collectors placed in an east-west direction (Kalogirou,
2004).
The parabolic dish reflector (PDR) tracks the sun in two axes. It has a parabolic structure and
a focal point in the dish, which has to fully track the sun in order to reflect beams into the
thermal receiver. The receiver absorbs the reflected solar energy and converts it into thermal
energy in a circulating fluid. The thermal energy can instantly be converted into electricity by
using an engine-generator, which is attached to the receiver, or it can be transported to a
central power-conversation system through pipes. Because the PDR is always pointed towards
the sun, it is the most efficient collector and the system can achieve temperatures that exceed
1500 °C (Kalogirou, 2004).
The Austrian solar engineering company S.O.L.I.D. has developed a new solar collector, the
Gluatmugl HT, which operates at higher efficiency levels especially in the temperature range
of 80 - 95 °C. On S.O.L.I.D.s website the product is described as follows (SOLID, 2011b):
”The Gluatmugl HT collector achieves low heat loss values with the aid of a double cover:
additionally to the outer glazing, an inner cover was added to reduce the convective heat
losses. The outer cover consists of a high-transmission solar glass (unstructured float glass
without AR coating on both sides, but AR available on request). The inner cover consists of a
transparent and high temperature resistant plastic film (Teflon) stretched at collector
assembly in order to reduce slack. A thicker back insulation (120 mm mineral wool) has also
been incorporated to reduce heat losses on high working temperatures.”

-39-
The Gluatmugl HT operates at temperatures in the range of 80-120 °C and is available in
several different sizes, 6.3 m², 7.2 m², 8.4 m², 9.6 m², 10.5m², 12.0m², 12.5 m² (export), 12.6
m² and 14.3m² both roof integrated and free mounted. The collectors have a conversion factor
of h0 = 0.811, heat loss coefficient of a1 = 2.71 W/m2K and a2= 0.01. The absorber has an
absorption of a = 96 % +/- 2 % and emission of e = 7 %. These collectors are suitable to use
for commercial large-scale systems since the collector modules are large in area and
competitive in price (SOLID, 2011b).
As portrayed in the introduction, the commercial, public and residential sectors account for a
majority of Singapore‟s energy consumption. Since the process of heating water in these
sectors demands a great deal of energy, the implementation of solar thermal systems has a
potential to significantly lower the use of fossil fuels and thus improve Singapore‟s use of
renewable energy and reduction of carbon foot print.
2.2.2.3 Solar PV
The solar PV cell absorbs sunlight in order to instantly convert it into electricity. The basic
principal in the solar cell is illustrated in Figure 11 and can be described as the utilization of a
so-called p-n junction, which is created by comprising two dissimilar semi-conductors (one p-
type that is positively charged and one n-type, which is negatively charged) and thus creating
an electric field (Shrestha, 2011). The phenomena taking place in PVs is called the
photoelectric effect and was first discovered by Edmond Becquerel in 1839. The photoelectric
effect implies that, in certain materials, the photons of light can be absorbed, causing electrons
to release from molecules within the material. By attaching electrical conductors to the
positive and negative side of the cell, it is possible to capture these free electrons in the form
of electric current, so-called electricity (Knier, 2002).

-40-
Figure 11: Illustration of the photoelectric effect inside the solar PV (Shrestha, 2011)
A group of electrically connected cells form a PV module, which are designed to supply the
electricity at a specific voltage. The electric current produced is dependent on how much light
that is absorbed by the module. By wiring multiple modules together, an array is formed.
They can be connected in both series and in parallel, in order to achieve requested voltage and
current combinations. The current produced from modules and arrays is a direct-current (DC)
(Knier, 2002). This needs to be transmitted into AC before put into the grid
The Solar PV can be used in multiple manners, for example (Zahedi, 2005):
Off-grid domestic: Appropriate for off-grids communities, more cost-effective than
extending the grid. Mostly used for low power loads, like lightning, refrigerating.
Off-grid non-domestic: Applied where small loads of electricity has high value. They
provide power at low maintenance for many applications, such as telecommunication,
water pump.
Grid-connected distributed: Supplies to loads that are connected to the main utility
grid, such as buildings. They are normally integrated into built environment and
supply consumers, households. Since they are connected to the main grid, there‟s no

-41-
need for storage in batteries as any surplus can be sent to main grid. This application is
less expensive than off-grid systems.
Grid-connected centralized: Used as back-up for main electricity generation or for
strengthening the utility grid.
A large problem that the solar PV industry has is the difficulty to develop and produce solar
cells which are able to be utilized in commercial solar panel systems. This is largely due to
financial reasons. It is simply exceedingly expensive and not financially viable for most actors
to establish commercial products. Some of the different technologies that are developed are
presented in Figure 12. Many of these technologies are currently undergoing a lot of research
but may still have a long time before being introduced to consumers on the market due to the
expensive production of conventional modules or due to needed improvements of efficiency
(Kochupurackal, 2011).
Figure 12: Different types of solar cells, measured under global AM 1.5 spectrum (1000 W/m2) at 25 °C
(Shrestha, 2011)
The Renewable Energy Corporation (REC) has developed an award winning module. REC
calls this module series the REC Peak Energy Integrated Series. The REC245PEI modules use

-42-
the cell type called 60 REC PE multi-crystalline which are 3 strings of 20 cells using 3 by-
pass diodes. They as well use antireflection solar glass and highly resistant double layer
polyester. The modules each have an area of 1.75 m² and have an efficiency rate of 14.8 %.
The solar PV system operates between -40 and +80 °C When tested in conditions with an air
mass of 1.5, radiance of 1000 W/m² and cell temperature of 25 °C the maximum power (Wp),
maximum power voltage (V) and maximum current (A) reaches 245 Wp, 30.2 V and 8.1 A
respectively. In November 2010, an installation was finished of 61 kWp of REC solar
modules on the rooftop of the Standard Chartered Bank office building in Singapore. (REC,
2011)
On the other hand, SunPower has managed to develop record setting solar cells and
furthermore, they have been able to produce commercial solar panels for consumers. Dr
Richard Swanson, who is the SunPower founder and chief technology officer mentioned that
during the past five years the research & development and engineering teams have been able
to increase solar cell efficiency by four percentage points which is implies that the efficiency
itself has increased by nearly 20 %. At the same time the manufacturing cost has decreased
significantly. As recently as of June 23, 2010 SunPower announced that they had set a new
world record in efficiency for large area silicon wafers. The U. S. Department of Energy‟s
National Renewable Energy Lab (NREL) confirmed that SunPower set a world record by
recording solar energy conversion efficiency of 24.2 % at the SunPower manufacturing plant
in the Philippines. The SunPower vice president of technology and development Bill
Mulligan stated that “This new world record demonstrates SunPower's ability to extend our
lead in manufacturing the world's highest efficiency solar cells. Our patented and proprietary,
high-efficiency solar cell technology drives down the cost of solar energy by increasing the
energy production from each solar panel." (SunPower, 2011)
SunPower has established itself as the leading solar PV company in the world by developing
and producing products with the highest efficiency in the world. Therefore, SunPower‟s solar
panels the most efficient PV panels on the market today. According to SunPower, their panels
produce more than 50 % more W/m2 compared to conventional design and 100 % more than
thin film solar panels. Moreover, the panels do as well decrease the amount of heat
degradation by 3.7 %. As a result, the cost per utilized kWh decreases since fewer panels need
to be installed. Furthermore, the panels have a long life span since the materials that the
panels are composed of along with the tempered front glass and a robust anodized aluminum
alloy frame make the panels extremely reliable and durable (SunPower, 2011)

-43-
The most efficient solar panel that SunPower offers for households is the E19 / 320 Solar
Panel from the E19 Series. The solar panel uses monocrystalline silicon wafers, which use the
finest and thinnest silicon and utilizes so-called 96 back-contact solar cells. Moreover, the
total panel conversion efficiency of the panel is 19.6 %, which is calculated through dividing
the maximum peak (320 W) by the suns irradiance (1 000 W/m2) and dividing that quotient
by the surface area (1.630714 m2). As well, the panel‟s efficiency is exceptional due to the
reduced voltage-temperature coefficient, high transmission tempered anti-reflective glass and
remarkable low-light performance. (SunPower, 2011)
2.2.3 Thermally active building system (TABS) and
Desiccant water cooling system (DECS)
2.2.3.1 Introduction to TABS and DECS
It is common knowledge that the population in Singapore, due to its tropical climate, is highly
dependent on air-conditioning. As mentioned earlier, about 5.71 % of the total energy
consumption in the country goes to residential air-conditioning. If a more effective cooling
system was to be used, that could have a large impact on the energy consumption of
Singapore.
An alternative to the air-conditioning system used in Singapore, a more efficient integrated
system that combines a desiccant evaporative cooling system and a thermally active building
system is currently tested in Singapore. Markus Brychta from the Energy department of the
Austrian Institute of Technology is one of the people mainly accountable for this project. He
states that thermally active building systems are currently used for both heating and cooling
purposes in Europe but are yet to be implemented in Asia. Meanwhile, the desiccant cooling
systems, some powered by solar energy, are tested and used in several countries in Southeast
Asia. This combination of the two systems will be the first of its kind to be tested in a tropical
climate like Singapore‟s. (Brychta, 2011)
2.2.3.2 Desiccant Evaporative Cooling System (DECS)
Desiccant cooling systems have the objectives of cooling and dehumidifying air inside a
closed environment – just like an air conditioner. The open system is an air handling unit
(AHU) with an integrated desiccant wheel that uses a process that dehumidifies and cools air

-44-
in a more energy efficient manner than conventional air-conditioning. The steps that the
incoming air goes through in this process are illustrated in Figure 6 and involve
dehumidification in the desiccant wheel (the dehumidifier) that contains a desiccant material
cooling by exhaust air and finally evaporative cooling before the air finally enters the
building. When exiting the building, the air is first evaporative cooled up to saturation and
then heated in the heat regenerator by the energy removed from the incoming air and finally
the air is heated up to regeneration level of the desiccant in order to regenerate the
dehumidifier (Höfker et. al, 2001). Figure 13 illustrates a scheme of the system.
The heating of the exhaust air before entering the desiccant wheel can be achieved with solar
liquid collectors by using a water to air heat exchanger. These heat exchangers can be
assumed to possess an efficiency of 60 % (Nerandra, 2011). The idea of this solar driven,
cooling process has good prospects for conventional air-conditioning systems and it could
make an important impact on energy savings and environmental protection (Höfker et. al,
2001).
Figure 13: Scheme that shows the route of the air in DECS (Höfker et. al, 2001)
2.2.3.3 Thermally Activated Building Systems (TABS)
Thermally activated building systems is an energy efficient economical alternative for cooling
and heating of buildings. The system integrates the structure of the building in the overall
energy strategy of the building as energy storage. This is carried out by embedding water

-45-
carrying pipes into the ceiling. By running cold water through the pipes the building is
cooling by radiant and convective energy absorption from the space. If instead warm water
flows through the pipes, stored energy will be released into the space, which has a heating
effect (Gwerder, 2007). The pipes are made of cross linked polyethylene, PEX. The high
temperatures of the water flowing through the pipes for heating (25 ºC – 30 ºC) and low
temperature for cooling (16 ºC - 20 ºC) make the system compatible with most forms of
renewable energy sources, producing optimum efficiency with ground heat exchangers and
heat pumps. Figure 14 illustrates how the system looks. The reductions in CO2 emissions, low
maintenance and lower investment and operational costs are further factors that make the
TABS a more potential system than commercial air-conditioning in a modern, sustainability-
focused energy system. (velta, 2011)
Figure 14: Illustration of TABS that will be tested in Singapore (Narendra, 2011)

-46-
3 Method
In order to be able to analyze the thesis in an orderly and suitable manner it is essential to
comprise a structured methodology describing the approach and model. This approach
consists of assumptions, limitations, modeling, calculation methods, parameters and variables.
Figure 15 depicts an illustration of the model with the included input parameters and resulting
outcome.
Figure 15: Illustration of the thesis model
3.1 Limitations
It is important to make limitations and restrictions when pursuing modeling. The model will
be limited to analyzing the potentials of solar PV, solar thermal collectors and small wind
turbines, when utilized in Singapore‟s urban areas. Due to the unfavorable wind conditions in
Singapore as well as the defined energy system‟s small scale, offshore wind power will not be
considered in the model. The thesis focuses on electricity generation in the financial aspect of
the feasibility study and an equivalent figure for the thermal energy is problematic to measure
Model Current Feasibility
Practically
Economically
Sensitivity
Technological
advancements
Subsidies
Energy resources
Power generation
equipment
Energy demand
Present value of
investment
Cost of energy
Future potential

-47-
in Singapore. Therefore, the financial study will not include solar thermal collectors, which is
only to be included when estimating the practical feasibility for powering TABS and DECS.
The scope of analysis will be limited to solely examining the technical and economical
aspects. Consequently, the environmental impact of wind and solar power from factors such
as the exploration of nature and eco-system disturbance will not be taken into consideration.
Furthermore, political restrictions and regulations on solar and wind power are also ignored
when looking at the potential of the technologies.
3.2 Assumptions
In order to be able to calculate the amount of potential energy that can be utilized from solar
and wind power at the location of the CleanTech Park at NTU, data from measurements of
wind speed and radiation for the location must be retrieved. In the case of retrieving weather
data, simplifications need to be made, as measurements carried out at NTU are confidential
and not accessible. Instead, the weather station implemented at the National University of
Singapore (NUS) is assumed to function as an accurate counterpart to the site of study at NTU
and thus, the sites‟ weather conditions are assumed to be equal. Furthermore, the accuracy of
the data retrieved from the weather station is considered reliable. The exception is all the
radiation data retrieved after November 28, 2010, due to the confirmed malfunctioning of
apparatus. Moreover, data could be retrieved with five-minute intervals on a weekly basis for
most part of the year. However, the data from certain weeks was not retrieved due to the lack
of cataloging during these periods. Nevertheless, Singapore‟s climate and environment is
fairly homogenous. Therefore, this does not substantially affect the overall reliability and
accuracy.
The efficiency of the wind turbine used is assumed not to be suffering from degradation over
the time of its lifespan. As a result, the same efficiency is used throughout all calculations.
The assumption is also accounted for the solar PV panels. However, research has shown that
solar PV panels are in fact exposed to degradation. The impact on the efficiency of the panel
differs depending on the standard that is used. The National Renewable Energy Laboratory
standard suggests using a degradation rate of 0.7 % annually while Sandia National
Laboratories estimates that the rate is 0.5 %.

-48-
3.3 Parameters and variables
The parameters and variables that are used in the calculations will alternate depending on the
setting. Thus, a parameter in a certain setting can be can be treated as a variable in another
setting. When analyzing the system, figures such as solar irradiance, solar panel and solar
thermal collector area, efficiency rate, life span and electricity tariff and price of power
generation equipment will be used as both parameters and variables depending on the given
setting and calculation.
3.3.1 Costs
In order to evaluate the feasibility of the different electric power generation resources and
comparing these to the conventional electric power production in Singapore, a standard
measure of costs needs to be assigned the technologies that we compare. This standard
measure is set to be price per unit electricity generated, or SGD/kWh.
The cost of conventional electricity in Singapore is currently set to 0.25 SGD. From the
historical tariffs that are presented in Figure 2 on page 18 an annual increment is calculated to
be 2.98 %.
Using the same annual increment for the next 25 years, an electricity tariff can be assumed for
each year until year 2036. Using these prices, the annual income from investing in solar and
wind power can be estimated respectively. In order to calculate the profit from the investment,
the accumulated income for each year during the assumed life span needs to be discounted
back to a present value by using an appropriate discount rate. This discount rate can be set to
be the annual growth of inflation, if only taking into account the change in fundamental value
of the currency. If it is to be considered as a financial investment, the discount rate consists of
the risk free rate and a risk premium. In this case, the risk free rate is equal to the rate of the
national long term government bond. In Singapore that is equivalent to the yield of
Singapore‟s 10-year government bond, which is currently set to 2.40 %. (SGX, 2011). The
risk premium consists of risk mainly associated to the electricity tariff and the equipment‟s
additional maintenance costs. Based on comparisons to other investments, the risk has been
assumed to be 2.60 %. The discount rate for the investment is therefore 5 %. This is also
considered to be the required rate of return on the investment. The profit of the investment is

-49-
calculated by simply subtracting the initial investment from the retrieved present value of
future incomes. The resulting formula is:
=
Where
PV = Present value of income from investment
C = Dividend from investments
r = Discount rate
t = time
g = annual growth
In addition to the net present value method, the payback period is another financial indicator,
which can be used to assess the investments profitability. The payback period simply shows
the period of time needed for the accumulated annual income to repay the initial investment.
This indicator disregards the change in value of currency over time.
3.3.2 Wind Turbines
For the model, the hypothetical wind turbine that is tested in the wind conditions will have
similar specifications as those that are available on the market. The turbine tested is selected
due to apparent suitableness and is form here on simply referred to as the test turbine. The
specifications of the test turbine are as follows:
Nominal efficiency: 2 kW
Blade length : 3.2 m
Rotor diameter: 2.5 m
Swept Area: 8 m2
Starting wind speed: 1.9 m/s
Cut-inn wind speed: 2.5 m/s

-50-
Cut-out wind speed: 60 m/s
Nominal wind speed: 12 m/s
Installation cost: 15000 SGD
The power curve in Figure 16 shows the generated electric power at every wind speed
respectively. The curve is a rough estimation, based on the curve in Figure 6 and adjusted to
the specifications mentioned above.
Figure 16: Power curve of test turbine with cut-in speed at 2.5 m/s and nominal wind speed at 12 m/s
Due to complications of calculating the power output for every five minute interval of the
wind data there needs to be some approximations made. Firstly, the wind power potential is
calculated by the following formula:
Where
ρ = density of air (kg/m3)
A = Swept area of turbine (m2)
V = wind speed (m/s)
0
500
1000
1500
2000
2500
0,0 1,9 3,0 4,1 5,3 6,4 7,5 8,6 9,8 10,9 12,0 13,1
Po
wer
Ou
tpu
t (W
)
Wind speed (m/s)
Power curve, test turbine
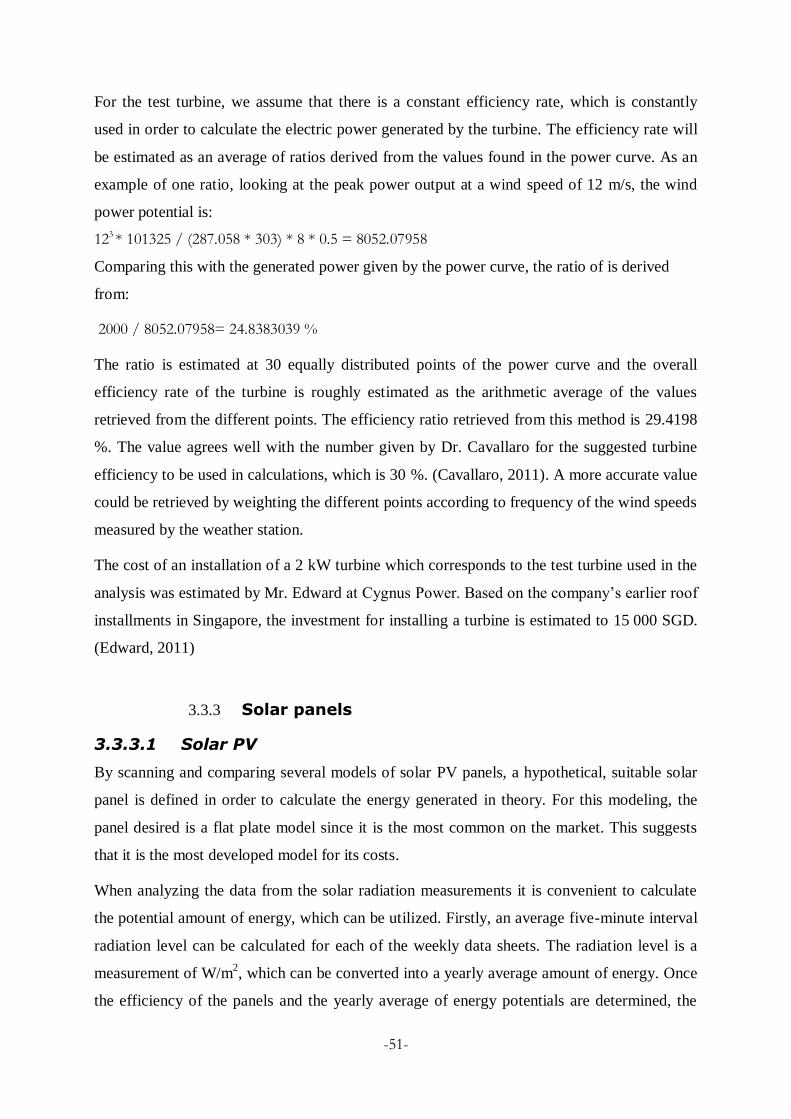
-51-
For the test turbine, we assume that there is a constant efficiency rate, which is constantly
used in order to calculate the electric power generated by the turbine. The efficiency rate will
be estimated as an average of ratios derived from the values found in the power curve. As an
example of one ratio, looking at the peak power output at a wind speed of 12 m/s, the wind
power potential is:
123 * 101325 / (287.058 * 303) * 8 * 0.5 = 8052.07958
Comparing this with the generated power given by the power curve, the ratio of is derived
from:
2000 / 8052.07958= 24.8383039 %
The ratio is estimated at 30 equally distributed points of the power curve and the overall
efficiency rate of the turbine is roughly estimated as the arithmetic average of the values
retrieved from the different points. The efficiency ratio retrieved from this method is 29.4198
%. The value agrees well with the number given by Dr. Cavallaro for the suggested turbine
efficiency to be used in calculations, which is 30 %. (Cavallaro, 2011). A more accurate value
could be retrieved by weighting the different points according to frequency of the wind speeds
measured by the weather station.
The cost of an installation of a 2 kW turbine which corresponds to the test turbine used in the
analysis was estimated by Mr. Edward at Cygnus Power. Based on the company‟s earlier roof
installments in Singapore, the investment for installing a turbine is estimated to 15 000 SGD.
(Edward, 2011)
3.3.3 Solar panels
3.3.3.1 Solar PV
By scanning and comparing several models of solar PV panels, a hypothetical, suitable solar
panel is defined in order to calculate the energy generated in theory. For this modeling, the
panel desired is a flat plate model since it is the most common on the market. This suggests
that it is the most developed model for its costs.
When analyzing the data from the solar radiation measurements it is convenient to calculate
the potential amount of energy, which can be utilized. Firstly, an average five-minute interval
radiation level can be calculated for each of the weekly data sheets. The radiation level is a
measurement of W/m2, which can be converted into a yearly average amount of energy. Once
the efficiency of the panels and the yearly average of energy potentials are determined, the

-52-
generated electricity from a panel is calculated by multiplying potential energy with the
efficiency of the panel, according to the formula
Therefore, a major factor considered when deciding which model to choose is the efficiency.
Since the disposable area for equipment is finite and the energy generation should be large
enough to meet the defined energy demands. The most favorable efficiency retrieved from
scanning multiple panels is 19.6 %.
There is a vast amount of solar panels available on the market today. There is as well a
diverse supply of different types of solar panels and different magnitudes. This means that it
is extremely important to define the desirable characteristics of the solar panel. After speaking
to the Dr. Jinesh Kochupurackal who is a Senior Research Fellow focused on solar PV
technologies it became evident that silicon solar PV was the type of solar panel most suitable
to our project and the system. Since the space available is limited in Singapore it was as well
essential to have solar panels with a high power output and high efficiency, thus minimizing
the amount of area being utilized. The price of the solar panels was also an exceptionally
important factor. These requirements scaled down the number of relevant and possible options
for solar PV panels.
Comparing companies shortened the list of acceptable solar panels down to three. The data
sheets for the solar panels were compared towards each other and the most suitable and
reliable solar panel system was offered by Sun Tech Corp who is the most established solar
panel company on the market. The impressively high power and unprecedented efficiency of
the solar panels was paramount to the other options. Even if the product is more expensive,
the company‟s experience and reputation as well as technical superiority outweighs the price
difference. Table 2 shows the comparison between the three most favorable solar PV panel
options, which are produced by Sunpower Corp. (SPC, 2011), Kyocera (Kyocera, 2011) and
REC Group (REC, 2011).

-53-
Table 2: Comparison of solar PV panels from different companies
The installation of solar PV panels from SunPower is done by a local solar PV installer. The
installer orders the solar panels needed from Sunpower Corp.„s production factory in the
Philippines. After adding up the solar panel and installation cost, the total implementation cost
reaches an amount of 116 690.25 SGD. Slightly more than half of the cost derives from the
actual solar panels. The rest consists of different installation costs. The total PV grid-tie
system consists of 40 panels each being 320 W, which accumulate to 12.8 kW, thus meaning
that the cost per kW is 9.17 SGD. Each panel costs 1 500 SGD, which amounts to a total cost
of 62 615 SGD. The installer provides 5 on grid inverters, which are 2500 W in size and cost
21 773 SGD in total. This price based on an installation of 66.5 m2 ends up being 1 754.74
SGD/m2 (Energy Plus, 2011).
The average price of solar modules has shown a steady decrease since the beginning of the
1990‟s. Figure 17 elucidates the price decrease in USD/W until 2009, which reached a price
of 2.79 USD/W. This data show that the average annual decrease in price was has been 3 %
from 1989 to 2009 (EIA, 2009).
The current average price has decreased even further since 2009. The Goldman Sachs Group
stated a current average price of 1.88 USD/W. All estimates imply that the price will continue
to decrease in the near future (Goldman Sachs Group, 2011). That would result in an average
annual price decrease of 4.5 % from 1989 to 2011.
This decrease in price is mainly due to an increase in competition and decrease in cost of
production as a result of technological advancements. If the Sunpower Corp.‟s panels follow
the historical average they will decrease to a price of 4 SGD/W in five years and 3.45 SGD/W
in ten years.
Company Sunpower Corp. Kyocera REC Group
Model E19/320 KD210GH-2PU REC245PEI
Peak Watt (Pmax) 320 Wp 210 Wp 245 Wp
Length 1559 mm 1500 mm 1690 mm
Width 1046 mm 990 mm 984 mm
Height 46 mm 46 mm 34 mm
Area 1.63 m^2 1.49 m^2 1.66 m^2
Generated power 196.23 W/m^2 141.41 W/m^2 147.59 W/m^2
Efficiency 0.196 0.141 0.148
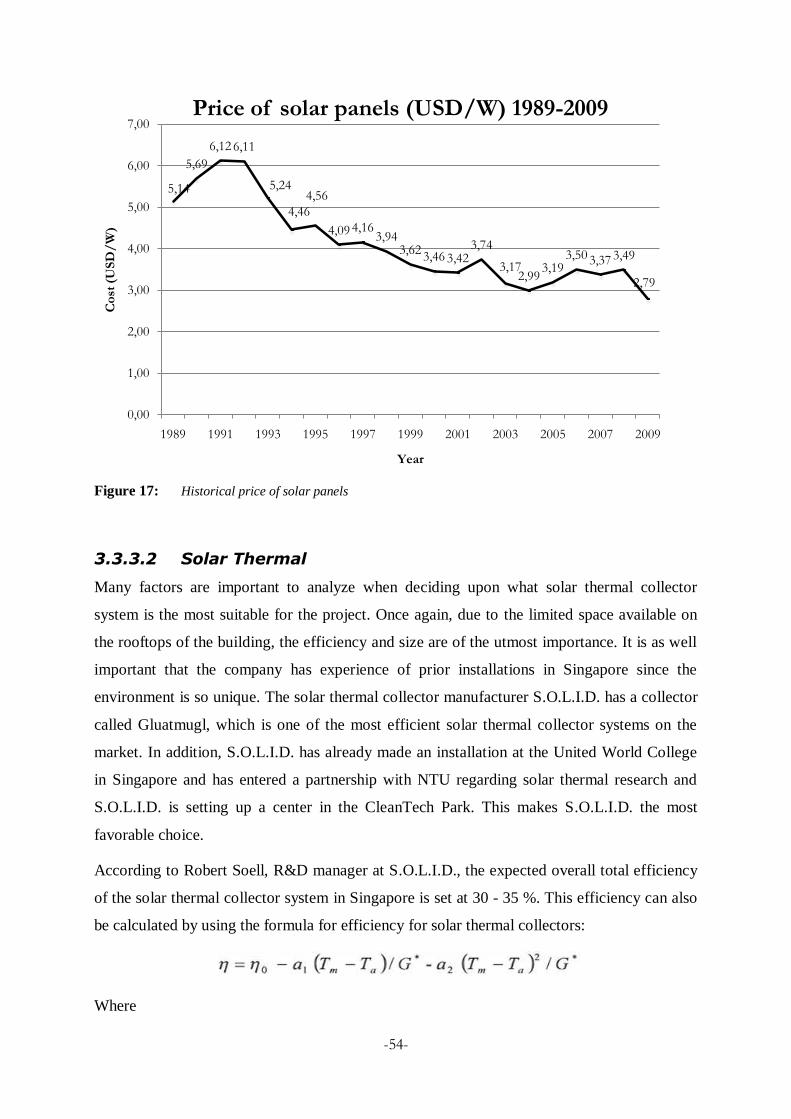
-54-
Figure 17: Historical price of solar panels
3.3.3.2 Solar Thermal
Many factors are important to analyze when deciding upon what solar thermal collector
system is the most suitable for the project. Once again, due to the limited space available on
the rooftops of the building, the efficiency and size are of the utmost importance. It is as well
important that the company has experience of prior installations in Singapore since the
environment is so unique. The solar thermal collector manufacturer S.O.L.I.D. has a collector
called Gluatmugl, which is one of the most efficient solar thermal collector systems on the
market. In addition, S.O.L.I.D. has already made an installation at the United World College
in Singapore and has entered a partnership with NTU regarding solar thermal research and
S.O.L.I.D. is setting up a center in the CleanTech Park. This makes S.O.L.I.D. the most
favorable choice.
According to Robert Soell, R&D manager at S.O.L.I.D., the expected overall total efficiency
of the solar thermal collector system in Singapore is set at 30 - 35 %. This efficiency can also
be calculated by using the formula for efficiency for solar thermal collectors:
Where
5,14
5,69
6,12 6,11
5,24
4,46
4,56
4,09 4,163,94
3,623,46 3,42
3,74
3,172,99
3,193,50 3,37 3,49
2,79
0,00
1,00
2,00
3,00
4,00
5,00
6,00
7,00
1989 1991 1993 1995 1997 1999 2001 2003 2005 2007 2009
Co
st (
US
D/
W)
Year
Price of solar panels (USD/W) 1989-2009

-55-
η0 = Conversion factor
a1 = heat loss coefficient (W/(m2K))
a2 = heat loss coefficient (W/(m2K))
Tm = mean temperature (K)
Ta = ambient temperature (K)
G = insolation level (W/m2)
When using the input parameters retrieved from the Gluatmugl GS specification received
from Mr. Soell (a1 = 4.073, a2 = 0.015, η0 = 0.809) and assuming the conditions of the DECS
and weather in Singapore (G = 500 W/m2, Tm = 323.15 K, Ta = 303.15 K) the resulting
efficiency is 32.67 %. However, the system does demand 220 kWh annually in order to pump
the water through the system. There is a substantial cost of purchasing the complete system.
Out of the total amount, about 43 800 SGD comes from fixed costs. Additionally, each m2 of
the solar thermal collector system has a price of around 270 SGD (AIT, 2009)
The fixed cost includes installation of the entire system, i.e. panels and system components
such as control unit, pipes, and chiller. There are no additional costs of maintenance of the
system.
3.3.4 Site analysis
It is important to analyze the current situation, the location, surrounding environment and size
of the reference building as well as the conditions of the TABS & DECS project which all
have a significant effect on the feasibility of installing a system with solar and wind power
products. Since solar PV panels, solar thermal collectors and small VAWT have a limited
ability of producing energy it is essential to define a reference building.
The CleanTech Building is situated on the NTU campus at the CleanTech Park on Nanyang
Avenue at the northern entrance. It is separated from the rest of the campus and is fairly
secluded. It is placed in such a way that it does not affect others. It lies beside a forest yet still
in located in an open area. Figure 18 provides an overview of the CleanTech Park.
The test building is assumed to be a commercial building. The cooling load required for a
commercial building depends on many variables, such as the type of building, the operations

-56-
that are carried out inside the building, the amount of time the building is in operation and the
amount of people inside the building. There are also various types of modeling software
programs that can be used to calculate the cooling load. Since the main goal of this thesis is
not to make an exact model of the building, but merely to look at how well the cooling
demand of a commercial building can be satisfied by the defined cooling system, the
dimensions and required cooling loads are estimates from earlier studies. According to Mr.
Seshradi who is currently a project officer on the test-bedding project regarding TABS and
DECS in Singapore, carried out at NTU, the commercial buildings in Singapore require a
sensible cooling load around 120 W/m2 and a latent cooling load of about 20 W/m
2. A
sensible cooling load means the energy exchanged that can be observed as a change of
temperature, while latent cooling refers to the amount of energy exchanged that doesn‟t result
in any temperature change. With the right design and efficient building envelope, it is possible
to reduce the required sensible load to 100 W/m2, which will be the figure counted on in this
model (Seshradi, 2011). The entire area is used for allocation of generating equipment on the
rooftop, with an exception for 10 m2 for the dispensing of necessary components of the AHU.
Initial calculation will be carried out for a cooling system, which runs for 12 hours per day.
Figure 18: CleanTech Park at NTU (GEM, 2011)
3.3.5 Output from TABS & DECS
The most of the earlier defined demanded cooling load will be met by the TABS, integrated in
the ceiling. The TABS has an expected cooling load of 70 W/m2. This entire cooling load is

-57-
sensible. The DECS is implemented to handle the remaining required sensible cooling load
and the entire latent cooling load. The latent cooling load derives from dehumidification,
which takes place in the desiccant wheel. The energy needed for this process is simply the
thermal energy required to heat the air that exits the heat exchanger and enters the desiccant
wheel to the required regenerating temperature in order to regenerate the desiccant. The
sensible energy input to generate the sensible cooling load of 30 W/m2 from the DECS equals
and the electricity that is required for running the fans and the pumps for the humidifiers. The
entire cooling load from the TABS is derived from electrical work load for pumping the cold
water through the pipes (Seshradi, 2011).
The relationship between contributed work and resulting cooling load is expressed by the
following equation:
Where:
COP = Coefficient of Performance for cooling
QC = Cooling load
W = Working load
Based on earlier tests in similar conditions, the thermal COP in the DECS is estimated to 0.66
(Wang et. al., 2011) and the electrical COP is set to be 5.3 in the DECS (Jalalzadih-Azar et.
al., 2004). The overall COP for the TABS is comprised by a chiller and a cooling tower. The
overall COP of the chiller and the cooler tower is normally between 3 and 5, depending on the
circumstances. An appropriate value to assign the COP in this case is 4.0 according to Mr.
Narendra, who is a project officer on the test-bedding project regarding TABS and DECS at
NTU (Narendra, 2011). Figure 19 illustrates how the DECS and TABS are powered by the
wind and solar power.

-58-
Figure 19: How the harnessed energy from solar and wind power is used to power the TABS and DECS
3.3.6 Parameters from geography weather station:
The weather station, which is located at the NUS, offers a database with measurements
relevant to the thesis. The data is collected from the homepage of Geography Weather Station
at NUS. The station is located near the Southwest coast of Singapore, approximately nine
kilometers from the city center at height of ca 90 m above the sea level and therefore receives
superb exposure. The measurements most relevant to this thesis are wind speeds measured by
a cup anemometer in m/s with an accuracy of +/- 0.5 m/s as well as incoming solar radiation
measured by a pyranometer in W/m2 at an accuracy of +/- 3 %. This data is recorded every
five minutes and can be viewed on a graph as well in an excel workbook. The graphs bellow
show data collected with five-minute intervals for March 4, 2011 (GWS, 2011).
Solar power
Wind power
Electric power
in TABS and
DECS
Wind turbine
Solar PV
Solar thermal
Thermal power
in desiccant wheel

-59-
4 Results
The results that are retrieved from the model are presented in this chapter.
4.1 Solar PV
When analyzing the economic viability of investing in solar PV panels it is sensible to start by
looking at the net value of the investment for each year without factoring in the inflation or
the return on investment, which can be done by using the payback method. Seeing how
maintenance is included in the initial investment each year acquires a return equivalent to the
amount of income received from value of electricity that is needed. Figure 20 displays the net
value for each year if the initial scenario is considered. The graph does as well show that the
investment will take about 20 years to break even.
Figure 20: Payback period of solar PV for initial conditions
The average level of energy absorbed from the sunlight per square meter at the NUS weather
station in 2009 and 2010 turned out to be 1 312 kWh/m2. This gives the panels a generation
capacity of 257 kWh/m2 annually. The price of total generated electricity every year is shown
in Figure 21. The price of electricity generated from solar PV panels is initially approximately
7 SGD/kWh. The price drops as more electricity is generated over time the price decreases
-1800,00
-1400,00
-1000,00
-600,00
-200,00
200,00
600,00
1000,00
1400,00
1800,00
2200,00
2600,00
3000,00
3400,00
3800,00
0 2 4 6 8 10 12 14 16 18 20 22 24 26 28 30 32 34 36 38
Net
valu
e (
SG
D/
m2)
Year
Payback period, solar PV(Initial condition)

-60-
slower as the amount of income from each year becomes smaller in relation to the net income,
which already is accounted for.
Figure 21: Price of total generated electricity from solar PV since installation
The result from the net present value method based on the initial conditions is presented in
Figure 22. When calculating the net present value of the investment it is important to define
the required return on investment. In this case it is set at 5.0 % as mentioned earlier. When
factoring in the electricity price, cost of investment and amount of electricity produced, the
net present value can easily be calculated for each year. The payback time can be
distinguished as 39 years according to the graph.
0
0,5
1
1,5
2
2,5
3
3,5
4
4,5
5
5,5
6
6,5
7
7,5
1 3 5 7 9 11 13 15 17 19 21 23 25 27 29 31 33 35 37 39
Pri
ce (
SG
D/
kW
h)
Year
Price of electricity from solar PV

-61-
Figure 22: Net present value of solar PV for initial conditions
4.2 Wind power
Resulting graphs from calculating payback period on investment and net present value for
wind turbines according to section 3.5 are shown in Figure 23 and Figure 24 respectively. The
payback period on investment is 59 years and the net present value by the end of the life span
is approximately -13 000 SGD.
-1800,00
-1600,00
-1400,00
-1200,00
-1000,00
-800,00
-600,00
-400,00
-200,00
0,00
200,00
0 2 4 6 8 10 12 14 16 18 20 22 24 26 28 30 32 34 36 38
Net
pre
sen
t va
lue (
SG
D/
m2)
Year
Net present value, solar PV(Initial condition)

-62-
Figure 23: Payback period of test turbine
Figure 24: Net present value of test turbine
4.3 The Building
In order to optimize the available area of the roof, which was earlier mentioned to be
restricted to 200 m2, the sensible cooling load was first tested to be satisfied by solely solar
PV. This resulted in the following installed areas:
-16000
-14000
-12000
-10000
-8000
-6000
-4000
-2000
0
2000
1 3 5 7 9 11 13 15 17 19 21 23 25 27 29 31 33 35 37 39 41 43 45 47 49 51 53 55 57 59
Net
valu
e (
SG
D)
Year
Payback period, Test turbine
-15000
-14800
-14600
-14400
-14200
-14000
-13800
-13600
-13400
-13200
-13000
1 2 3 4 5 6 7 8 9 10 11 12 13 14 15 16 17 18 19 20 21 22 23 24 25
Net
pre
sen
t va
lue (
SG
D)
Year
Net present value, Test turbine

-63-
Installed area of solar PV: 79.33 m2
Installed area of solar thermal: 67.44 m2
When trying to satisfy the sensible cooling load by using only wind power, the installed area
of solar thermal obviously remained unchanged but the required installed area of wind
turbines could be calculated to 326.1 m2, which makes the wind turbines insufficient for
powering the cooling system. However, the wind turbines can instead be used as a
complementary power source, which is to be used when the solar PV panels are not able to
power the system entirely.
When installing 79.33 m2 of solar PV panels, 67.44 m
2 of solar thermal collectors and the
remaining roof area of wind turbines, the cost of generated energy for each installation can be
illustrated with the curves in Figure 25. The figure also shows the total cost of electricity,
which after 25 years is 0.16 SGD/kWh. The calculations made in EES are presented in
Appendix A.
Figure 25: Cost of generated energy from different sources
0 5 10 15 20 25 300,0
0,2
0,4
0,6
0,8
1,0
1,2
1,4
1,6
1,8
2,0
2,2
2,4
2,6
2,8
3,0
3,2
3,4
3,6
3,8
4,0
4,2
4,4
4,6
4,8
5,0
Year
Co
st/k
Wh
(S
GD
/kW
h)
SGD/kWh Total
SGD/kWh Solar PVSGD/kWh Solar PV
SGD/kWh Solar ThermalSGD/kWh Solar Thermal
SGD/kWh Wind PowerSGD/kWh Wind Power
Cost of electricity

-64-
5 Sensitivity analysis
In order to take margin of errors and alternative scenarios into account, a sensitivity analysis
will be presented in this chapter. This is carried out by looking at how the results from our
model differ as the variables alternate, which gives a better understanding of how changes
may have an impact on financial and practical feasibility.
5.1 Solar PV
Figure 26 displays the amount of electricity which a solar panel with an efficiency rate of 19.6
% is capable of generating per square meter every year depending on the amount of solar
irradiance which is absorbed. The graph shows the amount of electricity in relation to the
variation of the solar irradiance. This is important seeing how the solar irradiance measured at
the weather station is lower than the actual solar irradiance since the measurement instrument
was installed ten years ago and has suffered from degradation over the years. At the same
time the weather conditions are volatile and could result in less favorable solar irradiance
levels as a result of worsened weather conditions. Therefore, it is important to look at both a
decrease and increase in solar irradiance. This can be used when looking at how a change in
the amount of generated solar electricity affects the feasibility of solar PV panel installations.
Figure 26: Electricity generated from solar PV at different levels of irradiance
200,00
210,00
220,00
230,00
240,00
250,00
260,00
270,00
280,00
290,00
10%5%4%3%2%1%0%-1%-2%-3%-4%-5%-10%
En
erg
y g
en
era
ted
(k
Wh
)
Variation in annual solar irradiance
Power generated when varying irradiance levels
Annual energy generated from panel with 19.6 % efficiency

-65-
Because of the reasons stated above, a sensitivity analysis is substantially important so as to
examine the impact that a change in solar irradiance has on the results from the net present
value method. Figure 27 exhibits the comparison between different levels of solar irradiance.
In a report from SERIS they state that Singapore has an average annual solar irradiance of 1
634 kWh/m2. If this amount of solar irradiance is used in the calculation of net present value
for the investment, the time it takes to reach the required return on investment is shortened by
around 10 years. Since the measurement instrument has experienced degradation it is possible
that the solar irradiance is in fact higher than the measured amount, thus shortening the time it
takes to reach the required return on investment. A 10 % increase in solar irradiance
compared to the level measured at the weather station implies that the return on investment is
met five years earlier than the time calculated for initial conditions. At the same time, if the
level of solar irradiance decreases by 10 % the investment results in a net loss of
approximately 150 SGD/m2 after 40 years.
Figure 27: Calculated Net present value for different levels of irradiance
-900,00
-800,00
-700,00
-600,00
-500,00
-400,00
-300,00
-200,00
-100,00
0,00
100,00
200,00
300,00
400,00
500,00
20 22 24 26 28 30 32 34 36 38 40
Net
pre
sen
t va
lue (
SG
D/
m2)
Year
Net present value of solar PV (Solar irradiance comparison)
Solar irradiance from solar station10 % decrease of solar irradiance10 % increase of solar irradianceSingapore average solar irradiance

-66-
Sensitivity of the electricity generation due to degradation using the National Renewable
Energy Laboratory standards and Sandia standards is shown in Figure 28. According to the
study carried out by NREL the annual average level of degradation for solar panel efficiency
is 0.7 %. The results from Sandia‟s study indicate that the level of degradation is 0.5 %, which
puts them at similar levels.
Figure 28: Sensitive analysis of generated electricity with degradation as variable
Figure 29 is retrieved if degradation is accounted for and both levels of degradation are
compared when calculating the net present value of the investment. The new slopes do not
diverge significantly from the slope of the initial scenario. The graph reveals that the
degradation does not have a significant affect on the time it takes to break even.
190
200
210
220
230
240
250
260
270
1 2 3 4 5 6 7 8 9 10 11 12 13 14 15 16 17 18 19 20 21 22 23 24 25
En
erg
y g
en
era
ted
(k
Wh
)
Years
Annuly generated energy when applying standards of degradation
Sandia
NREL

-67-
Figure 29: Net present value of the investment when accounting for different levels of degradation
In the near future, the efficiency of solar PV panels is assumed to continue increasing in
efficiency. Companies have already managed to attain efficiency at levels above 22 % and are
planning on implementing the products on the commercial market as soon as possible. Figure
30 shows how much electricity can be utilized when increasing the efficiency.
-1800,00
-1600,00
-1400,00
-1200,00
-1000,00
-800,00
-600,00
-400,00
-200,00
0,00
200,00
0 2 4 6 8 10 12 14 16 18 20 22 24 26 28 30 32 34 36 38 40
Net
pre
sen
t va
lue (
SG
D/
m2)
Year
Net present value, solar PV(Accounting for degradation)
NREL
Sandia

-68-
Figure 30: Amount of electricity generated from different levels of efficiency
Bearing in mind that improvements in the level of efficiency are still being achieved it is
essential that the sensitivity analysis includes a comparison and evaluation of how different
levels of efficiency change the time it takes to reach the required return on investment. Seeing
how these levels of efficiency have already been achieved and are soon to be introduced to
consumers on the commercial market the results are quite noteworthy. Being able to shorten
the time it takes to break even by seven years can be considered an astonishing advancement.
Figure 31 illustrates the change in net present value due to changes in panel efficiency.
240
250
260
270
280
290
300
22,6%22,1%21,6%21,1%20,6%20,1%
Energy (kWh)
Efficiency
Energy generated from solar panel when improving efficiency
Annual energy generated from panel with 19.6% efficiency

-69-
Figure 31: Net present value of solar PV investment when altering the efficiency rate.
Future improvements in product development and large-scale commercialization are likely to
keep driving down the price of solar PV panels. Figure 32 depicts the effect that different
levels of annual price decrease have on the price of solar PV panels. The decrease in price
becomes more significant further on into the future. Moreover, Figure 33 shows how the
change in price after one year affects the time it takes to achieve the required return on
investment. The difference is already evident after one year and will only increase looking
further into the future. This implies that by waiting a certain amount of years the time it takes
to achieve the required return on investment will be shortened substantially.
-800,00
-700,00
-600,00
-500,00
-400,00
-300,00
-200,00
-100,00
0,00
100,00
200,00
300,00
400,00
20 22 24 26 28 30 32 34 36 38 40
Net
pre
sen
t va
lue (
SG
D/
m2)
Year
Net present value, Solar PV(panel efficiency comparison)
19.6 % efficiency
20.6 % efficiency
21.6 % efficiency
22.6 % efficiency
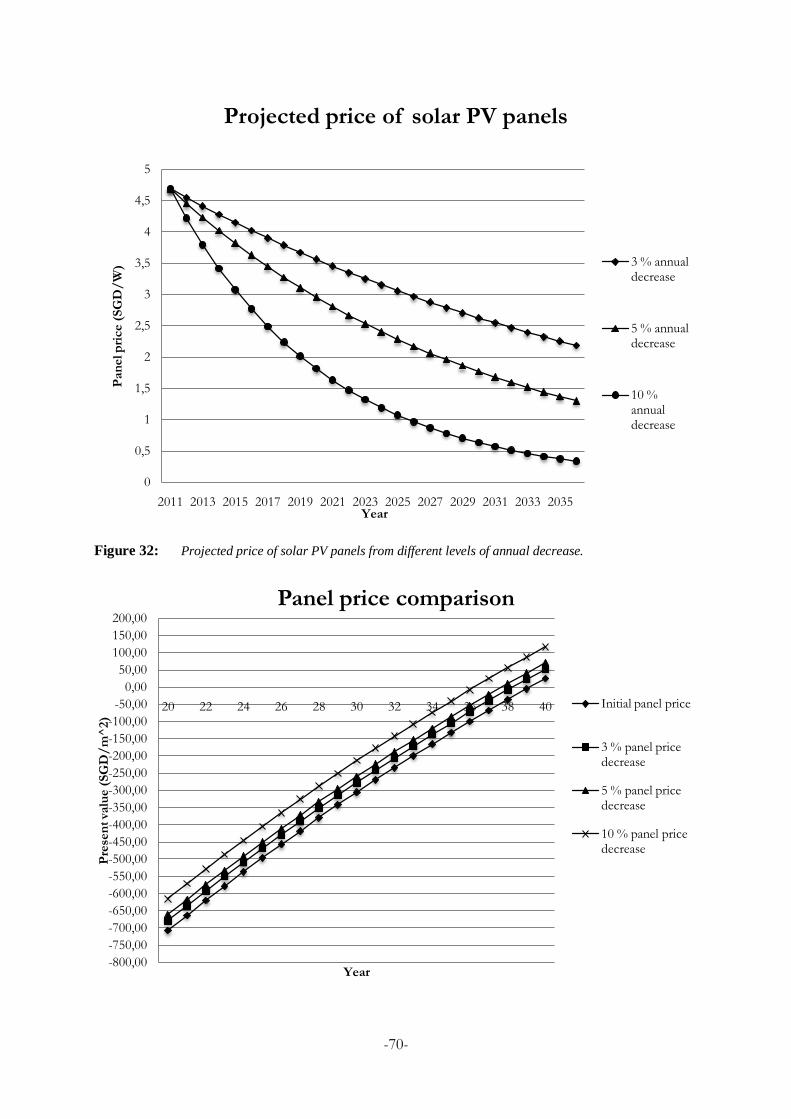
-70-
Figure 32: Projected price of solar PV panels from different levels of annual decrease.
0
0,5
1
1,5
2
2,5
3
3,5
4
4,5
5
2011 2013 2015 2017 2019 2021 2023 2025 2027 2029 2031 2033 2035
Pan
el p
rice (
SG
D/
W)
Year
Projected price of solar PV panels
3 % annual decrease
5 % annual decrease
10 % annual decrease
-800,00
-750,00
-700,00
-650,00
-600,00
-550,00
-500,00
-450,00
-400,00
-350,00
-300,00
-250,00
-200,00
-150,00
-100,00
-50,00
0,00
50,00
100,00
150,00
200,00
20 22 24 26 28 30 32 34 36 38 40
Pre
sen
t va
lue (
SG
D/
m^
2)
Year
Panel price comparison
Initial panel price
3 % panel price decrease
5 % panel price decrease
10 % panel price decrease

-71-
Figure 33: Net present value of solar PV panels when comparing different levels of price decrease.
The price development of conventional grid electricity tariff affects the income levels to a
greater extent than other parameters as the increase grows exponentially over the years.
Figure 34 illustrates this evidently as the 10 % increase in tariff price results in substantially
shortening the time it takes to meet the return on investment rate, which is cut in half. Thus,
the change in price of the electricity tariff has considerable impact.
Figure 34: Net present value of solar PV investment when comparing different levels of annual increase in
electricity tariffs
In 2018, part 2 of the CleanTech Park project will commence and construction of CleanTech
Two will be initiated. It is interesting to forecast how the characteristics of solar PV panels
will have changed. If the projections of how the features of solar PV panels will develop are
correct, an interesting scenario can be depicted. Figure 35 demonstrates how the payback on
-3000,00
-2000,00
-1000,00
0,00
1000,00
2000,00
3000,00
4000,00
5000,00
1 3 5 7 9 11 13 15 17 19 21 23 25 27 29 31 33 35 37 39 41Pre
sen
t va
lue (
SG
D/
m^
2)
Year
Net present value when altering increase of conventional grid electricity price
2.98 % increase
5 % increase
7 % increase
9 % increase

-72-
investment will progress. This scenario uses the price calculated using the 3 % decrease
annually, which arrives at 3.79 SGD/W by 2018. The price decrease comes as a result of cost
reduction of production and advancements in efficiency of the solar PV panels and is based on
historical data. The scenario is as well based on the supposition that Singapore adopts a
subsidy plan for solar energy comparable to the version which China implemented, where the
total installation cost is reduced to half of the original cost. The scenario factors in the
benefits of implementing such a subsidy program, which cuts the total cost of installation to
805.04 SGD/m2. The time it takes the solar PV installation to attain its required return on
investment is shortened significantly in this scenario, as the requirement is attained after just
nine years.
Figure 35: Projected net present value of solar PV panels if investment made in 2018
5.2 Wind turbines
With improved technology in the wind turbines, even more power could be harnessed from
the wind. One of the improvements would be if the cut-in speed of the test turbine could be
lowered to 2 m/s. Furthermore, if lowering the nominal wind speed to 10 m/s and adjusting
the previously used power curve for these parameters, the achieved result is a higher overall
efficiency of the turbine. Figure 36 depicts a theoretical power curve for an alternative test
turbine, which has a rated capacity of 2 kW, cut-in speed of 2 m/s and nominal speed of 10
m/s. The figure also includes a curve of the potential aero dynamic power that can be
harnessed from the wind at different wind speeds. By decreasing the nominal wind speed, the
curve becomes skewed to the left, which gives the turbine higher efficiency for lower wind
-1000,00-800,00-600,00-400,00-200,00
0,00200,00400,00600,00800,00
1000,001200,001400,001600,001800,00
0 2 4 6 8 10 12 14 16 18 20 22 24 26 28 30 32 34 36 38 40
Net
pre
sen
t va
lue (
SG
D/
m2)
Year
Net present value method, solar PV(Investment in 2018)

-73-
speeds.
Figure 36: Power curve of alternative test turbine and wind power potential for different wind speeds
The overall efficiency based on the power curve is estimated to 43.57 % and if assuming the
same wind conditions as for the other test turbine, the annually generated power is about 574
kWh. Figure 37 shows the payback time for the two test turbines as well as two turbines
assumed to generate 100 % and 200 % more electricity than the initial tested turbine
respectively. The figure shows that the generated electricity needs to be at least 200 % more
than for the first test turbine in order to have a positive net value within the expected life span.
Figure 38 shows the net present value of the investment for the different turbines, based on
the same initial cost, expected return on investment and electricity tariffs as for the first test
turbine.
0
500
1000
1500
2000
2500
3000
0,0 0,0 2,4 3,0 3,5 4,1 4,7 5,3 5,9 6,5 7,1 7,7 8,2 8,8 9,4 10,010,611,2
Gen
era
ted
po
wer
(W)
Wind speed (m/s)
Power curve, alternative test turbine
Wind power potential
Power from turbine

-74-
Figure 37: Payback period for turbines with different amount of generated power.
Figure 38: Net present value of turbines with different amount of generated power.
The graph in Figure 39 projects the net present value of the original test turbine over the
expected life span with the increase of the conventional grid electricity tariff as the only
altering parameter. The figure indicates that although the curve makes a significant shift due
to the altered tariffs, the tariff would need to be increased far more than 9 % annually in order
for an investment in a small wind turbine to pay off.
-16000
-14000
-12000
-10000
-8000
-6000
-4000
-2000
0
2000
1 6 11 16 21 26 31 36 41 46
Net
valu
e (
SG
D)
Payback time
200 % increased output
100 % increased output
Test Turbine 2
Test Turbine 1
-16000
-15000
-14000
-13000
-12000
-11000
-10000
-9000
-8000
-7000
1 2 3 4 5 6 7 8 9 10 11 12 13 14 15 16 17 18 19 20 21 22 23 24 25
NP
V (
SG
D)
Year
Net present value, Test Turbine 2
200 % increased output100 % increased outputTest turbine 2
Test Turbine 1
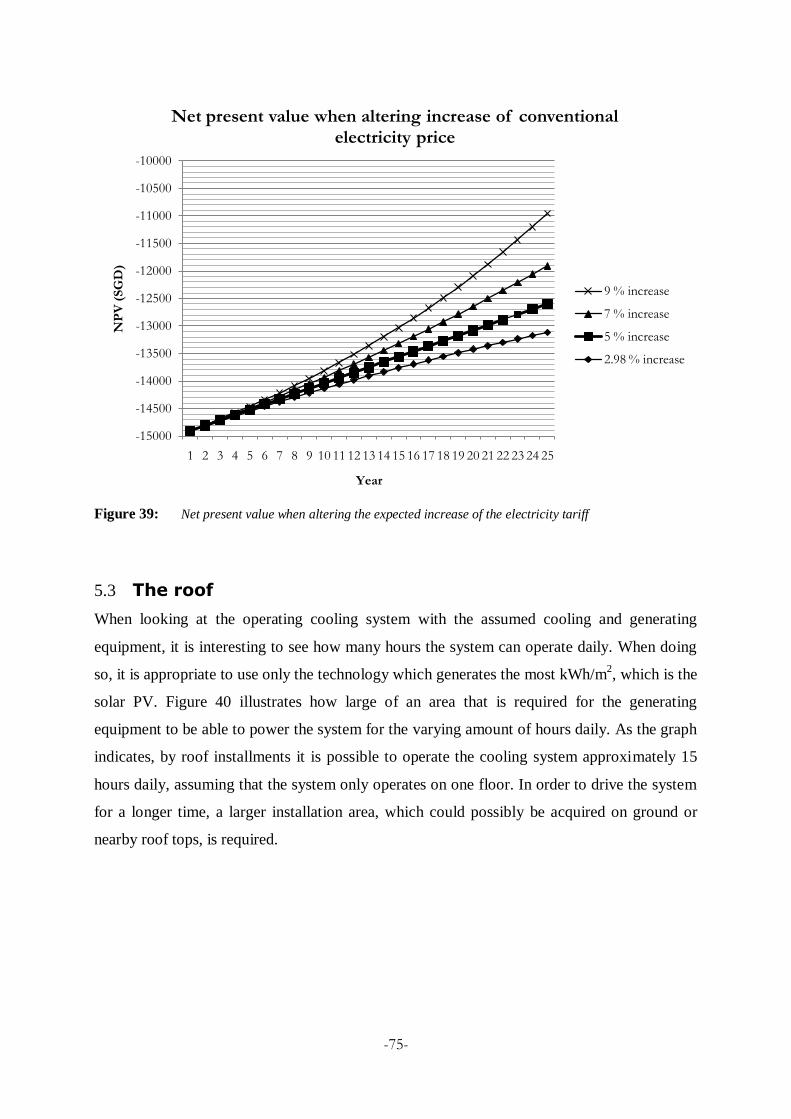
-75-
Figure 39: Net present value when altering the expected increase of the electricity tariff
5.3 The roof
When looking at the operating cooling system with the assumed cooling and generating
equipment, it is interesting to see how many hours the system can operate daily. When doing
so, it is appropriate to use only the technology which generates the most kWh/m2, which is the
solar PV. Figure 40 illustrates how large of an area that is required for the generating
equipment to be able to power the system for the varying amount of hours daily. As the graph
indicates, by roof installments it is possible to operate the cooling system approximately 15
hours daily, assuming that the system only operates on one floor. In order to drive the system
for a longer time, a larger installation area, which could possibly be acquired on ground or
nearby roof tops, is required.
-15000
-14500
-14000
-13500
-13000
-12500
-12000
-11500
-11000
-10500
-10000
1 2 3 4 5 6 7 8 9 10 11 12 13 14 15 16 17 18 19 20 21 22 23 24 25
NP
V (
SG
D)
Year
Net present value when altering increase of conventional electricity price
9 % increase
7 % increase
5 % increase
2.98 % increase

-76-
Figure 40: Installed area of different power generating equipment
6 8 10 12 14 16 18 20 22 240
20
40
60
80
100
120
140
160
180
200
220
240
260
280
300
System running time/day (h)
Ins
tall
ed
are
a (
m2)
Installed Area
Installed solar PVInstalled solar PV
Installed solar thermalInstalled solar thermal
Installed area totalInstalled area total

-77-
6 Conclusion
The purpose of this thesis has been to carry out financial and practical feasibility studies for
the installation of solar PV panels and wind turbines in order to power an integrated cooling
and air handling system consisting of TABS and DECS. The system might have the potential
to replace conventional air-conditioning systems in Singapore, which would result in a
significant decrease in energy demand for cooling loads in buildings in Singapore. Thus, a
functional integrated system that is powered by renewable energy sources would improve the
sustainability of Singapore‟s energy system.
6.1 Financial feasibility studies
The net present value method was used to calculate the present value of the investment for the
different technologies over their life span. The assumed discount rate for the investment was
estimated as an expected return on the investment, taking risk free rate and risk premium into
account. When having a discount rate larger than the predicted annual increase of the
electricity tariff, the income will decrease for each year. Moreover, if the increase of the
electricity tariff exceeds the discount rate, an increased annual income will occur. Thus, these
figures have a large impact on the profitability of the investment and an increase of the
discount rate will have the same effect as a decrease of the expected electricity tariff. The
reliability of the risk premium included in the modeling is hard to valuate since there are few
investing alternatives to use for comparison and it is difficult to evaluate each factor that
affects the risk. The expected annual increase of the electricity tariff is as defined in the
model, based on historical figures and it was estimated to be 2.98 %. Due to the complexity of
determining the electricity tariff, the reliability of this figure is uncertain. Factors that affect
the tariff, such as governmental regulations and the price of crude oil are difficult to calculate.
In the initial calculations, the discount rate is assumed to be higher than the increase of
electricity tariffs. As a result, the declining value of income generated from the electricity
affects the technologies differently.
6.1.1 Solar PV
Based on the results from the calculated payback period, generating electric power by
installing solar PV appears to be feasible because the accumulated income will exceed the
initial investment before the end of the expected life span. However, when taking the

-78-
expected return on investment into account the net present value method suggests that the
investment is not financially feasible. Figure 33 that shows the effect of altering the assumed
increase of conventional grid electricity tariffs suggests that the profitability of solar PV is
highly affected by this variable. The improved efficiency and decreasing costs of the panels
also have measureable impact. Yet, the factor which would impose the most triggering effect
on the profitability of solar PV panels, thus attracting investments into the products is
substantial governmental subsidies. Without such an intervention solar PV panels will remain
financially non-feasible in near future.
6.1.2 Wind power
As previously stated in the thesis, the wind conditions in Singapore are not favorable for the
utilization of wind turbines. This is also the conclusion that can be drawn from the financial
feasibility study. The accumulated income from an installed wind turbine does not even cover
14 % of the initial investment and sensitive analysis show that the when assuming an annually
generated electric energy that is three times larger than the calculations predict, the
accumulated income still only covers about 50 % of the initial investment. Precisely as in the
case of solar PV, the electricity tariff has a major impact on the financial feasibility of
utilizing wind power but even in the best case scenario the technology is still not close to
being profitable. However, if technology improves considerably for harvesting wind power at
even lower wind speeds with a higher efficiency, which seems to be an emerging trend on the
wind turbine market, this might be a future potential for electric power generation even in
Singapore.
6.2 Running TABS and DECS on renewable energy sources
The suitability of relying on solar PV, wind turbines and solar thermal for the powering of
TABS and DECS was estimated as well. For the model, the assumed conditions are that all
electric and thermal power that is generated will also be seized by the cooling system. Thus,
there will be no excessive power at any time and the generated power is evenly distributed
throughout the time that the system is operating, which means that it can be powered during
the entire time that it is operating. With these conditions, the results show that the cooling
system could be powered for 16 hours per day, which should be considered a reasonable
amount of time considering that a commercial building is normally only used during regular
-79-
working hours, which can be assumed to be between 8 a.m. and 6 p.m., i.e. 10 hours per day.
Based on assumed costs, this solution would be financially profitable as well since the price
of the generated energy was lower than the conventional grid power when counting on a life
span of 25 years. Wind turbines were due to the relatively small amount of generated energy
not optimal for powering the system but might be used as a complimentary source of power if
there is enough space and funding available. Solar PV however proved to be a reliable
provider of electricity for the cooling system. The solar thermal collector was due to its
efficiency and low cost the most reliable resource of energy. Based on the results, the solar
thermal collector could heat the desiccant wheel to the required regenerating temperature for
24 hours per day by using approximately 130 m2 of the roof. The solar thermal collector is not
an efficient electricity generator, which means that it would not be able to provide the system
with electricity.
In reality, however, the conditions are different since the energy is normally not generated
evenly throughout the day. For some periods of time, a surplus of energy will be generated,
while other times there will be a shortage of energy. Therefore, without a more thorough
study of potential energy storage and grid connection of the system, estimating the reliability
of this technology is much more complex in practice than what is suggested in theory.
6.3 Recommendations for future study
Reflecting upon the research findings, which briefly introduce alternative technologies
regarding solar PV, it would be interesting to further analyze the potential of PV technologies
such as gallium indium phosphide (GaInP) and gallium arsenide (GaAs) cells and copper-
based thin film cells, such as CuInSe2 and CuInS2. The GaInP and GaAs cells are particularly
fascinating due to the extremely high efficiency rates, which can be reach levels above 30 %.
However, the GaInP and GaAs cells are currently unfavorable seeing how they are too
expensive and cannot be competitive in the commercial market. At the NUS research is being
conducted with regards to lowering the cost of GaInP and GaAs cells. The copper-based cells
are on the contrary financially more appealing. Unfortunately their efficiency has not yet
reached a competitive state. While interviewing Dr. Jinesh we were informed about the
progressive research, which is taking place at ERI@N concerning the possible improvement
of efficiency rates for copper-based cells.

-80-
With regards to TABS and DECS it would be recommended to further study the exact amount
of energy that can be saved by implementing the system as an alternative to air-conditioning
systems in Singapore. Seeing how the system has actually never been implemented in
Singapore before this is difficult to determine in exact terms. It would therefore be extremely
interesting to see the results from a study carried out on an actual implementation. Since there
is a plan to implement the system in the future a study will certainly be conducted when the
time comes. Furthermore, it would be intriguing to retain an estimate of how much the actual
appliances would cost if they were to be installed compared to an air-conditioning system. In
order to further develop the scope of such a project it would be exciting and rewarding if a
study would be initiated in order to estimate the amount of carbon dioxide emissions which
could be reduce in total by replacing air-conditioning systems with the integrated TABS and
DECS system.

-81-
6.4 References
AIT (2009). Test Report – Thermal performance testing of a solar collector according to EN
12975:2006, Austrian Institute of Technology (AIT), available at http://www.solid.at,
retrieved 2011-05-01
ASHRAE (2009), American Society of Heating Refrigerating Air-Conditioning Engineers
“HVAC Energy Efficiency – Challenges & Opportunities”, available at
http://www.ashrae.org.sg, retrieved 2011-04-24
Brychta M.(2011), Member of Energy Department, Sustainable Building Technologies, AIT,
interview 2011-02-13
BWEA (2008), British Wind Energy Association Briefing Sheet, available at
http://www.bwea.com, retrieved 2011-02-23
Cace J., Horst E., Syngellakis K., Niel M., Clement P. Heppener R., Peirano E. (2010), Small
Wind Turbines, available at http://www.urban-wind.org, retrieved 2011-02-15
Cavallaro G. (2011), Senior Scientist at the Energy Research Institute @ NTU (ERI@N),
Interview 2011-03-29
CREM (2011), Conservation Renewables Energy Management, available at http://www.crem-
ltd.com, retrieved 2011-04-12
Cygnus (2011), Cygnus Power, available at http://cygnuspower.com, retrieved 2011-04-13
E2 (2011), E
2 Singapore, available at http://www.e2singapore.gov.sg, retrieved 2011-04-12
El-Samanoudy M., Ghorab A.A.E., Youssef Sh.Z (2010), Effect of some design parameters
on the performance of a Giromill vertical axis wind turbine, Ain Shams Engineering Journal
EDB (2010), “JTC and EDB unveil masterplan for CleanTech Park”, available at
http://www.edb.gov.sg, retrieved 2011-03-01
EIA (2009), Annual Energy Review 2009, available at http://www.eia.doe.gov, retrieved
2011-05-01
EMA (2010), EMA Annual Report 2009/2010, available at http://www.ema.gov.sg, retrieved
2011-02-20
EMA (2009), How is Electricity Tariff Determined, available at http://www.ema.gov.sg,
retrieved at 2011-02-26

-82-
Energy Vortex (2011), available at http://www.energyvortex.com, retrieved 2011-02-26
ERI@N (2011), Energy Research Institute at NTU, Professor Seri Lee, interview 2011-02-25
ETP (2011), European Technology Platform for the Electricity Networks of the Future,
available at http://www.smartgrids.eu, retrieved 2011-04-14
Fingersh L., Hand M., Laxson A. (2006), Wind Turbine Design Cost and Scaling Model,
available at http://www.nrel.gov, retrieved 2011-02-23
Höfker G., Eicker U., Lomas K., Eppel H. (2001), Desiccant Cooling with Solar Energy,
available at http://www.cibse.org, retrieved 2011-02-14
GEM (2011), Godwyn Environment Management, “JTC unveils cleantech building”,
available at http://www.godwyngroup.com, retrieved 2011-05-27
Gooi H. B. (2011). Professor at NTU, School of Electrical & Electronic Engineering, personal
interview, 2011-03-17
Goldman Sachs Group (2011), Clean Energy: Solar, available at
http://www2.goldmansachs.com, retrieved 2011-05-02
Gwerder M., Tödtli J. Lehmann B., Renggli F., Dorer V. (2007), Control of thermally
activated building systems, available at https://www.siemens.be, retrieved 2011-02-14
GWS (2011), Geography Weather Station NUS, available at http://www.courses.nus.edu.sg,
retrieved at 2011-03-04
IEA (2008), IEA Energy Statistics, available at http://www.iea.org, retrieved 2011-02-25
(Jalalzadih-Azar A., Slayzak S., Judkoff R., Schaffhauser T., DeBlasio R. (2004),
Performance assessment of a desiccant cooling system in a CHP application incorporating an
IC engine, National Renewable Energy Laboratory, available at http://www.nrel.gov,
retrieved 2011-05-02
Kochupurackal J. (2011) Research Fellow at ERI@N, Interview 2011-04-27
JTC (2010), “CleanTech Park Factsheet”, available at http://www.sedb.com, retrieved 2011-
02-27
Kalogirou S. A. (2004), Solar thermal collectors and applications, Progress in Energy and
Combustion Science, 30, p. 231–295
Keong P. K. (2008), Energy for Growth: Singapore‟s National Energy Policy, available at
-83-
http://www.esi.nus.edu.sg, retrieved 2011-02-26
Knier G. (2002), How Do PVs Work?, available at http://science.nasa.gov, retrieved 2011-02-
26
Kok L. (2010), “Biofuel gets hotter as green choice in Singapore” 2010-06-07, available at
www.eco-business.com, retrieved 2011-04-03
Liang L. H. (2010a), “Solar power usage in Singapore could reach grid parity by 2014” 2010-
05-21, available at http://www.rechargenews.com, retrieved 2011-02-25
Liang L. H. (2010b), “REC wins 1.7 SGD m contract to supply PV in Singapore” 2010-07-13,
available at http://www.rechargenews.com, retrieved 2011-02-25
Liang L. H. (2010c), “Singapore to build world‟s largest pilot 1 MW smart grid” 2010-06-19,
available at http://www.rechargenews.com, retrieved 2011-02-25¨
Luther (2010), Solar energy – the basis for a sustainable global energy supply system, SERIS,
available at http://www.seris.sg, retrieved 2011-04-06
MEWR (2009), Ministry of the Environmental Water Resource - A lively and livable
Singapore, available at http://www.scribd.com, retrieved 2011-02-28
Musial W., Butterfield S. (2004), Future For Offshore Wind Energy In The United States,
available at http://www.nrel.gov, retrieved at 2011-02-23
Narendra K. (2011) Project Officer at ERI@N, Interview 2011-02-17
NEA (2007), Energy For Growth - National Energy Policy Report, available at
http://www.scribd.com, retrieved 2011-02-23
NEMS (2003), National Electricity Market Report 2003, available at http://www.emcsg.com,
retrieved 2011-02-24
NEMS (2009), National Electricity Market Report 2009, available at http://www.emcsg.com,
retrieved 2011-02-24
Prime Minister Lee Hsien Loong (2010), Speech at Singapore Inernational Energy Week
2010, available at http://www.siew.sg, retrieved 2011-03-01
Quiet Revolution (2011), Quiet Revolution Ltd, available at http://www.quietrevolution.com,
retrieved at 2010-04-01
Quintana M.A., King D. L., McMahon T. J. Osterwald C. R. (2008), Commonly Observed

-84-
Degradation in Field-Aged PV Modules, available at http://www.sandia.gov, retrieved 2011-
05-02
REC (2011), The Renewable Energy Corporation, available at http://www.recgroup.com,
retrieved 2011-04-11
SEC (2011), Singapore Environmental Council, available at http://www.ecooffice.com.sg,
retrieved 2011-04-24
SEIA (2009), Solar Energy Industries Association - Solar Thermal, available at
http:/www.seia.org, retrieved 2011-02-28
SERIS (2008), Solar Energy Research Institute of Singapore Brochure, available at
http://www.seris.nus.edu.sg, retrieved 2011-03-02
Seshradi B. (2011) Project Officer at ERI@N, Interview 2011-02-17
Shrestha G. B. (2011), Professor at NTU, School of Electrical & Electronic Engineering,
personal interview, 2011-02-17
SGX (2011), Singapore Exchange, available at http://www.sgx.com, retrieved 2011-05-05
Singstat (2011), Department of Statistics Singapore, available at http://www.singstat.gov.sg,
retrieved 2011-04-13
SMU (2011), Singapore Management University, available at http://www.smu.edu.sg,
retrieved 2011-04-13
Snyder B., Kaiser M. J. (2008), Ecological and economic cost-benefit analysis of offshore
wind energy, Renewable Energy, 34, p. 1567-1578
SOLID (2011a), “Nanyang Technical University Singapore (NTU) and S.O.L.I.D. sign a
Cooperation agreement”, available at www.solid.at, retrieved 2011-04-12
SOLID (2011b), Gluatmugl – HT Solar Collectors Data Sheet, S.O.L.I.D., available at
http://www.solid.at, retrieved 2011-04-11
SP Services (2011), Press Releases on Electricity Tariff Revision, available at
www.spservices.sg, retrieved 2011-04-12
Stimmel R. (2009), AWEA Small Wind Turbine Global Market Study, available at
www.awea.org, retrieved 2011-02-15
SunPower (2011). Sunpower Corp., available at http://us.sunpowercorp.com, retrieved at

-85-
2011-04-24
Tay E. (2011), "Biofuels development: Singapore powering ahead, but gaps remain” 2011-03-
19, available at www.greenbusinesstimes.com, retrieved at 2011-04-12
Tobias C. (2010), “Outlook for wind energy in Singapore: sunny, with some clouds” 2010-06-
03, available at http://www.eco-business.com, retrieved at 2011-04-01
velta (2011), velta, available at http://www.velta-uk.com, retrieved 2010-04-14
Wang R.Z., Li H., Dai Y.J., Li Y., La D. (2008), Experimental investigation on a one-rotor
two-stage desiccant cooling/heating system driven by solar air collectors, Energy, 33, p.1807-
1815
Zahedi A. (2005), Solar PV (PV) energy; latest developments in the building integrated and
hybrid PV systems, Renewable Energy, 31, p. 711–718
ZKenergy (2011) ZK energy, available at http://www.zkenergy.com/, retrieved 2011-04-13
Ölz S., Beerepoot M. 2010, Deploying Renewables in South-East Asia, available at
http://www.oecd-ilibrary.org, retrieved 2011-02-25

-86-
7 Appendix
7.1 Appendix A
Formula in EES
{PARAMETERS} {Parameters to calculate generated energy} {Annual wind energy} E_Wind=1275,737886 {Annual solar energy} E_Sunps=1311,982735 {Efficiency turbine} H_Turbine=0,294198 {Efficiency solar PV} H_PV=0,196 {Efficiency solar thermal} H_ST=0,3 {Expected lifetime} Life=25 {Ground turbine} A_Turbine=6 {Ground area solar PV} A_PV=1,64 {Area roof} A_Roof=200 {Parameters to calculate required energy} {Required latent cooling load from DEC} P_CoolLdecps=20 {Required sensible cooling load from DEC} P_CoolSdecps=30 {Required sensible cooling load from TABS }P_Cooltabps=70 {COP DEC electricity} COP_EDec=5,3 {COP DEC thermal energy}COP_TDec=0,66 {COP TABS}COP_Tab=4 {Required energy for solar thermal} P_Reqsolar=0,062785 {System running hours/day} Time=12 {Cost parameters} {Cost of turbine} Cost_Turbine=4000+11000/6*IA_Turbine {Cost of solar PV} Cost_PV=1789*IA_PV {Cost of solar thermal} Cost_ST=43800+270*IA_ST {CALCULATIONS} {Required power input per square meter (psm)} {Required power input to dessiccant wheel DEC psm} P_TDecps=P_CoolLdecps/COP_TDec*Time/24 {Required power input to electricity DEC psm} P_EDecps=P_CoolSdecps/COP_EDec*Time/24 {Required power input to TABS psm} P_Tabps=P_Cooltabps/COP_Tab*Time/24 {Generated power output per square meter} {Annual wind energy psm} E_Windps=E_Wind/A_Turbine {Generated power from wind psm } P_Windps=E_Windps*1000/(365*24) {Generated power from solar psm} P_Sunps=E_Sunps*1000/(365*24) {Generated electric power turbine psm} P_Turbine=H_Turbine*P_Windps {Generated electric power solar PV psm} P_PV=H_PV*P_Sunps {Generated thermal power solar thermal} P_ST=H_ST*P_Sunps {Calculating installed area, power and energy} {Installed area solar thermal} IA_ST=A_Roof*P_TDecps/P_ST {Installed area solar PV} IA_PV=A_Roof*(P_EDecps+P_Tabps+P_Reqsolar)/P_PV {Installed area turbine} IA_Turbine=A_Roof-IA_PV-IA_ST-10 {Total installed area} IA=IA_ST+IA_PV+IA_Turbine {Installed thermal power solar thermal} IP_ST=IA_ST*P_ST {Installed electric power solar PV} IP_PV=IA_PV*P_PV {Installed electric power turbine}IP_Turbine=IA_Turbine*P_Turbine {Total installed energy in kWh} kWh_System=(IP_ST+IP_PV+IP_ST)/1000*24*365*Life

-87-
{Ratio of installed power to required power} Excess_ratio=(IP_PV+IP_Turbine+IP_ST)/(A_Roof*(P_TDecps+P_EDecps+P_Tabps+P_Reqsolar)) {Cost of generated energy per kWh} {Cost of generated thermal energy solar thermal} Cost_STkWh=Cost_ST/(IP_ST/1000*24*365*Life) {Cost of generated electric energy from solar PV} Cost_PVkWh=Cost_PV/(IP_PV/1000*24*365*Life) {Cost of generated electric energy from turbine} Cost_TurbinekWh=Cost_Turbine/(IP_Turbine/1000*24*365*Life) {Weighted cost of generated energy} Cost_kWh=(Cost_ST+Cost_PV+Cost_Turbine)/kWh_System