feasibility study on anaerobic digestion for the dingle peninsula · 2020-03-18 · the dingle...
TRANSCRIPT
XD Sustainable Energy Consulting Ltd Rocksavage, Clonakilty, Co. Cork
Tel: +353 86 0476124 Email: [email protected]
XD Sustainable Energy Consulting Ltd Directors: Xavier Dubuisson, Susan O’Flaherty
Registered address: Rocksavage, Clonakilty, Co. Cork
Feasibility Study on Anaerobic Digestion for the Dingle Peninsula
Draft Report #1: Vision & Feedstock Analysis
Date: 07/08/19
Consultancy team: Xavier Dubuisson, Tim Clarke, David Wall, Sarah Kandrot, Donal O Céileachair, Donncha O
Céileachair
This study is funded by:
1
Table of Contents I. Introducing the Feasibility Study ................................................................................................... 3
A. AIMS ............................................................................................................................................................................ 4 B. CURRENT STATUS ........................................................................................................................................................ 4 C. NEXT STEPS ................................................................................................................................................................ 4
II. The Study Area............................................................................................................................... 4
III. Context, Vision and Key Principles for the Development of AD in Dingle ........................... 5
A. INTRODUCTION ............................................................................................................................................................. 5 B. LEGISLATIVE AND POLICY FRAMEWORK ......................................................................................................................... 5 C. DINGLE SUSTAINABLE ENERGY COMMUNITY’S ENERGY MASTER PLAN ............................................................................ 6 D. TRANSITION KERRY’S SUSTAINABLE ENERGY COMMUNITY ROADMAP .............................................................................. 7 E. VISION & KEY PRINCIPLES FOR BIOGAS DEVELOPMENT IN DINGLE .................................................................................. 8
IV. Anaerobic Digestion Feedstock Analysis ............................................................................... 9
A. INTRODUCTION ............................................................................................................................................................. 9 B. AGRICULTURAL FEEDSTOCKS ........................................................................................................................................ 9
1. Feedstocks Considered ................................................................................................................................... 9 2. The agricultural context in Dingle .................................................................................................................. 10 3. Field survey of farmers in the study area ...................................................................................................... 12 4. Biogas potential of agricultural feedstocks .................................................................................................... 13
C. NON-AGRICULTURAL FEEDSTOCKS .............................................................................................................................. 16 1. Food Waste ................................................................................................................................................... 16 2. Sewage Sludge ............................................................................................................................................. 16 3. Fish Waste ..................................................................................................................................................... 17 4. Offal ............................................................................................................................................................... 18 5. Marine Algae ................................................................................................................................................. 19
D. SUMMARY OF BIOGAS FEEDSTOCK ANALYSIS ................................................................................................................ 19 E. SPATIAL ANALYSIS OF BIOGAS FEEDSTOCK .................................................................................................................. 20
V. References .................................................................................................................................... 23
VI. Appendix ............................................................................................................................... 25
A. APPENDIX A – SURVEY ............................................................................................................................................... 25 B. APPENDIX B – MUNICIPAL FEEDSTOCK PER ELECTORAL DIVISION ................................................................................. 28 C. APPENDIX C – POTENTIAL FOR ALGAE ......................................................................................................................... 29
2
List of Figures
Figure 1: Areas of Dingle Peninsula assessed. ........................................................................................................ 5
Figure 2: Final energy consumption by carrier in 2016. ........................................................................................ 6
Figure 3: Map of total energy delivered per ED in Dingle. ..................................................................................... 6
Figure 4: Kerry's Renewable Energy Roadmap - recommended energy system. ................................................... 7
Figure 5: Vegetation type and land cover [7]. ...................................................................................................... 10
Figure 6: Distribution of land use in Dingle .......................................................................................................... 10
Figure 7: Distribution of farm size in Dingle ......................................................................................................... 10
List of Acronyms
AD: Anaerobic Digestion
CH4: Methane (Biomethane)
EMP: Energy Master Plan
GWh: Gigawatt-hour or a million kWh
GWh: Gigawatt-hours
kWh: kilowatt-hour or a thousand Wh of energy
MWh: megawatt-hour or a thousand kWh
Nm3: normalised cubic meter
RE: Renewable energy
RES-e: electricity produced from renewable energy sources
RES-heat: Heat produced from renewable energy sources
tCO2: tonne of CO2
tDM: tonne of dry matter
tVDS: tonne of volatile solid
TWh: Terawatt-hour, or a billion kWh
tWM: tonne of wet matter
3
Executive Summary
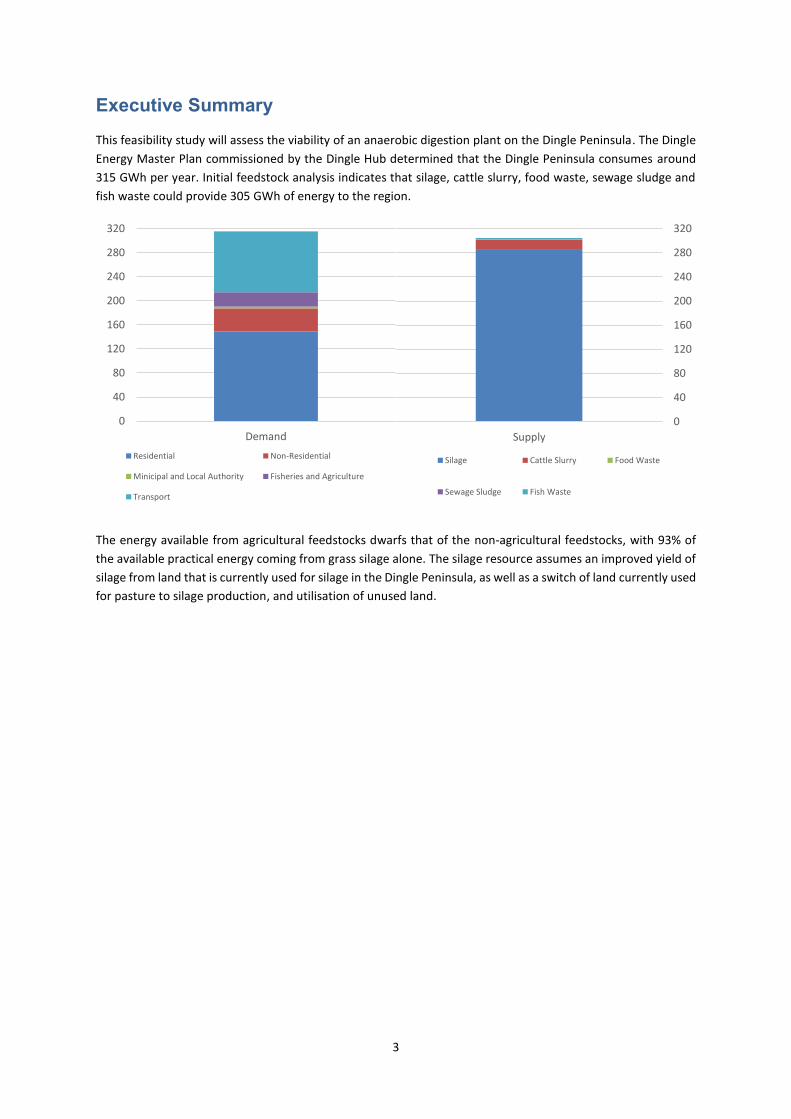
This feasibility study will assess the viability of an anaerobic digestion plant on the Dingle Peninsula. The Dingle
Energy Master Plan commissioned by the Dingle Hub determined that the Dingle Peninsula consumes around
315 GWh per year. Initial feedstock analysis indicates that silage, cattle slurry, food waste, sewage sludge and
fish waste could provide 305 GWh of energy to the region.
The energy available from agricultural feedstocks dwarfs that of the non-agricultural feedstocks, with 93% of
the available practical energy coming from grass silage alone. The silage resource assumes an improved yield of
silage from land that is currently used for silage in the Dingle Peninsula, as well as a switch of land currently used
for pasture to silage production, and utilisation of unused land.
0
40
80
120
160
200
240
280
320
Demand
Residential Non-Residential
Minicipal and Local Authority Fisheries and Agriculture
Transport
0
40
80
120
160
200
240
280
320
Supply
Silage Cattle Slurry Food Waste
Sewage Sludge Fish Waste
4
I. Introducing the Feasibility Study
A. Aims
The Dingle Sustainable Energy Community, led by the Dingle Hub/Molteic, has commissioned a feasibility study
on the Development of Anaerobic Digestion in the Dingle Peninsula with the aim to become one of the leaders
in the development of the rural bioeconomy in Ireland. The study, funded by the LECO project and Gas Network
Ireland, is undertaken by XD Sustainable Energy Consulting Ltd., with a team of experts in biogas system design
and engineering, advanced renewable energy systems and spatial planning.
Anaerobic digestion breaks down biodegradable materials in the absence of oxygen to produce biogas, a
renewable fuel which can be utilised to produce heat, electricity and for transport. Anaerobic digestion is used
worldwide in domestic, agricultural, municipal and industrial applications. Our objective is to investigate the
potential for biogas production on the Dingle Peninsula to contribute to meeting the community’s energy needs
in an affordable, secure and sustainable manner. The study will apply circular economy thinking, considering
organic wastes as a valuable resource which when combined with agricultural by-products and feedstocks, can
be turned into a high-quality fuel – enabling new economic opportunities locally.
B. Current Status
The study started in May 2019 with a comprehensive assessment of the biomass resource available in the
peninsula to determine their practical potential for biogas, their spatial distribution and cost. This report
presents the results of the feedstock analysis in Chapter IV. A workshop was organised on 3rd July with key
stakeholders, with a view to discuss the biogas potential on the Dingle Peninsula and to define a shared vision
for anaerobic digestion in the framework of the Dingle Peninsula’s transition to a low carbon and sustainable
energy community. It also helped identify the core principles which should govern its development. This shared
vision and core principles are discussed in Chapter III.
C. Next Steps
The next step will be to investigate and compare suitable technical biogas pathways, from feedstock to energy
end-use, considering their environmental, social and economic impacts. This will lead to conducting the
preliminary design and a lifecycle cost analysis of anaerobic digestion projects, deemed as being most beneficial.
In addition, a multi-criteria spatial analysis will be undertaken to identify optimal locations for anaerobic
digestion plants.
The feasibility study, planned for completion by January 2020, will also recommend business and financing
models appropriate for community participation, in consultation with key stakeholders. It will provide the
community with a roadmap for the deployment of anaerobic digestion systems on the Peninsula and guide the
next steps for project development.
II. The Study Area
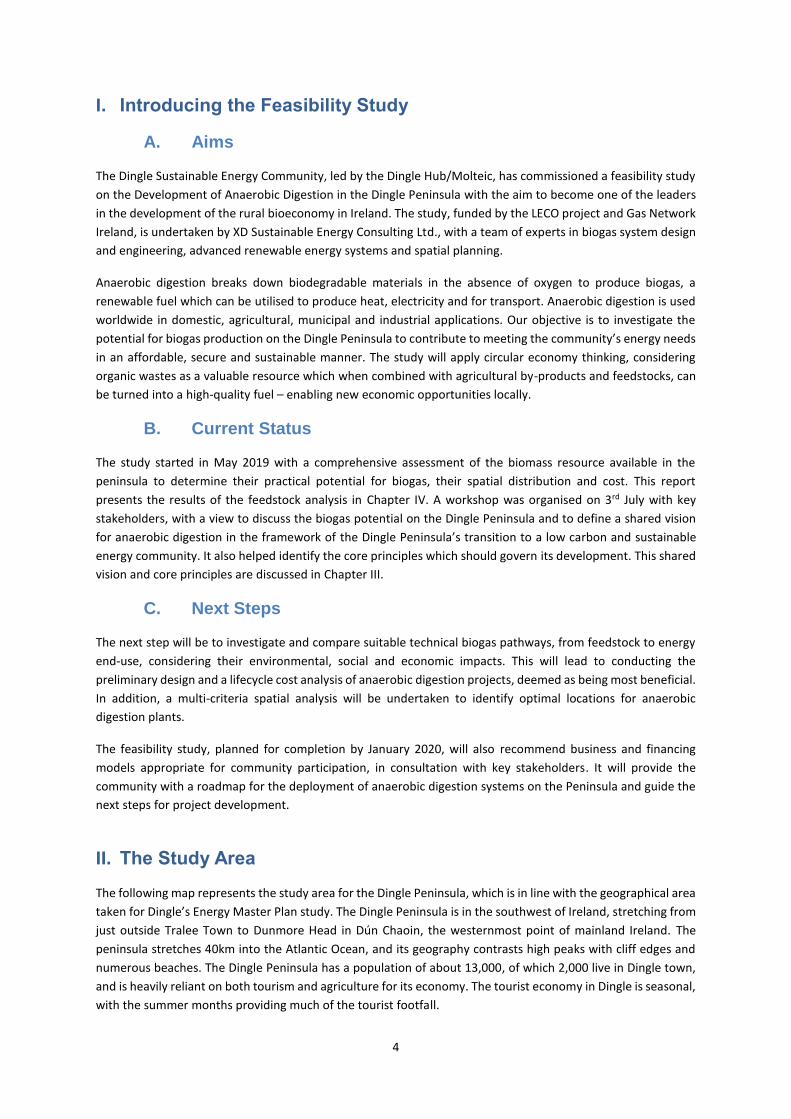
The following map represents the study area for the Dingle Peninsula, which is in line with the geographical area
taken for Dingle’s Energy Master Plan study. The Dingle Peninsula is in the southwest of Ireland, stretching from
just outside Tralee Town to Dunmore Head in Dún Chaoin, the westernmost point of mainland Ireland. The
peninsula stretches 40km into the Atlantic Ocean, and its geography contrasts high peaks with cliff edges and
numerous beaches. The Dingle Peninsula has a population of about 13,000, of which 2,000 live in Dingle town,
and is heavily reliant on both tourism and agriculture for its economy. The tourist economy in Dingle is seasonal,
with the summer months providing much of the tourist footfall.
5
Figure 1: Areas of Dingle Peninsula assessed.
III. Context, Vision and Key Principles for the Development of AD in Dingle
A. Introduction
In this chapter, a vision for the development of anaerobic digestion on the Dingle Peninsula is articulated on the
basis of the national policy framework, local planning policy and, most importantly, in consultation with
community stakeholders. The vision considers the results of the Dingle Energy Master Plan study commissioned
by the Dingle Hub and Transition Kerry’s Sustainable Energy Community Roadmap. In addition, key principles by
which different pathways and business models for the development of AD will be assessed are defined.
B. Legislative and Policy Framework
Agenda 2030 [1] and the Paris Agreement [2] on climate change require a transformational shift of our
economies and societies towards climate resilient and sustainable development. The Climate Action Plan [3]
puts in place a decarbonisation pathway to 2030 which would be consistent with the adoption of a net zero
target in Ireland by 2050. This will require a radical transformation of Ireland’s energy system, including
generating electricity from renewable sources, and moving to lower emissions fuels (e.g. from peat and coal to
gas) and ultimately away from fossil fuels altogether. By 2017, Ireland’s renewable energy (RE) in the total final
energy consumption was 10.7% compared to a EU RE Directive target of 16% by 2020. The biggest share of our
RE production is renewable electricity (RES-e) at 62%, and renewable energy contribution to heat (6.9%) and
transport (7.4%) fall significantly short of the 2020 targets of 12% and 10% respectively (SEAI, 2019). The revised
Renewable Energy Directive adopted in December 2018 establishes a new binding renewable energy target for
the EU for 2030 of at least 32%, with a clause for a possible upwards revision by 2023.
At a local level, the Kerry County Development Plan 2015 – 2021, Volume I, Chapter 13 “Development
Management – Standards and Guidelines” [4] states that wind energy, geothermal, biomass, combined heat and
power and all other forms of renewable energy will be considered in accordance with the Renewable Energy
Strategy [5], adopted by Kerry County Council in 2012. According to the appraisals that were carried out as part
of the RE Strategy, there is significant potential for the development of wind, bioenergy and, to a lesser extent,
hydro power within the county. However, the plan recognises the constraints of preserving and protecting
6
Kerry’s landscapes and archaeological heritage will have a significant impact on the potential to develop further
RE, in particular in the study area.
C. Dingle Sustainable Energy Community’s Energy Master Plan
Dingle’s Energy Master Plan (EMP) was commissioned by the Dingle Hub in 2019 with funding from SEAI. The
EMP study provides an assessment of baseline energy usage for the year 2016 and defines ambitious energy
demand reduction and renewable contribution targets by 2030. According to the analysis, the projected
achievable out-turns for these targets by 2030 are 34.96% and 36.34% respectively (Kevin Curtin, 2019).
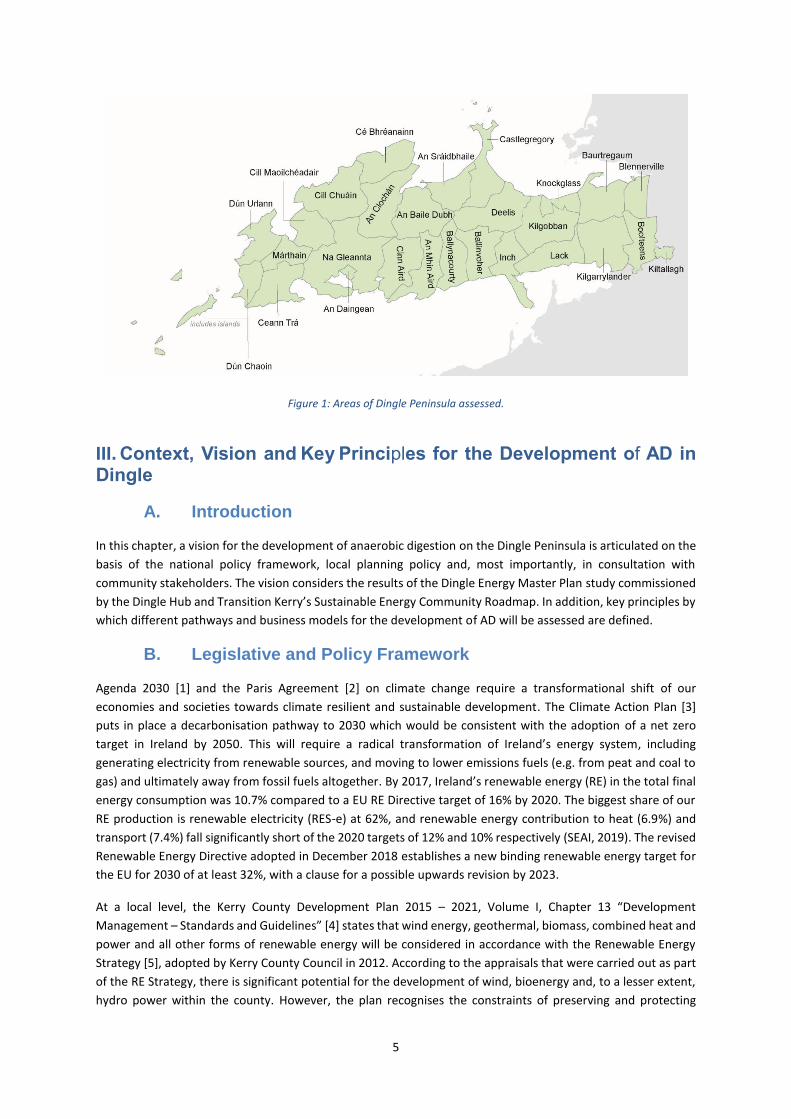
Table 1 shows the distribution of final energy usage within the study area in 2016, sector by sector, and Figure
2 shows the fuel mix. Overall, the energy expenditure in the peninsula was estimated at 38.5 million euro for
2016.
Table 1: Sectorial final energy usage for 2016.1
Figure 2: Final energy consumption by carrier in 2016.2
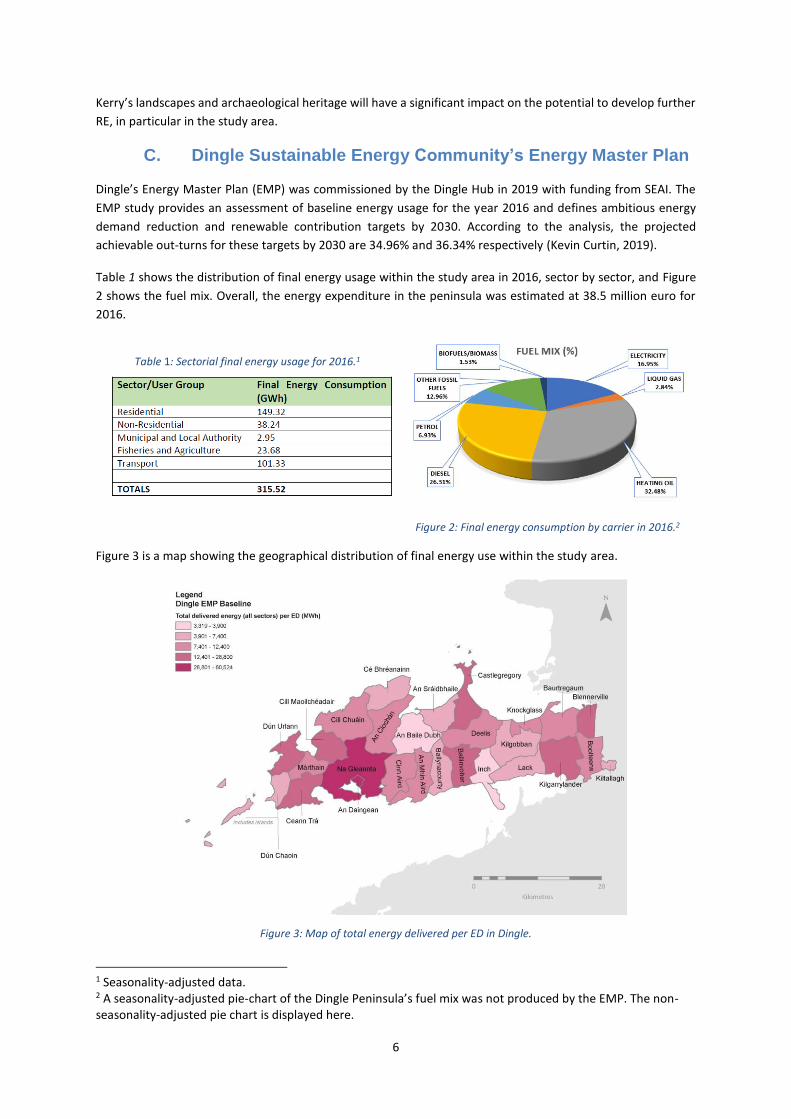
Figure 3 is a map showing the geographical distribution of final energy use within the study area.
Figure 3: Map of total energy delivered per ED in Dingle.
1 Seasonality-adjusted data. 2 A seasonality-adjusted pie-chart of the Dingle Peninsula’s fuel mix was not produced by the EMP. The non-seasonality-adjusted pie chart is displayed here.
7
The Dingle EMP recommends a large number of actions to deliver the targeted energy demand reduction and
renewable energy production, including widespread uptake of deep energy retrofit in the residential and
services sectors, as well as installation of renewable energy technologies in buildings (solar PV, heat pumps,
biomass boilers) and at utility-scale for solar PV and anaerobic digestion. It estimates a total capital investment
requirement of €211 million. This is made up of €166 million for energy demand reduction and €45 million for
renewable energy generation.
D. Transition Kerry’s Sustainable Energy Community Roadmap
This study [6] commissioned by Transition Kerry, a community initiative aiming to accelerate the change to a
more resilient, sustainable future for the population of Kerry, was completed in 2013. The objective of the study
was to set out a roadmap to plan the transition of the county towards 100% renewable energy by 2030, based
on a 25% reduction in energy demand by the same year, using 2008 as the baseline year. The study estimated
that the total annual energy spend in 2008 was €470 million and that the associated CO2 emissions were 1.22
million tonnes of CO2 per year (tCO2/year) at a social cost of €28 million per year.
The total renewable energy resource potentially available in Kerry was estimated at 42 terawatt-hours (TWh),
the majority of it in its adjacent offshore area, or 10.6 times its final energy usage in 2008. The theoretical
potential of biomass in the study area has been estimated at circa 2 TWh/yr or 50% of final energy usage. The
study carried out a lot of modelling to analyse different energy system transformation scenarios, out of which
the following was recommended as the most advantageous: “By 2030, the county will be capable of becoming
energy self-sufficient on the basis of its own renewable energy resource. Households, businesses and industry
in larger towns will be supplied renewable heat via district heating systems harnessing heat from wood-fired
power stations, industrial processes and large solar arrays. Rural dwellers will have switched to heat pumps and
solar heating systems, supplemented with wood stoves. In terms of electricity supply, wind energy will cover up
to 45% of total energy requirements of the county. Solar power will also play a significant role in the electricity
mix (10-15% of primary energy supply). The technological transformation of the energy system of the county
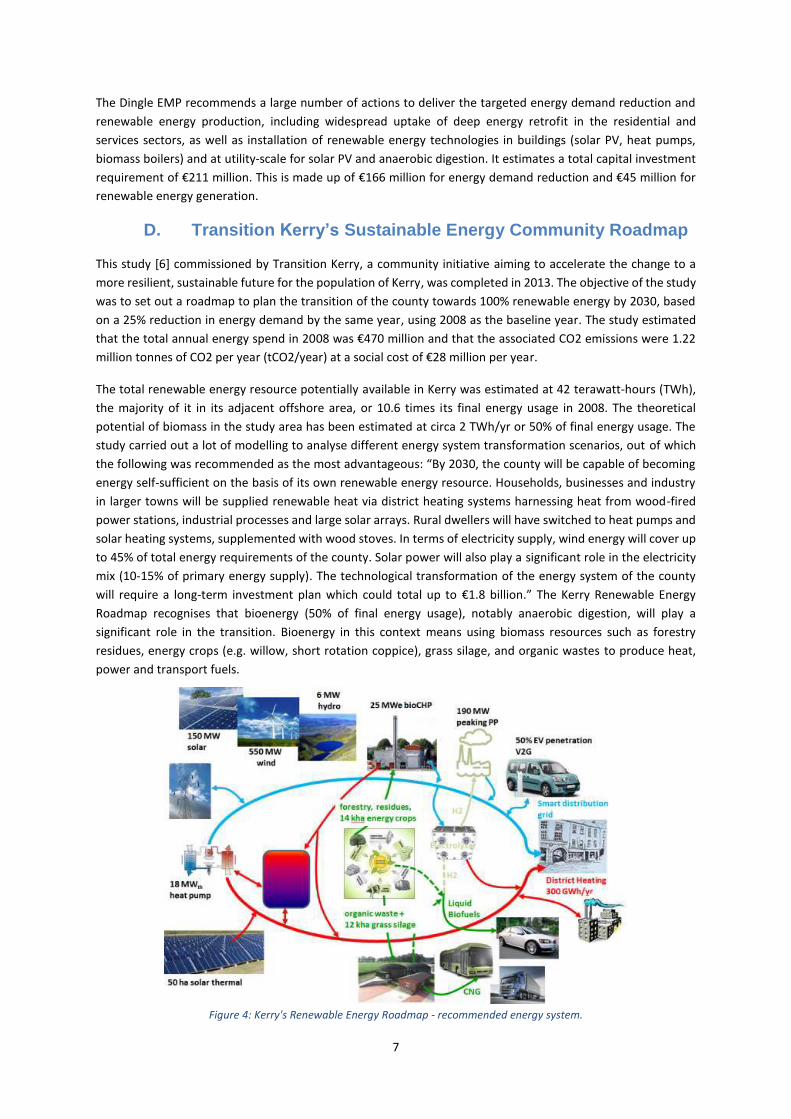
will require a long-term investment plan which could total up to €1.8 billion.” The Kerry Renewable Energy
Roadmap recognises that bioenergy (50% of final energy usage), notably anaerobic digestion, will play a
significant role in the transition. Bioenergy in this context means using biomass resources such as forestry
residues, energy crops (e.g. willow, short rotation coppice), grass silage, and organic wastes to produce heat,
power and transport fuels.
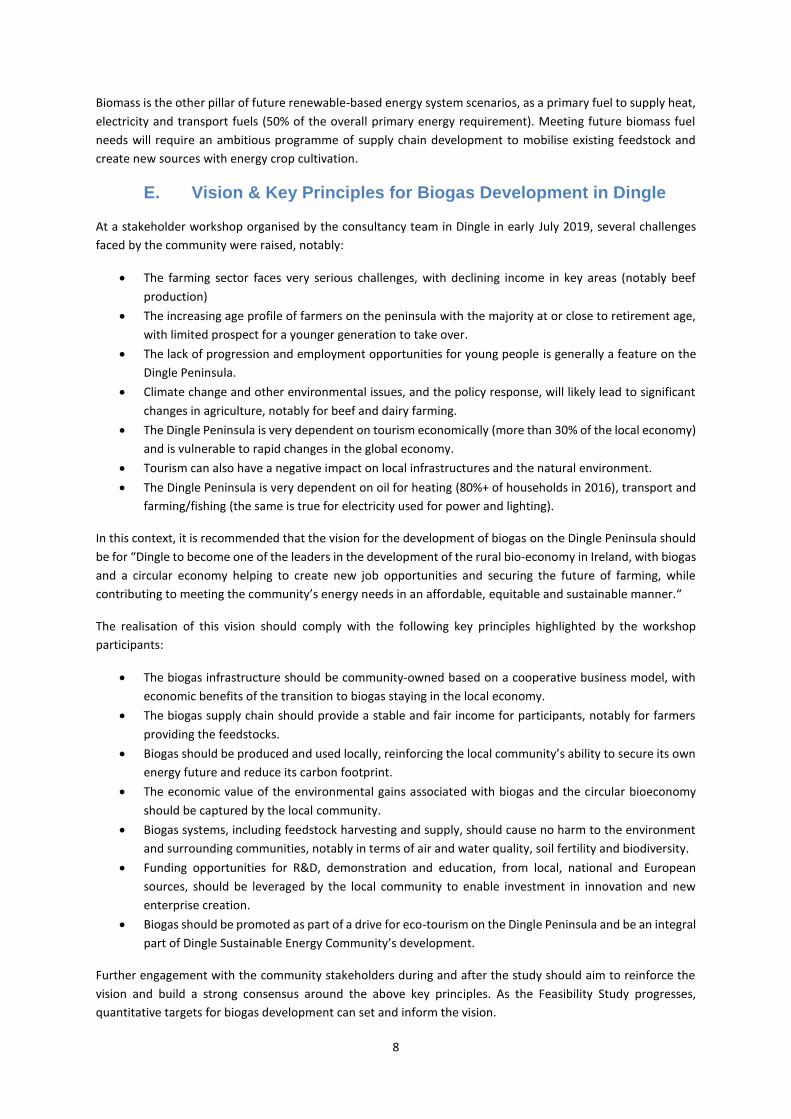
Figure 4: Kerry's Renewable Energy Roadmap - recommended energy system.
8
Biomass is the other pillar of future renewable-based energy system scenarios, as a primary fuel to supply heat,
electricity and transport fuels (50% of the overall primary energy requirement). Meeting future biomass fuel
needs will require an ambitious programme of supply chain development to mobilise existing feedstock and
create new sources with energy crop cultivation.
E. Vision & Key Principles for Biogas Development in Dingle
At a stakeholder workshop organised by the consultancy team in Dingle in early July 2019, several challenges
faced by the community were raised, notably:
• The farming sector faces very serious challenges, with declining income in key areas (notably beef
production)
• The increasing age profile of farmers on the peninsula with the majority at or close to retirement age,
with limited prospect for a younger generation to take over.
• The lack of progression and employment opportunities for young people is generally a feature on the
Dingle Peninsula.
• Climate change and other environmental issues, and the policy response, will likely lead to significant
changes in agriculture, notably for beef and dairy farming.
• The Dingle Peninsula is very dependent on tourism economically (more than 30% of the local economy)
and is vulnerable to rapid changes in the global economy.
• Tourism can also have a negative impact on local infrastructures and the natural environment.
• The Dingle Peninsula is very dependent on oil for heating (80%+ of households in 2016), transport and
farming/fishing (the same is true for electricity used for power and lighting).
In this context, it is recommended that the vision for the development of biogas on the Dingle Peninsula should
be for “Dingle to become one of the leaders in the development of the rural bio-economy in Ireland, with biogas
and a circular economy helping to create new job opportunities and securing the future of farming, while
contributing to meeting the community’s energy needs in an affordable, equitable and sustainable manner.“
The realisation of this vision should comply with the following key principles highlighted by the workshop
participants:
• The biogas infrastructure should be community-owned based on a cooperative business model, with
economic benefits of the transition to biogas staying in the local economy.
• The biogas supply chain should provide a stable and fair income for participants, notably for farmers
providing the feedstocks.
• Biogas should be produced and used locally, reinforcing the local community’s ability to secure its own
energy future and reduce its carbon footprint.
• The economic value of the environmental gains associated with biogas and the circular bioeconomy
should be captured by the local community.
• Biogas systems, including feedstock harvesting and supply, should cause no harm to the environment
and surrounding communities, notably in terms of air and water quality, soil fertility and biodiversity.
• Funding opportunities for R&D, demonstration and education, from local, national and European
sources, should be leveraged by the local community to enable investment in innovation and new
enterprise creation.
• Biogas should be promoted as part of a drive for eco-tourism on the Dingle Peninsula and be an integral
part of Dingle Sustainable Energy Community’s development.
Further engagement with the community stakeholders during and after the study should aim to reinforce the
vision and build a strong consensus around the above key principles. As the Feasibility Study progresses,
quantitative targets for biogas development can set and inform the vision.
9
IV. Anaerobic Digestion Feedstock Analysis
A. Introduction
The objective of the feedstock analysis is to understand the potential production of biogas, based on a detailed
assessment of the organic materials available within the study area, in terms of suitability for anaerobic
digestion, quantities that can be practically mobilised and cost. The analysis relies on the Central Statistical Office
(CSO)’s Population Census (2016) and Agriculture Census (2010), a field survey conducted by the team among
farmers in the study area, as well as other published sources of data and information. Section IV.C focuses on
non-agricultural feedstocks in the peninsula – municipal wastes and industrial wastes. Section IV.D gives a brief
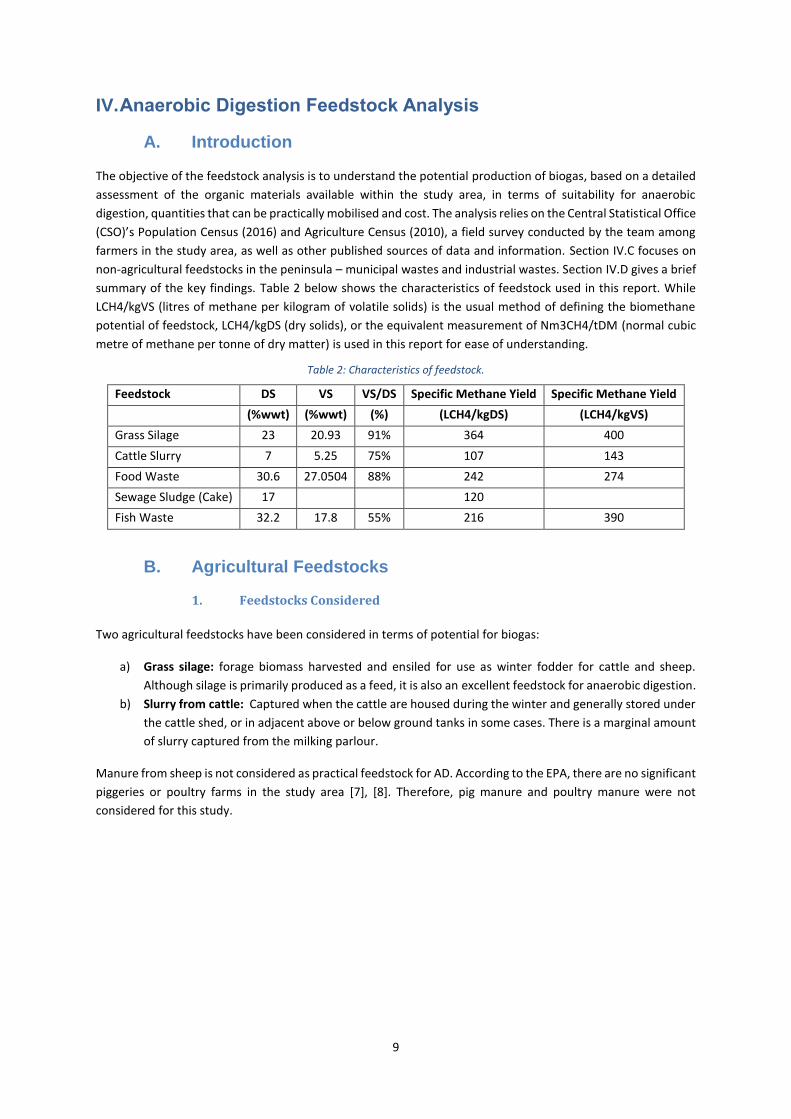
summary of the key findings. Table 2 below shows the characteristics of feedstock used in this report. While
LCH4/kgVS (litres of methane per kilogram of volatile solids) is the usual method of defining the biomethane
potential of feedstock, LCH4/kgDS (dry solids), or the equivalent measurement of Nm3CH4/tDM (normal cubic
metre of methane per tonne of dry matter) is used in this report for ease of understanding.
Table 2: Characteristics of feedstock.
Feedstock DS VS VS/DS Specific Methane Yield Specific Methane Yield
(%wwt) (%wwt) (%) (LCH4/kgDS) (LCH4/kgVS)
Grass Silage 23 20.93 91% 364 400
Cattle Slurry 7 5.25 75% 107 143
Food Waste 30.6 27.0504 88% 242 274
Sewage Sludge (Cake) 17 120
Fish Waste 32.2 17.8 55% 216 390
B. Agricultural Feedstocks
1. Feedstocks Considered
Two agricultural feedstocks have been considered in terms of potential for biogas:
a) Grass silage: forage biomass harvested and ensiled for use as winter fodder for cattle and sheep.
Although silage is primarily produced as a feed, it is also an excellent feedstock for anaerobic digestion.
b) Slurry from cattle: Captured when the cattle are housed during the winter and generally stored under
the cattle shed, or in adjacent above or below ground tanks in some cases. There is a marginal amount
of slurry captured from the milking parlour.
Manure from sheep is not considered as practical feedstock for AD. According to the EPA, there are no significant
piggeries or poultry farms in the study area [7], [8]. Therefore, pig manure and poultry manure were not
considered for this study.
10
2. The agricultural context in Dingle
Agriculture is dominated by three farming enterprises in Dingle3: cattle rearing and finishing (47%), dairy farming
(18%) and sheep farming (17%). The remaining 18% is comprised of land used for mixed grazing and mixed crops
[9]. There were over 25,237 heads of cattle in 20105 in the study area, including 5,795 dairy cows, and 123,617
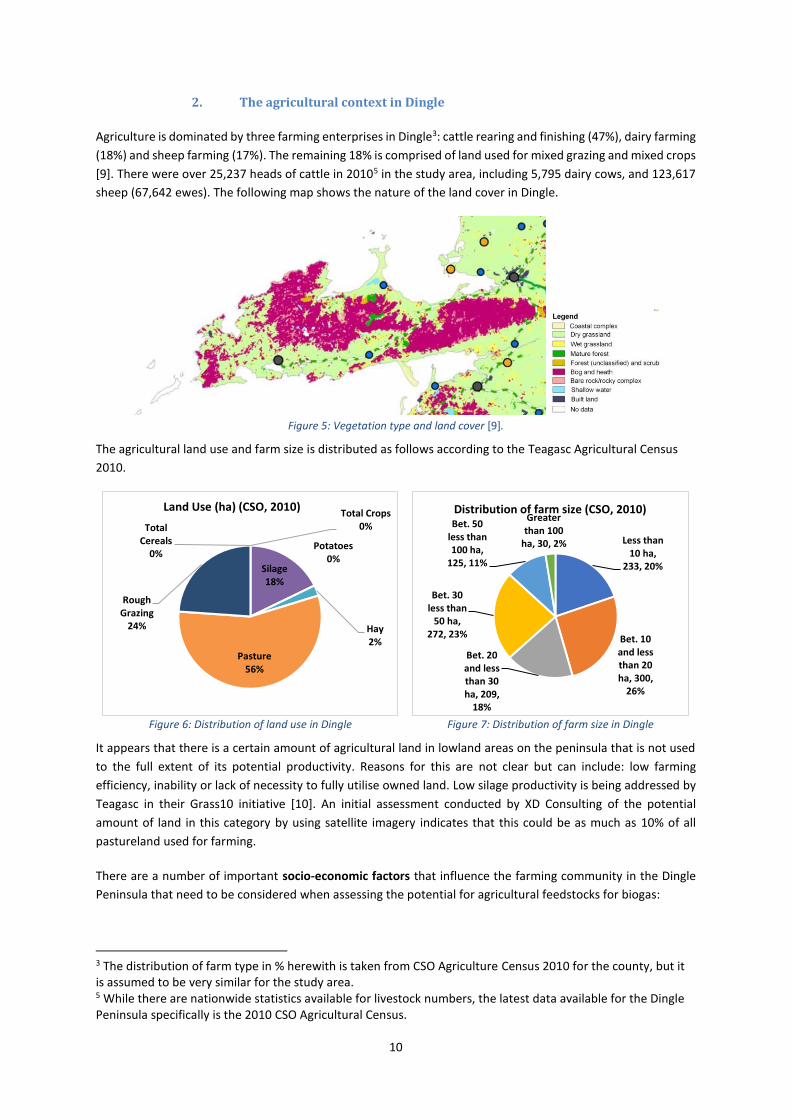
sheep (67,642 ewes). The following map shows the nature of the land cover in Dingle.
Figure 5: Vegetation type and land cover [9].
The agricultural land use and farm size is distributed as follows according to the Teagasc Agricultural Census
2010.
Figure 6: Distribution of land use in Dingle
Figure 7: Distribution of farm size in Dingle
It appears that there is a certain amount of agricultural land in lowland areas on the peninsula that is not used
to the full extent of its potential productivity. Reasons for this are not clear but can include: low farming
efficiency, inability or lack of necessity to fully utilise owned land. Low silage productivity is being addressed by
Teagasc in their Grass10 initiative [10]. An initial assessment conducted by XD Consulting of the potential
amount of land in this category by using satellite imagery indicates that this could be as much as 10% of all
pastureland used for farming.
There are a number of important socio-economic factors that influence the farming community in the Dingle
Peninsula that need to be considered when assessing the potential for agricultural feedstocks for biogas:
3 The distribution of farm type in % herewith is taken from CSO Agriculture Census 2010 for the county, but it is assumed to be very similar for the study area. 5 While there are nationwide statistics available for livestock numbers, the latest data available for the Dingle Peninsula specifically is the 2010 CSO Agricultural Census.
Total Cereals
0%Potatoes
0%
Total Crops0%
Silage18%
Hay2%
Pasture56%
Rough Grazing
24%
Land Use (ha) (CSO, 2010)
Less than 10 ha,
233, 20%
Bet. 10 and less than 20 ha, 300,
26%
Bet. 20 and less than 30 ha, 209,
18%
Bet. 30 less than
50 ha, 272, 23%
Bet. 50 less than 100 ha,
125, 11%
Greater than 100
ha, 30, 2%
Distribution of farm size (CSO, 2010)
11
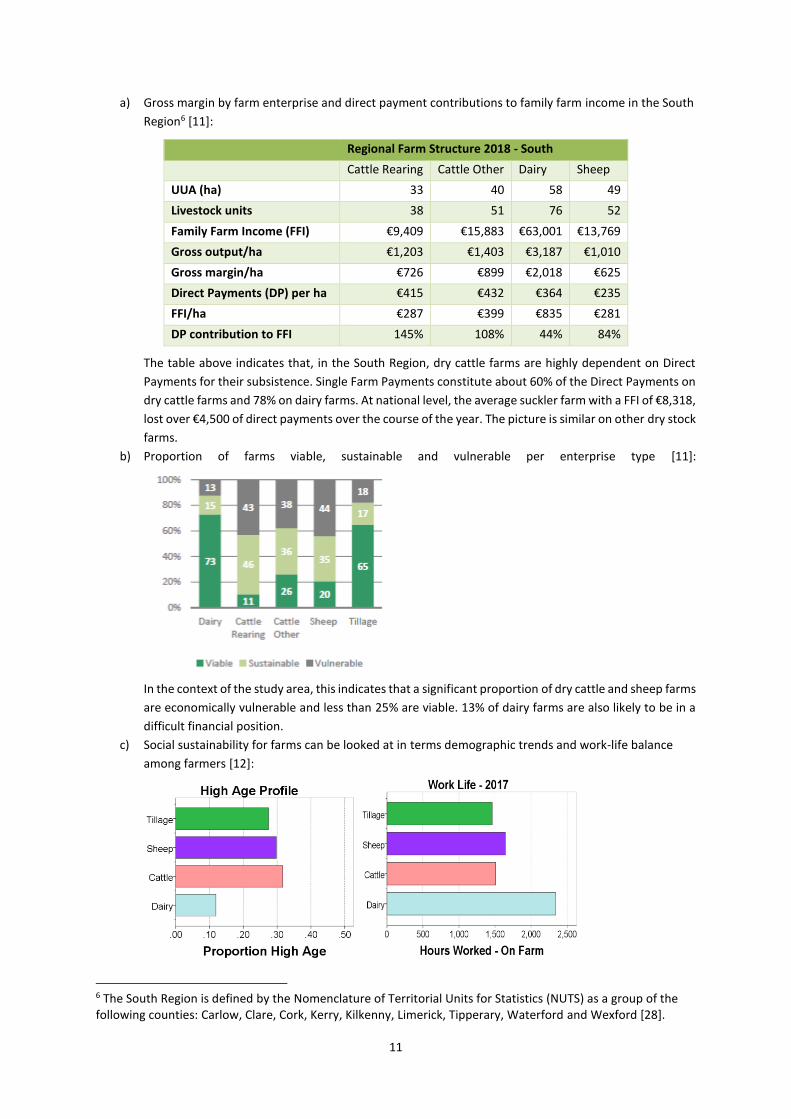
a) Gross margin by farm enterprise and direct payment contributions to family farm income in the South
Region6 [11]:
Regional Farm Structure 2018 - South
Cattle Rearing Cattle Other Dairy Sheep
UUA (ha) 33 40 58 49
Livestock units 38 51 76 52
Family Farm Income (FFI) €9,409 €15,883 €63,001 €13,769
Gross output/ha €1,203 €1,403 €3,187 €1,010
Gross margin/ha €726 €899 €2,018 €625
Direct Payments (DP) per ha €415 €432 €364 €235
FFI/ha €287 €399 €835 €281
DP contribution to FFI 145% 108% 44% 84%
The table above indicates that, in the South Region, dry cattle farms are highly dependent on Direct
Payments for their subsistence. Single Farm Payments constitute about 60% of the Direct Payments on
dry cattle farms and 78% on dairy farms. At national level, the average suckler farm with a FFI of €8,318,
lost over €4,500 of direct payments over the course of the year. The picture is similar on other dry stock
farms.
b) Proportion of farms viable, sustainable and vulnerable per enterprise type [11]:
In the context of the study area, this indicates that a significant proportion of dry cattle and sheep farms
are economically vulnerable and less than 25% are viable. 13% of dairy farms are also likely to be in a
difficult financial position.
c) Social sustainability for farms can be looked at in terms demographic trends and work-life balance
among farmers [12]:
6 The South Region is defined by the Nomenclature of Territorial Units for Statistics (NUTS) as a group of the following counties: Carlow, Clare, Cork, Kerry, Kilkenny, Limerick, Tipperary, Waterford and Wexford [28].
12
This indicates that a significant proportion of farmers in the study area are likely to be at retirement
age or above. According to the CSO Agriculture Census 2010, about 33% of farmers were above
retirement age in the study area and another 33% are likely to have reached retirement age since
then. Dairy farmers work very long hours on the farm, on average above 6 hours every single day of
the year.
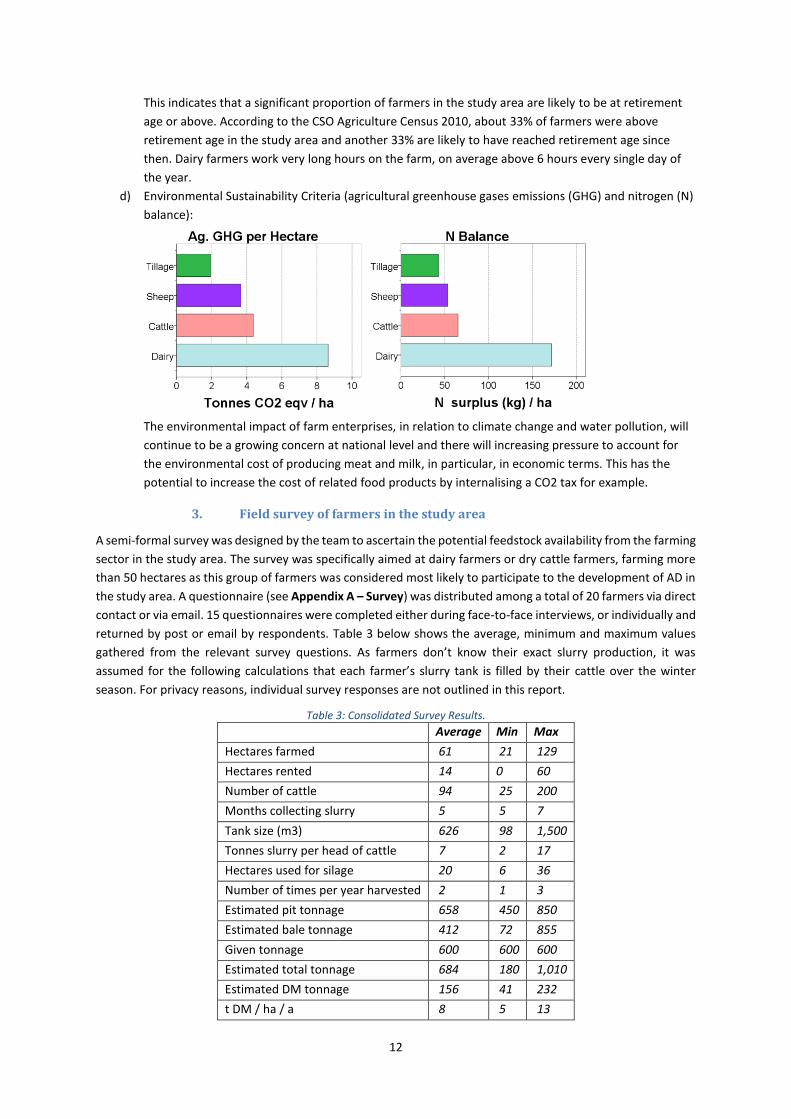
d) Environmental Sustainability Criteria (agricultural greenhouse gases emissions (GHG) and nitrogen (N)
balance):
The environmental impact of farm enterprises, in relation to climate change and water pollution, will
continue to be a growing concern at national level and there will increasing pressure to account for
the environmental cost of producing meat and milk, in particular, in economic terms. This has the
potential to increase the cost of related food products by internalising a CO2 tax for example.
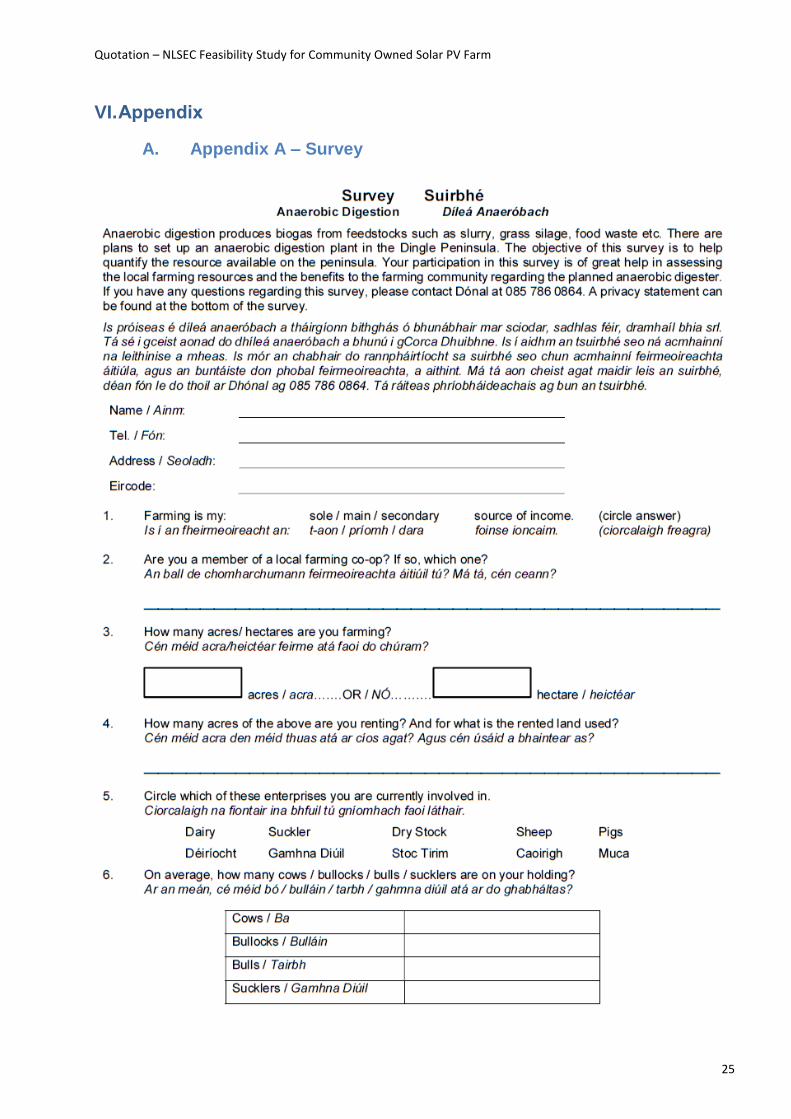
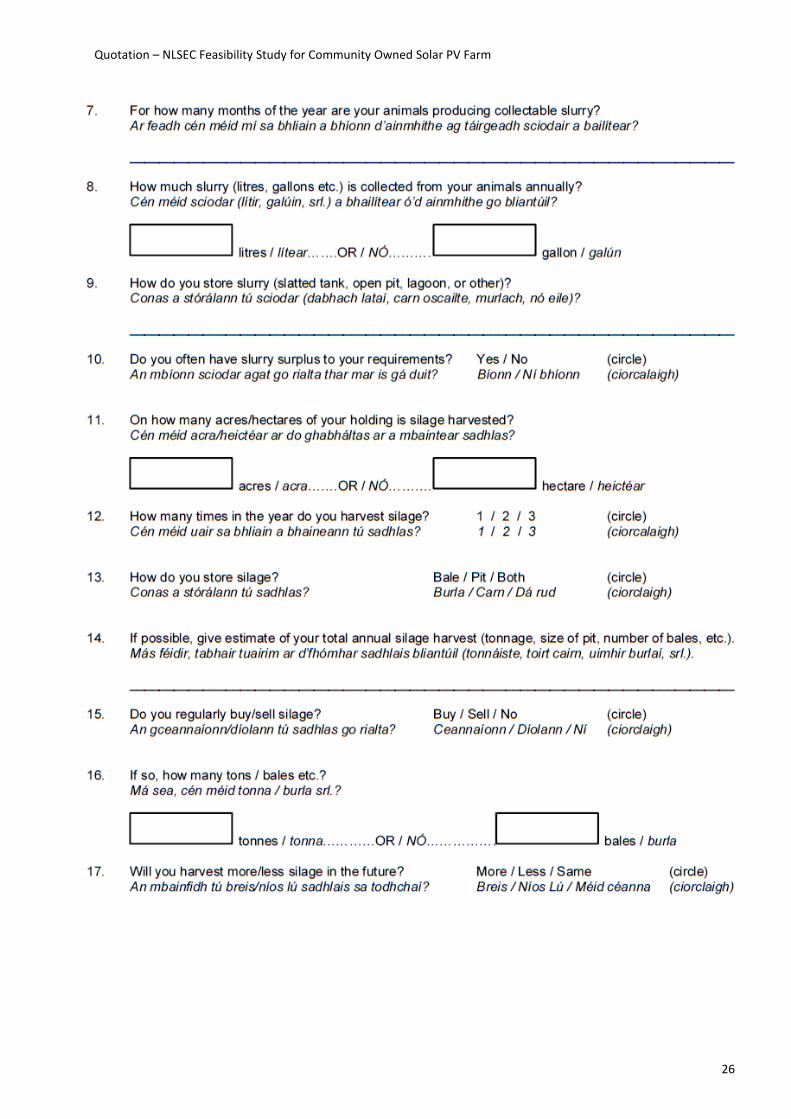
3. Field survey of farmers in the study area
A semi-formal survey was designed by the team to ascertain the potential feedstock availability from the farming
sector in the study area. The survey was specifically aimed at dairy farmers or dry cattle farmers, farming more
than 50 hectares as this group of farmers was considered most likely to participate to the development of AD in
the study area. A questionnaire (see Appendix A – Survey) was distributed among a total of 20 farmers via direct
contact or via email. 15 questionnaires were completed either during face-to-face interviews, or individually and
returned by post or email by respondents. Table 3 below shows the average, minimum and maximum values
gathered from the relevant survey questions. As farmers don’t know their exact slurry production, it was
assumed for the following calculations that each farmer’s slurry tank is filled by their cattle over the winter
season. For privacy reasons, individual survey responses are not outlined in this report.
Table 3: Consolidated Survey Results. Average Min Max
Hectares farmed 61 21 129
Hectares rented 14 0 60
Number of cattle 94 25 200
Months collecting slurry 5 5 7
Tank size (m3) 626 98 1,500
Tonnes slurry per head of cattle 7 2 17
Hectares used for silage 20 6 36
Number of times per year harvested 2 1 3
Estimated pit tonnage 658 450 850
Estimated bale tonnage 412 72 855
Given tonnage 600 600 600
Estimated total tonnage 684 180 1,010
Estimated DM tonnage 156 41 232
t DM / ha / a 8 5 13
13
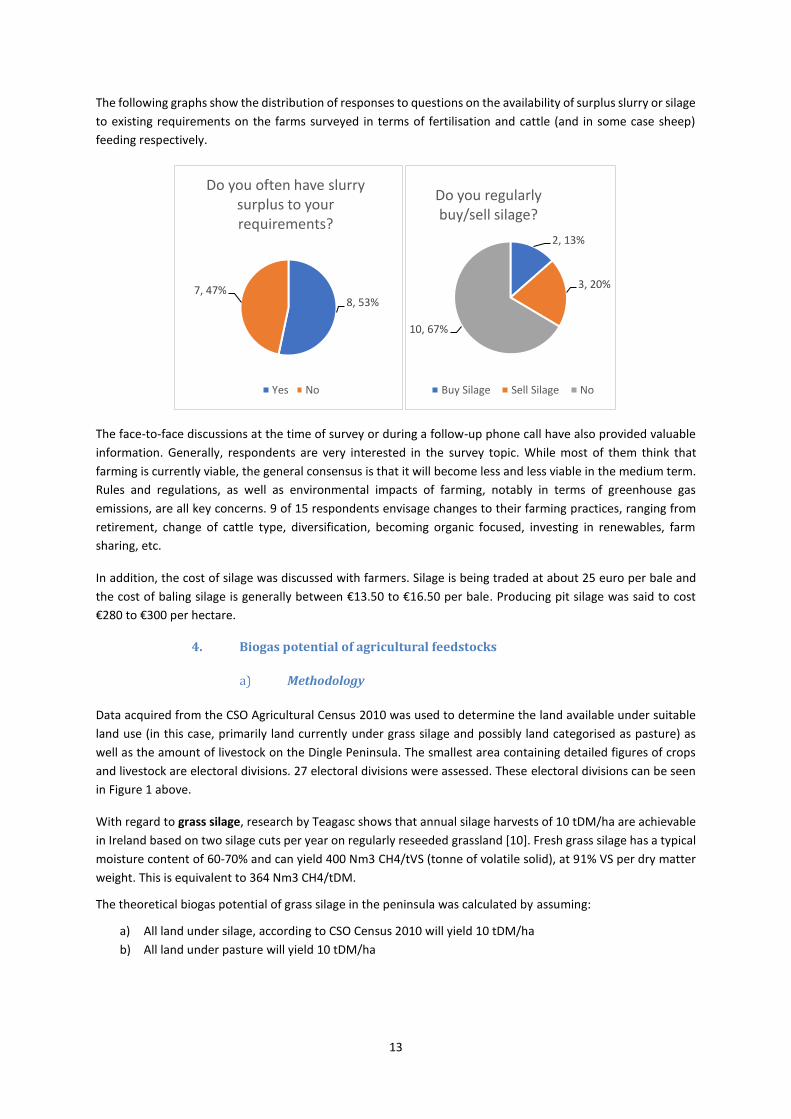
The following graphs show the distribution of responses to questions on the availability of surplus slurry or silage
to existing requirements on the farms surveyed in terms of fertilisation and cattle (and in some case sheep)
feeding respectively.
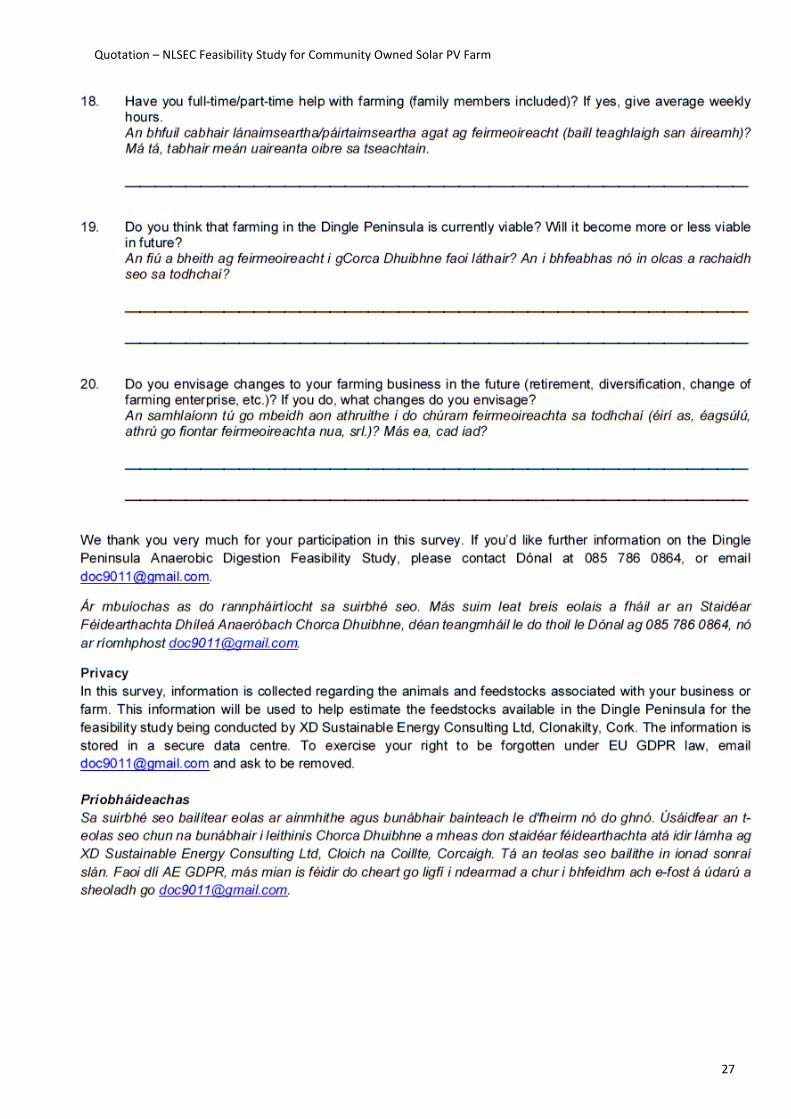
The face-to-face discussions at the time of survey or during a follow-up phone call have also provided valuable
information. Generally, respondents are very interested in the survey topic. While most of them think that
farming is currently viable, the general consensus is that it will become less and less viable in the medium term.
Rules and regulations, as well as environmental impacts of farming, notably in terms of greenhouse gas
emissions, are all key concerns. 9 of 15 respondents envisage changes to their farming practices, ranging from
retirement, change of cattle type, diversification, becoming organic focused, investing in renewables, farm
sharing, etc.
In addition, the cost of silage was discussed with farmers. Silage is being traded at about 25 euro per bale and
the cost of baling silage is generally between €13.50 to €16.50 per bale. Producing pit silage was said to cost
€280 to €300 per hectare.
4. Biogas potential of agricultural feedstocks
Methodology
Data acquired from the CSO Agricultural Census 2010 was used to determine the land available under suitable
land use (in this case, primarily land currently under grass silage and possibly land categorised as pasture) as
well as the amount of livestock on the Dingle Peninsula. The smallest area containing detailed figures of crops
and livestock are electoral divisions. 27 electoral divisions were assessed. These electoral divisions can be seen
in Figure 1 above.
With regard to grass silage, research by Teagasc shows that annual silage harvests of 10 tDM/ha are achievable
in Ireland based on two silage cuts per year on regularly reseeded grassland [10]. Fresh grass silage has a typical
moisture content of 60-70% and can yield 400 Nm3 CH4/tVS (tonne of volatile solid), at 91% VS per dry matter
weight. This is equivalent to 364 Nm3 CH4/tDM.
The theoretical biogas potential of grass silage in the peninsula was calculated by assuming:
a) All land under silage, according to CSO Census 2010 will yield 10 tDM/ha
b) All land under pasture will yield 10 tDM/ha
8, 53%7, 47%
Do you often have slurry surplus to your requirements?
Yes No
2, 13%
3, 20%
10, 67%
Do you regularly buy/sell silage?
Buy Silage Sell Silage No
14
The practical potential for grass silage is taken as:
a) The potential additional output from existing land used for grass silage from increased productivity
from the current average of 8 tDM/ha,yr as per the survey results in Table 3 to 10 tDM/ha,yr.
b) The potential increase in land used for silage from land currently with low productivity use, estimated
at about 10% of land used for permanent pasture, with a potential silage yield assumed to be 8 tDM/ha
if appropriate land improvement and grass management measures are taken.
c) The potential for silage production above cattle feeding requirements due to a reduction in herd size.
As shown in Chapter IV.B.2, approximately 40% of dry cattle farms, 44% of sheep farm and 13% of dairy
farms are vulnerable economically and could be incentivised to diversify towards the production of
silage for biogas. Forecasting the potential switch is difficult, considering other potential alternative
land use such as afforestation and dairy farming. However, the assumption has been made that the
practical potential for silage from farming enterprise change is 30% of permanent pasture in the study
area, or a total of 5,900 ha from which the assumed silage yield is taken as 8 tDM/ha (in line with survey
results in Table 3).
The theoretical potential of cattle slurry for biogas was calculated on the basis of the numbers of cattle per type
taken from the census 2010 data and indicators of slurry production by cattle type taken from a study by Teagasc
[13], see Table 4 below. The DM content of slurry was taken to be 7%. The biomethane potential of slurry was
taken to be 107 Nm3 CH4/tDM. The practical biogas potential from slurry considers that slurry loses (10%) of
gases during storage. The figures in Table 4 below are used to calculate slurry production on the peninsula as
opposed to the survey figures, as to not over-estimate the slurry available in the region.
Table 4: Slurry Production by cattle type.
Cattle Type Slurry Production
(tonnes/year/head)
Dairy Cows 5.84
Bulls 5.84
Other Cow Slurry 5.20
Other Cattle Slurry 4.10
The above calculations of theoretical and technical potential were conducted in per Electoral Division (ED) within
the study area, which represents the lowest geographical resolution for the CSO Agricultural Census data.
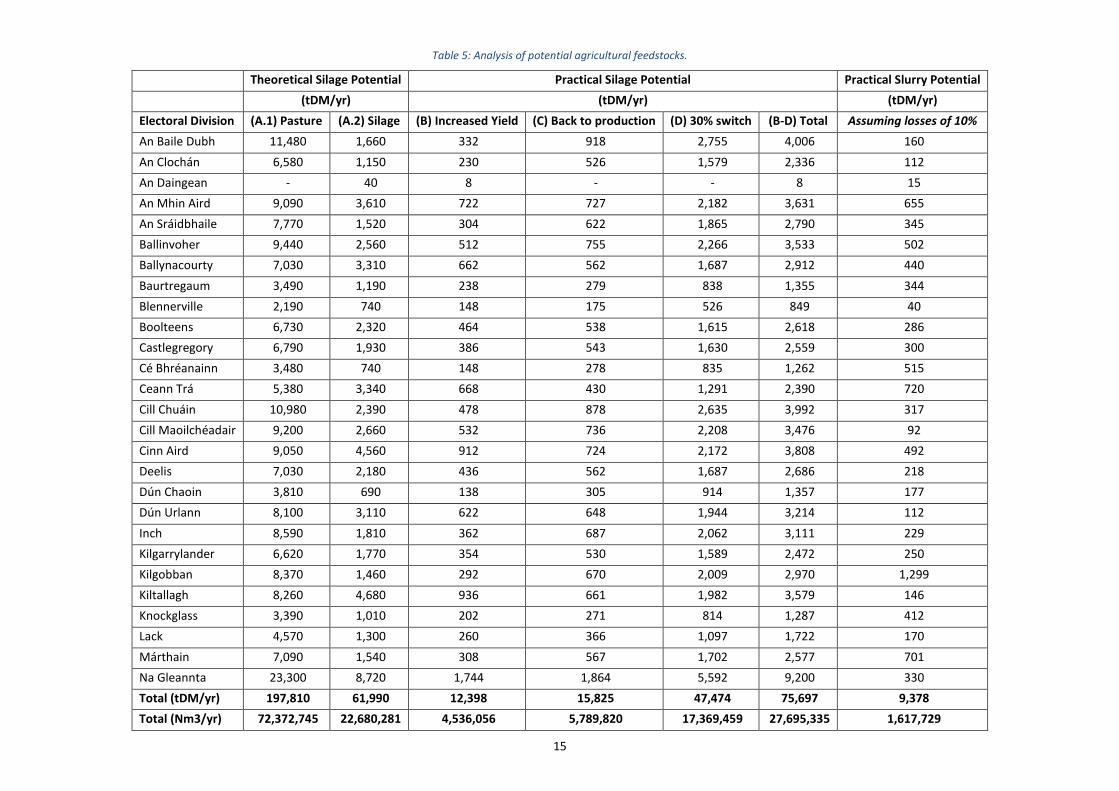
Results
The table below presents the results of our analysis of the potential agricultural feedstock for biogas, per ED,
including:
a) Theoretical potential based on all land currently (2010) under ‘silage’ and ‘permanent pasture’ is used
for silage production for biogas.
b) Practical potential based on surplus silage output from increased yield from land currently under
‘silage’.
c) Practical potential based on land turned back to productive use for silage.
d) Practical potential based on the equivalent of 30% of permanent pasture switched to silage for biogas.
e) Practical potential based on cattle slurry harvested during wintering season
15
Table 5: Analysis of potential agricultural feedstocks.
Theoretical Silage Potential Practical Silage Potential Practical Slurry Potential
(tDM/yr) (tDM/yr) (tDM/yr)
Electoral Division (A.1) Pasture (A.2) Silage (B) Increased Yield (C) Back to production (D) 30% switch (B-D) Total Assuming losses of 10%
An Baile Dubh 11,480 1,660 332 918 2,755 4,006 160
An Clochán 6,580 1,150 230 526 1,579 2,336 112
An Daingean - 40 8 - - 8 15
An Mhin Aird 9,090 3,610 722 727 2,182 3,631 655
An Sráidbhaile 7,770 1,520 304 622 1,865 2,790 345
Ballinvoher 9,440 2,560 512 755 2,266 3,533 502
Ballynacourty 7,030 3,310 662 562 1,687 2,912 440
Baurtregaum 3,490 1,190 238 279 838 1,355 344
Blennerville 2,190 740 148 175 526 849 40
Boolteens 6,730 2,320 464 538 1,615 2,618 286
Castlegregory 6,790 1,930 386 543 1,630 2,559 300
Cé Bhréanainn 3,480 740 148 278 835 1,262 515
Ceann Trá 5,380 3,340 668 430 1,291 2,390 720
Cill Chuáin 10,980 2,390 478 878 2,635 3,992 317
Cill Maoilchéadair 9,200 2,660 532 736 2,208 3,476 92
Cinn Aird 9,050 4,560 912 724 2,172 3,808 492
Deelis 7,030 2,180 436 562 1,687 2,686 218
Dún Chaoin 3,810 690 138 305 914 1,357 177
Dún Urlann 8,100 3,110 622 648 1,944 3,214 112
Inch 8,590 1,810 362 687 2,062 3,111 229
Kilgarrylander 6,620 1,770 354 530 1,589 2,472 250
Kilgobban 8,370 1,460 292 670 2,009 2,970 1,299
Kiltallagh 8,260 4,680 936 661 1,982 3,579 146
Knockglass 3,390 1,010 202 271 814 1,287 412
Lack 4,570 1,300 260 366 1,097 1,722 170
Márthain 7,090 1,540 308 567 1,702 2,577 701
Na Gleannta 23,300 8,720 1,744 1,864 5,592 9,200 330
Total (tDM/yr) 197,810 61,990 12,398 15,825 47,474 75,697 9,378
Total (Nm3/yr) 72,372,745 22,680,281 4,536,056 5,789,820 17,369,459 27,695,335 1,617,729
16
C. Non-Agricultural Feedstocks
1. Food Waste
Food waste is suited to biogas plants as it can have a high biomethane potential, is readily available and plays a
part in the circular economy of a region. Food waste coming into a biogas plant can be subject to gate fees,
which help support the plant economy. A waste operator in the study area reported transport costs of €50 per
tonne of food waste to treatment centres. If a biogas plant was in the region, this could reduce those costs to
waste operators in the Dingle Peninsula.
Methodology
The theoretical biogas potential from collectable domestic food waste in the study area was calculated on a per
electoral division basis according to population data from the Census (2016) and an annual food waste
production factor of 84.5 kg/person [14]. The quantity of food waste available from businesses (restaurants,
hotels, shops, etc.) and non-permanent residents (holiday homes) was estimated according to the number of
domestic and overseas visitors to the study area using data from the County Kerry’s Tourism Strategy and Action
Plan 2016-2022 [15]. The same food waste production per person factor as above was used. A DM content of
30.6%, and a biomethane potential of 242 Nm3/tDM was used [16].
The practical potential for food waste was determined by surveying the two main food waste collection
businesses operating in the study area, indicating that:
Domestic households: 700 tonnes of wet matter annually, or 214.2 tDM/year.
Business customers: 2 tonnes of wet matter per week during the winter, and 4 during the summer (May to
August), equivalent to 136 tWM/year, or 41.6 tDM/year.
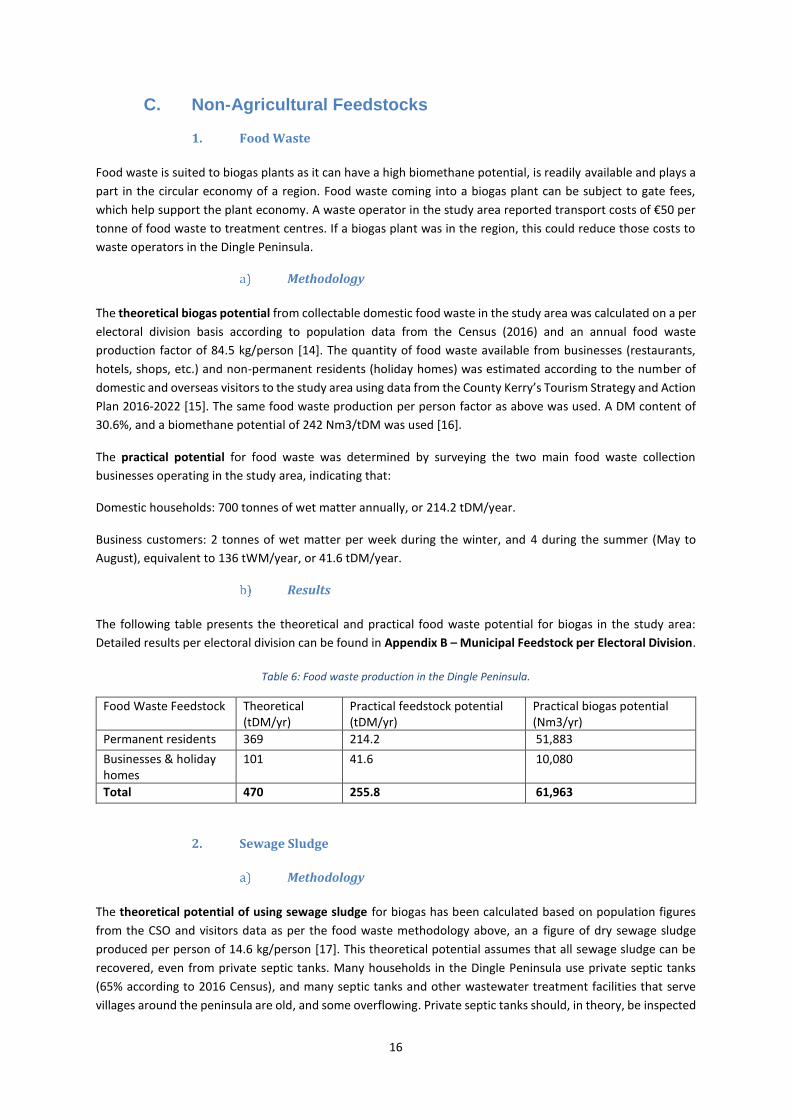
Results
The following table presents the theoretical and practical food waste potential for biogas in the study area:
Detailed results per electoral division can be found in Appendix B – Municipal Feedstock per Electoral Division.
Table 6: Food waste production in the Dingle Peninsula.
Food Waste Feedstock Theoretical (tDM/yr)
Practical feedstock potential (tDM/yr)
Practical biogas potential (Nm3/yr)
Permanent residents 369 214.2 51,883
Businesses & holiday homes
101 41.6 10,080
Total 470 255.8 61,963
2. Sewage Sludge
Methodology
The theoretical potential of using sewage sludge for biogas has been calculated based on population figures
from the CSO and visitors data as per the food waste methodology above, an a figure of dry sewage sludge
produced per person of 14.6 kg/person [17]. This theoretical potential assumes that all sewage sludge can be
recovered, even from private septic tanks. Many households in the Dingle Peninsula use private septic tanks
(65% according to 2016 Census), and many septic tanks and other wastewater treatment facilities that serve
villages around the peninsula are old, and some overflowing. Private septic tanks should, in theory, be inspected
17
and de-sludged (where necessary) at least once a year [18]. In reality, collecting sewage sludge from all private
homes would be unfeasible as there is no data available on what septic tanks in the study area are emptied
every year, if at all.
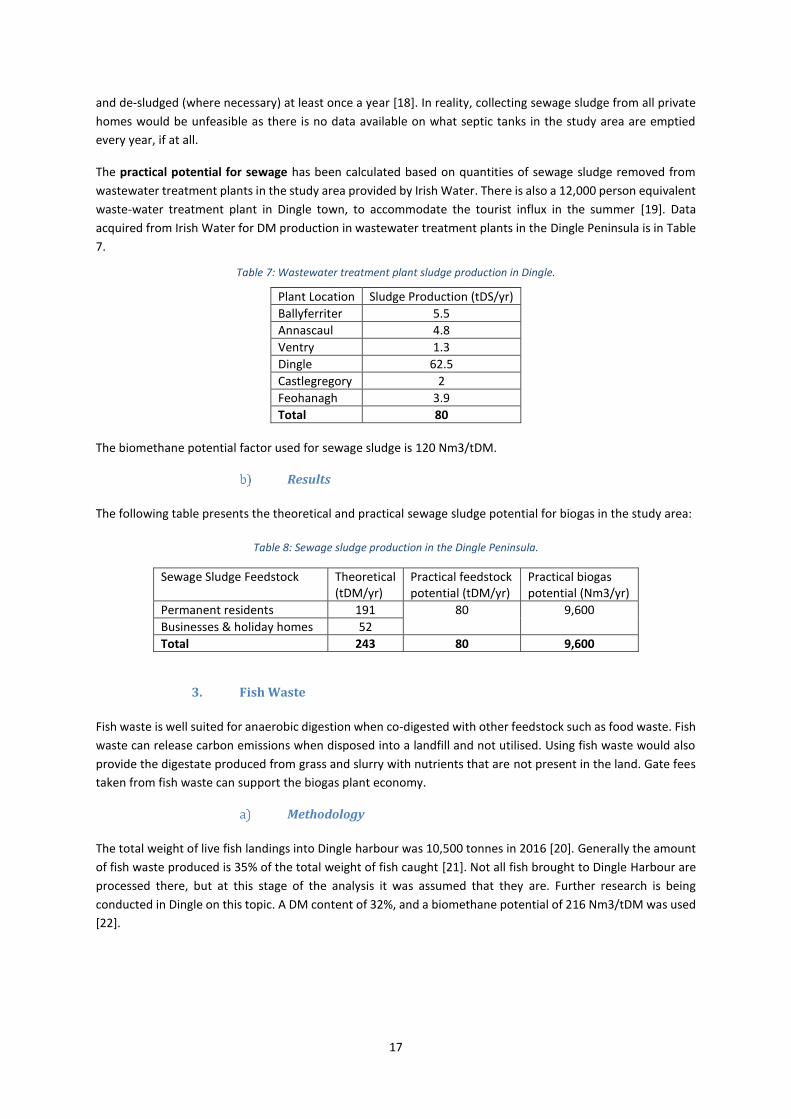
The practical potential for sewage has been calculated based on quantities of sewage sludge removed from
wastewater treatment plants in the study area provided by Irish Water. There is also a 12,000 person equivalent
waste-water treatment plant in Dingle town, to accommodate the tourist influx in the summer [19]. Data
acquired from Irish Water for DM production in wastewater treatment plants in the Dingle Peninsula is in Table
7.
Table 7: Wastewater treatment plant sludge production in Dingle.
Plant Location Sludge Production (tDS/yr)
Ballyferriter 5.5
Annascaul 4.8
Ventry 1.3
Dingle 62.5
Castlegregory 2
Feohanagh 3.9
Total 80
The biomethane potential factor used for sewage sludge is 120 Nm3/tDM.
Results
The following table presents the theoretical and practical sewage sludge potential for biogas in the study area:
Table 8: Sewage sludge production in the Dingle Peninsula.
Sewage Sludge Feedstock Theoretical (tDM/yr)
Practical feedstock potential (tDM/yr)
Practical biogas potential (Nm3/yr)
Permanent residents 191 80 9,600
Businesses & holiday homes 52
Total 243 80 9,600
3. Fish Waste
Fish waste is well suited for anaerobic digestion when co-digested with other feedstock such as food waste. Fish
waste can release carbon emissions when disposed into a landfill and not utilised. Using fish waste would also
provide the digestate produced from grass and slurry with nutrients that are not present in the land. Gate fees
taken from fish waste can support the biogas plant economy.
Methodology
The total weight of live fish landings into Dingle harbour was 10,500 tonnes in 2016 [20]. Generally the amount
of fish waste produced is 35% of the total weight of fish caught [21]. Not all fish brought to Dingle Harbour are
processed there, but at this stage of the analysis it was assumed that they are. Further research is being
conducted in Dingle on this topic. A DM content of 32%, and a biomethane potential of 216 Nm3/tDM was used
[22].
18
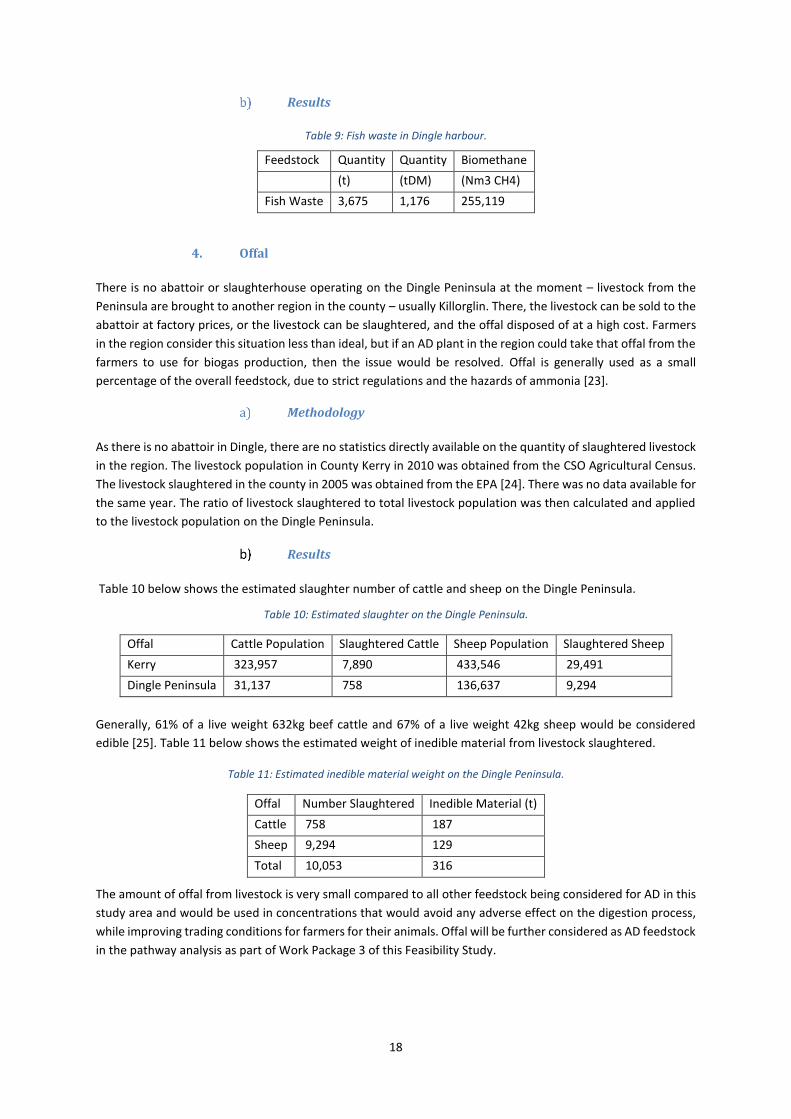
Results
Table 9: Fish waste in Dingle harbour.
Feedstock Quantity Quantity Biomethane
(t) (tDM) (Nm3 CH4)
Fish Waste 3,675 1,176 255,119
4. Offal
There is no abattoir or slaughterhouse operating on the Dingle Peninsula at the moment – livestock from the
Peninsula are brought to another region in the county – usually Killorglin. There, the livestock can be sold to the
abattoir at factory prices, or the livestock can be slaughtered, and the offal disposed of at a high cost. Farmers
in the region consider this situation less than ideal, but if an AD plant in the region could take that offal from the
farmers to use for biogas production, then the issue would be resolved. Offal is generally used as a small
percentage of the overall feedstock, due to strict regulations and the hazards of ammonia [23].
Methodology
As there is no abattoir in Dingle, there are no statistics directly available on the quantity of slaughtered livestock
in the region. The livestock population in County Kerry in 2010 was obtained from the CSO Agricultural Census.
The livestock slaughtered in the county in 2005 was obtained from the EPA [24]. There was no data available for
the same year. The ratio of livestock slaughtered to total livestock population was then calculated and applied
to the livestock population on the Dingle Peninsula.
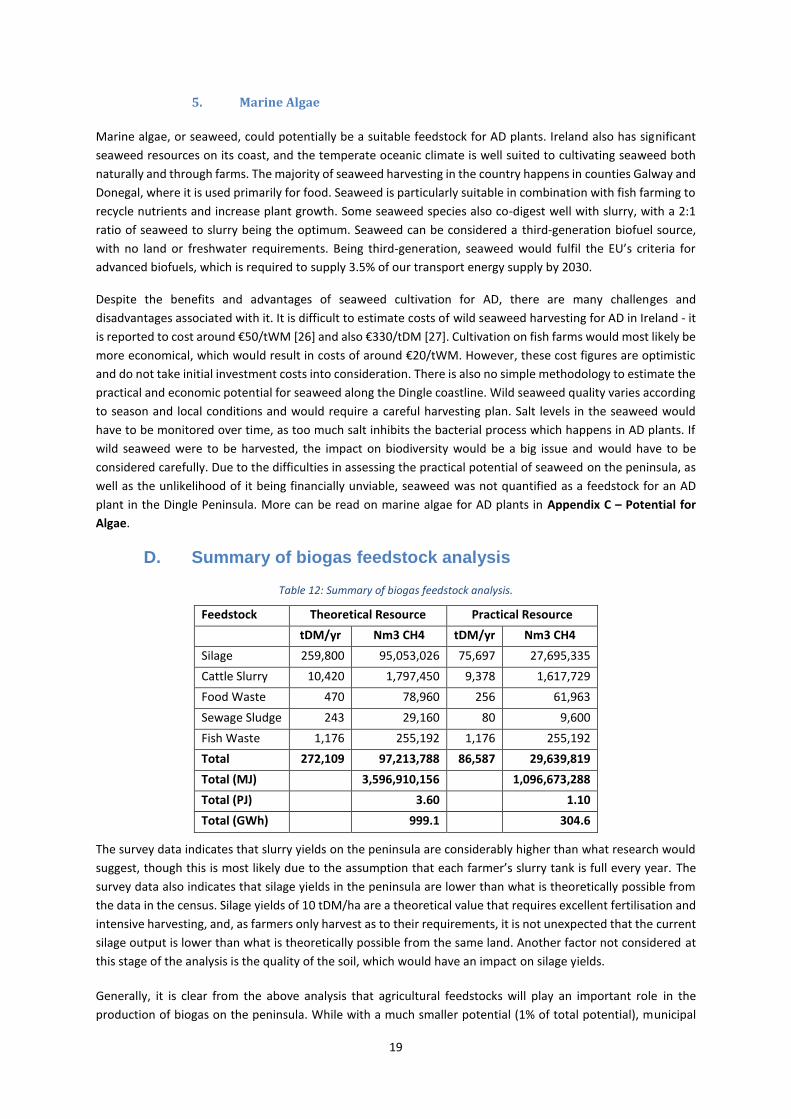
Results
Table 10 below shows the estimated slaughter number of cattle and sheep on the Dingle Peninsula.
Table 10: Estimated slaughter on the Dingle Peninsula.
Offal Cattle Population Slaughtered Cattle Sheep Population Slaughtered Sheep
Kerry 323,957 7,890 433,546 29,491
Dingle Peninsula 31,137 758 136,637 9,294
Generally, 61% of a live weight 632kg beef cattle and 67% of a live weight 42kg sheep would be considered
edible [25]. Table 11 below shows the estimated weight of inedible material from livestock slaughtered.
Table 11: Estimated inedible material weight on the Dingle Peninsula.
Offal Number Slaughtered Inedible Material (t)
Cattle 758 187
Sheep 9,294 129
Total 10,053 316
The amount of offal from livestock is very small compared to all other feedstock being considered for AD in this
study area and would be used in concentrations that would avoid any adverse effect on the digestion process,
while improving trading conditions for farmers for their animals. Offal will be further considered as AD feedstock
in the pathway analysis as part of Work Package 3 of this Feasibility Study.
19
5. Marine Algae
Marine algae, or seaweed, could potentially be a suitable feedstock for AD plants. Ireland also has significant
seaweed resources on its coast, and the temperate oceanic climate is well suited to cultivating seaweed both
naturally and through farms. The majority of seaweed harvesting in the country happens in counties Galway and
Donegal, where it is used primarily for food. Seaweed is particularly suitable in combination with fish farming to
recycle nutrients and increase plant growth. Some seaweed species also co-digest well with slurry, with a 2:1
ratio of seaweed to slurry being the optimum. Seaweed can be considered a third-generation biofuel source,
with no land or freshwater requirements. Being third-generation, seaweed would fulfil the EU’s criteria for
advanced biofuels, which is required to supply 3.5% of our transport energy supply by 2030.
Despite the benefits and advantages of seaweed cultivation for AD, there are many challenges and
disadvantages associated with it. It is difficult to estimate costs of wild seaweed harvesting for AD in Ireland - it
is reported to cost around €50/tWM [26] and also €330/tDM [27]. Cultivation on fish farms would most likely be
more economical, which would result in costs of around €20/tWM. However, these cost figures are optimistic
and do not take initial investment costs into consideration. There is also no simple methodology to estimate the
practical and economic potential for seaweed along the Dingle coastline. Wild seaweed quality varies according
to season and local conditions and would require a careful harvesting plan. Salt levels in the seaweed would
have to be monitored over time, as too much salt inhibits the bacterial process which happens in AD plants. If
wild seaweed were to be harvested, the impact on biodiversity would be a big issue and would have to be
considered carefully. Due to the difficulties in assessing the practical potential of seaweed on the peninsula, as
well as the unlikelihood of it being financially unviable, seaweed was not quantified as a feedstock for an AD
plant in the Dingle Peninsula. More can be read on marine algae for AD plants in Appendix C – Potential for
Algae.
D. Summary of biogas feedstock analysis
Table 12: Summary of biogas feedstock analysis.
Feedstock Theoretical Resource Practical Resource
tDM/yr Nm3 CH4 tDM/yr Nm3 CH4
Silage 259,800 95,053,026 75,697 27,695,335
Cattle Slurry 10,420 1,797,450 9,378 1,617,729
Food Waste 470 78,960 256 61,963
Sewage Sludge 243 29,160 80 9,600
Fish Waste 1,176 255,192 1,176 255,192
Total 272,109 97,213,788 86,587 29,639,819
Total (MJ)
3,596,910,156
1,096,673,288
Total (PJ)
3.60
1.10
Total (GWh) 999.1 304.6
The survey data indicates that slurry yields on the peninsula are considerably higher than what research would
suggest, though this is most likely due to the assumption that each farmer’s slurry tank is full every year. The
survey data also indicates that silage yields in the peninsula are lower than what is theoretically possible from
the data in the census. Silage yields of 10 tDM/ha are a theoretical value that requires excellent fertilisation and
intensive harvesting, and, as farmers only harvest as to their requirements, it is not unexpected that the current
silage output is lower than what is theoretically possible from the same land. Another factor not considered at
this stage of the analysis is the quality of the soil, which would have an impact on silage yields.
Generally, it is clear from the above analysis that agricultural feedstocks will play an important role in the
production of biogas on the peninsula. While with a much smaller potential (1% of total potential), municipal
20
and industrial feedstocks in the region would also play a part, as they typically attract a gate fee of between €50
and €75 per wet tonne. By comparison, silage is relatively costly as a feedstock, which would have a significant
impact on the viability of an AD plant. Further research into the potential of municipal and industrial waste from
outside of the study area would be justified in terms of generating gate fee revenues for an AD plant based on
the peninsula.
The seasonality of feedstocks must also be taken into consideration. Food waste and sewage sludge production
on the peninsula are significantly seasonal due to the large influx of tourists in the summer months. Equally, the
seasonality of slurry and silage harvesting and storage will impact the potential material flows into AD plant(s)
in the study area. This will be researched further as part of Work Package 3.
Finally, it is worth noting that the practical AD feedstock potential in the study area estimated at 32.6 million
Nm3 of methane (CH4) in above has an energy content of 304.6 GWh, compared to 315.5 GWh of final energy
usage in the study area according to Dingle’s EMP. This is promising in terms of the potential for AD to contribute
to meeting the local energy needs in a sustainable manner. The next step will be to assess the different
technological pathways whereby biogas can be converted to useful energy for heat, electricity and transport.
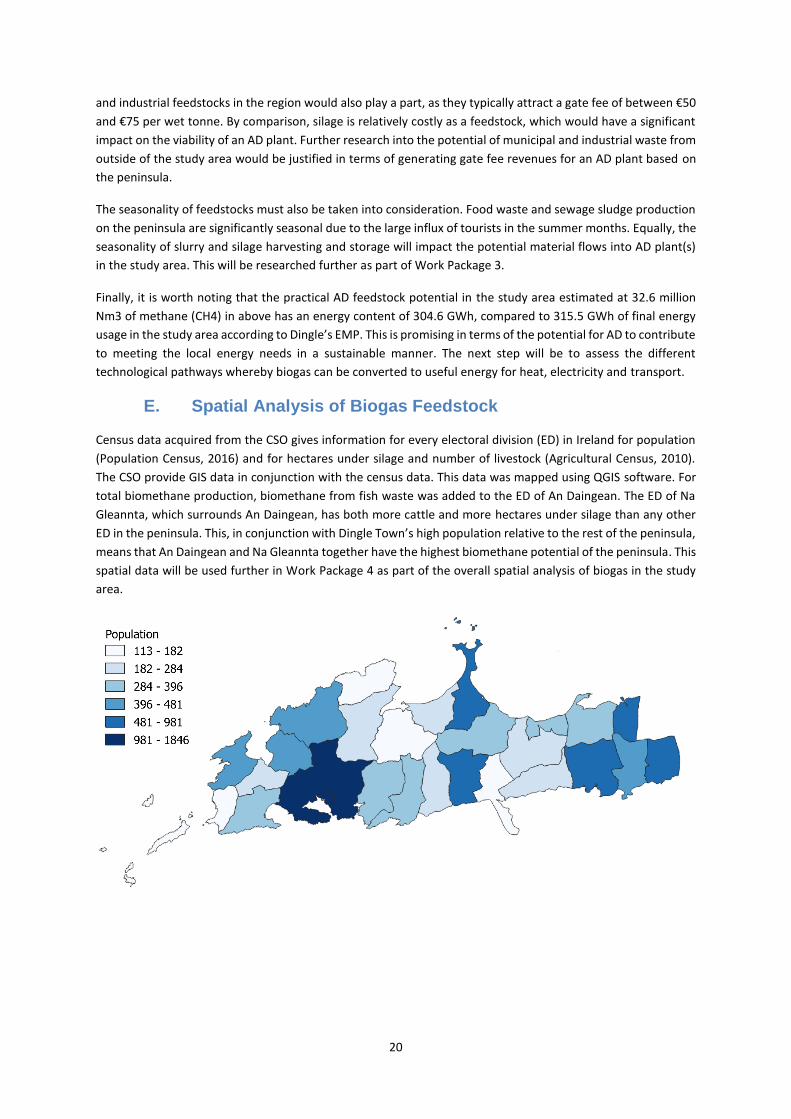
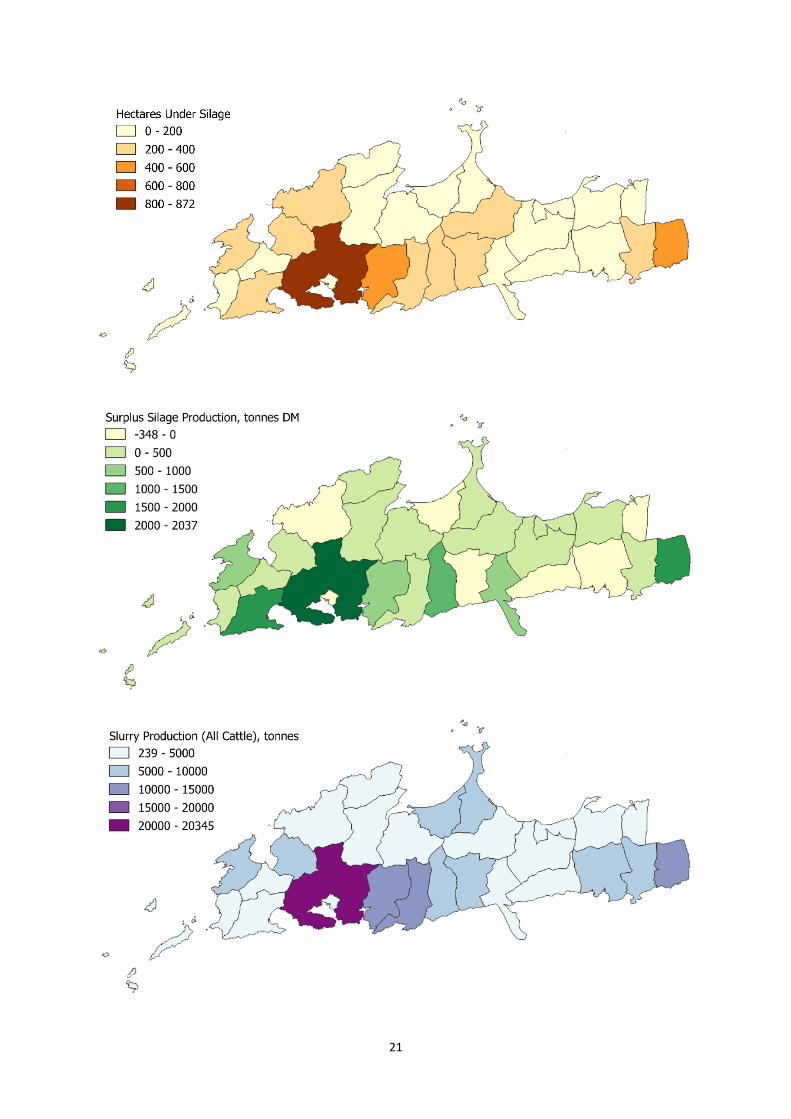
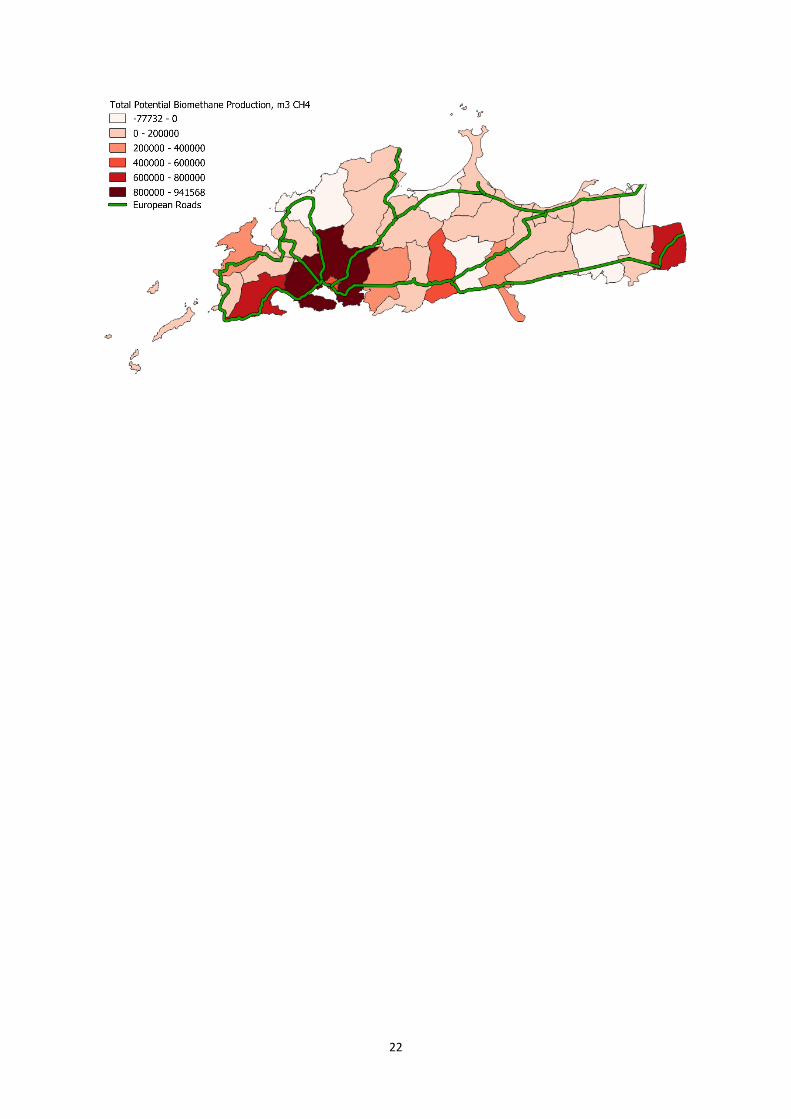
E. Spatial Analysis of Biogas Feedstock
Census data acquired from the CSO gives information for every electoral division (ED) in Ireland for population
(Population Census, 2016) and for hectares under silage and number of livestock (Agricultural Census, 2010).
The CSO provide GIS data in conjunction with the census data. This data was mapped using QGIS software. For
total biomethane production, biomethane from fish waste was added to the ED of An Daingean. The ED of Na
Gleannta, which surrounds An Daingean, has both more cattle and more hectares under silage than any other
ED in the peninsula. This, in conjunction with Dingle Town’s high population relative to the rest of the peninsula,
means that An Daingean and Na Gleannta together have the highest biomethane potential of the peninsula. This
spatial data will be used further in Work Package 4 as part of the overall spatial analysis of biogas in the study
area.
21
22
23
V. References
[1] UN, “TRANSFORMING OUR WORLD: THE 2030 AGENDA FOR SUSTAINABLE DEVELOPMENT UNITED NATIONS UNITED NATIONS TRANSFORMING OUR WORLD: THE 2030 AGENDA FOR SUSTAINABLE DEVELOPMENT.” [Online]. Available: https://sustainabledevelopment.un.org/content/documents/21252030 Agenda for Sustainable Development web.pdf. [Accessed: 31-Jul-2019].
[2] UN, “Paris Agreement,” 2015. [Online]. Available: https://unfccc.int/sites/default/files/english_paris_agreement.pdf. [Accessed: 31-Jul-2019].
[3] C. A. & E. Department of Communications, “Climate Action Plan.” [Online]. Available: https://www.dccae.gov.ie/en-ie/climate-action/Pages/default.aspx. [Accessed: 31-Jul-2019].
[4] Kerry County Council, “Chapter 13: Development Management - Standards & Guidelines,” 2015. [Online]. Available: http://cdp.kerrycoco.ie/wordpress/wp-content/uploads/2015/12/chptr_13.pdf. [Accessed: 31-Jul-2019].
[5] Kerry County Council, “Renewable Energy Strategy 2012,” 2012. [Online]. Available: http://www.kerrycoco.ie/home3/planning/planning-policy/renewable-energy-strategy-2012/. [Accessed: 31-Jul-2019].
[6] XD Sustainable Energy Consulting Ltd., “Transition Kerry’s Sustainable Energy Community Roadmap.” [Online]. Available: http://www.transitionkerry.org/wp-content/uploads/2014/12/TransitionKerrySECRoadmap_FinalReport.pdf. [Accessed: 31-Jul-2019].
[7] EPA, “Public Access to Licensing Files,” Environmental Protection Agency (EPA). [Online]. Available: https://www.epa.ie/licensing/info/files/. [Accessed: 06-Aug-2019].
[8] R. O’Shea, I. Kilgallon, D. Wall, and J. D. Murphy, “Quantification and location of a renewable gas industry based on digestion of wastes in Ireland,” Applied Energy, 2016. [Online]. Available: http://www.sciencedirect.com/science/article/pii/S0306261916305931.
[9] Kerry County Council, “Focus on agriculture In County Kerry.” [Online]. Available: http://atomik.kerrycoco.ie/ebooks/agri.pdf. [Accessed: 06-Aug-2019].
[10] “Grass10 - Teagasc | Agriculture and Food Development Authority.” [Online]. Available: https://www.teagasc.ie/crops/grassland/grass10/. [Accessed: 19-Jul-2019].
[11] E. Dillon, B. Moran, J. Lennon, and T. Donnellan, “Teagasc National Farm Survey 2018 Preliminary Results.” [Online]. Available: https://www.teagasc.ie/media/website/publications/2019/National-Farm-Survey-Preliminary-Results-2018.pdf. [Accessed: 12-Jul-2019].
[12] C. Buckley et al., “Teagasc National Farm Survey 2017 Sustainability Report,” 2019. [Online]. Available: https://www.teagasc.ie/media/website/publications/2019/2017-sustainability-report-250319.pdf. [Accessed: 12-Jul-2019].
[13] T. Hennessy, C. Buckley, M. Cushion, A. Kinsella, and B. Moran, “National Farm Survey of Manure Application and Storage Practices on Irish Farms,” 2011. [Online]. Available: https://www.teagasc.ie/media/website/publications/2011/TeagascNationalFarmSurveyOfManureApplication.pdf. [Accessed: 01-Apr-2019].
[14] F. Amlinger, E. Favoino, M. Prasad, and P. Foster, “The Collectable Source Separated Food and Garden Waste Arising from Households in Ireland,” 2010. [Online]. Available: http://www.cre.ie/web/wp-content/uploads/2010/12/Collectable-Household-Food-and-Garden-Waste-in-Ireland1.pdf. [Accessed: 01-Apr-2019].
[15] Kerry County Council, “Tourism Strategy and Action Plan 2016 - 2022,” 2016. [Online]. Available: http://docstore.kerrycoco.ie/KCCWebsite/Tourism/TourismStrategy.pdf. [Accessed: 31-Jul-2019].
24
[16] J. D. Browne, E. Allen, and J. D. Murphy, “Assessing the variability in biomethane production from the organic fraction of municipal solid waste in batch and continuous operation,” Applied Energy, 2014. [Online]. Available: http://www.sciencedirect.com/science/article/pii/S0306261914004607.
[17] A. Kelessidis and A. S. Stasinakis, “Comparative study of the methods used for treatment and final disposal of sewage sludge in European countries,” Waste Management, 01-Jun-2012. [Online]. Available: https://www.sciencedirect.com/science/article/pii/S0956053X12000268. [Accessed: 14-Jan-2019].
[18] E. P. A. (EPA), “What you can do to improve your treatment system,” Environmental Protection Agency (EPA). [Online]. Available: https://www.epa.ie/water/wastewater/legislation/youdo/. [Accessed: 06-Aug-2019].
[19] European Commission, “Dingle Waste Water Treatment Plant.” [Online]. Available: https://uwwtd.eu/Ireland/treatment-plant/ietp_172/2012. [Accessed: 02-Apr-2019].
[20] BIM, “The Business of Seafood 2016 - A Snapshot of Ireland’s Seafood Sector,” 2016. [Online]. Available: http://www.bim.ie/media/bim/content/publications/corporate-other-publications/BIM-the-business-of-seafood-2016.pdf. [Accessed: 25-Mar-2019].
[21] M. Archer, “Fish Waste Production in the United Kingdom - The Quantities Produced and Opportunities for Better Utilisation,” 2001. [Online]. Available: https://www.seafish.org/media/Publications/SR537.pdf. [Accessed: 02-Apr-2019].
[22] A. Mshandete, A. Kivaisi, M. Rubindamayugi, and B. Mattiasson, “Anaerobic batch co-digestion of sisal pulp and fish wastes,” Bioresource Technology, 01-Oct-2004. [Online]. Available: https://www.sciencedirect.com/science/article/pii/S0960852404000331. [Accessed: 02-Apr-2019].
[23] S. Moskowitz, “Anaerobic Digestion of Slaughterhouse Waste.” [Online]. Available: https://pdfs.semanticscholar.org/7e5a/a7891694d6bee2a2cb86107940c881621202.pdf. [Accessed: 19-Jul-2019].
[24] EPA, “Anaerobic Digestion: Decision Support Software,” Environmental Protection Agency (EPA), 2005. [Online]. Available: http://erc.epa.ie/safer/iso19115/displayISO19115.jsp?isoID=38. [Accessed: 19-Jul-2019].
[25] C. Walsh, “The use of Animal By-products The improving opportunities to add value to the beef and sheep slaughtering sectors,” 2014. [Online]. Available: https://beefandlamb.ahdb.org.uk/wp-content/uploads/2016/07/74318-5th-Quarter-Use-and-Flow-Final-Report-130514.pdf. [Accessed: 20-Jul-2019].
[26] M. R. Tabassum, A. Xia, and J. D. Murphy, “Potential of seaweed as a feedstock for renewable gaseous fuel production in Ireland,” Renewable and Sustainable Energy Reviews, 2017. [Online]. Available: http://www.sciencedirect.com/science/article/pii/S1364032116305962.
[27] T. Bruton, “A Review of the Potential of Marine Algae as a Source of Biofuel in Ireland.” [Online]. Available: http://www.fao.org/uploads/media/0902_SEI_-_A_Review_of_the_Potential_of_Marine_Algae.pdf. [Accessed: 16-Jul-2019].
[28] CSO, “Information Note for Data Users: revision to the Irish NUTS 2 and NUTS 3 Regions - CSO - Central Statistics Office.” [Online]. Available: https://www.cso.ie/en/methods/revnuts23/. [Accessed: 31-Jul-2019].
Quotation – NLSEC Feasibility Study for Community Owned Solar PV Farm
25
VI. Appendix
A. Appendix A – Survey
Quotation – NLSEC Feasibility Study for Community Owned Solar PV Farm
26
Quotation – NLSEC Feasibility Study for Community Owned Solar PV Farm
27
Quotation – NLSEC Feasibility Study for Community Owned Solar PV Farm
28
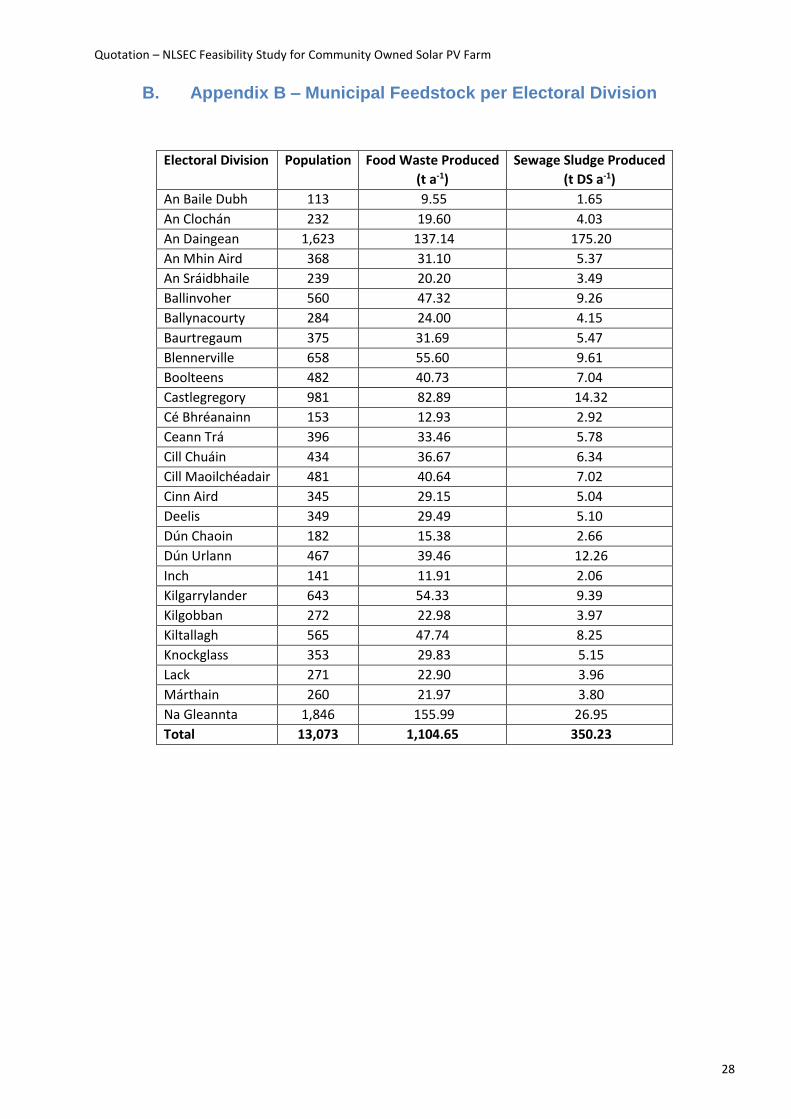
B. Appendix B – Municipal Feedstock per Electoral Division
Electoral Division Population Food Waste Produced Sewage Sludge Produced
(t a-1) (t DS a-1)
An Baile Dubh 113 9.55 1.65
An Clochán 232 19.60 4.03
An Daingean 1,623 137.14 175.20
An Mhin Aird 368 31.10 5.37
An Sráidbhaile 239 20.20 3.49
Ballinvoher 560 47.32 9.26
Ballynacourty 284 24.00 4.15
Baurtregaum 375 31.69 5.47
Blennerville 658 55.60 9.61
Boolteens 482 40.73 7.04
Castlegregory 981 82.89 14.32
Cé Bhréanainn 153 12.93 2.92
Ceann Trá 396 33.46 5.78
Cill Chuáin 434 36.67 6.34
Cill Maoilchéadair 481 40.64 7.02
Cinn Aird 345 29.15 5.04
Deelis 349 29.49 5.10
Dún Chaoin 182 15.38 2.66
Dún Urlann 467 39.46 12.26
Inch 141 11.91 2.06
Kilgarrylander 643 54.33 9.39
Kilgobban 272 22.98 3.97
Kiltallagh 565 47.74 8.25
Knockglass 353 29.83 5.15
Lack 271 22.90 3.96
Márthain 260 21.97 3.80
Na Gleannta 1,846 155.99 26.95
Total 13,073 1,104.65 350.23
Quotation – NLSEC Feasibility Study for Community Owned Solar PV Farm
29
C. Appendix C – Potential for Algae
Written by David Wall
Dingle Peninsula Study: Potential for Algae
Seaweed biomass can potentially provide an attractive feedstock for anaerobic digestion (AD) in particular
circumstances. Ireland has a significant potential with its considerable coastline (7500km) and temperate oceanic
climate to accumulate a sizeable seaweed resource both naturally and through farm cultivation. Irish brown seaweeds
include for Ascophyllum nodosum, Laminaria digitata, Laminaria hyperborea, Saccharina latissima and Saccorhiza
polyschides. Of these, Laminaria digitata and Saccharina latissima have been identified as having most potential due to
their rich organic composition (Tabassum et al., 2017). The estimated production of Irish seaweeds is 29,500 tonnes wet
weight per annum, occurring naturally (Tabassum et al., 2018). This harvest is dominated by Ascophyllum nodosum
which mainly accumulates in the north west of Ireland in Donegal and Galway (Murphy et al., 2013). At present, the
natural seaweed resource in Ireland is used primarily for food and not biofuels (Tabassum et al., 2016a).
Seaweed (macro-algae) can be considered a third-generation biofuel source as it does not have any land or fresh water
requirements as compared to traditional energy crops. It is also proposed as a feedstock that can achieve higher growth
rates and higher rates of carbon fixation than land-based energy crops (Tabassum et al., 2017). Additionally, due to the
absence of lignin (complex polymers) and hemicellulose, seaweed can be a more suitable biomass for digestion that
allows for easier fermentation and minimal pre-treatment (Tabassum et al., 2018; Xia et al., 2015). However, the
morphology of brown seaweed can vary substantially depending on the growth conditions at a given location; this
includes for temperature, nutrients, sunlight and water flow. The body of the plant can be divided into different
sections, namely the holdfast, stipe and frond, and the composition of each component can vary in terms of organic
content. The frond has been identified as the most significant fraction in terms of contributing to biogas production
(Tabassum et al., 2018). Despite the potential of natural seaweed stock for energy production, certain biodiversity issues
must obviously be considered. Thus, a more favourable pathway proposed is the farm cultivation of seaweed, a concept
known as integrated multi-trophic aquaculture (IMTA). Such a method combines seaweed cultivation with fish
(salmon/mussel) farms. The benefit of this approach is that the nutrient waste from the fish can be sequestered by the
seaweed and thereby cause increased plant growth as compared to pristine waters. The prospect of such a strategy will
depend on the location of fish farm sites, however this is deemed the most economical method for seaweed farming
(Tabassum et al., 2016a). Yields of 40-150 tonnes wet weight per hectare per annum have been indicated for seaweed
farm cultivation.
The seasonal variation of seaweed is one of the main characteristics to be considered if it is to be used as a biomass
resource for AD. The biochemical composition of seaweed will vary throughout the year as the seaweeds becomes ‘ripe’.
This will have inherent impact on the biogas production. For brown seaweed, the build-up of carbohydrates has typically
been reported in the summer and autumn; in the winter, carbohydrates are used as an energy source in cellular
activities (Tabassum et al., 2016b). Additionally, the ash content of seaweeds will vary throughout the year, for AD the
feedstock should have as minimal ash as possible. Another concern is the build-up of polyphenols, inhibitory compounds
for AD, which is dependent on the geographic location, harvest time light intensity and nutrient availability amongst
other factors. Significant seasonal variation has been reported for brown seaweeds. Literature studies have previously
shown that high polyphenol content in summer months adversely affected biogas production for Ascophyllum nodosum;
two potential harvest dates were thus suggested, March and October. In October the SMY reported was 215 L CH4 kg
VS−1 (47 m3 CH4 t−1) equivalent to a gross energy yield of 116 GJ ha−1 yr−1 (Tabassum et al., 2016b). For Laminaria digitata,
significant seasonal variation in biochemical composition is evident. August was indicated as the optimal harvest time
for this seaweed species with the SMY reported at 327 L CH4 kg VS−1 (53 m3 CH4 t−1) equivalent to a gross energy yield
of 200 GJ ha−1 yr−1. The SMY was 40% higher than that for a December harvest indicating the impact of seasonal
variation.
From a biogas production perspective, the potential for seaweed in Ireland is dependent on the availability of other
feedstocks (in the vicinity) that can be used in co-digestion, for example, farm slurries and the organic fraction of
municipal solid waste (OFMSW). This is deemed a more integrated approach. Indicative laboratory trials, co-digesting
Quotation – NLSEC Feasibility Study for Community Owned Solar PV Farm
30
cultivated Saccharina latissima with dairy slurry at a ratio of 2:1 (on a volatile solids basis), have been shown to generate
a specific methane yield (SMY) of 252 L CH4 kg−1 VS at an organic loading rate (OLR) of 4 kg VS m−3 d−1 (Tabassum et al.,
2016a). For natural stock Laminaria digitata co-digested with dairy slurry at a ratio of 2:1 (on a volatile solids basis), the
SMY reported was 232 L CH4 kg−1 VS at an OLR of 5 kg VS m−3 d−1 (Tabassum et al., 2016a). These can be considered quite
high OLRs.
Seaweeds typically have much higher chloride content as compared with land-based biomass sources, due to their origin
in the marine environment. A particular concern for the use of seaweed for AD is the accumulating salt concentrations,
which can be deemed the inorganic, ash component of the plant. Ensuring that the inoculum (microorganisms) in the
digester are acclimatised to tolerate higher salt concentrations is of importance to maximising the biogas production
(Tabassum et al., 2016a). In the laboratory trials reported for cultivated Saccharina latissima and natural stock Laminaria
digitate, chloride concentrations increased to high levels in digestion but were not found to be detrimental to operation.
However, accumulation of salts was evident and accelerated at higher loading rates, thus, longer term operation of such
digesters would require carefully monitoring (Tabassum et al., 2016a).
Beyond brown seaweed, Ulva Lactuca is a species of green seaweed, commonly referred to as sea lettuce, that appears
along the Irish coastline in shallow estuaries and on beaches. Green seaweed accumulates due to over excessive
agricultural practices and more specifically, eutrophication, whereby water sources become contaminated and overly
enriched with nutrients. Such circumstances are referred to as “green tides” or “algal blooms” and are a common
occurrence in Ireland and worldwide in countries such as France, Denmark and Japan. Algal blooms can result in the
closure of beaches and dangerous conditions due to the build-up of toxic gases such as hydrogen sulphide (H2S) as the
high-sulphur containing seaweed rots. One example of this problem is in Timoleague in West Cork, where every year
10,000 tonnes of sea lettuce washes up on the strand as a result of eutrophication of the bay. The problematic sea
lettuce is removed manually at a cost. However, Ulva Lactuca may present a potential resource if it can be utilised for
AD. Ulva Lactuca could be combined with slurry and excess grass available from local farmers or food waste from local
supermarkets to increase the biogas produced. Optimum conditions reported for Ulva Lactuca in digestion were
reported at a mix of 25% fresh Ulva lactuca and 75% dairy slurry (on a volatile solids basis) which generated a SMY of
170 L CH4 kg-1 VS at an OLR of 2.5 kg VS m-3 d-1 (Allen et al., 2014). Despite being a more difficult substrate to work with
due to high sulphur levels and a low C:N ratio, utilising AD to treat Ulva Lactuca would not only provide a source of
indigenous energy in Ireland but also a means of reducing the detrimental effects caused to the amenity of the Irish
coastline.
The importance of seaweed in the future is its merit as a third generation (advanced) biofuel in transport. The latest
recast of the EU Renewable Energy Directive (REDII) requires that 3.5% of transport energy must come from advanced
biofuel sources by 2030. The target may be achievable by applying innovative technologies using seaweed as an
alternative substrate for gaseous fuel production. The transport biofuel must also achieve 65% greenhouse gas
emissions savings as compared to fossil fuels. Emissions savings from seaweed biomethane systems are varied
depending on how they system is configured (22-70% savings have been suggested) (Czyrnek-Delêtre et al., 2017).
Quotation – NLSEC Feasibility Study for Community Owned Solar PV Farm
31
References
Allen, E., Wall, D.M., Herrmann, C., Murphy, J.D. 2014. Investigation of the optimal percentage of green seaweed that may be co-digested with dairy slurry to produce gaseous biofuel. Bioresource Technology, 170, 436-444.
Czyrnek-Delêtre, M.M., Rocca, S., Agostini, A., Giuntoli, J., Murphy, J.D. 2017. Life cycle assessment of seaweed biomethane, generated from seaweed sourced from integrated multi-trophic aquaculture in temperate oceanic climates. Applied Energy, 196, 34-50.
Murphy, F., Devlin, G., Deverell, R., McDonnell, K. 2013. Biofuel Production in Ireland—An Approach to 2020 Targets with a Focus on Algal Biomass. Energies, 6(12), 6391-6412.
Tabassum, M.R., Wall, D.M., Murphy, J.D. 2016a. Biogas production generated through continuous digestion of natural and cultivated seaweeds with dairy slurry. Bioresource Technology, 219, 228-238.
Tabassum, M.R., Xia, A., Murphy, J.D. 2018. Biomethane production from various segments of brown seaweed. Energy Conversion and Management, 174, 855-862.
Tabassum, M.R., Xia, A., Murphy, J.D. 2017. Potential of seaweed as a feedstock for renewable gaseous fuel production in Ireland. Renewable and Sustainable Energy Reviews, 68, 136-146.
Tabassum, M.R., Xia, A., Murphy, J.D. 2016b. Seasonal variation of chemical composition and biomethane production from the brown seaweed Ascophyllum nodosum. Bioresource Technology, 216, 219-226.
Xia, A., Jacob, A., Herrmann, C., Tabassum, M.R., Murphy, J.D. 2015. Production of hydrogen, ethanol and volatile fatty acids from the seaweed carbohydrate mannitol. Bioresource Technology, 193, 488-497.