feasibility study on pakbeng hydropower project - … … · · 2017-01-17feasibility study on...
TRANSCRIPT

Feasibility Study on Pakbeng Hydropower Project

1. Background
2. Hydrology
3. Adjustment of FSL 4. Installed Capacity 5. Reservoir Inundation 6. Project Layout 7. Alteration to Installed Capacity
CONTENTS
Background
Part 1
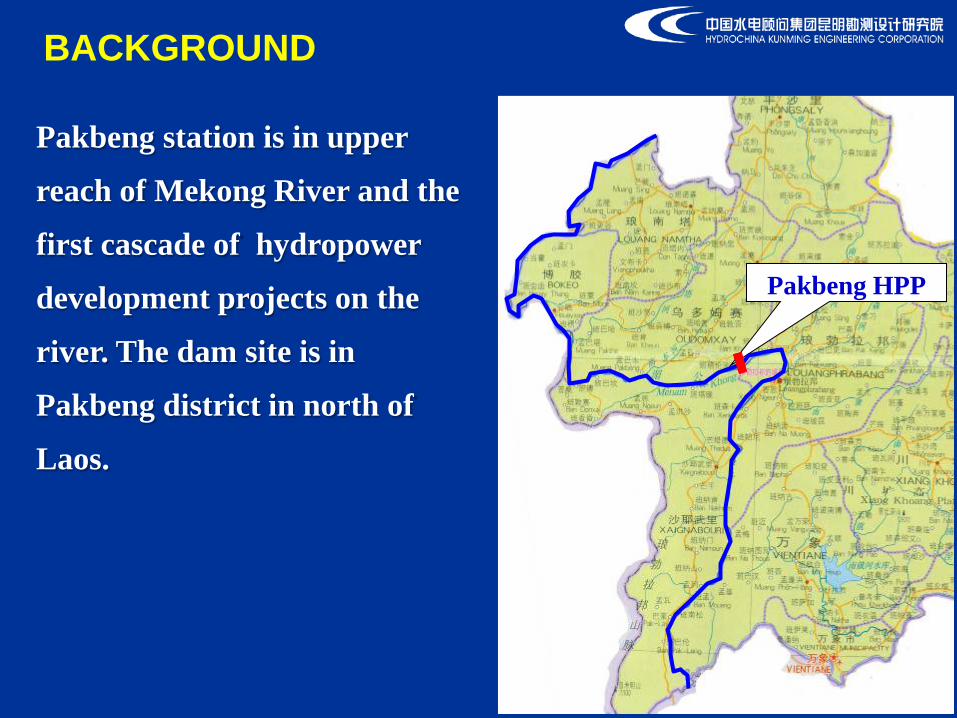
Pakbeng HPP
BACKGROUND Pakbeng station is in upper
reach of Mekong River and the
first cascade of hydropower
development projects on the
river. The dam site is in
Pakbeng district in north of
Laos.

In December 2008, the Feasibility Study
Report to GOL was concluded, in which
the FSL was 345m mainly according to
Mekong Mainstream Run-of-River
Hydropower published by MRC in
1994.
At the same time, Initial Environmental
Examination (IEE) jointly prepared by
Norconsult and Earth Systems LAO
was submitted.
BACKGROUND

BACKGROUND In February 2009, GOL organized a meeting to examine the Report, and in May 2009, officially replied the Feasibility Study with the requirement of 'for the normal water level and tail water level shall be determined after completion of Optimization Study carried out by CNR ' for final FSR.

•In July 2009, CNR completed Optimization Study of Mekong Mainstream Hydropower.
• In January 2010,GOL made it clear that in order not to affect Thailand, the maximum operating water level of Pak Beng Project should not exceed 340m.
BACKGROUND

• After the FSL was adjusted from 345m to 340m, the reservoir inundation indicator and compensation cost would be greatly reduced, and the installed capacity would also be reduced from 1,230 MW to 855 MW accordingly. •Therefore, this presentation mainly focus on design changes after the adjustment of FSL.
BACKGROUND

Hydrology
Part 2

• More hydrological data including Chiang Saen and Luangprabang Hydrological Stations were collected.
• Methodology is the same as that in last version of FS report
• Annual mean flow is 3,160 m3/s at Pak Beng dam site (Same as the data of last version)
Hydrology
Mean Flow
1 2 3 4 5 6 7 8 9 10 11 12 year
1,350 1,060 912 973 1,440 2,740 5,450 7,770 6,770 4,490 2,950 1,870 3,160
3.56 2.80 2.41 2.57 3.80 7.23 14.4 20.5 17.9 11.8 7.78 4.93 100

P(%) Chiang Saen (m3/s)
Laungprabang (m3/s)
Dam site (m3/s) P(%)
Chiang Saen (m3/s)
Laungprabang (m3/s)
Dam site (m3/s)
0.05 29800 30900 30200 2 20000 23700 21400
0.1 28100 29600 28700 5 17400 21600 18900
0.2 26200 28300 27000 10 15300 19900 17000
0.5 23800 26500 24800 20 13100 18100 14900
1 21900 25100 23100 50 9700 15000 11600
Hydrology •Design flood discharge: 27,000 m3/s •Check flood discharge: 30,200 m3/s •Flood results is close to results of CNR or MRC

Adjustment of FSL
Part 3

Adjustment of FSL
Main factors for determination of FSL The dam crest elevation is controlled by check flood level
which is 343.81m, so it is economic to raise the full supply water level below 344m .
Topographic and geological issues are not restrictive factors.
GOL made it clear that the construction of Pak Beng Hydropower Project could not inundate KengPhaDai, and officially advised on January 5, 2010 that its normal water level should not exceed 340m.

PB HPP
KengPhaDaikm97
Nam Ngao km105
Nam Ing km115
Chiang Khong km125
Pak Beng Reservior is shown as followed. Mainly Sensitive objects include KengPhaDai ,Nam Ing River,Nam Ngao,etc.
Adjustment of FSL

Laos Thailand
Generally speaking,under natural condition, the water level of this area moves from 337m to 344m with the average of 340m in flood season, and it will be from 332m to 337m with the average of 335m in dry season.
Overview of KengPhaDai
Adjustment of FSL

Adjustment of FSL
Overview of KengPhaDai In flood season, most or even all reefs in KengPhaDai shall be submerged, and in dry season, some are exposed. When the water level remains around 337m, most reefs shall be entirely exposed.

According to water level change and reef exposing at KengPhaDai, we prepared two schemes for technical and economic comparison. Scheme I: 340m in flood season , 335m in dry season Scheme II: 340m in all seasons
Adjustment of FSL
Elevation(m)
Operation level at 335m from Dec. to May
Operation level at 340m from June to Nov.
Operation level at 335m from Dec. to next May
1 2 3 4 5 6 7 8 9 10 11 12

As to the power generation benefit, operation at 340m will
generate extra 370GW·h than that at 335m in dry season.
According to engineering scheme, difference between two
schemes is not so obvious .
0
5
10
15
20
25
30
35
40
45
50
55
60
汛期340m枯期335m 全年340m
Energy 108kW·h Annual Energy
Enery in flood season
Enery in dryseason
Comparison of two schemes
Scheme I Scheme II

Item
P=50% (Qm=11600m3/s)
P=20% (Qm=14900m3/s)
P=10% (Qm=17000m3/s)
P=5% (Qm=18900m3/s)
WL . with PB
WL. without PB Diff.
WL . with PB
WL. without PB
Diff.
WL . with PB
WL. without PB
Diff.
WL . with PB
WL. without PB
Diff.
Ngao 347.90 347.48 0.42 350.27 350.25 0.02 351.72 351.72 0 353.03 353.03 0 Ing 349.64 349.37 0.27 352.02 352.00 0.02 353.52 353.52 0 354.79 354.79 0
Chiang khong 351.29 351.15 0.14 353.46 353.45 0.01 354.97 354.97 0 356.22 356.22 0
As to the impact on Nam Ngao, Nam Ing River and Chiang Khong under flood condition, it is generally same between schemes. And the water level of the aforesaid areas changes slightly (almost can be neglected ) whether to build Pak Beng HPP or not:
Comparison of two schemes

Monthly average water level change at KengPhaDai for scheme 1 is similar to the natural condition, and considering of the effects on Thailand, scheme I seems better than scheme II. For scheme I, water level change can be shown as followed schematic maps under natural or project condition:
Comparison of two schemes
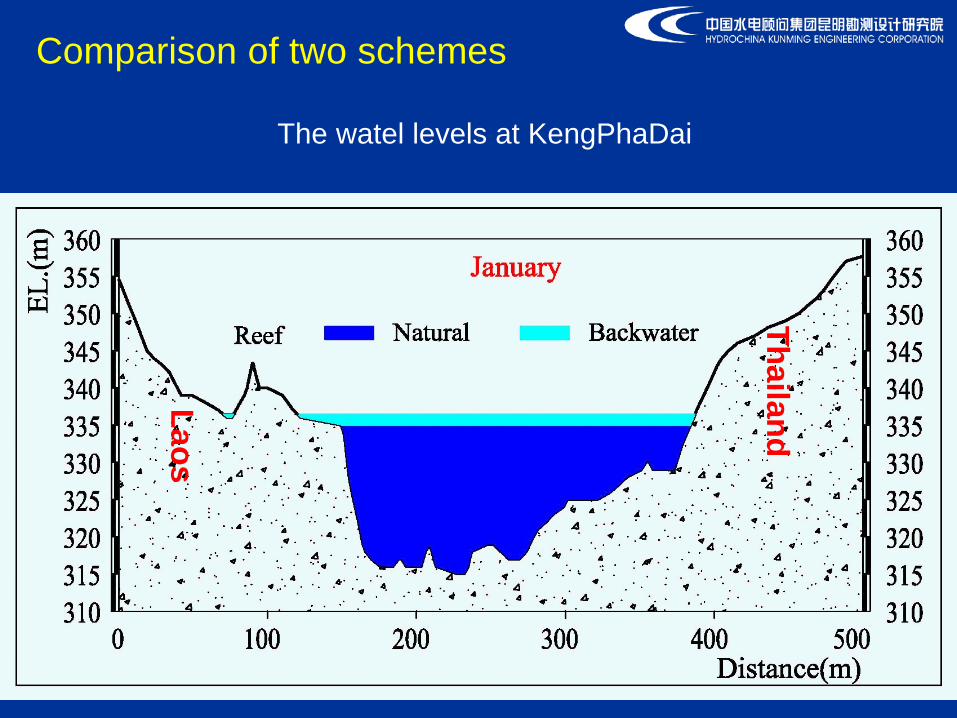
The watel levels at KengPhaDai Thailand
Laos
Comparison of two schemes

Laos
The watel levels at Nam Ngao River
Comparison of two schemes
Thailand

The distribution of farmland above EL.350m
in Thailand
Laos
The watel levels at Nam Ing River
Comparison of two schemes
Thailand

Both schemes can reserve most of the natural surface feature on Lao-Thai border and the scenery in KengPhaDai. But Scheme II with higher water level in dry seasons is comparatively not as good as Scheme I. Therefore, we recommend that the proposed FSL should be 340m, and the reservoir operates at 340m in flood season and 335m in dry season.
Comparison of two schemes

The setting of dead water level mainly considers factors as layout of key hydraulic structures and the flexibility of reservoir operation. Once the FSL adjusted to 340m, and the water level in dry season adjusted to 335m, the dead water level shall according be adjusted to 334m. The lowest navigable water level of upstream of the dam and dead water level are the same as 334m; Compared with values of FSL and reservoir water level corresponding to 3 years return period flood, the larger value shall be taken as the maximum navigable water level of upstream of the dam,which is 340m.
Adjustment of other operation water levels
Installed Capacity
Part 4

Main Factors for Finalization Installed Capacity as Follows: The type of water turbine, the capacity of generating unit, manufacturing level
and transportation conditions;
The characteristics of the output;
Power supply market and load characteristics of supply area;
Topographical and geological conditions and layout of hydraulic structures;
Index of hydropower energy of project;
Economy.
Six schemes of installed capacities such as 741 MW (13×57
MW), 798 MW (14×57 MW), 855 MW (15×57 MW) , 912 MW
(16×57 MW) , 969 MW (17×57 MW) and 1,026 MW (18×57
MW) are proposed for comparision .
Installed capacity

Water Head Range
The water head range of the power plant is changed from
13m ~ 34.7m to 7 m~ 29.7m, lead to the installed capacity
changed from 1,230MW to 855MW.
Selection of turbine type
Turbine Type
The maximum water head less than 30m, bulb turbines are
more suitable for this project

Single-Unit Capacity
Scheme 1 with 14 units, scheme 2 with 15 units and scheme 3
with 16 units are preliminarily selected for consideration .
According to the unit operating flexibility, equipment
manufacturing factors, transport conditions, hydro energy and
layout of hydraulic structures, the scheme of 57MW (15 units)
is recommended .
Selection of turbine type

The characteristics of the output
Output 1086MW 1162MW
Water head
Output (MW)
Head (m)
Output after considering output limit
According to the characteristic of the flow output, the total
Installed capacity may not more than 1086MW.
Discharge

200m 280m~460m
Topographic and geological conditions at the dam site and layout
and quantities of key hydraulic structures may not restrict the
selection of installed capacity.
The power transmission pattern, voltage grade and circuits of
outgoing lines applied to the aforementioned different schemes
are the same.
Comparison of other factors

Economically, the 855 MW is relatively good, while the other schemes are relatively poor in economic evaluation. In general, the proposed installed capacity shall be 855MW, 15 generating units with capacity of 57MW each. The firm output is 357MW, and annual average energy is 4846GW·h.
Installed capacity

Reservoir Inundation
Part 5

• KD has carried out comprehensive investigation on environment and social impact with Norconsult, with 1:5000 Lao PDR topographic map, in October 2008.
• In the FS stage, we committed NCG (National Consulting Group, Laos) to work for environmental and social impact assessment, and trans boundary, cumulative ESIA as well. ESIA will be reported soon afterwards.
Reservoir Inundation

Kiengphaak村搬迁户 17搬迁人口 102
Pak Xo村搬迁户 18搬迁人口 120
Pak Khob村搬迁户 21搬迁人口 132
Houay Moong村搬迁户 12搬迁人口 72
Homxai村搬迁户 18搬迁人口 126
Louangtong村搬迁户 47搬迁人口 232
Houay Chiko村搬迁户 12搬迁人口 84
Houay Khoun村搬迁户 4搬迁人口 28
168 households, and 1010 persons are living under 340masl.
Reservoir Inundation

Project Layout
Part 6
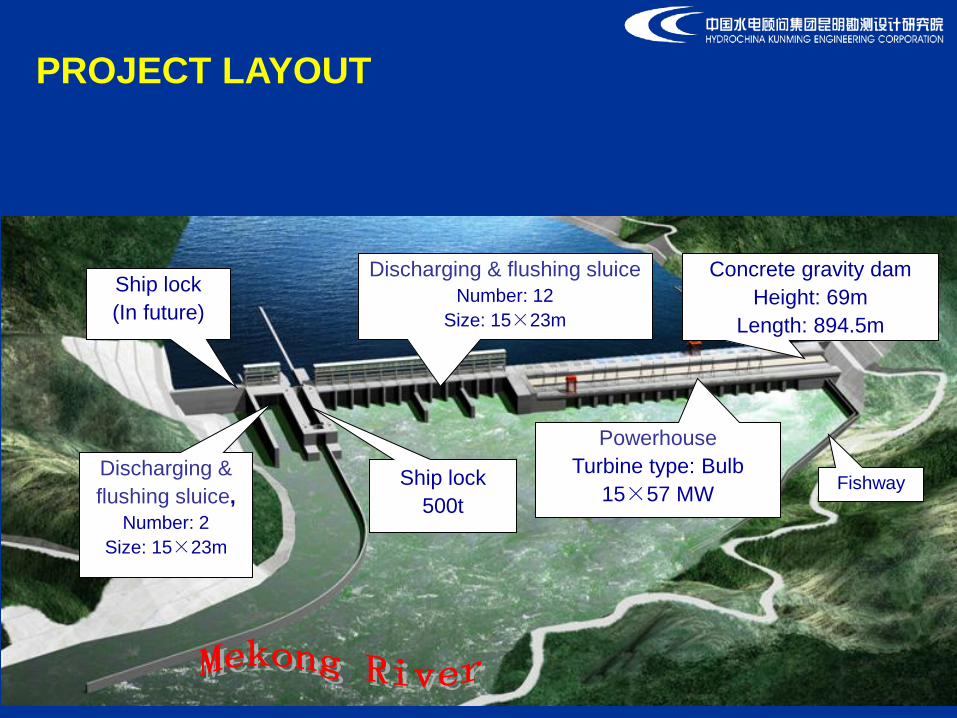
Ship lock 500t
PROJECT LAYOUT
Discharging & flushing sluice,
Number: 2 Size: 15×23m
Concrete gravity dam Height: 69m
Length: 894.5m
Discharging & flushing sluice Number: 12
Size: 15×23m
Powerhouse Turbine type: Bulb
15×57 MW Fishway
Ship lock (In future)

The powerhouse is installed with 15 sets of bulb turbine units. Each unit has the capacity of 57MW and the total will be 855MW.
Generating powerhouse
Design standard of navigation structure across the dam According to the navigation agreement on Lancang-Mekong river signed by China, Laos, Myanmar and Thailand, and Preliminary Design Guidance for Proposed Mainstream Dams in the Lower Mekong Basin,the navigation structures across the dam are designed as navigation channel of class IV for watercraft of 500t level. A 500t ship can get across one time by the effective dimension of ship lock. We adopt single line and single lock at persent, and it is possible for double lines to meet the demand of shipping growth in the future.

General construction schedule The general construction period is 63 months. The preparation period is 20 months. The period for construction of main works is 25 months. The first unit can be operated and generate power within 45 months after commencement.

Conclusions
With the adjustment of FSL from 345m to 340m, the negetive effects on Thailand can be avoided, and the technical and economic indicator of Pak Beng project is still good and feasible, relatively.
Alteration to Installed Capacity
Part 7
After MOU feasibility study report, the Project had progressed in a relatively slow pace. During this period, KD conducted deeper and more detailed study on the project design. Given minor discrepancy in economic efficiency of installed capacity schemes of 798MW, 855MW and 912MW, further study was carried out. For the purpose of installed capacity of Pak Beng HPP, the same principle in MOU feasibility study is still adhered at this stage, i.e. economic comparison among different schemes. Along with deepening of the design, it can be perceived that difference between this comparison and that at MOU feasibility study stage is mainly reflected in project cost.
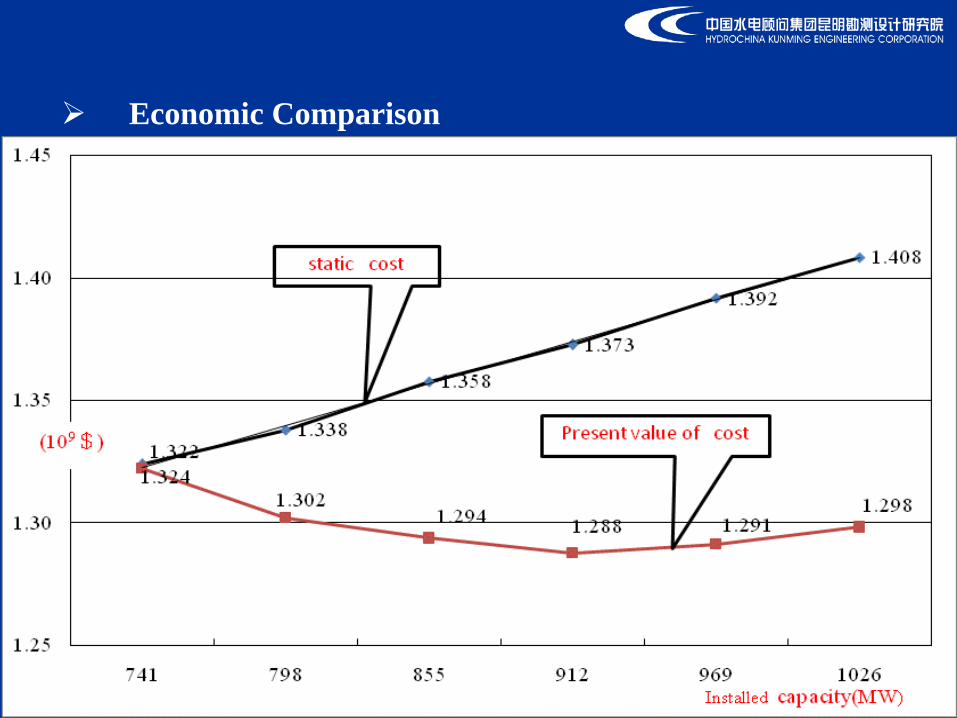
Economic Comparison

Economic Comparison Cost C
omparison am
ong Options Proposed
at Two Stages
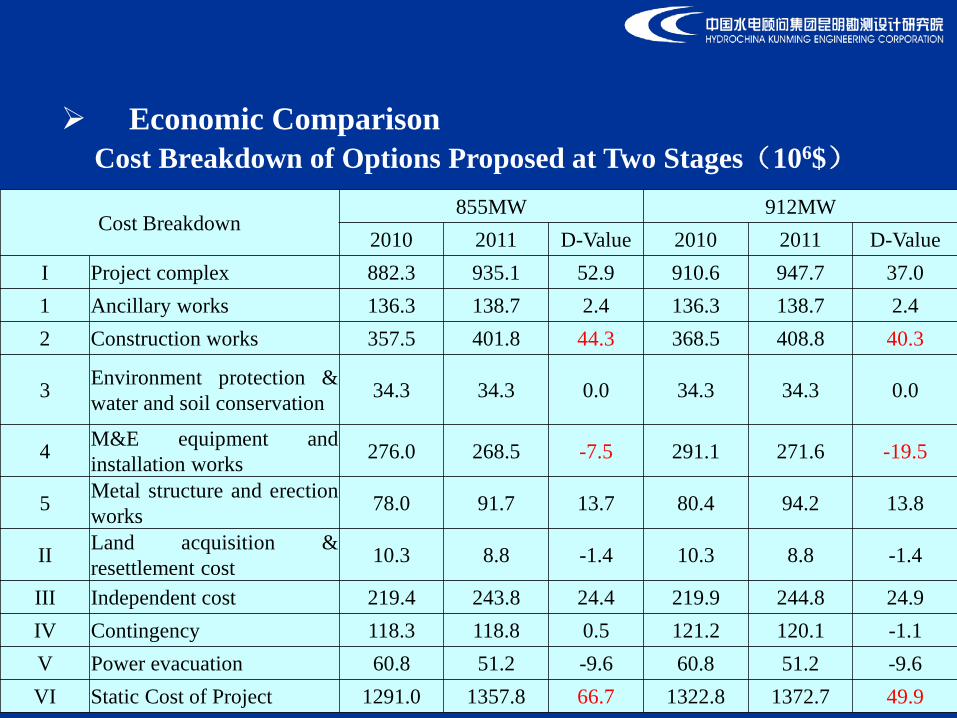
Economic Comparison Cost Breakdown of Options Proposed at Two Stages(106$)
Cost Breakdown 855MW 912MW
2010 2011 D-Value 2010 2011 D-Value I Project complex 882.3 935.1 52.9 910.6 947.7 37.0 1 Ancillary works 136.3 138.7 2.4 136.3 138.7 2.4 2 Construction works 357.5 401.8 44.3 368.5 408.8 40.3
3 Environment protection & water and soil conservation 34.3 34.3 0.0 34.3 34.3 0.0
4 M&E equipment and installation works 276.0 268.5 -7.5 291.1 271.6 -19.5
5 Metal structure and erection works 78.0 91.7 13.7 80.4 94.2 13.8
II Land acquisition & resettlement cost 10.3 8.8 -1.4 10.3 8.8 -1.4
III Independent cost 219.4 243.8 24.4 219.9 244.8 24.9 IV Contingency 118.3 118.8 0.5 121.2 120.1 -1.1 V Power evacuation 60.8 51.2 -9.6 60.8 51.2 -9.6 VI Static Cost of Project 1291.0 1357.8 66.7 1322.8 1372.7 49.9

Recommendation Comparison on cost breakdowns shows M&E equipment and construction work under 912MW is remarkably less costly than 855MW and post-commissioning cost difference is narrowed. Comparing with MOU feasibility stage, post-commissioning cost difference between these two options is 16.8×10⁶$.

Conclusion on Comparison of Options
Overall technical and economic comparison conducted at MOU feasibility study stage indicated all schemes are technically feasible. 855MW was most efficient economically, almost identical to 912MW. Due to further study on project design, difference in project cost between 855MW and 912MW has been narrowed, and 912MW has shown higher economic efficiency. Therefore, it is recommended to increase installed capacity of Pak Beng HPP up to 912MW.

Analysis on Other Influential Factors
(1) With progress of manufacturing technology of turbine unit, larger capacity will be more efficient economically. (2) Huge potential of power market is likely to trigger escalation of electricity tariff in the future. In the event that electricity tariff is increased during operation period and all energy production is absorbed, then the option with larger capacity appears to be more economic.

Final Conclusion
With reference to the latest results of analysis on installed capacity and possible impact of changes in relevant influential factors against various options, it is recommended to increase installed capacity of Pak Beng HPP up to 912MW.
