feasibility study project for the jcm (2015fy) energy saving for
TRANSCRIPT

Feasibility Study Project for the JCM (2015FY)
Energy Saving for Factories with Introduction of
EMS and Highly Energy Efficient Equipment
March 2016
ASICS Corporation
myclimate Japan Co., Ltd.
2
Table of contents
Chapter 1. Energy-saving project in subcontract factories of Asics .................................. 4
1.1. Project overview ......................................................................................................... 4
1.2. Project background (ASICS CSR strategy) .............................................................. 4
1.3. Technical overview ..................................................................................................... 5
1.3.1. EMS ...................................................................................................................... 5
1.3.2. Efficiency improvement of each equipment ....................................................... 6
1.4. Project site .................................................................................................................. 7
1.4.1. Cambodia: ■■■■■■ company limited (COMPANY A).................................. 7
1.4.2. Vietnam: ■■■■■■ company limited (COMPANY B) .................................... 7
1.4.3. Production process ............................................................................................... 7
Chapter 2. A concrete plan for implementing the project .................................................. 8
2.1. Understanding the energy balance in the subject factories .................................... 8
2.1.1. Overview of Shneider’s Energy-saving diagnosis ............................................. 8
2.1.2. Result of energy-saving diagnosis (Cambodia) ................................................ 10
2.1.3. Result of energy-saving diagnosis (Vietnam) .................................................. 12
2.2. Determination of subject items and finance, and Decision of capital spending plan.
.......................................................................................................................................... 16
2.3. Important study to reduce operational risk ........................................................... 16
2.4. Comparative investigation to competitors’ products for product diffusion in local
.......................................................................................................................................... 16
Chapter 3. Methodology for emission reduction and estimation of expected GHG
emission reduction .............................................................................................................. 18
3.1. Methodology developing approach .......................................................................... 18
3.1.1. Categorization of energy-saving measures in the factories ............................ 18
3.1.2. Analysis of existing methodology ..................................................................... 19
3.2. Overview of the methodology .................................................................................. 21
3.2.1. Eligibility criteria .............................................................................................. 21
3.2.2. Calculation procedure for the amount of reference emissions ....................... 22
3.2.3. Calculation procedure for the amount of project emissions ........................... 24
3.2.4. Monitoring method ............................................................................................ 25
3.2.5. Estimation of the amount of emission reduction ............................................ 29
3.3. In forthcoming issues ............................................................................................... 35
3.3.1. How to secure the maintainability of the amount of emission reduction ...... 35
Chapter 4. Analysis of the economic effect and the impact on the partner countries
trough the project ................................................................................................................ 36
3
4.1. The economic effect through the project ................................................................. 36
4.2. Analysis of the impact on the partner countries .................................................... 37
Chapter 5. Tasks for the project, success factors or issued for JCM in the future......... 38
Chapter 6. Policy recommendation and the reaction of the partner governments ........ 39
6.1. Current issues and the solution proposal ............................................................... 39
6.1.1 Current issues ..................................................................................................... 39
6.1.2. Predicaments in Japan ...................................................................................... 42
6.1.3. Solution Proposal for the partner countries .................................................... 43
6.2. Future issues ............................................................................................................ 44
Chapter 7. Summary .......................................................................................................... 44
Figure / Table List
Figure 1 Energy-saving Approach ............................................................................. 4
Figure 2 Equipment Introduction Flow ..................................................................... 6
Figure 3 Shoes Component ......................................................................................... 7
Figure 4 Manufacturing Process Flow ...................................................................... 8
Figure 5 Monthly Electricity Consumption and Cost in COMPANY A ................. 11
Figure 6 Energy Usage Ratio by Facility in COMPANY A ..................................... 11
Figure 7 Monthly Electricity Consumption and cost in COMPANY B ................. 13
Figure 8 Energy Usage Ratio by Facility in COMPANY B .................................... 13
Figure 9 Comparison with Competitors .................................................................. 17
Figure 10 Conceptual Scheme of Scope 1-3 ............................................................. 18
Table 1 Scopes for energy-saving diagnosis .............................................................. 9
Table 2 The Countermeasure Items Proposed by Energy-saving Diagnosis
(COMPANY A) ....................................................................................................... 11
Table 3 The Countermeasure Items Proposed by Energy-saving Diagnosis
(COMPANY B) ...................................................................................................... 14
Table 4 Category of Energy-saving Measure in Factories ..................................... 18
Table 5 Category of Calulation Methods for GHG emission Reduction in Factories
............................................................................................................................... 19
Table 6 The Result of Calculation: The Economic Effect on COMPANY A in
Cambodia .............................................................................................................. 36
Table 7 The Result of Calculation: The Economic Effect on COMPANY B in
Vietnam ................................................................................................................. 37
Table 8 Expected Policy Actions for Energy Saving Measures .............................. 39
4
Chapter 1. Energy-saving project in subcontract factories of Asics
1.1. Project overview
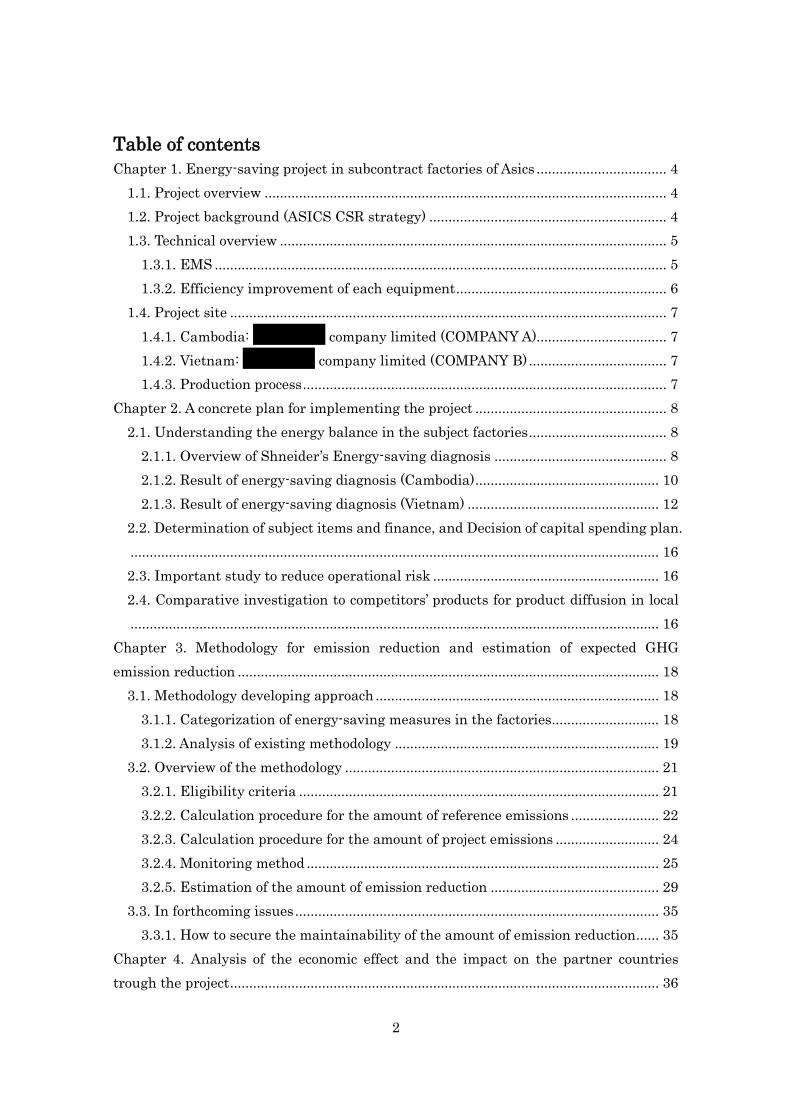
This project aims to reduce both the energy cost and the GHG emissions by
optimizing energy utilazationin the whole factory by means of the introduction of
Energy Management System
(hereinafter called EMS) and
efficiency improvement of each
equipment in subcontract
factories of ASICS (one factory
each in Cambodia and Vietnam).
EMS has a certain level of effect
for the leveling of used amount
and the lowering of the maximum
used amount with peak-cut or peak-shift of energy utilization.
On the other hand, performance improvement of each equipment shows the
possibility to lower the total amount of energy consumption by raising the efficiency of
each equipment in itself (figure 1.).
This project (a consignment project by the Ministry of Economy, Trade and Industry)
is designated to verify the current situation of existing energy consumption (energy
diagnosis), propose the efficient list of countermeasure items to the each subcontract
factory, and draw up the project by conferring with subcontract factories as the
feasibility study for above mentioned project.
1.2. Project background (ASICS CSR strategy)
Established in 1949, ASICS Corporation is the manufacturing and distribution
company which produces sports equipment. Aside from the head office and ASICS
institute of sport science in Kobe, Hyogo prefecture, ASICS has 11 consolidated
subsidiaries and affiliates in Japan, as well as 40 in the world (the United States of
America, Europe, Asia and Oceania). As it related to the financial information,
consolidated net sales in December 2012 are 345.051 million JPY, which 80.5% in
overseas sales. In the product category basis, sports shoes are the core product with
79.9% of consolidated net sales, secondary sportswear, 15.3% and 4.8% of sport
equipment. Among more than 200 ASICS factories in the world, all of them are
subcontract facilities (contract manufacturing) expect the one which is owned by ASICS.
As the global company, ASICS is actively undertaking CSR activity, and sets a
corporate objective to “10% reduction of CO2 emissions”. Till now, ASICS has been
FIGURE 1 ENERGY-SAVING APPROACH
(kW)
Energyconsumption
(time)
Approach to peak times by EMS
Approach to efficient use of each equipment

5
promoting the electricity consumption reduction as well as the renewable energy
utilization in their business places and shops. However, there is a limit how far they can
do in those business places and shops (see scope 1 and 2).
Therefore, ASICS has just embarked CO2 emission reduction actions in the overseas
subcontract factories in order to expand the reduction target into the manufacturing
processes (see scope 3) which consume huge energy on their activity. At the
energy-saving program in the subcontract factories, not only to implement
energy-saving measures, but also ASICS has an intention to strengthen the price
competitiveness by understanding an appropriate manufacturing cost based on the
“visualization”.
As ASICS has never conducted energy-saving measures in their subcontract factories,
this project was the first trial for them. By referring to this project as a model case, they
have an intention to expand the energy-saving measures into 25 factories in Asia (2 in
Cambodia, 4 in Vietnam, 13 in China and 3 in Indonesia) which have high potential for
reduction, and furthermore beyond the Asia in the future.
1.3. Technical overview
1.3.1. EMS
EMS is the system for implementing energy cost control which the final adopter
should pay, by visualizing and optimizing energy consumption without preventing from
the original purpose.
In this project, ASICS plans to introduce “Power quality monitoring unit” from Fuji
Electric FA Components & Systems Co., Ltd. This system can flexibly manage possible
modifications (partial revisions or additional alterations) and well modulized. So that, it
can be easily linked to the other energy information such as water and gas. This system
also makes enable for energy information to be linked to the cooperating site
management systems in the upper system, or their subcontract factories which
introduce EMS, when the companies who have several factories or who are consigned
for manufacturing want to manage all energy information centrally. In addition to that
point, EMS can remain history record of harmonics or noise. So by using those records,
it will be possible to determine the cause and take measures for avoiding harmonics and
noise in the early timing. Since the load of factory equipment becomes reduced, the
service life of factory equipment can be extended.
This EMS consists of a monitoring software and electric meters. Putting electric
meters in several points of the electric circuit in the factory, electricity consumption
information from meters are traceable through monitoring software on time (every
6
15minutes). With this information, it is possible to emit warnings when the excess
usage penalty may occur because of temporary high electricity consumption, or cut the
power off automatically if not in use to avoid paying excess penalty. Furthermore, once
the information is accumulated which let us to understand the trend in the past, we can
prepare programmed beforehand to set control usage in peak time.
Once introduced above mentioned monitoring software into ASICS and their
subcontract factories, ASICS can correctly understand the status of energy consumption
in each subcontract factory, which leads to visualize the manufacturing cost.
Furthermore, ASICS can ask subcontract factories to check the status of energy
consumption if their electricity consumption is more than planned or drastically
increased, and to optimize their electricity consumption.
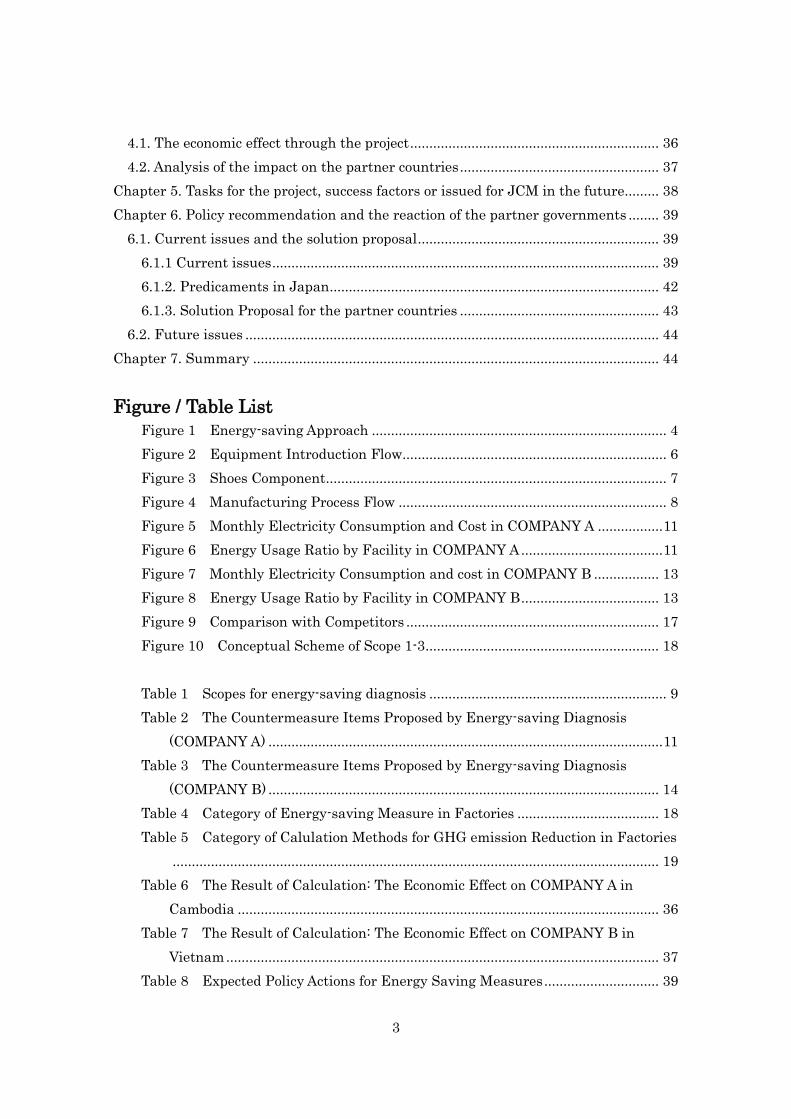
1.3.2. Efficiency improvement of each equipment
Appropriate improvement of energy efficiency for each factory can aim to decrease the
total amount of energy consumption. To achieve this goal, it is necessary to consider
each circumstance such as the status of use or life expectancy of each equipment and
facility, then implement the efficiency improvement measures which are the most
cost-effective. There are two types of measures for equipment efficiency improvement.
First, the measures for equipment used in the production line, second, for utility
equipment necessary for factory operation such as supply of power, lighting or
air-conditioning.
In this project, ASICS conducts the energy-saving diagnosis for both production
equipment and utility equipment, then confer the measures with subcontract factories.
Therefore, it seems to be possible to plan the project in earlier timing comparing to the
case which requires to start by verifying the possibility of introduction with the
restricted introduced system.
FIGURE 2 EQUIPMENT INTRODUCTION FLOW
Selecting equipment
Confirming suitability
Adjusting specs Implementation
Implementation
Past Projects
This ProjectGrasping current
conditionSelecting
equipment
Energy-savingDiagnosis Verifying the possibility

7
1.4. Project site
1.4.1. Cambodia: ■■■■■■ company limited (COMPANY A)
■■■■■■ company limited (hereinafter called COMPANY A) is located
■■■■■■■■■■■■■■■■■■■■■■■■■■ in the Kingdom of Cambodia,
■■■■■■■■■■■■■■■■■■■■■■■■■■■■ (■■■■ by car). The area of the
factory is 665,555 square meters, and the number of employees is approximately 7,000.
COMPANY A is a local subsidiary of ■■■■■■■■■■■■■. ■■■■■■■■ also
holds 2 factories in Cambodia (manufacturing the products ordered by the other
manufacturer). COMPANY A continues to deal with ASICS since 2012, the most
order-received factory among 4 factories in Cambodia (4,803,982 pairs in 2015).
1.4.2. Vietnam: ■■■■■■■■ company limited (COMPANY B)
■■■■■■■■ company limited (hereinafter called COMPANY B) is located
■■■■■■■■■■■■■■■■■■■■■■■■■■, in the Socialist Republic of Viet Nam,
■■■■■■■■■■■■■■■■■■■■■■■■■■ (■■■■ by car). The area of the
factory is apporoximately 480,000 square meters, and the number of employees is
approximately 6,900.
COMPANY B is a local subsidiary of ■■■■■■■ group ■■■■
■■■■■■■■■■■■■■■■■■■■■. ■■■■■■■ has the CSR division in the
headquarter office, and eagers to perform energy-saving action in their factories. The
trading between ■■■■■■■ and ASICS has long been since 2004. Production quantity
of ASICS shoes is 7,677,903 pairs in 2015.
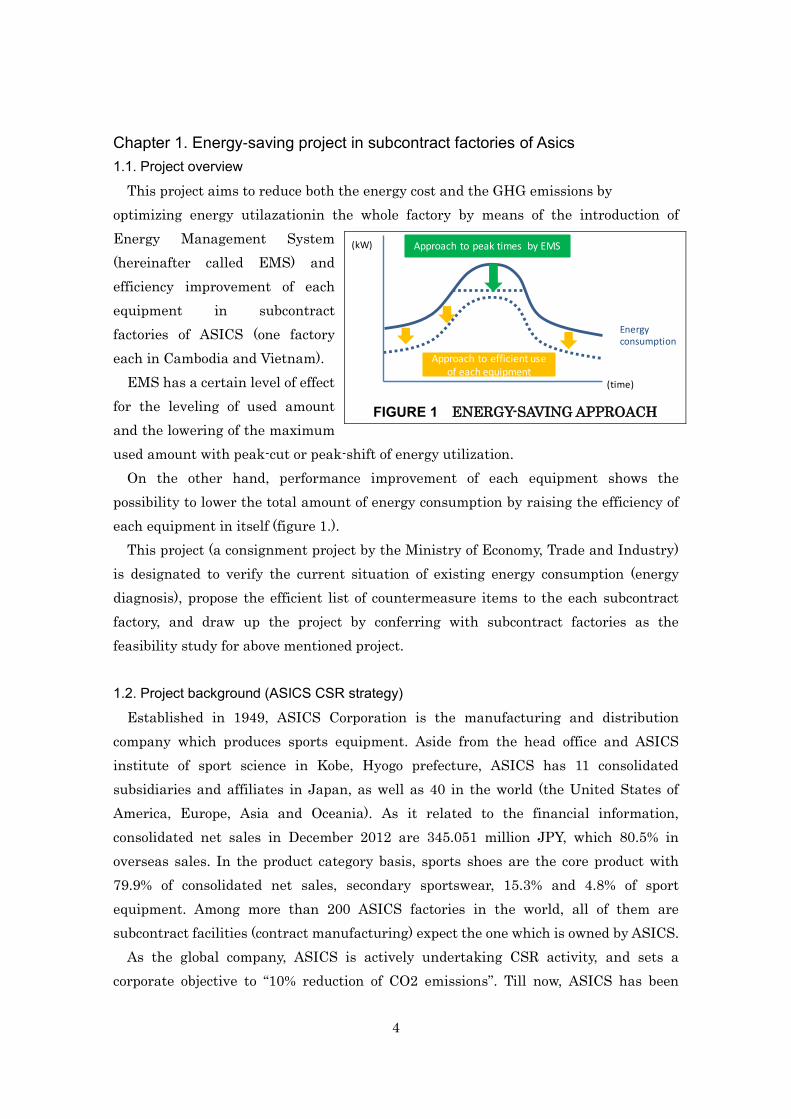
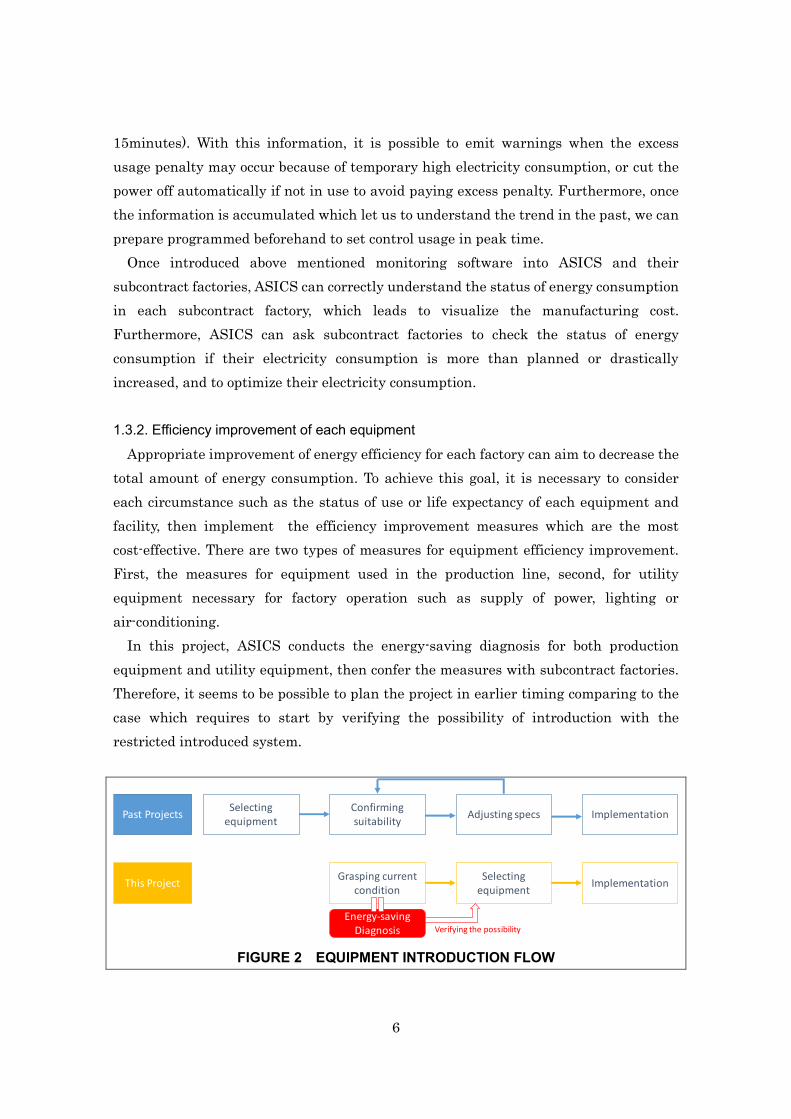
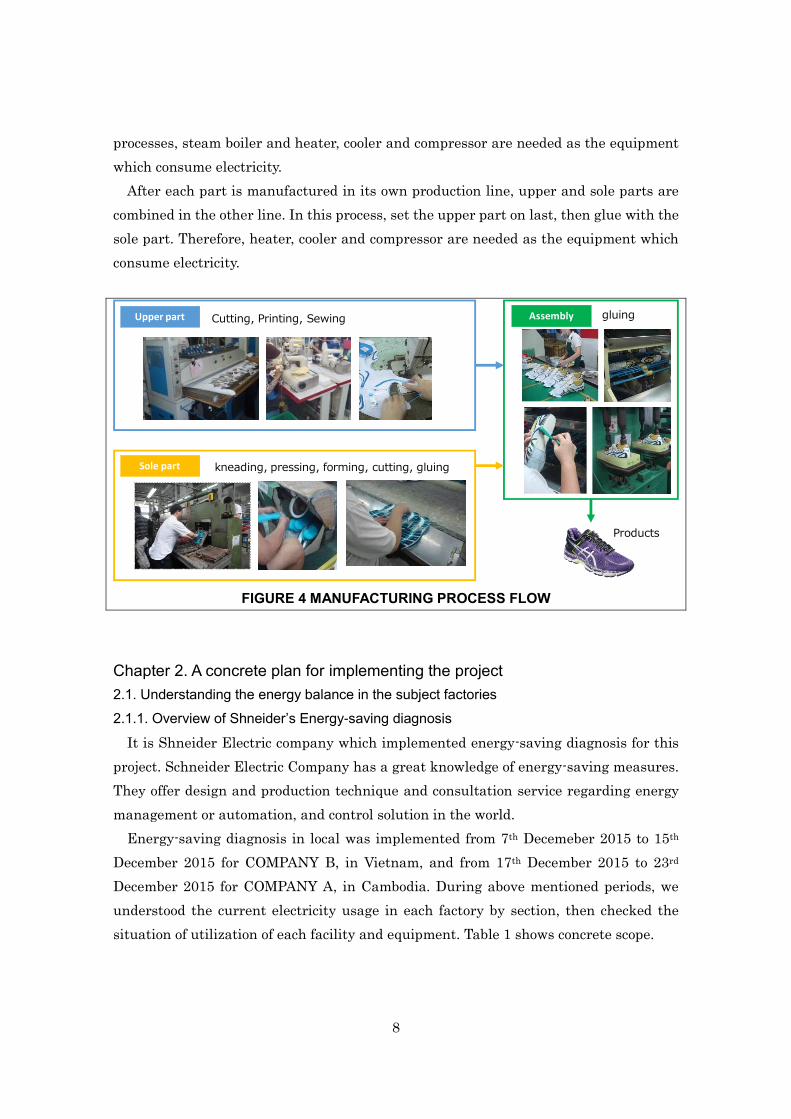
1.4.3. Production process
Both 2 factories which are subjects for this project produce sports shoes for
running. Sports shoes are composed of 2
different parts. Upper part which uses
fibrous material and artificial leather, and
sole part which uses rubber, rubber sponge
and EVA sponge.
Upper part requires cutting materials,
printing and sewing process. For those
processes, cutting machine, sewing machine
and compressor are needed as the equipment
which consumes electricity.
Sole part requires kneading, pressing, forming, cutting and gluing process. For those
FIGURE 3 SHOES COMPONENT
Upper part
Sole part
8
processes, steam boiler and heater, cooler and compressor are needed as the equipment
which consume electricity.
After each part is manufactured in its own production line, upper and sole parts are
combined in the other line. In this process, set the upper part on last, then glue with the
sole part. Therefore, heater, cooler and compressor are needed as the equipment which
consume electricity.
FIGURE 4 MANUFACTURING PROCESS FLOW
Chapter 2. A concrete plan for implementing the project
2.1. Understanding the energy balance in the subject factories
2.1.1. Overview of Shneider’s Energy-saving diagnosis
It is Shneider Electric company which implemented energy-saving diagnosis for this
project. Schneider Electric Company has a great knowledge of energy-saving measures.
They offer design and production technique and consultation service regarding energy
management or automation, and control solution in the world.
Energy-saving diagnosis in local was implemented from 7th Decemeber 2015 to 15th
December 2015 for COMPANY B, in Vietnam, and from 17th December 2015 to 23rd
December 2015 for COMPANY A, in Cambodia. During above mentioned periods, we
understood the current electricity usage in each factory by section, then checked the
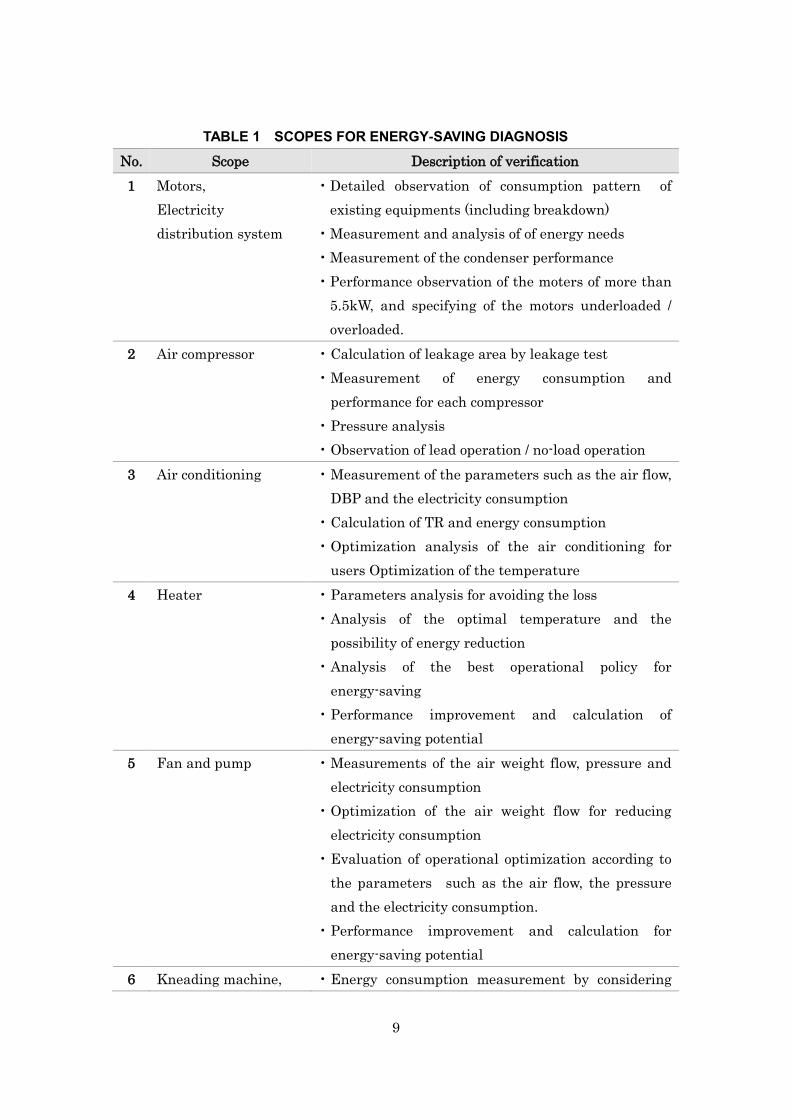
situation of utilization of each facility and equipment. Table 1 shows concrete scope.
Cutting, Printing, SewingUpper part
kneading, pressing, forming, cutting, gluingSole part
Assembly gluing
Products
9
No. Scope Description of verification
1 Motors,
Electricity
distribution system
• Detailed observation of consumption pattern of
existing equipments (including breakdown)
• Measurement and analysis of of energy needs
• Measurement of the condenser performance
• Performance observation of the moters of more than
5.5kW, and specifying of the motors underloaded /
overloaded.
2 Air compressor • Calculation of leakage area by leakage test
• Measurement of energy consumption and
performance for each compressor
• Pressure analysis
• Observation of lead operation / no-load operation
3 Air conditioning • Measurement of the parameters such as the air flow,
DBP and the electricity consumption
• Calculation of TR and energy consumption
• Optimization analysis of the air conditioning for
users Optimization of the temperature
4 Heater • Parameters analysis for avoiding the loss
• Analysis of the optimal temperature and the
possibility of energy reduction
• Analysis of the best operational policy for
energy-saving
• Performance improvement and calculation of
energy-saving potential
5 Fan and pump • Measurements of the air weight flow, pressure and
electricity consumption
• Optimization of the air weight flow for reducing
electricity consumption
• Evaluation of operational optimization according to
the parameters such as the air flow, the pressure
and the electricity consumption.
• Performance improvement and calculation for
energy-saving potential
6 Kneading machine, • Energy consumption measurement by considering
TABLE 1 SCOPES FOR ENERGY-SAVING DIAGNOSIS
10
Press machine operational time and each equipment
• Analysis of the oil pump pressure
• Estimation of the potential about performance
improvement and energy-saving
• Detailed energy-saving analysis with parameters
such as input / output for kneading machine,
electricity and production capacity
• Analysis of energy consumption / usage pattern
7 Lighting • Actual survey for lighting improvement and
optimization.
• Study for introduction of intermittent lighting for
energy consumption saving, improvement of
equipments, and rayout change.
• Investigation of operational possibility about the
parameters such as voltage for the lighting circuit
8 Possibility of using
renewable energy
• Feasibility analysis of the renewable energy such as
solar power
• Analysis of cost effectiveness by introduction
2.1.2. Result of energy-saving diagnosis (Cambodia)
The annual energy cost in COMPANY A (from December 2014 to November 2015) was
1,059,622USD. Grid electricity utility expense was the biggest factor for this expense,
which is 94.5% of the total (1,004,714USD, 5,648.51MWh). The rest of 5.2% were for the
diesel fuel expense which is used during a power cut (54,907.4USD, 228.78MWh).

11
FIGURE 5 MONTHLY ELECTRICITY CONSUMPTION AND COST IN COMPANY A
FIGURE 6 ENERGY USAGE RATIO BY FACILITY IN COMPANY A
No. Measure items Reduced
electricity
(kWh)
Steam
reduction
(t)
Cost
reduction
(USD)
Measures
cost
(USD)
1 Measures against air leaking
from the compressor machine
308,207 55,917 24,000 0.4
2 Temperature optimization for
the heater
101,220 17,612 14,400 0.8
0
10
20
30
40
50
60
70
80
90
100
0
100
200
300
400
500
600
Dec Jan Feb Mar Apr May Jun Jul Aug Sep Oct Nov
Electiricist cost
(k USD)
Electricity
consumption
(MWh)
from December 2014 to November 2015
consumption cost
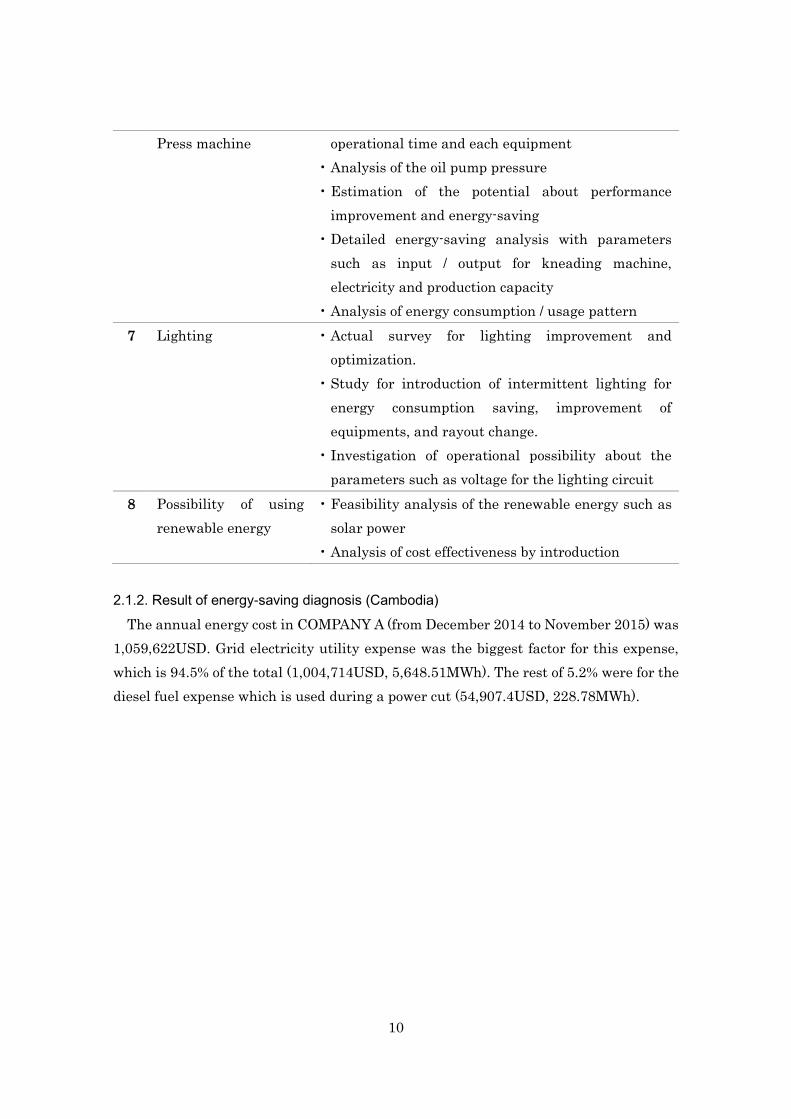
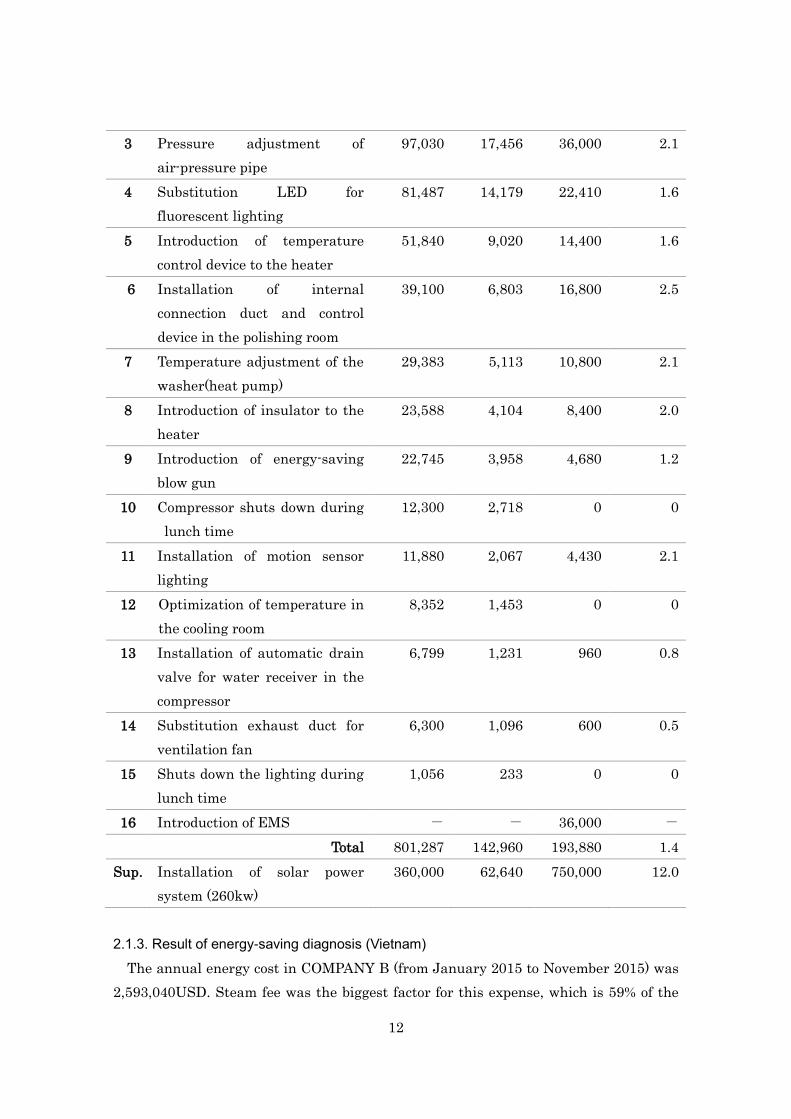
TABLE 2 THE COUNTERMEASURE ITEMS PROPOSED BY ENERGY-SAVING
DIAGNOSIS (COMPANY A)
12
3 Pressure adjustment of
air-pressure pipe
97,030 17,456 36,000 2.1
4 Substitution LED for
fluorescent lighting
81,487 14,179 22,410 1.6
5 Introduction of temperature
control device to the heater
51,840 9,020 14,400 1.6
6 Installation of internal
connection duct and control
device in the polishing room
39,100 6,803 16,800 2.5
7 Temperature adjustment of the
washer(heat pump)
29,383 5,113 10,800 2.1
8 Introduction of insulator to the
heater
23,588 4,104 8,400 2.0
9 Introduction of energy-saving
blow gun
22,745 3,958 4,680 1.2
10 Compressor shuts down during
lunch time
12,300 2,718 0 0
11 Installation of motion sensor
lighting
11,880 2,067 4,430 2.1
12 Optimization of temperature in
the cooling room
8,352 1,453 0 0
13 Installation of automatic drain
valve for water receiver in the
compressor
6,799 1,231 960 0.8
14 Substitution exhaust duct for
ventilation fan
6,300 1,096 600 0.5
15 Shuts down the lighting during
lunch time
1,056 233 0 0
16 Introduction of EMS - - 36,000 -
Total 801,287 142,960 193,880 1.4
Sup. Installation of solar power
system (260kw)
360,000 62,640 750,000 12.0
2.1.3. Result of energy-saving diagnosis (Vietnam)
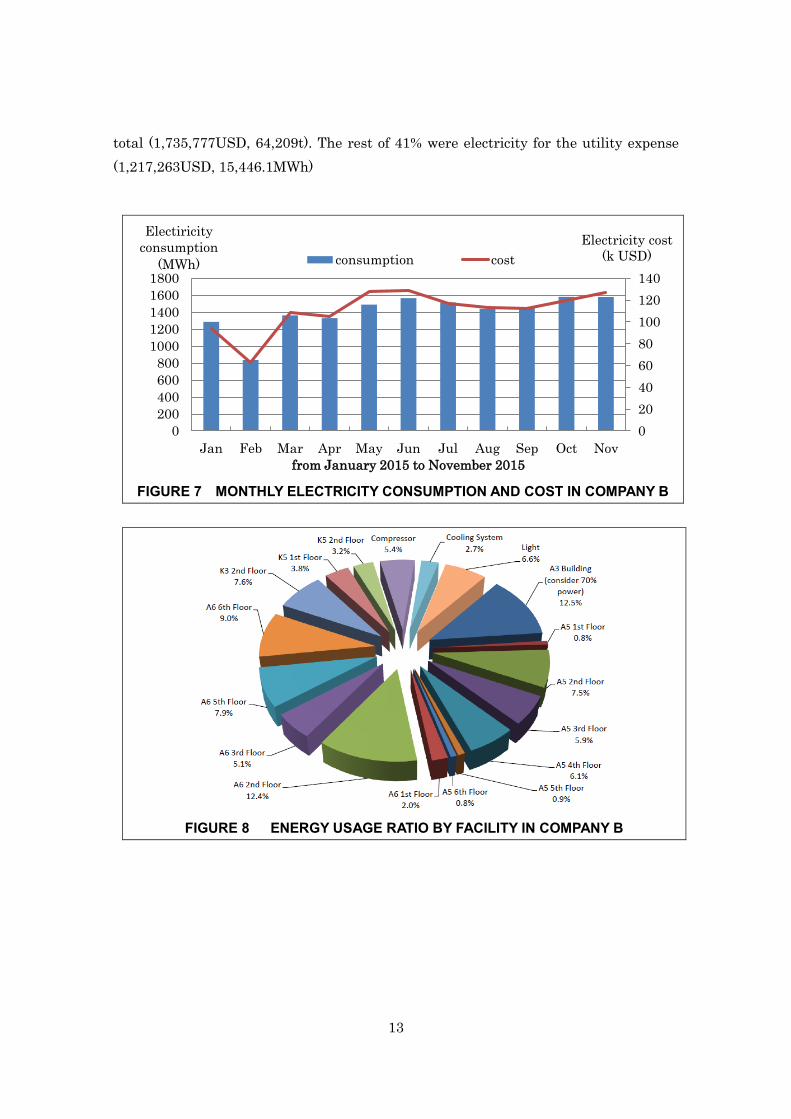
The annual energy cost in COMPANY B (from January 2015 to November 2015) was
2,593,040USD. Steam fee was the biggest factor for this expense, which is 59% of the
13
total (1,735,777USD, 64,209t). The rest of 41% were electricity for the utility expense
(1,217,263USD, 15,446.1MWh)
FIGURE 8 ENERGY USAGE RATIO BY FACILITY IN COMPANY B
FIGURE 7 MONTHLY ELECTRICITY CONSUMPTION AND COST IN COMPANY B
0
20
40
60
80
100
120
140
0
200
400
600
800
1000
1200
1400
1600
1800
Jan Feb Mar Apr May Jun Jul Aug Sep Oct Nov
Electricity cost
(k USD)
Electiricity
consumption
(MWh)
from January 2015 to November 2015
consumption cost

14
No. Measure items Reduced
electricity
(kWh)
Steam
reduction
(t)
Cost
reduction
(USD)
Measures
cost
(USD)
Investment
Return
(year)
1 Substitution LED for
fluorescent light
891,218 - 70,406 330,986 4.7
2 Improvement of the
cooling pump and
installation of the
control device
554,400 - 43,800 72,000 1.6
3 Introduction of
energy-saving blow
gun
303,402 - 23,969 21,840 0.9
4 Prevention of heat loss
in the boiler
- 775 20,954 12,000 0.6
5 Introduction of
insulator to pipes and
tanks
- 660 18,000 24,000 1.3
6 Improvement of
volumetric efficiency
in the compressor
193,827 - 15,312 10,800 0.7
7 Improvement of the
press
machine oil pump
129,024 - 10,193 19,200 1.9
8 Saving energy from
the ceiling lights
150,696 - 11,905 0 0
9 Introduction of control
device to the heater
134,865 - 10,654 11,880 1.1
10 Introduction of auto
temperature control
device to the fan in the
cooling room
128,993 - 10,190 12,000 1.2
11 Introduction of 93,595 - 7,394 12,000 1.6
TABLE 3 THE COUNTERMEASURE ITEMS PROPOSED BY ENERGY-SAVING
DIAGNOSIS (COMPANY B)

15
insulator to the
heater and the
vulcanizer
12 Substitution the
steam type water
heater for the electric
water heater
- - 5,662 12,000 2.1
13 100% opening door of
the boiler intake
dumper, and
optimization of
existing control
devices
62,537 - 4,940 2,400 0.5
14 Installation of motion
sensor lighting
40,343 - 3,187 11,520 3.6
15 Measures against air
leaking from the
compressor
39,564 - 3,126 3,600 1.2
16 Temporary shut down
of waterway in the
cooler, according to
improvement of No.2
pump
23,040 - 1,820 0 0
17 Optimization of water
temperature in the
cooling room
8,640 - 683 0 0
18 Optimization of
pressure in the
compressor
8,415 - 665 0 0
19 Compressor shuts
down during lunch
time
7,410 - 585 0 0
20 Introduction of EMS - - - 54,000 -
Total 2,769,969 1,435 263,445 610,226 2.3
16
2.2. Determination of subject items and finance, and Decision of capital spending plan.
This investigation demonstrated that EMS is a high cost-effective measure for both
factories, as well as the early investment-return can be expected after the initial
investment. In addition to it, measure cost is calculated as approximately 1-3 million
JPY, it is affordable for both COMPANY B and COMPANY A to introduce EMS
according to their needs with their own finance.
2.3. Important study to reduce operational risk
In regards to the implementation of energy-saving measures, no risk is presumed.
Since this project aims to realize energy-saving in the factories either improving the
equipments already used in the factories or adding new equipment (control equipment).
Therefore, it is not subject to EIA, because purchasing new land is not required.
Furthermore, equipment improvement which may cause any problem around the
factories such as drainage or noise is not anticipated. Regarding regulations, neither
official permission / authorization nor regulations about energy-saving improvement
exist. Moreover, there is no operational risk for financing since considering the amount
and the recovery speed, both COMPANY A and COMPANY B are able to secure
financing by themselves.
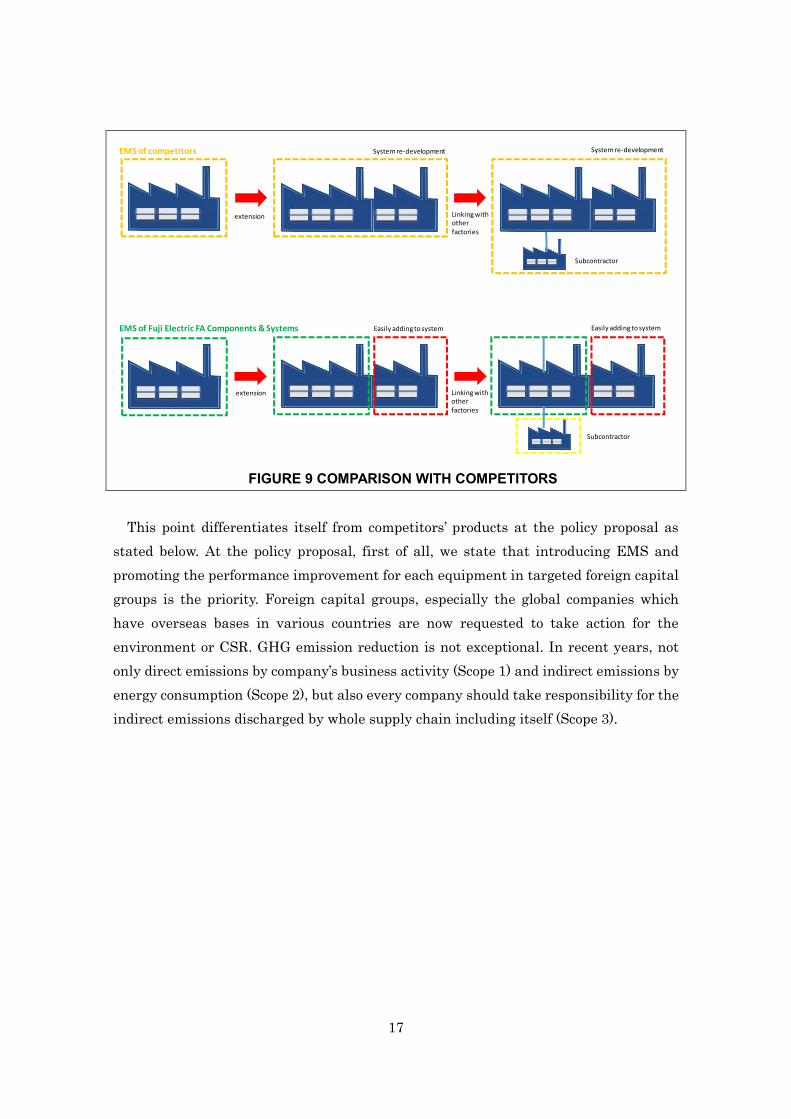
2.4. Comparative investigation to competitors’ products for product diffusion in local
Comparing to competitors’ products, EMS of Fuji Electric FA Components & Systems
Co., Ltd. has an advantage of being well generalized. Other manufacturers’s EMS needs
to be established from scratch in order to be linked to an existing system in the factories.
So that, it is necessary to reestablish EMS in case of enlargement or expansion of
factories, or systems linkage to consignor companies or sub-subcontractors. In the mean
time, Fuji Electric EMS easily corresponds to partial modifications (add or delete
subject items) or system link with upper / lower groups. Since Fuji Electric FA
Components & Systems Co., Ltd. was established as a joint venture between Schneide
Electric which has a wide range of customer in the world, and Fuji Electric, EMS has
been developed after considering various systems in all of the world with the knowledge
Schneide Electric. So that, Fuji Electric FA Components & Systems Co., Ltd.’s EMS has
the advantage as mentioned above. Therefore, for the companies who manage factories,
EMS can be useful for expanding factories due to production volume up or linking to
other factories, subcontractor or sub-subcontractor without establishing a system from
scratch, it apparently means with low cost.
17
FIGURE 9 COMPARISON WITH COMPETITORS
This point differentiates itself from competitors’ products at the policy proposal as
stated below. At the policy proposal, first of all, we state that introducing EMS and
promoting the performance improvement for each equipment in targeted foreign capital
groups is the priority. Foreign capital groups, especially the global companies which
have overseas bases in various countries are now requested to take action for the
environment or CSR. GHG emission reduction is not exceptional. In recent years, not
only direct emissions by company’s business activity (Scope 1) and indirect emissions by
energy consumption (Scope 2), but also every company should take responsibility for the
indirect emissions discharged by whole supply chain including itself (Scope 3).
EMS of competitors
extension
System re-development
EMS of Fuji Electric FA Components & Systems Easily adding to system
Linking with other factories
Subcontractor
extension
System re-development
Linking with other factories
Subcontractor
Easily adding to system

18
FIGURE 10 CONCEPTUAL SCHEME OF SCOPE 1-31
For ASICS, scope 3 was a trigger to start working on this project. It shows that the
global companies like ASICS have a more and more tendency to work on scope3. With
EMS in subcontract factories, which can be easily linked to the corporate site
management systems in the headquarter, the global companies are able to understand
the data from subcontract factories.
Chapter 3. Methodology for emission reduction and estimation of expected GHG
emission reduction
3.1. Methodology developing approach
3.1.1. Categorization of energy-saving measures in the factories
Energy-saving measure items mentioned in the previous chapter as the result of
energy diagnosis for COMPANY A in Cambodia and COMPANY B in Vietnam are
divided into 3 categories.
No. Category Examples of energy-saving measures
1 Introduction of high
performance
equipment
· Substitution LED for fluorescent light
· Introduction of high performance pump
1 Mizuho Research and Information Insutitute
http://www.meti.go.jp/committee/kenkyukai/sangi/supplychain_gas_global/001_05_01s.pdf
TABLE 4 CATEGORY OF ENERGY-SAVING MEASURE IN FACTORIES
19
(substitution for
existing equipment)
2 Introduction of
control device
· Introduction of intermittent control device to the
pumps
· Introduction of temperature control device to the
heater
· Introduction of temperature control device to the
condenser room
· Introduction of internal connection duct and control
device to the fan in the polishing room
· Introduction of motion sensor lighting
3 Operational
improvement,
maintenance and
repairing of existing
equipment
· Countermeasures against air leaking from the
compressor
· Installation of heat insulator in the boiler
· Optimization of temperature in the dryer
· Temperature adjustment of washer machine
· Compressor shuts down during lunch time
etc.
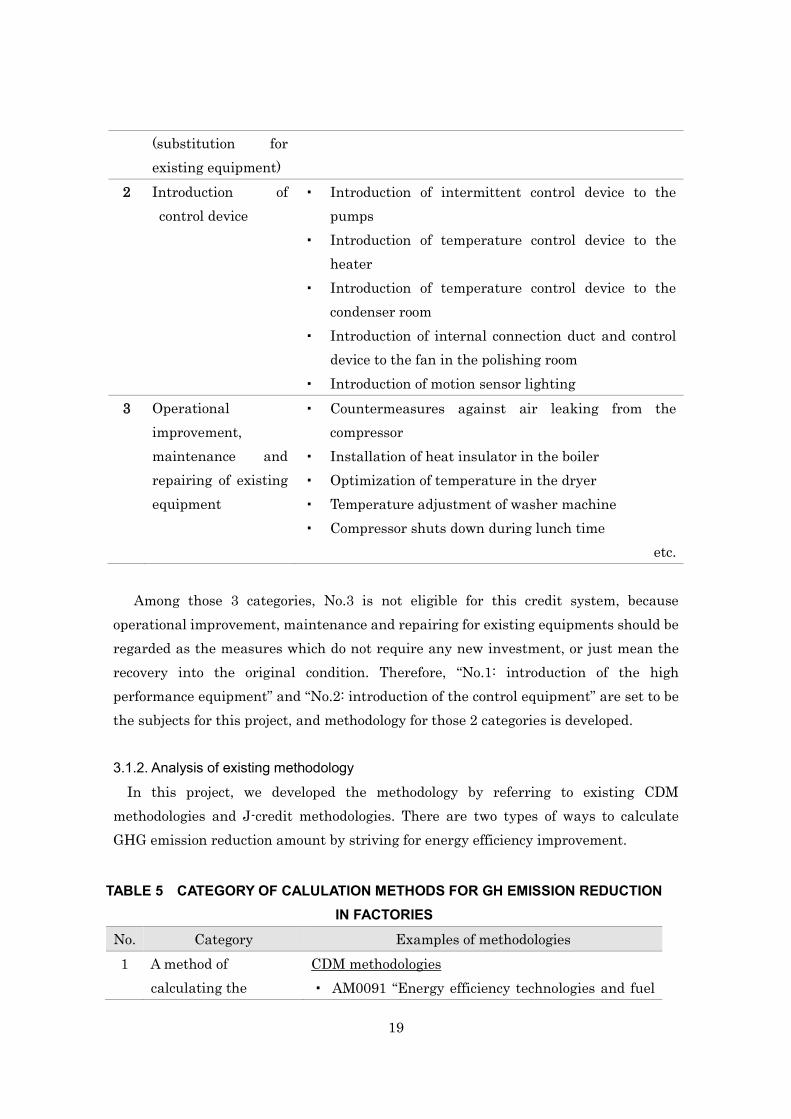
Among those 3 categories, No.3 is not eligible for this credit system, because
operational improvement, maintenance and repairing for existing equipments should be
regarded as the measures which do not require any new investment, or just mean the
recovery into the original condition. Therefore, “No.1: introduction of the high
performance equipment” and “No.2: introduction of the control equipment” are set to be
the subjects for this project, and methodology for those 2 categories is developed.
3.1.2. Analysis of existing methodology
In this project, we developed the methodology by referring to existing CDM
methodologies and J-credit methodologies. There are two types of ways to calculate
GHG emission reduction amount by striving for energy efficiency improvement.
No. Category Examples of methodologies
1 A method of
calculating the
CDM methodologies
· AM0091 “Energy efficiency technologies and fuel
TABLE 5 CATEGORY OF CALULATION METHODS FOR GH EMISSION REDUCTION
IN FACTORIES

20
amount of emission
reduction in whole
building or based on
the certain unit of
land area
switching in new and existing buildings”
· AMS-Ⅲ .AE “Energy efficiency and renewable
energy measures in new residential buildings”
· AMS- Ⅱ .Q “Energy efficiency and/or energy
supply projects in commercial buildings”
Etc.
J-credit methodology
N/A
2 A method of
calculating the
amount of emission
reduction by each
equipment introduced
to this project.
CDM methodologies
· AMS- Ⅱ .C “Demand-side energy efficiency
activities for specific technologies”
· AMS-Ⅱ .J “Demand-side activities for efficient
lighting technologies”
· AMS- Ⅱ .N “Demand-side energy efficiency
activities for installation of energy efficient
lighting and/or controls in buildings”
· AMS-Ⅱ.S “Energy efficiency in motor systems”
Etc.
J-credit methodology
· EN-S-001 “Introduction of high efficiency boiler”
· EN-S-002 “Introduction of high efficiency heat
pumps”
· EN-S-005 “Renewal of fan and pump or
installation of inverter and controlling
equipment”
· EN-S-006 “Introduction of high efficiency lighting
facilities”
Etc.
To calculate the amount of emission reduction based on whole building or certain
surface per unit, it is common to set the baseline by simulating on energy cnsumption
per unit, on the assumption of accumulated data in the past. This way may lighten the
burden of the credit application process, but in many JCM signer countries, it is
uncertain If the data which can be used for setting the original unit of energy
consumption in the building has accumulated enough. Then, developing a
methodology with this way seems not to be feasible. Normally, the way to calculate the

21
amount of emission reduction for each equipment tend to increase a burden because it is
necessary to carry out a data monitoring and emission reduction calculation particularly.
However, with EMS, which has a particular monitoring function, a burden to the
companies which handle the application process can be lightened. In addition to it,
EMS can avoid the effect of energy-saving or emission reduction to be overestimated
since EMS is able to quantify only the effect occurred by the project. Normally, the case
that many various projects are simultaneously handled, such as temperature setting or
repairing is not eligible for the project. However, EMS can resolve this point.
Therefore, in this project, we concluded that calculating the amount of emission
reduction based on each equipment is the best way to develop a methodology.
3.2. Overview of the methodology
The target of this methodology is the project which optimizes energy consumption,
introduces energy-saving equipment (high performance equipment and control
equipment), and reduces energy consumption and CO2 emissions.
3.2.1. Eligibility criteria
The criteria for this methodology are as follows;
No. Contents
Criterion 1 To implement energy-saving diagnosis before introducing
energy-saving equipment (high performance equipment, control
device).
Criterion 2 To introduce equipment which has higher energy efficiency than
existing equipment, or can control energy consumption in existing
equipment in factories subjected to the project.
Criterion 3 To introduce EMS to the factories subjected to the project, and
implement measurement and management of energy consumption
in the factories.
Criterion 4 Introduction of energy-saving equipment shall be implemented
either by the replacement of existing equipment or the new
installation on the existing equipment.
Criterion 5 Among the existing equipment which are subject to, the ones
which have already started working before the project are not
subject to this project.
This methodology sets the factories the object, and aims at;
22
(1) Promoting understanding energy-saving measures based on energy-saving
diagnosis, and confirming if there is potential of reduction.
(2) Implementing energy-saving measures based on the diagnostic result.
(3) Quantifying the reduction effect of energy-saving measures, and promoting the
diffusion of EMS which can visualize the amount of energy consumption
optimizing energy utilization.
Hence, based on these aims, we ordain the above mentioned eligibility criteria 1., 2., and
3.
Since criterion 4 determines the object of this methodology as existing equipments in
order to recommend energy-saving process in the factories as well as criteria 1,2, and 3,
the case of establishing a new factory is excluded.
Furthermore, this methodology aims to control energy consumption, which may lead
to discharge GHG emissions such as co-operative energy from non-renewable energy or
fossil fuel, so that criterion 5 excludes the equipment who had started its operation with
renewable energy before the beginning of this project.
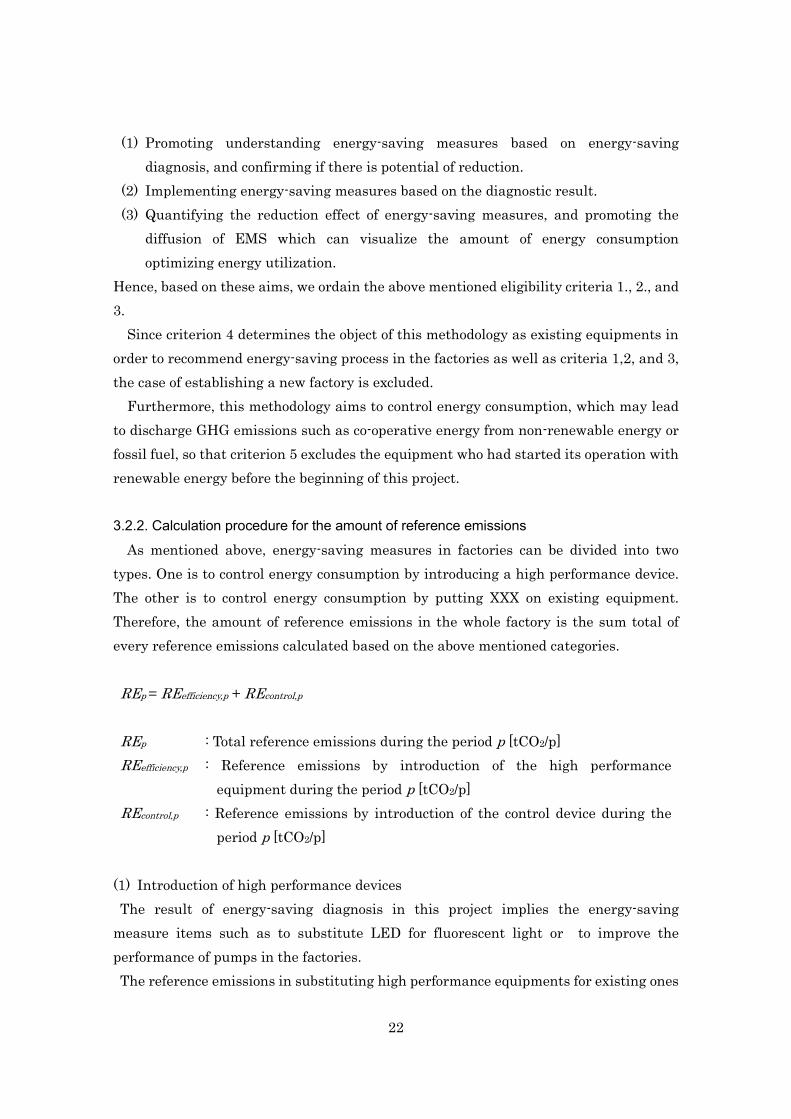
3.2.2. Calculation procedure for the amount of reference emissions
As mentioned above, energy-saving measures in factories can be divided into two
types. One is to control energy consumption by introducing a high performance device.
The other is to control energy consumption by putting XXX on existing equipment.
Therefore, the amount of reference emissions in the whole factory is the sum total of
every reference emissions calculated based on the above mentioned categories.
REp = REefficiency,p + REcontrol,p
REp : Total reference emissions during the period p [tCO2/p]
REefficiency,p : Reference emissions by introduction of the high performance
equipment during the period p [tCO2/p]
REcontrol,p : Reference emissions by introduction of the control device during the
period p [tCO2/p]
(1) Introduction of high performance devices
The result of energy-saving diagnosis in this project implies the energy-saving
measure items such as to substitute LED for fluorescent light or to improve the
performance of pumps in the factories.
The reference emissions in substituting high performance equipments for existing ones
23
are calculated as follows;
The reference emissions = the amount of energy consumption of the introduced
equipments x the efficiency differences of equipment before and after replacement
x the emission factors of used energy
The equipment efficiency means the index-value of working performance of the
equipment, differ from the index-value of energy efficiency of each introduced
equipment. The power dissipation for lightings, COP /APF for air conditioning, and the
boiler efficiency for boiler are subjects to the calculation.
REp = REefficiency,p + REcontrol,p
REp : Total reference emissions during the period p [tCO2/p]
REefficiency,p : Reference emissions by introduction of the high performance
equipment during the period p [tCO2/p]
REcontrol,p : Reference emissions by introduction of the control device during the
period p [tCO2/p]
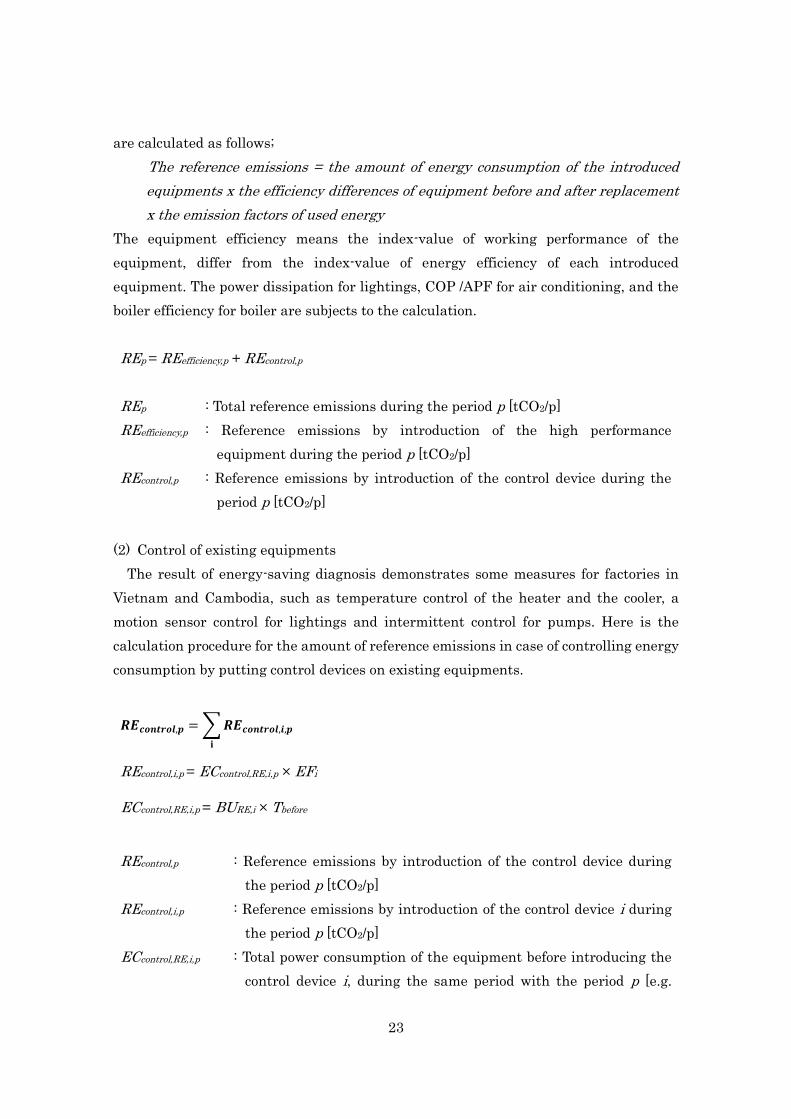
(2) Control of existing equipments
The result of energy-saving diagnosis demonstrates some measures for factories in
Vietnam and Cambodia, such as temperature control of the heater and the cooler, a
motion sensor control for lightings and intermittent control for pumps. Here is the
calculation procedure for the amount of reference emissions in case of controlling energy
consumption by putting control devices on existing equipments.
𝑹𝑬𝒄𝒐𝒏𝒕𝒓𝒐𝒍,𝒑 =∑𝑹𝑬𝒄𝒐𝒏𝒕𝒓𝒐𝒍,𝒊,𝒑𝐢
REcontrol,i,p = ECcontrol,RE,i,p × EFi
ECcontrol,RE,i,p = BURE,i × Tbefore
REcontrol,p : Reference emissions by introduction of the control device during
the period p [tCO2/p]
REcontrol,i,p : Reference emissions by introduction of the control device i during
the period p [tCO2/p]
ECcontrol,RE,i,p : Total power consumption of the equipment before introducing the
control device i, during the same period with the period p [e.g.

24
kWh,l,ton/p]
EFi : CO2 emission factor of the equipment with control device i [e.g.
tCO2/kWh,l,ton]
BURE : Base unit of reference energy usage of the equipment with the
control device i [e.g. kWh,l,ton/p]
Tbefore : Time of operation expected without capacity variability by control
device i [hour]
3.2.3. Calculation procedure for the amount of project emissions
Either the case of introducing high performance equipments or control device, the
amount of project emissions needs to be calculated by measuring the actual energy
consumption after the introduction. Calculation procedure is as follows;
PEp = PEefficiency,p + PEcontrol,p
PEp : Project emissions during the period p
PEefficiency,p : Project emissions by introduction of the high performance
equipment during the period p [tCO2/p]
PEcontrol,p : Project emissions by introduction of the control device during the
period p [tCO2/p]
The amount of project emissions by introducing high performance equipments
𝑷𝑬𝒆𝒇𝒇𝒊𝒄𝒊𝒆𝒏𝒄𝒚,𝒑 =∑𝑷𝑬𝒆𝒇𝒇𝒊𝒄𝒊𝒆𝒏𝒄𝒚,𝒊,𝒑𝐢
PEefficiency,i,p = ECefficiency,PJ,i,p ×EFi
PEefficiency,p : Project emissions by introduction of the high performance
equipment during the period p [tCO2/p]
PEefficiency,i,p : Project emission by introduction of the high performance
equipment i , during the period p[tCO2/p]
EC efficiency,PJ,i,p : Total power consumption of the device i, during the period p [e.g.
kWh,l,ton/p]
EFi : CO2 emission factor of the equipment with control device i [e.g.
tCO2/kWh,l,ton]
The amount of project emissiosn by introducing control devices
25
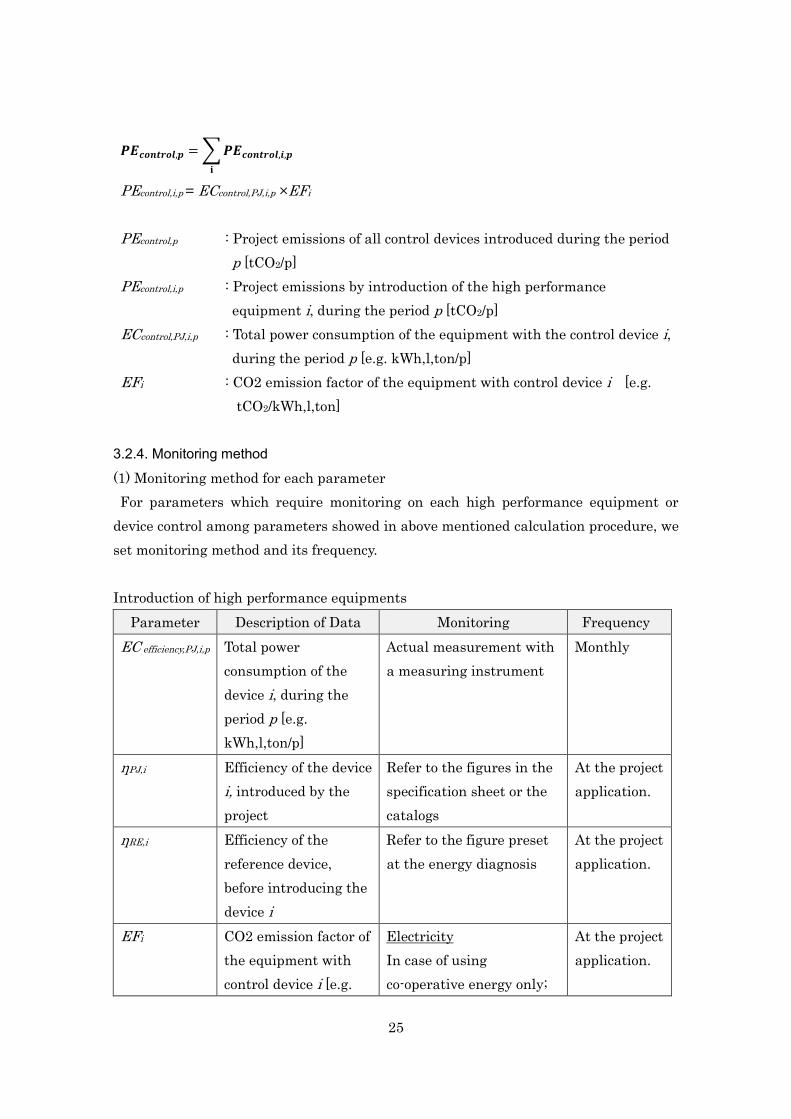
𝑷𝑬𝒄𝒐𝒏𝒕𝒓𝒐𝒍,𝒑 =∑𝑷𝑬𝒄𝒐𝒏𝒕𝒓𝒐𝒍,𝒊,𝒑𝐢
PEcontrol,i,p = ECcontrol,PJ,i,p ×EFi
PEcontrol,p : Project emissions of all control devices introduced during the period
p [tCO2/p]
PEcontrol,i,p : Project emissions by introduction of the high performance
equipment i, during the period p [tCO2/p]
ECcontrol,PJ,i,p : Total power consumption of the equipment with the control device i,
during the period p [e.g. kWh,l,ton/p]
EFi : CO2 emission factor of the equipment with control device i [e.g.
tCO2/kWh,l,ton]
3.2.4. Monitoring method
(1) Monitoring method for each parameter
For parameters which require monitoring on each high performance equipment or
device control among parameters showed in above mentioned calculation procedure, we
set monitoring method and its frequency.
Introduction of high performance equipments
Parameter Description of Data Monitoring Frequency
EC efficiency,PJ,i,p Total power
consumption of the
device i, during the
period p [e.g.
kWh,l,ton/p]
Actual measurement with
a measuring instrument
Monthly
ηPJ,i Efficiency of the device
i, introduced by the
project
Refer to the figures in the
specification sheet or the
catalogs
At the project
application.
ηRE,i Efficiency of the
reference device,
before introducing the
device i
Refer to the figure preset
at the energy diagnosis
At the project
application.
EFi CO2 emission factor of
the equipment with
control device i [e.g.
Electricity
In case of using
co-operative energy only;
At the project
application.

26
tCO2/kWh,l,ton] Refer to co-operative
energy emissions factor
published by government
In case of using reserve
power as well;
Refer to the lowest figure
among the ones published
by government and captive
emission factors adopted
by CDM
Fossil fuel
Refer to the IPCC figures
Existing device control
Parameter Description of Data Monitoring Frequency
ECcontrol,PJ,i,p Total power
consumption of the
equipment with the
control device i, during
the period p [e.g.
kWh,l,ton/p]
Actual measurement with
a measuring instrument
Monthly
EFi CO2 emission factor of
the equipment with
control device i [e.g.
tCO2/kWh,l,ton]
Electricity
In case of using
co-operative energy only;
Refer to co-operative
energy emission factors
published by government
In case of using reserve
power as well;
Refer to the lowest figure
among the ones published
by government and captive
emission factors adopted
At the project
application.
27
by CDM
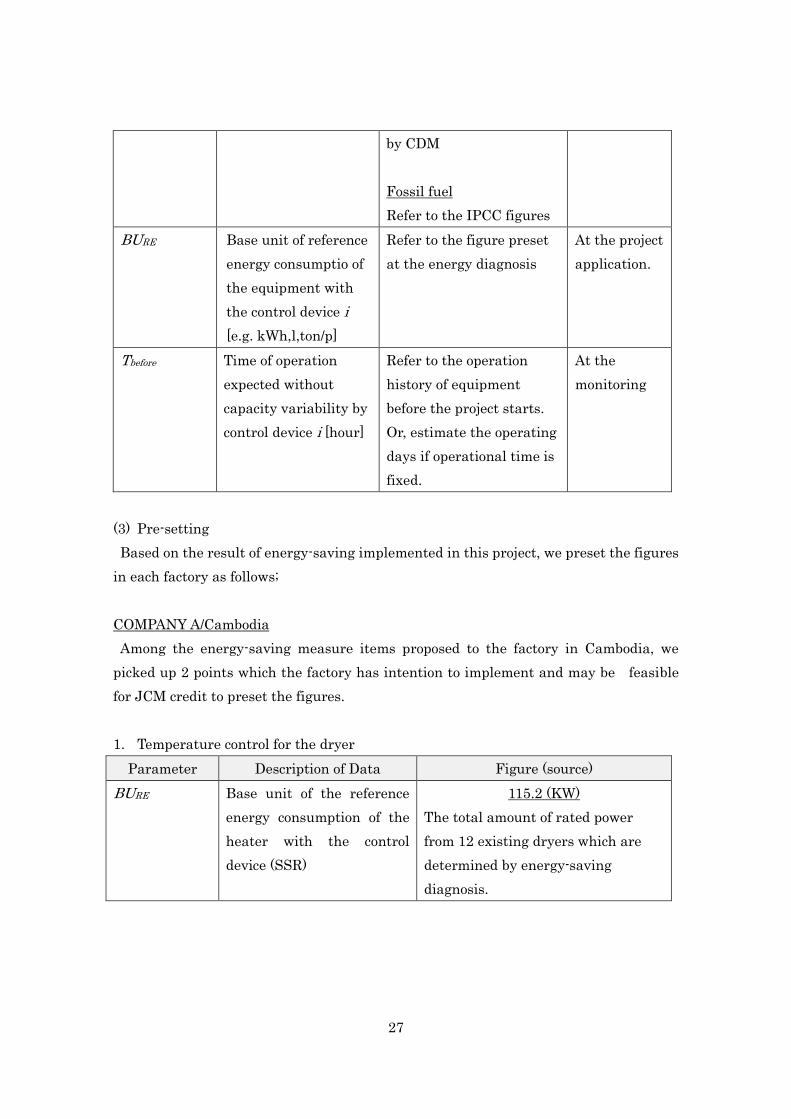
Fossil fuel
Refer to the IPCC figures
BURE Base unit of reference
energy consumptio of
the equipment with
the control device i
[e.g. kWh,l,ton/p]
Refer to the figure preset
at the energy diagnosis
At the project
application.
Tbefore Time of operation
expected without
capacity variability by
control device i [hour]
Refer to the operation
history of equipment
before the project starts.
Or, estimate the operating
days if operational time is
fixed.
At the
monitoring
(3) Pre-setting
Based on the result of energy-saving implemented in this project, we preset the figures
in each factory as follows;
COMPANY A/Cambodia
Among the energy-saving measure items proposed to the factory in Cambodia, we
picked up 2 points which the factory has intention to implement and may be feasible
for JCM credit to preset the figures.
1. Temperature control for the dryer
Parameter Description of Data Figure (source)
BURE Base unit of the reference
energy consumption of the
heater with the control
device (SSR)
115.2 (KW)
The total amount of rated power
from 12 existing dryers which are
determined by energy-saving
diagnosis.

28
2. Motor control for the aspirator in the polishing room
Parameter Description of Data Figure (source)
BURE Base unit of the reference
energy consumption of the
aspirator with the control
device (VFD).
40 (KW)
The total amount of rated power
from an existing aspirator which is
determined by energy-saving
diagnosis
COMPANY B/Vietnam
Among the energy-saving measure items proposed to the factory in Vietnam, we picked
up 4 points which the factory has intention to implement and may be possible for JCM
credit to preset the figures.
1. Introduction of high performance pump and intermittent control
Parameter Description of Data Figure (source)
BURE Base unit of the reference
energy consumption of the
pump with the control
device (VFD).
151(KW)
The total amount of rated power
from 13 existing pumps which are
determined by energy-saving
diagnosis.
2. Temperature control for the heater
Parameter Description of Data Figure (source)
BURE Base unit of the reference
energy consumption of the
dryer with the control
device (SSR).
299.7 (KW)
The total amount of rated power
from 3 existing dryers which are
determined by energy-saving
diagnosis
3. Temperature control for the fan in the cooling room
Parameter Description of Data Figure (source)
BURE Base unit of the reference
energy consumption of the
cooling fan with the control
device (temperature control
device)
27.3 (KW)
The total amount of rated power
from 5 cooling fans
29
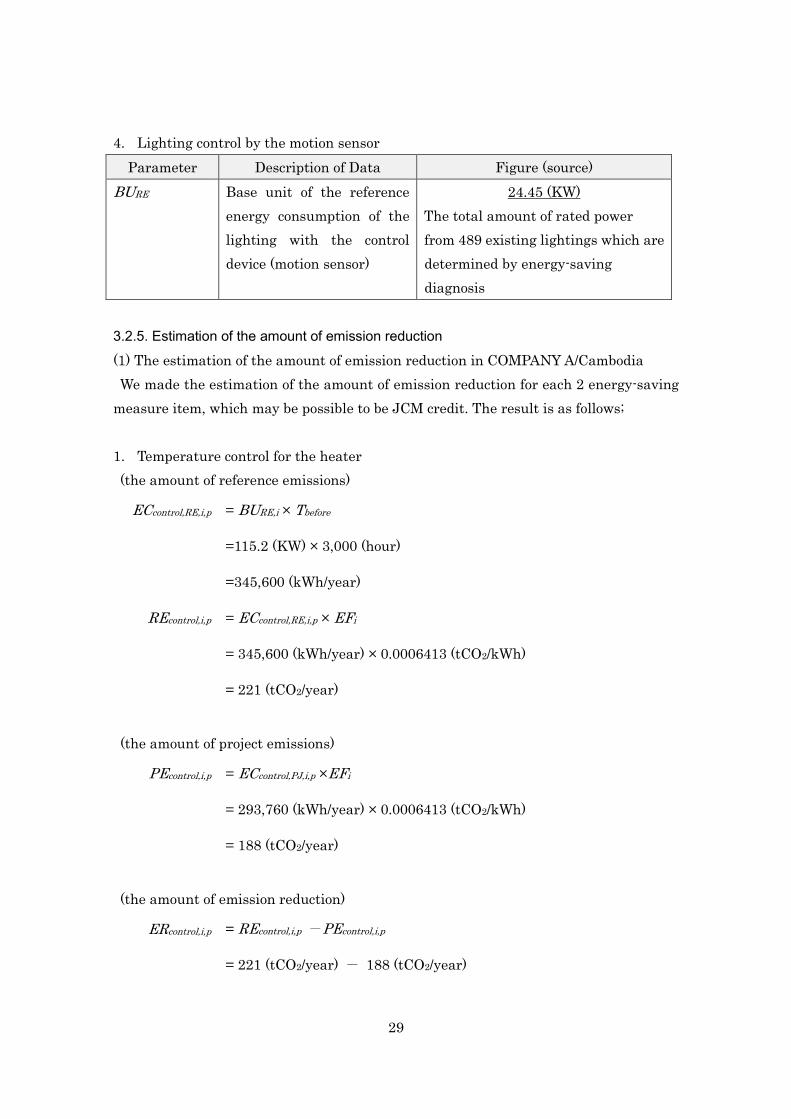
4. Lighting control by the motion sensor
Parameter Description of Data Figure (source)
BURE Base unit of the reference
energy consumption of the
lighting with the control
device (motion sensor)
24.45 (KW)
The total amount of rated power
from 489 existing lightings which are
determined by energy-saving
diagnosis
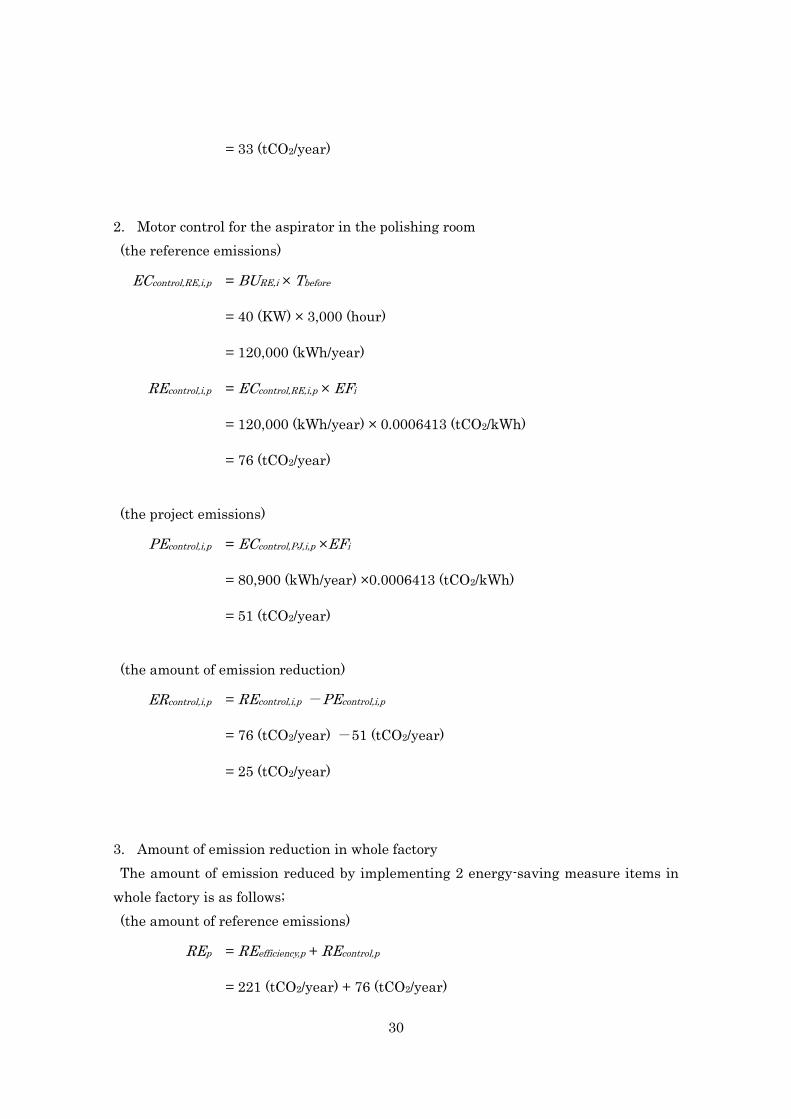
3.2.5. Estimation of the amount of emission reduction
(1) The estimation of the amount of emission reduction in COMPANY A/Cambodia
We made the estimation of the amount of emission reduction for each 2 energy-saving
measure item, which may be possible to be JCM credit. The result is as follows;
1. Temperature control for the heater
(the amount of reference emissions)
ECcontrol,RE,i,p
= BURE,i × Tbefore
=115.2 (KW) × 3,000 (hour)
=345,600 (kWh/year)
REcontrol,i,p = ECcontrol,RE,i,p × EFi
= 345,600 (kWh/year) × 0.0006413 (tCO2/kWh)
= 221 (tCO2/year)
(the amount of project emissions)
PEcontrol,i,p = ECcontrol,PJ,i,p ×EFi
= 293,760 (kWh/year) × 0.0006413 (tCO2/kWh)
= 188 (tCO2/year)
(the amount of emission reduction)
ERcontrol,i,p = REcontrol,i,p -PEcontrol,i,p
= 221 (tCO2/year) - 188 (tCO2/year)
30
= 33 (tCO2/year)
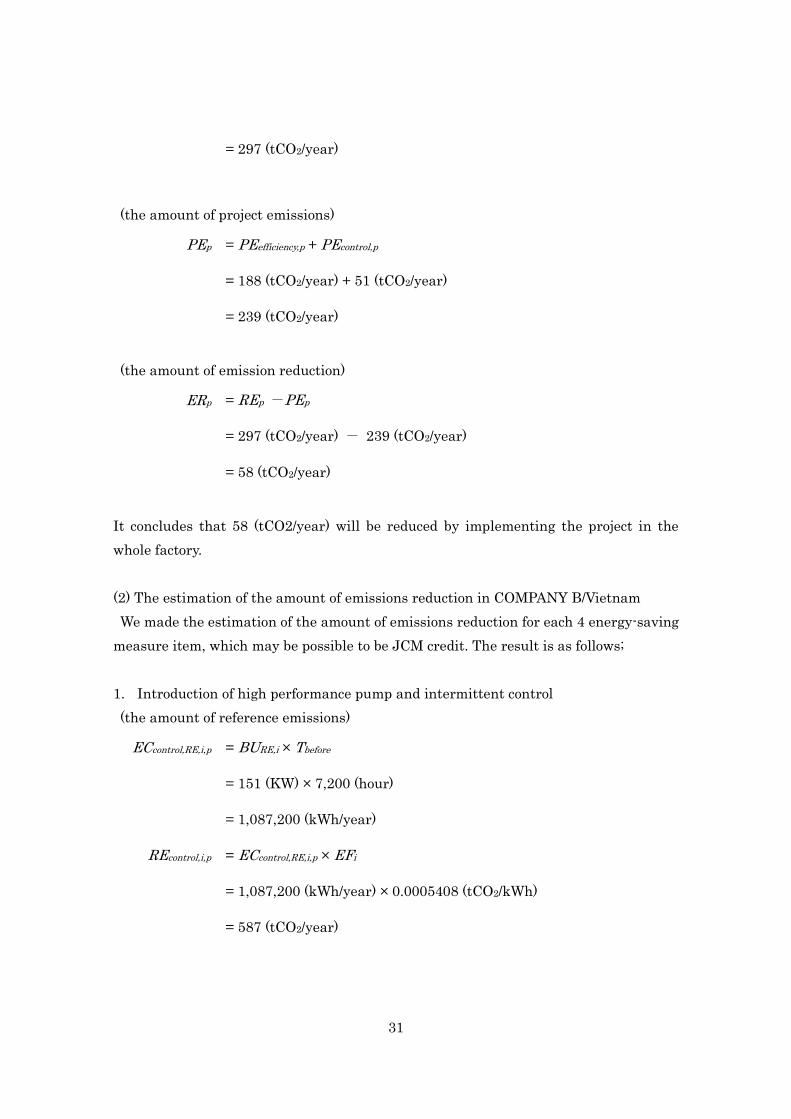
2. Motor control for the aspirator in the polishing room
(the reference emissions)
ECcontrol,RE,i,p
= BURE,i × Tbefore
= 40 (KW) × 3,000 (hour)
= 120,000 (kWh/year)
REcontrol,i,p = ECcontrol,RE,i,p × EFi
= 120,000 (kWh/year) × 0.0006413 (tCO2/kWh)
= 76 (tCO2/year)
(the project emissions)
PEcontrol,i,p = ECcontrol,PJ,i,p ×EFi
= 80,900 (kWh/year) ×0.0006413 (tCO2/kWh)
= 51 (tCO2/year)
(the amount of emission reduction)
ERcontrol,i,p = REcontrol,i,p -PEcontrol,i,p
= 76 (tCO2/year) -51 (tCO2/year)
= 25 (tCO2/year)
3. Amount of emission reduction in whole factory
The amount of emission reduced by implementing 2 energy-saving measure items in
whole factory is as follows;
(the amount of reference emissions)
REp
= REefficiency,p + REcontrol,p
= 221 (tCO2/year) + 76 (tCO2/year)
31
= 297 (tCO2/year)
(the amount of project emissions)
PEp
= PEefficiency,p + PEcontrol,p
= 188 (tCO2/year) + 51 (tCO2/year)
= 239 (tCO2/year)
(the amount of emission reduction)
ERp = REp -PEp
= 297 (tCO2/year) - 239 (tCO2/year)
= 58 (tCO2/year)
It concludes that 58 (tCO2/year) will be reduced by implementing the project in the
whole factory.
(2) The estimation of the amount of emissions reduction in COMPANY B/Vietnam
We made the estimation of the amount of emissions reduction for each 4 energy-saving
measure item, which may be possible to be JCM credit. The result is as follows;
1. Introduction of high performance pump and intermittent control
(the amount of reference emissions)
ECcontrol,RE,i,p
= BURE,i × Tbefore
= 151 (KW) × 7,200 (hour)
= 1,087,200 (kWh/year)
REcontrol,i,p = ECcontrol,RE,i,p × EFi
= 1,087,200 (kWh/year) × 0.0005408 (tCO2/kWh)
= 587 (tCO2/year)

32
(the amount of project emissions)
PEcontrol,i,p = ECcontrol,PJ,i,p ×EFi
= 536,256 (kWh/year) × 0.0005408 (tCO2/kWh)
= 290 (tCO2/year)
(the amount of emission reduction)
ERcontrol,i,p = REcontrol,i,p -PEcontrol,i,p
=587 (tCO2/year) - 290 (tCO2/year)
=297 (tCO2/year)
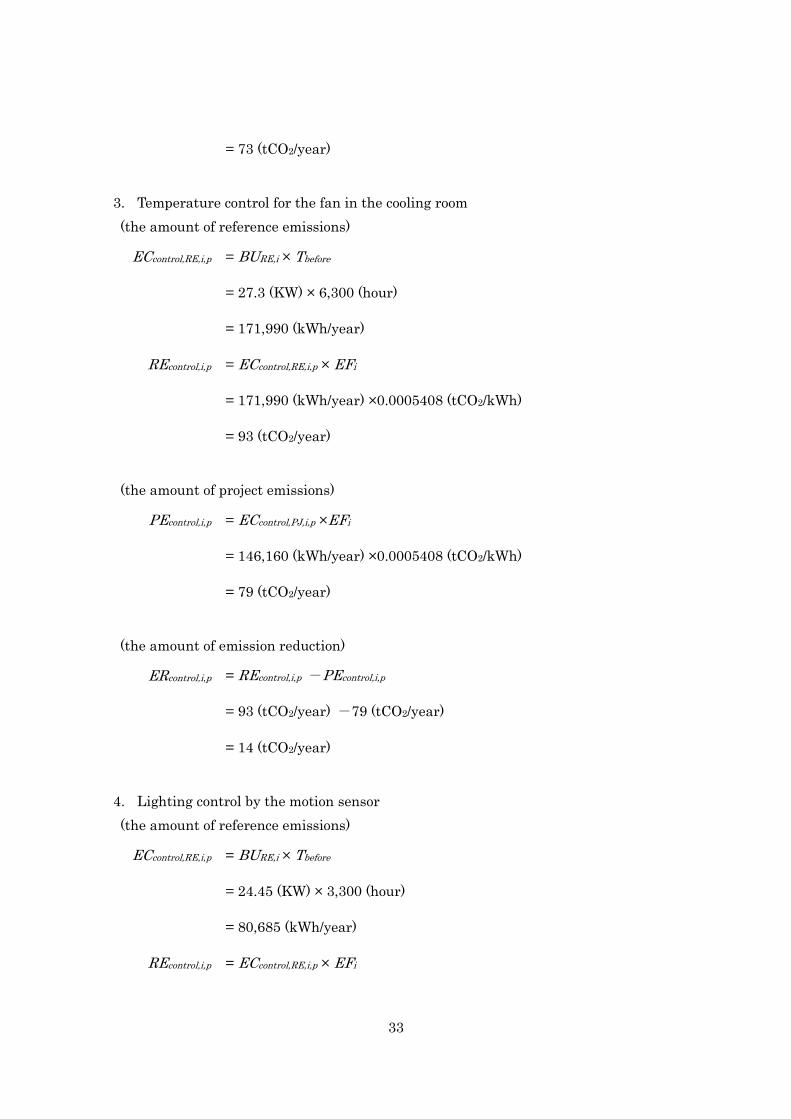
2. Temperature control for the heater
(the amount of reference emissions)
ECcontrol,RE,i,p
= BURE,i × Tbefore
= 299.7 (KW) × 3,000 (hour)
= 899,100 (kWh/year)
REcontrol,i,p = ECcontrol,RE,i,p × EFi
= 899,100 (kWh/year) ×0.0005408 (tCO2/kWh)
= 486 (tCO2/year)
(the amount of project emissions)
PEcontrol,i,p = ECcontrol,PJ,i,p ×EFi
= 764,235 (kWh/year) ×0.0005408 (tCO2/kWh)
= 413 (tCO2/year)
(the amount of emission reduction)
ERcontrol,i,p = REcontrol,i,p -PEcontrol,i,p
= 486 (tCO2/year) - 413 (tCO2/year)
33
= 73 (tCO2/year)
3. Temperature control for the fan in the cooling room
(the amount of reference emissions)
ECcontrol,RE,i,p
= BURE,i × Tbefore
= 27.3 (KW) × 6,300 (hour)
= 171,990 (kWh/year)
REcontrol,i,p = ECcontrol,RE,i,p × EFi
= 171,990 (kWh/year) ×0.0005408 (tCO2/kWh)
= 93 (tCO2/year)
(the amount of project emissions)
PEcontrol,i,p = ECcontrol,PJ,i,p ×EFi
= 146,160 (kWh/year) ×0.0005408 (tCO2/kWh)
= 79 (tCO2/year)
(the amount of emission reduction)
ERcontrol,i,p = REcontrol,i,p -PEcontrol,i,p
= 93 (tCO2/year) -79 (tCO2/year)
= 14 (tCO2/year)
4. Lighting control by the motion sensor
(the amount of reference emissions)
ECcontrol,RE,i,p
= BURE,i × Tbefore
= 24.45 (KW) × 3,300 (hour)
= 80,685 (kWh/year)
REcontrol,i,p = ECcontrol,RE,i,p × EFi
34
= 80,685 (kWh/year) × 0.0005408 (tCO2/kWh)
= 43 (tCO2/year)
(the amount of project emissions)
PEcontrol,i,p = ECcontrol,PJ,i,p ×EFi
= 40,343 (kWh/year) × 0.0005408 (tCO2/kWh)
= 21 (tCO2/year)
(the amount of emission reduction)
ERcontrol,i,p = REcontrol,i,p -PEcontrol,i,p
= 43 (tCO2/year) -21 (tCO2/year)
= 22 (tCO2/year)
5. The amount of emission reduction in whole factory
The amount of emission reduced by implementing 4 energy-saving measure item in
whole factory is as follows;
(the amount of reference emissions)
REp
= REefficiency,p + REcontrol,p
= 587 (tCO2/year) + 486 (tCO2/year) + 93 (tCO2/year) + 43 (tCO2/year)
= 1,209 (tCO2/year)
(the amount of project emissions)
PEp
= PEefficiency,p + PEcontrol,p
= 290 (tCO2/year) + 413 (tCO2/year) + 79 (tCO2/year) + 21 (tCO2/year)
= 803 (tCO2/year)
(the amount of emission reduction)
ERp = REp -PEp
35
= 1,209 (tCO2/year) - 803 (tCO2/year)
= 406 (tCO2/year)
It concludes that 406 (tCO2/year) will be reduced by implementing the project in the
whole factory.
3.3. In forthcoming issues
The methodology in this project was set to aim to lighten burdens for business
operators who have intention to issue the JCM credit in calculation for the amount of
emission reduction. The implementation of energy-saving diagnosis, and energy-saving
measures, and the actual measurement of the amount of energy used for each
equipment by introducing EMS are the presuppositions. However, the guarantee
method of maintaining the amount of emission reduction is still open to argument in the
future..
3.3.1. How to secure the maintainability of the amount of emission reduction
The amount of emission reduction in JCM credit system needs to be calculated
conservatively in order to maintain certainly the reduction amount by implementing
the project. When referring to the past methodologies, the way to secure the
maintainability is various according to each methodology. However, this methodology
aims to secure the maintainability by pre-setting the figures. In either case, the
introduction of high performance equipment or control device, pre-setting the figures
based on the power dissipation or the performance of equipment before the project is the
appropriate approach for determining the amount of reference emissions. To set
conservatively the figures in advance for each calculation, such as “Efficiency of the
reference device, before introducing the device i (ηRE,i)”,” Base unit of reference energy
consumption of the equipment with the control device i [e.g. kWh,l,ton/p](BURE)”, ,
following approaches are supposed;
1) Adopt the figures in the catalogs
In general, the equipment is deteriorating accordingly to daily use, then its capacity
and performance are degraded by comparison with catalogs or specification sheets.
Therefore, to calculate more conservatively the amount of reference emissions than the
actual figures, it is better to adopt the figures in the catalogs for pre-setting the base
unit of reference energy consumption of the equipment with the control device i(BURE)”,

36
as well as the efficiency of the reference device, before introducing the device i (ηRE,i)。
2) Consider the capacity degradation due to the aging degradation
In case where neither catalog, nor specification sheet exists, there is no approach
other than to measure at the energy-saving diagnosis. In this approach, it is possible to
secure the maintainability as well as the approach of adopting catalog figures, by
estimating performance degradation of each equipment, from its introduction to now,
and setting the performance at the introduction timing as the preset figures.
Regarding the validity and the feasibility of the above mentioned approaches, to
secure the maintainability of the calculation, verification through the registration
process of this methodology is still necessary.
Chapter 4. Analysis of the economic effect and the impact on the partner
countries trough the project
4.1. The economic effect through the project
This project aims to implement each measure and the introduction of EMS after the
energy-saving diagnosis. So that, we concluded to include the expense of energy-saving
diagnosis for calculating the economic effect. In the mean time, the introduction of the
equipment of solar power which is under consideration of COMPANY A in Cambodia, is
excluded from this calculation.
(USD)
investment
year1 year 2 years 3 years 4 years 5 years
Energy-saving diagnosis 33,000 0 0 0 0 0 0 0
EMS 36,000 0 0 0 0 0 0 0
Other mesures (excl. EMS) 157,880 142,960 0 142,960 406,405 669,850 933,295 1,196,740
total 226,880 142,960 0 142,960 406,405 669,850 933,295 1,196,740
0.0% 63.0% 179.1% 295.2% 411.4% 527.5%ROI
COMPANY AInvestment
cost
Annual
saving effect
Accomulation saving effect
TABLE 6 THE RESULT OF CALCULATION: THE ECONOMIC EFFECT ON
COMPANY A IN CAMBODIA
37
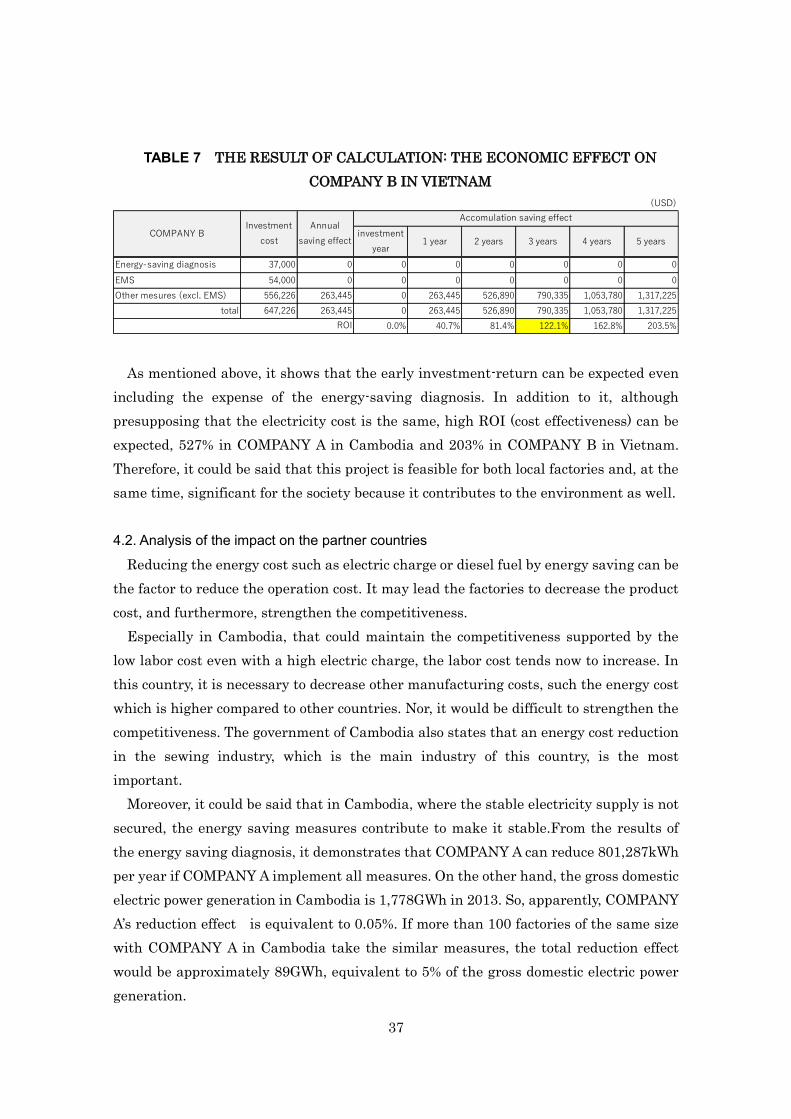
As mentioned above, it shows that the early investment-return can be expected even
including the expense of the energy-saving diagnosis. In addition to it, although
presupposing that the electricity cost is the same, high ROI (cost effectiveness) can be
expected, 527% in COMPANY A in Cambodia and 203% in COMPANY B in Vietnam.
Therefore, it could be said that this project is feasible for both local factories and, at the
same time, significant for the society because it contributes to the environment as well.
4.2. Analysis of the impact on the partner countries
Reducing the energy cost such as electric charge or diesel fuel by energy saving can be
the factor to reduce the operation cost. It may lead the factories to decrease the product
cost, and furthermore, strengthen the competitiveness.
Especially in Cambodia, that could maintain the competitiveness supported by the
low labor cost even with a high electric charge, the labor cost tends now to increase. In
this country, it is necessary to decrease other manufacturing costs, such the energy cost
which is higher compared to other countries. Nor, it would be difficult to strengthen the
competitiveness. The government of Cambodia also states that an energy cost reduction
in the sewing industry, which is the main industry of this country, is the most
important.
Moreover, it could be said that in Cambodia, where the stable electricity supply is not
secured, the energy saving measures contribute to make it stable.From the results of
the energy saving diagnosis, it demonstrates that COMPANY A can reduce 801,287kWh
per year if COMPANY A implement all measures. On the other hand, the gross domestic
electric power generation in Cambodia is 1,778GWh in 2013. So, apparently, COMPANY
A’s reduction effect is equivalent to 0.05%. If more than 100 factories of the same size
with COMPANY A in Cambodia take the similar measures, the total reduction effect
would be approximately 89GWh, equivalent to 5% of the gross domestic electric power
generation.
(USD)
investment
year1 year 2 years 3 years 4 years 5 years
Energy-saving diagnosis 37,000 0 0 0 0 0 0 0
EMS 54,000 0 0 0 0 0 0 0
Other mesures (excl. EMS) 556,226 263,445 0 263,445 526,890 790,335 1,053,780 1,317,225
total 647,226 263,445 0 263,445 526,890 790,335 1,053,780 1,317,225
0.0% 40.7% 81.4% 122.1% 162.8% 203.5%
COMPANY BInvestment
cost
Annual
saving effect
Accomulation saving effect
ROI
TABLE 7 THE RESULT OF CALCULATION: THE ECONOMIC EFFECT ON
COMPANY B IN VIETNAM

38
Chapter 5. Tasks for the project, success factors or issued for JCM in the future
First of all, a high initial cost for the equipment introduction in case of implementing
the energy saving diagnosis and EMS introduction / equipment efficiency improvement
at the same timing is the issue. To resolve this issue, it is preferable to start
disseminating the energy saving measures into the factories which have relatively high
financial power, but it may possibly lead to the partner countries to burden the risks, in
terms of technique or cost. If in the case of counting on the future diffusion into the
factories which have low financial power, it is better to utilize the government-led
system such as JCM, and give the incentives regarding the implementation of
energy-saving diagnosis or the equipment introduction to the partner countries.
As the possibility for JCM project, there are 2 options as follows;
1) Energy saving by combining EMS and the efficiency improvement of each
equipment
2) Energy saving only by EMS (visualization and the electricity demand control by
EMS)
Regarding 1), the demonstration time of those technologies is needed, as any
example of combination of EMS and the efficiency improvement of each equipment
has not been demonstrated in the partner countries. Therefore, it is preferable to utilize
“JCM feasibility studies and demonstration project” of New Energy and Industrial
Technology Development Organization (hereinafter called NEDO). Meanwhile, about 2),
it is assumed to aim to the JCM project registration by utilizing “MRV feasibility
studies and demonstration project” of NEDO as well.
Success factor is that, by implementing energy saving diagnosis, we could clearly
show the necessary measures, its introduction expenses and the cost effectiveness. It
indicates that the early investment return can be expected even though EMS and
energy saving diagnosis are used together. In the case of promoting the similar energy
saving measures in the future, it is preferable to propose the combination of EMS and
energy saving diagnosis.
Issue to be resolved is that, in the energy saving project, GHG reduction effect
obtained from the one single factory is small. In both Cambodia and Vietnam, most of
private factories are in the light industry, then the quantity of discharged emissions
from them are smaller than from the ones in the heavy industry. In this regard, the
possible approach is to disseminate the energy saving project in the factories as the
CDM project type. In this case, it is required to build the methodology to integrate
many projects into the one, then create credits by accumulating all reduced emissions. If
this method is not practical, the approach to increase the gross amount of GHG

39
reduction by combining with particular measures which have a higher reduction effect
should be adopted.
Chapter 6. Policy recommendation and the reaction of the partner governments
6.1. Current issues and the solution proposal
6.1.1 Current issues
Referring to the predicaments of saving energy in Japan, there may exist five
policy actions to promote the energy saving in the factories (Figure 17). Since the
governments of the partner countries do not have ample financial power, Figure 17 is
summarized from the point of view of taking the effective approaches, by considering
the period and scope needed for financial burden and policy support.
Policy actions Financia l
burden
Period for
policy
support
Scope Evaluation by our
company Predicaments in Japan
1. Formulaitio
n of energy
saving
related law
(mandatory)
Medium Long
term
Wide
area
Difficult to ensure
comprehensiveness
and equality, adjust
between the parties
concerned
Energy saving related low
(Obligation of
implementing the energy
saving measures)
2. Subsidy for
energy
saving
measures
Large Mid
term
Limite
d area
Difficult to implement
permanently due to
the limited target
range
Subsidy for rationalizing
energy use, reduce taxes
for green investment
3. Human
resource
development
for saving
energy
Small Long
term
Limite
d area
Low cost but takes a
long time, and limited
target range
Examination for qualified
energy manager’s license,
Courses in the Energy
conservation Center
(ECC)
4. Introduction
of energy
saving
Small Short
term
Wide
area
Difficult to train
consultants for the
certifying organization
ISO50001(Energy
management standard),
Eco action 21
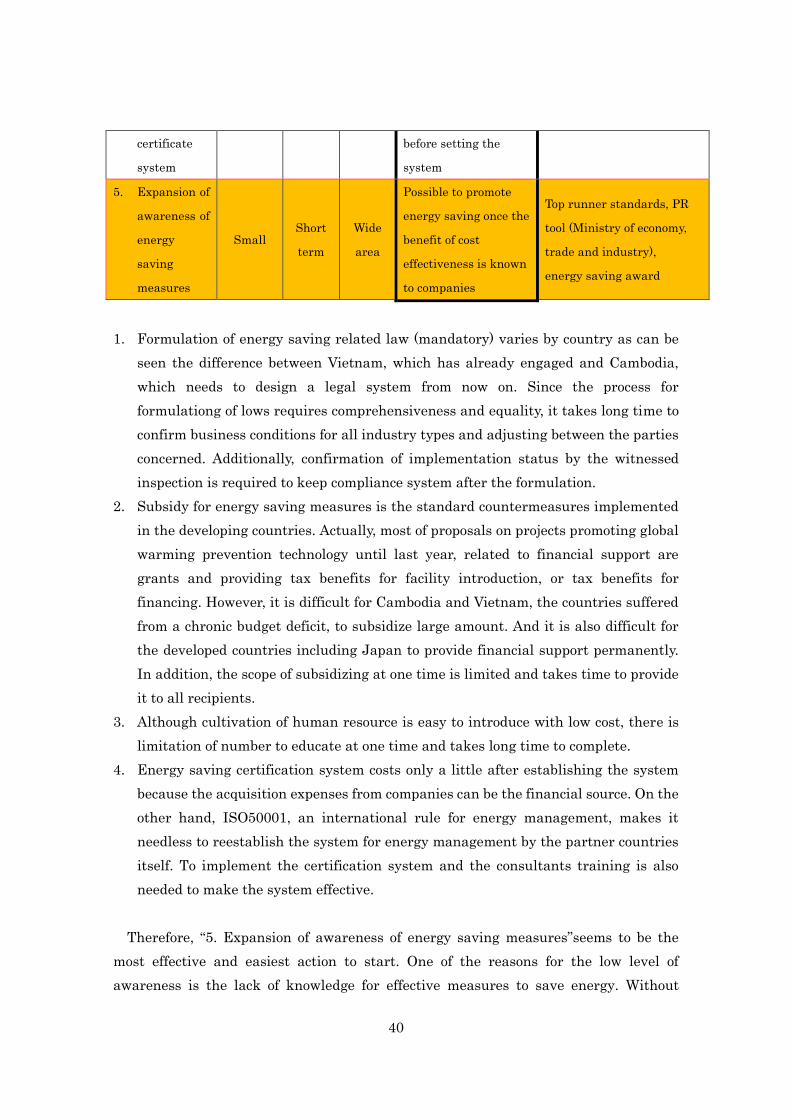
TABLE 8 EXPECTED POLICY ACTIONS FOR ENERGY SAVING
MEASURES
40
certificate
system
before setting the
system
5. Expansion of
awareness of
energy
saving
measures
Small Short
term
Wide
area
Possible to promote
energy saving once the
benefit of cost
effectiveness is known
to companies
Top runner standards, PR
tool (Ministry of economy,
trade and industry),
energy saving award
1. Formulation of energy saving related law (mandatory) varies by country as can be
seen the difference between Vietnam, which has already engaged and Cambodia,
which needs to design a legal system from now on. Since the process for
formulationg of lows requires comprehensiveness and equality, it takes long time to
confirm business conditions for all industry types and adjusting between the parties
concerned. Additionally, confirmation of implementation status by the witnessed
inspection is required to keep compliance system after the formulation.
2. Subsidy for energy saving measures is the standard countermeasures implemented
in the developing countries. Actually, most of proposals on projects promoting global
warming prevention technology until last year, related to financial support are
grants and providing tax benefits for facility introduction, or tax benefits for
financing. However, it is difficult for Cambodia and Vietnam, the countries suffered
from a chronic budget deficit, to subsidize large amount. And it is also difficult for
the developed countries including Japan to provide financial support permanently.
In addition, the scope of subsidizing at one time is limited and takes time to provide
it to all recipients.
3. Although cultivation of human resource is easy to introduce with low cost, there is
limitation of number to educate at one time and takes long time to complete.
4. Energy saving certification system costs only a little after establishing the system
because the acquisition expenses from companies can be the financial source. On the
other hand, ISO50001, an international rule for energy management, makes it
needless to reestablish the system for energy management by the partner countries
itself. To implement the certification system and the consultants training is also
needed to make the system effective.
Therefore, “5. Expansion of awareness of energy saving measures”seems to be the
most effective and easiest action to start. One of the reasons for the low level of
awareness is the lack of knowledge for effective measures to save energy. Without
41
concrete and cost-effective ideas, many companies may give up to implement
countermeasures considering an expensive initial investment. The countermeasures we
propose in this project has a large benefit of the early investment return period. It takes
only a few years and much shorter than installed equipment life, normally eight to
fifteen years. About Vietnam, taking into account calculating with actual low electric
expense, it is assumed to be shorter. Raising awareness of these benefits in owners who
own factories may enhance incentives to save energy and accelerate the penetration
even in the private sector.
Concrete approaches proposed by us are introducing examples and awards system.
When the global companies without its own factories in the local area as Asics, require
to save energy to its subcontract companies, it is understandable what kind of
measurements to take if predicaments are well known. From the point of view of CSR,
award system can easily appeal the company to the public.
In Cambodia, although concrete measures and targets are settled for saving energy in
EUEI PDF, the government priors electric and infrastructure equipment to raise
awareness. However, it is clear that unstable power supply and expensive electric
expense compared to neighboring countries disturb foreign investments to come.
Considering falling international competitiveness due to continuity of labor cost
escalation and increasing power demand, saving energy is definitely required.
According to Cambodia MME, lack of predicaments with obvious cost benefits is the one
of the biggest reasons to disturb penetration of concrete saving energy measures.
In Vietnam, the Japanese Government has already contributed to accelerate saving
energy. The saving energy related laws have already come into effect and the
government provides diagnosis for industries which use much energy as cement,
thermal power plants, coal, steel and iron. However, it is not provided to
small-to-medium-sized companies. According to Vietnam MOIT, the biggest problem is
lacking funds for implementing the measures even the energy saving diagnosis showed
its necessity clearly. Especially in Vietnam, saving energy cannot be regarded as a
management problem because of its low electricity cost. For these reasons, the
government expects the penetration of cost-effective measures. Realistically, FDI has
financial allowance and is regarded the suitable candidate to implement energy-saving
strategy at first. After confirming the effectiveness, it should be done in domestic
companies as well.

42
6.1.2. Predicaments in Japan
Raising awareness campaign conducted by the government in Japan is providing
information actively. There are a few examples below.
Portal-site for saving energy: shindan-net.jp
• Offer the diagnosis about possibility for saving energy technology importation
to small and medium-sized companies that have fewer human resources,
technology or financial power to save energy
• Aggressively offer the information through the website, by opening the dedicated
homepage to introduce predicaments of energy saving, or using panels and movies
in the events.
As a result of opening a dedicated website to show the effects of measures for every
industry/equipment including cost information, each company can adopt the
appropriate idea by itself.
Potal-site about energy saving by the government:setsuden.go.jp
• Provide the information about energy saving from ministries and agencies
• Publish the governmental announce about the period, time and goal for energy
saving, especially in the high power demand period.
• Obviously show how much electricity will be saved by taking each action2
2 METI, http://setsuden.go.jp/pdf/setsuden_menu_jigyo_other2015w.pdf

43
The government provides information not only through those websites, but also
accelerates saving energy through events, then requests companies, organizations and
municipalities to disseminate energy-saving information. Furthermore, the government
promotes enhancement of energy saving by transmitting information through the media
as newspaper and internet.3
Saving energy award
To promote products, activities, and consciousness regarding energy saving, the
government recognizes companies’ contribution to the energy saving by awards.
Evaluating companies for its excellent works and technologies also helps to improve the
corporate image
6.1.3. Solution Proposal for the partner countries
Since energy saving policy has not penetrated into private sector yet, approaches to
expand or promote the awareness of energy saving measures are effective. Energy
saving measures combined with EMS is cost-effective and have the possibility to lead
the companied to autonomously take action, by notifying these technologies to the
public. If the government can propose high ROI measures and show concretely the
investment effect while refering to predicaments of other countries, such as
expanding/promoting awareness, companies may be able to take energy saving actions
without much difficulty.
The followings are the proposed measures to expand awareness;
1. Opening the website
3 MEXT, http://www.mext.go.jp/a_menu/shisetu/cost/__icsFiles/afieldfile/2015/11/09/1340892_01.pdf

44
2. Preparation and distribution of pamphlets
3. Awards to the companies which take actions
4. Providing free or cheap diagnostic system for energy saving
Even though these above mentioned measures have already implemented partially in
both Vietnam and Cambodia, equipment installation has not yet progressed. The high
initial investment cost which is not affordable for the companies and the low awareness
of energy saving measures may be the road blocks. Especially for the former, we picked
up foreign companies which have enough financial power, but less awareness of the
energy saving measures as the target for promotion actions.
Moreover, it is also preferable to further study energy saving measure items or
manage a peak shift by the system control by visualizing the energy consumption on
each production line, with the combination of EMS and energy saving measures.
6.2. Future issues
Even though enough information is provided, the domestic companies tend not
actively to introduce energy saving equipment due to the initial investment cost.
Therefore, the approach of implementing promotion for the domestic factories of foreign
companies first, showing the concrete effects to the domestic companies, then
disseminating seems to be the effective method. The proposed measures for energy
saving in this project estimate 1-3 years of the investment return, calculated on the
energy saving effect per year to the initial investment cost (the effect of electricity
expense reduction). It implies the great benefit compared to the life expectancy of
introduced equipment, and it may be a strong incentive for the foreign companies to
introduce energy saving measures, and to follow for the domestic companies. Therefore,
it is the most important how to make the high ROI measures such as this project well
know by the foreign campanies first.
Chapter 7. Summary
This project aims to implement energy saving in ASICS’ subcontract factories with
the introduction of EMS and the efficiency improvement of each equipment. Through
this project, it is revealed that Governments recognize not only the supply approach, as
to increase supply sources, but also e demand approach, as to optimize energy
consumption, as problems. Governments recognize as well that it is necessary to adopt
enough policies for the peak control, such as peak cut / peak shift. Therefore, the
45
scenario to promote the peak control into local companied with the introduction of EMS
is one of the possible options. However, as it may be difficult to introduce only EMS,
visualizing the effect by combining with the energy saving diagnosis is the practical
way.
In the meantime, this project showed that there is an immense room for improving
the efficiency of each equipment in local. Especially in the light industry, which has less
large equipment, the equipment improvement can be implemented at a lower cost.
Furthermore, there are measures that its energy saving can be done only by the
operational improvement. So, these measures are able to be promoted in local, even
though excluded from JCM project.
The background to explain the reason why the energy saving measures of the
introduction of EMS and the efficiency improvement of each equipment is, that the
factories are not capable to judge which measures they should take or recognize what
the benefit (the economic effect) of the energy saving is. Hence forward, the approach to
promote the energy saving measures into the other factories by utilizing the JCM
system and implementing the model project is effective. The energy cost reduction by
the energy saving may lead the local industries to strengthen the competitiveness.
Therefore, this point will attract the foreign companies as well.
To implement this project as the JCM project, there are two approached as follows;
1) The energy saving by the combination of EMS and the efficiency improvement of
each equipment
2) The energy saving by single EMS (the visualization and the energy demand control
by EMS)
As the demonstration period is needed for the above mentioned 1), the approach to
utilize “JCM feasibility studies and demonstration project” of NEDO is potential. For
above mentioned 2), which does not require the demonstration period, aiming to be
registered as the JCM project by utilizing “MRV feasibility studies and demonstration
project” of NEDO is the possible approach.
Issue on implementing JCM project is that the effect of GHG emission reduction per
factory in the light industry is low, because the light industry discharge less emissions
compared to the heavy industry.Therefore, the methodology of issuing credits by
accumulating reduced emissions by combining many projects into one, ought to be
developed in the future.