feasibility study ship scrapping final report 21feb01feasibility study ship scrapping final report...
TRANSCRIPT

FINAL REPORT
DET NORSKE VERITAS – APPLEDORE INTERNATIONAL
COMMISSION OF THEEUROPEAN COMMUNITIES
TECHNOLOGICAL AND ECONOMIC FEASIBILITYSTUDY OF SHIP SCRAPPING IN EUROPE
REPORT NO. 2000-3527REVISION NO. 01

DET NORSKE VERITAS – APPLEDORE INTERNATIONAL
FINAL REPORT
Head Office: Veritasvn. 1, N-1322 HØVIK, NorwayFeasibility Study Ship Scrapping Final Report 21feb01.doc
DET NORSKE VERITASREGION NORGE AS
Environmental Advisory Services
Veritasveien 1,1322 HØVIK, NorwayTel: +47 67 57 99 00Fax: +47 67 57 99 11http://www.dnv.comOrg. No: NO 945 748 931 MVA
Date of first issue: Project No.:2001-02-13 590 00159Approved by: Organisational unit:
Christian L. S. RafnHead of Section
Environmental Advisory Services
Client: Client ref.:Commission of the EuropeanCommunities
Magnus Level
Summary:
The study has considered the feasibility of undertaking the procedures associated with the disposal offour vessel categories with respect to technology and economy within Europe, the wider EuropeanEconomic Area and in neighbouring countries (Eastern Europe and Russia). The four categories are:• Offshore structures• Merchant fleet• Inland waterway vessels• Naval vesselsFindings and conclusions are based on assessments including the review of decommissioning anddisposal decision factors, type and volume forecast predictions, established procedures, marketopportunities, legislative framework and compliance expectations.
The report presents disposal forecast results for each vessel category and provides guidance on thepotentials and opportunities of undertaking such activity in Europe. Limitations and requirementsassociated with decommissioning, dismantling and recycling/ re-use in a European context arediscussed and recommendations provided. These are supported by background data and detailspresented in Appendices.
Report No.: Subject Group:2000-3527 Indexing termsReport title:Technological and Economic Feasibility Studyof Ship Scrapping in Europe
Ship decommissioning/ scrapping/ recycling
Decommissioning volumes
Merchant/ offshore/ naval/ inland waterways
Feasibility in EuropeWork carried out by:Aage Bjørn Andersen (DNV), Øyvind Endresen (DNV), SueHall (AI), Pam Jose (AI), Raouf Kattan (Safinah), Peter Orrick(AI), Astrid Rydock (DNV), and Terje Sverud (DNV)
No distribution without permission from theclient or responsible organisational unit, i.e. freedistribution within DNV after 3 years
Work verified by:Egil Dragsund (DNV) Strictly confidential
Date of this revision: Rev. No.: Number of pages:13.02.2001 01 95 Unrestricted distribution

DET NORSKE VERITAS – APPLEDORE INTERNATIONAL
Report No: 2000-3527, rev. 01
FINAL REPORT
Page iReference to part of this report which may lead to misinterpretation is not permissible.
Feasibility Study Ship Scrapping Final Report 21feb01.doc
Table of Content Page
1 SUMMARY AND CONCLUSIONS........................................................................ 1
2 INTRODUCTION.................................................................................................... 42.1 Recycling and sustainability 42.1.1 Vessel categories 42.1.2 European Environmental Context 42.1.3 Implications for vessel disposal and scrapping industries 52.2 Objectives and scope 62.2.1 Methodology 62.3 Accomplishment 8
3 END-OF-LIFE DECISION FACTORS .................................................................. 103.1 Offshore structures 103.2 Merchant world fleet 113.3 Navy fleet 123.4 Inland fleet 12
4 DECOMMISSIONING VOLUME......................................................................... 144.1 The European dimension 144.1.1 The Basel Convention impact 154.2 Offshore structures 164.2.1 World-wide 164.2.2 Europe 164.2.3 Offshore decommissioning and disposal regulations 174.2.4 European scrapping forecast 174.2.4.1 Input to the recycling process 184.2.5 Conclusion 194.3 Merchant world fleet 194.3.1 The cargo carrying fleet 204.3.1.1 Flag state distribution 204.3.2 Scrapping supply, merchant world fleet 204.3.3 Europe 1999 224.3.4 Vessels sold for scrapping 1992-2000 244.3.5 Forecast - world merchant fleet scrapping rate 254.3.6 Conclusion 284.4 Navy fleet 304.4.1 World navy fleet 304.4.1.1 Global distribution 314.4.2 US navy fleet 314.4.3 Europe 324.4.4 Conclusion 33

DET NORSKE VERITAS – APPLEDORE INTERNATIONAL
Report No: 2000-3527, rev. 01
FINAL REPORT
Page iiReference to part of this report which may lead to misinterpretation is not permissible.
Feasibility Study Ship Scrapping Final Report 21feb01.doc
4.5 Inland fleet 344.5.1 World-wide 344.5.2 EU- fleet 354.5.2.1 The future of the European waterway fleet 384.5.3 Conclusion 394.6 Conclusion – all vessel categories 39
5 CURRENT PRACTICE ......................................................................................... 415.1 Industry Characteristics 415.2 Non-compliance in Current Practice 425.2.1 Adopted practices 425.2.2 Safety, Health and the Environment 435.2.3 Compliance mismatch 465.2.4 New Initiatives 465.3 Adopting Current Practice in Europe 47
6 MATERIAL COMPOSITION AND RETURN TO MARKET............................... 496.1 Background 496.1.1 Changes in resource management and policies 496.1.2 Changing provisions for ship scrapping 496.1.3 Minimising waste – maximising recycling 506.2 Material composition and waste streams 506.2.1 Material composition complexity 516.2.2 Waste streams 526.2.3 Material stream – quantities and qualities 536.2.3.1 Ferrous scrap metal – Non-ferrous scrap metal 546.2.3.2 Machinery 556.2.3.3 Electrical and electronic equipment 556.2.3.4 Minerals 556.2.3.5 Plastics 556.2.3.6 Liquids, chemicals and gases 566.2.3.7 Joinery related products 576.2.3.8 Miscellaneous 576.2.4 Waste streams and SHE aspects 596.2.4.1 Asbestos 596.2.4.2 PCBs 606.2.4.3 Radiation sources 616.2.4.4 Mercury 616.2.4.5 Isocyanates 626.2.4.6 Tributyl tin (TBT) 626.2.4.7 Lead (Pb) 626.2.4.8 Marine growth 626.2.4.9 Other waste streams 626.2.4.10 Extraction procedures, hazardous substances and SHE-exposure 636.2.5 Waste stream summary 67

DET NORSKE VERITAS – APPLEDORE INTERNATIONAL
Report No: 2000-3527, rev. 01
FINAL REPORT
Page iiiReference to part of this report which may lead to misinterpretation is not permissible.
Feasibility Study Ship Scrapping Final Report 21feb01.doc
6.3 Market for product categories from scrapping processes in Europe 686.3.1 Re-use, recycling and disposal options 686.3.2 Products 696.3.3 Markets 696.3.3.1 Offshore installations 706.3.3.2 Vessels 716.3.4 Potential barriers 71
7 SCRAPPING CAPACITY AND FUTURE VOLUMES......................................... 737.1 Scrapping Capacity 737.2 Future Scrapping Volumes 757.3 Vessel Sizes 76
8 SHIP DISPOSAL WITHIN EUROPE .................................................................... 778.1 Pre-processing 778.2 Ship Dismantling Facility 788.2.1 Functionality 798.2.2 Operation 818.2.3 Description of the Model Facility 838.2.4 Production Equipment 848.3 Greenfield/ Brownfield Site Alternatives 858.3.1 Brownfield Site Development 858.3.2 Greenfield Site Development 86
9 ECONOMIC AND COMMERCIAL FACTORS.................................................... 889.1 Revenue Streams 889.2 Cost Base 899.2.1 Dismantling Operational Labour Costs 899.2.2 Other Operational Costs 909.2.3 Facility Costs 919.3 Economics of Ship Dismantling Facility 919.4 Ship End-of-Life Value 92
10 REFERENCES....................................................................................................... 93
Appendix A Decommissioning volume - supportAppendix B Material and waste stream quantification - support

DET NORSKE VERITAS – APPLEDORE INTERNATIONAL
Report No: 2000-3527, rev. 01
FINAL REPORT
Page 1Reference to part of this report which may lead to misinterpretation is not permissible.
22 February 2001, B/feasibility study ship scrapping final report 21feb01.doc
1 SUMMARY AND CONCLUSIONSThe study has considered the feasibility of undertaking the procedures associated with thedisposal of four vessel categories with respect to technology and economy within Europe, thewider European Economic Area and in neighbouring countries (Eastern Europe and Russia). Thefour categories are:
Offshore structures Merchant global fleetInland waterway vessels Naval vessels
Findings and conclusions are based on assessments including the review of decommissioningand disposal decision factors, type and volume forecast predictions, established procedures,market opportunities, legislative framework and compliance expectations.
The report presents disposal forecast results for each vessel category and provides guidance onthe potentials and opportunities of undertaking such activity in Europe. Limitations andrequirements associated with decommissioning, dismantling and recycling/ re-use in a Europeancontext are discussed and recommendations provided. These are supported by background dataand details presented in Appendices.
Technical constraints and opportunities;From initial findings and volume forecast predictions, it has been shown that:
• Disposal policies differ widely between the categories
• The majority of vessel scrapping activity relates to merchant vessels (conventional shipscrapping)
• Currently this is undertaken almost exclusively outside of Europe
• The main scrapping activities take place in India, Bangladesh, Pakistan and increasingly inChina
• Many aspects of current principles and methods adopted and in use are non-compliant withEU health, safety and environmental legislation and objectives
• A considerable scrapping volume (capacity) is processed at non-facilitated sites on beachesrather than at dedicated facilities
• An increase in no./ tonnage of vessels requiring scrapping is predicted over a fifteen yeartimescale from 2001 – 2015
• The dominant component of this comes from the merchant ship fleet in which the predictedaverage annual volumes for Europe are:
• 107 – 247 ships• 4.3 – 11.1 million dwt

DET NORSKE VERITAS – APPLEDORE INTERNATIONAL
Report No: 2000-3527, rev. 01
FINAL REPORT
Page 2Reference to part of this report which may lead to misinterpretation is not permissible.
22 February 2001, B/feasibility study ship scrapping final report 21feb01.doc
• 2.9 – 7.4 million GT• 0.86 – 1.48 million tonnes steel
• It is not considered practicable to upgrade the existing facilities outside Europe to achievecompliance and the concept of pre-processing within Europe (or within other OECD memberstates) to achieve a sterile (or neutral) ship prior to dismantling is not considered to be eithereconomically or technically viable.
• Developments in environmental legislation and objectives within the EU are targeted tomaximise the re-use and recycling of materials and to reduce and limit the disposal of wastematerials by landfill or incineration. The policy of minimising waste and maximising returnwill also be governing for the disposal of vessels.
• There is little or no re-use market for ship components and/or structure within Europe andsignificant cultural and legislative obstacles exist to implement such practice. The emphasisof ship scrapping at the present time in a European context is therefore to maximise therecycling of waste materials rather than focusing on the opportunities of re-use.
• There is an economic balance between the labour cost of separation and the increased valueof ‘purer’ waste streams. The level of separation achievable in India and other ultra lowlabour cost countries is not considered economically viable in Europe and the absence oflocal re-use markets exacerbates this situation.
• Based on projected volumes, a single, high volume, fast turnaround facility is proposed,comprising a dock large enough to serve vessels up to 400,000 dwt.
• Existing limitations on the dimensions of scrap steel impose a requirement to dismantle themain steel structure into small pieces which currently are a maximum of 1.5 x 0.5 x 0.5m insize. To achieve a fast turnaround of ships through the dock, ships will be initially dividedinto large 800 tonne sections for transfer to land-based open dismantling workstations or tocovered workshops where the removal of toxic or hazardous materials as required will becarried out.
• A combination of thermal and mechanical cutting processes are proposed for the steeldismantling process, which is estimated to represent approximately ¾ of the total wastestream by weight.
• The remaining ¼ of the waste stream has been categorised into basic waste streams whichwill require recycling.
Economic issues;• The economic analysis has demonstrated that the end-of-life value of the vessels will be
heavily dependent upon the costs of separation and dismantling, such costs being in turnprimarily influenced by the prime employment cost of labour.
• Additionally in undertaking the analysis, it has been necessary to assume a resale/disposalvalue to the anticipated waste streams. “Scrap” values in the recycling field are generallyhighly volatile representing commodity market prices and our economic analysis has utilisedcurrent market values. Variations in scrap values and disposal costs will of course affect the

DET NORSKE VERITAS – APPLEDORE INTERNATIONAL
Report No: 2000-3527, rev. 01
FINAL REPORT
Page 3Reference to part of this report which may lead to misinterpretation is not permissible.
22 February 2001, B/feasibility study ship scrapping final report 21feb01.doc
economics of ship dismantling. The dominance of scrap steel revenues will make thisparticularly applicable.
• It should be noted that the productivity levels achieved in dismantling, and hence therequired manning levels of the facility, will influence the overall economics. The adoption ofnovel applications of steel cutting technology and the assumptions regarding otherdismantling labour requirements inevitably mean that the economic analysis should only beconsidered as a “broad-brush” indication.
• The analysis demonstrates however that projected ships end-of-life values, expressed in US$per tonne of steel, are highly dependent upon the labour cost in the country of the dismantlingfacility. The example shows that a “break-even” point falls somewhere in the range ofUS$10 –15/hr.
• Employment costs in most Eastern European and FSU countries fall in the range US$1-5/hrwhereas in Western European countries employment costs fall in $15 – 30/hr range.
• Economic viability will therefore be greatest in the lower cost economy countries of EasternEurope and the FSU, and it is likely that the labour costs applicable within Western Europeancountries would result in a negative ship end-of-life value.
• Such end-of-life values contrast with the scrapping prices paid currently to shipowners by theship scrapping operators. These values themselves are market driven and volatile, howeverrecent values of $125/steel tonne have been quoted and trends have shown prices in the rangeUS$ 100-125 /steel tonne over the last few years. At such levels the current shipyardoperators would seem to be able to achieve a premium to international scrap steel prices interms of the net revenue per steel tonne achievable.
Technological and Economic Feasibility of Ship Scrapping in Europe rests upon the ability ofapplying efficient non-labour intensive steel processing methods in a high volume scenario. Thedevelopment of furnace technologies allowing larger “scrap-batches” will reduce the requiredcutting volume and thereby improve the economy of the process.

DET NORSKE VERITAS – APPLEDORE INTERNATIONAL
Report No: 2000-3527, rev. 01
FINAL REPORT
Page 4Reference to part of this report which may lead to misinterpretation is not permissible.
22 February 2001, B/feasibility study ship scrapping final report 21feb01.doc
2 INTRODUCTIONThere is no purpose-made legislative framework covering the demolition processes of vessels assuch, either in Europe or elsewhere. There are, however, various standards, norms, regulationsand international conventions that may have applications or relevance within certain segments ofthe processes involved. These may be of occupational nature or may concern environmentalmatters, safety issues, aspects of health and general employment rights. Within Europe, suchlegislation is well developed, established and adhered to in most all sectors and mirrorexpectations to conformity for non-regulated industrial activities.
2.1 Recycling and sustainabilityCurrent ship scrapping and associated vessel demolition activities represent a manufacturingindustry supplying raw materials to steel industries as well as providing 2nd hand components toa wider market.
Steel production from scrap is a sustainable process in that it achieves a far better environmentalperformance in light of energy efficiency and the preservation of non-renewable resources incomparison with the alternative ore-based production. The energy balance between the twoapproaches may differ by up to 70%. However, the majority of scrap volume originating fromvessels is extracted by means seriously in conflict with those principles generally valid andexpected within the European community.
2.1.1 Vessel categoriesOffshore fields, not only those within Europe, are decommissioned or updated by theintroduction of modern production concepts at an increasing rate. Consequently, an increase inrequired scrapping capacity for offshore structures may be expected in a relatively shorttimescale.
The vast majority of merchant tonnage sold for scrapping is exported to facilities located on theIndian sub-continent. These, often larger vessels reflecting the building scenario of the 1970’sand the 1980’s, arrive at the beach-based non-facilitated sites usually by their own power.
Smaller merchant vessels, inland waterway vessels, are most often disposed off locally. Statisticsindicate that this fleet segment is decreasing and hence one is lead to believe that the scrappingvolume in this category is increasing.
The disarmament following the ending of the cold war and the collapse of the economy of theformer USSR republics has lead to a huge increase in naval tonnage being decommissioned.However, a relatively small proportion of these has been scrapped. This may reflect a desire bystates to maintain a certain military contingency. Looking at the age composition ofdecommissioned naval vessels, it becomes evident that disposal will be required increasingly inthe near future.
2.1.2 European Environmental ContextFaced with the ever-increasing volume of waste generated by our modern consumer society, theEuropean Community is developing a long-term strategy to reduce the amount of waste

DET NORSKE VERITAS – APPLEDORE INTERNATIONAL
Report No: 2000-3527, rev. 01
FINAL REPORT
Page 5Reference to part of this report which may lead to misinterpretation is not permissible.
22 February 2001, B/feasibility study ship scrapping final report 21feb01.doc
produced, and to ensure that this waste is disposed of in a manner causing least damage to theenvironment.
The ban amendment of the 1989 Convention on Transboundary Movements of HazardousWastes and their Disposal (Basel Convention) specifically prohibits the export of hazardouswastes from the Community (OECD member states) to non-OECD member states. Many of thehazardous materials to be found aboard end-of-life vessels appear in the Annex VIII and AnnexIX waste lists (list A/ B) of the convention.
The European community is also looking to reduce our dependency on landfill, and is activelyencouraging other methods of waste disposal such as recycling and composting, as well asincineration with energy recovery.
The volatility of the markets for recyclable materials make it difficult to maintain standards inrecycling operations, as health, safety and environmental issues are often ignored or de-prioritised as a consequence of optimising profits or that of declining revenues. Most Europeangovernments have adopted legislative measures to correct this situation, using the principle of“the Polluter pays”.
Legislation has placed a duty of care on the producer of waste to ensure that a properly licensedwaste disposal contractor handles the waste, in a sound environmental manner. There is a cost tothe waste disposal operator in acquiring the relevant licences and maintaining the standardsnecessary to hold the licences. This cost is passed on the waste producer. Laws introduced inindividual European countries also include a landfill tax, and a ban on certain materials fromlandfill, further encouraging waste producers to look at reducing or recycling waste.
These laws have enabled the recycling industry to commence charging for the handling ofmaterials for recycling, as the waste producer has either no alternative route or a more costlywaste disposal route.
2.1.3 Implications for vessel disposal and scrapping industriesThe changes in regulations in the EU and the growth in environmental concerns relating todisposal were highlighted in the Brent Spar disposal of the offshore structure. This, combinedwith pressure from Norway and the USA, has served to highlight the concerns over theconditions under which ship scrapping currently takes place.
The ban amendment of the Basel Convention may also require the shipping industry withinEurope to reconsider its approach to the scrapping of ships that have reached the end of theiroperational life.
Considering European legislation in other areas, notably packaging and car manufacture, there isemerging a clearly defined role and responsibility of the producer and users in the subsequentdisposal of products that are manufactured.
This, combined with the EU control over the export of toxic material, could very easily changethe face of ship scrapping as we see it today. At present a ship owner receives payment when heoffers his ship for sale as scrap. However, if the standards for carrying out the work are raisedand the by-products handled, recycled and disposed of responsibly, this could result in a situationwhere the ship owner may experience a considerable cost or reduced income associated todisposal. This may have a considerable impact on the economics of the shipping industry. For

DET NORSKE VERITAS – APPLEDORE INTERNATIONAL
Report No: 2000-3527, rev. 01
FINAL REPORT
Page 6Reference to part of this report which may lead to misinterpretation is not permissible.
22 February 2001, B/feasibility study ship scrapping final report 21feb01.doc
the naval and the offshore sector, an increase in decommissioning costs would not imply suchimpacts to the same extent.
2.2 Objectives and scopePossibilities and constraints associated with the scenario of increasing vessel disposal andscrapping within Europe, the wider European Economic Area and in neighbouring countries(Eastern Europe and Russia) are assessed in light of developing a viable and sustainable industry.The project have carried out a work programme where focus has been as follows:
Ø Demand for scrapping capacity over a 15-year perspective
Ø Capability
Ø Commercial aspects
By identifying driving factors generating the mechanisms involved in decommissioningincluding both demand and capacity, a knowledge basis is established. This represents aninformation resource starting-point supporting the assessments necessary in order to evaluate thefeasibility of undertaking ship scrapping in Europe. The context of these assessments areidentified by drawing the framework to which ship scrapping should be subjected, reflectingapplicable regulations and adopted and recognised practices including the aspects of safety,health and the environment. Commercial realism is assessed and implemented in projectactivities as applicable.
2.2.1 MethodologyA methodical strategic approach (see Figure 2-1) is adopted in order to address the studyobjectives.

DET NORSKE VERITAS – APPLEDORE INTERNATIONAL
Report No: 2000-3527, rev. 01
FINAL REPORT
Page 7Reference to part of this report which may lead to misinterpretation is not permissible.
22 February 2001, B/feasibility study ship scrapping final report 21feb01.doc
O B J E C T I V E S - F R A M E S - R E Q U I R E M E N T S
CAPABILITY
DEMANDDecommissioning?Scrapping? Recycling?
Decision drivers
Merchant
Naval
Offshore
Inland
OPTIONS
PROCESSING
Short/ Medium/Long term
Hazards –health, safety andthe environment
Costs
Skills
Regulations
Infrastructure
Facilities
Capacity
COMMERCIAL ASPECT
Scrapping technologies
Recycling technologies
Economics 2nd. hand market
CONCLUSIONS
Figure 2-1 Project structure, work programmes and interrelated tasks. Colour codesrefer to related subject areas.
The initial angle of the study aims to:
Ø Define and quantify the demand for decommissioning/ scrapping by statistics and probabilityprediction models forecasting a future trend over a 15-year perspective. This includes theidentification of dominant decision drivers for respective vessel categories.
Ø Assess issues of environmental concern related to the decommissioning/ scrapping processincluding addressing material composition focussing on areas associated with the aspects ofsafety, health and the environment.
Ø Define and quantify ship scrapping capability and key parameters affecting this.
Ø Assess and provide recommendations on the technological context within which shipscrapping takes place. (Demolition/ treatment and recycling technologies).
Ø Address economics, the costs and revenues associated with the decommissioning process.These are key-tasks providing insight enabling considerations on opportunities arising from theresultant demand/ supply combination and to the economic implications to be made.

DET NORSKE VERITAS – APPLEDORE INTERNATIONAL
Report No: 2000-3527, rev. 01
FINAL REPORT
Page 8Reference to part of this report which may lead to misinterpretation is not permissible.
22 February 2001, B/feasibility study ship scrapping final report 21feb01.doc
Recommendations on future scrapping strategies and associated matters are based upon thisapproach.
2.3 AccomplishmentThe study commences with an analysis of the world fleets for merchant vessels, offshorestructures, naval vessels and inland waterway vessels. Characteristics and projections ofdemands and requirements associated with the disposal of these, once they have reached the endof their useful life, has been established. The analysis demonstrates that the dominant volumeclearly emerging from the merchant vessel sector with the other three sectors representing a verysmall part of total demand. The merchant vessel sector is similarly dominated by the cargovessel fleet which represent approximately 95% by deadweight. The remaining analysis hastherefore concentrated on the volumes, nature and characteristics of the cargo vessels sector,which will dictate the facilities required.
The initial review of the current situation in the ship scrapping market identified that there islittle or no activity currently taking place within neither European OECD member states (OECDEurope) nor the geographical Europe.
The current dominant areas for ship scrapping in the world market are India, Bangladesh,Pakistan and China. The conditions under which scrapping is undertaken in the Indian sub-continent have been studied to some detail and are considered to be non-compliant in manyrespects in relation to EU safety, health and environmental (SHE) legislation and objectives.The nature of this non-compliance is fundamental to the scrapping process and downstreamrecycling and reuse procedures, and is considered to be deeply rooted in the cultural, social andlegislative environment of the countries. It may therefore be assumed that the provision of acompliant ship scrapping facility would need to be located within Europe.
Environmental objectives and legislation within the EU are increasingly focusing on re-use orrecycling of materials to reduce the volume of landfill and incineration of waste as well as topreserve natural resources and in particular those being non-renewable. It is assumed in thisstudy therefore that maximum levels of recycling or re-use will be an issue of compliance andshould be prioritised. At present time, there are many social, legislative and cultural barriers tothe re-use of ship’s components within the EU and there are no meaningful markets for suchitems unlike countries in the Indian sub-continent. Following this line of argument, it isconcluded that the potential of ship scrapping in Europe must focus on recycling rather thandismantling for component reuse.
Within the recycling scenario there is an economic balance to be achieved between the cost ofseparation of mixed components and the increased waste stream value or recycling opportunitiesfor ‘purer’ waste streams. Experience from recycling industries elsewhere however, indicatesthat such separation is generally not cost effective. It is therefore assumed that the level ofseparation achieved in the traditional ship scrapping countries is neither justifiable in terms ofend use opportunities nor economically viable. The waste streams resulting from the demolitionprocess have been assessed and a number of primary waste stream categories representingpotential assets have been identified. These have provided as a base for the economic analysis ofship dismantling undertaken.
The amount of waste is dominated by the volumes of steel in terms of both weight and volume.

DET NORSKE VERITAS – APPLEDORE INTERNATIONAL
Report No: 2000-3527, rev. 01
FINAL REPORT
Page 9Reference to part of this report which may lead to misinterpretation is not permissible.
22 February 2001, B/feasibility study ship scrapping final report 21feb01.doc
The physical characteristics of ships dictate the physical characteristics of the required facilities.To cater for the variety in ship size, facilities must also offer a level of flexibility enablingparallel as well as sequential operations of multi-type/ size vessels. Large docking facilities arerequired of which the main driver is the volume of the predominantly steel cargo areas of thevessels. On the basis of the projected ship scrapping volumes, it becomes clear that volumeprocessing of steel is the dominant characteristic. Analysis has shown that a single dock facilitywould handle the projected annual volumes and provide the best economies of scale. Some 98%of the forecast scrapping requirement by deadweight (representing 99.9% by numbers) relates tovessels up to 400,000 dwt and the capital cost difference between this size of dock and a smallerdock is relatively small in overall terms. It has therefore been assumed that a single volumethroughput facility is appropriate incorporating a dock large enough to handle vessels up to400,000 dwt.
Market prices for waste materials in the recycling market are highly volatile reflecting the supplyand demand of the commodities. It is not possible to reflect such variability within the scope ofthis study, and so current resale and disposal values have been assumed in order to undertake abasic economic analysis.
Assumptions have had to be made regarding the productivity of dismantling activities withinsuch a high volume purpose developed facility. The productivity level achievable for thedismantling of the steel structure of the vessel will in particular have an influence. This study hasnot identified any similar facility handling the physical size and workload volume of shipscantling steels. A variety of available steel cutting technologies have therefore been assessedbefore concluding that a combination of thermal and mechanical cutting processes offers the besteconomics. Current standards in the scrap steel market limit the size of sections that will beaccepted to approximately 1.5 x 0.5 x 0.5 metres which imposes an enormous workload on thefacility. The steelwork cutting productivity is therefore likely to have a major impact on theoverall economics of the processes. We have estimated this through theoretical analysis ofcutting lengths and known process times for such. The limited size is governed by currentfurnace limitations. An increase in acceptable size will reduce the required workload and henceinfluence the economics of the facility.
In general terms, it becomes clear from the analysis that the cost of labour for manning theproposed facility is a critical factor to the end-of-life value that may be expected from theproposed approach to ship scrapping. We have therefore looked at four different labour costscenarios, and it can be seen that break-even conditions lie in the range of $10 - $15/hour range.This would seem to confirm our initial conclusions that such a purpose built dedicated facilitywould be most economically located within the lower cost/ wage economies of Eastern Europeor FSU countries.
Interestingly, the economic analysis indicates that positive end-of-life values may therefore bepossible in these economies where labour costs currently lie in the $1 – 5/ hour range, althoughthis would be dependent on the basis of financing and the return on investment required.However, these must be compared with the current prices obtained by ship owners fromtraditional ship scrapping operators and are likely to represent a significant reduction in the end-of-life value and hence ship investment appraisal results.

DET NORSKE VERITAS – APPLEDORE INTERNATIONAL
Report No: 2000-3527, rev. 01
FINAL REPORT
Page 10Reference to part of this report which may lead to misinterpretation is not permissible.
22 February 2001, B/feasibility study ship scrapping final report 21feb01.doc
3 END-OF-LIFE DECISION FACTORSThe common denominators connecting the four categories are likely to identify to what levelmutual decision factors are present. In physical likeness it is obvious that the conventional vesselcategories; naval, merchant and inland waterway fleets have common grounds whilst offshorestructures may be seen as an outsider. When looking at respective operational regimes, itbecomes equally obvious within the vessel category, that there are significant and relevantdifferences.
3.1 Offshore structuresAn offshore field development is first and foremost governed by reservoir size, which again isindicative to both infrastructure and production life and hence expected life span of the offshorestructures required. Almost all existing offshore fields in both Europe and elsewhere aredeveloped specifically to suit a particular reservoir and a production schedule. Consequently, thedecommissioning scenario is defined in terms of time. However, improvements in productiontechniques and methods have for some fields’ lead to an increase of the original productionvolumes and also an expansion in the expected life of the field. Field production upgrading canoccur more than once during the production phase. In the case of production upgrading,installations are assessed and modified for extended life.
The general development of reservoir production efficiency has lead to two main directions thatwill have influence on future decommissioning and disposal of offshore structures.:• Procedures are to a greater extent being remotely operated and monitored allowing a
reduction of scale of structures required. This has resulted in the development of sub-surfaceproduction installations.
• Reservoirs of marginal cost-benefit potential based on conventional technology have provedprofitable by adopting alternative technologies. Floating production concepts are nowincreasingly in use. These structures are in essence ships with processing technologyinstallations rather than conventional offshore structures. The first generation of these unitswas predominantly designed for a limited life span. Later developments have shown a greaterflexibility allowing the unit to serve at different locations during its life and hence these aredesigned for a longer life.
Traditionally, decommissioning follows when the reservoir is “dry”. Existing structures can to avery limited extent be re-used for its original intended purpose as its design features are specificfor the field it serves. It is therefor assumed that there are no real re-use alternatives available.Consequently, decommissioning is equivalent to disposal. For “new-technology” installations,the market scenario may offer alternatives. However, these installations have only recentlyentered into operation. Their future disposal will not influence in the timeframe considered inthis work.
The disposal of offshore installations (for the North Sea and the NorthEast Atlantic) is regulatedin the OSPAR Convention of 1997 (discussed in chapter 4.2.3).

DET NORSKE VERITAS – APPLEDORE INTERNATIONAL
Report No: 2000-3527, rev. 01
FINAL REPORT
Page 11Reference to part of this report which may lead to misinterpretation is not permissible.
22 February 2001, B/feasibility study ship scrapping final report 21feb01.doc
3.2 Merchant world fleetVessels belonging to this category can be classed as either commodity carriers (primarilycarrying cargo) or non-cargo carriers. These groups can again be broken down into main types.Important main cargo carrying vessels types are; tankers, bulkers and general cargo carriers. Theimportant types in the non-cargo-carrying group are passenger vessels and fishing vessels.
The particular characteristic of a vessel will reflect the trade to which it is designed for. Globaltrade relying on shipboard transport represents an enormous span in requirements resulting in aconsiderable number of vessels types and sub types. In some trades, the transport requirementsare changing rapidly, whilst others are more settled. Changes in requirement dependent upon atrade-specific scenario may impact the economic life of a vessel in that it becomes obsolete.
New developments and technological breakthrough may also provide as a barrier in the marketfor ageing ships. Market preference may phase-out ageing technology and thus ageing ships.However, this again is not applicable to the same extent for all trades. Incentives such asenvironmental indexing schemes, i.e. as implemented in Sweden, Norway and as initiated byGreen Award (the Netherlands) may develop to phase out or remove ageing tonnage morerapidly.
A stronger and more important barrier is that of regulations requiring new technology or generalupgrade to be implemented. The most important regulative tool presently affecting the tradinglife of vessels is that of the MARPOL Convention. The phase-out mechanisms built into Annex I(Regulation 13) to the convention, limits the operational trading life of conventional built tankersby requiring major upgrading at the 5th special survey (at age of 25 years). Single skin tankersmust at this stage convert to hydrostatically balanced loading or install segregated ballast tanks.Both options represent costs and extend the remaining trading life by only another 5 years. At the6th main survey (30 years), double hull is required. Regulations also affect the trading life of bulkcarriers. Following a dramatic increase in losses of such tonnage, (92 ships (1,540.443 Dwt. from1995 – 1999) regulations now require a structural modification for ageing vessels.
Tonnage are also “naturally” deleted from the registers and scrapped simply because of old age.Repairs and maintenance required to keep up a minimum standard exceeds potential earnings,and it may be more profitable for the owner to collect the price attained by selling for scrapping.
When keeping a vessel in operation is no longer viable regardless of the cause, it is usuallyoffered for sale to the ship breakers through shipbrokers. In some cases, “cash buyers” will takethe vessel directly off the hands of the owner and re-sell for scrapping;• Alternative 1: The shipowner may sell the ship directly to a ship breaker company, or more
often through a broker. When the ship is sold to the ship breaker company, the shipownermust provide for transportation of the ship to its final destination. The ship is then sold forthe “going” price in the global market.
• Alternative 2: The shipowner sells the ship to a “cash buyer” company, which again willtransport the ship to the ship breaking location. The price obtained for the ship is then lowerthan in alternative 1.
The various shipowners may or may not have their own procedures regarding specification ofhazardous materials on board, since such environmental declarations are not an internationalrequirement yet. Ships sold for breaking in India are required to be “gas free for man entry”,resulting in cleaning costs for the shipowners. Ships that are subjected to extensive cleaning (i.e.

DET NORSKE VERITAS – APPLEDORE INTERNATIONAL
Report No: 2000-3527, rev. 01
FINAL REPORT
Page 12Reference to part of this report which may lead to misinterpretation is not permissible.
22 February 2001, B/feasibility study ship scrapping final report 21feb01.doc
tankers) will therefore most likely be sold to other ship breaking nations where this is not arequirement.
Ships are purchased on the basis of contracts either prepared by the ship breakers, or more oftenthe broker or by “cash buyers”. “SALESCRAP 87” is a standard contract format developed byBIMCO and commonly used and accepted by the scrapping industry. A new revised version of“SALESCRAP 87” is being developed and is expected to be released by the summer of 2001.The next contract format will differ significantly from the previous version and is likely toinclude precautions and recommendations on environmental issues.
3.3 Navy fleetThe life of a naval vessel differs from that of a civilian with basis in its basic operationalpurpose. This is valid also for the decision factors of importance leading to the decommissioningand later the scrapping of such tonnage.
The larger naval vessels are built to high standards at high costs for a particular strategic purposeand integrated in national and international military long-term plans. Typically, they will reach ahigher age than a merchant vessel. Refits and modifications are common and for some types anearby continuous process. The smaller naval vessels (service vessels, patrol vessels, etc) have alife pattern similar to civilian vessels.
The process leading to scrapping in this category is initiated by deciding decommissioning. Forpurposes of military contingency, decommissioned vessels are typically de-militarised and laidup for a long period before eventually being scrapped. The decommissioning period can last forlonger than 30 years. This work has identified existing but decommissioned naval tonnage builtas early as 1924.
The major military powers and strategic alliances have limited or no scrapping capability andhave relied on selling naval tonnage on the open market resulting in these vessels ending theirlife on the beaches of the Indian sub continent. This has caused major protests among the generalpublic in many countries. The debate has largely proven a non-acceptance of this practice. Theconsequence has been that the scrapping of allied naval vessels in developing countries haveceased and subsequently, the decommissioning period has been affected.
The controversy related to scrapping of military tonnage is still not resolved. In the US, thepolicy has now changed and plans are laid based on disposing the vessels nationally. However,the capacity and the economics of this are still unresolved issues. The growing numbers of laidup former USSR military tonnage also represent an unresolved disposal challenge.
3.4 Inland fleetInland waterway vessels are by characteristics small and represent a diversity in type serving insheltered waters.
The fleet’s average age is considerably higher than that for the merchant fleet. Statistics indicatefurther that this transport alternative is losing in the battle against transport by road and rail.Consequently, the number of vessels have decreased, new building activity is very low andconsequently, the average age will continue to increase.

DET NORSKE VERITAS – APPLEDORE INTERNATIONAL
Report No: 2000-3527, rev. 01
FINAL REPORT
Page 13Reference to part of this report which may lead to misinterpretation is not permissible.
22 February 2001, B/feasibility study ship scrapping final report 21feb01.doc
The main decision factor related to decommissioning and scrapping is that of profitability. Asrates are squeezed in competition and cost of repairs and maintenance increases as age takes itstoll, the owner may choose to sell the vessel for scrapping.
The inland fleet will not compare in unit prices seen when scrapping merchant tonnage. Further,these vessels are incapable of undertaking open ocean voyages and thus must be scrapped locallyor regionally.
The process following the decision to sell for scrapping will largely follow that for the merchantfleet.

DET NORSKE VERITAS – APPLEDORE INTERNATIONAL
Report No: 2000-3527, rev. 01
FINAL REPORT
Page 14Reference to part of this report which may lead to misinterpretation is not permissible.
22 February 2001, B/feasibility study ship scrapping final report 21feb01.doc
4 DECOMMISSIONING VOLUMEThe four categories;
I: Offshore structures II: Merchant world fleet
II: Navy fleet IV: Inland waterway fleet
have been assessed with emphasis on fleet size, age composition, growth/ decline characteristicsand other parameters that may influence the patterns of decommissioning for disposal. Decisionfactors (chapter 3) have been an input to the volumes and the forecast produced.
Detailed global registers for all categories have been established and analysed. Futuredecommissioning and consequently scrapping prognoses of expected supply of tonnage availableto the recycling markets over a 15 year perspective have been established. For purposes ofpracticalities, forecasts have been extrapolated to cover the life of a vessel of respective categoryfrom year 2000 through to estimated retirement. The latter stage of the presented prognoses, i.e.after year 2015, is exposed to coarse assumptions.
Findings are discussed and presented focussing on the source of supply by categories and oncharacteristics that may influence the technical and economical dimensions involved.
4.1 The European dimensionA comprehensive share of the world fleet of vessels is under the control of European owners orregistered under European registries. An even larger share of the world fleet will at some stagehave had some other European connection. This may encompass such as nationality ofmanufacturer, operator or area of trade.
The feasibility of decommissioning a vessel in Europe will not depend upon its Europeanconnections alone but may reflect factors such as national and international policies andregulations but also issues of a practical nature such as size and distance to markets.
Compliance to the concept of sustainable operations includes all aspects in a life cycle, henceincluding both the production and disposal stages. This is reflected in recent directives of theEuropean Commission placing a greater obligation on manufacturers/ distributors of goods toensure that the products they produce are not only disposed of in a correct manner but alsorecycled to a higher degree. This may be illustrated by;• The Packaging Waste Directive obliging producers, fillers and retailers of packaging
materials, to recycle a percentage of all packaging that they handle (entered into force in1999).
• The Directive on Waste from Electrical and Electronic Equipment, obligating producersto similarly ensure that a percentage of the products are recycled after end of life (expected toenter into force in 2001)
• The Producer Responsibility for End of Life Vehicles, currently under discussion andlikely to become law in 2001 or 2002. This will oblige manufacturers of motor vehicles toensure proper disposal and recycling when vehicles are no longer roadworthy.

DET NORSKE VERITAS – APPLEDORE INTERNATIONAL
Report No: 2000-3527, rev. 01
FINAL REPORT
Page 15Reference to part of this report which may lead to misinterpretation is not permissible.
22 February 2001, B/feasibility study ship scrapping final report 21feb01.doc
The implications of legislation requiring the original producer to assume responsibility fordisposal would be onerous on European countries, if retrospectively applied in shipbuilding, inview of their historical dominance in vessel construction.
The stronger emphasis on minimising consumption (in particular of non-renewable resources)has increased consciousness in most all sectors of industry, shipping being one of fewexceptions, on methods of optimising the share of return-to-life following end-of life. Thedispose of scenario is increasingly moving away from that of re-use to increased recycling.Future ship scrapping in Europe will be expected to perform similarly to industry in general andis hence subjected to the same expectations. As seen in the car manufacturing industry, this mayimpose changes to the current design and construction practices within shipbuilding.
4.1.1 The Basel Convention impactThe process of decommissioning for scrapping and re-use/ recycling introduces a number ofaspects, also of a legal nature, to be considered. The transboundary nature of the activity calls forsome form of international compliance. However, at present there are no purpose-made legalinstruments in place that addresses the topic of decommissioning, demolition and recycling ofmobile structures.
There are International conventions/ regulations with associations to elements of the process.The most important of these are listed below;• The 1989 Convention on Transboundary Movements of Hazardous Wastes and their
Disposal (The Basel Convention)• 1972 London Dumping Convention (1996 Protocol)• OSPAR convention of 1997• The 1993 Council Regulation (EEC) No. 259/93 on the Supervision and Control of
Shipments of Waste within, into and out of the European Community (Shipment Regulation)That of most interest, The Basel Convention, prohibits the export of hazardous wastes and otherwastes to other states without the prior approval from the importing state. The exporting stateshall not permit such export to states, which have prohibited the import of such wastes or withouta consent obtained by the importing state. But more important, the Basel Convention hasprohibited the transboundary movements of waste from OECD countries to non-OECD countriesdestined for final disposal, and phasing out of wastes destined for recycling or recoveryoperations.
The natural market for ship scrapping in Europe reflecting the spirit of the Basel Convention hasprovided the following definition;
European market; All European vessels, that is all those of European geographicalnationality of registration, and also provided OECD membership. Themerchant fleets of OECD states outside Europe (Australia, Canada, Korea,New Zealand, Japan, Mexico and USA) contribute in a lesser scale and arehence excluded here.
This definition is required for assessing the volumes of scrapping candidates arriving from themerchant world fleet. The definition may also be used for inland waterway vessels. The volumeslikely to arrive from the naval and offshore sector are governed by different parameters asdiscussed in chapter 3 and accounted for in the following.

DET NORSKE VERITAS – APPLEDORE INTERNATIONAL
Report No: 2000-3527, rev. 01
FINAL REPORT
Page 16Reference to part of this report which may lead to misinterpretation is not permissible.
22 February 2001, B/feasibility study ship scrapping final report 21feb01.doc
4.2 Offshore structures4.2.1 World-wideThere are more than 6,500 offshore installations comprising a variety of structures world-wide.Some 4000 are located in the Gulf of Mexico (Figure 4-1). Approximately 490 platforms aresituated in the North Sea and the North East Atlantic. Of the latter, around two-thirds areconsidered small structures operating in shallow waters (less than 75 meters depth) or weighingless than 4000 tonnes. The remaining are those comprising large steel structures or large concretegravity based structures.
A typical platform consists of ”topsides” (weighing up to 40,000 tonnes) and a supportingsubstructure, the ”jacket”. In general, one may claim that the topsides represent the potential as acarrier of hazardous substances, whereas the substructure consists of clean steel or concrete (ref.:/6/). Offshore structures are one-off designs for a specific field and hence differ in characteristicsaccordingly.
A significant number of European offshore oil and gas installations are entering their lastoperational phase and expected ready for decommissioning within the next decade.
Figure 4-1 Offshore oil and gas installations world-wide (ref.: /7/)
4.2.2 EuropeThe number of European offshore oil and gas installations varies from 400 to 609 depending onsource. This relatively large gap reflects non-compliance in definitions used in the differentstatistical sources (i.e. reference year, geographical definition of Europe, types of offshorestructures). Previous work undertaken on behalf of the European Commission (ref.:/1/) is used asa main source in the following predictions.

DET NORSKE VERITAS – APPLEDORE INTERNATIONAL
Report No: 2000-3527, rev. 01
FINAL REPORT
Page 17Reference to part of this report which may lead to misinterpretation is not permissible.
22 February 2001, B/feasibility study ship scrapping final report 21feb01.doc
Table 4-1 presents the distribution of offshore structures in Europe. It should be noted that thedata presented does not include mobile drilling ships nor flotels. Certain types of offshore ships/vessels are also included in the merchant fleet registers, hence there may be some overlap andhence inconsistency in the data.
Table 4-1 Distribution of type of offshore structure (ref. /1/).Number of structures per type
Country CFPF FPF FPSO JU TLP GBS Steelstructures
Grand total
Denmark 0 0 0 0 0 0 39 39Germany 0 0 0 0 0 2 0 2Greece 0 0 0 0 0 0 4 4The Netherlands 0 0 0 4 0 2 114 120Ireland 0 0 0 0 0 0 2 2Italy 0 0 0 0 0 0 112 112Norway 1 5 3 2 2 14 54 81Spain 0 0 0 0 0 0 2 2UK 0 6 10 5 1 10 215 247Grand total 1 11 13 11 3 28 542 609CFPF: Concrete floating production facilityFPF: Floating production facilityFPSO: Floating production storage and offtakeJU: Jack-upTLP: Tension leg platformGBS: Gravity based structure
A total of 89 % of all installations are of piled steel structures. The average total weight of suchpiled steel structures (excluding piles) has been estimated to be 7,282 tonnes. The total weight ofall steel structures will be in the order of 3,9 million tonnes (ref. /1/).
4.2.3 Offshore decommissioning and disposal regulationsThe OSPAR convention of 1997 regulates the disposal at sea of offshore installations in theNorth Sea and the North East Atlantic. Permits for partial removal or disposal at sea are issuedon a case-by-case basis by the individual national authorities. Topsides including systems andcomponents are brought to shore for reuse or recycling. Reinforced concrete structures are heavyand difficult to break up. These structures are for practical reasons not considered recyclable.Assessments considering the final fate of these are likely to recommend them left in place ordisposed of at a deepwater disposal sites. Several studies have concluded that clean steel orconcrete can be disposed of at sea with negligible environmental impact (ref.: /6/).
The technology required to move offshore installations to shore for recycling and reuse alreadyexists. However, potential impact in relation to the aspects of health, safety and environmental aswell as costs need to be considered in the process of determining the fate of the individualstructure (ref.: /6/).
4.2.4 European scrapping forecastAn estimation of the number of offshore fields in Europe to be closed down for the years 1985-2066 is presented in Figure 4-2. These numbers are based on the expected production time forthe various offshore production fields in Europe.

DET NORSKE VERITAS – APPLEDORE INTERNATIONAL
Report No: 2000-3527, rev. 01
FINAL REPORT
Page 18Reference to part of this report which may lead to misinterpretation is not permissible.
22 February 2001, B/feasibility study ship scrapping final report 21feb01.doc
By year 2000, approximately 90 fields are assumed closed down. In the next 15-year period(2000-2015), another 160 fields are expected to be closed down. It should be noted thatimproved oil production technologies have expanded operational life of several fields. Thisdevelopment may impact the predictions presented here.Installations are decommissioned in the sense that their operational life has ceased but they arenot necessarily scrapped or recycled. A lag period of 2-20 years from closedown ordecommissioning to actual scrapping may be expected. Some of the structures may not bescrapped at all (see chapter 6).
The long lag-period between closedown and scrapping is evidenced by the fact that only veryfew structures have been scrapped (or fully decommissioned) until now. This may also reflectthe potential of alternatives to scrapping (recycling/ resale). The predictions of the potentialscrapping volume for the next 15 years (presented in Figure 4-2) are based on estimatedclosedown frequency for the period 2000-2015 only and do not take account of the potentialbuild-up of structures due to the long lag-periods nor the effects of suggested alternative use.
Figure 4-2 Time of closure for European offshore fields (ref.:/1/)
4.2.4.1 Input to the recycling processThe number of structures per field varies from 1 to 20. European offshore production fields havean average of 1.1 structures per field (ref. /1/), the larger fields consisting of typically 5structures.
The volume of steel offshore structures (production installations only) to be considered fordecommissioning in the next 15 years can be estimated as follows:
FSWW AT ⋅⋅≈ (4.1)
Where:
02468
1 01 21 41 61 8
0
5 0
1 0 0
1 5 0
2 0 0
2 5 0
3 0 0
3 5 0
N o o f F ie l d s A c c u m u l a t e d

DET NORSKE VERITAS – APPLEDORE INTERNATIONAL
Report No: 2000-3527, rev. 01
FINAL REPORT
Page 19Reference to part of this report which may lead to misinterpretation is not permissible.
22 February 2001, B/feasibility study ship scrapping final report 21feb01.doc
WT: Total weight of all steel structures (tonnes)
WA: Average total weight of a steel structure (tonnes)
S: Average number of structures per field
F: Number of fields to be closed down
Based on a total number of 160 fields to be closed down in the period with an average of 1.1structures per field, each containing 7,300 tonnes of steel, some 1,150,000 tonnes of steel may berecovered. (Note that 89% of structures are of steel construction).
Based on this, the annual scrapping rate in Europe would be about 80,000 tonnes of steelstructures arriving from the offshore sector. However, this represents a coarse estimation due tothe considerable uncertainties in lag periods and alternatives to scrapping.
4.2.5 ConclusionThe number of European offshore oil and gas installations varies from 400 to 609 depending onthe source used. This large gap is probably caused by differences in the reference year, thegeographical definition of Europe and types of offshore installations included in the statistics.
Assuming a closedown of 90 fields by year 2000 and taking into account the fact that very fewalready decommissioned structures have been scrapped, a backlog of structures representingsome 6 units annually (39,000 tons of steel structures/ year) can be expected. Over a 15 yearperiod this will represent 585,000 tons of steel structures.
In addition, over the next 15-year period, another 160 fields are expected closed. If this isassumed arriving at a constant rate and scrapped without delay, some additional 80,000 tons ofsteel will arrive annually from this category. The yearly scrapping potential of European offshorestructures is summarised in Table 4-2 (approximated numbers).
Table 4-2 Yearly scrapping potential for European offshore steel structures in the period2001-2015
No. of structures TonsBacklog by the year 2000 5.3 40,000Closedown 2001-2015 10.4 80,000Yearly scrapping potential 15.7 120,000
The final fate of offshore structures is not necessarily that of being scrapped. The figurespresented here do not account for alternative usage.
4.3 Merchant world fleetThe world fleet of propelled sea-going merchant vessels larger than 100 gross tons (GT) reacheda number of 86,817 units representing a total of 543.6 million GT in 1999. The average age ofthe fleet was 20 years (ref.:/12/). There are two main categories of merchant vessels:• cargo carriers (cargo carrying fleet)

DET NORSKE VERITAS – APPLEDORE INTERNATIONAL
Report No: 2000-3527, rev. 01
FINAL REPORT
Page 20Reference to part of this report which may lead to misinterpretation is not permissible.
22 February 2001, B/feasibility study ship scrapping final report 21feb01.doc
• other vessels (miscellaneous vessels)Both are experiencing a continuous growth reflecting the global trade growth. The world fleetgrowth and distribution by numbers and tonnage as a function of type over the period from 1994to 1998 is presented in Appendix A.
4.3.1 The cargo carrying fleetThe volume of ships being scrapped is dominated by the cargo carrying segment counting some46,002 units of an accumulated tonnage of 777.8 million DWT or 515.4 million GT (1999, ref.:/12/). This represents only some 50% of the world fleet by numbers but account for as much as95 % of the total world tonnage (GT). The importance of this category in context of being asupplier to ship demolition and recycling is overwhelming compared to the non-cargo carriersand hence, the latter category will not be addressed in particular in the following.
The average age of the cargo carrying fleet is 18 years (1999). General cargo vessels aredominant by numbers whilst the bulk carriers and crude oil tankers represent the main tonnagecontributors (accounting for approximately 63 % of the total cargo carrying fleet).
4.3.1.1 Flag state distributionFor the period from 1994 to 1998, approximately 40% of vessels by number representing some30% of the tonnage (GT) was of OECD member state origin. The OECD contribution trend overthe period shows a decline in both numbers and volume (GT) with few exceptions (Norway, theNetherlands, Korea and the USA).
The dominating flag states within the OECD with reference to size (in descending order) are;Greece, Norway, Japan, UK and the USA. In Appendix B, the OECD distribution for the periodis detailed. The changes in flag state distribution is however not considered significant.
By assessing the flag distribution of vessels reported scrapped in 1999, a distribution by flagstate can be provided. For the purpose of identifying tonnage for input to European scrappingfacilities, this has been done for geographical Europe (GEUR) and for the European OECDmember states. (OEUR), see Table 4-3.
Table 4-3 European registered vessels reported scrapped in 1999
Ships DWT GRT Share byTotal 630 17,303,964 10,256,797 Ships (no.) DWT GRT
GEUR* 186 6,146,516 3,554,791 30% 36% 35%
OEUR** 84 2,404,184 1,348,261 13% 14% 13%
* Geographical Europe
** European flag registers within the OECD area. Distribution used in forecasted predictions.
The largest flag registers within geographical Europe (GEUR) are Cyprus and Malta.
4.3.2 Scrapping supply, merchant world fleetTraditional shipping represented by the merchant world fleet is by far the largest of the vesselcategories considered in this work and thereby the most significant as an input to the scrappingand recovery industries.

DET NORSKE VERITAS – APPLEDORE INTERNATIONAL
Report No: 2000-3527, rev. 01
FINAL REPORT
Page 21Reference to part of this report which may lead to misinterpretation is not permissible.
22 February 2001, B/feasibility study ship scrapping final report 21feb01.doc
In 1999, a number of 664 vessels representing 9,9 million GT with an average age of 25 yearswere deleted from merchant fleet registers (ref.:/12/). Of these, 538 were reported scrapped, anumber of 19 vessels were scrapped following casualty incidents, whilst 107 vessels were lost atsea. The vast majority of vessels scrapped was from the cargo carrying segment.
A number of 629 vessels representing 17.3 million DWT are registered scrapped in 1999 (ref./10/). The deviation between the two sources to may arrive due to inconsistency in data,reporting routines or reflect a backlog of vessels awaiting scrapping following decommissioning.
Statistics for 1999 on tonnage sold for scrapping is at a record high at 30 million DWT (ref.:/23/), see chapter 4.3.4). The inconsistency between volume sold for scrapping, that deleted frommerchant registers and finally that reported actually scrapped, is considerable. This strengthensthe suggestion that some tonnage sold for scrapping are not actually scrapped nor deleted fromthe registers but laid up or in some form of intermediate use. The high freight rates experiencedin particular in the tanker segments in year 2000 are most likely a factor prolonging the tradingphase.
The scrapping volume has been predicted (ref.: /19/) to remain at a high level for a period of upto 3-5 years (2000-2003/ 2005). The considerable distance between tonnage actually scrappedand that sold for scrapping and future predictions on scrapping demand may cause an aggregatedbacklog build-up. This may suggest insufficient scrapping capacity.
The distribution of vessels by size scrapped in 1999 is presented in Figure 4-3. Only 7% bynumbers were larger than 100,000 DWT but representing as much as 45% of the total DWT.Likewise, 38% of vessels that were scrapped, were small, of less than 5,000 DWT, representingonly 1% of the total tonnage. The figures demonstrate that the large number of smaller shipsconstitutes only a small percentage of the total tonnage and hence recyclable material. Thesignificance of the larger vessels dominated by tankers and bulk carriers as the main source ofsupply to the scrapping industries is obvious.
0 %
20 %
40 %
60 %
80 %
100 %
No of vessels 100 % 93 % 86 % 72 % 46 % 38 %
Sum DWT 100 % 55 % 36 % 20 % 3 % 1 %
<400000 DWT
<100000 DWT
<50000 DWT
<25000 DWT
<10000 DWT
<5000 DWT

DET NORSKE VERITAS – APPLEDORE INTERNATIONAL
Report No: 2000-3527, rev. 01
FINAL REPORT
Page 22Reference to part of this report which may lead to misinterpretation is not permissible.
22 February 2001, B/feasibility study ship scrapping final report 21feb01.doc
Figure 4-3 Number of vessels and associated DWT scrapped in 1999 categorised by size(ref.: /10/).
4.3.3 Europe 1999The demolition database (ref.: /10/) for 1999, provides an overview of scrapping countriesdemolishing European ships (by flag register). Based on average DWT it seems that the largestEuropean ships were scrapped in Pakistan (100,504 DWT) and Bangladesh (84,609 DWT),whereas India had the largest turnover in numbers of European ships (89 ships).
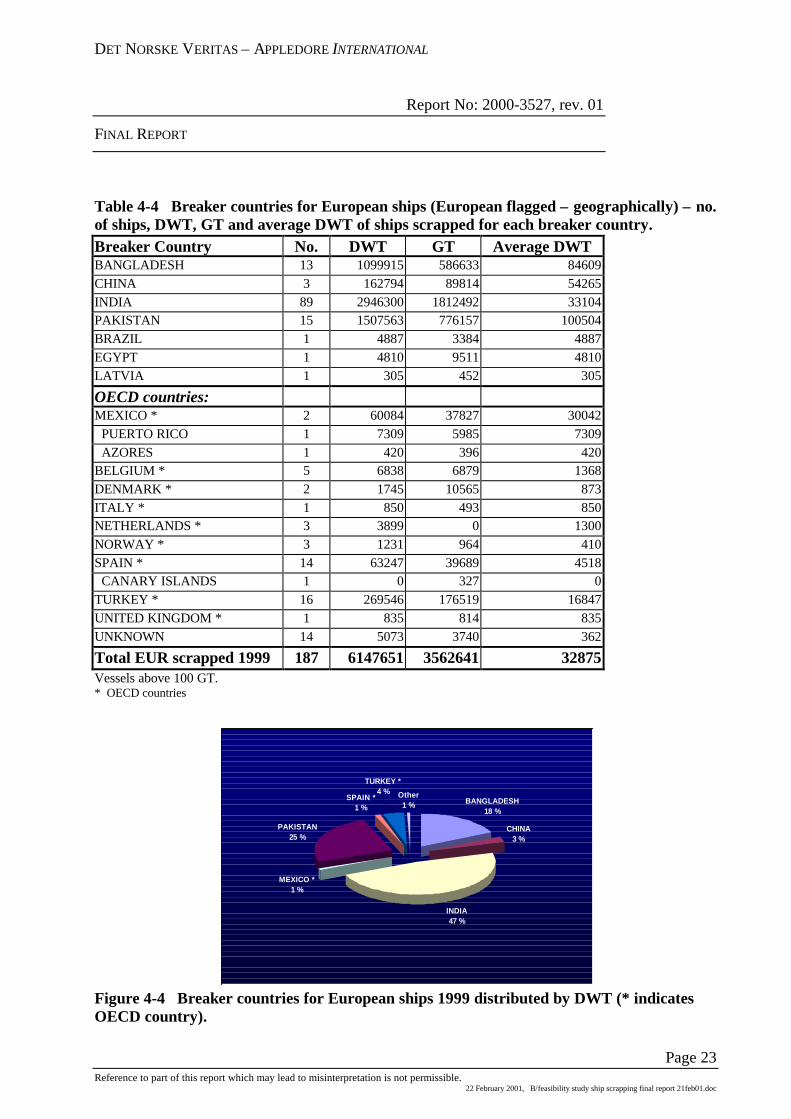
Table 4-4, supported by Figure 4-4 illustrates the distribution of scrapping of European tonnagein 1999. European tonnage scrapped in Bangladesh, India and Pakistan accounted for 90% of thetotal scrapping volume from European registers. Turkey and Spain represented the leadingEuropean scrapping nations, although only 5 % of European tonnage (in terms of DWT) wherescrapped in these countries. In terms of numbers, 26 % of European vessels were scrapped inEurope in 1999. The majority of these vessels where small and scrapped by random inbrownfield facilities by opportunity.
DET NORSKE VERITAS – APPLEDORE INTERNATIONAL
Report No: 2000-3527, rev. 01
FINAL REPORT
Page 23Reference to part of this report which may lead to misinterpretation is not permissible.
22 February 2001, B/feasibility study ship scrapping final report 21feb01.doc
Table 4-4 Breaker countries for European ships (European flagged – geographically) – no.of ships, DWT, GT and average DWT of ships scrapped for each breaker country.Breaker Country No. DWT GT Average DWTBANGLADESH 13 1099915 586633 84609CHINA 3 162794 89814 54265INDIA 89 2946300 1812492 33104PAKISTAN 15 1507563 776157 100504BRAZIL 1 4887 3384 4887EGYPT 1 4810 9511 4810LATVIA 1 305 452 305
OECD countries:MEXICO * 2 60084 37827 30042 PUERTO RICO 1 7309 5985 7309 AZORES 1 420 396 420BELGIUM * 5 6838 6879 1368DENMARK * 2 1745 10565 873ITALY * 1 850 493 850NETHERLANDS * 3 3899 0 1300NORWAY * 3 1231 964 410SPAIN * 14 63247 39689 4518 CANARY ISLANDS 1 0 327 0TURKEY * 16 269546 176519 16847UNITED KINGDOM * 1 835 814 835UNKNOWN 14 5073 3740 362
Total EUR scrapped 1999 187 6147651 3562641 32875Vessels above 100 GT.* OECD countries
BANGLADESH18 %
CHINA3 %
INDIA47 %
MEXICO *1 %
PAKISTAN25 %
SPAIN *1 %
Other1 %
TURKEY *4 %
Figure 4-4 Breaker countries for European ships 1999 distributed by DWT (* indicatesOECD country).

DET NORSKE VERITAS – APPLEDORE INTERNATIONAL
Report No: 2000-3527, rev. 01
FINAL REPORT
Page 24Reference to part of this report which may lead to misinterpretation is not permissible.
22 February 2001, B/feasibility study ship scrapping final report 21feb01.doc
A total of 66 % of European ships (above 100 GT) by numbers scrapped in 1999 were scrappedin non-OECD countries. This represents 93 % in terms of DWT. The potential volume forincreased European scrapping and recycling is represented by these figures when reflecting uponthe intentions of the export ban represented by the Basel Convention.
4.3.4 Vessels sold for scrapping 1992-2000Statistical data on vessels sold for scrapping in the last decade is presented in Table 4-5. Bulkersand tankers are dominant in terms of tonnage (DWT). The data has some fluctuation mirroringinstability in respective markets. It should be noted that average age of vessels sold for scrappinghas increased over the past decade.
Table 4-5 The number, tonnage and average age of vessels sold for scrapping 1992-2000*(Vessels of size >10,000 DWT only, ref.: /23/).Year No., DWT
and AgeTankers Bulk
CarriersCombos Gas
vesselsOther dry All
VesselsNo. 94 67 11 4 64 240106 DWT 10.22 3.913 1.296 0.011 0.775 16.2151992Age 23.8 23.6 20.8 26.8 24.7 23.9No. 110 50 15 10 129 314106 DWT 10.685 2.557 2.27 0.111 1.398 17.0211993Age 23.1 24.2 21.9 24.9 29.4 25.9No. 87 70 18 7 112 294106 DWT 12.558 4.351 2.421 0.018 1.234 20.61994Age 22.6 24 21.9 26.3 26.5 24.5No. 93 33 9 1 91 227106 DWT 10.794 2.093 1.229 0.002 1.195 15.3131995Age 25.2 25.2 22.4 30 27.2 25.9No. 72 128 15 5 168 388106 DWT 6.829 7.297 1.904 0.021 1.967 18.0181996Age 25.3 25 23.1 27.9 27.2 26No. 40 161 6 6 187 400106 DWT 3.611 7.707 0.746 0.075 2.596 14.7351997Age 28.3 25.5 23.6 28.4 26.5 26.3No. 52 236 10 6 191 495106 DWT 7.547 11.666 1.416 0.028 3.181 23.8381998Age 25 25 22.8 27.5 25.5 25.2No. 113 194 9 6 226 548106 DWT 17.114 9.385 1.13 0.019 3.185 30.8331999Age 24.9 24.9 24.3 31.4 25.2 25.1No. 55 29 4 1 45 134106 DWT 7.234 1.353 0.393 0.018 0.641 9.6392000*Age 26.1 27.1 25 31.7 25.7 26.2No. 83 117 12 6 146 363106 DWT 9.92 6.12 1.55 0.04 1.94 19.57
Average1992-1999
Age** 24.4 24.8 22.4 26.9 26.3 25.3* Jan-Mar 2000** DWT weight Age

DET NORSKE VERITAS – APPLEDORE INTERNATIONAL
Report No: 2000-3527, rev. 01
FINAL REPORT
Page 25Reference to part of this report which may lead to misinterpretation is not permissible.
22 February 2001, B/feasibility study ship scrapping final report 21feb01.doc
Annual scrapping rates in terms of DWT is presented in Table 4-6. The average rate for theperiod was at 2.7 %.
Table 4-6 Yearly scrapping rate (by tonnage).Year Current fleet*
(million DWT)Scrapped**
(millionDWT)
Scrapped(%)
1994 704.0 20.6 2.91995 717.5 15.3 2.11996 739.7 18.0 2.41997 757.8 14.7 1.91998 765.8 23.8 3.11999 777.8 30.8 4.0
Average 743.8 20.5 2.7
* Lloyd’s 1999** Sold for scrapping, > 10,000 DWT (ref.: /23/)
4.3.5 Forecast - world merchant fleet scrapping rateFigure 4-5 presents a forecast of expected deleted tonnage from the world fleet of cargo carryingvessels equal to or above 10,000 DWT for different period intervals. The scrapping forecast ofvessels of size less than 10,000 DWT has been developed based on the assumption that fleetdistribution follows the same patterns as that for vessels above 10,000 DWT. The base for thesmaller category has been actual scrapping statistics for 1999. Predictions are detailed inTable 4-7 and Table 4-8, and data supporting the predictions is included in Appendix A.
By assuming an average annual scrapping rate of 2.7 % (Table 4-6), and extrapolating the worldfleet tonnage from year 2000 (ref.: /12/), an “expected“ scrapping volume accounting for thegrowth in world fleet has been estimated. Further, by assuming the vessel type distribution (forscrapping) to be consistent with that of 1999, the forecast can distinguish between types. Thepredictions assume a steady global economic growth and that the demand for shipping serviceswill follow general economic growth.
The historical average scrapping rate of approximately 400 vessels/ year and 20 millionDWT/year (ref. Table 4-5) is approximately 25 % below the forecasted values. The predictedscrapping volume suggests some 26 million DWT/ year. The predictions do not include theprobability of longer lifetime for tankers (i.e. cease of the phase-out effect generated byMARPOL, Annex I, regulation 13). However, the majority of tankers built after 1993 are that ofdouble hull, hence the effect of this will not influence predictions for the period of year 2000–2015. Incidents such as the Erika disaster of the coast of France in December of 1999, mayhowever trigger regional or international initiatives that may impact the life-span pattern of largeoil carrying vessels.
Further, the forecast does not include tonnage lost at sea, and may therefore represent anoverestimate. Based on statistics, one may expect losses to account for approximately 3% ofscrapped tonnage (or 18% by numbers). Hence, the average size of vessels lost at sea are smallerthan that scrapped (ref. /11/). This corresponds with casualty statistics showing a significantrepresentation of fishing vessels and general cargo vessels.

DET NORSKE VERITAS – APPLEDORE INTERNATIONAL
Report No: 2000-3527, rev. 01
FINAL REPORT
Page 26Reference to part of this report which may lead to misinterpretation is not permissible.
22 February 2001, B/feasibility study ship scrapping final report 21feb01.doc
59934.8
36625.5
36819.0
54121.9
59828.7
75725.5
0 200 400 600 800
2026-2022
2021-2017
2016-2012
2011-2007
2006-2002
<2002
Yearly scrapped nr. of ships Yearly scrapped Million Dwt
Figure 4-5 Forecast of the number of vessels scrapped yearly in different time periodswith the corresponding scrapped tonnage (DWT).

DET NORSKE VERITAS – APPLEDORE INTERNATIONAL
Report No: 2000-3527, rev. 01
FINAL REPORT
Page 27Reference to part of this report which may lead to misinterpretation is not permissible.
22 February 2001, B/feasibility study ship scrapping final report 21feb01.doc
Table 4-7 Forecasted global ship scrapping volume by category in a 15 year perspective(vessels above 10,000 DWT)Year Million
DWTNo. Tanker
No./ millionDWT
BulkerNo./ millionDWT
Dry cargoNo./ millionDWT
CombosNo./ millionDWT
GasNo./ millionDWT
2001 25.5 757 199/ 13 227/ 7.9 303/ 2.55 23/ 2.04 8/ -2002 25.5 757 199/ 13 227/ 7.9 303/ 2.55 23/ 2.04 8/ -2003 28.7 598 155/ 14.6 179/ 8.9 240/ 2.9 18/ 2.3 6/ -2004 28.7 598 155/ 14.6 179/ 8.9 240/ 2.9 18/ 2.3 6/ -2005 28.7 598 155/ 14.6 179/ 8.9 240/ 2.9 18/ 2.3 6/ -2006 28.7 598 155/ 14.6 179/ 8.9 240/ 2.9 18/ 2.3 6/ -2007 21.9 541 141/ 11.2 163/ 6.8 216/ 2.2 16/ 1.7 5/ -2008 21.9 541 141/ 11.2 163/ 6.8 216/ 2.2 16/ 1.7 5/ -2009 21.9 541 141/ 11.2 163/ 6.8 216/ 2.2 16/ 1.7 5/ -2010 21.9 541 141/ 11.2 163/ 6.8 216/ 2.2 16/ 1.7 5/ -2011 21.9 541 141/ 11.2 163/ 6.8 216/ 2.2 16/ 1.7 5/ -2012 19 368 96/ 9.7 110/ 5.9 147/ 1.9 11/ 1.5 4/ -2013 19 368 96/ 9.7 110/ 5.9 147/ 1.9 11/ 1.5 4/ -2014 19 368 96/ 9.7 110/ 5.9 147/ 1.9 11/ 1.5 4/ -2015 19 368 96/ 9.7 110/ 5.9 147/ 1.9 11/ 1.5 4/ -Av. 25.3 579 151/ 12.9 174/ 7.9 232/ 2.5 17/ 2.0 6/ -
Table 4-8 Forecasted global ship scrapping volume by category in a 15 year perspective(vessels below 10,000 DWT)Year Million
DWTNo. Tanker
No./ millionDWT
BulkerNo./ millionDWT
Dry cargoNo./ millionDWT
2001 6.0 503 50/ 1.2 126/ 1.6 392/ 3.22002 6,0 503 50/ 1.2 126/ 1.6 392/ 3.22003 6.8 397 40/ 1.4 99/ 1.8 258/ 3.62004 6.8 397 40/ 1.4 99/ 1.8 258/ 3.62005 6.8 397 40/ 1.4 99/ 1.8 258/ 3.62006 6.8 397 40/ 1.4 99/ 1.8 258/ 3.62007 5.2 359 36/ 1.0 90/ 1.4 233/ 2.82008 5.2 359 36/ 1.0 90/ 1.4 233/ 2.82009 5.2 359 36/ 1.0 90/ 1.4 233/ 2.82010 5.2 359 36/ 1.0 90/ 1.4 233/ 2.82011 5.2 359 36/ 1.0 90/ 1.4 233/ 2.82012 4.5 244 24/ 0.9 61/ 1.2 159/ 2.432013 4.5 244 24/ 0.9 61/ 1.2 159/ 2.432014 4.5 244 24/ 0.9 61/ 1.2 159/ 2.432015 4.5 244 24/ 0.9 61/ 1.2 159/ 2.43Av. 5.5 358 36 /1.1 89/ 1.4 233/ 3

DET NORSKE VERITAS – APPLEDORE INTERNATIONAL
Report No: 2000-3527, rev. 01
FINAL REPORT
Page 28Reference to part of this report which may lead to misinterpretation is not permissible.
22 February 2001, B/feasibility study ship scrapping final report 21feb01.doc
From DNV’s registers, a relationship between lightship weight (LIGW) and DWT is found andused to produce type specific LIGW for OEUR (and GEUR) vessels requiring scrapping in a 15-year perspective from year 2000. The results are presented in Table 4-9 and Table 4-10.
4.3.6 ConclusionFrom the discussion above, it may be concluded that:• The average scrapping age of cargo vessels is approximately 26 years.• The main scrapping contributors in tonnage are bulkers and tankers. The main scrapping
countries are Bangladesh, India, Pakistan and China.• Double hull requirements may cause longer lifetimes of cargo vessels (tankers). However,
incidents may influence regional legislations and hence counteract this trend.• The annual expected scrapping rate world-wide is about 500 vessels/year at 25 million DWT
depending on fleet development, and age and size distribution.• 66 % of the number of European ships scrapped in 1999 was scrapped in non-OECD
countries. This represents some 93 % in terms of dead weight.The input to future European scrapping facilities arriving from the fleet of merchant vesselsbased upon the intentions of the Basel Convention, will be represented by the vessels underEuropean OECD flag. The remaining OECD fleet may sequentially also represent such input.The remaining OECD fleet (that of; Australia, Canada, Japan, Korea, Mexico and USA) willrepresent an additional 10 % by DWT.

DET NORSKE VERITAS – APPLEDORE INTERNATIONAL
Report No: 2000-3527, rev. 01
FINAL REPORT
Page 29Reference to part of this report which may lead to misinterpretation is not permissible.
22 February 2001, B/feasibility study ship scrapping final report 21feb01.doc
Table 4-9 OEUR vessels above 10,000 DWT (GEUR in brackets)LIGW (million tons)
Year No. MillionDWT
MillionGT
Tanker Bulker Dry cargo Combos Gas
2001 98 (227) 3.6 (9.3) 1.9 (5.12) 0.35 (0.89) 0.22 (0.56) 0.09 (0.23) 0.06 (0.15) -2002 98 (227) 3.6 (9.3) 1.9 (5.12) 0.35 (0.89) 0.22 (0.56) 0.09 (0.23) 0.06 (0.15) -2003 84 (179) 4.0 (10.33) 2.16 (5.81) 0.39 (1.0) 0.25 (0.64) 0.1 (0.26) 0.07 (0.17) -2004 84 (179) 4.0 (10.33) 2.16 (5.81) 0.39 (1.0) 0.25 (0.64) 0.1 (0.26) 0.07 (0.17) -2005 84 (179) 4.0 (10.33) 2.16 (5.81) 0.39 (1.0) 0.25 (0.64) 0.1 (0.26) 0.07 (0.17) -2006 84 (179) 4.0 (10.33) 2.16 (5.81) 0.39 (1.0) 0.25 (0.64) 0.1 (0.26) 0.07 (0.17) -2007 70 (159) 3.07 (7.88) 1.65 (4.44) 0.30 (0.77) 0.19 (0.49) 0.08 (0.20) 0.05 ((0.12) -2008 70 (159) 3.07 (7.88) 1.65 (4.44) 0.30 (0.77) 0.19 (0.49) 0.08 (0.20) 0.05 ((0.12) -2009 70 (159) 3.07 (7.88) 1.65 (4.44) 0.30 (0.77) 0.19 (0.49) 0.08 (0.20) 0.05 ((0.12) -2010 70 (159) 3.07 (7.88) 1.65 (4.44) 0.30 (0.77) 0.19 (0.49) 0.08 (0.20) 0.05 ((0.12) -2011 70 (159) 3.07 (7.88) 1.65 (4.44) 0.30 (0.77) 0.19 (0.49) 0.08 (0.20) 0.05 ((0.12) -2012 48 (110) 2.66 (6.84) 1.43 (3.85) 0.26 (0.66) 0.17 (0.42) 0.067 (0.17) 0.04 (0.11) -2013 48 (110) 2.66 (6.84) 1.43 (3.85) 0.26 (0.66) 0.17 (0.42) 0.067 (0.17) 0.04 (0.11) -2014 48 (110) 2.66 (6.84) 1.43 (3.85) 0.26 (0.66) 0.17 (0.42) 0.067 (0.17) 0.04 (0.11) -2015 48 (110) 2.66 (6.84) 1.43 (3.85) 0.26 (0.66) 0.17 (0.42) 0.067 (0.17) 0.04 (0.11) -Av. 75 (174) 3.54 (9.11) 1.90 (5.09) 0.34 (0.88) 0.22 (0.57) 0.087 (0.22) 0.06 (0.15) -
Table 4-10 OEUR vessels below 10,000 DWT (GEUR in brackets)LIGW (million tons)
Year MillionDWT
No. Tanker Bulker Dry cargo
2001 0.84 (2.16) 65 (181) 0.03 (0.08) 0.04 (0.12) 0.11 (0.29)2002 0.84 (2.16) 65 (181) 0.03 (0.08) 0.04 (0.12) 0.11 (0.29)2003 0.95 (2.45) 52 (119) 0.03 (0.1) 0.05 (0.13) 0.13 (0.32)2004 0.95 (2.45) 52 (119) 0.03 (0.1) 0.05 (0.13) 0.13 (0.32)2005 0.95 (2.45) 52 (119) 0.03 (0.1) 0.05 (0.13) 0.13 (0.32)2006 0.95 (2.45) 52 (119) 0.03 (0.1) 0.05 (0.13) 0.13 (0.32)2007 0.73 (1.87) 46 (108) 0.03 (0.07) 0.04 (0.1) 0.1 (0.25)2008 0.73 (1.87) 46 (108) 0.03 (0.07) 0.04 (0.1) 0.1 (0.25)2009 0.73 (1.87) 46 (108) 0.03 (0.07) 0.04 (0.1) 0.1 (0.25)2010 0.73 (1.87) 46 (108) 0.03 (0.07) 0.04 (0.1) 0.1 (0.25)2011 0.73 (1.87) 46 (108) 0.03 (0.07) 0.04 (0.1) 0.1 (0.25)2012 0.63 (1.62) 32 (73) 0.02 (0.06) 0.03 (0.09) 0.09 (0.22)2013 0.63 (1.62) 32 (73) 0.02 (0.06) 0.03 (0.09) 0.09 (0.22)2014 0.63 (1.62) 32 (73) 0.02 (0.06) 0.03 (0.09) 0.09 (0.22)2015 0.63 (1.62) 32 (73) 0.02 (0.06) 0.03 (0.09) 0.09 (0.22)Av. 0.77 (1.98) 32 (73) 0.03 (0.08) 0.04 (0.1) 0.1 (0.27)

DET NORSKE VERITAS – APPLEDORE INTERNATIONAL
Report No: 2000-3527, rev. 01
FINAL REPORT
Page 30Reference to part of this report which may lead to misinterpretation is not permissible.
22 February 2001, B/feasibility study ship scrapping final report 21feb01.doc
4.4 Navy fleetNaval vessels are excluded from international legislation, which is governing the building andoperation of civilian vessels. The life span of naval vessels is typically higher than that ofcivilian vessels. Furthermore, substantial refits for the purpose of updating both performances aswell as expanding remaining lifetime, is not unusual. These parameters have an impact on thedecommissioning, disposal and scrapping patterns of naval vessels.
4.4.1 World navy fleetThe world navy fleet consists of some 20,000 warships. The vast majority of these are smallvessels for patrol and supporting services. The world naval fleet distribution by type is presentedin Table 4-11, and is further detailed in Appendix A.
Table 4-11 World Navy fleet in 1998 (ref.: /8/)Submarines *Region/organisation
Nuclear Diesel
AircraftCarriers/Cruiser
*
Destroyers/Frigates
*
Patrolvessels
**
Misc.**
Nato fleet 109 82 39 320Non-Nato-Europe fleet 72 52 18 51South and central Asia; East Asiaand Oceania
6 154 2 277
Middle East and North Africa; Sub-Saharan Africa; Latin America
0 48 3 105
SUM 187 336 62 753 6,218 11,836* Data exclude vessels of less than 100 tons standard displacement. Figures are for June 1998.** Data for vessels less than 100 tons standard displacement. Figures are from 1995.
The largest navy fleet nations by numbers of warships of size above 100 displacement tons arepresented in Table 4-12.
Table 4-12 Largest Navy fleets in 1998, sorted by vessel numbers (ref.: /8/)SubmarinesCountry
Nuclear DieselAircraft
Carriers/CruisersDestroyers/
FrigatesSum
United States 84 0 31 97 212Russia 72 26 18 26 142China 6 57 0 53 116Japan 0 16 0 57 73France 10 2 2 39 53United Kingdom 15 0 3 35 53Korea, South 0 14 0 34 48Other 0 221 8 412 641Sum 187 336 62 753 1338
Note: Data exclude most paramilitary, security, and irregular forces. Naval data exclude vessels of less than 100tons standard displacement. Figures are for June 1998.
Only 7% of the naval fleet (by numbers) is in the category of large warships (larger than 100standard displacement tons). The number of submarines reported varies depending on sourceused. This deviation may be caused by insufficient updating in relation to scrapping,inconsistency in reference year and the adoption of different “grouping” parameters (size/ type).

DET NORSKE VERITAS – APPLEDORE INTERNATIONAL
Report No: 2000-3527, rev. 01
FINAL REPORT
Page 31Reference to part of this report which may lead to misinterpretation is not permissible.
22 February 2001, B/feasibility study ship scrapping final report 21feb01.doc
Due to lack of data on small naval tonnage, this assessment focuses on the contribution fromlarge warships (>100 tons standard displacement) and submarines.
4.4.1.1 Global distributionThe 1998 NATO fleet accounted for approximately half of all large warships in the world. TheUS navy fleet was the largest accounting for 1/6 of total, followed by Russia. Nuclear poweredwarships are operated by only a few naval fleets dominated by USA and Russia.
At the end of the 1980s, the Soviet navy had more nuclear submarines than all other nations puttogether. As a result of the START II disarmament treaty in combination with the high age ofsome of the early generations of Soviet submarines, this fleet has now been considerably reducedfollowing the decommissioning of some 138 FSU submarines. This number is expected toincrease over the years to come as more of the ageing classes of submarines aredecommissioned. The status of the subsequent process of demolishing these vessels is not knownin detail, but a high number of these vessels are laid up awaiting scrapping (ref.: /9/).
A number of 13 Russian submarines and 1 submarine from United Kingdom (UK) of an averagedisplacement of 4,000 tons were reported scrapped in the period from 1990 to 1999 (ref.: /13/).In the same period, 16 large surface warships of an average displacement of 20,000 tons werereported scrapped (3 US, 2 UK and 11 Russian vessels).
A typical decommissioning age seems to be less than 30 years, and the age for scrapping lessthan 50 years. Assuming an average scrapping age of 50 year, and adopting a navy scrappingrate of half of the merchant rate, the volume of large warships to arrive for scrapping annually isestimated to 25 – 30 vessels.
4.4.2 US navy fleetThe historic US navy fleet decommissioning contribution is detailed in Table 4-13 (the numberof US ships decommissioned after January 1st 1980 differentiated by type (ref.: /3/). Thenumbers of scrapped/ disposed vessel are also provided. The statistics indicates that a highfraction of the decommissioned submarines are scrapped, while surface vessels seems to bedecommissioned to enter a fleet of contingency/ reserve or sold or used as targets. The datareveal a US scrapping rate of 1-5 vessels annually.
The US naval vessel register (ref.: /2/) refers to a “non-active vessels” category (containingapproximately 3200 vessels, year 1924 and onwards). From this source, some 900 vessels arecategorised as: Disposed of, resold by Defence Reutilization and Marketing Service (DRMS) forscrapping (not separated by vessel category).
Since 1993, a total of 23 scrapping contracts have been completed based on DRMS information(ref.: /14/). The contracts include 9 destroyers 2 minesweeper 1 submarine tender and 11 other.From this material, a scrapping rate of 1 large surface combat vessel each year has beenestablished.
Based on the US contribution to the world naval fleet, a prediction of a scrapping rate of 9 largesurface combat vessels each year is established. Following this approach, 12 submarines may bescrapped annually (based on Table 4-13). This scrapping rate (12 submarines of 523 submarinestotal) is comparable to the modified scrapping rate of the world merchant fleet (chapter 4.3).

DET NORSKE VERITAS – APPLEDORE INTERNATIONAL
Report No: 2000-3527, rev. 01
FINAL REPORT
Page 32Reference to part of this report which may lead to misinterpretation is not permissible.
22 February 2001, B/feasibility study ship scrapping final report 21feb01.doc
Table 4-13 US ships decommissioned since 1 January 1980.Type Number Scrapped/pending scrapping For DisposalSubmarines 124 35/77Surface combat vessels 207 8 23Amphibious 44 4Coastal & Mine Craft 35 10Auxiliaries 185 24Other 28 7Sum 623 68Include: All USN combat vessels, support ships, auxiliaries, research ships, cargo vessels and test ships, includingships manned by the Military Sealift Command. All USCG and NOAA vessels over 65 ft long. Major vessels of theUS Army, Air Force, other US Government agencies, and maritime academies. For the sake of completeness,nuclear submarines decommissioned before 1980 and major surface combatants in reserve in 1980 are included.
4.4.3 EuropeThe European navy fleet (excluding Russia) is characterised by a higher average age comparedto that of the merchant fleet.
A total number of 194 frigates and destroyers of European nationality have been identified in theWorld Navies Today database (ref. /3/). The number of vessels and displacement weights havebeen summarised for the European countries (Belgium, Denmark, France, Germany, Greece,Italy, Netherlands, Norway, Poland, Portugal, Romania, Spain, Turkey, Ukraine, UnitedKingdom and Yugoslavia) in order to display the variation in number of vessels anddisplacement weight as a function of age. The total displacement weight of this segment of theEuropean naval fleet is approximately 707,000 tonnes.
Figure 4-6 presents the accumulated number of vessels and displacement weights as a percentageof the total (194 vessels and 707,000 tons). From the figure, it is seen that 2 % of the number ofvessels in operation (corresponding to approximately 3% by displacement weight) are older than35 years. The average displacement weight of the frigates and destroyers is approximately 3,600tons.
Based on an absolute life-span of 50 years, the 2 % (4 vessels) of the fleet above 35 years willrequire scrapping within the next 15 year period.
Figure 4-6, an introduction of new tonnage at the rate of 16% in 5-year intervals is indicated. Theexpected scrapping rate for European frigates and destroyers may be assumed to be of the sameorder at approximately 6 vessels per year.
By adopting the same assumptions for the world’s naval vessels (a total of 1338 vessels), anannual scrapping rate is estimated to 43 vessels. This figure is comparable to that found for themerchant fleet.

DET NORSKE VERITAS – APPLEDORE INTERNATIONAL
Report No: 2000-3527, rev. 01
FINAL REPORT
Page 33Reference to part of this report which may lead to misinterpretation is not permissible.
22 February 2001, B/feasibility study ship scrapping final report 21feb01.doc
Figure 4-6 The number of vessels and total displacement as function of age (ref.: /3/)
4.4.4 ConclusionPresent scrapping rate of naval vessels is low, estimated to some 9 large surface vessels (above100 standard displacement tons) and 12 submarines.
The future scrapping rate of large warships is estimated to be less than 2%. Howeverdisarmament treaty agreements and the high age of some of the earlier generations warships maycause an increase in scrapping rates for the period considered (2000-2015).
The contribution of scrapping candidates from the navy is negligible compared to that of themerchant fleet. This is mainly due to the size (relatively few vessels) and the high life-spanexpectation.
Naval vessels follow a different pattern when decommissioned from operational military service.This results in a relatively long lag-period before scrapping.
Assuming that global fleet distribution for small naval vessels (less than 100 displacement tons)equal that of the larger vessel, the NATO fleet consists of some 6000 – 8000 units, and furtherassuming a similar scrapping rate to that of the larger vessels, an annual scrapping volume isestimated to be 90 – 120 units.
0 %
20 %
40 %
60 %
80 %
100 %
No of vessels 89 % 69 % 52 % 29 % 18 % 8 % 2 %
Displacement 89 % 69 % 52 % 31 % 21 % 9 % 3 %
> 5 year >10 year >15 year >20 year >25 year >30 year >35 year

DET NORSKE VERITAS – APPLEDORE INTERNATIONAL
Report No: 2000-3527, rev. 01
FINAL REPORT
Page 34Reference to part of this report which may lead to misinterpretation is not permissible.
22 February 2001, B/feasibility study ship scrapping final report 21feb01.doc
4.5 Inland fleetThe world fleet of inland vessels consists typically of older and smaller units compared to that ofthe sea-going merchant fleet. The inland fleet composition mirrors the characteristics of thewaterways they serve. In Europe, the inland waterway infrastructure consists of both rivers andconnecting canal networks. The fleet includes non-propelled vessels and is subjected togeographical operational constraints.
4.5.1 World-wideTable 4-14 presents the 1992 inland fleet of Europe, USA, Russia and countries of the formerUSSR. The figures are based on OECD statistics (ref.: /16/). The fleets of these nations consist ofsome 80,000 units representing a gross carrying capacity of 80,000 tonnes.
US and Russia dominate the scene accounting for approximately 40% and 30 %, respectively, interms of numbers. The Netherlands is the largest operator of inland vessels in Europe at 8% ofthe world total.
By number, the inland fleet represents a similar size as that of the sea-going merchant worldfleet. However, its cargo carrying capacity is on average less than 900 tons. Push-towed vesselsaccount for a major part of the cargo carrying fleet, thus this varies somewhat according tocountry and region.
Table 4-14 may provide a general picture of the fleet composition and regional distribution. Thefleet statistics presented here are 8 years old, and are limited to only some main inland transportregions. However, the size of the inland fleet has not developed in the latter part of the 1990s(Table 4-15/ Figure 4-7).

DET NORSKE VERITAS – APPLEDORE INTERNATIONAL
Report No: 2000-3527, rev. 01
FINAL REPORT
Page 35Reference to part of this report which may lead to misinterpretation is not permissible.
22 February 2001, B/feasibility study ship scrapping final report 21feb01.doc
Table 4-14 Fleet composition 1992 (ref.: /16/). (Numbers in italics are estimated)Number of units Gross carrying capacity
(103 tonnes)Country
Total Push-towed
Total Push-towed
%
Average size of ariver barge unit(tonnes)
Germany* 3749 1418 3328.7 1136.4 34.1 888Austria 225 140 250.2 206.4 82.5 1112Belgium 1845 292 1475 374.6 25.4 799France 2878 989 1551.7 692.1 44.6 539Hungary 249 145 251.2 202.2 80.5 1009Luxembourg 28 0 28.6 0 0 1021Netherlands 6534 1109 5818.1 1525 26.2 890Poland 2102 1069 812.4 340.5 41.9 386Switzerland 156 69 281.4 127.1 45.2 1804Czech Republic 543 469 321.6 245.4 76.3 592Slovakia 309 309 376.2 376.2 100 1217Croatia 189 107 83.1 40.7 49 440United Kingdom 830 205 247Other Europeancountries
274 370.6 1356
Ukraine 765 347 762 372.7 48.9 996Baltic States 107 51 1.4 0.6 42.9 13Russia 24559 2647Other countries of theformer USSR
115 114 30.9 30.8 99.7 269
United States 34387 28615 42111 40190 95.4 1225Sum 79844 37890 58060** 45861** 822
*former GDR & GFR** Russia not included
4.5.2 EU- fleetAfter the end of World War II, the growth of transport by inland waterways in Europe, co-ordinated by the various international authorities, resulted in an enlarged and integrated networkbrought up to a minimum standard for serving vessels of 1,350 tons (ref.: /17/). This formed thebasis of the existing network of waterways. At present, only six EU member states haveoperational inland waterway networks: France, The Netherlands, Belgium, Luxembourg,Germany and Austria. Traffic density is closely linked to that of activity levels of the adjacentports through which the main traffic is channelled (ref.: /16/).
In the European continent, a considerable growth was experienced in total tons carried by inlandwaterways from 385 million tons to 472 million tons in the years 1964-68. In 1938, Germanycarried 90 million tons of freight on its inland waterways, and by the end of the 1960s, theFederal Republic of Germany alone was carrying over 230 million tons annually (East Germanywas carrying an additional 12 million tons). Nor was this increase limited to the earlier years ofthe decade, as is shown by the volume of goods passing along the Rhine, which rose from 187million tons in 1963 to 265 million tons in 1969. Most European countries could refer to thesame substantial growth. The Soviet Union carried over its 233,000 miles of navigablewaterways approximately 239.5 million tons in 1963. This had increased to 322.7 million tons in1969 (ref.: /17/).

DET NORSKE VERITAS – APPLEDORE INTERNATIONAL
Report No: 2000-3527, rev. 01
FINAL REPORT
Page 36Reference to part of this report which may lead to misinterpretation is not permissible.
22 February 2001, B/feasibility study ship scrapping final report 21feb01.doc
Despite the fact that the freight transport market in Europe almost doubled in volume over theperiod from 1970 to 1995, growth in the inland sector has remained stagnant. Until now, thewaterways have primarily been used to cover transport requirements of traditional manufacturingsectors, those that have been hard hit by industrial restructuring. The waterway network can bereadily incorporated into logistics chains in which regular supply streams and low transport costsare more important than speed. The transportation of hazardous materials and container transportare also offering promising markets (ref.: /17/).
The restructuring and upgrading of the European waterway network was gradually integratedinto to the work-scope of the EU. Arising out of this came the scrapping scheme (Directive No.1101/89) initiating a systematic restructuring of the inland waterway fleet. The restructuring isnow almost complete on the Rhine and the Rhone and in the Netherlands, where the waterwaysector is experiencing renewed growth (ref.: /17/).
The western European fleet is being renewed by the introduction of self-propelled push-towbarges better adapted to the needs of containerised transport. The East European fleets need to bemodernised. Barges are still most often towed and the technical standards, particularly thoseassociated with safety, are still inadequate. In some countries, such as Poland, the size of thevessels is relatively small (ref.: /17/).
Table 4-15 presents the EU fleet separated by country and vessel category (ref.: /4/). The 1997fleet consisted of 15,471 self-propelled cargo-carrying vessels and 4,016 dumb and push barges(vessels not based on own propulsion). The age distribution of self-propelled inland waterwayvessels is shown in Table 4-16. Assuming that the age distribution in this table is representativeof the whole fleet, this clearly indicates a dramatic reduction in supply of new tonnage in the lastdecade. Based on this and the development in volume of vessels operating the last ten years, ascrapping rate of approximately 200-300 vessels annually has been estimated (from Table 4-15).This rough estimation is only based on the net reduction in tonnage, but replacement of oldtonnage would also involve some scrapping.
From Table 4-17, it can be seen that the average size of the vessels is approximately 650 DWT.It follows that the expected tonnage scrapped annually will be no more than 0.2 million DWT.By comparing inland merchant fleet scrapping volume to that of the world merchant fleet, itsminor influence as a source for recycling industries becomes evident.
Looking at a scenario where it is assumed that the tendency seen in the last decade continues todevelop and the supply of new tonnage cease, in the period from year 2000 to 2015, the fleetmay be reduced to some 12,000 vessels. However, some supply of new tonnage may counteractthis trend and balance the numbers. The considerable backlog of very old vessels(approximately 70% of the number of vessels in the fleet was built before 1969) will require anincreasing degree of replacement within the period (2000-2015). It should be noted that newvessels are likely to be larger than the older, and hence balancing the numbers should reflect this.
Figure 4-7 shows that the decrease in number of vessels has levelled out in the period from 1993– 1996. Note that there may be changes in the tonnage distribution not envisaged by theillustration presented.
Looking at the average inland vessel’s characteristics and size, these vessels will most likely bescrapped in Europe.

DET NORSKE VERITAS – APPLEDORE INTERNATIONAL
Report No: 2000-3527, rev. 01
FINAL REPORT
Page 37Reference to part of this report which may lead to misinterpretation is not permissible.
22 February 2001, B/feasibility study ship scrapping final report 21feb01.doc
Table 4-15 Inland Waterway fleet statistics, EU Member States (ref.: /4/).
0
5000
10000
15000
20000
25000
30000
35000
1965 1970 1975 1980 1985 1990 1995 2000
Year
Num
ber
of v
esse
ls
Figure 4-7 Development of the inland merchant fleet.

DET NORSKE VERITAS – APPLEDORE INTERNATIONAL
Report No: 2000-3527, rev. 01
FINAL REPORT
Page 38Reference to part of this report which may lead to misinterpretation is not permissible.
22 February 2001, B/feasibility study ship scrapping final report 21feb01.doc
Table 4-16 Age distribution self-propelled goods vessels in 1996, EU inland water crafts*(ref.: /5/)
Age distribution %
Up to 1949 25.01950-1969 43.61970-1979 11.81980-1989 16.71990 and over 2.8
100* based on the data from 4677 vessels
Table 4-17 Size distribution self-propelled goods vessels in 1996, EU inland water crafts*(ref.: /5/)Tonnage distribution %
Up to 249 tonnes 6.9250-399 tonnes 27.6400-649 tonnes 20.5650-999 tonnes 14.31000-1499 tonnes 17.61500-2999 tonnes 12.73000 tonnes and over 0.4
100* based on the data from 4692 vessels
4.5.2.1 The future of the European waterway fleetThe OECD has summarised the perspectives of the inland waterway network of Europe asfollows (ref.: /16/):• On the whole, the future of the waterways lies more in new markets than in the spin-offs
from possible changes in the current modal split.• Many countries have experienced significant growth in the transport by inland waterway of
products not normally carried by that mode.• Waterway transport can be integrated into logistical chains in which regular flows of supplies
and low costs are more important than speed.• The Rhine and the Danube are the two major river corridors in Europe. The Rhine will
continue to be a major corridor in the future, due to qualitative progress in the handling oftraffic flows.
• Living standards in eastern European countries will rise and the integration of these countriesinto the world economy should accelerate, thus stimulating growth in traffic flows.
• The future for waterway transport is all the more secure in that it will be difficult for roadtransport to absorb the very strong growth forecast in goods traffic; the road transport market,however, is relatively distinct from the waterway market.

DET NORSKE VERITAS – APPLEDORE INTERNATIONAL
Report No: 2000-3527, rev. 01
FINAL REPORT
Page 39Reference to part of this report which may lead to misinterpretation is not permissible.
22 February 2001, B/feasibility study ship scrapping final report 21feb01.doc
4.5.3 ConclusionThe scrapping contribution from the Inland merchant fleet seems to be negligible as a source forsteel recycling industries compared to that of the merchant fleet.
However, due to the high number of units represented by the fleet and its age composition, it islikely that a considerable number of these vessels will require scrapping in the period considered.The individual scrapping candidate will not resemble that of a merchant vessel with respect tooutput (recyclable share). This is an argument for undertaking scrapping of small tonnage withinEurope.
4.6 Conclusion – all vessel categoriesAll “marine vehicles” have a limited operational (design) life span and will consequently requiresome form of end-of-life disposal at some predictable point in time.
This chapter has assessed the volume and composition of scrapping candidates over a 15 yearperspective (2000-2015) and made predictions based on statistics and common practice for therespective category.
The merchant fleet represented by the cargo-carrying segment represents by far the largestcontributing category to the scrapping industries by tonnage. The decommissioning patternsassociated with offshore structures and naval vessels are influenced by constraints of politicalnature whilst the decommissioning of inland waterway vessels is governed by practical andoperational constraints.
Offshore;
The closedown of 90 fields by the year 2000 with a lag period of 2-20 years before scrappingfollowing decommissioning is likely to represent a backlog representing some 4 units annually(29,200 tons/ year steel). Over a 15-year period this will accumulate to 438,000 tons of steelstructures. An additional demand may be represented by the 160 fields expecteddecommissioned in the interval from year 2000-2015. If these are assumed arriving at a constantrate and scrapped without delay, some additional 80,000 tons of steel (11 units) annually willarrive from offshore structures from year 2010. The final fate of offshore structures is notnecessarily that of being scrapped. The figures presented in this chapter do not account foralternative usage.
Merchant fleet;
The average scrapping age of cargo vessels is approximately 26 year, and the main scrappingcontributors in terms of tonnage are bulkers and tankers. The main scrapping countries areBangladesh, India and Pakistan. Double hull requirements may cause longer lifetimes of cargovessels (tankers). However, incidents may influence regional legislations and hence counteractthis trend. The annual expected scrapping rate is about 500 vessels/year and 25 million DWTdepending on fleet development, and age and size distribution. 66 % of the number of Europeanships scrapped in 1999 was scrapped in non-OECD countries and this represents 93 % in termsof dead weight.

DET NORSKE VERITAS – APPLEDORE INTERNATIONAL
Report No: 2000-3527, rev. 01
FINAL REPORT
Page 40Reference to part of this report which may lead to misinterpretation is not permissible.
22 February 2001, B/feasibility study ship scrapping final report 21feb01.doc
Naval fleet;Present scrapping rate of naval vessels is low, estimated to some 9 large surface vessels (above100 standard displacement tons) and 12 submarines. The annual scrapping rate of large warshipshas been estimated to be less than 2%. However, disarmament treaty and the high age of some ofthe earlier generations warships may generate peaks within the period considered. The scrappingcontribution from navy fleets seems to be negligible compared to that of the merchant fleet dueto lower number of large vessels and a higher scrapping age. A considerable share ofdecommissioned navy vessels is kept as a contingency prior to disposal. A scrapping rate ofEuropean navy vessels has been found at 6 units annually. A considerable part of the world’snaval fleet consists of smaller vessels. Some 93% by numbers are of less than 100 tons standarddisplacement and consequently not represented in the figures above. These smaller vessels havetypically a lower average age when decommissioned. Assuming that the distribution pattern forthese smaller vessels is identical to that of destroyers and frigates, the European share of navalvessels of less than 100 standard displacement tons are approximately 36% (some 6,600 units).Furthermore, assuming that the average scrapping rate for the smaller vessels equals that of thelarger naval fleet, a volume of 132 European smaller naval vessels requires disposal.
Inland waterway fleet;
The scrapping contribution from the inland waterway fleet is negligible compared to that of themerchant fleet in terms of tonnage. Inland waterway vessels are diverse from the merchant fleetnot only by size but also by age as these vessels are kept in operation for a considerably longertime than the merchant fleet. However, due to the high number of units represented by this fleetand its age composition, it is likely that a considerable number of these vessels will requirescrapping in the period considered. The individual scrapping candidate will not resemble that ofa merchant vessel with respect to output (recyclable share). This is an argument for undertakingscrapping of small tonnage within Europe.
Assuming that nearby 70% of the European inland waterway fleet was built prior to 1969 (ref.Table 4-16) and further assuming a 2% scrapping rate, an annual number of 216 vessels to bedisposed of can be expected for the period. Dumb and pushed barges would come to 56 vesselsannually in addition.

DET NORSKE VERITAS – APPLEDORE INTERNATIONAL
Report No: 2000-3527, rev. 01
FINAL REPORT
Page 41Reference to part of this report which may lead to misinterpretation is not permissible.
22 February 2001, B/feasibility study ship scrapping final report 21feb01.doc
5 CURRENT PRACTICE
5.1 Industry CharacteristicsThere has been little or no commercial ship scrapping activity within Western Europe over thelast 10 years. World-wide scrapping activity has centred on India, Bangladesh, Pakistan andChina. Additionally there has been some recorded scrapping in Spain and Turkey.
The capacity in the Indian sub-continent and SE Asia is conveniently located close to themajority of trade routes. The Indian sub-continent covers the major trade routes of the Far East tothe Middle East and Europe whilst China covers the trade routes within Asia and across thePacific. These locations tend to minimise transport distances for vessels as they can often bestemmed with a cargo close to the final point of disposal. Perhaps the only major trade routes notadequately served are those across the Atlantic and through to the Mediterranean and WestAfrican coastlines.
Predominantly, scrapping activity has been most evident in the Indian sub-continent, where theprocess involves the beaching of vessels, and subsequent manual break-up and dismantling. It isthis type of activity that causes major concerns on environmental, health and safety and socialgrounds. The major environmental concern is lack of containment to prevent toxins fromentering the water, the land, the air or humans.
Manual, low paid workers are allowed to dismantle the ships without the provision of safetyequipment, and scant attention is paid to health and safety issues or training. Injuries and deathsare common place. Similarly, environmental concerns are low on the agenda of the workforce,with little attention paid to the pollution occurring to land, air and sea as a result of theiractivities. Against Western European standards, these methods of scrapping fail to comply onalmost all aspects of health, safety and environmental concern.
The extent and nature of non-compliance associated with ship scrapping activities in thesecountries is identified in the following section which is based upon an on-site case studyundertaken at the scrapping sites at Fauzdarhat, Chittagong in Bangladesh. It can be seen thatthe gap to be bridged to achieve compliance is potentially huge, and would require capitalinvestment in facilities, process control and radically different working practices and conditions.Furthermore, the local legal and cultural framework would need to be in place to ensure that anynew environmental and health and safety measures that are introduced would be adhered to.
However, against local standards the situation does not seem so detrimental, as priorities aredifferent and few alternative lifestyle opportunities are afforded. There is no doubt that theimpact of these industries on the local community and economy is considerable and this must beconsidered in possible solutions. The situation in the other main scrapping countries is notnecessarily identical, but to some extent similar issues exist.
There is effectively no existing scrapping activity for merchant vessels within Europe, and hencenon-compliance is not really relevant. Elsewhere in the world the compliance gaps to beaddressed are substantial and the climate in which to do this not conducive.
As a result of abundant low cost labour, and the level of non-compliance with Western Europeanstandards, the existing yards have the advantage of low operating costs. The less well developed

DET NORSKE VERITAS – APPLEDORE INTERNATIONAL
Report No: 2000-3527, rev. 01
FINAL REPORT
Page 42Reference to part of this report which may lead to misinterpretation is not permissible.
22 February 2001, B/feasibility study ship scrapping final report 21feb01.doc
countries such as India, also provide a ready market for many of the components that arise out ofthe ship scrapping process, such as pumps and generators. These components would notnecessarily comply with regulations that would permit their reuse in Europe. The marketplacefor these components also makes the transport of recovered materials very cost effective.
It would be difficult to ignore the social implications of removing large volumes of scrappingfrom these existing operations, as they generate employment and revenue for the local economy.The sustainability of any proposed changes to these operations would have to take into accountthe effect of balancing the environmental, social and economic issues.
In summary, the existing locations offer two critical factors:
• An abundance of low cost labour willing to do this dirty and dangerous work.
• A ready market to re-use many of the dated items on the vessels, such as pumps, generators,compressors, etc.
Relocating the industry would likely result in:
• Increased labour costs, which would have to be offset by improved methods of working toenable greater mechanisation.
• Increased transport costs to move many of the re-useable items to the markets, or a netreduction in the re-use element of the disposal process.
• Increased controls and legislation requiring considerable investment in facilities to bring theprocess up to meet international standards.
5.2 Non-compliance in Current PracticeCurrent ship scrapping is based around the principle of maximum separation and mirror a reverse“building” process being similar in that it is labour intensive but does not however make usetechnology commonly used in ship building. At present these operations are undertaken virtuallywithout any mechanised aids on beaches by unskilled labour.
Scrapping sites are non-facilitated beaches including adjacent areas with some degree ofinfrastructure available. There may be some variations in adopted procedures by location, butthe general contexts are very similar. Consequently, the findings from the case study of the sitesat Fauzdarhat, Chittagong, Bangladesh are assumed to be generically valid and hence relevantfor how the majority of tonnage (90% by DWT) is scrapped. Ref.: /20/ provides details from thisstudy.
5.2.1 Adopted practicesThe choice of location for the establishment of scrapping sites rests upon some priorityrequirements;
• A long uniform intertidal zone/ sufficient tidal difference (allowing vessels of a rangeof sizes to be “dry-beached)
• Minimum exposure (coastal protection) and stable weather conditions.• Availability of low cost labour.• A certain level of infrastructure.

DET NORSKE VERITAS – APPLEDORE INTERNATIONAL
Report No: 2000-3527, rev. 01
FINAL REPORT
Page 43Reference to part of this report which may lead to misinterpretation is not permissible.
22 February 2001, B/feasibility study ship scrapping final report 21feb01.doc
The scrapping process follows a sequential pattern that can be described in a series of four steps:
1) Offshore: Prior to beaching, tanks are discharged and valuables (mostly electronicequipment) are removed.
2) Intertidal zone: The vessel is beached by own power and dismantling is initiated (in acertain sequence).
3) On the beach: Sorting of components and further cutting into manageable pieces forfurther transport.
4) On shore/final destination: Re-use ‘as is’ of different components/materials (second-hand market) and re-manufacturing/recycling into new products/components.
These steps are elaborated on in Figure 5-1 and Figure 5-2.
5.2.2 Safety, Health and the EnvironmentAn inventory (Inventory of best practices, see Figure 5-2) complying guidelines, procedures,standards and requirements referring to actual operations covering both the ship breaking processas well as that of re-use or recycling should be identified. Such inventory will include a mutualsection for practices related to the identification and handling of materials, items and hazardscovering all SHE-aspects identifying minimum requirements for the ship breaking facility andthe associated recycling processes including operational procedures. It should also addressincidents and requirements associated with such (contingency preparedness). At a developedstage, this inventory will in effect serve as an Environmental and Safety Manual (ESM) for theship scrapping facility.
Such requirements should cover the facilities themselves as well as operational procedures.Listed below are some examples:
1. Facility Layout Work task separation (requirements to work surfaces and drainage);Material separation (waste separation facilities).
2. Operational procedures Use of machinery and tools (procedures when using winches/ cranes,touch cutters, etc. (clearance zone, protective gear ); Handling ofhazardous substances (procedures for personal protection, storage andtransport)
Adopted standards must reflect and comply with national regulations or regulations whereapplicable.


DET NORSKE VERITAS – APPLEDORE INTERNATIONAL
Report No: 2000-3527
FINAL REPORT
Reference to part of this report which may lead to misinterpretation is not permissible.22 February 2001, B
Minimum requirementStage Purpose
Safety Health
Offshore - Quayside Removal of; residual cargo/ wastes/ballast/ oils/ salables, etc
Protective wear/equipment
Protection fromexposure, monitoring
Intertidal zone Access/ gross demolition Protective wear/equipment
Protection fromexposure, monitoring
Onshore –Scrapping site
Fine demolition and sorting Protective wear/equipment
Protection fromexposure, monitoring
Onshore – Finaldestination
Reuse/ resale/ recycling/reprocessing
Protective wear/equipment
Protection fromexposure, monitoring
Figure 5-1 Compliance to basic requirements
ESMSafety/ Health Environment
Occupational Safety and Health Plan Environmental Management Plan Contingency Preparedness and Disaster Management Plan
Inventory of best practicesFigure 5-2 Schematic example on SHE-procedures; The overlaying requirement to safeguard all SHE-aspects that of the establishment ofprocedures. Such procedures will incorporate requirements to third parties (documentation and preparations), as well as to equipment in use,methods adopted, workers skills, emergency measures, etc., and may be organised in an Environmental Safety Manual for the ship scrappingfacility.

DET NORSKE VERITAS – APPLEDORE INTERNATIONAL
Report No: 2000-3527, rev. 01
FINAL REPORT
Page 46Reference to part of this report which may lead to misinterpretation is not permissible.
22 February 2001, B/feasibility study ship scrapping final report 21feb01.doc
The ESM approach is a managerial tool for the operation containing references to all relevantnorms, standards, regulations etc. and provide for implementation, maintenance and continuosimprovements. Based on an identified safety and environmental performance policy to beadopted by the scrapping facility, the manual rests on identified safety and environmentalperformance criteria. Through defined procedures, conformity (or non-conformity) with theidentified policy can be monitored and verified.
5.2.3 Compliance mismatchMost nations involved in ship scrapping will be able to make reference to some nationalguidelines and/ or recommendations covering both safety and environmental issues. However, itis evident that these are not implemented or adhered to.
From Figure 5-1 and Figure 5-2, it is evident that even though the work follows a certain patternof logic, it fails to comply with the most general expectations in terms of precautions with thepotential of causing serious safety violations and causing harm to workers health and theenvironment. The absence of overlaying plans and policies, lacking in facilities, lackingprocedures, lacking skills requirement and appreciation of training needs represent sufficientinadequacies to draw the conclusion of general non-compliance. The findings from the casestudy undertaken by DNV at Fauzdarhat, Chittagong, Bangladesh (ref.: /20/) is a documentationof this.
5.2.4 New InitiativesThe industry is to some extent recognising its failure to comply and there are some initiativesaiming for changes. The most promising current activities associated to the development of shipscrapping as an industry, may be illustrated by emerging initiatives:
• An Australian ship scrapping project; this is being led by Australian Steel and a number ofbig backers (Deutsche Bank, AMEC, ABB, etc). However, this has been 3 years in theplanning and a number of site selections have been rejected, other sites have been selectedand the project team would consider a suitable opportunity in Europe.
• Offshore facilities, there are at least 3 offshore facilities that are active in offshorerigs/platform de-commissioning in Europe. Two located in the UK and one in Norway. Theseare interesting because they have a different cost/income structure to the traditional shipscrap yards.
• Development/opening of a new ship demolition yard at Pipanav in India, which is being builtwith Japanese help – most notably loans for 85% of the project cost. This is a dock basedfacility comprising 2 very large docks (700m x 60m) which is being equipped to be moreenvironmentally friendly and less hazardous than the nearby beaching facilities at Alang. Thedesign capacity of this facility is 8 VLCCs per year.
• Finally there is has been some news items regarding P&O investing in the upgrading of aChinese facility to enable it to meet international standards.
It should also be noted that recent initiatives at existing sites on SHE issues has been announcedincluding the establishing waste reception facilities and medical treatment facilities. However,whether the extent of these initiatives will be sufficient to achieve compliance is unsure.
The offshore facilities and the US attempts have deviated from the established traditionalfinancial scenario in which the owner is paid money by the scrap yard to purchase the vessel for

DET NORSKE VERITAS – APPLEDORE INTERNATIONAL
Report No: 2000-3527, rev. 01
FINAL REPORT
Page 47Reference to part of this report which may lead to misinterpretation is not permissible.
22 February 2001, B/feasibility study ship scrapping final report 21feb01.doc
scrap with the price usually determined by the steel weight. In the US and the offshore sectors anumber of contracts have been executed where either there has been zero payment to the owneror the owner has had to pay to have the marine vehicle disposed of.
5.3 Adopting Current Practice in EuropeShip scrapping of the dominant merchant vessel category at the current time is almostexclusively undertaken in countries such as India, Bangladesh, Pakistan, etc. where the practicesare non-compliant in respect of SHE considerations.
The basic concept of the scrapping process in these countries is to dismantle the vessel intocomponent parts and manageable sized units of structure. In the general recycling environmentthis task is referred to as separation, and is usually highly labour intensive. The benefit ofundertaking a high level of separation is however that the resultant material output streams aremore easily reusable or recyclable because the mix of materials is reduced. For example,separation of pipework into straight tube lengths, welded bends, flanges and valves allows muchgreater flexibility for re-use than a prefabricated section of pipework. Similarly, separation ofsteel structure from insulation, cement compositions, cable trays or windows provides a purersource of steel for recycling. This results in potentially higher income streams from resale.
A large part of the economics of recycling therefore is a trade off between the cost of separationand the increased resale opportunities and value for the resultant material output. Whereseparation is largely a labour intensive process rather than a mechanised or chemical process, thebalance between separation cost and material value is very different according to the labouravailability and cost in the country in which it occurs. In many recycling industries, the balanceis such that recycling becomes a net cost item rather than a revenue generating activity. Thissituation is further exacerbated by the volatility of waste material prices in the commoditymarkets. In some instances after initial separation/ processing and compacting, materials areexported to lower labour cost countries for ‘hand picking’ or further separation.
The value of an item for re-use is generally greater than that for recycling and in theenvironmental hierarchy this may also be a more desirable option. Therefore the readyavailability of local markets for the re-use of components within a particular country is also asignificant factor in terms of the overall economics of recycling in general and ship scrapping inparticular. Within Western European and EU countries there are both cultural or mental andlegislative barriers to the principle of re-use. Product labelling, safety regulations, materialtraceability requirements etc. present practical hurdles to the re-use of “second” handcomponents. Also client expectations are generally towards buying new rather than second-hand.This means that the markets that exist in countries like Bangladesh, India or China for the resaleof components, such as valves, pumps, generators and washbasins to name just a few examples,do not exist to any meaningful extent within these Western European countries. The exceptionmay be that of spares and reconditioned components for ships in operation. However, this is ahighly specialised area and represents a very limited market.
It can be seen therefore that adoption of the current ship practice of maximum separation wouldoperate at a disadvantage in several respects, including:
• Additional costs of adopting SHE compliant practices• Cost of separation

DET NORSKE VERITAS – APPLEDORE INTERNATIONAL
Report No: 2000-3527, rev. 01
FINAL REPORT
Page 48Reference to part of this report which may lead to misinterpretation is not permissible.
22 February 2001, B/feasibility study ship scrapping final report 21feb01.doc
• Non-availability of local re-use markets and the revenue streams associated withthese
There are other characteristics of ships that need to be taken into consideration when evaluatingthe overall economics of scrapping in comparison to recycling technology in other sectors.Firstly the physical scale of the item to be recycled and some of its component parts presentssome problems. The ship’s structure itself, which is predominantly steel is too large and heavy tobe easily handled or transported. Additionally, this structure itself is designed to haveconsiderable strength and rigidity. Crushing or compacting technology that is used in otherindustries cannot therefore be readily applied to reduce the physical size of the unit for transport– so unlike car bodies it is not practicable to crush the ship’s hull. Even after cutting into smallersections, the ship’s structure is likely to be very space consuming. Continuing with the carcomparison, specialist units exist for recycling car engines, however the physical size of ship’sengines (or the sub-units of these) and most auxiliary machinery is both heavier and larger.
All in all it is hard to find a comparison of items of similar size, structural strength and weight,and complexity to ships within existing recycling practice. Even large buildings like hotels orpower stations are more easily reduced to manageable size by demolition (impact or explosion).
The scale problem is also dominant at the bottom of the recycling chain with disposal.Traditionally disposal by landfill was considered the option for items which are not harmful inthemselves, but for which the cost of recycling is high. Landfill undesirability in currentrecycling terms is reflected both in the legislation requiring re-use or recycling and also in theescalating costs of landfill. In such instances the materials are compacted to reduce the volume.It is evident however that the physical space required of to dispose of some 100 - 250 ships peryear even if the question of compaction could be addressed is enormous. Perhaps, the marineequivalent of landfill has been the practice of sinking vessels at sea, however such activity has tobe licensed and increasing environmental awareness and legislation over the protection of themarine environment would suggest that this practice is not an option for the future.
It would seem therefore that adoption of the traditional scrapping practices within Europeancountries is not a practical option given the costs of separation and the absence of secondarymarkets for components. The approach that has been adopted for the basis of this report istherefore the adoption of limited separation into a number of primary waste stream categories forrecycling rather than re-use.

DET NORSKE VERITAS – APPLEDORE INTERNATIONAL
Report No: 2000-3527, rev. 01
FINAL REPORT
Page 49Reference to part of this report which may lead to misinterpretation is not permissible.
22 February 2001, B/feasibility study ship scrapping final report 21feb01.doc
6 MATERIAL COMPOSITION AND RETURN TO MARKET
6.1 BackgroundThe overriding culture of recent times is that as a society, it is no longer acceptable to dispose ofmaterials in a fashion which may cause harm to our environment, or to the future generations.Furthermore, the justification of applying the principles of sustainability to resource managementis achieving broad acceptance and recognition in both industrial segments and also in society ingeneral. This is mirrored by the fast growing acceptance of re-use and recycling of materialswherever possible.
6.1.1 Changes in resource management and policiesTo this end there is a growing amount of legislation coming mainly from the EU, which isforcing our populations to view the way in which waste is handled. It is no longer acceptable todispose of waste to landfill or incineration without giving some thought to having the materialrecycled.
The packaging waste directive, which obligates us to recycle a percentage of all packagingwaste, and the forthcoming Waste Electrical and Electronic Equipment Directive, as well as theEnd of Life Vehicle Directive, are all forcing us to change the way that we view the disposal ofgoods when they reach the end of their useful life.
The forthcoming EU Landfill directive will obligate us to reduce the amount of waste we send tolandfill and will no longer allow us to landfill biodegradable waste (this includes paper and pulpproducts), and will also limit landfill for certain types of hazardous waste. This will lead to risingcosts for waste disposal, and a review of materials, which were once deemed uneconomic torecycle, as paying for recycling may well prove less costly than waste disposal.
Landfill charges used as incentives to improve waste and recycling management in Europe, arestill reasonably low. In the UK the cost of disposing of controlled waste is $26 per tonne rising to$45 per tonne for hazardous waste. An increase in tax of $1.50 per tonne every year for the nextthree years has already been approved, and as regulations on landfill operators become moreonerous, landfill charges in general are expected to rise at a faster rate than this.
Incineration of certain materials is also an option. Mainstream incinerators require huge capitalinvestment and long term contracts for both waste and delivery of the energy its provides. Theestablishment of such plants require permissions which often have proven difficult to obtain dueto objections from surrounding communities.
The change in attitudes towards, and methods of waste disposal, mean that goods, which mayonce have had a residual value when they reach the end of their working life, such as motorvehicles, will now cost for disposal.
6.1.2 Changing provisions for ship scrappingFor a ship, the governing parameters differ according to category and size as visualised inTable 6-1. Policies and decisive factors on these issues are elaborated upon in chapter 3.
The methods applied in the merchant fleet have developed from the prime objective of profit-making, and thus, this has been the main driver on shaping the concept of current scrapping

DET NORSKE VERITAS – APPLEDORE INTERNATIONAL
Report No: 2000-3527, rev. 01
FINAL REPORT
Page 50Reference to part of this report which may lead to misinterpretation is not permissible.
22 February 2001, B/feasibility study ship scrapping final report 21feb01.doc
procedures. Media exposure and growing awareness materialising in new policies are howeverintroducing new views and may slowly impact the established scrapping principles. For theremainder categories, other parameters have had an impact on the process of decommissioningand scrapping.
In general, material composition determines the recycling potential and further the challengesassociated to the required extraction processes for complex products. Re-use/ recycling may notbe restricted to the re-use of single components or the recycling of material (steel) arriving fromstructure, but may imply partial demolition and re-use of major elements of the originalstructure. Examples might be the re-use of offshore modules at new locations or partialdemolition of a vessel and utilisation of structure as artificial reefs or as diving objects (seesection 6.3 for further examples). The use of partial demolished vessels may be regulated bynational or internationals regulations, i.e. the London Convention (convention on the preventionof marine pollution by dumping of wastes and other matter).
Table 6-1 Governing parameters for scrapping in four categories
Vessel category Parameters governing scrapping practices Comments
Offshore structures Policies, media exposure, regulations Oil majors environmental policies.
Merchant world fleet Economics, size Profit-making, third world employmentopportunities, international conventions.
Navy fleet Politics/ policies Comprehensive decommissioningprocedures and (inter-) national politics.
Inland fleet Economics, size, geography Size limits geographical scrappingopportunities.
6.1.3 Minimising waste – maximising recyclingThe waste streams for all four vessel categories are dominated by the contribution of steel. Eventhough the remaining materials will differ both with respect to value in the recycling chain andon requirements in association to waste handling for different vessel categories, it is assumedthat the merchant fleet will reflect the broadest of scenarios. This and the comprehensivedominance of the merchant fleet in the scrapping context, is reflected in the following.
In terms of ship scrapping, there is the potential to create massive annual volumes of materialsfor re-use, recycling or disposal. A significant proportion of this waste stream is steel for whichrecycling options exist. However, there is also a considerable volume of other materials whichmust be catered for. The following sections assess the composition of materials under mainprimary waste streams and look at requirements and options available for re-use, recycling ordisposal. This forms the basis of the economic analysis presented in chapter 9.
6.2 Material composition and waste streamsBeside type and size, the required functions of a specific vessel will be determining for theconfiguration of onboard materials and systems and consequently the waste stream configurationwhich will influence requirements for the scrapping facilities.

DET NORSKE VERITAS – APPLEDORE INTERNATIONAL
Report No: 2000-3527, rev. 01
FINAL REPORT
Page 51Reference to part of this report which may lead to misinterpretation is not permissible.
22 February 2001, B/feasibility study ship scrapping final report 21feb01.doc
6.2.1 Material composition complexityTo enable assessments of waste streams and quantities from the dismantling process, the vesselhas been segmented into spaces:
A Cargo spaces
B Machinery spaces
C Accommodation spaces
The composition of these spaces in terms of complexity/ density of components and materialcomposition varies significantly. The ABC approach allows simple breakdown as function ofmaterial composition complexity and allows waste stream quantification to be undertaken.
The cargo space areas represent large low density volumes of the vessels bounded by shipsstructure and containing mostly only simple items such as pipework and outfit steel includingladders and hatch covers. There may also be limited amounts of cabling, instrumentation andselected machinery items.
The machinery space areas represent steel structure surrounding high-density areas comprisingpredominantly heavy machinery items including the main engines, generators, auxiliarymachinery and pipework. There will also be significant electrical cabling, electronic equipment,instrumentation, insulation and outfit steel in such areas. Overall, a far greater diversity oforiginal materials will be present than in cargo, tank or void spaces.
The accommodation space areas however whilst also high-density areas surrounded by(generally lighter scantling) steel structure have a marked difference in the compositioncomprising hotel outfit (furniture, furnishings, sanitary) within joinery sub-divided areas,together with electrical and electronic equipment and controls in the navigation and domesticareas. These areas require high levels and complex utility provision involving pipework,electrical cabling, ventilation trunking and comfort insulation.
Different ship types will have different mixes of these three area types and further, thecomposition within the areas will differ accordingly.
For simplicity, the total steelweight of the vessel has been included in the A category togetherwith any outfit in those areas. The total lightweight of the vessel can be considered to comprise:
LIGHTSHIP = A (STEELWORK/ OUTFIT)+ B (MACHINERY/ OUTFIT) + C (JOINERY/ OUTFIT)
Different ratios by weight for different vessel types are presented in Table 6-2. This can be usedas a basis for calculating an illustrative ‘average’ composition reflecting the mix of ship types inthe fleet.
An average “ship” can be identified based upon the composition of the world fleet into thesedifferent ship types and a weighted average calculation for the relative weight breakdown. Theabove calculation has defined this average vessel composition by weight as:
Lightship = (75% A) + (12.5% B outfit) + (12.5% C outfit)

DET NORSKE VERITAS – APPLEDORE INTERNATIONAL
Report No: 2000-3527, rev. 01
FINAL REPORT
Page 52Reference to part of this report which may lead to misinterpretation is not permissible.
22 February 2001, B/feasibility study ship scrapping final report 21feb01.doc
In the following sections the major component waste streams for ships have been identified andthe relative mix of these for each of the above 3 categories estimated.
Table 6-2 Different ABC ratios by weight for different vessel typesShip Type Lightship
TonnesA%
B + C%
Cargo ship 400,000 dwt 53,500 85% 15%Cargo ship 200,000 dwt 29,400 84% 16%Cargo ship 100,000 dwt 18,300 80% 20%Cargo ship 70,000 dwt 16,700 77% 23%Cargo ship 20,000 dwt 8,300 69% 31%Cruise vessel 2,000 pax 23,000 44% 56%Pass/RoRo ferry 985 59% 41%Fishing vessel 1,416 30% 70%Offshore supply 765 51% 49%Dredger 2,379 63% 37%‘Average fleet vessel’ 100% 75% 25%
Ship dismantling requires the redundant product to be broken down into component materialwaste streams for recycling. Such waste streams can be considered as falling into threecategories:
• Revenue generating• Requiring disposal or safe processing for which there is a cost• Neutral cost disposal
The purity of the waste streams will generally affect its potential value where revenue generationis possible. However, separation is required to achieve such purity, which involves processingcost arising out of a labour intensive process. An economic balance exists therefore betweenvalue of the waste streams and cost of separation.
6.2.2 Waste streamsFor each stream it is necessary to establish the disposal route from the dismantling yard. Inenvironmental terms the hierarchy is:
• Re-use• Recycle• Disposal
Table 6-3 identifies the primary waste streams that have been used in this study for the purposeof quantifying the waste output and net revenue/ cost of this. The content of the “waste streamlist” includes a variety of different substances commonly found in all four vessel categories, butmay also contain substances that are relevant only for specific vessel categories or particular shiptypes.

DET NORSKE VERITAS – APPLEDORE INTERNATIONAL
Report No: 2000-3527, rev. 01
FINAL REPORT
Page 53Reference to part of this report which may lead to misinterpretation is not permissible.
22 February 2001, B/feasibility study ship scrapping final report 21feb01.doc
Table 6-3 Waste streams from ship scrappingMaterial stream Where is it found on board a vessel?Ferrous scrap metal Outfit and structural steel, hatch covers, pipes and pipe fittings, castings
(stern frame), anchor and chains, propeller shaft, rudders, wires, sheetmetals, tanks (non-integrated)
Nonferrous scrap metal Copper: cables, pipes, motor windings, fittings, domestic pipework, etc.Aluminium: anodes, wheelhouseZinc: anodesSpecial bronze: propellers, fittings
Machinery Main engine, auxiliary engines, pumps, generators, boilers, separators,steering gear, deck machinery, cranes, etc.
Electrical and electronic equipment Switchboards, consoles, control panels, navigational aids, domesticelectrical items, instruments, sensors, etc.
Minerals Asbestos and mineral wool for insulation, ceramics (domestic sanitaryequipment), concrete, tiles, glass, windows etc.
Plastics Plastic pipework, fittings, furniture, light fittings, life boats, rafts, etc.Liquids, chemicals and gases Fuels, fuel oils, lubrication oils, hydraulic fluids, polluted waters,
refrigerants, cargo residues, sludges, chemicals, etc.Joinery Timber, joinery bulkhead and deckhead panels, accommodation doors and
frames, furniture and furnishings, composite timber products, etc.Miscellaneous wastes Domestic wastes, radiation sources (equipment, scale), mercury (i.e. in level
switches, light fittings, thermometers), batteries, marine growth (fouling/ballast water and sediments)
6.2.3 Material stream – quantities and qualitiesFor the offshore category, volume data on material and waste streams from a number ofinstallations in the North Sea has been compiled in order to establish generic waste streamestimates for a “unit installation”. This represent a coarse simplification since all installationsare different, hence the data produced must be used keeping this in mind (ref. /25/).
In order to establish some generic norm in relation to volumes from the merchant fleetcategory, lightship data and empirical formulas have been adopted enabling the quantification ofmain contributing categories (steelwork, machinery, accommodation, etc). By applying detaileddata arrived from a case vessel (ref.: /19/), a further breakdown in order to estimate the identifiedwaste streams has been made.
The diversity of the naval and inland waterway fleets makes waste stream quantification adifficult task. Further, looking at the volumes they generate compared to that of the sea-goingmerchant navy, their contribution becomes negligible. Material quantities from these categoriescan be estimated by using the data arriving from the merchant fleet and the volumes (tonnage)arriving from naval and inland waterways.
Basis and data used in the quantitative assessments are presented in Appendix B.
The fleet of merchant vessels is by far the largest provider of waste streams and hence representsthe obvious opportunity with respect to the development of cost effective solutions. The studyhas therefore concentrated efforts on assessing the potentials of this category.

DET NORSKE VERITAS – APPLEDORE INTERNATIONAL
Report No: 2000-3527, rev. 01
FINAL REPORT
Page 54Reference to part of this report which may lead to misinterpretation is not permissible.
22 February 2001, B/feasibility study ship scrapping final report 21feb01.doc
6.2.3.1 Ferrous scrap metal – Non-ferrous scrap metalSteel scrap represents the largest recyclable fraction from the merchant fleet and is commonlyclassed as ferrous scrap, of which the largest proportion is so-called “carbon steel”. Non-ferrousscrap, often of particular interest due to it’s relatively higher value, comprises metal scrap ofalloys.
The scrapping facility may recycle scrap metal by selling it to a re-smelting/ re-rolling companyor a scrap metal broker.
At the present time, there is an international standard maximum size for steel scrap ofapproximately 1.5 x 0.5 x 0.5 metres. The projected volume from a ship dismantling facilitywithin Europe would provide a major single source of scrap steels, the like of which we believedoes not currently exist. It is not clear whether a dedicated stream of waste of such magnitudewould change this limitation, however current furnace technology does impose geometricconstraints.
The amount of steel will vary according to ship type. The steel fraction will typically increase ascomplexity is increased and size reduced.
Copper represents a high value commodity and markets exist for recycling and reclaiming scrapcopper. One of the major sources of copper in a ship is electrical cabling. Such cable is recycledby stripping off the insulated covering and other layers to recover the copper. Dedicated cablestripping machines exist for such tasks. The resulting copper can be sold as scrap and theinsulation material would add to the relevant waste stream (most often this will be that ofplastics, however, insulation may be consist of other materials). Alternatively the cable can besold to an intermediary for such separation. Another main source of copper is from electricmotor windings. Copper may arrive from the waste stream of electrical and electronicequipment. Copper pipework can be sold directly unless highly contaminated.
It is important to separate copper and other non-ferrous metals from the scrap steel, as copper isa major contaminant in the steel making process. Further, it may be required to treat insulationwaste as hazardous waste as certain cable types have insulation components that belong in thiscategory.
Special bronzes alloys used in e.g. the manufacturing of propellers are equally valuable and aresought after in the recycling market.
Anodes are fitted to both the vessel’s hull and inside tanks in order to protect against corrosionand fouling. Anodes consist mainly of aluminium (Al) and zinc (Zn), but may also include smallamounts of other metals, such as Cu, Fe, and Hg. Anodes are sacrificed over a space of time andthe amount of metals left when the ship arrives for scrapping will reflect its history ofmaintenance. Currently, anodes are often removed and sorted for reuse/ resale. Heavily corrodedanodes are disposed of as waste, if recycling is not a feasible option. The removal of the anodeswill in itself not generate any adverse effects on humans or the environment, since Al and Zn arenon-toxic in their solid states (ref.: /19/).
Note that anodes should avoid being mixed with steel scrap as it represents a source forcontamination in the steel recycling process.

DET NORSKE VERITAS – APPLEDORE INTERNATIONAL
Report No: 2000-3527, rev. 01
FINAL REPORT
Page 55Reference to part of this report which may lead to misinterpretation is not permissible.
22 February 2001, B/feasibility study ship scrapping final report 21feb01.doc
6.2.3.2 MachineryThere are many items of machinery on board a ship, ranging from the main engine itself, throughauxiliary generators to smaller items like pumps and separators. These items comprise mainlymetal bodies, and specialist operators exist which will take machinery for recycling. If suchmachinery is free from fuel oils, lubrication oils, greases, etc. a potential revenue stream exists.However, if cleaning is required a charge or expense will be incurred. Discussions withrecyclers indicate that cleaning would probably not be required for most ship machinery.
It is envisaged therefore that most ship machinery could be saleable for revenue. Once again thequestion of scale exists, ships’ main engines in particular, are likely to be far larger thancomparable items of machinery currently recycled, so it is envisaged that dismantling intocomponent parts may be required.
6.2.3.3 Electrical and electronic equipmentAt present, there is no existing scrap market for such items or specialist disposal operators. It isenvisaged therefore that such items would represent a disposal cost to the process. However, aslegislation evolves from the forthcoming Waste Electrical and Electronic Equipment (and other)directives, - it may well be that specialist operators will emerge for the disposal of such items.There is some evidence for this happening for computers.
6.2.3.4 MineralsA wide range of mineral items exists on board ships, especially in the accommodation areas. Ingeneral terms, mineral materials are suitable for recycling into aggregates. However, in currentmarket conditions, there would be a charge made for such material by a specialist processor orintermediary. Through use of an on-site crushing facility it should be possible to achieve aneutral cost stream and future changes in legislation may well turn this into a revenue stream.Specifically there are some mineral wastes that are classified as controlled or hazardous wastesfor which specialist disposal would be required. These include mineral wool and insulationmaterials, which are classed as controlled wastes, but which may soon be upgraded to hazardousclassification.
Asbestos-containing material (ACM) may be found in thermal system insulation and onsurfacing materials. Some other applications may also be found. The use of asbestos in shipbuilding may have continued into the 1980s despite the introduction of regulations already inplace in the latter half of the 1970s. Regulations on asbestos and the SHE aspects of asbestos areelaborated upon in chapter 6.2.4.1.
6.2.3.5 PlasticsIncreasingly, plastic materials are used in vessels, particularly in accommodation areas. Plasticsused for example in furniture and fittings are likely to comprise of several polymers or to becontaminated with other materials such as textiles or metals, rendering them unsuitable forrecycling. It is considered therefore that the majority of the plastic waste streams from vesselsare generally going to require disposal for which a disposal cost is envisaged. Certain specificitems such as cable coverings may be suitable for recycling, but this is likely to be the exceptionrather than the rule.
Polyvinyl chlorides (PVC) are used in a wide variety of products for different applications andare commonly found in cables, floor coverings and plastic devices of different types. PVCcontains more than 50% chlorine, and may contain environmentally hazardous additives. A

DET NORSKE VERITAS – APPLEDORE INTERNATIONAL
Report No: 2000-3527, rev. 01
FINAL REPORT
Page 56Reference to part of this report which may lead to misinterpretation is not permissible.
22 February 2001, B/feasibility study ship scrapping final report 21feb01.doc
complex mixture of fumes and gases is generated when PVC is burned. This includes largequantities of hydrogen chloride gas that can react with water vapours and form hydrochloric acidin the lungs, as well as carbon monoxide, dioxins and chlorinated furans. Dioxins are among themost toxic substances known.
6.2.3.6 Liquids, chemicals and gasesReclaimed fuels, hydraulics and lubricating oils have a residual value, however the costs ofrecovering/ cleaning these can be significant and is likely to offset any such revenue. It isenvisaged that much of the liquid wastes could be processed in a conventional tank farmarrangement allowing the recovery of any oils through separation for re-use or resale by the yard.It has been assumed that these would be recyclable but without revenue or cost to thedismantling yard. It is unlikely that shipowners will deliver ships with significant volumes ofuncontaminated fuels, and where these exist it is likely to be compensated for in terms of thenegotiated price of the vessel.
Coolants and refrigerants can often be sold for re-use, but the equipment needed to recover theseis fairly specialised and in low volumes it is likely that there would be a cost for the removal ofthese by a specialist operator. However, the introduction of regulations (MARPOL, Annex VI)may require such substances to be delivered to waste reception facilities.
The vessels piping and tank arrangements will generally contain some quantities of oil, fuel,sludge and associated residues. Fuel oil may be found in both integrated and free-standing tanksthroughout the ship. Lubricating oils may be found in a variety of tanks depending on theirindividual use. System oils are typically located in engine room sump tanks, whilst cylinder oilsmay be stored in separate purpose tanks. Lubrication oils may also be stored in drums. Tankersmay arrive at the scrapping facility with a significant quantity of cargo residues. Further, alltanks may contain a certain level of sludge.
The primary danger in handling oil and fuel on ships is that of fire. Still, it should be noted thatoil and fuel represent certain toxic hazards. Both petroleum products and non-petroleum oils canhave adverse and well documented effects on the environment. Note that local/ nationalrequirements may require notification to authorities on installation as well as on use, includingfire regulations for the storage of flammable or combustible liquids and further on financialresponsibilities.
Used oil may be defined as oil that has been refined from crude oil or made from syntheticmaterials, and that contains physical or chemical contaminants as a result of being used. Usedoil should not be mixed with other wastes as this may require the entire volume to have to bemanaged as hazardous waste. The most environmentally friendly and often most economical wayof managing used oil is recycling. Oil and oily wastes that are defined as hazardous waste, eitherby definition (e.g. appearing on “target lists”) or by having hazardous waste characteristics(ignitable, corrosive, reactive or toxic) and must be managed according to governing nationalhazardous waste regulations.
Other chemicals requiring particular attention and affecting the requirements of the process andhence the revenue streams are:
- Glycol and water- Different chemicals for injection- Methanol for injection

DET NORSKE VERITAS – APPLEDORE INTERNATIONAL
Report No: 2000-3527, rev. 01
FINAL REPORT
Page 57Reference to part of this report which may lead to misinterpretation is not permissible.
22 February 2001, B/feasibility study ship scrapping final report 21feb01.doc
- AFFF foam- Dry powder in fire extinguishers- Solvents/ thinners- Battery electrolyte- Evaporator dosing and de-scaling acids- Corrosion inhibitor- Fresh paints
6.2.3.7 Joinery related productsWhere timber, wood and associated materials exists on a ship, this can generally be reclaimedand sold to intermediary resellers. However, in modern ship designs, much of the joineryproducts are of a composite nature and may be contaminated by vinyl, plastics, rubber, etc. It islikely that this would have to be disposed of at a charge, although wood recovered fromshredding can generally be disposed of at no cost to recycling centres. An alternative to disposalis incineration, which can provide a low cost alternative energy source. MDF is not recyclableand would require disposal.
6.2.3.8 MiscellaneousBilge and ballast water
Bilge water is stagnant water mixed with potentially polluting liquids, that has drained to thelowest inner part of a ship’s hull (i.e. the ship’s bilge). Bilge water is often referred to as oilywaste as it may contain oil and grease, in addition to other pollutants (inorganic salts, and metals,such as arsenic, copper, chromium, lead, and mercury). More bilge water may be accumulatedthrough rainwater during ship scrapping.
Ballast water is fresh, brackish or marine water that intentionally has been brought on board aship in order to adjust the ship’s stability and trim characteristics in accordance to accommodatevarious operating conditions. Ballast water may contain pollutants, such as residual fuel,biocides, oil and grease, petroleum hydrocarbons, and metals (e.g. iron, copper, chromium,nickel, zinc). Ballast water in cargo tanks (oil) is often referred to as dirty ballast water.
Transport of large volumes of water containing organisms from shallow, coastal waters acrossnatural oceanic barriers can cause massive invasions of neritic marine organisms. Because ballastwater is usually taken from bays and estuaries with water rich in animal and plant life, mostships carry a diverse assemblage of organisms in their ballast water. Viable organisms isolatedfrom ballast water discharges, include fish, crustaceans, molluscs, polychaete worms, arrowworms, coelentarates, sea squirts, toxic dinoflagellates, diatoms, virus and bacteria. Aggregatedsediments typically found in ballast tanks will contain living species reflecting the trade historyof the vessel. The discharge of ballast water/ sediment species into the coastal sea-area in thevicinity of, or at the scrapping site, may carry the potential of introducing unwanted organismsthreatening the ecological balance in the seas in the area and thereby introducing a direct threatto biodiversity. Ballast water can be the source of viruses and bacteria transferred to humanscausing epidemics (ref.: /29/).
The facility should determine the pollutant concentrations in bilge and ballast water prior todischarge. Further, the ecological aspects of ballast water discharge should be considered. Bilgeand ballast water may be transferred to onshore storage tanks, evaporation pits (ballast water

DET NORSKE VERITAS – APPLEDORE INTERNATIONAL
Report No: 2000-3527, rev. 01
FINAL REPORT
Page 58Reference to part of this report which may lead to misinterpretation is not permissible.
22 February 2001, B/feasibility study ship scrapping final report 21feb01.doc
only) or discharged directly overboard. National discharge regulations may apply and mayspecify which pollutants to analyse for and provide permitted levels of the contaminants. Inaddition the MARPOL convention, Annex I, also provides regulations for permissible levels ofoil in discharged ballast water. Discharge of ballast water should in general be avoided if notanalysed and found not to represent an ecological threat. Note that additives, such as sodiumchromate, sometimes are used for both ballast water and bilge water in order to prevent algalgrowth during a ship’s operation. A high chromium concentration would make the ballast waterhazardous waste. Ballast water sediments should be assessed equally and may consequentlyrequire to be handled as hazardous waste.
The cost assessment assumes that the handling of bilge water, ballast water and sedimentsrepresent a neutral cost element.
Freon
Freon (a Du Pont trade name for chlorofluorocarbons) (CFC), compounds of chlorine, fluorineand carbon, are nontoxic, nonflammable and stable in the troposphere, whereas in thestratosphere, they can be broken down by UV light and deplete the ozone layer. CFCs are usedas refrigerants, solvents and foam blowing agents. Shipborne CFCs have been believed tocontribute up to 10% of global emissions. The United States, Canada, and the Scandinaviancountries imposed a ban on the use of CFCs in aerosol-spray dispensers in the late 1970s. In1987, 27 nations signed the Montreal Protocol, which is a global environmental treaty onreducing substances that deplete the ozone layer. Several amendments have followed, and theuse of CFCs, some chlorinated solvents and Halons (chemicals used as fire extinguishing agents)should therefore become obsolete in the next decade (ref.: /30/). These products and restrictionsassociated with their use are also addressed in MARPOL (Annex VI).
The handling of Freons represents a cost.
Paints and coatings
A comprehensive selection of different paints and coating products are present on board a vessel.These products are used both on the exterior and the interior and may have characteristicsrequiring certain precautions with respect to the demolition process. Paints can be flammable andmay contain toxic compounds (PCBs, heavy metals (e.g. lead, barium, cadmium, chromium, andzinc), and pesticides). Paints with metallic compounds are used to protect ship surfaces fromcorrosion. Pesticides, such as tributyl tin (TBT) and organotin are still commonly in use onsubsurface hull in order to prevent fouling. Fresh paint for maintenance purposes may also befound on board (see chapter 6.2.3.6).
Removal of paints prior to cutting during ship scrapping may not be necessary unless the processwill lead to the release of toxic compounds or if the paint is highly flammable.
Paint follows the flow of steel and hence is “exported” to the steelworks away from thedemolition facility. Measures including paint removal or emission cleaning may be requiredprior to or during recycling (at steelworks).
Batteries can contain heavy metals such as Pb, Cd and Ni. Lead-acid batteries also containsulphuric acid, which is corrosive and can cause severe burns. There are batteries in flashlights,mobile radios and electrical equipment, but the largest volume of batteries (lead-acid batteries) isfound in radios, intercom, fire alarms, emergency start equipment and lifeboats. Batteries inworking order will most often be sorted and sold for reuse. Lead represents a considerable value

DET NORSKE VERITAS – APPLEDORE INTERNATIONAL
Report No: 2000-3527, rev. 01
FINAL REPORT
Page 59Reference to part of this report which may lead to misinterpretation is not permissible.
22 February 2001, B/feasibility study ship scrapping final report 21feb01.doc
in itself, and there is therefore reason to believe that the batteries could be recycled regardless oftheir condition. If batteries are undamaged, they will not have an environmental effect.However, improper disposal of batteries can cause a threat to human health and the environment(ref.: /19/).
6.2.4 Waste streams and SHE aspectsThe extraction of materials as described under chapter 6.2.3 introduces a number of issues ofSHE-nature. Some of the onboard substances (integrated in products or systems) are harmful inthemselves whilst the actual extraction process may introduce scenarios generating suchsubstances. Further, workers safety is an item to be considered in all of the operations incurringduring demolition.
6.2.4.1 AsbestosAsbestos-containing material (ACM) may be found in thermal system insulation and onsurfacing materials. Some other applications may also be found. When ACM is deteriorated ordisturbed, asbestos breaks up into very fine fibres that can be suspended in the air for longperiods and possibly inhaled by workers and operators at the facility or by people living nearby.The most dangerous asbestos fibres are too small to be visible. Once they are inhaled, the fibrescan remain and accumulate in the lungs. Breathing high levels of asbestos fibres can lead to anincreased risk of lung cancer, mesothelioma (a cancer of the chest and abdominal linings), andasbestosis (irreversible lung scarring that can be fatal). The risk of lung cancer and mesotheliomaincreases with level of exposure. Symptoms of these diseases do not show up until many yearsafter exposure. Most people with asbestos-related diseases have been exposed to elevatedconcentrations in connection with their work.
When health hazards associated with asbestos were revealed in the late 70’s, legislation on theuse of asbestos was initiated. The US EPA regulation on asbestos dates back to 1989, but wasamended in 1991 leaving only six asbestos-containing product categories subject to the asbestosban (corrugated paper, rollboard, commercial paper, speciality paper, flooring felt, and new usesof asbestos). In addition, several uses of Asbestos Containing Materials (ACM) remained banned(spray-on applications of asbestos (> 1% asbestos) and certain types of asbestos-containinginsulation). The European Commission imposed a ban on the remaining use of asbestos throughthe Asbestos Directive in 1991. This prohibits the use of 5 out of 6 types of asbestos. Theremaining type (white, chrysotile) was banned in 14 categories of asbestos. A full and completeasbestos ban will enter into force across the EU no later than year 2005. It should be noted that anumber of states around the world imposed strict regulations on the use of asbestos at a muchearlier stage. Denmark was a pioneer in this area when a ban for the use of asbestos wasintroduced in 1972. Sweden banned marketing of certain asbestos products in 1975 and followedup by a product ban in 1976 (crocidolite, or blue asbestos). The Netherlands followed in 1977and then a string of nations revealed new stricter regulations on marketing, manufacturing andthe use of different asbestos products.
Asbestos removed from a ship is still not necessarily regulated as hazardous waste. In fact, insome countries asbestos is recovered by manual crushing and then re-casted for re-use (ref.:/20/). Depending on national regulations, the scrapping facility must accommodate to whateverrequirements there may be. However, the potential health impacts associated with the use ofasbestos are of such severe nature that minimum precautions are necessary. This includes theprotection of workers when extracting asbestos from the vessel, the securing of the disposal of

DET NORSKE VERITAS – APPLEDORE INTERNATIONAL
Report No: 2000-3527, rev. 01
FINAL REPORT
Page 60Reference to part of this report which may lead to misinterpretation is not permissible.
22 February 2001, B/feasibility study ship scrapping final report 21feb01.doc
asbestos and measures preventing asbestos to re-enter the market. If national requirements do notaddress these areas, the facility is recommended to implement an asbestos disposal plan in thewaste management plan. This should include requirements associated to the ship’s inventoryplans so that asbestos can be localised, quantified and identified prior to removal. Further, theplan should identify personal safety equipment for personnel removing the material andprocedures for both the removal as well as the disposal. Handling of asbestos should bemonitored by record keeping as well as by sampling. The facility is advised to refrain fromselling asbestos to re-enter the market.
All ACM must be removed from a ship being scrapped before any activity that would disturb thematerials is carried out. Processes producing asbestos dust must be isolated. To preventdispersion of dust and debris containing ACM, control methods, such as vacuum cleaners and/ orlocal exhaust ventilation equipped with HEPA filters must be used. The ACM to be removedmust be adequately wet when removed and must remain wet until it has been collected andcontained (in leak-tight containers) for disposal, unless the material is contained in leak-tightwrapping. The ACM should then be carefully lowered to the ground. Properly labelled leak-tight containers with lid are required to be used for the transport of asbestos from the extractionsite to the disposal area. Typically, asbestos is disposed of by burying it in the ground.
Asbestos may be found in considerable amounts on board. Sampling has revealed quantities inthe region of 7 – 11 tons for vessels in the size category 100,000 – 250,000 dwt. It should benoted that vessel size is not necessarily decisive for heat insulation requirements.
6.2.4.2 PCBsPCBs are found in a variety of equipment and materials including cable insulation, thermalinsulation material, transformers, capacitors, oils, paints, plastics and rubber products, etc. PCBsare toxic and persistent in the environment and have been shown to cause a number of adversehealth effects. The toxicity of chemicals produced when PCBs are heated (polychlorinateddibenzofurans and polychlorinated dibenzo-p-dioxins) is of special concern, as they are believedto be even more toxic than PCBs themselves.
Transformers are either oil cooled or air-cooled. An offshore unit platform will on average haveone oil cooled transformer. The oil in the transformer may have PCB-containing oil. Sometimesthis oil has been changed during maintenance, and hence the PCB-containing oil may have beenreplaced. It should be noticed that there might be traces of PCB in the changed oil.
PCB has been found in various concentrations in cable insulation by independent investigations(see section 6.2.3.1, and ref.: /20/ and /24/). Recently revealed maximum PCB-concentrationsfrom cable samples taken from vessels during scrapping at 280.000 ppm (28%) is alarminglyhigh. Based on this, it seems reasonable to suggest that the configuration of cable insulationarriving from vessels being decommissioned will most likely contain PCB in some quantities.Improper processing of cables in order to extract copper by burning off the insulation(commonly used in scrap facilities in Bangladesh and India) may lead to the release ofparticularly hazardous components to the environment and must be avoided.
The production of PCBs in the USA ceased in 1979 following new regulations. In Europe, mostcountries banned the manufacturing of PCB in the early 1980s (1978-1982) and phase-outregulations on use of PCB are in place. A global campaign aiming at prohibiting all use of PCBis ongoing. International trade of PCB is regulated in the Rotterdam Convention.

DET NORSKE VERITAS – APPLEDORE INTERNATIONAL
Report No: 2000-3527, rev. 01
FINAL REPORT
Page 61Reference to part of this report which may lead to misinterpretation is not permissible.
22 February 2001, B/feasibility study ship scrapping final report 21feb01.doc
Wastes containing PCBs at a concentration level of 50 mg/kg or more are considered hazardouswaste by the Basel Convention. As a precaution, it may be feasible to remove all known andsuspected PCBs and PCB-containing material, or conduct sampling and chemical analysis ofthese items and, if regulated PCB levels are present, dispose of them according to relevantnational regulations.
PCBs or PCB items to be stored must be placed in proper containers, covered and labelledaccording to the relevant regulations. PCB-containing waste may be disposed of by incineration(licensed) or at special landfills. Disposal requirements may be dependent upon the nature of thesource and its concentration.
6.2.4.3 Radiation sourcesRadioactive material may be present on board a ship in liquid level indicators, smoke detectorsor emergency signs. These sources generate low-level radioactive waste, but handling anddisposal of such waste is usually strictly regulated. Ionising radiation is hazardous to humanhealth and the environment and can cause severe forms of cancer and/ or damage to geneticmaterial endangering future generations. Any release of radioactive material could increase theradiation exposure to the population and must therefore be avoided.
Radioactive deposits, often referred to as low specific activity (LSA) scale, formed inside vesselsand pipework, is a well-known problem on oil production facilities. These deposits containelevated levels of radioactivity, mainly 226Ra, 228Ra and their daughter products, however theexact concentration and composition of the radionuclides in the scale varies with the source rockand the extraction depth of the oil.
The radium is tightly bound to the lattice structure of the Ba/Sr/Ca SO4 and CaCO3 in the scale.Of the radionuclides present in the scale in significant concentrations, 226Ra has the longest half-life of 1,620 years. The remaining nuclides have considerably shorter half-life, most of themfrom days to seconds, and because of the slow transfer rates to surface water relatively highlevels could be introduced to the sea without any measurable effect at greater distance from thesource. However, release of 226Ra could potentially lead to increased dose rates to man throughe.g. consumption of seafood. Radionuclides are naturally present in the aquatic environment, andall aquatic organisms have evolved and developed in the presence of a background radiationexposure. Human activities have resulted in the introduction of additional quantities ofradionuclides into the marine environment. The radionuclides present in LSA scale are of naturalorigin and therefore indistinguishable in kind, but not necessarily in quantity from thosenaturally present in the marine environment.
The water solubility of scale is very low, and it is estimated to be 6.5 x 10⁻³ % in distilled water.It is also estimated that it will take 800 years to dissolve a 1-cm layer of scale. Because of thislow solubility, the dissolved scale will be very diluted, and it is assumed that an effect ofradioactivity only will be relevant in the vicinity of the scale deposits.
It is recommended that as much LSA scale as possible is removed prior to platform removal/dismantling (ref.: /31/).
6.2.4.4 MercuryMercury is a toxic heavy metal and a persistent, bioaccumulative pollutant that affects thenervous system. On board ships, mercury can be found in thermometers, electrical switches andlight fittings. Accidental spills of mercury can lead to dangerous mercury exposure.

DET NORSKE VERITAS – APPLEDORE INTERNATIONAL
Report No: 2000-3527, rev. 01
FINAL REPORT
Page 62Reference to part of this report which may lead to misinterpretation is not permissible.
22 February 2001, B/feasibility study ship scrapping final report 21feb01.doc
Consumption of contaminated fish is also an important route of mercury exposure. Mercury mustbe handled as hazardous waste according to national regulations.
6.2.4.5 IsocyanatesThese are often used in spray-painting and polyurethane coating processes and may be releasedwhen hot work is applied. Occupational exposure can cause respiratory diseases and asthma.The exposure levels likely to be generated by ship scrapping activities are unknown.
6.2.4.6 Tributyl tin (TBT)Tributyl tin (TBT) is an organometallic substance used in anti-fouling paints. It can cause aneffect at low to sub-nanogram quantities per litre, and is therefore considered to be one of themost toxic compounds in the aquatic environment. Its use is now strictly controlled in most partsof the world (ref.: /32/). A study looking at the distribution of TBT in Asian waters showedhighest values in areas with high shipping activity (ref.: /19/).
6.2.4.7 Lead (Pb)Lead is toxic, and is found in batteries, paints and in components in motors, generators, piping,cables and others. The deleterious effects of lead upon human health have been commonlyknown for a long time. Young children are most susceptible to the toxic effects of lead. Long-term exposure to even low levels can cause irreversible learning difficulties, mental retardationand delayed neurological and physical development. In adults, exposure to lead affects primarilythe peripheral nervous system and can cause impairment of hearing, vision, and muscle co-ordination. Lead also damages the blood vessels, kidneys, heart and the reproductive system.
An investigation at four ship-breaking operations in Canada revealed widespread excessive leadexposure to employees. Air sampling results for lead were above recommended standards at alllocations. Another study conducted on workers from a scrapping/ shipyard in Taiwan showedthat the workers involved with steel cutting have higher lead values in blood and urine than thedock workers. The study involved 140 oxyacetylene torch metal burners and 21 dock workerswithout direct lead exposure as the control group.
Lead chromate (present in paint pigments) is documented as a carcinogen both to humans andother organisms. It may also damage embryo development and cause infertility.
Improper disposal of batteries and paints containing lead can cause a threat to health as well as tothe environment (ref.: /19/).
6.2.4.8 Marine growthThis constitutes a large amount of sessile organisms that grow on the jacket of offshoreinstallations and represents waste that has to be treated onshore. The amount of marine growthvaries depending e.g. on the water depth.
6.2.4.9 Other waste streamsIn instances where no recycling option is available, waste materials would potentially bedesignated for disposal. Two main options exist in the general recycling industry landfill and/orincineration. Comments in chapter 6.1 however explain that landfill options are likely to becomemore expensive and increasingly prohibited in an attempt to reduce landfill activity and promoterecycling

DET NORSKE VERITAS – APPLEDORE INTERNATIONAL
Report No: 2000-3527, rev. 01
FINAL REPORT
Page 63Reference to part of this report which may lead to misinterpretation is not permissible.
22 February 2001, B/feasibility study ship scrapping final report 21feb01.doc
6.2.4.10 Extraction procedures, hazardous substances and SHE-exposureThere are obvious SHE-issues requiring attention within ship scrapping. Some precautions thatmay contribute to improve general SHE-aspects within the ship scrapping industry are brieflysummarised in Table 6-4. This listing is meant to highlight the issues of SHE and is not a guidefor ship scrapping facilities.

DET NORSKE VERITAS – APPLEDORE INTERNATIONAL
Report No: 2000-3527
FINAL REPORT
Reference to part of this report which may lead to misinterpretation is not permissible.22 February 2001, B
Table 6-4 General SHE aspects within the ship scrapping industry (ref.: /28/)Dismantlingactivity
Workers exposure Measures Environmentalexposure
Measures Safety exposure
Asbestos removaland disposal
Exposure to asbestosfibres, especiallythrough inhalation, maycause asbestosis orcancer.
• Approved respirators• Protective clothing• Head covering• Gloves• Foot covering• Face shield/ goggles• Decontaminationareas and procedures
Exposure of peopleworking and living inthe neighbourhood, andmigration of asbestosfibres to bodies of water.
• Wet asbestos/ misting• Regulate area forremoval• Prompt cleanup anddisposal• Containment in leak-tight wrapping• Exhaust ventilationequipped with HEPAfilter• Enclosure ofprocesses producing dust
PCB removal anddisposal
Exposure throughinhalation, ingestion, orabsorption through theskin may cause adversehealth effects.
• Protect from exposureto airborne PCBs in theworkplace• Appropriate personalprotective clothing orequipment, dependingon removal and disposalscenario• Respirators, ifnecessary
PCBs are toxic andpersistent in theenvironment. The mostcarcinogenic PCBs tendto bioaccumulate.
• Sampling, PCB conc.> 50 ppm is hazardouswaste• Proper storagefacilities• Labelling andsegregation of PCB-containing waste• Proper transportationand disposal
Toxic furans and dioxinsare produced whenPCBs are heated, f.ex. infire-related incidents.
Bilge and ballastwater removal
Toxic organics, i.e.solvents or PCBs, maycause serious healtheffects.Discharge of toxicorganics may causerelease of poisonousgases.
• Careful cleaningbefore any hot work• Ventilation of tank/compartment and testingfor vapours and oxygenbefore entry• Training
Metal exposure:consumption ofcontaminated seafoodmay cause healthproblems.Oils and fuels maypoison marine organismsand physically soil theenvironment (birds, fish,plants, etc.).Invasion of alien aquaticspecies that may disturbthe ecological balance.
• Test for pollutants(i.e. chromium)• Proper transferequipment and booms• Proper storage anddisposal, dependent oncontamination level• Discharge permit orproper pretreatment, ifrequired• Management plans foroil spill prevention,response and recovery
Flammable vapours orgases may evolve fromresidues in tanks orcompartments.

DET NORSKE VERITAS – APPLEDORE INTERNATIONAL
Report No: 2000-3527
FINAL REPORT
Reference to part of this report which may lead to misinterpretation is not permissible.22 February 2001, B
Table 6-4 Continuing..Dismantlingactivity
Workers exposure Measures Environmentalexposure
Measures Safety exposure
Oil and fuel removal Oils and fuels mayexhibit toxiccharacteristics. Mainexposure routes areinhalation andconsumption ofcontaminated fish andwater.
• Careful cleaningbefore any hot work• Ventilation of tank/compartment and testingfor vapours and oxygenbefore entry• Training
Oils can have adverseeffects on theenvironment, f. exampleby physical damage ofwildlife and theirhabitats. Light refinedpetroleum products aretoxic and represent a firehazard. Oil spillthreatens naturalresources, birds,mammals and marineorganisms.
• Proper transferequipment and booms• Meet national storageand disposalrequirements• Management plans foroil spill prevention,response and recovery
Refined petroleumproducts represent a firehazard.
Paint removal anddisposal
Chemicals/ solventsused in stripping evolveVOCs and hazardous airpollutants. Abrasiveblasting and mechanicalremoval generateparticulates (i.e. leaddust). These emissionsare toxic and may causecancer. Main exposureroute is inhalation.
• Appropriate personalprotective equipment,incl. respiratoryprotection, and often eyeand skin protection• Test paint/ coating fortoxicity andflammability, andremove prior to cutting,if necessary• Blasting equipmentmust be regularlyinspected
Wastes (incl. blastingresidues and paint chips)may have negative effecton the environmentthrough contaminationof soil and surfacewaters.
• Proper managementand disposal of wastefrom removal of paint/coating• Measures to preventor minimise pollution ofrunoff water
Paints and coatings maybe flammable.

DET NORSKE VERITAS – APPLEDORE INTERNATIONAL
Report No: 2000-3527
FINAL REPORT
Reference to part of this report which may lead to misinterpretation is not permissible.22 February 2001, B
Table 6-4 Continuing…Dismantlingactivity
Workers exposure Measures Environmentalexposure
Measures Safety exposure
Metal cutting andmetal disposal
Torch cutting generatesfumes, smoke andparticulates (incl.manganese, nickel,chromium, iron,asbestos, and lead) thatmay have toxic effects.
• Make sure area istested and declared safefor hot work prior tocutting• Workers must usesuitable eye, hand andbody protection• Respiratory protectiveequipment and/orventilation under certaincircumstances• Clothing must notcontain flammablematerial• Noise protection• Careful handling ofcompressed gascylinders• Training
Improper storage anddisposal of scrap metaland wastes from cuttingprocesses maycontaminate soil andwater.Environmentallyhazardous fumes mayevolve when metaland/or paint is heated,f.ex. during hot work.
• Remove toxic orflammable coatings priorto cutting• Fluff from shreddingmust be stored anddisposed of inaccordance withregulations• Cable burning in openair may be prohibited• Wastewater fromcutting operations mustbe properly managed• Scrap metal that is notrecycled must beproperly managed anddisposed of
Pockets of flammablesubstances represent afire and explosionhazard when cuttingmetal.
Removal anddisposal ofmiscellaneous shipmachinery
Workers handling shipmachinery componentsmay be exposed tocontaminants, such asasbestos, PCBs, oil andfuels.
• See protectivemeasures from processesabove
Ship machinerycomponents may becontaminated withhazardous materials,such as asbestos, PCBs,oil and fuels. Improperstorage may also lead tolead contamination.
• Ship machinerycomponents must behandled, stored andreused/ recycled/disposed of in anappropriate manner toavoid contamination ofsoil, surface water andgroundwater
Oils, fuels, etc. mayrepresent a fire andexplosion hazard whenbeing disassembled

DET NORSKE VERITAS – APPLEDORE INTERNATIONAL
Report No: 2000-3527, rev. 01
FINAL REPORT
Page 67Reference to part of this report which may lead to misinterpretation is not permissible.
Feasibility Study Ship Scrapping Final Report 21feb01.doc
6.2.5 Waste stream summaryAn attempt has been made to quantify the main waste streams discussed in the subchapters 6.2.3and 6.2.4. These results are presented in Appendix B.
In order to estimate volumes for the merchant fleet, “standard vessels” representative of theforecasted scrapping demand (chapter 4.3) have been identified. These are presented inTable 6-5.
Table 6-5 Dimensions of the “standard vessels” used for estimating waste stream volumesfor the merchant fleet.Vessel type Dwt. Light. Wst Wmach Wout Wn
Standard tanker (type 1) 120,000 21,487 15,998 1,059 3,762 668Standard bulker (type 2) 52,000 15,158 9,562 889 2419 2288
Lightship weight (light.) has been estimated based on data from approximately 20 vessels (forboth types and size-groups). The steelweight (Wst) has been calculated based on empiricalapproximations (ref.: /36/). Machinery weight (Wmach) include main propulsion engine(s) andassociated systems whilst generators, auxiliary engines, etc are included in a system weightgroup (Wn). Wmach and outfit weight (Wout) are calculated based on empirical approximations(ref.: /37/) using input data (power, length and beam) from the same source as the lightshipcalculations.
The waste streams (Table 6-3) have been quantified by assessing the relative composition ofeach of the three main weight categories of the ship: A (steelwork/ outfit), B (machinery outfit)and C (joinery/ outfit) using data from the type 1 and type 2 vessels (see Table 6-5) andproportion numbers derived from sample vessel (presented in Appendix B). Distribution betweenthe categories (ABC) reflects the findings presented in Table 6-2. Note that there is room forconsiderable variation in these proportion numbers depending on ship type and size. The resultsare presented in Table 6-6.
Table 6-6 Waste stream quantification in the A, B, and C categoriesTotal Type A Type B Type C
% %Waste Stream Type 1 Type 2 Type 1 Type 2 Type 1 Type 2 Type 1 Type 2
Steel (f) 74.4 63.15 55.8 47.35 9.3 7.9 9.3 7.9Copper (nf) 0.01 0.04 0.01 0.02 0 0.01 0 0.01Zinc (fn) 0.03 0.04 0.03 0.04 0 0 0 0Special Bronze(nf) 0.03 0.04 0 0 0.03 0.04 0 0Machinery 14 19 5 8 9 11 0 0Electrical/Electronic Equipment 2.5 5 0.5 1.5 1.5 2.5 0.5 1Joinery - related products 5 6 0 0 1 2 4 4Minerals 0.5 2.5 0 1 0.4 1 0.1 0.5Plastics 0.5 1.2 0 0.1 0.1 0.5 0.4 0.6Liquids 2 1 1.5 0.5 0.5 0.5 0 0Chemicals and gases 0.03 0.03 0 0 0.03 0.03 0 0Other miscellaneous 1 2 0.5 0.75 0.5 0.75 0 0.5
Distribution, segments 100 100 63.34 59.26 22.36 26.23 14.3 14.51

DET NORSKE VERITAS – APPLEDORE INTERNATIONAL
Report No: 2000-3527, rev. 01
FINAL REPORT
Page 68Reference to part of this report which may lead to misinterpretation is not permissible.
Feasibility Study Ship Scrapping Final Report 21feb01.doc
6.3 Market for product categories from scrapping processes in Europe6.3.1 Re-use, recycling and disposal optionsThe general environmental hierarchy comprising reuse, recycle and disposal, may only havepartial application for ship scrapping in the European context. The options on recycling for someof the relevant items or substances are fairly limited.
The environmental context is changing rapidly and legislation is being implemented orintroduced to require more recycling and to reduce disposal by landfill. As a result, specialistoperators are emerging to deal with certain types of waste that has previously been considereduneconomic to recycle. As technology evolves in such areas, the economics change, there maystill be a cost to the originator of the waste but this may start to drop or even turn into a revenuestream. Most importantly, it reduces the volume of material destined for landfill, which is likelyto be restricted by legislation and hence become increasingly expensive as a disposal route.
One example of how these developments are taking shape, is the form of recycling villages,comprising a wide variety of specialist operators present on a single site to deal with largequantities of potentially recyclable wastes. Clearly, the location of such a facility close to a shipdismantling facility would be very desirable to maximise the opportunities for recycling waste onthe best economic basis.
In terms of re-use, the existing climate allows for little or no re-use of components from shipsand major changes in legislation and culture would be required before such options are likely toexist. In such circumstances, the approach to design and procurement in ship newbuilding wouldneed to adjust to reflect this. However, at a more fundamental level, the options for re-use mayseem closer. Firstly, the trend of recent years to refurbish cruise ships rather than to replace, canbe seen as the re-use of the ships hull and structure. More dramatically, conversions of ships tonew functionality are other examples of reuse of the elements of the ship. The conversion oftankers into FPSOs can be seen in this context. In the offshore market the re-use of platformshas already been adopted in some instances.
Another area in which there has been some interest recently, is in the replacement of theforebody of ships to provide new cargo carrying functionality. This in effect is the re-use of theengine room and accommodation areas once the condition or the functionality of the cargosection has deteriorated to uneconomic levels. The vast majority of non-steel elements of thevessel, lie in these two areas and this is where much of the non-recyclable waste is generated.Development in this area, therefore, would offer a major option for re-use of ship components.
Those operators adopting or exploring such options clearly see an economic argument forfollowing such initiatives. However, at the present times, these occur against the current climateof selling vessels for scrap to the traditional scrapping sites or to other operators who will takeaccount of the eventual disposal value of the vessel. Environmentally, there has been littleimpact on either operators or builders in terms of legislation requiring recyclability of theproduct in terms of controlled or restricted disposal. If the end of life value of the vessel reducesor turns into a cost rather than a revenue, it will shift the economic balance to favour re-useconversions rather than newbuildings. In such circumstances, technological and design changeswill start to emerge. Additionally, there may be an impact at component level for example theeconomics of technical obsolescence will alter when there are either restrictions or major costimplications on disposal.

DET NORSKE VERITAS – APPLEDORE INTERNATIONAL
Report No: 2000-3527, rev. 01
FINAL REPORT
Page 69Reference to part of this report which may lead to misinterpretation is not permissible.
Feasibility Study Ship Scrapping Final Report 21feb01.doc
The future may bring forward significant issues regarding the re-use of ships and theircomponents that will be triggered by the changing environmental context and legislation. Therealisation of such opportunities will be dependent upon “design for re-use” criteria becomingpart of the design requirements for ships along with other environmental requirements.
Following the decision of decommissioning, independent of vessel category, specific equipment,installations and components will be removed and excluded from the actual scrapping process. Insome cases, this is commonly carried out prior to sale and hence these articles do not follow thevessel to its final destiny. This will be the case for offshore structures and naval vessels to agreater extent than it will be for the world merchant fleet and for inland waterway vessels. Thesecomponents may be kept by the original owner and installed onboard other vessels in the fleet orthe owner may offer these for sale.
Consumable stores will also be removed before demolition and offered to the market directly.Some “system consumables” such as fuels and lubrication oils may also be removed at this stageand offered either directly to the market or for recovery (see chapter 6.2).
6.3.2 ProductsRe-usable products may be equipment, components, systems, substances, and consumables ofsections or whole installations/modules (offshore). Some examples are listed below.
- Whole operational offshore installations (the whole installation including jacket andtopside or e.g. subsea templates)
- Whole offshore modules (e.g. quarter module, compressor module)- Structure (i.e. de-polluted ship hull)- Compressors- Generators- Pumps- Machinery including diesel engines and turbines- Hydraulic components- Cranes- Electrical equipment (e.g. navigational aids (radars, etc.), radios, computers, televisions)- Life saving equipment (e.g. life rafts/ boats, survival suits, life buoys)- Drilling equipment (e.g. drilling pipes)- Sanitary equipment- Oils and chemicals (lubricating oil, drilling chemicals, operational chemicals, etc.)
The main commodity arriving from traditional scrapping of merchant vessels, steel, is notaddressed in the following.
6.3.3 MarketsIn theory (and also in current practice), recovered products following demolition may find a newlife also outside the original application. The supply of reconditioned products is in someindustries quite common. Further, the second hand market characteristics will varygeographically reflecting the social standards and product legislation. At the present time, thepractice seems better accepted within the offshore sector than in the merchant or other vesselsectors. The following sections provide some details.

DET NORSKE VERITAS – APPLEDORE INTERNATIONAL
Report No: 2000-3527, rev. 01
FINAL REPORT
Page 70Reference to part of this report which may lead to misinterpretation is not permissible.
Feasibility Study Ship Scrapping Final Report 21feb01.doc
6.3.3.1 Offshore installationsSale and reuse of whole or parts of decommissioned offshore installations and equipment in theNorth Sea has been most unusual and nearly a non-subject until recently. In the Gulf of Mexicohowever, reuse is well-known and may be looked on as an established practice. Experienceshows the potential of significant field development savings based on reuse. A reduction ininvestments in the region of 15-75 % compared to “new price” has been achieved. Many of theinstallations in the North Sea are older and much larger than the ones in the Gulf of Mexico andthis will obviously represent a market limitation and impose an impact on the possibility of reuse(ref.: /27/).
Phillips Petroleum Company Norway (PPCoN) has in the recent years worked with the sale ofoffshore installations from the Ekofisk field. This field was closed down in 1998. PPCoN haveestablished a web-page where 15 offshore installations are advertised for sale (ref.: /25/). Thecompany has also been in dialog with the market through other operators and through purchasersof second hand equipment. The market response to these efforts has been limited. However, forcertain equipment categories, in particular turbines and generators, there has been some interestin the international market.
Similar initiatives have been carried out by other operators;
Elf Petroleum Norge (operator of the East Frigg, Lille Frigg and Frøy fields) initiated aprocess in connection with decommissioning of offshore fields in 1998 aiming atidentifying reuse alternatives for their obsolete installations
Statoil Norway have recently awarded an exclusive contract to Web Platform Brokers totake care of all marketing activities in connection with the marketing and sale of theStatoil 2/4S Riser platform.
WEB Platform Brokers operate an Oracle based database containing detailed records of offshoreplatforms, due for decommissioning within the next 5 years. ELF and Statoil have contracted thiscompany in their attempt to find a second hand market in connection with decommissioning.PPCoN has launched their own system as mentioned earlier. The WEB Platform Broker systemreveal platform specific details including production figures, uptime, PFD's (Process FlowDiagram's), equipment data sheets and maintenance records. In addition, a photo library offering360º (bubble view) photographs of the platform's facilities are available.
Operators can, at their convenience, enter production requirements of new reservoirs and thesoftware will match these production requirements with the capabilities of existing platforms inthe database, highlighting potential benefits. The matching results will list the top three platformswith closest match to the production requirements of the new reservoir. Access to the databaseand the matching facility is possible via Internet. The service is free of charge for general search.A subscription is required fully detailed analysis.
The offshore second hand market is dominated by the companies within the offshore sector (i.e.other oil companies). Further, PPCoN has made donation agreements with four differentorganisations close to Stavanger for typical redundant equipment and movables, e.g. emergencybatteries and lifeboats. These are all charity organisations. The company reports a number ofenquiries originating from private individuals but these are refused on policy grounds.

DET NORSKE VERITAS – APPLEDORE INTERNATIONAL
Report No: 2000-3527, rev. 01
FINAL REPORT
Page 71Reference to part of this report which may lead to misinterpretation is not permissible.
Feasibility Study Ship Scrapping Final Report 21feb01.doc
6.3.3.2 VesselsCurrent ship scrapping (naval, merchant, inland waterways) include beside “breaking” the shipand selling scrap metal for profit, recovering equipment for use in alternative environments, andperhaps even sinking an intact ship off a coast to be used as a reef.
A scrapping candidate found obsolete for its original intended purpose may have deficienciesassociated to general condition, non-compliance with regulations or non-compliance with marketrequirements. There is an obvious difference between decommissioned offshore structures,which may be exported for reuse at a new field, and a decommissioned vessel. The latter isheading for a final destiny, since it has reached a point of no return in the sense of it being anoperational vessel. The exception being some categories of naval vessels, which may be laid upover a long period of time before finally being scrapped.
Cargo carrying vessels consists comprehensively of steel structure, typically 60% – 90% of itslightship depending upon type and size and of components and systems. The composition ofcomponents varies in type and capacity dependent upon the specifics of the vessel. On boardsystems provide required functions and comprise a number of components. During the life spanof the vessel, components and systems may be upgraded and replaced. Consequently, somecomponents may be significantly younger than the vessel itself. Further, a vessel carries asubstantial amount of spares. These may even be unused. Most often these are machinery spares.Based on this, it is likely that a certain market is available for secondary equipment andcomponents.
However, the introduction of stricter regulations, certification requirements etc. will most likelymake the re-use of shipboard components very limited for the European market. There may besome opportunities in the existing reconditioning markets, however, the potentials for re-use ofsuch components as seen in developing countries will not be available unless the components areexported. This is most likely not cost efficient.
6.3.4 Potential barriersThere are a number of possible barriers affecting the potential for used/ second hand installationsor equipment. Trade barriers such as taxes and duties are one of these (ref.: /26/). The issueconcerning duties and taxes when importing second-hand equipment from the offshore sector/shipping clearly represents a “grey zone” and regulations may differ between countries.
Both national regulations and international agreements will affect the opportunities (ref. /26/).This may be illustrated by the following examples relevant for the offshore sector:
National regulations;
The Petroleum Act which regulates general aspects of petroleum activities, includingexploration, production, liability for pollution damages, economic compensation tofishermen, safety, etc.
The Pollution Control Act applies to pollution and waste in the external environment andsubject to limitations following from international law. A number of regulations are laiddown in pursuance of this act e.g. Regulations on hazardous waste, Regulations on dumpingand incineration of substances and objects at sea, Regulations concerning export and importof hazardous waste, Regulations relating to notification of discharge of oil or oily mixturesto sea, rivers or land, Regulations concerning environmentally harmful batteries and

DET NORSKE VERITAS – APPLEDORE INTERNATIONAL
Report No: 2000-3527, rev. 01
FINAL REPORT
Page 72Reference to part of this report which may lead to misinterpretation is not permissible.
Feasibility Study Ship Scrapping Final Report 21feb01.doc
accumulators, Regulations concerning polychlorinated biphenyls (PCB) and Regulationsconcerning manufacture, import, export and use of chlorofluorocarbons (CFCs) and halons.
Act on worker protection and the working environment.
International agreements:
Guidelines and Standards for the Removal of Offshore Installations and Structures on theContinental Shelf and in the Exclusive Economic Zone (IMO) which regulate the removalof offshore structures in relation to safety of navigation.
The Geneva Convention on the continental shelf, which in its article 5 stipulates that anyinstallation that is abandoned or not in use should be entirely removed.
The Ministerial Declaration of the Third International Conference on the Protection of theNorth Sea (The North Sea Declaration) which adopt a comprehensive set of commonactions including reducing the input of hazardous substances and nutrients, the operationaldischarges from offshore installations and the discharges and disposal of radioactive wastes.
In addition there might be barriers with regard to re-certification or re-qualification (i.e. CEmark legislation). Used ship equipment to be used in Europe is subject to prove conformity withreference to CE-mark requirements. The second hand market will require “full” productdocumentation. This may induce design documentation and documentation of in-serviceperformance and maintenance work. Re-certification of such equipment will be a stepwise processwhere the next step is determined by the results of the previous step in terms of technical andeconomical considerations.
Changing requirements in regulations is also a factor to be taken into account when assessingimplications of re-certification. Thus the equipment will not meet the requirements that are used ontoday’s equipment.Mental barriers will also affect the re-sale potential. The brokers in the market are willing to andeager to provide the market with used equipment. However, designers, owners and engineers areoften unmotivated to consider second hand systems in new-building.Moral ethic barriers may also occur. It is a possibility to sell second hand equipment todeveloping countries where this equipment may be of interest. However, moral ethic questionsmay be raised regarding export of such equipment. Why should the developing countries use thisequipment when it isn’t found useful in the industrialised countries?
The above mentioned barriers will apply for all the types included in this study i.e. offshoreinstallations, merchant vessels, navy vessels and inland waterway vessels. However it should bementioned that e.g. navy vessels and the equipment included in these are built based on stricterrules than merchant vessels. Thus the equipment onboard navy vessels will suit a much smallermarket than the equipment onboard merchant vessels.

DET NORSKE VERITAS – APPLEDORE INTERNATIONAL
Report No: 2000-3527, rev. 01
FINAL REPORT
Page 73Reference to part of this report which may lead to misinterpretation is not permissible.
Feasibility Study Ship Scrapping Final Report 21feb01.doc
7 SCRAPPING CAPACITY AND FUTURE VOLUMES
7.1 Scrapping CapacityThe capacity of current ship demolition and scrapping facilities is difficult to establish. Themajority of existing ships scrapping sites are “first generation facilities” since they require only asuitable beach and a sufficiency of labour. They mostly rely on dynamic beaching as the meansof transferring vessels from sea to land.
Current locations therefore have no real physical limits on expansion, capacity ultimatelydepending on how long the beach is and how many workers can be attracted to work there. Theonly constraint that may exist would be local planning and environmental concerns that might atleast prevent uncontrolled expansion.
Demand is therefore considered the best measure of existing capacity and, in general, capacitydoes match demand. The best way to determine the present capacity therefore is to review thenumber of vessels and tonnage scrapped world-wide over recent years in the dominant merchantvessel category. This is summarised in the following table based upon the analysis of ships soldfor scrapping in chapter 4, Table 4-5, with a provision for (merchant) vessels below 10,000 dwtscrapping workload. World scrapping capability, on this basis is therefore considered to beapproximately 21.4 million deadweight.
Table 7-1 Tonnage (dwt) sold for scrapping in the period 1994-1999Million Deadweight
1994 1995 1996 1997 1998 1999 Ave>10,000 dwt (96%) 20.6 15.3 18.0 14.7 23.8 30.8 20.5<10,000 dwt (4%) 0.9Total 21.4
Exceptions are the vessels for which either no suitable facilities exist or there are politicalconcerns over the potential future uses of the vessel or over the methods to be employed for theirdisposal. Offshore structures, naval vessels and other specialist vessels are typicallyrepresentatives of such.
However there is increasing evidence of inadequate supply of facilities considered suitable tohandle naval vessels and evidence of an increased number of abandoned vessels (e.g., on thewest coast of Africa) or vessels being laid up.
In terms of location, during the last few decades, the focus of scrapping activity has changed asshown in Table 7-2. A variety of factors have influenced this movement, including generalglobal development patterns, labour costs, scrap steel demand and regulatory developments (ref.:/18/).

DET NORSKE VERITAS – APPLEDORE INTERNATIONAL
Report No: 2000-3527, rev. 01
FINAL REPORT
Page 74Reference to part of this report which may lead to misinterpretation is not permissible.
Feasibility Study Ship Scrapping Final Report 21feb01.doc
Table 7-2 The movement of scrapping centres over the last 50 years.
Period Main ship scrapping centres
1945- 80: USA and Europe
1980-88 Korea, China and Taiwan
1980-98 India, China, Pakistan and Bangladesh
Current locations undertaking ship scrapping, have varied slightly in the recent past, with thefollowing major locations being active in the last 10 years:• Turkey (Izmir)• India (Alang/ Bombay/ Calcutta/ Cochin)• Pakistan (Gadani Beach)• Bangladesh (Chittagong)• Thailand (Sri Racha)• Taiwan (Kao Hsing)• China (Shaghai province)• Vietnam
A number of other countries have a limited activity in this area.
Korea was active up to the late 1980's, the Philippines, Singapore and Indonesia do some workbut are considered expensive. The USA has had poor results with various programmes to try tomanage the scrapping of naval ships.
India, Pakistan, Bangladesh and China contributed to 65% of the scrapping activity in 1989,while the same countries handled 94% of the scrapping activity in 1998 (ref.: /11/, /21/ and /22/).
China was a dominant ship breaker in the 1980s. Following the introduction of national importfees on ships designated for the breaking yards, a severe decrease in volume going to China wasexperienced. Due to recent changes in the Chinese tax-system, the effect of this is no longer sovisual and hence, China is seen re-entering the market of ship breaking.
India reached the position of major scrapping nation of the world in 1998 demolishing 370 shipsof 6.3 million GT. This represented more than 50 per cent of all vessels scrapped in the year interms of GT. In total China scrapped 30 vessels of 0.6 million GT compared with the 5.5 millionGT scrapped in 1993. Bangladesh became the second ranked demolition country in 1998, with aturnover of 63 ships of 2.6 million GT. Pakistan demolished 57 vessels of 2.2 million GT andbecame the third largest scrapping nation in 1998 (ref.: /15/).
In terms of European vessels, the locations of known scrapping activity in 1999 is shown inTable 4-4 on page 23 in this report, from which it can be seen that India, Pakistan andBangladesh have featured highly.

DET NORSKE VERITAS – APPLEDORE INTERNATIONAL
Report No: 2000-3527, rev. 01
FINAL REPORT
Page 75Reference to part of this report which may lead to misinterpretation is not permissible.
Feasibility Study Ship Scrapping Final Report 21feb01.doc
7.2 Future Scrapping VolumesThe future demand for ship scrapping over the next 15 year period has been identified in chapter4, Table 4-7 and Table 4-8, of which the dominant element is merchant ships, comprising anannual scrapping projection of:
Table 7-3 Forecasted annual average of European ship scrapping volumes (2001-2015)OECD Europe Geographical EuropeVessel Size
Dwt (million) No Dwt (million) No> 10,000 dwt 3.54 75 9.11 174< 10,000 dwt 0.77 32 1.98 73
Total 4.31 107 11.09 247
Using the composition ratios identified in section 6.1 this equates to the following projectedthroughput for a European ship scrapping facility:
• No of Ships : 107 - 247• Deadweight : 4.31 - 11.09 million tonnes• Gross Tonnage : 2.87 - 7.39 million tons (Dwt/1.5)• ‘A’ Steelweight: 0.86 - 1.48 million tonnes (Dwt*0.2)• ‘B’ space outfit : 0.14 - 0.25 million tonnes (Lightship * 0.125) **• ‘C’ space outfit : 0.14 - 0.25 million tonnes (Lightship * 0.125) **• Lightship : 1.15 - 1.98 million tonnes (Steelweight/0.75)
** Based on the average vessel composition in chapter 6.2.1.
Based on the major waste stream categories identified in section 6.2 and the composition ratiosof these, this equates to the following waste material output streams:
Table 7-4 Forecasted annual waste stream volumesVolume (tonnes)Waste stream
OECD Europe Geog. EuropeSteel 860,000 1,480,000Copper 115 197Zinc 345 591Special Bronze 345 591Machinery 161,000 275,800Electrical/Electronic Equipment 28,750 49,250Joinery – related products 57,500 98,500Minerals 5,750 9,850Plastics 5,750 9,850Liquids 23,000 39,400Chemicals and gases 345 591Other miscellaneous 11,500 19,700
Total 1,154,400 1,984,320

DET NORSKE VERITAS – APPLEDORE INTERNATIONAL
Report No: 2000-3527, rev. 01
FINAL REPORT
Page 76Reference to part of this report which may lead to misinterpretation is not permissible.
Feasibility Study Ship Scrapping Final Report 21feb01.doc
7.3 Vessel SizesThe size range distribution of vessels to be handled has been built upon the composition of theexisting world cargo carrying fleet. These vessels represent the largest vessels in terms of sizeand the dominant composition in terms of overall tonnage and can be summarised as:
Table 7-5 World merchant fleet vessel sizes
Dwt size range % by number % by deadweight0 – 10,000 dwt 69.9 10.010,000 - 40,000 dwt 18.2 24.540,000 - 100,000 dwt 8.5 30.0100,000 - 300,000 dwt 2.8 29.7300,000 – 400,000 dwt 0.2 4.4400,000 + dwt 0.1 1.4Total 100.0 100.0

DET NORSKE VERITAS – APPLEDORE INTERNATIONAL
Report No: 2000-3527, rev. 01
FINAL REPORT
Page 77Reference to part of this report which may lead to misinterpretation is not permissible.
Feasibility Study Ship Scrapping Final Report 21feb01.doc
8 SHIP DISPOSAL WITHIN EUROPEOn the basis that the existing capability and capacity for ship scrapping lies outside OECDEurope, is extensively non-compliant with respect to SHE criteria and is outwith the effectivecontrol of member countries and likely in opposition with the intentions of internationalconventions, a disposal facility for the hazardous aspects of ships from OECD/EU Europe needsto lie within Europe, one can argue.
This can be achieved either by the provision of pre-processing facilities to “clean” the vesselprior to disposal at existing facilities or the development of environmentally compliant facilitieswithin Europe. Such facilities might be developed either around existing shipyard facilities(brownfield sites) or through purpose built new facilities (greenfield sites). These options areexplored within the following sections.
8.1 Pre-processingPre-processing of vessels destined for scrapping, before despatch to the scrapping facility,requires the removal of the contaminant and hazardous materials. The objective is to neutralisethe vessel in such a way that its dismantling in existing capability, ideally, would not createenvironmental problems or that in practice these factors would be substantially if not totallyeliminated.
In practical terms, this would require the vessel to be stripped of environmentally hazardousmaterials such as those listed below:
• Asbestos• Fuel oil from bunkers and lines• Lead and TBT/TPT based paint systems• Lubricating and hydraulic oils• PVC, polystyrene, phenol foam and other combustible plastics• CFCs from HVAC and refrigerant systems• Solid wastes from settlement tanks• Contaminated bilge water• Residual cargo contents• Ballast water and sediments
Additionally, the tanks, bunkers and pipelines of the vessel will need to be flushed and cleanedto remove residual traces of contaminants.
The result of a “neutralisation” process would be a “dead” ship without power systems. Thevessel would need to be transported to the scrapping facility under tow or other independentpowering. The costs of towing will impose a considerable expense and would have to befactored into the overall economics of the process. Furthermore, a towing operation itself, is asafety critical operation representing the potential of causing incidents that may haveenvironmental consequences.
In view of the lack of physical containment at existing facilities and other poor environmentalcontrols, the extent of pre-processing would need to include the removal of all surface paintcoatings from the hull and other elements of the vessel. This would be a very extensive task.

DET NORSKE VERITAS – APPLEDORE INTERNATIONAL
Report No: 2000-3527, rev. 01
FINAL REPORT
Page 78Reference to part of this report which may lead to misinterpretation is not permissible.
Feasibility Study Ship Scrapping Final Report 21feb01.doc
However, if it was excluded or only partially undertaken during pre-processing, then non-compliant activities would continue at the scrapping location.
The stripping, de-toxification and cleaning process would need to be undertaken by a competentoperator, potentially existing ship repair yards, for which there would be a cost. Given that thereis little of a commercially profitable recycling nature in this work, this cost is unlikely to beoffset by recycling revenues to the contractor.
The majority of existing scrapping capability is based on beaching the vessel, using the ship’sown power to drive the vessel as far up the beach as possible to make the hull accessible and toreduce transfer distances for components. A dead ship would have no such power and it cannotbe envisaged how the same objective could be easily and cheaply achieved by any other means.
Once at the final location, the physical dismantling process would be undertaken, presumably,along the same basis at it currently occurs. Whilst the non-compliance associated with hazardoussubstances would be avoided, the concerns regarding the health and safety of current workingpractices would continue. Some of those environmental non-compliance issues associated withthe dismantling process itself and associated downstream recycling operations would still bepresent.
In summary the concept of pre-processing is seen to raise some major practical and economicissues:
• Cost of pre-processing work within OECD Europe;• Cost of towage of dead vessel to final destination;• Practical difficulties in beaching the vessels at final destination;• Continued health and safety hazards to scrapping personnel;• Continued environmental non-compliance of the dismantling process and
downstream recycling practices.In terms of economics, the cleansing operation costs are likely to be same or greater than thoseundertaken in a dedicated ship scrapping facility, the towage cost would be simply an additionalcost. Taken together with the practical problems of beaching the vessel, it would seem that theeconomics of pre-processing are likely to be less advantageous than those of ship disposal withinEurope. Additionally, little benefit would be achieved in terms of the dangerous and hazardousworking conditions of the operators and in some part environmental non-compliance wouldcontinue in the downstream dismantling and recycling processes. This option, which would notrequire any major development of facilities as it could be undertaken at existing repair yards, hasnot been explored further.
8.2 Ship Dismantling FacilityTo be environmentally acceptable and compliant, any new developments, whether brownfield orgreenfield, specifically designed for the breaking of the world fleet surplus, both commercial andnaval, must be configured and operated differently from existing ship scrapping facilities.
In essence this is introducing a new generation of facility, the second generation facility, whichwill be referred to as a ship dismantling facility rather than a ship scrapping or ship breakingyard. In the near term, it is likely that this process will still be fairly labour intensive, but thatthere will be a much higher degree of control over both the processes and outputs of the facility.Clearly, where automation is possible and cost effective, the technology will be incorporated into

DET NORSKE VERITAS – APPLEDORE INTERNATIONAL
Report No: 2000-3527, rev. 01
FINAL REPORT
Page 79Reference to part of this report which may lead to misinterpretation is not permissible.
Feasibility Study Ship Scrapping Final Report 21feb01.doc
the design of such facilities to make them efficient in terms of layout, operation anddisposal/recycling outputs. However, as always the cost balance between capital investment andproductivity improvement will vary according to whether the facility is located in a low, mediumor high cost economy.
The scope of this study does not support the detailed design of a facility and, additionally, muchof the technology and application would be novel. The following sections describe the basicconcept, functionality and operation of the envisaged facility.
The concept has been based upon volume throughput of ships for dismantling, taking intoaccount the projected future volumes identified in chapter 7.
8.2.1 FunctionalityThe above requirements are considered to be best met by adopting a well-planned and structureddismantling approach to ship breaking. Simplistically, ship dismantling will, in large part, be theinverse of the original ship building operation. Conceptually dismantling will involve:• Removal, from the vessel whilst afloat, of consumables and loose components;• Removal of the ship out of the water;• Break up of the vessel into major sections that can be subsequently dismantled into smaller
components;• Careful removal of hazardous or polluting materials where necessary, e.g. asbestos, metallic
compounds, residues;• Collection and storage of recyclable raw materials, waste products and any re-usable
components;• Despatch of outputs to recycling, re-use and disposal centres or customers.
The range of vessel sizes, which need to be accommodated for breaking, is extensive, hence aswith new building yards, facilities will need to be designed to suit a range of ship sizes. Inparticular the means of transfer of the vessel from sea to land is likely to differ according to sizeand anticipated throughput. For example, marine railways will be suitable for small vessels, shiplifts for vessels up to around 30,000 dwt and dry docks for larger vessels. However, in practice asingle volume throughput facility needs to cater for all sizes of vessels and will therefore reflectthe largest vessel sizes.
In terms of product mix, the distinction between ship types is considered to be less important forship dismantling compared to shipbuilding. Although perhaps cruise ships, naval vessels andother non-cargo carrying vessels are likely to prove exceptions to the norm as a consequence ofthe greatly differing ratio of steel to outfit content prevailing and the wide variety of outputmaterials.
Typically, a dismantling yard will comprise the following key functionality:• Wet berths, used to moor vessels alongside upon arrival at the yard prior to the start of the
dismantling activities allowing general preparations to be undertaken;- Clearing of all residual materials at a cleaning/ waste reception station (incl. clearance of
e.g. any cargo ullage in tanks or holds, bunker and fuel tank, contents, all bilge and oilywater, sewage tank contents, ballast water and sediments, etc.)
- Vessel is made gas free and certified

DET NORSKE VERITAS – APPLEDORE INTERNATIONAL
Report No: 2000-3527, rev. 01
FINAL REPORT
Page 80Reference to part of this report which may lead to misinterpretation is not permissible.
Feasibility Study Ship Scrapping Final Report 21feb01.doc
- Ensure that ship is presented for dismantling in a clean and safe condition• The primary dismantling facility, or facilities, which takes the ship out of the water, isolate it
from the marine environment and allows the initial vessel breakdown into large blocks orsections.
• Large capacity cranes allowing these large sections to be removed from the primarydismantling facility.
• Workstations for secondary dismantling activities and sequential breakdown into componentelements. Special enclosed workstations will be required to provide containment during theremoval of hazardous and toxic materials.
• External storage areas which hold benign steelwork and materials between different stages ofdismantling.
• Secure, and open, storage that holds fully processed equipment and materials ready foroutput from the facility for recycling, re-use or disposal.
Figure 8-1 shows a conceptual illustration of such a facility designed to accommodate largervessel types.
Figure 8-1 Model Ship Dismantling Yard – Conceptual Layout
The yard’s primary dismantling facility will need to provide guaranteed containment of anyunscheduled spills arising from the initial stages of the dismantling activities. This wouldeffectively isolate the ship from the marine environment, particularly during the critical initialstages when the integrity of both hull and ship major systems are first breached.

DET NORSKE VERITAS – APPLEDORE INTERNATIONAL
Report No: 2000-3527, rev. 01
FINAL REPORT
Page 81Reference to part of this report which may lead to misinterpretation is not permissible.
Feasibility Study Ship Scrapping Final Report 21feb01.doc
The type of primary facility (marine railway, ship lift or dock) to be provided will be dependentupon a number of factors:• The size range of ships to be accommodated.• The product mix of ships to be processed.• The prevailing site topography and ground conditions.• The annual throughput of ships to be deconstructed.Eventual layout adopted for any individual yard will also be largely dictated by these samefactors.
The size distribution of the world fleet (chapter 7) demonstrates that a docking capacity of400,000 dwt. would be sufficient (in size) for almost the entire fleet, since only 0.1% (by no.) ofthe world fleet are above 400,000 dwt.
The primary facility will drive the complete operation. This will need to be provided with largecapacity cranes (related to the ship size range to be accommodated) to maximise the throughputpotential of the yard. All downstream facilities and activities will be sized and organised so as tominimise the possibility of creating bottlenecks within the dock, shiplift or marine railwayelements of the operation.
All open work areas will be fully paved and all surface water drainage systems will be equippedwith large capacity pollution traps to ensure that any solid or liquid contaminants which may bespilt cannot find their way into local waterways or permeate into the water table.
8.2.2 OperationTo our knowledge, no second generation ship dismantling facility yet exists. The principlesoutlined in the following section are based upon a novel synthesised dismantling methodology.The component elements of the synthesis, however, are based upon established productionprocesses, handling methods and strategic approaches. Parallels can be found in current shipbuilding, ship conversion and industrial dismantling operations.
The operations and facility descriptions are for a large scale, high throughput, ship dismantlingactivity specialising particularly in steel intensive ship types (dwt carriers). It is envisaged that asingle facility with a single 400,000 dwt drydock would be able to handle the predicted annualthroughput levels for either OECD or geographical Europe definitions.
In terms of preparations planning, it is envisaged that broad ship dismantling strategies will bedeveloped for each of the common ship types dismantled, which clearly identifies specialproblem areas to be expected and the overall dismantling approach to be adopted. Individualdetails of particular vessels will then be required to plan a safe dismantling operation. It is likelythat shipowners will be responsible for providing details on the material composition of theirvessels (or for new tonnage, builders to provide inventory details on delivery) in the form of aships “passport” (ref.: /33/).
Prior to commencement of the dismantling activities, the ship will be cleared of all residualmaterials at a cleaning/ waste reception station (Wet Berths for Vessel Mooring, Figure 8-1).The clearance will include, inter alia, any cargo ullage in tanks or holds, bunker and fuel tankcontents, all bilge and oily water, sewage tank contents, ballast water and sediments, etc. Thevessel will be fully gas freed and certified. Actions will ensure that the ship is presented fordismantling in a clean and safe condition.

DET NORSKE VERITAS – APPLEDORE INTERNATIONAL
Report No: 2000-3527, rev. 01
FINAL REPORT
Page 82Reference to part of this report which may lead to misinterpretation is not permissible.
Feasibility Study Ship Scrapping Final Report 21feb01.doc
Large diameter pipe work, such as tanker cargo pipe work, will also be cleared, cleaned andmarked accordingly. Smaller diameter pipe work will be cleared; cleaned and marked only ifconvenient or necessary to do so at this stage, otherwise they will remain charged to be dealtwith later.
Prior to the main steel dismantling process beginning, the ship will be examined and thesequence and nature of the work to be performed agreed upon and planned as a specificextension to the appropriate broad strategy. Preliminary outfit removal and/ or make-securework in way of dismantling breaks will also be commenced at this time. As much outfit materialas possible will be removed prior to transferring the ship to the primary facility. Access to theship builder’s original strategy documentation will be useful at this juncture.
The ship will then be transferred to the dock and associated dismantling facility, which isconfigured to maximise the efficiency of steel breakdown activities. The ship will be cut up intoring units of appropriate length to most closely match the capacity of the main dock crane andthereby minimise the actual work content within the dock.
Large blocks and units, complete with almost all remaining elements of outfit and machineryinstallation, etc. will be removed for subsequent dismantling or specialist decontaminationelsewhere on site. Only where remaining outfit items cross a dismantling break will they beeither severed or removed. Any charged and unmarked pipelines will be blocked on both sidesof any necessary breaks to prevent significant spillage occurring.
Very large items, such as main propulsion machinery, auxiliary generators, etc. may need to beremoved in the open sky condition, but wherever possible, outfit and machinery will be leftcomplete within the enclosing steel unit.
Blocks and units removed from the ship are craned initially to areas of the yard adjacent to thedock and under cover of the main crane for limited further dismantling into large interimproducts approximating to two dimensional panels. These panels are then transported to otherareas of the yard for subsequent breakdown into ever smaller pieces down to the desired size formost cost effective disposal. Hazardous activities such as the removal and bagging of asbestosinsulation, removal of anti-fouling and lead based coatings, etc, are performed under cover toprevent the possibility of airborne dispersion across and beyond the yard boundaries.
A considered set of facility specific contingency plans and associated procedures will bedeveloped to respond to any accidental release of hazardous or toxic wastes. Such plans willinclude all SHE aspects.
During subsequent dismantling activities, the unit size of breaking components is progressivelyreduced and organised into distinct lines, typically:• Major outfit items – propellers, engines, generators, large electric motors, purifiers, anchors,
chains, etc.• Minor outfit items – small electric motors, starter units, fans, etc.• Pipework systems – pumps, valves, steel and non-ferrous pipe and tubing, etc.• Cabling - armoured, MICC, PVC insulated, etc.• Timber and timber products• Domestic, kitchen, sanitary fittings, etc.• Miscellaneous - Ship wheels, compasses, bells, etc.• Waste - benign materials with little or no resale or re-cycle value

DET NORSKE VERITAS – APPLEDORE INTERNATIONAL
Report No: 2000-3527, rev. 01
FINAL REPORT
Page 83Reference to part of this report which may lead to misinterpretation is not permissible.
Feasibility Study Ship Scrapping Final Report 21feb01.doc
• Toxic and hostile materials requiring licensed disposal• Etc.
The yard will be primarily responsible for reducing the steel hull and steel accommodationcomponent of ships into optimised scrap for recycling. Large, steel intensive items, such as slowspeed marine diesel engines may also be reduced to optimised scrap.
It is probable that some elements of the technology required to allow the dismantling work to beundertaken in the manner described either does not presently exist or is inadequately developedto allow immediate adoption.
Environmentally responsible ship dismantling will be a new industry and, as such, will need timefor all necessary operational and management tools to be properly developed.
8.2.3 Description of the Model FacilityThe facility described in outline here is configured for the routine dismantling of large, steelintensive vessels which collectively display a high degree of conformity in their structural designconfiguration.
It is considered that the facility needs a minimum site area of 20 hectares offering an absoluteminimum of 250 metre of water frontage adjacent to deep water access.
A 400 metre long and 15 metre wide finger jetty is provided to accept incoming vessels andwhere initial dismantling activities commence with the removal of as much outfit items andmaterials as possible prior to entering the dry dock. The jetty operates a 20 tonne capacitytravelling jib crane to furnish the large number of smaller lifts envisaged at this stage of thedismantling operation. On the jetty is installed initial Cleaning/ Waste reception facilities forrelevant cleaning operations (gas free, etc.) and waste categories (domestic waste, consumables,operational waste, cargo remains, etc, see 8.2.2). This will be equipped with pumps, ventingarrangements, electrical supply, etc. as well as facilities for containment and transport.
The facility is concentrated around a single large dock capable of accommodating vessels of upto 400,000 dwt. The dock floor is provided with a secondary bund system to contain any leakageor accidental spills and to prevent these entering the dock de-watering and leakage strippingsystem. The dock is fully equipped with all electrical and mechanical services necessary for theeffective deployment of the types and numbers of cutting and associated equipment employed tocut the ship into large ring units.
The dock is bounded along one side and across the dock head by hard-standing work areas wherethe ring units from the dock are reduced down to their constituent panels. The dock head area isused mainly for complex shaped steel work such as bow and stern sections as well asaccommodation blocks. These areas are also provided with bunds to contain spills and preventcontamination of the adjacent ground. All surface water drainage is routed through separatorsand settlement tanks to reduce pollutants to acceptable levels. The hard-standings are providedwith all necessary electrical and mechanical services to support production.
The combined dock and hard-standing areas are covered by a circa 500 tonne lift capacity largespan portal crane which transfers the ring units from the dock ashore. Two 20 tonne jib cranesalso service the hard-standing areas to perform the smaller, more frequent lifts, encounteredduring the subsequent dismantling activities.

DET NORSKE VERITAS – APPLEDORE INTERNATIONAL
Report No: 2000-3527, rev. 01
FINAL REPORT
Page 84Reference to part of this report which may lead to misinterpretation is not permissible.
Feasibility Study Ship Scrapping Final Report 21feb01.doc
A further large external hard-standing area is provided where the relatively large panels, outputfrom the areas adjacent to the dock, are reduced down to the sizes which command the maximumscrap or re-use values. Materials handling activities in this area are predominantly undertakenwith mobile cranes, a single unit of 50 tonne capacity and four 25 tonne machines.
All external areas are equipped with flood lighting to allow 24 hour working be undertaken.
A three bay workshop is also provided on site in which the piece small dismantling of steelwork,piping and equipment which is environmentally hostile or is valuable or easily damaged isundertaken. The building structure provides the primary enclosure to minimise the risk of anypollutants or contaminants escaping into the external biosphere. The workshop is equipped witha range of overhead cranes with capacities matched to the both the initial and final scale of thedismantled products. As with elsewhere on the site, the workshop is fully equipped with allnecessary electrical and mechanical services to support the range of dismantling activitiesundertaken.
A stores building provides secure containment of hostile and valuable materials prior to theirdispatch from site for reuse, recycling or disposal. Materials handling activities within the storesbuilding is performed with fork lift trucks.
A number of support buildings are provided within the site boundaries, these comprising of themain administration and amenities block, a medical centre and a fire station. Traffic andpersonnel movements into and out of the site are controlled from a single gate-house. Carparking is provided in the area adjacent to the administration building.
All buildings and work areas are inter-connected by a comprehensive road network.
8.2.4 Production EquipmentThe production equipment spend anticipated for the yard is concentrated in two particular areas,steel cutting and materials handling. These two activities will dominate the ship dismantlingoperation as defined.
For steel cutting high energy plasma processes are used for all large scale plate cutting activitieswherever possible with secondary cutting undertaken by either conventional oxy/fuel torches orvia more specialised processes such as oxygen arc or powder cutting. A high degree of processmechanisation is considered to be essential. Such mechanisation would need to be speciallydeveloped to suit ship dismantling activities.
For reducing the steel down to acceptably small pieces for reprocessing, a large proportion ofcutting will be performed by large, heavy duty, mechanical shears mounted on the booms oftracked excavators. Such shear/excavator combinations are extensively used during thedismantling of large, land based, steel structures such as power stations.
Most of the movements of large panel type structures from the areas adjacent to the dock tosubsequent breakdown external areas and in the workshops will be done with self elevatingtransporters similar to the types common in modern shipyards. A number of these vehicles ofvarying capacities will be required to meet the large number of load movements required. It isanticipated that these will operate independently of the main facility craneage by deployingstools from which to place and recover loads.
The mobile cranes, which service the final external steel cutting area, are all of the telescopicmast type, all terrain types able to operate mostly without the need to deploy their stabilisers.

DET NORSKE VERITAS – APPLEDORE INTERNATIONAL
Report No: 2000-3527, rev. 01
FINAL REPORT
Page 85Reference to part of this report which may lead to misinterpretation is not permissible.
Feasibility Study Ship Scrapping Final Report 21feb01.doc
Where the load or outreach demands the stabilisers be used, the hard standing is sufficientlystrong and level to minimise the deployment time.
The compressed air demands for the complete facility are met by a set of three centrally locatedcompressors installed within a dedicated compressor house.
8.3 Greenfield/ Brownfield Site Alternatives8.3.1 Brownfield Site DevelopmentIn terms of looking at the availability of existing brownfield sites, one of the key issues is theavailability of docking capability to allow the vessels to be taken out of the water for break-upwithin a contained environment. For all but the smallest vessels, this suggests an existing dry-docking or ship lift capability – floating docks do not provide the necessary containment and as ameans of lifting to transfer from water to land, specific site conditions would need to beconsidered at each location. Ship lifts tend to be limited to vessels up to 35,000 dwt. For thisreason, the consideration of brownfield facilities has been limited to dry docks.
Clearly within Europe there is existing dry-docking capability around which brownfielddevelopment(s) could be undertaken. Within Western European countries, much of this dry-dock capability is in current shipbuilding or repairing use and additionally the relatively highcost of labour in these economies, provides a poor base against which to develop such acapability.
On this basis, we have concentrated the consideration of brownfield development on the lowercost economy countries within Europe. Table 8-1 lists the main dry docks in these countries:
Table 8-1 Dry-docks – Eastern/Central EuropeCountry Yard Location L x B x D DWTLatvia Tosmare (1) Liepaja 225 x 35 x 9 20,000
(2) 185 x 38 x 9 18,000Bulgaria Varna (1) Varna 237x40 x 5.5 80,000
(2) 190x23 x 4.5 30,000Odessos Varna 243x 27 x 10 30,000
Romania Constantza (1) Constantza 200,000(2) 360x 48 x 10 160,000
Daewoo MHI (1) Mangalia 360 x 60 x 7 200,000(2) 300 x 48 160,000
Galatz Galatz 60,000Poland Radunia Gdansk 40,000
MMS (1) Gdansk 60,000(2) Gdansk
Gdynia Gdynia 380 x 70 x 8 400,000Intermarine Szczecin 30,000
Estonia Loksa Loksa 6,000Ukraine Sevastopolsky (1) Sevastopol 170 x 20
(2) 150 x 20(3) 280 x 35 80,000
Chernomorsky Zavod Nikolaev 150 x 37 4,500Kherson Kherson 140 x 32
140 x 18Okean Nikolaev 350 x 56 235,000Zaliv Kerch 350x 56 x 11 235,000
Note: The capacity of a number of these docks is based upon the leading dimensions provided The remaining docking capability in these countries is floating docks.

DET NORSKE VERITAS – APPLEDORE INTERNATIONAL
Report No: 2000-3527, rev. 01
FINAL REPORT
Page 86Reference to part of this report which may lead to misinterpretation is not permissible.
Feasibility Study Ship Scrapping Final Report 21feb01.doc
It can be seen that only Poland and Ukraine have significant sized docks that could accommodatethe majority of cargo carrying ships in the world fleet. The dock in Poland is in currentshipbuilding use and additionally, the development of the Polish economy has increased labourcosts. Shipyard activity in the Ukraine is generally fairly low at the present time, with significantsurplus or mothballed capacity. However, the financial climate is quite hard and the situationregarding social and environmental compliance is uncertain due to the limited inward investmentand development. The largest docks in Romania can accommodate vessels up to approximately200,000 dwt. However, these are located in shipyards that are currently active in bothshipbuilding and repair.
The technology described in the previous section is based upon maximum throughput of vesselswithin a single facility. Utilising this approach the anticipated volumes of ships for dismantlingcan be handled within a single dock operation facility. Such a dock however would thereforeneed to accommodate the largest vessels.
The identified Eastern European docks capability comprises mainly smaller dry docks for vesselsup to panamax size. Larger facilities are located at the following locations:• Constantza in Romania for vessels up to 200,000 dwt• Mangalia in Romania for vessels up to 200,000 dwt• Okean in Ukraine for vessels up to 235,000 dwt• Zaliv in Ukraine for vessels up to 235,000 dwt• Gdynia in Poland for vessels up to 400,000 dwt
The largest of these docks at 400,000 dwt would be sufficient (in size) for almost the entireworld ship dismantling workload, while the smaller facilities at 200,000 – 235,000 dwt wouldonly be sufficient in size for around 80% of the dismantling workload.
Additionally, whilst there is under-utilisation of shipyard capacity within the Eastern Europeancountries, most of these dry-docks currently have some shipbuilding or ship repair activity goingon and therefore the availability of docking capability around which to develop a brownfield sitewould be proportionately reduced. Specifically the largest of these docks, at Gdynia in Poland,is part of a highly active shipbuilding facility.
8.3.2 Greenfield Site DevelopmentAs always with a greenfield site development, the factors influencing location are more general.In this instance they focus down on the following:• Sea access for arriving vessels – suitable for a docking facility• Availability of low cost labour• Availability of suitable energy supplies• Supporting logistics infrastructure• Political stability• Suitable political and legislative context to support social and environmental requirements

DET NORSKE VERITAS – APPLEDORE INTERNATIONAL
Report No: 2000-3527, rev. 01
FINAL REPORT
Page 87Reference to part of this report which may lead to misinterpretation is not permissible.
Feasibility Study Ship Scrapping Final Report 21feb01.doc
Taking into account EU membership, the timetable for enlargement and the requirement for lowlabour costs, the following have been identified as the possibilities:• Balkan States• Bulgaria• Greece• Poland• Romania• Slovenia• Turkey
Whilst the required capacity is significant, there is clearly plenty of scope for development ofpurpose developed scrapping facility on either a single or multiple site locations.
In terms of the relative economies of operating in these countries, this will primarily be afunction of unit labour costs and productivity, in conjunction with the energy costs and the costof facilities development. It is not possible to be prescriptive about this.
However, it should be noted that greenfield developments are likely to face quite strongresistance. The Australian project (ref. chapter 5.2.4) has already had its preferred site rejectedand site selection has caused the most problems for the consortium so far.

DET NORSKE VERITAS – APPLEDORE INTERNATIONAL
Report No: 2000-3527, rev. 01
FINAL REPORT
Page 88Reference to part of this report which may lead to misinterpretation is not permissible.
Feasibility Study Ship Scrapping Final Report 21feb01.doc
9 ECONOMIC AND COMMERCIAL FACTORSIn considering the overall economics of an environmentally compliant ship disposal facility, wehave looked to calculate a ship end-of-life value per steelweight tonne to compare with thecurrent market values of vessels sold for scrapping.
To do this we have used a simple economic model:
Ship end-of-life value = annual net profit/loss of dismantling ÷ steel workload in tonnes
The annual net profit or loss of dismantling operations has been calculated as the projected netrevenue streams of the operation from the resale of waste materials less the costs of dismantlingoperations. The dismantling costs comprise three main elements:
• operational costs of dismantling process.• labour cost.• facility costs.
9.1 Revenue StreamsThe revenue streams of the operation have been determined through identifying those materialoutput streams for which a resale value is anticipated. The annual volumes of material have beenestimated based on the predicted scrapping workloads in section 7.2. Unit resale values havebeen assumed based on each such revenue stream.
Values of recycling materials are generally highly volatile as they reflect demand and supplysituations in the commodity markets. For the basis of this study however, values have beenassessed taking into account the current market prices and trends.
There are however other waste material streams that it is anticipated will represent disposal costsfor the operation. The costs of these have to be offset against the revenue streams to calculatethe net revenue of the operation. Unit disposal costs have been assumed for each waste disposalstream. These are identified in the table below. Such disposal costs are also likely to be subject tomarket variations and in particular to changes in the cost and availability of landfill and theregulation and licensing of specialist disposal contractors.
The net revenue streams from waste materials have been estimated for the scrapping workloadsassociated with both OECD European flagged vessels and geographical Europe flagged vessels(see Table 9-1).

DET NORSKE VERITAS – APPLEDORE INTERNATIONAL
Report No: 2000-3527, rev. 01
FINAL REPORT
Page 89Reference to part of this report which may lead to misinterpretation is not permissible.
Feasibility Study Ship Scrapping Final Report 21feb01.doc
Table 9-1 Revenue of waste streams estimated for EuropeRevenue Value Revenue US $ million
Waste Stream or Cost $ / tonne OECDEurope
Geog.Europe
Steel Revenue 80 68.8 118.4Copper Revenue 1780 0.2 0.4Zinc Revenue 1030 0.4 0.6Special Bronze Revenue 1200 0.4 0.7
Machinery Revenue 50 8.1 13.8Electrical/Electronic Equipment Cost -70 -2.0 -3.4Joinery – related products Neutral 0 0.0 0.0Minerals Cost -30 -0.2 -0.3Plastics Cost -30 -0.2 -0.3
Liquids Neutral 0 0.0 0.0Chemicals and gases Cost -70 0.0 0.0
Other miscellaneous Cost -70 -0.8 -1.4Net Revenue 74.3 128.5
9.2 Cost Base9.2.1 Dismantling Operational Labour CostsThe dismantling operational costs include the labour costs of the direct and indirect workforce,including management and administration personnel. As with all shipyard operations and otherlabour intensive processes, the labour costs will be the dominant cost driver in these operations.
Direct manning levels for the steelwork dismantling process have been calculated using a varietyof technologies, based upon the steel cutting and handling activities necessary to break emptysteel ships structure into 1.5 x 0.5 x 0.5 metre elements. This size of final component is drivenby current steel scrap standards. The results of these calculations have given steel productivitiesbetween 1.2 and 3.5 manhours/ tonne. For our calculations we have used a mid-range figure of2.3 manhours/ tonne.
The manning levels required for the dismantling operations for outfit and machinery areas havebeen calculated on a pro-rata basis, reflecting the overall composition of steel, machinery andoutfit content for ship newbuilding. The premise underpinning this assumption is that the processof dismantling is the reverse of ship construction and that steel, outfit and machinery componentsare largely being dismantled back to original components or similar component size (in the caseof steel). The level of complexity and alignment elements are of course not applicable indismantling, however this is a common factor. Labour associated with painting, commissioningand testing can be ignored in calculating the ratios, as there is no parallel dismantling operation.A ratio of 60/40% has been assumed based on the labour composition of traditional full serviceyards without sub-contracting.

DET NORSKE VERITAS – APPLEDORE INTERNATIONAL
Report No: 2000-3527, rev. 01
FINAL REPORT
Page 90Reference to part of this report which may lead to misinterpretation is not permissible.
Feasibility Study Ship Scrapping Final Report 21feb01.doc
The level of management and administration personnel has been based upon appropriate industrystandards for operations with similar manning levels. Significant levels of technical and designpersonnel are not envisaged.
The following table presents the calculations for operational manning levels for the workloadrange previously estimated.
Table 9-2 Manning levelsOECD Europe Geographical Europe
Steelweight throughp. approx (tonnes) 860,000 1,480,000Steelwork productivity 2.3 mhrs/tonne 2.3 mhrs/tonneSteelwork manning (60% direct) 1,130 1,945Outfit manning (40% direct) 755 1,295Total direct manning 1,885 3,240Indirect manning 500 700Total 2,385 3,940
Based on the above calculations, yard manning levels have been rounded up to 2,400 and 4,000respectively for the purpose of estimating labour costs. The following table shows the labourcosts of the operation for a range of employment cost rates.
Table 9-3 Operational labour costsOECD Europe
US$ millionGeographical Europe
US$ millionEmployment cost $2.5/hr 12.2 20.3Employment cost $5.0/hr 24.3 40.6Employment cost $10.0/hr 48.7 81.1Employment cost $20.0/hr 97.3 162.2
9.2.2 Other Operational CostsOther operational costs comprise mainly the non-labour overhead costs for both production andadministrative elements. The production labour costs will relate primarily to the use ofconsumables in the cutting and dismantling process, e.g. energy, gases, etc. These can beexpected to be significantly higher than for traditional shipyard operation in view of the highlevel of steel cutting. The extent to which mechanical cutting is adopted, as opposed to thermalcutting processes for secondary dismantling, will significantly influence the consumable costs.Other overhead non-labour costs are estimated based upon typical shipyard costs.
For the purpose of the analysis, the following values have been used for other operational costs:
Table 9-4 Other operational costsOECD Europe
US$ millionGeographical Europe
US$ millionProduction overhead 5.4 9.4Other overhead 2.0 3.0Total 7.4 12.4

DET NORSKE VERITAS – APPLEDORE INTERNATIONAL
Report No: 2000-3527, rev. 01
FINAL REPORT
Page 91Reference to part of this report which may lead to misinterpretation is not permissible.
Feasibility Study Ship Scrapping Final Report 21feb01.doc
9.2.3 Facility CostsThe capital costs of developing the ship dismantling facility have been based around theprovision of a single facility, which has the capability of handling the envisaged annualthroughput. The key functionality of the facility is described in Section 8.2, and has beencategorised as follows for costing purposes:
• Finger jetty - jetty, crane, bollards and fendering• Dock and dockside area - dry dock, dock cranes, hard standing and drainage• Workshops - buildings, services, and internal cranage• Ext. dismantling area - open areas with drainage and contained settlement tank system• Plant and machinery - mob. cranes, transporters, shears/plasma equip, compactors• Miscellaneous buildings - administration buildings etc
Table 9-5 Facility development costsItem Capital Cost Working Life Depreciation
US $ million Years US $ millionDry dock & dockside areas 66.3 40 1.66Finger jetty 9.0 40 0.22Workshops 8.5 40 0.21Open dismantling area 1.6 40 0.04Plant and machinery 8.4 15 0.56Misc. buildings 2.0 40 0.05Total 95.8 2.74
It can be seen therefore that the capital cost of the facility is estimated to be approximatelyUS$100 million. Based upon the useful working life of these assets, this has been converted intoan annual depreciation charge of US $ 2.74 million.
9.3 Economics of Ship Dismantling FacilityIt can be seen that the main variable of the shipyard costs is that of labour costs and the overalleconomics of the process will reflect the differing costs of labour in different countries. Thefollowing table demonstrates the revenue cost balance for four different labour rates. In thissimplified calculation no financing costs have been included for the cost of capital investment indeveloping the facility.

DET NORSKE VERITAS – APPLEDORE INTERNATIONAL
Report No: 2000-3527, rev. 01
FINAL REPORT
Page 92Reference to part of this report which may lead to misinterpretation is not permissible.
Feasibility Study Ship Scrapping Final Report 21feb01.doc
Table 9-6 Projected annual cost and revenue levels (US $ million)OECD Europe Geographical Europe
$2.5/hr $5/hr $10/hr $20/hr $2.5/hr $5/hr $10/hr $20/hrLabour 12.2 24.3 48.7 97.3 20.3 40.6 81.1 162.2Other 7.4 7.4 7.4 7.4 12.4 12.4 12.4 12.4Depreciation 2.7 2.7 2.7 2.7 2.7 2.7 2.7 2.7Total Cost -22.3 -34.4 -58.8 -107.4 -35.4 -55.7 -96.2 -177.3Net Revenue 74.3 74.3 74.3 74.3 128.5 128.5 128.5 128.5Balance 52 39.9 15.5 -33.1 93.1 72.8 32.3 -48.8
As the employment costs rise, the costs of dismantling start to exceed the net revenues of theoperation, indicating that there would be a net cost to ship dismantling in higher labour costcountries. In the above table the move from positive to negative balance occurs between$10/hour and $20/hour. A simplistic calculation of the break-even employment costs (i.e. wherenet revenue are equal to total cost) indicates $13/ hour for the lower volume OECD Europescenario and $14/hour for the higher volume Geographical Europe scenario.
9.4 Ship End-of-Life ValueThe end of life value for ships based upon the above economic analysis has been calculated pertonne of steelweight to allow comparison with current scrapping prices being achieved forvessels sold for scrap.
Based upon the figures presented in Table 9-6 in Section 9.3, the following end-of-life values persteelweight tonne have been calculated:
Table 9-7 Ship end-of-life value, denoted in US $ per steelweight tonne
OECD EuropeUS$/ steelweight tonne
Geographical EuropeUS$/ steelweight tonne
Employment cost $2.5/hr 60 63Employment cost $5.0/hr 46 49Employment cost $10.0/hr 18 22Employment cost $20.0/hr -38 -33

DET NORSKE VERITAS – APPLEDORE INTERNATIONAL
Report No: 2000-3527, rev. 01
FINAL REPORT
Page 93Reference to part of this report which may lead to misinterpretation is not permissible.
Feasibility Study Ship Scrapping Final Report 21feb01.doc
10 REFERENCES
/1/ “A technological review of the possible methods of decommissioning and disposing ofoffshore oil and gas installations”. Contract No B4-3040/96/000259/MAR/D1. JohnBrown Engineers & Constructors B.V. for The European Commission DG XI and DGXVII, December 1996.
/2/ US naval Vessel Register (official list of US Navy ships, past and present)http://www.nvr.navy.mil/quick/inactive.htm
/3/ The world Navies Today, by Andrew Toppan.http://www.hazegray.org/ or http://www.hazegray.org/worldnav/usa/decom.htm
/4/ Transport statistics for the EU Member States, INLAND WATERWAYS, EuropeanCommunities, 1995-2000:http://europa.eu.int/en/comm/dg07/tif/3_means_of_transport/ch3_iww_tran_eqpt.htm
/5/ Hans Strelow: Database of inland cargo vessels, EU 2000, - personal communication
/6/ Institution of Chemical Engineers (IChemE), environmental conference,Environment97:http://www.environment97.org/text/reception/r/keypapers/papers/s11.htm
/7/ UNEP – Offshore Oil and Gas ENVIRONMENT FORUM: “International ExpertMeeting on Environmental Practices in Offshore Oil and Gas Activities”, Noordwijk,the Netherlands, 1997:
http://www.natural-resources.org/offshore/emissions/decomm/index.htm
/8/ ENCYCLOPÆDIA BRITANNICA, Approximate Strengths of Selected RegularArmed Forces of the World, 1998:http://www.britannica.com/bcom/eb/article/single_table/0,5716,136725,00.html
/9/ T. Nilsen, I. Kudrik and A. Nikitin, 1996, “The Russian Northern Fleet Nuclear-powered vessels”, Bellona report:http://www.bellona.no/imaker?id=11091&sub=1#O0
/10/ Lloyd’s ship demolition database for the year 1999 (generated for DNV, 2000)
/11/ Lloyd’s Register of Shipping, “World Fleet Statistics, 1998”, London 1999.(http://www.lr.org/information/publications)
/12/ Lloyd’s Register of Shipping, “World Fleet Statistics, 1999”, London 2000.(http://www.lr.org/information/publications)
/13/ Warships on the web, Royal Navy Encyclopedia, by Andrew Cashmorehttp://www.warships.co.uk/
/14/ Defence Reutilization and Marketing Service (DRMS), scrapping contracts completedsince 1993. http://www.drms.dla.mil/marketing/ship.pdf

DET NORSKE VERITAS – APPLEDORE INTERNATIONAL
Report No: 2000-3527, rev. 01
FINAL REPORT
Page 94Reference to part of this report which may lead to misinterpretation is not permissible.
Feasibility Study Ship Scrapping Final Report 21feb01.doc
/15/ Lloyd’s Register of Shipping: “World Casualty Statistics, 1998”.
/16/ Organisation for Economic Co-operation and Development (OECD) 1997, EconomyResearch Centre, “What Markets are there for Transport by Inland Waterways?”
/17/ ENCYCLOPÆDIA BRITANNICA, Canals and inland waterwayshttp://www.britannica.com/bcom/eb/article/9/0,5716,138639+2+117291,00.html
/18/ Drewry Shipping Consultants: “Ship Scrapping – Locations, Activity, Price Trends andProblems. Briefing Report.” October 1996. + recent data on ship scrapping by location(personal communication). October 1998.
/19/ DNV Report No. 99-3065: “Decommissioning of Ships - Environmental Protection andShip Demolition Practices”, 1999.
/20/ DNV Report No. 2000-3158: “Ship Breaking Practices/ On Site Assessment,Bangladesh – Chittagong”, May 2000.
/21/ Lloyd’s Register of Shipping: “World Fleet Statistics, 1994”, London 1995.(http://www.lr.org/information/publications)
/22/ Lloyd’s Register of Shipping: “World Fleet Statistics, 1996”, London 1997.(http://www.lr.org/information/publications)
/23/ Internal DNV Memo based upon Fearnley/Lloyd’s/DNV data
/24/ EPA PCB studie: http://www.epa.gov
/25/ DNV Report No. 98-4029: “Ekofisk 2/4 Q, 2/4 FTP, 2/4 R, 2/4 P, 2/4 T, 2/4 H, 2/4 A,2/4B and Ekofisk I Pipelines. Material Inventory.”, Phillips Petroleum Company, 1999
/26/ DNV Report No. 98-4024: “Asbestos survey on Frigg. QP, TP1, TCP2 and DP2.”, ElfPetroleum Norge AS
/27/ DNV Report No. 97-3328: “Material Inventory Dossier. Heimdal Platform.”, ElfPetroleum Norge AS
/28/ US EPA: “A Guide for Ship Scrappers – Tips for Regulatory Compliance”, EPA 315-B-00-001, Summer 2000.
/29/ The EMBLA Homepage: http://projects.dnv.com/embla
/30/ The Chapman & Hall Encyclopedia of Environmental Science: “Chlorofluorocarbons(CFCs)”, pp.78-80, Kluwer Academic, Boston, MA, 1999 orhttp://www.cmdl.noaa.gov/noah/publictn/elkins/cfcs.html
/31/ DNV Report No. 97-3564: “Maureen Alpha Decommissioning Environmental Effects –Acceptability Criteria’s”, Phillips Petroleum Company UK Ltd., Rev. 01. 1997
/32/ Waldock, M. J.: “Organometallic compounds in the aquatic environment”, Handbookof Ecotoxicology, Vol. 2, 1994 (ed. P. Calow), pp. 106-129
/33/ DNV Report No. 2000-3160: “Decommissioning of Ships – Environmental Standards”,

DET NORSKE VERITAS – APPLEDORE INTERNATIONAL
Report No: 2000-3527, rev. 01
FINAL REPORT
Page 95Reference to part of this report which may lead to misinterpretation is not permissible.
Feasibility Study Ship Scrapping Final Report 21feb01.doc
Ship Inventory Dossier-Environment (SIDE), July 2000
/34/ Bjarte Bøe: “Opphugging av tankskip – Scrapping”, Skriftlig utredning vedHandelshøyskolen i Bergen, 1983
/35/ Raouf Kattan, -personal communication
/36/ Bertram & Wobig: “Simple empirical formulae to estimate main form parameter ofships”, Schiff+Hafen, Vol. 11, 1999, pp118-121
/37/ Schneekluth & Bertram: “Ship design for efficiency and economy”, Butterworth-Heinemann, Second edition, 1998
/38/ SFT: “PCB in building materials” (Norwegian), SFT Report No. 98:09, 1998
- o0o -

DET NORSKE VERITAS – APPLEDORE INTERNATIONAL
Page A-1Report No. 2000-3527, rev. 01
22 February 2001, B/feasibility study ship scrapping final report 21feb01.doc
APPENDIXA
DECOMMISSIONING VOLUME - SUPPORT

DET NORSKE VERITAS – APPLEDORE INTERNATIONAL
Page A-2Report No. 2000-3527, rev. 01
22 February 2001, B/feasibility study ship scrapping final report 21feb01.doc
Figure 10-1 and Figure 10-2 illustrate the world fleet distribution by type (cargo carryingvessels/ other vessels), number and tonnage (GT) over the period from 1994 to 1998. Nationalityadherence distinguishes the OECD flag state registry fleet from the world fleet. The reason forpresenting the growth of the world fleet in this way rests upon the ban amendment of the BaselConvention prohibiting the export of waste from OECD member states to non-OECD memberstates.
World Fleet 1994, -96 -98Number of vessels
0
10000
20000
30000
40000
50000
60000
70000
80000
90000
100000
Country
Misc. vesselCargo vessel
Figure 10-1 World fleet distribution by numbers
World Fleet 1994, -96 -98Gross tons
0
100000000
200000000
300000000
400000000
500000000
600000000
Country
GT Misc. vesselCargo vessel
Figure 10-2 World fleet distribution by tonnage

DET NORSKE VERITAS – APPLEDORE INTERNATIONAL
Page A-3Report No. 2000-3527, rev. 01
22 February 2001, B/feasibility study ship scrapping final report 21feb01.doc
Figure 10-3 shows that all OECD countries have experienced a reduction of volume (GT) withthe exemption of Norway. Furthermore, the trend within the OECD is that of a decreasingnumber of vessels with the exemption of Norway, Korea, The Netherlands and USA.

DET NORSKE VERITAS – APPLEDORE INTERNATIONAL
Report No. 2000-3527, rev. 0122 February 2001, B
World Fleet in OECD 1994, -96 & -98- GT
0
5000000
10000000
15000000
20000000
25000000
30000000
35000000
OECD Countries
Figure 10-3 World fleet contributions from OECD countries (ref.: /11/21/22/)

DET NORSKE VERITAS – APPLEDORE INTERNATIONAL
Page A-5Report No. 2000-3527, rev. 01
22 February 2001, B/feasibility study ship scrapping final report 21feb01.doc
Scrapping forecast – world fleet of cargo carrying vessels (2000-2025)
The calculated fraction in %, is based on the actual number of vessels and Dwt for each timeperiod (Table 6 in Lloyd’s statistics) divided by respectively the total number of vessel (45 576)and Dwt (765.8⋅106).
The calculated fraction in %, is based on the actual number of vessels and Dwt for each timeperiod (Table 6 in Lloyd’s statistics) divided by respectively the total number of vessel and Dwtof vessels greater (or equal) than 10,000 Dwt.
Table 10-1 CARGO CARRING SHIPS – DEADWEIGHT AND AGE PROFILE IN %,1999
0-4 5-9 10-14 15-19 20-24 25+Dwt category % No. % Dwt Age
% No. % Dwt % No. % Dwt % No. % Dwt % No. % Dwt % No. % Dwt % No. % Dwt
4999 or less 58.3 5.2 21 5.00 0.52 7.85 0.73 7.35 0.60 8.00 0.80 8.58 0.86 21.48 1.71
5000-9999 11.6 4.8 16 2.06 0.87 1.68 0.69 1.45 0.61 2.16 0.89 2.04 0.86 2.21 0.88
10000-14999 4.5 3.3 16 0.83 0.59 0.53 0.38 0.50 0.38 0.81 0.60 1.03 0.76 0.82 0.61
15000-19999 4.1 4.2 17 0.55 0.57 0.29 0.30 0.45 0.46 0.85 0.88 1.40 1.41 0.57 0.56
20000-24999 3.1 4.1 15 0.72 0.97 0.36 0.47 0.26 0.35 0.56 0.75 0.78 1.05 0.40 0.52
25000-29999 3.0 4.9 17 0.48 0.79 0.25 0.42 0.40 0.66 0.61 1.00 0.67 1.09 0.55 0.90
30000-34999 1.9 3.7 17 0.34 0.65 0.10 0.18 0.20 0.38 0.44 0.85 0.54 1.03 0.30 0.58
35000-39999 1.9 4.3 16 0.20 0.44 0.14 0.31 0.36 0.82 0.62 1.38 0.44 0.98 0.16 0.36
40000-44999 1.8 4.6 12 0.36 0.92 0.36 0.90 0.51 1.28 0.35 0.88 0.18 0.44 0.06 0.14
45000-49999 1.7 4.6 7 0.84 2.33 0.30 0.85 0.24 0.65 0.17 0.46 0.07 0.20 0.05 0.15
50000-59999 0.9 2.8 14 0.15 0.47 0.13 0.42 0.13 0.41 0.21 0.67 0.18 0.59 0.08 0.27
60000-69999 1.9 7.3 13 0.33 1.30 0.31 1.23 0.31 1.21 0.64 2.44 0.26 0.99 0.05 0.18
70000-79999 1.1 4.9 8 0.61 2.64 0.18 0.77 0.05 0.24 0.14 0.63 0.09 0.39 0.05 0.20
80000-89999 0.6 3.1 15 0.10 0.49 0.04 0.22 0.12 0.59 0.18 0.89 0.15 0.76 0.03 0.15
90000-99999 0.5 2.7 10 0.08 0.46 0.22 1.24 0.07 0.40 0.04 0.21 0.06 0.34 0.02 0.08
100000-124999 0.5 3.6 10 0.23 1.44 0.08 0.53 0.05 0.30 0.02 0.16 0.13 0.90 0.04 0.26
125000-149999 0.8 6.3 13 0.12 1.00 0.23 1.93 0.08 0.69 0.15 1.25 0.16 1.25 0.03 0.21
150000-174999 0.6 6.0 7 0.32 3.06 0.17 1.60 0.07 0.62 0.02 0.21 0.04 0.41 0.01 0.06
175000-199999 0.1 1.3 13 0.02 0.21 0.01 0.09 0.05 0.60 0.02 0.26 0.01 0.14 0.00 0.02
200000-224999 0.1 0.9 11 0.01 0.11 0.02 0.24 0.03 0.32 0.01 0.17 0.00 0.03 0.00 0.00
225000-249999 0.1 1.7 16 0.00 0.03 0.02 0.28 0.04 0.59 0.00 0.00 0.05 0.64 0.01 0.15
250000-274999 0.3 5.4 15 0.04 0.57 0.09 1.44 0.05 0.76 0.01 0.14 0.11 1.79 0.04 0.69
275000-299999 0.3 4.5 9 0.09 1.49 0.11 1.81 0.01 0.18 0.01 0.11 0.03 0.58 0.02 0.29
300000-349999 0.2 3.6 7 0.10 1.85 0.04 0.74 0.01 0.24 0.00 0.08 0.03 0.58 0.01 0.12
350000-399999 0.0 0.8 22 0.00 0.00 0.00 0.00 0.00 0.05 0.00 0.09 0.03 0.66 0.00 0.05
400000 and over 0.1 1.4 22 0.00 0.00 0.00 0.00 0.00 0.00 0.00 0.00 0.05 1.43 0.00 0.00
Sum 100 100 13.6 23.8 13.5 17.8 12.8 13.4 16.0 15.8 17.1 20.1 27.0 9.1
No/ Dwt 46002 8.E+08 0 6243 2.E+08 6211 1.E+08 5885 1.E+08 7375 1.E+08 7876 2.E+08 12412 7.E+07

DET NORSKE VERITAS – APPLEDORE INTERNATIONAL
Page A-6Report No. 2000-3527, rev. 01
22 February 2001, B/feasibility study ship scrapping final report 21feb01.doc
Table 10-2 Scrapping forecast distribution in %.2026-2022 2021-2017 2016-2012 2011-2007 2006-2002 <2002Dwt category % No. % Dwt Age
% No. % Dwt % No. % Dwt % No. % Dwt % No. % Dwt % No. % Dwt % No. % Dwt
10000-14999 15.0 3.7 16 2.76 0.66 1.74 0.42 1.66 0.42 2.68 0.66 3.40 0.85 2.73 0.68
15000-19999 13.7 4.6 17 1.84 0.63 0.97 0.33 1.49 0.51 2.83 0.97 4.65 1.57 1.89 0.62
20000-24999 10.2 4.6 15 2.38 1.08 1.19 0.52 0.87 0.39 1.85 0.83 2.59 1.16 1.31 0.58
25000-29999 9.8 5.4 17 1.59 0.88 0.83 0.46 1.33 0.73 2.03 1.11 2.23 1.22 1.84 1.00
30000-34999 6.4 4.1 17 1.13 0.73 0.32 0.20 0.66 0.43 1.47 0.94 1.78 1.14 1.01 0.65
35000-39999 6.4 4.8 16 0.66 0.49 0.47 0.35 1.20 0.91 2.06 1.54 1.46 1.09 0.53 0.40
40000-44999 6.0 5.1 12 1.20 1.02 1.18 1.00 1.70 1.42 1.17 0.98 0.58 0.49 0.19 0.16
45000-49999 5.5 5.1 7 2.79 2.58 1.01 0.94 0.79 0.72 0.55 0.51 0.23 0.22 0.17 0.16
50000-59999 2.9 3.1 14 0.49 0.53 0.43 0.47 0.43 0.46 0.68 0.75 0.61 0.65 0.28 0.30
60000-69999 6.3 8.2 13 1.10 1.45 1.03 1.37 1.02 1.34 2.13 2.71 0.87 1.10 0.15 0.20
70000-79999 3.7 5.4 8 2.02 2.93 0.60 0.86 0.18 0.27 0.48 0.70 0.30 0.43 0.15 0.22
80000-89999 2.0 3.4 15 0.32 0.54 0.14 0.24 0.39 0.66 0.58 0.99 0.50 0.84 0.10 0.17
90000-99999 1.6 3.0 10 0.27 0.51 0.72 1.37 0.24 0.45 0.12 0.23 0.20 0.38 0.05 0.09
100000-124999 1.8 4.0 10 0.75 1.60 0.27 0.59 0.15 0.33 0.08 0.17 0.43 1.00 0.12 0.29
125000-149999 2.5 7.0 13 0.39 1.11 0.75 2.15 0.27 0.77 0.51 1.39 0.52 1.38 0.09 0.23
150000-174999 2.1 6.6 7 1.05 3.40 0.57 1.77 0.22 0.69 0.07 0.23 0.14 0.46 0.02 0.07
175000-199999 0.4 1.5 13 0.06 0.23 0.03 0.10 0.18 0.67 0.08 0.29 0.04 0.16 0.01 0.03
200000-224999 0.2 1.0 11 0.03 0.12 0.06 0.27 0.09 0.36 0.04 0.18 0.01 0.03 0.00 0.00
225000-249999 0.4 1.9 16 0.01 0.03 0.06 0.31 0.14 0.65 0.00 0.00 0.15 0.71 0.04 0.17
250000-274999 1.1 6.0 15 0.12 0.64 0.31 1.60 0.17 0.85 0.03 0.15 0.37 1.99 0.14 0.77
275000-299999 0.9 5.0 9 0.29 1.66 0.35 2.01 0.04 0.20 0.02 0.12 0.12 0.64 0.06 0.32
300000-349999 0.7 4.0 7 0.34 2.05 0.14 0.83 0.04 0.26 0.01 0.09 0.10 0.64 0.02 0.14
350000-399999 0.1 0.9 22 0.00 0.00 0.00 0.00 0.01 0.05 0.01 0.10 0.10 0.73 0.01 0.05
400000 and over 0.2 1.6 22 0.00 0.00 0.00 0.00 0.00 0.00 0.00 0.00 0.18 1.59 0.00 0.00
Sum % 100 100 21.6 24.9 13.2 18.2 13.3 13.5 19.5 15.7 21.6 20.5 10.9 7.3
YearlyaverageNo/ Dwt*
598.8 34.8 365.8 25.5 367.6 19.0 540.8 21.9 598.0 28.7 757.0 25.5
* Based on an average in each time period

DET NORSKE VERITAS – APPLEDORE INTERNATIONAL
Page A-7Report No. 2000-3527, rev. 01
22 February 2001, B/feasibility study ship scrapping final report 21feb01.doc
Table 10-3 Distribution of vessels scrapped by type;
Distribution, vessels above 10,000 DWT:Ship Type Tanker Bulker Dry cargo Combos Gas
Distribution by no. 26% 30% 40% 3% 1%
Distribution by DWT 51% 31% 10% 8% 0
GRT relation to DWT
Average size (DWT) 120.000 52.000 13.000 130.000 -
Distribution, vessels below 10,000 DWT:Ship Type Tanker Bulker Dry cargo*
Distribution by no. 10% 25% 65%
Distribution by DWT 20% 26% 54%* Including all other vessels other than bulk and tank.
The relationships between DWT scrapped and the representing GRT have been estimated for thetwo size categories respectively, and have been found to:
Vessels above 10,000 DWT: DWT/ GRT = 1.729
Vessels below 10,000 DWT: DWT/ GRT = 0.999

DET NORSKE VERITAS – APPLEDORE INTERNATIONAL
Page A-8Report No. 2000-3527, rev. 01
22 February 2001, B/feasibility study ship scrapping final report 21feb01.doc
The World Navy Fleet
Table 10-4 Nato fleet (ref.: /8/).SubmarinesCountry
Nuclear DieselAircraftCarriers/Cruisers
Destroyers/Frigates
Belgium -- -- -- 3Canada -- 3 -- 16Denmark -- 5 -- 3France 10 2 2 39Germany -- 14 -- 15Greece -- 7 -- 16Italy -- 8 2 28Netherlands, The -- 4 -- 16Norway -- 12 -- 4Portugal -- 3 -- 10Spain -- 8 1 17Turkey -- 16 -- 21United Kingdom 15 -- 3 35United States 84 -- 31 97Sum 109 82 39 320
Table 10-5 Non-Nato-Europa fleet (ref.: /8/).SubmarinesCountry
Nuclear DieselAircraftCarriers/Cruisers
Destroyers/Frigates
Albania -- 1 -- --Azerbaijan -- -- -- 2Bulgaria -- 2 -- 1Croatia -- 1 -- --Poland -- 3 -- 2Romania -- 1 -- 7Sweden -- 10 -- --Ukraine -- 4 -- 9Yugoslavia -- 4 -- 4Russia 72 26 18 26Sum 72 52 18 51

DET NORSKE VERITAS – APPLEDORE INTERNATIONAL
Page A-9Report No. 2000-3527, rev. 01
22 February 2001, B/feasibility study ship scrapping final report 21feb01.doc
Table 10-6 SOUTH AND CENTRAL ASIA; EAST ASIA AND OCEANIA (ref.: /8/).SubmarinesCountry
Nuclear DieselAircraft Carriers/Cruisers Destroyers/ Frigates
Australia -- 4 -- 11Bangladesh -- -- -- 4China 6 57 -- 53India -- 19 1 24Indonesia -- 2 -- 17Japan -- 16 -- 57Korea, North -- 26 -- 3Korea, South -- 14 -- 34Malaysia -- -- -- 6Pakistan -- 9 -- 10Philippines -- -- -- 1Singapore -- 1 -- --Taiwan -- 4 -- 36Thailand -- -- 1 14Vietnam -- 2 -- 7Sum 6 154 2 277
Table 10-7 MIDDLE EAST AND NORTH AFRICA; SUB-SAHARAN AFRICA; LATINAMERICA (ref.: /8/).
SubmarinesCountryNuclear Diesel
Aircraft Carriers/Cruisers Destroyers/ Frigates
Algeria -- 2 -- 3Egypt -- 4 -- 9Iran -- 3 -- 3Iraq -- -- -- 2Israel -- 3 -- --Libya -- 2 -- 3Morocco -- -- -- 1Saudi Arabia -- -- -- 8Syria -- 3 -- 2United Arab Emirates -- -- -- 2Eritrea -- -- -- 1Nigeria -- -- -- 1South Africa -- 3 -- --Argentina -- 3 -- 13Brazil -- 6 1 18Chile -- 4 -- 8Colombia -- 2 -- 4Cuba -- 1 -- 2Ecuador -- 2 -- 2Mexico -- -- -- 9Peru -- 8 2 5Uruguay -- -- -- 3Venezuela -- 2 -- 6Sum 0 48 3 105
- o0o -

DET NORSKE VERITAS – APPLEDORE INTERNATIONAL
Page B-10Report No. 2000-3527, rev. 01
22 February 2001, B/feasibility study ship scrapping final report 21feb01.doc
APPENDIXB
MATERIAL AND WASTE STREAM QUANTIFICATION - SUPPORT

DET NORSKE VERITAS – APPLEDORE INTERNATIONAL
Page B-11Report No. 2000-3527, rev. 01
22 February 2001, B/feasibility study ship scrapping final report 21feb01.doc
Material and waste stream volumes
In the following, the volume distribution originating from the four different vessel categories areassessed. Priority groups have been focused upon.
Merchant vessels/ Inland waterway vesselsIn order to establish some generic norm in relation to volumes of materials and wastes thatnormally are found in a vessel ready for scrapping, a VLCC has been investigated (ref.: /19/),since it is thought to be representative for the VLCC fleet that will enter the market over the nextfew years. The vessel was built in Europe in 1976 and had a carrying capacity of 290,000 DWT.Main groups of substances of environmental concern were identified and attempted quantified.
Anodes
For protection against corrosion and fouling a number of anodes are fitted to the vessel’s hulland inside the tanks. According to the original specifications there were about 70,000 kgAluminum (Al) anodes and 40,000 kg Zinc (Zn) anodes on board when the ship was first built.It has been found that 30-70 % of the original amount is likely to be left when the ship is readyfor scrapping, hence our sample vessel would contain ~ 35,000 kg Al and ~ 20,000 kg Zn (theanodes will also contain small amounts of other metals including some heavy metals).
Batteries
Lead-acid batteries represent the largest volume of batteries on board and are found in radios,fire alarms, emergency start equipment, lifeboats, etc. The total weight (wet) of lead-acidbatteries on the sample ship amounts to 232 kg, of which there were 140 kg lead (Pb) and 44liters of sulfuric acid (H2SO4 (l) ). This amount is thought to be low in comparison with merchantvessels in general, since some vessels have configurations providing emergency lighting from abattery source in addition to a number of spare batteries.
Paints and coatings
Paints and coating are used on ships in order to protect against corrosion and fouling (subsurfacehull) and are known to contain various environmentally hazardous substances, such as certainheavy metals, PCB and tin-organic compounds (ex. TBT). Documentation indicates that 65,000liters of paints and coatings were used when the ship was built. A considerable amount of this isvolatile compounds that will evaporate during coating. The amount left of the original paintsand coatings has been estimated to be about 25 % on the hull/ superstructure and about 60 % onthe inside of the vessel. However, due to accumulation caused by new applied paintworkfollowing maintenance, the total amount of paint on the ship ready for scrapping is most likelymore than the amount originally applied. The remaining TBT from anti-foulings was estimatedto be 1,200 kg.
Another source gives an estimate of 3 liters of paints and coatings per GT of ship (ref.: /35/). Ofthis, 10% of the products used are polyurethanes, 15% are anti-foulings, 12% are shop primers(zinc silicates), and the balance is mainly epoxy based.

DET NORSKE VERITAS – APPLEDORE INTERNATIONAL
Page B-12Report No. 2000-3527, rev. 01
22 February 2001, B/feasibility study ship scrapping final report 21feb01.doc
In Norway, the PCB content in paint used on vessels in the period 1950-1970 has been found tobe approx. 5% (wet paint) (ref.: /38/).
CFC
The total amount of refrigerants on board was estimated to be approx. 1000 kg of R22 (CHClF2)and Freon-12 (CF2Cl2), and was used in the control room, storage rooms, air conditioningsystems and as spare.
Asbestos
Two ships were assessed with respect to asbestos content. The sample VLCC of 290,000 DWTcontained about 7,000 kg asbestos and a 100,000 DWT chemical tanker had about 10,000 kg ofasbestos. It must be noted that the vessel size is not necessarily decisive for heat insulationrequirements in the engine room.
Steel
The amount of steel will vary according to ship type. Empirical methods suggest some 15 % ofthe DWT for VLCC and ULCC to be representative for the steel weight. The steel fraction willbe somewhat higher for smaller vessels (ref.: /34/).
Since the relationships above are for very large ships only, some relationships betweensteelweight and deadweight that would be valid across a wider range of vessel sizes have beendeveloped:
0.7-1.8 million tonnes steelweight equates to 3.6-9.0 million DWT.
This means that about 20% of the DWT represents the steel weight (Ref. Appledore).
Electrical installations
The approximately 50,000 meters of cables on board our sample ship contained an estimatedamount of 45,000 kg copper (Cu), 10,000 kg PVC and 20,000 kg rubber.
PCB was detected in a cable sample from an on-site assessment at a ship scrapping yard inBangladesh. It is not established if the PCB came from the original cable material or if the cablehad been contaminated with PCB-containing oil (ref.: /20/). EPA has recently revealedmaximum PCB-concentrations from cable samples taken from a vessel during scrapping at280.000 ppm. Based on this, it seems likely to suggest that the configuration of cables arrivingfrom vessels being decommissioned will most likely contain PCB in some quantities.
It has been shown that capacitors in light fittings may contain up to 30 mg PCB, and thatfluorescent light tubes might contain up to 15 mg mercury (Hg) (ref.: /19/). Our sample VLCChad 481 light fittings and more than 1,000 light tubes, which yields a total of 14 grams of PCBand about 15 grams of Hg. There are also other sources of Hg and PCB on a ship that maycontribute more to Hg- and PCB-containing waste, but these were not assessed in our sampleship.
Oil
The oil content (remaining onboard when beached) of the VLCC was estimated as follows:
Lubrication oil: approx. 20,000 liters
Hydraulic oil: approx. 18,000 liters

DET NORSKE VERITAS – APPLEDORE INTERNATIONAL
Page B-13Report No. 2000-3527, rev. 01
22 February 2001, B/feasibility study ship scrapping final report 21feb01.doc
Heavy fuel oil: approx. 333,000 liters
Oil sludge (sand, rust and oil): approx. 2,000,000 liters
Offshore StructuresData from seven installations in the North Sea has been compiled in order to establish a genericnorm in relation to volumes of materials and wastes that are expected to be found in an offshorestructure ready for scrapping (ref.: /25/).
Data regarding materials and wastes from the 7 installations have been summarised producing a“unit installation” which is an average installation of the seven studied installations. Althoughthis is a coarse simplification, the method gives numbers that may give an impression ofmaterials and wastes to be produced in the future from offshore installations.
An offshore installation may in general be divided into two main parts:• Topside with different modules (drilling, helideck, living quarter, separation, utilities etc.)
The topside may therefore contain several different types of materials and wastes.• Jacket (steel structure with piles of steel filled with concrete).Based on the evident difference between the topside and jacket the two parts have been studiedseparately.
Re-usable equipment
There is little information about quantities of re-usable equipment from offshore installations.However it may be assumed that pumps, valves, compressors, life saving equipment etc. fromtopsides may be reused, but this depends on the status of the equipment. It may be assumed that1-5 % of the topside weight is equipment that may be reused. Correspondingly, it may beassumed that there are no directly reusable parts from the jacket. It should be emphasised thatthis is an estimate.
Recyclable material
Table 10-8 summarises the amounts of recyclable materials from topside and jacket. The tablealso gives amounts of recyclable material for a unit installation and for the 15 installations thatare expected to be decommissioned annually for the next 15 years.
Table 10-8 Recyclable material from topside and jacket.Item Steel
(tons)Stainless Steel
(tons)Copper (Cu)
(tons)Aluminium (Al)
(tons)Concrete
(tons)Topside 3,481 190 238 8 14Jacket 3,310 31 264SUM “unit installation” 6,791 190 238 39 278SUM 15 unit installations 101,865 2,850 3,570 585 4,170

DET NORSKE VERITAS – APPLEDORE INTERNATIONAL
Page B-14Report No. 2000-3527, rev. 01
22 February 2001, B/feasibility study ship scrapping final report 21feb01.doc
As can be seen from Table 10-8 the amount of steel from offshore installations will constituteabout 100,000 tons annually for the next 15 years. The topside and the jacket have in a unitinstallation about the same amount of steel. The stainless steel originates from equipment,coverings etc. exposed in such a way that additional anti-corrosive activity is required.
The amount of copper originates mainly from electrical cables on the topside.
Aluminium originates mainly from anodes on the jacket. The anodes consist of about 98 % Aland almost 2 % sink (Zn). Thus the weight of aluminium given in Table 10-8 constitutes almostthe weight of the anodes.
Concrete consists mainly of grouting in the piles in the Jacket of the steel platforms. It isdebatable whether concrete could be recycled or if it should be regarded as waste material. Inthis study it is however assumed that the concrete may be used e.g. in construction of roads, asfilling material etc. and hence it is regarded as a recyclable material. Whole concrete installationsare not discussed here.
Waste material
Table 10-9 summarises the amounts of waste materials from topside and jacket. The table alsogives amounts of waste material for a unit installation and for the 15 installations that areexpected to be decommissioned annually for the next 15 years.
Table 10-9 Waste material from topside and jacket.Item Wood
(tons)Structural
water(tons)
Marine growth(tons)
Rest(tons)
Topside 1.4 318Jacket 376 367SUM “unit installation” 1.4 376 367 318SUM 15 unit installations 21 5,640 5,505 7,770
Wood mainly originates from furniture, walls etc.
The structures of the jackets are often water filled (structural water). Corrosion inhibitors(biocides) are added the water in order to avoid corrosion. In certain cases it will be allowed todischarge this water to the sea.
The amount of marine growth varies depending e.g. on the water depth. The marine growthconstitutes a large amount of sessile organisms that grow on the jacket and represents waste thathas to be treated onshore.
As can be seen from Table 10-9 the rest column constitutes an extensive number. In Table 10-10the most important waste materials in the rest column is partly specified. It should be emphasisedthat the numbers in Table 10-10 is both given as tons, kg and numbers of units.

DET NORSKE VERITAS – APPLEDORE INTERNATIONAL
Page B-15Report No. 2000-3527, rev. 01
22 February 2001, B/feasibility study ship scrapping final report 21feb01.doc
Table 10-10 Specification of some waste materials from the “Rest” column in Table 10-9.Item Paint
(tons)Insu-lationtotal(tons)
As-bestosin insul.(tons)1
Plas-tic incables(No.)
Lighttubes(No.)
Radio-activesmoke
detector(No.)
Cd,emer-gencylight
battery(kg)
Ni,emer-gencylight
battery(kg)
Oilfilledtrans.(No.)
Levelswitc(No.)
Hal-on
(kg)
CFC’s
(kg)
Topside 32 54 13 60 1,357 15 45 65 1 24 74 57Jacket 19
SUM “unitinstallation”
51 54 13 60 1,357 15 45 65 1 24 74 57
SUM 15unitinstallations
765 810 195 900 20,355
225 675 975 15 360 1,106 857
1: Calculated based on an assumption that 0.3 % of topside weight is asbestos /26/.
Paint is one of the main contributors to the rest column in Table 10-9. The types of paint usedwill vary considerably.
Insulation is the generic term for e.g. mineral wool and asbestos. Asbestos has been calculatedassuming that 0.3 % of the topside weight is asbestos.
The plastic number given is only for plastic in cables. No other number has been available withregard to plastics.
One fluorescent light tube contains approximately 15 mg of mercury which means that the tubeshave to be treated as hazardous waste.
Based on available information there are only some models of smoke detectors that may containa radioactive source. Numbers of such items are given in Table 10-10. Another source ofradioactive material is scale, which may be found in e.g. main processing pipes on theinstallations. However there have not been any available numbers with regards to amounts ofsuch scale on offshore installations. In addition it should also be noticed that in emergency exitplates there might also be a radioactive source. However many of these plates will be removedbeforehand. No numbers are available.
Batteries in the emergency light fittings contain nickel and cadmium and the amounts aresummarised in Table 10-10. However there are also battery rooms with battery packages on theinstallations. These batteries are much larger and consist on average 7 weight-% cadmium and 8weight-% nickel. From other sources (ref.: /27/) than the one referred to with regard toemergency light fittings (ref. /25/), it may be assumed that the cadmium and nickel content in theemergency light fitting batteries constitutes about 15 % of the total content of all batteries on aninstallation. Hence the amount of nickel and cadmium per unit installation is about 4.5 tons and6.5 tons respectively. In addition there is an alkaline electrolyte solution in these batteries mainlyconsisting of potassium hydroxide (KOH) and small amounts of lithium hydroxide (LiOH) indistilled or de-ionised water. On a unit installation there will be about 4,500 litres of suchelectrolyte (ref.: /27/). In addition it should be noticed that there are lead batteries in lifeboats,MOB boats and on air compressors. These batteries consist on average of about 90 % lead. On aunit installation it may be assumed that there will be about 450 kg lead in such batteries.
Transformers are either oil cooled or air-cooled. A unit platform will on average have one oilcooled transformer. The oil in the transformer may have PCB containing oil. However often thisoil has been changed during maintenance and hence the PCB-containing oil may have been

DET NORSKE VERITAS – APPLEDORE INTERNATIONAL
Page B-16Report No. 2000-3527, rev. 01
22 February 2001, B/feasibility study ship scrapping final report 21feb01.doc
replaced. It should however be noticed that there might be traces of PCB in the changed oil. Ifthe oil contains more than 50 ppm PCB the oil has to be treated as hazardous waste.
Old level switches could contain mercury. In recent years the use of mercury in level switcheshas decreased. However most of these level switches have a long lifetime and thus it should beexpected that some switches are original. The switches should be opened in order to verify theHg-content. Content of mercury in each level switch varies. No numbers are availableconcerning the content.
Halon may be found in fire fighting systems but has for most installations been phased outalready.
CFC’s may be found in refrigeration plants in fixed and portable units. Originally these werefilled with CFC’s that are damaging to the environment. However due to phase-out of theserefrigerants, all refrigeration plants should have been recharged with alternative refrigerants. Thenumbers given in Table 10-10 are only given for fixed units. The portable units (fridge’s,freezers, small water coolers and ice machines) contain about 0.1 to 0.4 kg of CFC per unit. Therefrigeration units additionally contain an amount of oil and not uncommonly an amount ofmercury in switches. Amounts are assumed to be very small. The number of units onboard a unitinstallation is not identified. However portable units can be sent ashore for recycling withoutopening the refrigeration system.
Hydrocarbons and chemicals (except halon and CFC’s) are not included in the list of wastes thathave to be treated. The amount of hydrocarbons and chemicals will vary considerably with thedifferent fields and types of installation, and thus it is not possible to estimate numbers for a unitinstallation.

DET NORSKE VERITAS – APPLEDORE INTERNATIONAL
Page B-17Report No. 2000-3527, rev. 01
22 February 2001, B/feasibility study ship scrapping final report 21feb01.doc
Naval vesselsWhilst it has been possible to develop general assumptions for the size range of vessels commonto the west European navies, no data exists regarding the much larger warship types found in theex-Soviet and US navies (see table below).
Table 11 “Typical” west European naval ship dataShip Type LOA B Draught Depth Steelweight Lightship
/Std DisptFull Load
DisptSteelwt/
DisptSubmarine 78 781Patrol Craft 63 10 5,5 329 583 56 %Corvette 83 11,5 3,4 7,2 438 1103 40 %T22 Frigate 148 14,75 9,41 1775T23 Frigate 133 16,1 5,5 9 1264 3500 4200 36 %Canada Frigate 134 16,4 4,6 11,4 1700Frigate 137 15,55 5,78 11,58 1370 4382 31 %T42 Destroyer (short) 125 14,3 6,4 9,7 2991T42 Destroyer (stretched) 141 14,9 5,8 9 1283 3500 4775 37 %T45/CNGF 145 20,5 5 11,8 2300 4916 47 %Ocean Survellance 65 13,1 4,3 6,1 763 1364 56 %Fleet Oiler US 180 26,82 9,75 14,83 6586 9198 72 %Fleet Oiler US 207 29,75 10,52 15,24 10928 14946 73 %Helicopter Carrier 129 18,68 4,41 15,25 4470 0 %Aircraft Carrier(Illustrious) approx.
206,6 27,5 6,4 11500 19500 59 %
- o0o -