feasibility testing for sample storage and transport for
TRANSCRIPT
Anna Englund
Feasibility Testing for Sample Storage and Transport for Nucleic Acid Assays
Helsinki Metropolia University of Applied Sciences
Bachelor of Laboratory Services
Laboratory Sciences
Bachelor’s Thesis
15.12.2017

Abstract
Author(s) Title Number of Pages Date
Anna Englund Feasibility Testing for Sample Storage and Transport for Nucleic Acid Assays 33 pages + 3 appendices 15 December 2017
Degree Bachelor of Laboratory Services
Degree Programme Laboratory sciences
Instructor(s)
Jaakko Kurkela, R&D manager Tiina Soininen, senior lecturer
This study was conducted for Mobidiag Oy as part of their part of a project developing new technologies for potential products. The aim of was to develop stool sample tube for detection of pathogens by PCR method. Purpose was to develop a sample tube that in-activates the pathogens from the stool sample and stabilizes samples nucleic acids. PCR is slowly becoming a norm, as concerns detecting pathogenic organisms. PCR is less time consuming and less expensive than traditional culture-based methods. It is highly precise method and it is becoming increasingly used for analysis detecting patho-gens from stool and other biological specimen in clinical laboratories. Feasibility testing of the sample tube was made by series of different methods to get data of the possible composition of the sample tube and its capabilities needed for the sample tube. Data gathered for sample tube in this study were: NA stability, nucleic acid binding, microbial inactivation, detergent optimization and inhibition testing. Results gave some good candidates for composition of the sample tube and the compo-sitions microbial inactivation attributes. NA stability testing is still ongoing to gather reliable data for the NA stability. Compositions also were found to inactivate pathogens, which is important attribute for sample tube. Gathered results of this study will be utilized for further developing the sample tube in the future.
Keywords PCR, stool sample, feasibility testing
Tekijä Otsikko Sivumäärä Aika
Anna Englund Soveltuvuustestaus näyteen säilytykseen ja kuljetukseen nukleiinihappomäärityksiä varten 33 sivua + 3 liitettä 15.12.2017
Tutkinto Laboratorioanalyytikko (AMK)
Koulutusohjelma Laboratorioalan ko
Ohjaajat
R&D päällikkö Jaakko Kurkela Lehtori Tiina Soininen
Opinnäytetyö suoritettiin osana Mobidiag Oy:n projektia uusien tuotteiden kehittämi-seen. Opinnäytetyön tavoitteena oli tutkia ja kehittää ulostenäyteputkea, jota voidaan käyttää patogeenien detektointiin PCR-metodilla. Tarkoituksena oli saada aikaiseksi näyteputki, joka inaktivoi patogeeneja ulostenäytteestä ja stabiloi näytteen nukleiiniha-pot. PCR-metodista on tullut normi patogeenisten organismien detektoinnissa. PCR-metodi on vähemmän aikaa kuluttavaa ja halvempaa kuin perinteiset viljelmätestit. Se on myös hyvin tarkka metodi, joka on tullut kasvavasti merkittäväksi metodiksi patogeenien de-tektointiin ulostenäytteistä ja muista biologisista näytteistä kliinisissä laboratorioissa. Näyteputken soveltuvuustestaus tehtiin suorittamalla erilaisia analyyseja, jotta saatai-siin dataa näyteputken mahdollisesta koostumuksesta ja sen tarvittavista ominaisuuk-sista. Dataa näyteputkea varten kerättiin nukleeiinihappojen stabiilisuudesta, mikrobio-logisesta inaktivaatiosta, detergenttien ominaisuuksista ja inhibition testauksesta. Tulokset antoivat osviittaa näyteputken mahdollisesta koostumuksesta ja koostumuk-sen mikrobiologisesta inaktivaatiokyvystä. NA-stabiilisuustestaus on vielä kesken, joten tuloksia koostumuksen stabiilisuusominaisuuksista ei voida pitää luotettavina, mutta suuntaa antavina. Näyteputken kompositiot inaktivoivat myös patogeeneja, joka on hy-vin tärkeä ominaisuus komposition kannalta. Opinnäytetyössä saatuja tuloksia voidaan käyttää hyväksi näyteputken kehittämisessä tulevaisuudessa.
Keywords PCR, ulostenäyte, soveltuvuustestaus
Contents
Abbreviations 4
1 Introduction 1
2 Different Biological Specimens 1
3 Requirements of Sample Tube 2
3.1 Inactivation of Pathogens 2 3.2 DNA Stability 3
4 Preanalytics and Challenges of Stool Sample Tube 3
4.1 Sampling and Storing of Stool Sample 3 4.2 Sample Preparation 4 4.3 PCR Inhibition 5
5 DNA extraction 6
5.1 DNA extraction with Zymo Quick-DNA Fecal/Soil Microbe Miniprep Kit 6 5.2 DNA extraction with NucliSENS easyMAG instrument 7
6 Materials and methods 8
6.1 Nucleic Acid Binding 10 6.2 Salmonella Lysis Test 12 6.3 Nucleic Acid Stability 12 6.4 Microbial Inactivation 13
6.4.1 Escherichia coli 13 6.4.2 Straphylococcus aureus 14 6.4.3 Rhodococcus equi 15 6.4.4 Candida albicans 16
6.5 Microbial Inactivation Testing 16 6.6 Maximal Volume of Inactivation 16 6.7 Detergent Optimization 17 6.8 Inhibition Testing 18
7 Results 19
7.1 Results of Nucleic Acid Binding and Salmonella Lysis Test 19

7.2 Results of Nucleic Acid Stability 23 7.3 Results of Microbial Inactivation 27 7.4 Results of Detergent Optimization 30 7.5 Results of inhibition testing 32
8 Discussion 33
References 34
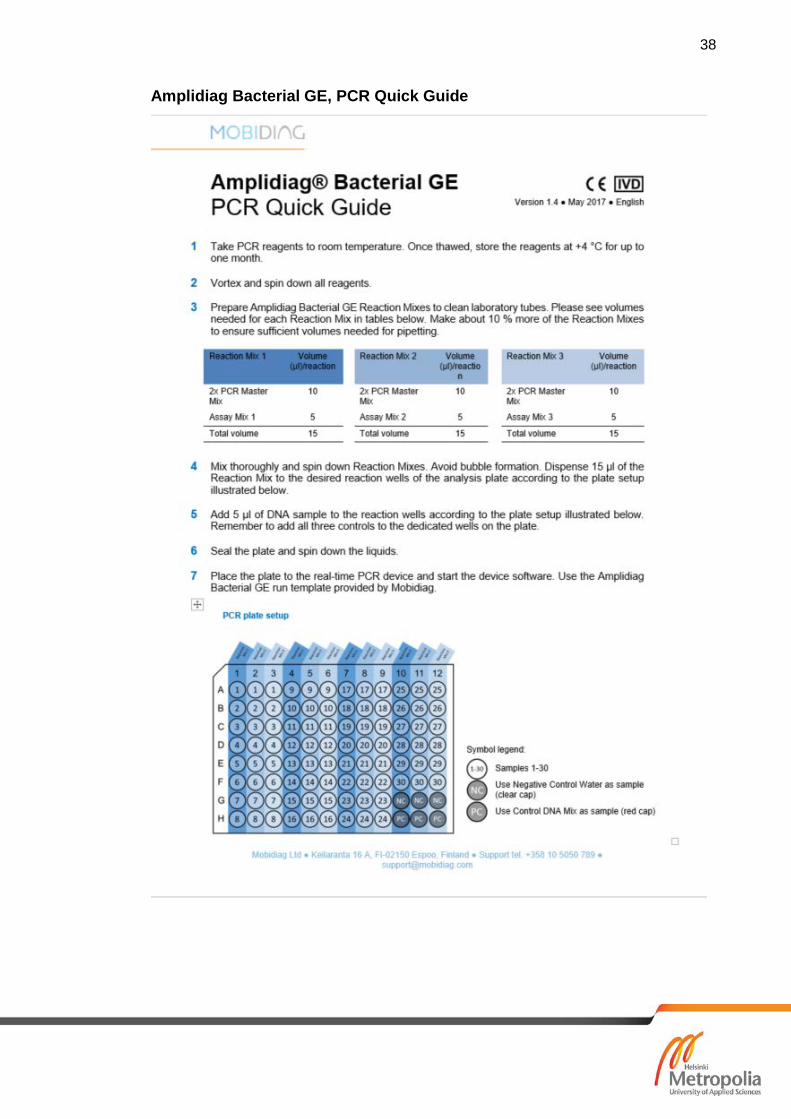
Appendices Appendix 1. HUSLAB instructions for sampling parasite sample for nucleic acid assay (F-ParaNhO) Appendix 2. Instruction manual, Quick-DNA Fecal/Soil Microbe Miniprep Kit Appendix 3. Amplidiag Bacterial GE PCR Quick Guide

Abbreviations
CFU Colony-forming unit. Unit used to present the number of col-
onies of bacteria or fungi in sample.
CLED agar Cystine lactose electrolyte deficient agar. CLED agar is used
to isolate urinary organisms. Lactose-positive bacteria form
yellow colonies on this agar.
Cq Quantification cycle. Cq value is the cycle were amplification
of the target curve is maximal.
EHEC Enterohamerrhagic Escherichia coli. One of the bacteria that
causes food poisoning.
MRSA Methicillin-resistant Straphylococcus aureus. Strand of S. au-
reus bacteria that is resistant to common antibiotics. MRSA
infects people with weakened immune system.
NA Nucleic acid. Biomolecules that consist of different RNA and
DNA.
PBS Phosphate buffered saline. PBS is water based salt solution
that is used for variety of biological analysis.
RT Room temperature.
TE buffer Buffer that contains EDTA and Tris (tris(hydroxymethyl)ami-
nomethane). TE buffer is commonly used in molecular biol-
ogy laboratories as it solubilizes DNA and RNA.
1
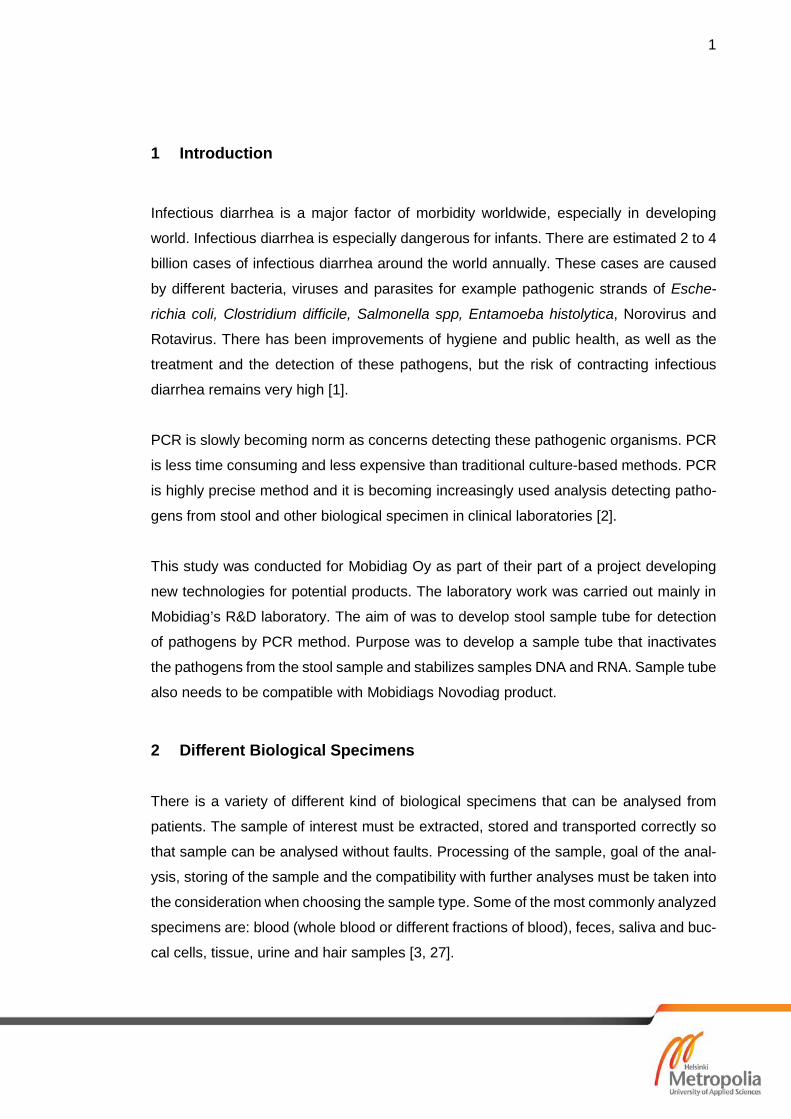
1 Introduction
Infectious diarrhea is a major factor of morbidity worldwide, especially in developing
world. Infectious diarrhea is especially dangerous for infants. There are estimated 2 to 4
billion cases of infectious diarrhea around the world annually. These cases are caused
by different bacteria, viruses and parasites for example pathogenic strands of Esche-
richia coli, Clostridium difficile, Salmonella spp, Entamoeba histolytica, Norovirus and
Rotavirus. There has been improvements of hygiene and public health, as well as the
treatment and the detection of these pathogens, but the risk of contracting infectious
diarrhea remains very high [1].
PCR is slowly becoming norm as concerns detecting these pathogenic organisms. PCR
is less time consuming and less expensive than traditional culture-based methods. PCR
is highly precise method and it is becoming increasingly used analysis detecting patho-
gens from stool and other biological specimen in clinical laboratories [2].
This study was conducted for Mobidiag Oy as part of their part of a project developing
new technologies for potential products. The laboratory work was carried out mainly in
Mobidiag’s R&D laboratory. The aim of was to develop stool sample tube for detection
of pathogens by PCR method. Purpose was to develop a sample tube that inactivates
the pathogens from the stool sample and stabilizes samples DNA and RNA. Sample tube
also needs to be compatible with Mobidiags Novodiag product.
2 Different Biological Specimens
There is a variety of different kind of biological specimens that can be analysed from
patients. The sample of interest must be extracted, stored and transported correctly so
that sample can be analysed without faults. Processing of the sample, goal of the anal-
ysis, storing of the sample and the compatibility with further analyses must be taken into
the consideration when choosing the sample type. Some of the most commonly analyzed
specimens are: blood (whole blood or different fractions of blood), feces, saliva and buc-
cal cells, tissue, urine and hair samples [3, 27].

2
Specimens are extracted from patient with a specific protocol and then either stored or
analyzed. Depending on the sample, method and how the sample is stored, the sample
can be stored in different temperatures for different amount of time. For example, blood
samples do not need rapid processing after collection. However, with other biological
specimen the time between collection of the sample and the analysis of the sample
should be minimized.
Depending on the specimen or the further analysis of the sample, specimens can be
stored in different conditions. Usually, to ensure the DNA stability, specimen should be
stored from -0.5 °C to -196 °C [3, 32-33].
3 Requirements of Sample Tube
Sample tube developed in this study is supposed to be swab tube for fecal samples.
Tube contains 2 ml of liquid composition that must inactivate pathogenic organisms and
ensure the stability of NA. Pathogenic inactivation is important to make sure that the
sample is safe to handle, transport and process. Sample tube also must stabilize DNA
and RNA for further analysis and storage of samples. The sample tube needs to contain
components that do not inhibit the further PCR method or destroy the DNA of the sample.
This particular sample tube should be also compatible with molecular systems. Some of
the specific concentrations of components and compositions cannot be specified in this
study. Compositions consists of guanidinium thiocyanate, detergents and number of
other components to ensure the sample preservation and further analysis.
3.1 Inactivation of Pathogens
Many clinical laboratory personnel handle potentially pathogenic samples daily for ex-
ample blood and stool samples. These samples may contain pathogenic bacteria, vi-
ruses and parasites. This poses potential health risk to person handling the sample.
Therefore, inactivation of the possible pathogens is important. Bacterial pathogens can
be inactivated by using disinfect reagents in sample storing (for example guanidium thi-
ocyanate), using unfavourable pH or using harmful reagent for pathogens. If sample is

3
collected correctly and sample tube is handled in the appropriate manner, the sample
should not pose health risk to personnel after the collection of the sample [4].
3.2 DNA Stability
Stability of DNA is dependent of hydrogen bonds between DNA strands and base stack-
ing interactions. Water molecules surrounding the DNA effects the balance and stability
of the DNA. This makes the buffer where DNA is stored extremely important so that
hydrogen bonds hold. Also, very important factor of DNA stability is temperature. In too
high temperatures DNA strands can denaturate, separating from each other. Also spon-
taneous hydrolysis can damage DNA and high temperature can speed up the hydrolysis.
Hydrolysis can be blocked by chelation of divalent cations, like Mg2+, for example with
EDTA [5; 26].
4 Preanalytics and Challenges of Stool Sample Tube
4.1 Sampling and Storing of Stool Sample
Sampling of the stool sample can vary depending on the further analysis, analysable
bacteria, virus or parasite. Before some of the sampling, patient must follow certain diet,
avoid specific medicine or alcohol. Patient is given equipment and sampling instructions
to follow and collect the sample according to the instructions. It is important that patient
does not contaminate the sample or the outside of the sample tube [6].
There are different kind of sample tubes and methods of collecting the sample, usually
stool samples are taken with swab or scooping some of the stool to the given sterile tube,
as shown in figure 1. Swabs are taken by swabbing the cotton swab in the stool and
transferring the swab to either liquid or gel sample tube. After collecting the sample,
patient must label the sample with name, social security number, time and date of the
sampling. Sample should be delivered to the laboratory as soon as possible. If sample
tube can’t be delivered immediately, sample must be stored in +4 °C. Some of the sam-
ples must be taken to laboratory within same day. Appendix 1 has HUSLAB laboratory’s
instructions for taking sample for parasite detection for nucleic acid assays.

4
Figure 1. Example of swab sample tube for nucleic acid assays. Sample is collected with swab. (Photo copied from from http://products.copangroup.com/index.php/products/genetics/enat [28])
When storing stool sample, the cold chain must be uninterrupted and the time between
collecting the sample and analysis must be cut to the minimum. Stool samples can be
stored in +4 °C for short term and for longer storing time -20 °C freezer is required. DNA
stability suffers with time, if the sample is not stored correctly.
4.2 Sample Preparation
Stool sample is challenging sample for molecular diagnostic, because it is not homoge-
nous, has lot of solid matter and the sample is complex and rich in macromolecules.
Stool sample can be prepared before analysing to minimize these problems. Some of
the commonly used methods are to filter, centrifuge, dilute or homogenise the sample
before moving to analysing the sample. These methods are usually time consuming, so
user benefits not doing these steps [7].
Stool matter is usually stored in –20 °C for longer periods of time. To prepare the stool
sample analysis; frozen fecal matter was weight and diluted into PBS solution (15 %

5
stool in PBS). Stool suspension was then vortexed continuously for 10 minutes and be-
fore pipetting the suspension was left to set to prevent the solid matter getting to samples
or clogging the pipette. Also, good method of avoiding the effects of inhibitors is to dilute
the sample before the PCR. Samples were diluted in 1:10 ratio and analysed in parallel
to the undiluted samples to get idea of inhibition in the samples.
4.3 PCR Inhibition
PCR is very precise method to use, but PCR inhibitors have always been problem for
the analysis. Most PCR inhibitors interfere with DNA polymerase and inhibit the PCR
reaction that way or inhibitors can directly bind to the DNA obstructing the copying of the
DNA. This affects the amplification of DNA sequence, which leads to weaker signal or
false negative results. Most problematic issue concerning the PCR inhibitors is the pres-
ence of inhibitors in the sample. PCR inhibitors can also come from processing contain-
ers or contaminated reagents. Most common samples that contain known inhibitors are
blood, soil, stool and fabrics. Also, the materials and reagents that come to contact with
the sample include inhibitors, such as many salts, ionic detergents, ethanol, isopropanol
and phenol. These reagents are often used during sample processing [8; 9].
To prevent the PCR inhibitors, the sample should be processed with as little inhibitors
as possible. This is problem if the sample itself contains a lot of inhibitors. In case of
samples that are on other material, sample can be collected with swab-transfer method,
which eliminates some of the inhibitors [9].
Stool is one of the most complex samples when PCR is used, because feces contain lot
of bacteria and inhibitors that come from food or other biological material [7]. Handling
of stool sample is also problematic, since stool sample is not homogeneous and solid
matter in feces can interfere with used systems. Stool samples contain hard to remove
inhibitors such as: polysaccharides, fecal fats, haemoglobin, bile salts and uric acids [10].
These PCR inhibitors might weaken the PCR results or give wrong negative results.

6
5 DNA extraction
DNA extraction is commonly used method in laboratories. DNA was first extracted by
Friedrich Miescher in 1869 from leucocyte cells. Miescher intended to study proteins of
the cell, when he discovered DNA, which he first called nuclei. After the discovery he
shifted his studies to DNA. He developed method to first separating cells’ nuclei and
isolation the DNA [11].
There is number of ways to extract nucleic acids (NA) from samples. The most used
methods are phenol-chloroform method, salting out, ion exchange and silica binding
methods. Nowadays many extractions of NA in laboratories are made by commercial kits
or automated equipment, which usually are based on silica binding method. When
choosing the method of nucleic acid extraction, one must consider the chemistry and
materials used in particular method, sample, cost of the method, contamination risks and
the further analysis of DNA [12].
Typically, the first step of DNA extraction is creating lysate, breaking cellular structure
and releasing DNA from cells. DNA is then separated from cellular debris and other un-
wanted material by centrifuging the sample. After that, target DNA is purified from un-
wanted nucleic acids and proteins for further analysis of sample [13].
In this study purification of DNA was made by silica DNA binding method. This method
was used, because it was automated in used laboratory (easyMAG equipment). Silica
binding method is based on the silica’s nucleic acid binding attribute when there is high
concentration of chaotropic salts present, such as guanidium thiocyanate. These salts
facilitate binding the nucleic acids to silica particles, nucleic acids are then washed, and
DNA can then be eluted with for example water or TE buffer. Absence of chaotropic
reagent releases the nucleic acid from silica [13].
5.1 DNA extraction with Zymo Quick-DNA Fecal/Soil Microbe Miniprep Kit
In this study DNA was first extracted with Zymo Research Corporation’s Quick-DNA Fe-
cal/Soil Microbe Miniprep Kit, modifying the kits instructions by replacing the kits washing
buffers with 70 % ethanol and DNA elution buffer with TE pH 8.0. This was made to ensure

7
the compositions abilities to bind the NA to column and release of the NA to elution buffer in
known circumstances. In this extraction kit DNA is extracted by using spin columns with silica
membrane. Appendix 2 has Quick-DNA Fecal/Soil Microbe Miniprep kit’s protocol.
5.2 DNA extraction with NucliSENS easyMAG instrument
DNA and RNA from the samples were also extracted with NucliSENS easyMAG instru-
ment, which extraction method is based on silica particles nucleic acid binding properties
when guanidinium thiocyanate or other chaotropic reagent is present, as illustrated in
figure 2. Silica is separated with magnets, NA is washed and eluted to a desired volume.
Most of the extractions made in this study was made with EasyMAG instrument. In one
extraction 24 samples can be extracted and one run takes about 1 hour [14].
Figure 2. Extraction princicple of EasyMAG. [14]

8
6 Materials and methods
First background research was made to determine some of compositions that could be
suitable for sample tube. Figure 3 illustrates used methods and flow of the analysis.
Figure 3. Flow chart of the analysis of sample tube compositions.
Range of concentrations were selected for each component and different kind of com-
positions were made with MODDE Pro –software. MODDE Pro –software is Sartorius
Stedim Biotechs software used to create experimental setups [15]. Software gave total
of 24 different compositions, which were taken to analysis. These 24 compositions had
some parallel compositions to verify the results. The first series of compositions is called
N-series (shown in table 1.).

9
Table 1. Compositions of N-series. 0 means no component/detergent was added to the
composition. Concentrations stated are relative. Component 1 and component 6 was added
in every composition, just with different concentrations.
Com-
ponent
1
Com-
ponent
2
Com-
ponent
3
Com-
ponent
4
Com-
ponent
5
Com-
ponent
6
Com-
ponent
7
Deter-
gent 1
Deter-
gent 2
Deter-
gent 3
N1 1 0 0 0 0 2 0 5 0 0
N2 1 1 0 1 0 1 1 0 1 0
N3 2 0 0 0 1 1 1 5 5 0
N4 2 0 1 1 0 1 1 1 0 0
N5 2 0 1 0 1 2 0 0 1 0
N6 1 1 1 1 1 2 0 1 5 0
N7 2 1 1 1 1 1 0 5 0 1
N8 2 0 0 1 1 2 1 1 1 1
N9 1 0 0 0 0 1 0 0 5 1
N10 2 1 1 0 0 2 1 0 0 1
N11 1 1 1 0 1 1 1 5 1 1
N12 2 1 0 0 0 1 0 1 5 1
N13 1 1 0 0 1 2 1 1 0 5
N14 1 0 1 0 0 1 0 1 1 5
N15 1 0 1 1 0 2 1 0 5 5
N16 1 0 0 1 1 1 0 0 0 5
N17 2 1 0 1 0 2 0 5 1 5
N18 1 0 0 0 0 1 0 0 5 1
N19 1 1 0 0 1 2 1 1 0 5
N20 2 1 1 1 1 1 0 5 0 1
N21 2 1 1 0 1 1 0 1 0 0
N22 1 1 0 2 1 2 0 5 1 0
N23 1 0 0 2 0 1 0 1 5 0
N24 2 0 1 2 0 2 0 5 0 0
These 24 compositions where tested with different molecular- and microbiological anal-
ysis. The second series of compositions is called S-series. S-series was made the same
way as N-series with MODDE-software, some of the components were eliminated from
compositions based on results of N-series analysis and some concentrations of compo-
nents were fixed. Compositions of S-series are illustrated in table 2.

10
Table 2. Compositions of S-series. 0 means no component/detergent was added to the
composition. Concentrations stated are relative. Components 1, 5 and 6 were fixed according
to the analysis done of N-series compositions. Component 7 was determined not to be im-
portant for composition. Component 3 and detergent 3 was also taken away from composi-
tions.
Component
1
Component
2
Component
4
Component
5
Component
6
Detergent
1
Detergent
2
S1 2 1 4 1 1 0 0
S2 2 3,3 2,6 1 1 0 0
S3 2 2,5 0 1 1 0 0
S4 2 1 1,3 1 1 1 0
S5 2 1,7 0 1 1 1 0
S6 2 3,3 0 1 1 10 0
S7 2 3,3 4 1 1 10 0
S8 2 1 2,6 1 1 10 0
S9 2 1 2,6 1 1 0 1
S10 2 3,3 1,3 1 1 0 1
S11 2 2,5 4 1 1 1 1
S12 2 1 0 1 1 10 1
S13 2 1,7 4 1 1 10 1
S14 2 1 0 1 1 0 10
S15 2 3,3 4 1 1 0 10
S16 2 2,1 2 1 1 0 10
S17 2 3,3 0 1 1 1 10
S18 2 1 4 1 1 1 10
S19 2 1 0 1 1 10 10
S20 2 1 4 1 1 10 10
S21 2 3,3 4 1 1 10 10
S22 2 2,5 0 1 1 10 10
S23 2 2,1 2 1 1 1 1
S24 2 2,1 2 1 1 1 1
6.1 Nucleic Acid Binding
NA binding test was first started by preparing two sets of N-series samples, one with
stool background (15 % stool in PBS) and one without stool background. In this analysis
compositions ability to bind the NA was tested. Targets for PCR amplification added were
invE gBlock plasmids and process control (PRC) for Mobidiags own extraction equip-
ment. Table 3 illustrates the preparing of samples. 1:10 of dilution was prepared of the
11
samples and analysed parallel to undiluted samples to examine, if PCR inhibitors are left
to the sample after NA extraction.
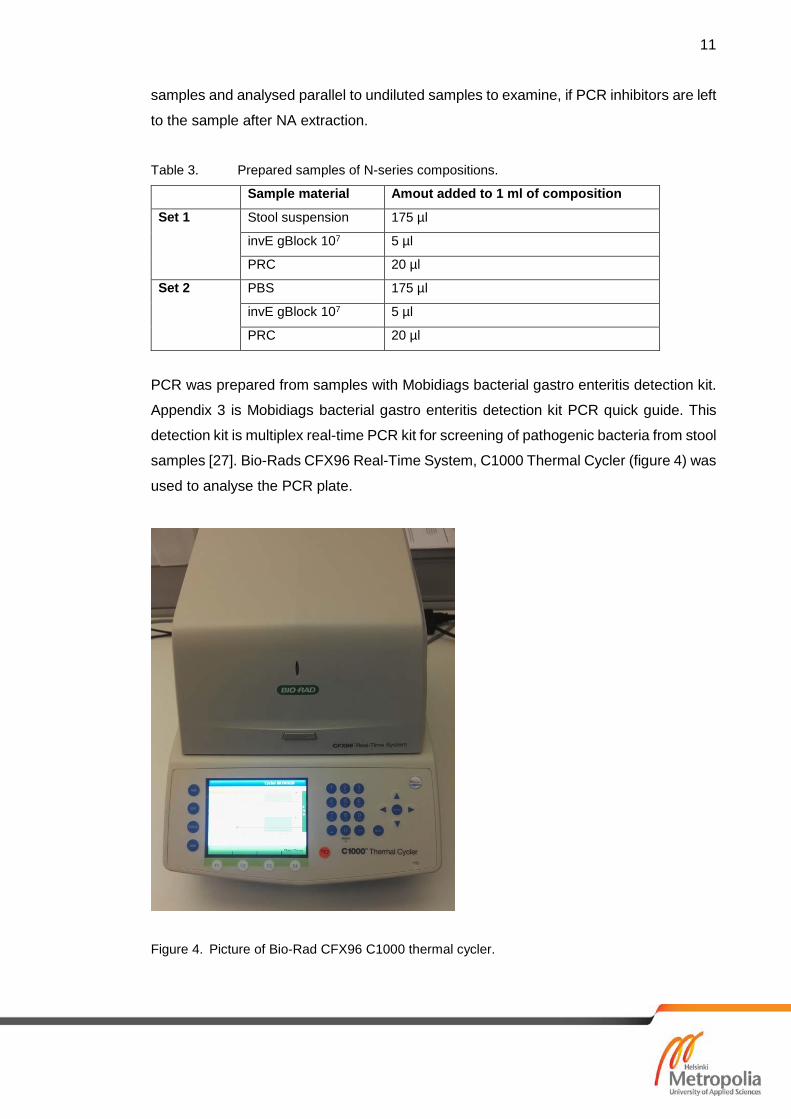
Table 3. Prepared samples of N-series compositions.
Sample material Amout added to 1 ml of composition
Set 1 Stool suspension 175 µl
invE gBlock 107 5 µl
PRC 20 µl
Set 2 PBS 175 µl
invE gBlock 107 5 µl
PRC 20 µl
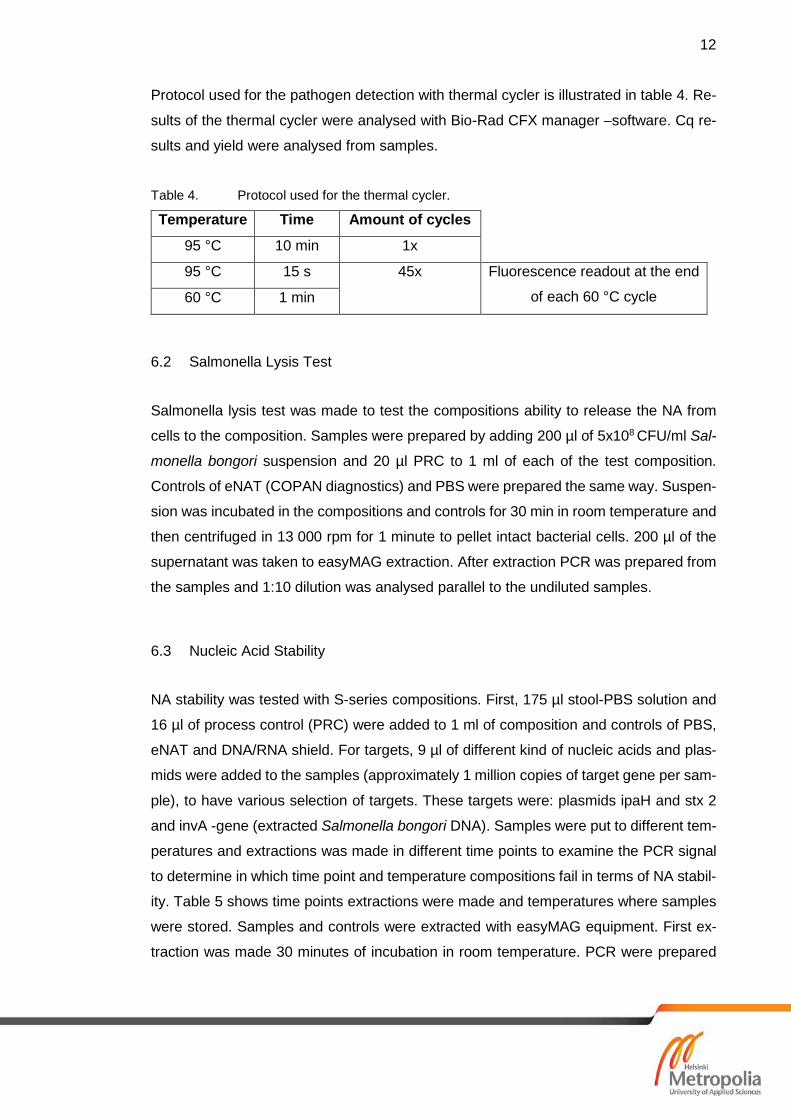
PCR was prepared from samples with Mobidiags bacterial gastro enteritis detection kit.
Appendix 3 is Mobidiags bacterial gastro enteritis detection kit PCR quick guide. This
detection kit is multiplex real-time PCR kit for screening of pathogenic bacteria from stool
samples [27]. Bio-Rads CFX96 Real-Time System, C1000 Thermal Cycler (figure 4) was
used to analyse the PCR plate.
Figure 4. Picture of Bio-Rad CFX96 C1000 thermal cycler.
12
Protocol used for the pathogen detection with thermal cycler is illustrated in table 4. Re-
sults of the thermal cycler were analysed with Bio-Rad CFX manager –software. Cq re-
sults and yield were analysed from samples.
Table 4. Protocol used for the thermal cycler.
Temperature Time Amount of cycles
95 °C 10 min 1x
95 °C 15 s 45x Fluorescence readout at the end
of each 60 °C cycle 60 °C 1 min
6.2 Salmonella Lysis Test
Salmonella lysis test was made to test the compositions ability to release the NA from
cells to the composition. Samples were prepared by adding 200 µl of 5x10⁸ CFU/ml Sal-
monella bongori suspension and 20 µl PRC to 1 ml of each of the test composition.
Controls of eNAT (COPAN diagnostics) and PBS were prepared the same way. Suspen-
sion was incubated in the compositions and controls for 30 min in room temperature and
then centrifuged in 13 000 rpm for 1 minute to pellet intact bacterial cells. 200 µl of the
supernatant was taken to easyMAG extraction. After extraction PCR was prepared from
the samples and 1:10 dilution was analysed parallel to the undiluted samples.
6.3 Nucleic Acid Stability
NA stability was tested with S-series compositions. First, 175 µl stool-PBS solution and
16 µl of process control (PRC) were added to 1 ml of composition and controls of PBS,
eNAT and DNA/RNA shield. For targets, 9 µl of different kind of nucleic acids and plas-
mids were added to the samples (approximately 1 million copies of target gene per sam-
ple), to have various selection of targets. These targets were: plasmids ipaH and stx 2
and invA -gene (extracted Salmonella bongori DNA). Samples were put to different tem-
peratures and extractions was made in different time points to examine the PCR signal
to determine in which time point and temperature compositions fail in terms of NA stabil-
ity. Table 5 shows time points extractions were made and temperatures where samples
were stored. Samples and controls were extracted with easyMAG equipment. First ex-
traction was made 30 minutes of incubation in room temperature. PCR were prepared

13
from the samples in each timepoint and temperature using Mobidiags bacterial pathogen
detection kit and PCR plates were then analysed with Bio-Rad CFX96 Real-Time Sys-
tem, Thermal Cycler.
Table 5. Temperatures where samples were stored, and time points were extraction of the
samples were taken.
Temperatures
Time points -20 °C +4 °C RT +37 °C
30 min x
3 days x x x
2 weeks x x x
4 weeks x x x x
6.4 Microbial Inactivation
In this test it was determined, if different organisms are efficiently inactivated in the dif-
ferent test compositions. This was done by choosing four test organisms so that they
would be as different as possible and have different attributes and morphology. The or-
ganisms that were chosen based on these conditions were: Escherichia coli (Sa1558),
Staphylococcus aureus (F704), Rhodococcus equi (Sa1635) and Candida albicans
(Fa232). E. coli was selected because of it is widely used in laboratories and is very
common intestine bacteria. S. aureus was selected to represent the common gram-pos-
itive bacteria. Rhodococcus equi is acid-fast bacteria and Candida albicans is represent-
ing yeasts.
6.4.1 Escherichia coli
Escherichia coli is rod shaped, about 2 μm long, gram-negative bacteria that live in di-
gestive tracts of humans and animals. E. coli is commonly used bacteria in laboratories
because the genetics of E. coli are fairly known, and they are easy to grow and manipu-
late. Some of E. coli types are harmless and are not pathogens. However, some may
14
cause diarrhea or urinary tract infections. One of the bacteria that is cause of food poi-
soning is E. coli O157:H7, which is part of EHEC –serogroup. Other pathogenic E. coli
serogroups are ETEC, EAEC, STEAEC, DAEC, AIEC, EPEC and EIEC [16].
In this analysis E. coli was incubated in CLED (cysteine lactose electrolyte deficient) agar
for 48 h in +37 °C. E. coli forms yellow colonies in CLED agar. Bacteria that grow yellow
colonies in CLED agar indicate lactose positive and blue colonies indicate lactose neg-
ative bacteria [17].
6.4.2 Straphylococcus aureus
Straphylococcus aureus is gram-positive cocci shaped bacteria that is about 1 μm in
diameter. In blood agar S. aureus forms big golden-yellow to white colonies. S. aureus
is common bacteria found on the skin, nose and pharynx of humans. It is potential path-
ogen that may cause food poisoning and skin infections like boils and sties. Some S.
aureus strains can be resistant to multiple antibiotics and are known as MRSA. MRSA
can spread in hospitals, where poor hygiene and weak immune system can infect pa-
tients. Even though S. aureus in some cases cause infections in humans, approximately
30 % of population carry the bacteria in their normal flora [18].
S. aureus was incubated in sheep blood agar for 48 h in +37 °C. Sheep blood agar
contains different nutrients and 5 to 10 % sheep blood. This agar detects hemolysis
around the colonies. Hemolysis is destruction of red blood cells in the agar and it turns
the agar colourless, green or brown around colonies. There are 3 types of hemolysis
(alpha-, beta- and gamma hemolysis) that can be detected from the agar, observing the
type and the radius of hemolysis around the colonies can help to detect the bacteria in
agar. S. aureus causes beta-hemolysis in sheep blood agar (figure 5), which lyses the
red cell in agar and turns agar around the colonies colourless [19; 20].

15
Figure 5. S. aureus colonies in sheep blood agar with beta-hemolysis. (Photo copied from http://www.bacteriainphotos.com/Staphylococcus%20aureus.html [29])
6.4.3 Rhodococcus equi
Rhodococcus equi is gram-positive, intracellular, coccobacillus bacteria that can be
found in soil and water. R. equi does not form spores and is nonmotile. It has strong cell
wall that has mycolic acids, so it can resist some acid and can also grow in anaerobic
conditions. R. equi is known to infect horses and particularly young foals, but it is also
known to infect humans with weak immune system. R. equi infections lead to pneumonia,
which causes swelling of tissue in lungs. In case of R. equi infections antibiotics are used
as treatment [21].
Rhodococcus equi was incubated in chocolate agar for 48 h in +37 °C. Chocolate agar
is very rich medium for more fastidious organisms. Chocolate agar is made by heating
blood agar until blood cells are lysed, turning the agar brown, which gives the agar its
name. When blood cells are boiled they release nutrients such as haemoglobin and he-
min into the agar [22].

16
6.4.4 Candida albicans
C. albicans is a yeast that can be found in human intestinal tract, mouth and colon. Can-
dida albicans can grow in ether yeast or filamentous cell form depending on the environ-
mental factors for example temperature, pH and CO2 concentration effect the form. C.
albicans can also form biofilm from cellulose to protect itself, which makes it resistant to
environmental factors. C. albicans is usually harmless, but might infect those with low
immunoprotection. If C. albicans gets overgrown in human body, it causes infections for
mouth, throat, genitals or bloodstream. C. albicans was cultured to chocolate agar and
incubated for 48 h in +37 °C [23].
6.5 Microbial Inactivation Testing
In inactivation testing, selected test organisms were incubated in compositions and
growth was inspected from agar plates. In parallel of each composition 1:10 dilution was
also prepared and analysed. First dilutions series was made of the bacteria so that suit-
able number of bacteria could be added to compositions. Right concentration was deter-
mined with DensiCHEK densitometer. E. coli, S. aureus, R. equi and C. albicans sus-
pensions were adjusted to 0.5 McFarland standard (1,5x10⁸ CFU/ml). In each composi-
tion 200 µl of 1,5x10⁷ CFU/ml bacteria solution was added in compositions and controls
so that each composition had 2,5 million CFU. Compositions were then incubated in
room temperature for 30 min. 100 µl of solutions was cultured in suitable agar plate for
the organism. Agar plates where incubated in +37 °C for 48 h and colonies were counted.
6.6 Maximal Volume of Inactivation
After inactivation testing compositions maximal volume of microbial inactivation was fur-
ther tested spiking compositions with bacterial suspension (1,5x10⁷ CFU/ml) in different
volumes. Spiked volumes were from 0.25 ml to 3 ml bacterial suspension to either 0.25
or 0.5 ml of test composition. These solutions were incubated in room temperature for
30 minutes and then cultured on agar plate and incubated for 48 h in +37 °C. Colonies
were examined and counted from the composition- and control agar plates.
17
The microbial inactivation abilities of different composition, components were also tested
to see performance of components individually. Components 1 and 2 and detergents 1,
2 and 3 were selected to this analysis. These components were tested in different con-
centrations. Table 6 shows the relative concentrations of components tested. In this anal-
ysis suspension was made by mixing 1.5x10⁸ CFU/ml E. coli and S. aureus suspension
and making dilution series of the mix. 200 µl of 1.5x10⁷ CFU/ml suspension was then
added to 1 ml of each component. Components were then incubated for 30 min and 100
µl was cultured to agar plates. Organisms were incubated for 48 h in +37 °C.
Table 6. Components and the relative concentrations tested for microbial inactivation.
Component 1 Component 2 Detergent 1 Detergent 2 Detergent 3
Concentration 1 1 1 1 1 1
Concentration 2 2 1.5 2 2 2
Concentration 3 3 2 2.5 2.5 2.5
6.7 Detergent Optimization
The use of detergent 2 will be highly regulated due to environmental concerns, so deter-
gent in composition 3 should be preferably replaced. In this method one new detergent
(detergent 4) was taken into analysis, trying to find suitable detergent for composition.
First, composition N3 was prepared without any detergents and added different concen-
trations of detergent 1, detergent 3 and detergent 4. Table 7 shows the prepared com-
positions and relative concentrations added. 200 µl of 5x10⁸ CFU/ml Salmonella bongori
suspension was added to 1 ml of composition and left to incubate for 30 minutes. These
samples were then extracted with EasyMAG and Zymo DNA kit, and then PCR was
prepared from the samples.

18
Table 7. Relative concentrations of added detergents. Detergents were added to N3 com-
position without detergents.
Detergent 1 Detergent 3 Detergent 4
Concentration 1 0 0 0
Concentration 2 1 1 1
Concentration 3 5 5 5
Concentration 4 10 10 10
Concentration 5 20 20 20
6.8 Inhibition Testing
In this analysis different components and the compositions of those components inhibi-
tory effects were analyzed. Components examined in this analysis were component 1, 2
and 4 as well as detergents 1 and 2. Each component was tested in five different con-
centration to determine in which concentration component inhibits PCR. Table 8 demon-
strates the components prepared. Calibration standard for bacterial pathogen detection
was used as a template.
Table 8. Components prepared for inhibition testing. Concentrations are relative.
Component 1 10 5 2.5 1.25 0.625
Component 2 10 5 2.5 1.25 0.625
Detergent 1 10 2.5 0.63 0.16 0.04
Detergent 2 10 2.5 0.63 0.16 0.04
Component 4 10 5 2.5 1.25 0.625
Figure 6 shows the detection panel of bacterial pathogen detection kit; calibration DNA
standard 3 includes all the target genes shown on the figure.

19
Figure 6. Mobidiags bacterial pathogen detection kit target panel. (Appendix 3)
7 Results
7.1 Results of Nucleic Acid Binding and Salmonella Lysis Test
From Cq results of the PCR, number of copies of the target gene were calculated and
compared to the undiluted samples to get yield of the samples. Cq results of the samples
were also compared to the control eNAT. eNAT is sample tube for clinical samples to be
analysed with molecular diagnostic methods [24]. Assembled results of PCR (table 9)
helped to narrow the compositions down to four of the best compositions, which were
taken to further analysis.
20
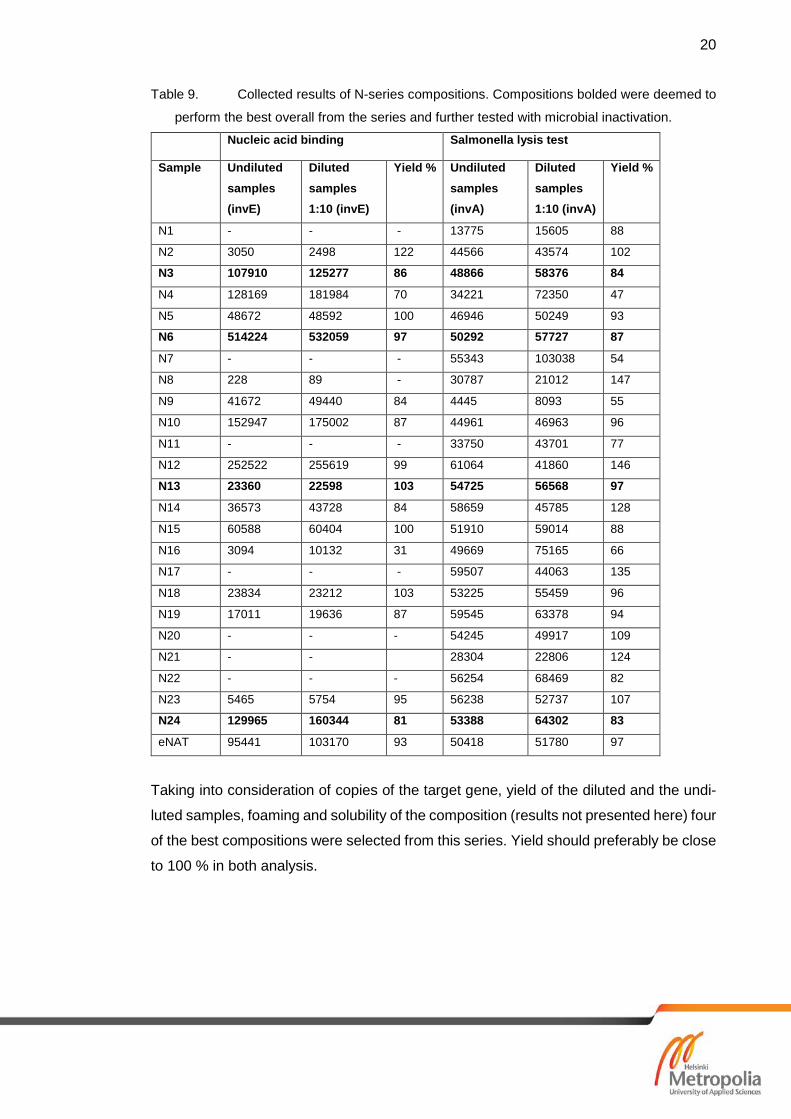
Table 9. Collected results of N-series compositions. Compositions bolded were deemed to
perform the best overall from the series and further tested with microbial inactivation.
Nucleic acid binding Salmonella lysis test
Sample Undiluted samples (invE)
Diluted samples 1:10 (invE)
Yield % Undiluted samples (invA)
Diluted samples 1:10 (invA)
Yield %
N1 - - - 13775 15605 88
N2 3050 2498 122 44566 43574 102
N3 107910 125277 86 48866 58376 84
N4 128169 181984 70 34221 72350 47
N5 48672 48592 100 46946 50249 93
N6 514224 532059 97 50292 57727 87
N7 - - - 55343 103038 54
N8 228 89 - 30787 21012 147
N9 41672 49440 84 4445 8093 55
N10 152947 175002 87 44961 46963 96
N11 - - - 33750 43701 77
N12 252522 255619 99 61064 41860 146
N13 23360 22598 103 54725 56568 97
N14 36573 43728 84 58659 45785 128
N15 60588 60404 100 51910 59014 88
N16 3094 10132 31 49669 75165 66
N17 - - - 59507 44063 135
N18 23834 23212 103 53225 55459 96
N19 17011 19636 87 59545 63378 94
N20 - - - 54245 49917 109
N21 - -
28304 22806 124
N22 - - - 56254 68469 82
N23 5465 5754 95 56238 52737 107
N24 129965 160344 81 53388 64302 83
eNAT 95441 103170 93 50418 51780 97
Taking into consideration of copies of the target gene, yield of the diluted and the undi-
luted samples, foaming and solubility of the composition (results not presented here) four
of the best compositions were selected from this series. Yield should preferably be close
to 100 % in both analysis.
21
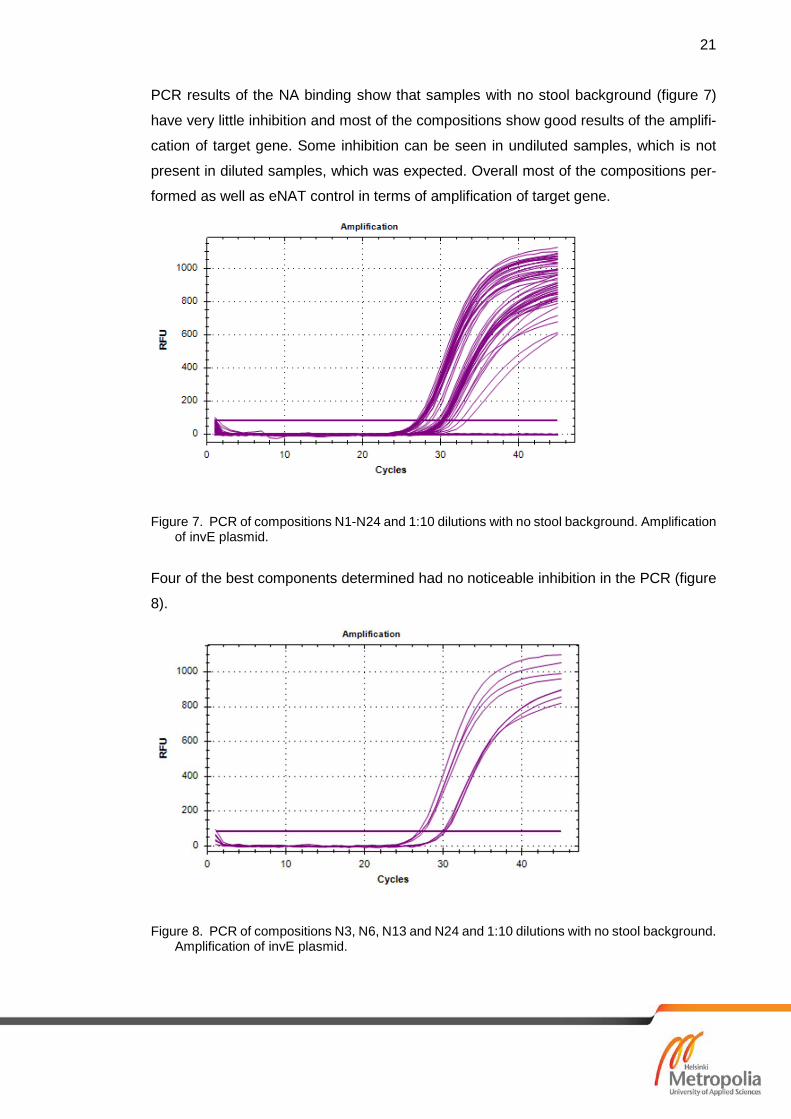
PCR results of the NA binding show that samples with no stool background (figure 7)
have very little inhibition and most of the compositions show good results of the amplifi-
cation of target gene. Some inhibition can be seen in undiluted samples, which is not
present in diluted samples, which was expected. Overall most of the compositions per-
formed as well as eNAT control in terms of amplification of target gene.
Figure 7. PCR of compositions N1-N24 and 1:10 dilutions with no stool background. Amplification of invE plasmid.
Four of the best components determined had no noticeable inhibition in the PCR (figure
8).
Figure 8. PCR of compositions N3, N6, N13 and N24 and 1:10 dilutions with no stool background. Amplification of invE plasmid.

22
PCR results with stool background have noticeable inhibition in samples (figure 9). In
conclusion stool background inhibits PCR in most of the compositions in some extend.
Figure 9. PCR of compositions N1-N24 and 1:10 dilutions with stool background. Amplification of invE plasmid.
Figure 10 shows PCR results for 4 of the best N-series compositions with stool back-
ground. The best performing compositions had almost no inhibition compared to the
samples with no stool background.
Figure 10. PCR of compositions N3, N6, N13 and N24 and 1:10 dilutions with stool back-ground. Amplification of invE plasmid.

23
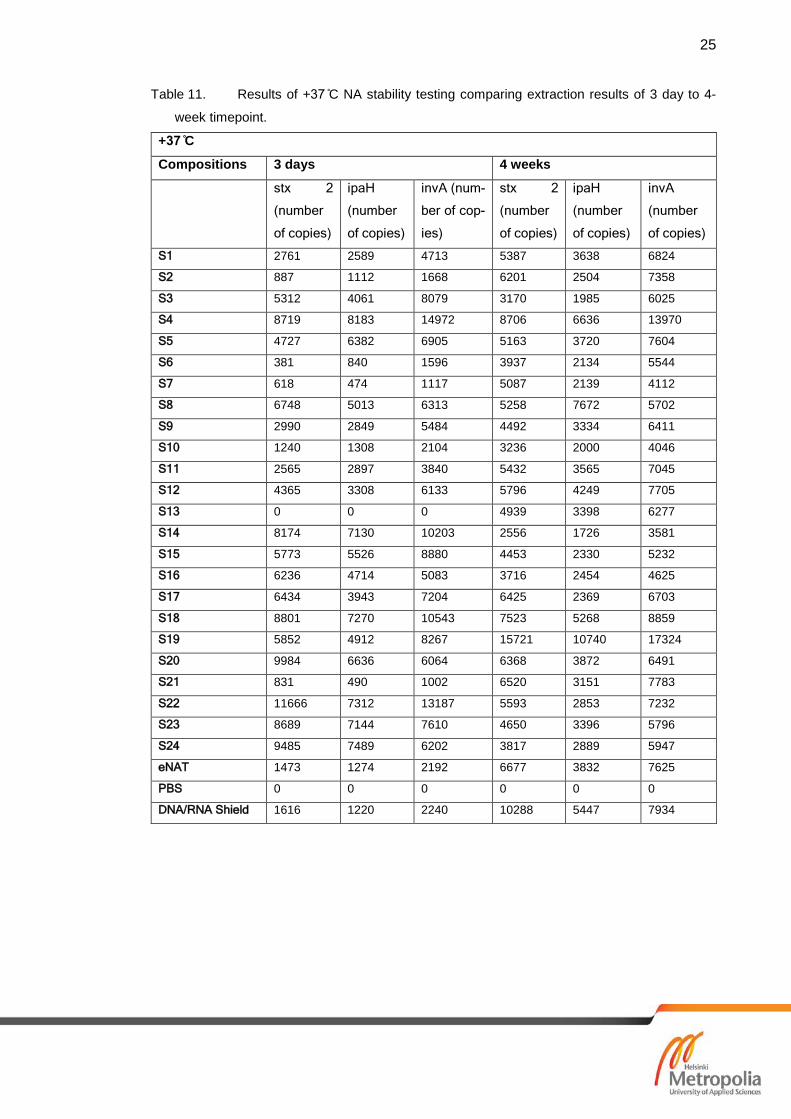
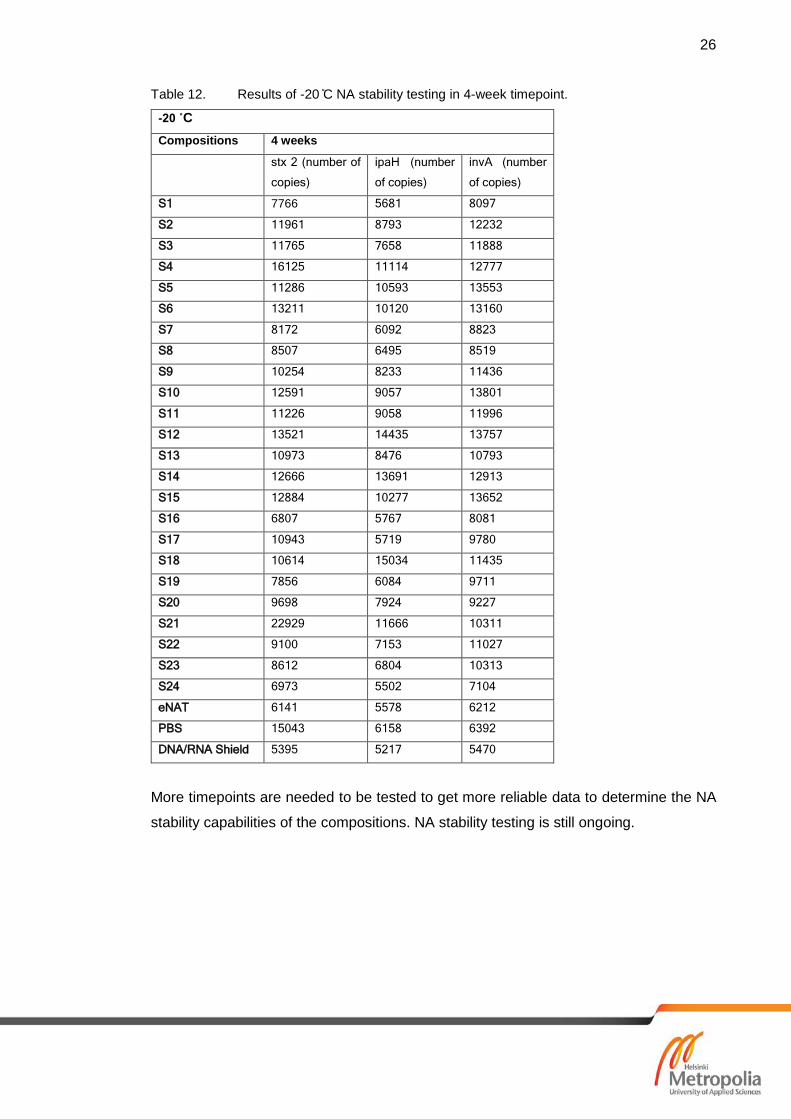
7.2 Results of Nucleic Acid Stability
Most of the compositions should keep the NA stabile in -20 ˚C at least the 4-week period
that was last tested timepoint in this study. -20 ˚C results are shown in table 12 and all
the compositions and controls are shown to stabilize DNA. Results for the RT samples
(shown in table 10) show that some of the compositions stabilises the NA even in RT.
Compared to the controls: Zymo Research Corp. DNA/RNA shield [25] and eNAT.
DNA/RNA shield is attended for NA stability and transport for clinical samples. PBS con-
trol shows that NA is not stabile after 4-week period and has no amplification of target
gene. Samples S12 and S13 failed to stabilize the NA. Tables 11 and table 12 show
results of +37 ˚C and -20 ˚C stability testing.

24
Table 10. Results of room temperature NA stability testing comparing extraction results of 30
min to 4-week timepoint.
Room temperature
Compositions 30 min 4 weeks
stx 2 (num-
ber of cop-
ies)
ipaH (num-
ber of cop-
ies)
invA (num-
ber of cop-
ies)
stx 2 (num-
ber of cop-
ies)
ipaH (num-
ber of cop-
ies)
invA (num-
ber of cop-
ies)
S1 7766 5681 8097 7895 9810 9786
S2 11961 8793 12232 7315 10702 11671
S3 11765 7658 11888 12826 9864 14448
S4 16125 11114 12777 13183 13332 14057
S5 11286 10593 13553 10848 12924 14639
S6 13211 10120 13160 6920 6237 10315
S7 8172 6092 8823 4929 4873 10908
S8 8507 6495 8519 2009 3199 3207
S9 10254 8233 11436 6861 9148 9316
S10 12591 9057 13801 9958 9469 15437
S11 11226 9058 11996 8334 10030 11675
S12 13521 14435 13757 0 0 0
S13 10973 8476 10793 23 25 42
S14 12666 13691 12913 18639 22326 23099
S15 12884 10277 13652 6809 5957 12632
S16 6807 5767 8081 11109 10804 12027
S17 10943 5719 9780 9096 4134 9724
S18 10614 15034 11435 11253 11896 15275
S19 7856 6084 9711 6694 6833 10119
S20 9698 7924 9227 7851 9721 10766
S21 22929 11666 10311 13441 8732 9173
S22 9100 7153 11027 9122 5929 11174
S23 8612 6804 10313 6832 7757 10421
S24 6973 5502 7104 6816 6980 7502
eNAT 6141 5578 6212 5621 6595 8167
PBS 15043 6158 6392 0 0 0
DNA/RNA Shield 5395 5217 5470 4343 5502 5439
25
Table 11. Results of +37 ̊C NA stability testing comparing extraction results of 3 day to 4-
week timepoint.
+37 ̊C
Compositions 3 days 4 weeks
stx 2
(number
of copies)
ipaH
(number
of copies)
invA (num-
ber of cop-
ies)
stx 2
(number
of copies)
ipaH
(number
of copies)
invA
(number
of copies)
S1 2761 2589 4713 5387 3638 6824
S2 887 1112 1668 6201 2504 7358
S3 5312 4061 8079 3170 1985 6025
S4 8719 8183 14972 8706 6636 13970
S5 4727 6382 6905 5163 3720 7604
S6 381 840 1596 3937 2134 5544
S7 618 474 1117 5087 2139 4112
S8 6748 5013 6313 5258 7672 5702
S9 2990 2849 5484 4492 3334 6411
S10 1240 1308 2104 3236 2000 4046
S11 2565 2897 3840 5432 3565 7045
S12 4365 3308 6133 5796 4249 7705
S13 0 0 0 4939 3398 6277
S14 8174 7130 10203 2556 1726 3581
S15 5773 5526 8880 4453 2330 5232
S16 6236 4714 5083 3716 2454 4625
S17 6434 3943 7204 6425 2369 6703
S18 8801 7270 10543 7523 5268 8859
S19 5852 4912 8267 15721 10740 17324
S20 9984 6636 6064 6368 3872 6491
S21 831 490 1002 6520 3151 7783
S22 11666 7312 13187 5593 2853 7232
S23 8689 7144 7610 4650 3396 5796
S24 9485 7489 6202 3817 2889 5947
eNAT 1473 1274 2192 6677 3832 7625
PBS 0 0 0 0 0 0
DNA/RNA Shield 1616 1220 2240 10288 5447 7934
26
Table 12. Results of -20 ̊C NA stability testing in 4-week timepoint.
-20 ˚C
Compositions 4 weeks
stx 2 (number of
copies)
ipaH (number
of copies)
invA (number
of copies)
S1 7766 5681 8097
S2 11961 8793 12232
S3 11765 7658 11888
S4 16125 11114 12777
S5 11286 10593 13553
S6 13211 10120 13160
S7 8172 6092 8823
S8 8507 6495 8519
S9 10254 8233 11436
S10 12591 9057 13801
S11 11226 9058 11996
S12 13521 14435 13757
S13 10973 8476 10793
S14 12666 13691 12913
S15 12884 10277 13652
S16 6807 5767 8081
S17 10943 5719 9780
S18 10614 15034 11435
S19 7856 6084 9711
S20 9698 7924 9227
S21 22929 11666 10311
S22 9100 7153 11027
S23 8612 6804 10313
S24 6973 5502 7104
eNAT 6141 5578 6212
PBS 15043 6158 6392
DNA/RNA Shield 5395 5217 5470
More timepoints are needed to be tested to get more reliable data to determine the NA
stability capabilities of the compositions. NA stability testing is still ongoing.
27
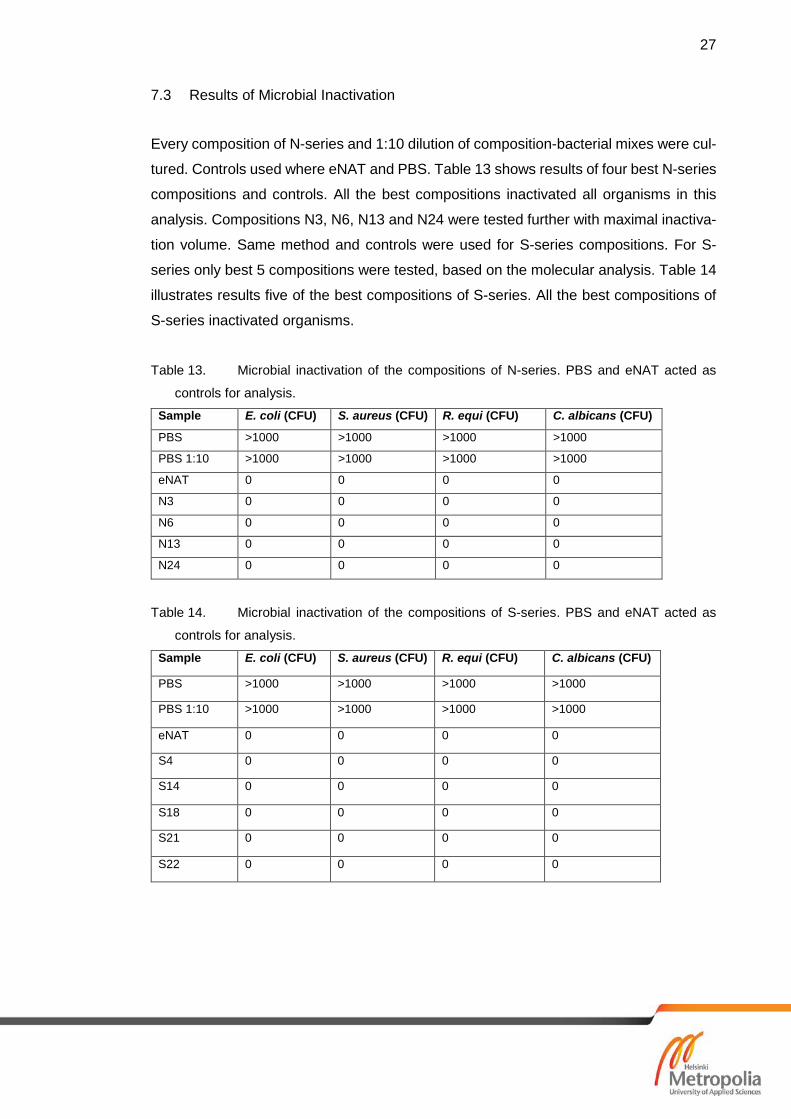
7.3 Results of Microbial Inactivation
Every composition of N-series and 1:10 dilution of composition-bacterial mixes were cul-
tured. Controls used where eNAT and PBS. Table 13 shows results of four best N-series
compositions and controls. All the best compositions inactivated all organisms in this
analysis. Compositions N3, N6, N13 and N24 were tested further with maximal inactiva-
tion volume. Same method and controls were used for S-series compositions. For S-
series only best 5 compositions were tested, based on the molecular analysis. Table 14
illustrates results five of the best compositions of S-series. All the best compositions of
S-series inactivated organisms.
Table 13. Microbial inactivation of the compositions of N-series. PBS and eNAT acted as
controls for analysis.
Sample E. coli (CFU) S. aureus (CFU) R. equi (CFU) C. albicans (CFU)
PBS >1000 >1000 >1000 >1000
PBS 1:10 >1000 >1000 >1000 >1000
eNAT 0 0 0 0
N3 0 0 0 0
N6 0 0 0 0
N13 0 0 0 0
N24 0 0 0 0
Table 14. Microbial inactivation of the compositions of S-series. PBS and eNAT acted as
controls for analysis.
Sample E. coli (CFU) S. aureus (CFU) R. equi (CFU) C. albicans (CFU)
PBS >1000 >1000 >1000 >1000
PBS 1:10 >1000 >1000 >1000 >1000
eNAT 0 0 0 0
S4 0 0 0 0
S14 0 0 0 0
S18 0 0 0 0
S21 0 0 0 0
S22 0 0 0 0
28
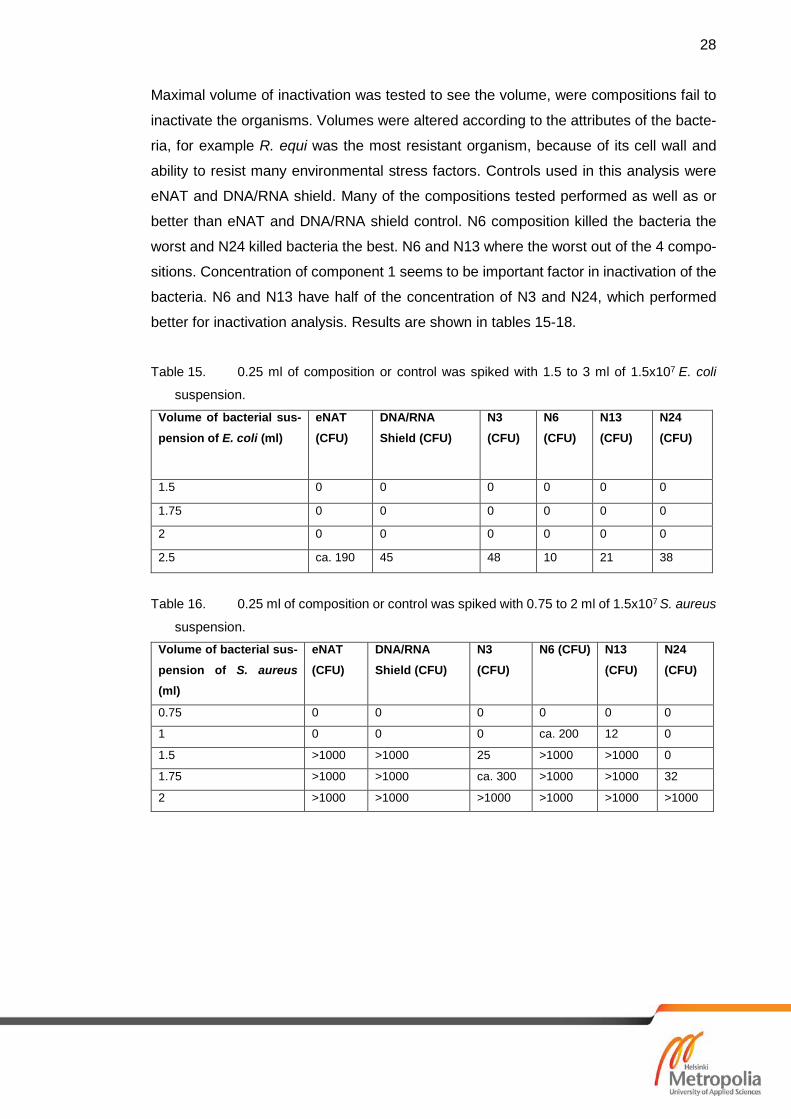
Maximal volume of inactivation was tested to see the volume, were compositions fail to
inactivate the organisms. Volumes were altered according to the attributes of the bacte-
ria, for example R. equi was the most resistant organism, because of its cell wall and
ability to resist many environmental stress factors. Controls used in this analysis were
eNAT and DNA/RNA shield. Many of the compositions tested performed as well as or
better than eNAT and DNA/RNA shield control. N6 composition killed the bacteria the
worst and N24 killed bacteria the best. N6 and N13 where the worst out of the 4 compo-
sitions. Concentration of component 1 seems to be important factor in inactivation of the
bacteria. N6 and N13 have half of the concentration of N3 and N24, which performed
better for inactivation analysis. Results are shown in tables 15-18.
Table 15. 0.25 ml of composition or control was spiked with 1.5 to 3 ml of 1.5x10⁷ E. coli
suspension.
Volume of bacterial sus-pension of E. coli (ml)
eNAT (CFU)
DNA/RNA Shield (CFU)
N3 (CFU)
N6 (CFU)
N13 (CFU)
N24 (CFU)
1.5 0 0 0 0 0 0
1.75 0 0 0 0 0 0
2 0 0 0 0 0 0
2.5 ca. 190 45 48 10 21 38
Table 16. 0.25 ml of composition or control was spiked with 0.75 to 2 ml of 1.5x10⁷ S. aureus
suspension. Volume of bacterial sus-pension of S. aureus (ml)
eNAT (CFU)
DNA/RNA Shield (CFU)
N3 (CFU)
N6 (CFU) N13 (CFU)
N24 (CFU)
0.75 0 0 0 0 0 0
1 0 0 0 ca. 200 12 0
1.5 >1000 >1000 25 >1000 >1000 0
1.75 >1000 >1000 ca. 300 >1000 >1000 32
2 >1000 >1000 >1000 >1000 >1000 >1000

29
Table 17. 0.5 ml of composition or control was spiked with 0.25 to 3 ml of 1.5x10⁷ R. equi
suspension.
Volume of bacterial sus-pension of R. equi (ml)
eNAT (CFU)
DNA/RNA Shield (CFU)
N3 (CFU)
N6 (CFU)
N13 (CFU)
N24 (CFU)
0.25 0 0 0 0 0 0
0.5 0 0 0 0 0 0
1 0 0 0 1 0 0
2 >1000 >1000 >1000 >1000 >1000 ca. 300
3 >1000 >1000 >1000 >1000 >1000 >1000
Table 18. 0.5 ml composition or control was spiked with 0.25 to 3 ml of 1.5x10⁷ C.albicans
suspension.
Volume of bacterial sus-pension of C. albicans (ml)
eNAT (CFU)
DNA/RNA Shield (CFU)
N3 (CFU)
N6 (CFU)
N13 (CFU)
N24 (CFU)
0.25 0 0 0 0 0 0
0.5 0 0 0 0 0 0
1 0 0 0 74 0 0
2 15 59 0 >1000 0 3
3 88 >1000 ca. 200 >1000 >1000 ca. 150
Results of microbial analysis of different components show that component 1 inactivates
the bacteria in all concentrations. Also, detergent 1 inactivates organisms very effec-
tively, except for R. equi, which had some growth in all the concentrations. Components
2 and detergents 2 and 3 do not inactivate any of the organisms in any of the concentra-
tions. Controls used were PBS and eNAT. All the results of the components are shown
in table 19.
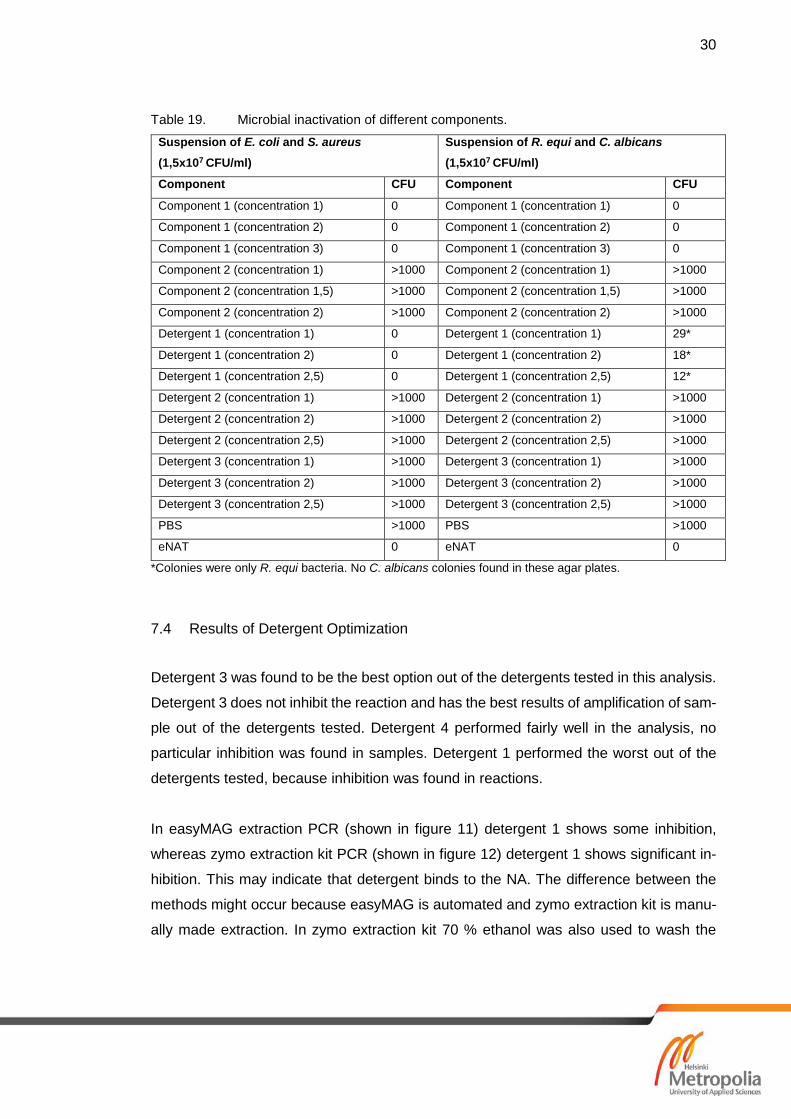
30
Table 19. Microbial inactivation of different components.
Suspension of E. coli and S. aureus (1,5x10⁷ CFU/ml)
Suspension of R. equi and C. albicans (1,5x10⁷ CFU/ml)
Component CFU Component CFU
Component 1 (concentration 1) 0 Component 1 (concentration 1) 0
Component 1 (concentration 2) 0 Component 1 (concentration 2) 0
Component 1 (concentration 3) 0 Component 1 (concentration 3) 0
Component 2 (concentration 1) >1000 Component 2 (concentration 1) >1000
Component 2 (concentration 1,5) >1000 Component 2 (concentration 1,5) >1000
Component 2 (concentration 2) >1000 Component 2 (concentration 2) >1000
Detergent 1 (concentration 1) 0 Detergent 1 (concentration 1) 29*
Detergent 1 (concentration 2) 0 Detergent 1 (concentration 2) 18*
Detergent 1 (concentration 2,5) 0 Detergent 1 (concentration 2,5) 12*
Detergent 2 (concentration 1) >1000 Detergent 2 (concentration 1) >1000
Detergent 2 (concentration 2) >1000 Detergent 2 (concentration 2) >1000
Detergent 2 (concentration 2,5) >1000 Detergent 2 (concentration 2,5) >1000
Detergent 3 (concentration 1) >1000 Detergent 3 (concentration 1) >1000
Detergent 3 (concentration 2) >1000 Detergent 3 (concentration 2) >1000
Detergent 3 (concentration 2,5) >1000 Detergent 3 (concentration 2,5) >1000
PBS >1000 PBS >1000
eNAT 0 eNAT 0
*Colonies were only R. equi bacteria. No C. albicans colonies found in these agar plates.
7.4 Results of Detergent Optimization
Detergent 3 was found to be the best option out of the detergents tested in this analysis.
Detergent 3 does not inhibit the reaction and has the best results of amplification of sam-
ple out of the detergents tested. Detergent 4 performed fairly well in the analysis, no
particular inhibition was found in samples. Detergent 1 performed the worst out of the
detergents tested, because inhibition was found in reactions.
In easyMAG extraction PCR (shown in figure 11) detergent 1 shows some inhibition,
whereas zymo extraction kit PCR (shown in figure 12) detergent 1 shows significant in-
hibition. This may indicate that detergent binds to the NA. The difference between the
methods might occur because easyMAG is automated and zymo extraction kit is manu-
ally made extraction. In zymo extraction kit 70 % ethanol was also used to wash the

31
samples, instead of the kits own wash buffers. There were found to be no significant
difference between the extraction methods with detergent 3 and 4.
Detergent 3 Detergent 4 Detergent 1
Figure 11. PCR analysis of the different detergents in different concentrations. Samples where extracted with EasyMAG equipment. Amplification of invA gene.
Detergent 3 Detergent 4 Detergent 1
Figure 12. PCR analysis of the different detergents in different concentrations. Samples where extracted with Zymo Quick-DNA Fecal/Soil Microbe Miniprep Kit. Amplification of invA gene.

32
7.5 Results of Inhibition Testing
Some of the components and detergents were found to inhibit PCR reaction. Table 20
illustrates the concentrations of components that inhibited the reaction. All components
show inhibition in high concentrations. Inhibition was found to be worst with detergent 1,
which inhibits PCR reaction still in low concentrations. Figure 13 shows the amplification
of the sxt1 plasmid of the samples.
Table 20. Concentrations that show inhibition in PCR reaction are highlighted in yellow. Con-
centrations shown are relative.
Component 1 10 5 2.5 1.25 0.625
Component 2 10 5 2.5 1.25 0.625
Detergent 1 10 2.5 0.63 0.16 0.04
Detergent 2 10 2.5 0.63 0.16 0.04
Component 4 10 5 2.5 1.25 0.625
Component 1 Component 2 Component 4 Detergent 1 Detergent 2
Figure 13. Target gene viewed in this figure is stx1 gene. Different components and deter-gents are shown in different colours.
33
8 Discussion
With the above methods, this study was done to ensure that requirements of the sample
tube were met. Some of the method attributes and chemistry are not known, and this has
to be taken in the consideration when interpreting the results. Also, some of the methods
should be repeated to ensure the gained results. Microbial inactivation testing could be
developed more by first culturing only the composition to agar plate and then culturing
bacterial suspension on top to ensure that compositions do not just inhibit the growth of
the bacteria.
Development of the sample tube in question continues with more stability testing and
component testing. Follow-up research should include analysis of NA stability further,
inactivation of viruses and testing of possible tube. Composition consists of components
that might cause corrosion of the tube, so testing endurance of the tube is needed. Pos-
sible tube candidate has screw top, which might be vulnerable to strong reagents.
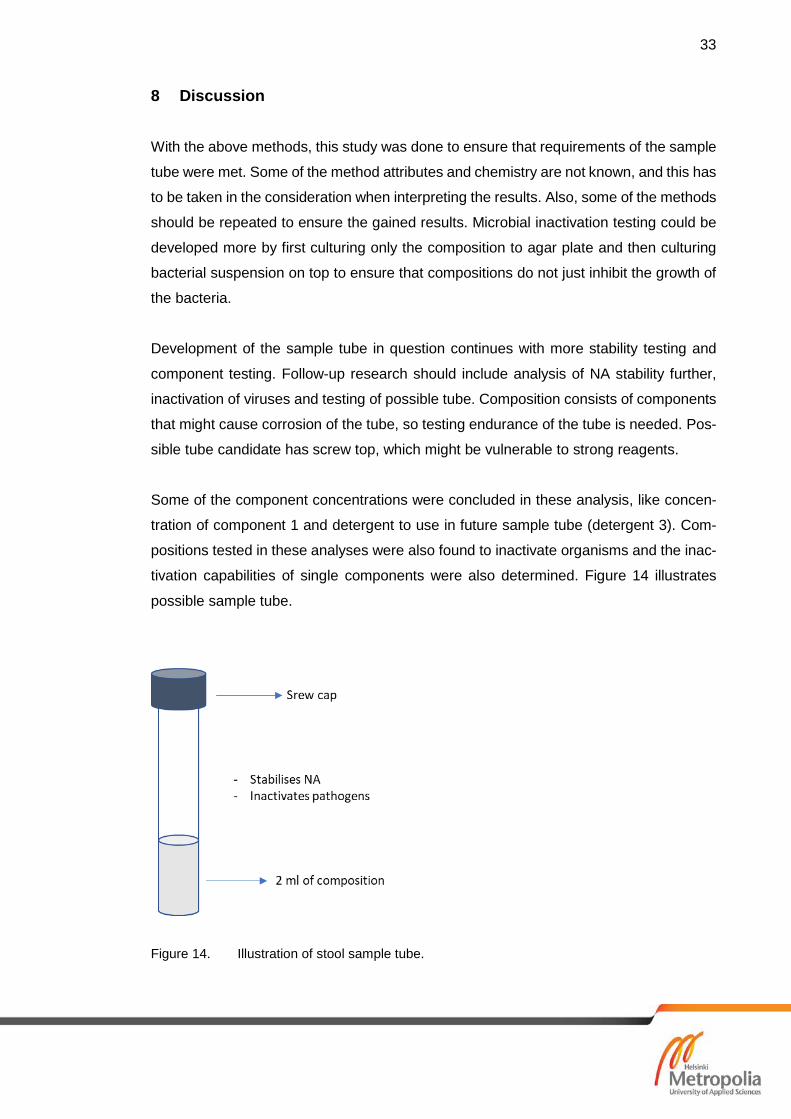
Some of the component concentrations were concluded in these analysis, like concen-
tration of component 1 and detergent to use in future sample tube (detergent 3). Com-
positions tested in these analyses were also found to inactivate organisms and the inac-
tivation capabilities of single components were also determined. Figure 14 illustrates
possible sample tube.
Figure 14. Illustration of stool sample tube.
34
References
1 Hodges K. & Gill. 2010. Infectious diarrhea. Gut Microbes. 1: 4–21.
2 Caliendo A., Gilbert D., Ginocchio C., Hanson K., May L., Quinn T., et. al. 2013. Better Tests, Better Care: Improver Diagnostics for Infectious Diseases. Clinical infectious Diseases: An Official Publication of the Infectious Diseases Society of America. 57: 139–170.
3 Vaught J. & Henderson K. 2011. Biological sample collection, processing, stor-age and information management. Molecular epidemiology: principles and prac-tices. 23–42.
4 Böhling K., Grote G., Hülseweh B., Marschall H., Sagripanti J., Voß L. 2011. Mi-crobial Inactivation for Safe and Rapid Diagnostics of Infectious Samples.
5 Kool E. 2001. Hydrogen bonding, base stacking, and steric effects in DNA repli-cation. Annual review of biophysics and biomolecular structure. 30: 1–22.
6 The leeds teaching hospitals NHS. [webpage] http://www.pathol-ogy.leedsth.nhs.uk/pathology/Departments/Microbiology/How-toSample/StoolSamples.aspx read 24.10.2017
7 Deda O., Gika H., Wilson I., Theodoridis G. 2015. An overview of fecal sample preparation for global metabolic proifiling. Journal of Pharmaceutical and biomed-ical analysis. 113: 137–150.
8 Wilson I. 1997. Inhibition and facilitation of nucleic acid amplification. Applied and environmental microbiology. Oct, 1997: 3741–3751.
9 Bessetti J. 2007. An introduction to PCR inhibitors. Promega corporation. Profiles in DNA 10: 9–10. [Webdocument].
10 Bonnemaison D., Bonnet J., Cabrita J., Mégraud F., Monteiro L., Petry K., Vekris A., Vidal R. 1997. Complex polysaccharides as PCR inhibitors in feces: Helico-bacter pylori model. Journal of clinical microbiology. 995–998.
11 Dahm R. 2005. Friedrich Miescher and the discovery of DNA. Development biol-ogy. Vol 278: 274–288.
12 Tan S., Yiap B. 2009. DNA, RNA, and Protein Extraction: The Past and The Pre-sent. Journal of biomedicine and biotechnology. 2009: 574398.
13 Promega. DNA purification, The basis of DNA isolation, plasmid growth and DNA quantitation. [webpage] https://fi.promega.com/resources/product-guides-and-se-lectors/protocols-and-applications-guide/dna-purification/ read 15.10.2017.
14 Biomérieux. Nuclisens EASYMAG. [webpage] http://www.biomerieux-diagnos-tics.com/nuclisensr-easymagr read 10.9.2017.
35
15 Sartorius stedmin biotech. MODDE Pro [webpage] http://umetrics.com/prod-uct/modde-pro read 29.8.2017.
16 Clements A., Constantinou N., Frankel G., Young J. 2012. Infection strategies of enteric pathogenic Escherichia coli. Gut microbes. 3: 71–87.
17 Microbiology and infectious diseases. [webpage] http://mi-crobesinfo.com/2015/07/cystine-lactose-electrolyte-deficient-cled-agar/ read 14.9.2017
18 News medical life sciences. What is Straphylococcus Aureus? [webpage] https://www.news-medical.net/health/What-is-Staphylococcus-Aureus.aspx read 14.9.2017
19 Himedia Technical data. Sheep blood agar plate. MP1301 [webdocument] http://www.himedialabs.com/TD/M1301.pdf read 14.9.2017
20 Medical- labs. Different types of bacterial hemolysis of blood agar [webpage] http://www.medical-labs.net/different-types-of-bacterial-hemolysis-on-blood-agar-788/ read 25.9.2017
21 Medscape. Rhodococcus equi. [webpage] https://emedicine.medscape.com/arti-cle/235466-overview?src=refgatesrc1#showall read 14.9.2017
22 Gunn B. 1984. Chocolate agar, a different medium for gram-positive cocci. Jour-nal of microbiology. Oct. 1984: 822–823.
23 Nobile C. & Johnson A. 2015. Candida albicans biofilms and human disease. An-nual review of Microbiology. 69: 71–92.
24 Copan diagnostics. ENat. [webpage] http://products.copangroup.com/in-dex.php/products/genetics/enat read 15.8.2017
25 Zymo Research. DNA/RNA shield [webdocument] http://www.zy-moresearch.com/downloads/dl/file/id/502/r1100_50i.pdf read 18.8.2017
26 Gates K. 2009. An Overview of Chemical Processes That Damage Cellular DNA: Spontaneous Hydrolysis, Alkylation, and Reactions with Radicals. Chemical re-search in toxicology. Nov. 22(11): 1747-1760.
27 Mobidiag Oy. Amplidiag® Bacterial GE. [webpage]. http://mobidiag.com/prod-ucts/amplidiag/bacterial-ge/
28 Copan diagnostics. ENat®. [webpage] http://products.copangroup.com/in-dex.php/products/genetics/enat
29 Bacteria in Photos. Bacteria photos: Staphylococcus aureus. [webpage] http://www.bacteriainphotos.com/Staphylococcus%20aureus.html

36
HUSLAB instructions for sampling parasite sample for nucleic acid assay (F-ParaNhO)

37
Instruction manual, Quick-DNA Fecal/Soil Microbe Miniprep Kit (Page 5)
38
Amplidiag Bacterial GE, PCR Quick Guide