feature selection using swarm-based relative reduct technique for fetal heart rate
TRANSCRIPT
ORIGINAL ARTICLE
Feature selection using swarm-based relative reduct techniquefor fetal heart rate
H. Hannah Inbarani • P. K. Nizar Banu •
Ahmad Taher Azar
Received: 26 July 2013 / Accepted: 17 January 2014
� Springer-Verlag London 2014
Abstract Fetal heart rate helps in diagnosing the well-
being and also the distress of fetal. Cardiotocograph (CTG)
monitors the fetal heart activity to estimate the fetal tach-
ogram based on the evaluation of ultrasound pulses
reflected from the fetal heart. It consists in a simultaneous
recording and analysis of fetal heart rate signal, uterine
contraction activity and fetal movements. Generally CTG
comprises more number of features. Feature selection also
called as attribute selection is a process of selecting a
subset of highly relevant features which is responsible for
future analysis. In general, medical datasets require more
number of features to predict an activity. This paper aims at
identifying the relevant and ignores the redundant features,
consequently reducing the number of features to assess the
fetal heart rate. The features are selected by using unsu-
pervised particle swarm optimization (PSO)-based relative
reduct (US-PSO-RR) and compared with unsupervised
relative reduct and principal component analysis. The
proposed method is then tested by applying various clas-
sification algorithms such as single decision tree, multi-
layer perceptron neural network, probabilistic neural
network and random forest for maximum number of classes
and clustering accuracies like root mean square error, mean
absolute error, Davies–Bouldin index and Xie–Beni index
for minimum number of classes. Empirical results show
that the US-PSO-RR feature selection technique outper-
forms the existing methods by producing sensitivity of
72.72 %, specificity of 97.66 %, F-measure of 74.19 %
which is remarkable, and clustering results demonstrate
error rate produced by US-PSO-RR is less as well.
Keywords Unsupervised � PSO � Feature selection �Relative reduct � Fetal heart rate � Cardiotocogram
1 Introduction
Classically, a graphical representation of fetal heart rate
(FHR) signal is visually inspected by clinician, whose task
is to identify and to classify the signal patterns. The
interpretation of heart rate patterns obtained by fetal
monitoring relies mainly on the definition of the basal level
of the FHR signal and its variability. The basal level of
FHR signal, called the baseline, is considered as the run-
ning average heart rate in the absence of external stimuli
during periods of fetal rest. The FHR variability is defined
in the aspect of its transient increase (acceleration pattern)
or decrease (deceleration pattern). Accelerations are the
result of fetal movements and to identify the fetal well-
being, while decelerations are the symptoms of fetal dis-
tress usually indicating the risk of fetal hypoxia.
During the crucial period of labor, FHR monitoring is
used as the main screening test of the fetal acid-base bal-
ance [1]. Visual analysis of FHR recording does not
guarantee a correct assessment of the fetal state, and the
accuracy of the interpretation depends on clinician’s
experience. It was concluded in [2], that the weakness of
H. Hannah Inbarani
Department of Computer Science, Periyar University,
Salem, India
e-mail: [email protected]
P. K. Nizar Banu
Department of Computer Applications,
B.S. Abdur Rahman University, Chennai, India
e-mail: [email protected]
A. T. Azar (&)
Faculty of Computers and Information, Benha University,
Benha, Egypt
e-mail: [email protected]; [email protected]
123
Neural Comput & Applic
DOI 10.1007/s00521-014-1552-x
cardiotocograph (CTG) still lies in a generally poor stan-
dard of interpretation, and the contribution of the human
factor demonstrated by high intra- and inter-observer var-
iability. To decrease the subjective nature of fetal state
evaluation, computerized decision support systems should
be developed for supporting the process of medical diag-
nosis [2]. The earliest work for automatic analysis was
completely based on clinical guidelines for CTG assess-
ment [3]. Recently, methods derived from adults HRV
research were similarly used for FHR analysis [4]. The
statistical description of CTG tracings was employed in [4,
5]. Another features derived from wavelets transform were
used in [6, 7]. A combination of neural networks and fuzzy
models, namely neuro-fuzzy systems were also employed
for the classification of fetal cardiotocograms. A fuzzy
inference system based on artificial neural network
(ANBLIR) with epsilon-insensitive learning [8] was used
for the prediction of fetal outcome on the basis of FHR
signal analysis [9, 10]. The epsilon-insensitive learning
employing the principles of the statistical learning theory
[11, 12] resulted in high prediction accuracy.
Proper heart activity is an indicator of adequate fetal
blood oxygenation and shows that the central nervous
system is intact and provides a good modulating control.
Hence, the analysis of FHR is an essential element of
diagnostic process for the assessment of fetal status and
well-being during pregnancy and labor. Original features of
FHR are derived from three domains: the time domain, the
frequency domain and the morphological domain. Mor-
phological domain utilizes medical definitions of morpho-
logical features, which have already been used with
antepartum [13, 14] and intrapartum case [14, 15]. As the
number of features increases, time taken to predict the
status of fetal in critical conditions during pregnancy is a
challenging task. In some cases, essential features like
baseline value of FHR, number of accelerations and fetal
movements per second are left without considering for
further analysis. These kinds of features may also give rise
for predicting different classes which has been already
recorded. In certain cases, values of features may be similar
but they differ in classes they belong to. Here comes the
need to apply rough sets [16]; a mathematical tool to dis-
cover the dependencies among the features. When rough
set is combined with swarm intelligence, significant fea-
tures are identified in a lesser time, since this technique is
inspired from the nature. The objective of this paper is to
identify the vital features that help in assessing the fetal
heart rate and to diagnose the status of fetus.
Rough set can be used as a tool to discover data
dependencies and to reduce the number of features con-
tained in a dataset using the data alone [16]. Feature
selection algorithms are classified as filter approach and
wrapper approach. Filter-based methods does not depend
on any induction algorithm, and therefore, these methods
are efficient than wrapper-based methods. Although
wrappers produces good results, they are expensive to run
and will reduct more number of features. PSO is a filter-
based heuristic method that guides in feature selection by
providing optimal minimal subset every time. PSO-based
algorithms tend to select the features in all possible ways,
rather than sticking to exactly minimum set of features
[17]. In this paper, unsupervised swarm-based relative re-
duct technique, hybrid of both swarm intelligence and
rough set, is applied to identify the most essential features,
and its accuracies are tested with both clustering and
classification methods that leads in early diagnosis. On
using this hybrid technique, the strict requirement of fitness
function is relaxed and the features are selected by intro-
ducing the dependency among the attributes. This proves to
be a flexible approach in practical applications.
Most of existing algorithms for fetal heart rate focus
only on identifying the status of fetus with the help of
classification techniques. We insist classification alone is
not important; features that have highest impact for clas-
sification is also equally important. This research work
provides the purpose of finding the useful features in
unsupervised approach and the empirical results presented
in this paper reveals it.
The rest of this paper is organized as follows. Section 2
surveys related work. Section 3 discusses rough sets along
with the details of rough sets and fetal heart rate. Feature
selection using rough sets including the algorithm and its
working procedure is given in Sect. 4. Section 5 presents
the experimental results with the performance analysis, and
this paper is concluded in Sect. 6.
2 Related work
Fetal heart rate (FHR) monitoring is mainly used to find out
the amount of oxygen a fetus is acquiring during the time
of labor [18]. In the research carried out so far, it is
observed that 50 % of the death and long-term disablement
occurs due to abnormal FHR pattern; even if it is recog-
nized in the earlier stage, it is not communicated properly
due to lack of knowledge and seriousness, and it is left
without taking appropriate action. Though numerous
measures are taken for the FHR, features that are highly
informative should be identified and recommended to the
physicians for further analysis. This paper aims to identify
the important features by preserving the details of the
dataset.
Features derived from wavelets transform were used in
[6, 19, 20]. A system identification approach to estimate
parameters from FHR and uterine pressures was described
in [21]. The extraction of nonlinear features for FHR
Neural Comput & Applic
123
analysis was applied in different studies. The measure of
fractal dimension was performed by Chaffin [22], Gough
[23] and Felgueiras [24]. Another attempt was to measure
the length of FHR curve using the Higuchi’s method [25].
In this study, two distinct fractal structures within the FHR
variation were identified and that fractal features of heart
rate of healthy normal fetuses changed significantly during
pregnancy period. A hybrid approach for FHR classifica-
tion utilizing grammatical evolution for features construc-
tion was also presented in [26], and the newly constructed
features were tested using a neural network, which was
trained based on a hybrid method involving a combination
of a genetic algorithm and a local optimizer.
A review of the papers that analyzed the spectrum of
FHR either antepartum or intrapartum was given in [27]. In
[28], the spectral power of fetal heart rate variability was
analyzed in relation to fetal scalp blood pH. The absolute
and normalized spectral power in the low-frequency band
(0.04–0.15 Hz) and in the high-frequency band
(0.4–1.5 Hz) was measured. It was found that normalized
low-frequency and normalized high-frequency power of
fetal heart rate variability is associated with fetal scalp
blood pH.
Recently, a system identification approach to estimate
parameters from FHR and uterine pressures was described
in [21]. The extraction of nonlinear features for FHR
analysis was applied in different studies. The measure of
fractal dimension was performed by [22–24]. A review of
the different estimations of fractal dimension was given in
[29]. Another nonlinear methods as the approximate
entropy (ApEn) and sample entropy (SampEn) were used
and proved their applicability in FHR analysis [30–32].
One more method for nonlinear analysis is Lempel–Ziv
complexity used in [33]. The conventional features were
evaluated and compared to the nonlinear ones for intra-
partum FHR classification in [34]. It was proven that the
addition of nonlinear features improved accuracy of clas-
sification. The best classification results were achieved
using a combination of conventional and nonlinear features
with sensitivity of 73.4 %, specificity of 76.3 % and
F-measure of 71.9 %. The best selected nonlinear features
were: Lempel–Ziv complexity, sample entropy and fractal
dimension estimated by Higuchi’s method. In this paper,
we have used morphological features of FHR, and the
unsupervised PSO-based relative reduct (US-PSO-RR)
approach produces sensitivity of 72.72 %, specificity of
97.66 % and F-measure of 74.19 %.
The use of rough set theory to construct reducts in a
supervised way for reducing the number of features in an
unsupervised clustering is given in [35]. The authors of
[36] proposed a novel heuristic algorithm based on rough
set theory to find out the feature subset. An application of
rough set method for feature selection in pattern
recognition is presented in [37]. A number of feature
selection methods for decision system based on the rough
set theory approach are reviewed and given in [38]. A
novel approach for fetal heart rate classification is given in
[26]. In this paper, rough-set-based approach is used to find
the features that can be used in future for diagnosis.
In [39], the baseline’s fluctuations were investigated
along gestation, in relation to fractal and nonlinear prop-
erties. The fractal properties were evaluated by applying
detrended fluctuation analysis. The nonlinear properties
and time ordering were explored by applying the scaling
magnitude and sign analyses. The main findings were that
the baseline showed fractal and particular nonlinear anti-
correlated fluctuations which suggests that the baseline
may provide on information concerning the functional
integration of cardiac regulatory mechanisms.
For classification of the FHR signals, many different
approaches were proposed in the literature. Among these
are the methods based on fuzzy set theory and fuzzy logic.
A fuzzy system was developed for the assessment of the
fetal state in [40, 41]. The developed system represents the
fuzzy extension of an existing classical (crisp) expert sys-
tem [42] assessing features of five-min segments of FHR
recording. A higher performance of the fuzzy system in
comparison with the crisp expert system was demonstrated
as measured by a degree of agreement with clinical experts.
A set of classifiers of the FHR signals based on fuzzy
inference systems was presented in [43, 44]. The main goal
was to identify the intrauterine growth retardation and
diabetes type I based on gestational age and quantitative
description of the signal in time and frequency domains. In
[45], the signal describing parameters were used as inputs
to fetal distress fuzzy monitoring system.
Another group of methods for the fetal state assessment
constitutes procedures using learning and generalization
capabilities of artificial neural networks (ANN). In [46], a
five-layer feedforward neural network was constructed for
the fetal state assessment. The classification accuracy was
calculated in relation to the clinical expert’s interpretation.
An application of self-organizing neural networks was
done in [47]. A comparison of the classification perfor-
mance when using both types of networks was presented in
[48]. The obtained results showed a higher classification
accuracy of the multilayer perceptron network. The ANN
classifiers were compared to classical statistical methods
using quantitative description of FHR signals in [49]. The
ANN resulted in an improved quality of the FHR record-
ings assessment. It was also identified that the multilayer
perceptron networks are the most suitable for evaluating
the fetal state on the basis of quantitative analysis of FHR
recordings. These findings were also emphasized in [50].
Some practical issues on ANN application to fetal state
assessment on the basis of quantitative description of FHR
Neural Comput & Applic
123
signals were presented in [51, 52]. A comparison of the
fetal outcome prediction capabilities using a three-layer
ANN and fuzzy clustering algorithm was demonstrated in
[53]. Application of ANN showed a higher evaluation
quality; however, a fuzzy approach was suggested for
databases of smaller size. A hybrid approach for FHR
classification utilizing grammatical evolution for features
construction was also presented in [26]. The newly con-
structed features were tested using a neural network, which
was trained based on a hybrid method involving a combi-
nation of a genetic algorithm and a local optimizer. The
performance of conventional classifiers such as k-nearest
neighbors (k-NN), linear discriminant classifier (LDC) and
quadratic discriminant classifier (QDC) was compared to
the hybrid approach method. The hybrid approach method
overwhelmed the approach with the conventional classifi-
ers and the principal component analysis (PCA) stage. The
obtained results on real dataset demonstrated an overall
specificity and sensitivity of 90 %. A simple analysis of
US-PSO-RR approach is given in [54].
From the study, it is understood that most of the papers
focus on classifying the FHR; we comprehend looking for
informative features is also desirable in near future. If
classification alone gets more attention; when the dataset
grows with huge number of samples and features concur-
rently, time it requires to classify and diagnose is unpre-
dictable. In this modern era, physicians track for specific
constraint that is complex during labor and attempt to
reduce the risk as much as possible. Applying rough sets
alone for this kind of problem is not sufficient. Intelli-
gence-based methodology will produce remarkable results.
This motivated us to use US-PSO-RR approach, a combi-
nation of rough sets and swarm intelligence, which out-
performs other conventional methods used in the literature
by producing overall specificity of 97.66 %.
3 Rough set: preliminaries
Rough set theory [16] is an extension of conventional set
theory that supports approximations in decision making. It
possesses many features in common with Dempster–
Shafer theory of evidence. The rough set is the approxi-
mation of a vague set by a pair of precise concepts called
lower and upper approximations. Lower approximation is
a description of the domain objects which definitely
belong to the subset of interest, whereas the upper
approximation is a description of the objects that may or
may not belong to the subset. Rough sets are applied in
many domains such as medicine, finance, telecommuni-
cation, vibration analysis, conflict resolution, intelligent
agents, image analysis, pattern recognition, control theory,
process industry and marketing [55]. Feature selection
aims to choose a subset of original features which pro-
vides the most useful information by preserving the sig-
nificant details present in a given dataset. This can be
achieved by detecting and ignoring the noisy features
from the dataset.
Rough sets, introduced by Pawlak [16], helps to spot
the most informative features by considering the condi-
tional attributes alone without requiring any additional
information and helps in knowledge discovery. Rough set
approach is an approximation of sets resulting in the form
of granular computing and thus becomes a part of com-
putational intelligence. Rough set approach forces to dis-
cover to what extent a given set of objects approximates
another set of objects of interest [56]. The main advantage
of rough set analysis is it requires no additional parame-
ters to operate other than the available data. When FHR is
considered, it is not possible for the physicians to say
whether two or more feature values are similar and to
what extent they are same, they may be alike or differ due
to noise leading to improper or late diagnosis. Most of the
existing feature selection algorithms are supervised; it
tends to depend on the decision attribute. For medical
diagnosis, the physicians require lot of experiments to
predict some sort of disorders. In such situation, unsu-
pervised feature selection algorithm plays a vital part to
assist physicians. Rough sets helps in removing the irrel-
evant attributes without any information loss. The fol-
lowing sections explain how rough set is applied for fetal
heart rate with appropriate notations.
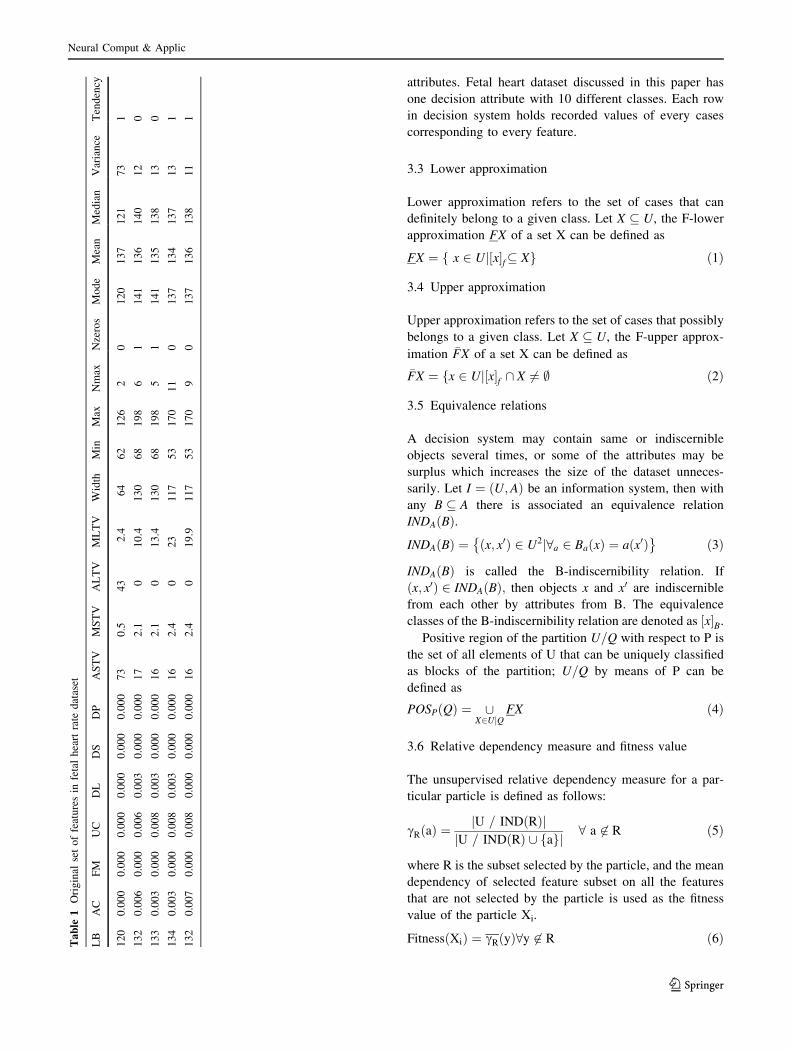
3.1 Rough sets and fetal heart rate
Fetal heart rate dataset can also be called as information
(Table 1) according to rough sets; it is represented as a
table shown in Table 1, and each row represents a case and
column represents a feature. Information table comprises a
set of cases (rows) called universe (U) and a set of features
(columns) represented as ‘A.’ Hence, an information table
is a pair I = (U, A), where U is a non-empty finite set of
cases called the universe and A is a non-empty finite set of
features such that a: U ! Va for every a [ A. The set Va is
called the value set of a. Fetal heart rate dataset comprises
21 features and 10 classes. Feature selection technique is
applied to identify the most informative features to diag-
nose quickly.
3.2 Lower and upper approximations
Information system which contains all the 21 features with
2,126 samples is denoted as I = (U, A). U is the universe
with non-empty set of finite samples; A is a non-empty
finite set of conditional attributes. A decision system
includes conditional attributes and one or more decision
Neural Comput & Applic
123
attributes. Fetal heart dataset discussed in this paper has
one decision attribute with 10 different classes. Each row
in decision system holds recorded values of every cases
corresponding to every feature.
3.3 Lower approximation
Lower approximation refers to the set of cases that can
definitely belong to a given class. Let X � U, the F-lower
approximation FX of a set X can be defined as
FX ¼ f x 2 Uj x½ �f� Xg ð1Þ
3.4 Upper approximation
Upper approximation refers to the set of cases that possibly
belongs to a given class. Let X � U, the F-upper approx-
imation �FX of a set X can be defined as
�FX ¼ fx 2 Uj½x�f \ X 6¼ ; ð2Þ
3.5 Equivalence relations
A decision system may contain same or indiscernible
objects several times, or some of the attributes may be
surplus which increases the size of the dataset unneces-
sarily. Let I ¼ U;Að Þ be an information system, then with
any B � A there is associated an equivalence relation
INDAðBÞ.INDA Bð Þ ¼ x; x0ð Þ 2 U2j8a 2 Ba xð Þ ¼ a x0ð Þ
� �ð3Þ
INDA Bð Þ is called the B-indiscernibility relation. If
x; x0ð Þ 2 INDA Bð Þ; then objects x and x0 are indiscernible
from each other by attributes from B. The equivalence
classes of the B-indiscernibility relation are denoted as x½ �B.
Positive region of the partition U=Q with respect to P is
the set of all elements of U that can be uniquely classified
as blocks of the partition; U=Q by means of P can be
defined as
POSP Qð Þ ¼ [X2UjQ
FX ð4Þ
3.6 Relative dependency measure and fitness value
The unsupervised relative dependency measure for a par-
ticular particle is defined as follows:
cR að Þ ¼ U = INDðRÞj jU = INDðRÞ [ fagj j 8 a 62 R ð5Þ
where R is the subset selected by the particle, and the mean
dependency of selected feature subset on all the features
that are not selected by the particle is used as the fitness
value of the particle Xi.
Fitness Xið Þ ¼ cR yð Þ8y 62 R ð6ÞTa
ble
1O
rig
inal
set
of
feat
ure
sin
feta
lh
eart
rate
dat
aset
LB
AC
FM
UC
DL
DS
DP
AS
TV
MS
TV
AL
TV
ML
TV
Wid
thM
inM
axN
max
Nze
ros
Mo
de
Mea
nM
edia
nV
aria
nce
Ten
den
cy
12
00
.00
00
.00
00
.00
00
.00
00
.00
00
.00
07
30
.54
32
.46
46
21
26
20
12
01
37
12
17
31
13
20
.00
60
.00
00
.00
60
.00
30
.00
00
.00
01
72
.10
10
.41
30
68
19
86
11
41
13
61
40
12
0
13
30
.00
30
.00
00
.00
80
.00
30
.00
00
.00
01
62
.10
13
.41
30
68
19
85
11
41
13
51
38
13
0
13
40
.00
30
.00
00
.00
80
.00
30
.00
00
.00
01
62
.40
23
11
75
31
70
11
01
37
13
41
37
13
1
13
20
.00
70
.00
00
.00
80
.00
00
.00
00
.00
01
62
.40
19
.91
17
53
17
09
01
37
13
61
38
11
1
Neural Comput & Applic
123
4 Feature selection and rough sets
An information system or a decision system may have
more than one reducts. Any one subset can be used to
replace the original table. Finding all the reducts from a
decision system or an information system is NP-hard [57].
In most of the real applications, it is usually not necessary
to find all of them. It is sufficient to compute only one
reduct [58].
When there occurs more than one set of reducts, one
possibility of selecting the reduct is to consider the subset
with the least number of features. This selection process is
not suitable for all applications. At the time of applying
these kinds of feature selection techniques, classification
accuracy measures can be applied and the reduct set which
gives the highest classification accuracy shall be taken.
Conditional attributes have been taken from the fetal
heart rate dataset, and therefore, unsupervised feature
selection technique called US-PSO-RR proposed in [59] is
applied.
4.1 Unsupervised PSO-based relative reduct
(US-PSO-RR)
Particle swarm optimization algorithm, one of the swarm
intelligence approach is based on the principles of collec-
tive behavior of swarms. Relative reduct algorithm a
rough-set-based technique includes all the attributes at
once and then checks for the dependency between the
conditional attributes and decision attribute. Unsupervised
feature selection algorithm and unsupervised relative re-
duct (USRR) [60] calculate the dependency measures for
every attribute without considering decision attribute. If the
dependency between the conditional attribute is 1, then the
subset should be retained.
Rough-set-based feature reduction algorithms like
USRR [60] and unsupervised quick reduct (USQR) [61]
can also be applied, but it will take more time to converge
as proved in [59]. When PSO is combined with rough set,
rather than taking all combinations, it starts by representing
every particle’s position as a binary bit in which the attri-
butes marked as 1’s are taken for further processing. Each
particle’s position is considered as an attribute subset.
With the intelligence of swarm, features are covered in all
combinations; with the influence of rough sets, features that
are not highly dependent are removed; rest of the features is
retained. This is how swarm-based relative reduct is focused
in this paper, and the same is detailed in next section.
For example, if five features from FHR dataset, namely
base line value (LB), number of accelerations per second
(AC), number of fetal movements per second (FM), num-
ber of uterine contractions per second (UC) and number of
light decelerations per second (DL) are taken and if the
selected particle is (0, 1, 0, 1, 1), then the feature subset is
AC, UC and DL. The technique applied in this paper is
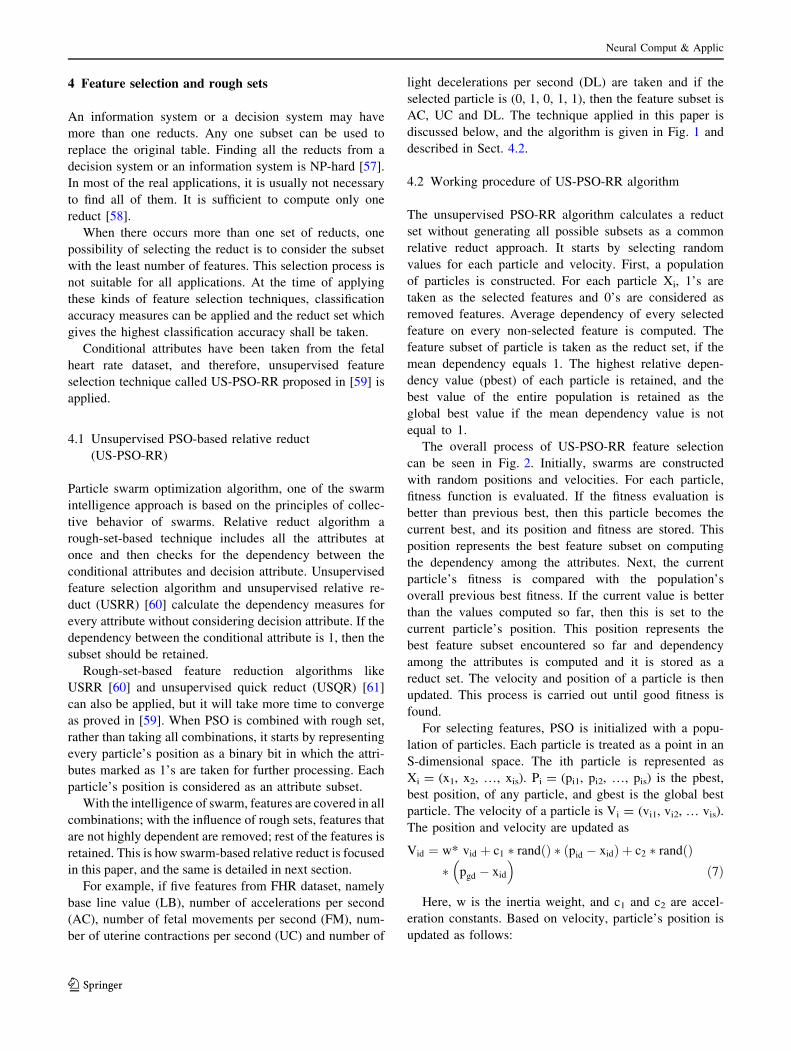
discussed below, and the algorithm is given in Fig. 1 and
described in Sect. 4.2.
4.2 Working procedure of US-PSO-RR algorithm
The unsupervised PSO-RR algorithm calculates a reduct
set without generating all possible subsets as a common
relative reduct approach. It starts by selecting random
values for each particle and velocity. First, a population
of particles is constructed. For each particle Xi, 1’s are
taken as the selected features and 0’s are considered as
removed features. Average dependency of every selected
feature on every non-selected feature is computed. The
feature subset of particle is taken as the reduct set, if the
mean dependency equals 1. The highest relative depen-
dency value (pbest) of each particle is retained, and the
best value of the entire population is retained as the
global best value if the mean dependency value is not
equal to 1.
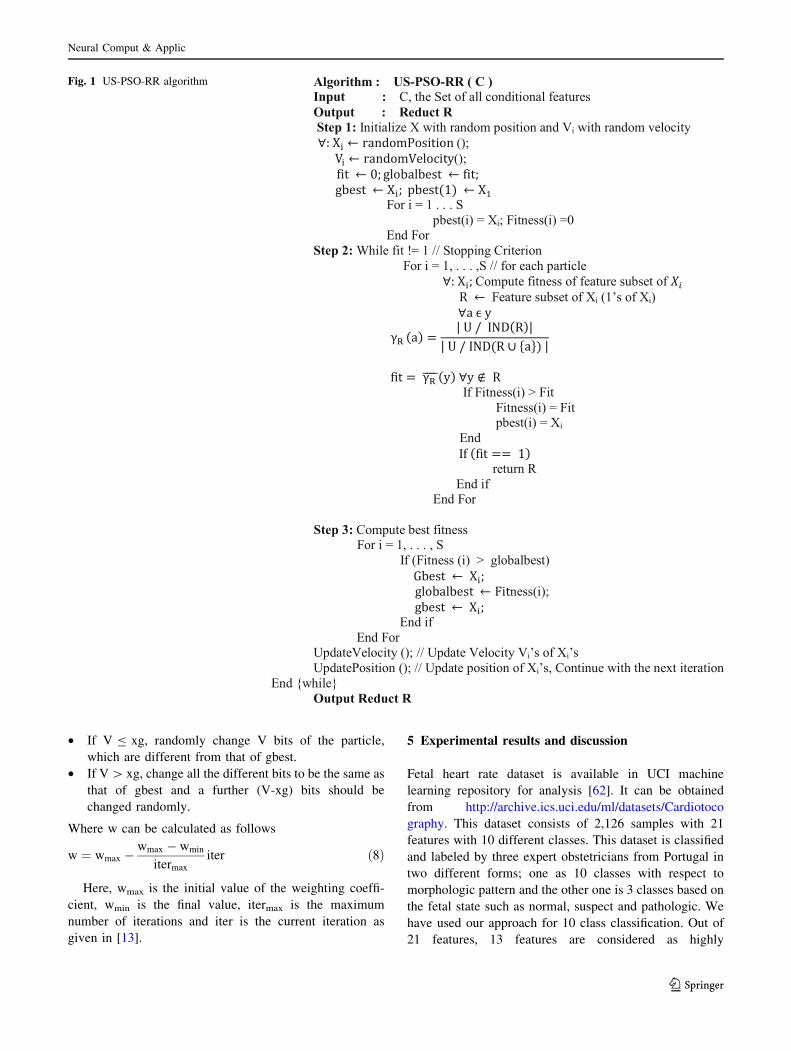
The overall process of US-PSO-RR feature selection
can be seen in Fig. 2. Initially, swarms are constructed
with random positions and velocities. For each particle,
fitness function is evaluated. If the fitness evaluation is
better than previous best, then this particle becomes the
current best, and its position and fitness are stored. This
position represents the best feature subset on computing
the dependency among the attributes. Next, the current
particle’s fitness is compared with the population’s
overall previous best fitness. If the current value is better
than the values computed so far, then this is set to the
current particle’s position. This position represents the
best feature subset encountered so far and dependency
among the attributes is computed and it is stored as a
reduct set. The velocity and position of a particle is then
updated. This process is carried out until good fitness is
found.
For selecting features, PSO is initialized with a popu-
lation of particles. Each particle is treated as a point in an
S-dimensional space. The ith particle is represented as
Xi = (x1, x2, …, xis). Pi = (pi1, pi2, …, pis) is the pbest,
best position, of any particle, and gbest is the global best
particle. The velocity of a particle is Vi = (vi1, vi2, … vis).
The position and velocity are updated as
Vid ¼ w* vid þ c1 � randðÞ � pid � xidð Þ þ c2 � randðÞ� pgd � xid
� �ð7Þ
Here, w is the inertia weight, and c1 and c2 are accel-
eration constants. Based on velocity, particle’s position is
updated as follows:
Neural Comput & Applic
123
• If V B xg, randomly change V bits of the particle,
which are different from that of gbest.
• If V [ xg, change all the different bits to be the same as
that of gbest and a further (V-xg) bits should be
changed randomly.
Where w can be calculated as follows
w ¼ wmax �wmax � wmin
itermax
iter ð8Þ
Here, wmax is the initial value of the weighting coeffi-
cient, wmin is the final value, itermax is the maximum
number of iterations and iter is the current iteration as
given in [13].
5 Experimental results and discussion
Fetal heart rate dataset is available in UCI machine
learning repository for analysis [62]. It can be obtained
from http://archive.ics.uci.edu/ml/datasets/Cardiotoco
graphy. This dataset consists of 2,126 samples with 21
features with 10 different classes. This dataset is classified
and labeled by three expert obstetricians from Portugal in
two different forms; one as 10 classes with respect to
morphologic pattern and the other one is 3 classes based on
the fetal state such as normal, suspect and pathologic. We
have used our approach for 10 class classification. Out of
21 features, 13 features are considered as highly
Fig. 1 US-PSO-RR algorithm
Neural Comput & Applic
123
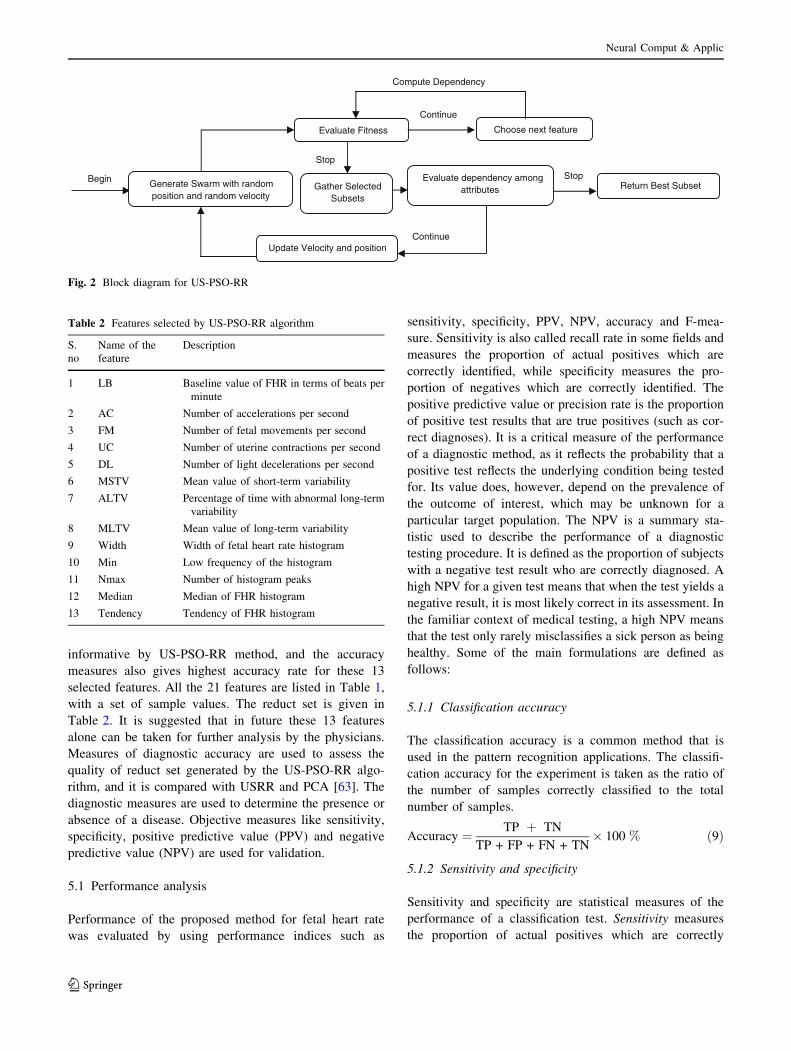
informative by US-PSO-RR method, and the accuracy
measures also gives highest accuracy rate for these 13
selected features. All the 21 features are listed in Table 1,
with a set of sample values. The reduct set is given in
Table 2. It is suggested that in future these 13 features
alone can be taken for further analysis by the physicians.
Measures of diagnostic accuracy are used to assess the
quality of reduct set generated by the US-PSO-RR algo-
rithm, and it is compared with USRR and PCA [63]. The
diagnostic measures are used to determine the presence or
absence of a disease. Objective measures like sensitivity,
specificity, positive predictive value (PPV) and negative
predictive value (NPV) are used for validation.
5.1 Performance analysis
Performance of the proposed method for fetal heart rate
was evaluated by using performance indices such as
sensitivity, specificity, PPV, NPV, accuracy and F-mea-
sure. Sensitivity is also called recall rate in some fields and
measures the proportion of actual positives which are
correctly identified, while specificity measures the pro-
portion of negatives which are correctly identified. The
positive predictive value or precision rate is the proportion
of positive test results that are true positives (such as cor-
rect diagnoses). It is a critical measure of the performance
of a diagnostic method, as it reflects the probability that a
positive test reflects the underlying condition being tested
for. Its value does, however, depend on the prevalence of
the outcome of interest, which may be unknown for a
particular target population. The NPV is a summary sta-
tistic used to describe the performance of a diagnostic
testing procedure. It is defined as the proportion of subjects
with a negative test result who are correctly diagnosed. A
high NPV for a given test means that when the test yields a
negative result, it is most likely correct in its assessment. In
the familiar context of medical testing, a high NPV means
that the test only rarely misclassifies a sick person as being
healthy. Some of the main formulations are defined as
follows:
5.1.1 Classification accuracy
The classification accuracy is a common method that is
used in the pattern recognition applications. The classifi-
cation accuracy for the experiment is taken as the ratio of
the number of samples correctly classified to the total
number of samples.
Accuracy ¼ TP þ TN
TP + FP + FN + TN� 100 % ð9Þ
5.1.2 Sensitivity and specificity
Sensitivity and specificity are statistical measures of the
performance of a classification test. Sensitivity measures
the proportion of actual positives which are correctly
Begin Generate Swarm with randomposition and random velocity
Evaluate Fitness
Gather SelectedSubsets
Evaluate dependency amongattributes Return Best Subset
Choose next feature
Update Velocity and position
Continue
Compute Dependency
Stop
Continue
Stop
Fig. 2 Block diagram for US-PSO-RR
Table 2 Features selected by US-PSO-RR algorithm
S.
no
Name of the
feature
Description
1 LB Baseline value of FHR in terms of beats per
minute
2 AC Number of accelerations per second
3 FM Number of fetal movements per second
4 UC Number of uterine contractions per second
5 DL Number of light decelerations per second
6 MSTV Mean value of short-term variability
7 ALTV Percentage of time with abnormal long-term
variability
8 MLTV Mean value of long-term variability
9 Width Width of fetal heart rate histogram
10 Min Low frequency of the histogram
11 Nmax Number of histogram peaks
12 Median Median of FHR histogram
13 Tendency Tendency of FHR histogram
Neural Comput & Applic
123
identified as such (e.g., the percentage of sick people who
are correctly identified as having the condition). Specificity
measures the proportion of negatives which are correctly
identified (e.g., the percentage of healthy people who are
correctly identified as not having the condition). For sen-
sitivity and specificity analysis, we use the following
expressions:
Senstivity ¼ TP
TP + FN� 100 % ð10Þ
Specificity ¼ TN
FP + TN� 100 % ð11Þ
5.1.3 Positive predictive value (PPV), negative predictive
value (NPV)
Positive predictive value is the proportion of positive test
results that are true positives (such as correct diagnoses). It
is a critical measure of the performance of a diagnostic
method, as it reflects the probability that a positive test
reflects the underlying condition being tested for. The NPV
is the probability that gives a negative result, when the fetal
heart rate measure is absent. It is defined as the proportion
of subjects with a negative test result who are correctly
diagnosed. A high NPV for a given test means that when
the test yields a negative result, it is most likely correct in
its assessment.
PPV ¼ TP
TP + FP� 100 % ð12Þ
NPV ¼ TN
TN + FN� 100 % ð13Þ
5.1.4 F-measure
The F-measure or F-score can be used as a single measure
of performance of the test. The F-score is the harmonic
mean of precision and recall and can be calculated as:
F�measure ¼ 2 precision� recallð Þprecisionþ recall
ð14Þ
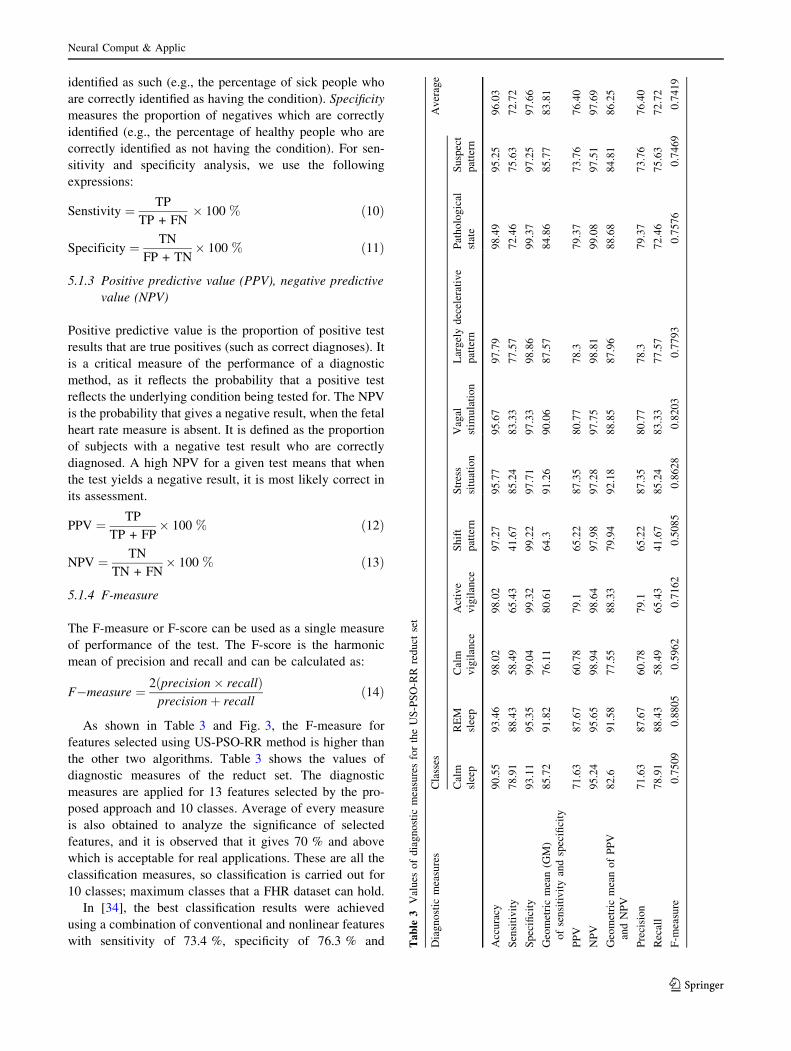
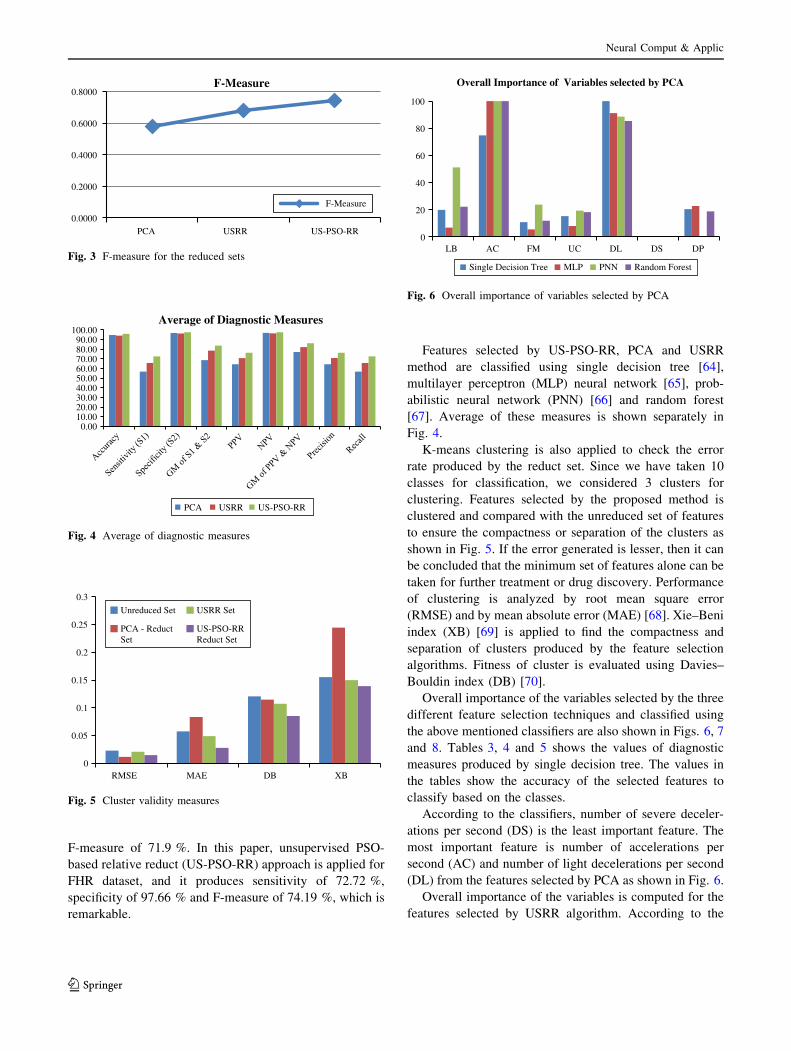
As shown in Table 3 and Fig. 3, the F-measure for
features selected using US-PSO-RR method is higher than
the other two algorithms. Table 3 shows the values of
diagnostic measures of the reduct set. The diagnostic
measures are applied for 13 features selected by the pro-
posed approach and 10 classes. Average of every measure
is also obtained to analyze the significance of selected
features, and it is observed that it gives 70 % and above
which is acceptable for real applications. These are all the
classification measures, so classification is carried out for
10 classes; maximum classes that a FHR dataset can hold.
In [34], the best classification results were achieved
using a combination of conventional and nonlinear features
with sensitivity of 73.4 %, specificity of 76.3 % and Ta
ble
3V
alu
eso
fd
iag
no
stic
mea
sure
sfo
rth
eU
S-P
SO
-RR
red
uct
set
Dia
gn
ost
icm
easu
res
Cla
sses
Av
erag
e
Cal
m
slee
p
RE
M
slee
p
Cal
m
vig
ilan
ce
Act
ive
vig
ilan
ce
Sh
ift
pat
tern
Str
ess
situ
atio
n
Vag
al
stim
ula
tio
n
Lar
gel
yd
ecel
erat
ive
pat
tern
Pat
ho
log
ical
stat
e
Su
spec
t
pat
tern
Acc
ura
cy9
0.5
59
3.4
69
8.0
29
8.0
29
7.2
79
5.7
79
5.6
79
7.7
99
8.4
99
5.2
59
6.0
3
Sen
siti
vit
y7
8.9
18
8.4
35
8.4
96
5.4
34
1.6
78
5.2
48
3.3
37
7.5
77
2.4
67
5.6
37
2.7
2
Sp
ecifi
city
93
.11
95
.35
99
.04
99
.32
99
.22
97
.71
97
.33
98
.86
99
.37
97
.25
97
.66
Geo
met
ric
mea
n(G
M)
of
sen
siti
vit
yan
dsp
ecifi
city
85
.72
91
.82
76
.11
80
.61
64
.39
1.2
69
0.0
68
7.5
78
4.8
68
5.7
78
3.8
1
PP
V7
1.6
38
7.6
76
0.7
87
9.1
65
.22
87
.35
80
.77
78
.37
9.3
77
3.7
67
6.4
0
NP
V9
5.2
49
5.6
59
8.9
49
8.6
49
7.9
89
7.2
89
7.7
59
8.8
19
9.0
89
7.5
19
7.6
9
Geo
met
ric
mea
no
fP
PV
and
NP
V
82
.69
1.5
87
7.5
58
8.3
37
9.9
49
2.1
88
8.8
58
7.9
68
8.6
88
4.8
18
6.2
5
Pre
cisi
on
71
.63
87
.67
60
.78
79
.16
5.2
28
7.3
58
0.7
77
8.3
79
.37
73
.76
76
.40
Rec
all
78
.91
88
.43
58
.49
65
.43
41
.67
85
.24
83
.33
77
.57
72
.46
75
.63
72
.72
F-m
easu
re0
.75
09
0.8
80
50
.59
62
0.7
16
20
.50
85
0.8
62
80
.82
03
0.7
79
30
.75
76
0.7
46
90
.74
19
Neural Comput & Applic
123
F-measure of 71.9 %. In this paper, unsupervised PSO-
based relative reduct (US-PSO-RR) approach is applied for
FHR dataset, and it produces sensitivity of 72.72 %,
specificity of 97.66 % and F-measure of 74.19 %, which is
remarkable.
Features selected by US-PSO-RR, PCA and USRR
method are classified using single decision tree [64],
multilayer perceptron (MLP) neural network [65], prob-
abilistic neural network (PNN) [66] and random forest
[67]. Average of these measures is shown separately in
Fig. 4.
K-means clustering is also applied to check the error
rate produced by the reduct set. Since we have taken 10
classes for classification, we considered 3 clusters for
clustering. Features selected by the proposed method is
clustered and compared with the unreduced set of features
to ensure the compactness or separation of the clusters as
shown in Fig. 5. If the error generated is lesser, then it can
be concluded that the minimum set of features alone can be
taken for further treatment or drug discovery. Performance
of clustering is analyzed by root mean square error
(RMSE) and by mean absolute error (MAE) [68]. Xie–Beni
index (XB) [69] is applied to find the compactness and
separation of clusters produced by the feature selection
algorithms. Fitness of cluster is evaluated using Davies–
Bouldin index (DB) [70].
Overall importance of the variables selected by the three
different feature selection techniques and classified using
the above mentioned classifiers are also shown in Figs. 6, 7
and 8. Tables 3, 4 and 5 shows the values of diagnostic
measures produced by single decision tree. The values in
the tables show the accuracy of the selected features to
classify based on the classes.
According to the classifiers, number of severe deceler-
ations per second (DS) is the least important feature. The
most important feature is number of accelerations per
second (AC) and number of light decelerations per second
(DL) from the features selected by PCA as shown in Fig. 6.
Overall importance of the variables is computed for the
features selected by USRR algorithm. According to the
0.0000
0.2000
0.4000
0.6000
0.8000
PCA USRR US-PSO-RR
F-Measure
F-Measure
Fig. 3 F-measure for the reduced sets
0.0010.0020.0030.0040.0050.0060.0070.0080.0090.00
100.00Average of Diagnostic Measures
PCA USRR US-PSO-RR
Fig. 4 Average of diagnostic measures
0
0.05
0.1
0.15
0.2
0.25
0.3
RMSE MAE DB XB
Unreduced Set
PCA - ReductSet
USRR Set
US-PSO-RRReduct Set
Fig. 5 Cluster validity measures
0
20
40
60
80
100
LB AC FM UC DL DS DP
Overall Importance of Variables selected by PCA
Single Decision Tree MLP PNN Random Forest
Fig. 6 Overall importance of variables selected by PCA
Neural Comput & Applic
123
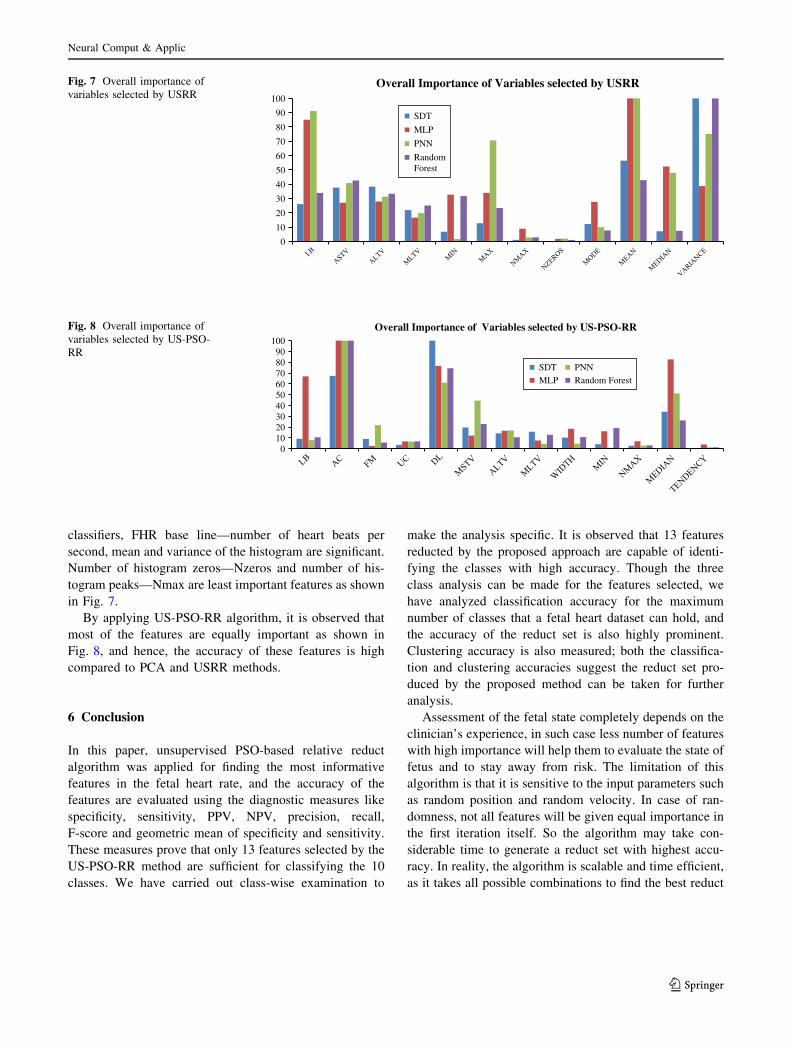
classifiers, FHR base line—number of heart beats per
second, mean and variance of the histogram are significant.
Number of histogram zeros—Nzeros and number of his-
togram peaks—Nmax are least important features as shown
in Fig. 7.
By applying US-PSO-RR algorithm, it is observed that
most of the features are equally important as shown in
Fig. 8, and hence, the accuracy of these features is high
compared to PCA and USRR methods.
6 Conclusion
In this paper, unsupervised PSO-based relative reduct
algorithm was applied for finding the most informative
features in the fetal heart rate, and the accuracy of the
features are evaluated using the diagnostic measures like
specificity, sensitivity, PPV, NPV, precision, recall,
F-score and geometric mean of specificity and sensitivity.
These measures prove that only 13 features selected by the
US-PSO-RR method are sufficient for classifying the 10
classes. We have carried out class-wise examination to
make the analysis specific. It is observed that 13 features
reducted by the proposed approach are capable of identi-
fying the classes with high accuracy. Though the three
class analysis can be made for the features selected, we
have analyzed classification accuracy for the maximum
number of classes that a fetal heart dataset can hold, and
the accuracy of the reduct set is also highly prominent.
Clustering accuracy is also measured; both the classifica-
tion and clustering accuracies suggest the reduct set pro-
duced by the proposed method can be taken for further
analysis.
Assessment of the fetal state completely depends on the
clinician’s experience, in such case less number of features
with high importance will help them to evaluate the state of
fetus and to stay away from risk. The limitation of this
algorithm is that it is sensitive to the input parameters such
as random position and random velocity. In case of ran-
domness, not all features will be given equal importance in
the first iteration itself. So the algorithm may take con-
siderable time to generate a reduct set with highest accu-
racy. In reality, the algorithm is scalable and time efficient,
as it takes all possible combinations to find the best reduct
0
10
20
30
40
50
60
70
80
90
100
Overall Importance of Variables selected by USRR
SDT
MLP
PNN
RandomForest
Fig. 7 Overall importance of
variables selected by USRR
0102030405060708090
100
Overall Importance of Variables selected by US-PSO-RR
SDT
MLP
PNN
Random Forest
Fig. 8 Overall importance of
variables selected by US-PSO-
RR
Neural Comput & Applic
123

Ta
ble
4V
alu
eso
fd
iag
no
stic
mea
sure
sfo
rP
CA
red
uct
set
Dia
gn
ost
icm
easu
res
Cla
sses
Av
erag
e
Cal
m
slee
p
RE
M
slee
p
Cal
m
vig
ilan
ce
Act
ive
vig
ilan
ce
Sh
ift
pat
tern
Str
ess
situ
atio
n
Vag
al
stim
ula
tio
n
Lar
gel
yd
ecel
erat
ive
pat
tern
Pat
ho
log
ical
stat
e
Su
spec
t
pat
tern
Acc
ura
cy8
7.0
69
2.3
89
7.5
19
7.5
59
5.3
49
5.6
79
6.4
79
7.8
89
6.7
19
1.6
79
4.8
2
Sen
siti
vit
y7
58
9.9
81
.89
45
.68
5.5
68
4.3
48
4.9
27
8.5
42
.03
59
.95
6.7
8
Sp
ecifi
city
89
.72
93
.28
99
.95
99
.61
98
.49
97
.77
98
.03
98
.91
98
.54
94
.92
96
.92
Geo
met
ric
mea
n(G
M)
of
sen
siti
vit
yan
dsp
ecifi
city
82
.03
91
.62
13
.73
67
.45
23
.39
90
.81
91
.24
88
.12
64
.36
75
.46
8.8
2
PP
V6
1.6
78
3.3
65
08
2.2
21
1.4
38
7.5
85
.26
79
.25
49
.15
54
.63
64
.45
NP
V9
4.2
19
6.1
49
7.5
59
7.8
99
6.7
59
7.1
29
7.9
79
8.8
69
8.0
69
5.8
69
7.0
4
Geo
met
ric
mea
no
fP
PV
and
NP
V7
6.2
28
9.5
26
9.8
48
9.7
13
3.2
59
2.1
89
1.4
88
.51
69
.43
72
.37
77
.24
Pre
cisi
on
61
.67
83
.36
50
82
.22
11
.43
87
.58
5.2
67
9.2
54
9.1
55
4.6
36
4.4
5
Rec
all
75
89
.98
1.8
94
5.6
85
.56
84
.34
84
.92
78
.54
2.0
35
9.9
56
.78
F-m
easu
re0
.67
69
0.8
65
40
.03
64
0.5
87
30
.07
48
0.8
58
90
.85
09
0.7
88
70
.45
31
0.5
71
40
.57
64
Ta
ble
5V
alu
eso
fd
iag
no
stic
mea
sure
sfo
rU
SR
Rre
du
ctse
t
Dia
gn
ost
icm
easu
res
Cla
sses
Av
erag
e
Cal
m
slee
p
RE
M
slee
p
Cal
m
vig
ilan
ce
Act
ive
vig
ilan
ceS
hif
t
pat
tern
Str
ess
situ
atio
n
Vag
al
stim
ula
tio
n
Lar
gel
yd
ecel
erat
ive
pat
tern
Pat
ho
log
ical
stat
e
Su
spec
t
pat
tern
Acc
ura
cy9
1.3
83
.44
97
.79
97
.74
96
.28
88
.38
91
.39
98
.92
98
.87
96
.89
4.0
9
Sen
siti
vit
y7
5.7
87
5.1
35
4.7
25
3.0
92
56
9.8
85
3.5
78
6.9
27
8.2
68
5.2
86
5.7
6
Sp
ecifi
city
94
.72
86
.55
98
.89
99
.51
98
.78
91
.81
96
.48
99
.55
99
.56
97
.98
96
.38
Geo
met
ric
mea
n(G
M)
of
sen
siti
vit
yan
dsp
ecifi
city
84
.72
80
.64
73
.56
72
.68
49
.69
80
.17
1.8
99
3.0
28
8.2
79
1.4
17
8.6
0
PP
V7
5.9
86
7.6
55
5.7
78
1.1
34
1.8
66
1.2
16
7.1
69
1.1
88
5.7
18
1.1
67
0.8
8
NP
V9
4.6
69
0.2
99
8.8
49
8.1
79
7.4
19
4.2
89
3.9
29
9.3
19
9.2
79
8.4
99
6.4
6
Geo
met
ric
mea
no
fP
PV
and
NP
V
84
.81
78
.16
74
.25
89
.24
63
.86
75
.97
79
.42
95
.16
92
.24
89
.41
82
.25
Pre
cisi
on
75
.98
67
.65
55
.77
81
.34
1.8
66
1.2
16
7.1
69
1.1
88
5.7
18
1.1
67
0.9
0
Rec
all
75
.78
75
.13
54
.72
53
.09
25
69
.88
53
.57
86
.92
78
.26
85
.28
65
.76
F-m
easu
re0
.75
88
0.7
11
90
.55
24
0.6
41
80
.31
30
.65
26
0.5
96
0.8
90
.81
82
0.8
31
70
.67
66
Neural Comput & Applic
123
set rather than taking the dataset as such. As a future
direction, neural networks can be used to tune the param-
eters and to achieve better performance.
References
1. Geijn HP (1996) Developments in CTG analysis. Bailliere’s Clin.
Obstet. Gynaecol. 10(2):185–209
2. Steer PJ (2008) Has electronic fetal heart rate monitoring made a
difference. Semin. Fetal Neonat. Med. 13:2–7
3. FIGO (1986) Guidelines for the use of fetal monitoring. Int.
J. Gynecol. Obstet. 25:159–167
4. Goncalves H, Rocha AP, De Campos DA, Bernardes J (2006)
Linear and nonlinear fetal heart rate analysis of normal and aci-
demic fetuses in the minutes preceding delivery. Med. Biol. Eng.
Comput. 44(10):847–855
5. Magenes G, Signorini MG, Arduini D (2000) Classification of
cardiotocographic records by neural networks. In: Proceedings of
the IEEE-INNS-ENNS international joint conference on neural
networks IJCNN, vol 3, pp 637–641
6. Salamalekis E, Thomopoulos P, Giannaris D, Salloum I, Vasios
G, Prentza A, Koutsouris D (2002) Computerised intrapartum
diagnosis of fetal hypoxia based on fetal heart rate monitoring
and fetal pulse oximetry recordings utilising wavelet analysis and
neural networks. BJOG 109(10):1137–1142
7. Georgoulas G, Stylios C, Groumpos P (2005). Classification of
fetal heart rate using scale dependent features and support vector
machines. In: Proceedings of 16th IFAC world congress
8. Leski J (2003) Neuro-fuzzy system with learning tolerant to
imprecision. Fuzzy Sets Syst 138:427–439
9. Czabanski R, Jezewski M, Wrobel J, Horoba K, Jezewski J
(2008). A neurofuzzy approach to the classification of fetal car-
diotocograms. In: Proceedings of 14th international conference
NBC2008, vol 20, pp 446–449
10. Czabanski R, Jezewski M, Wrobel J, Jezewski J, Horoba K
(2010) Predicting the risk of low-fetal birth weight from cardi-
otocographic signals using ANBLIR system with deterministic
annealing and e-insensitive learning. IEEE Trans Inf Technol
Biomed 14:1062–1074
11. Vapnik V (1998) Statistical learning theory. Wiley, New York
12. Vapnik V (1999) An overview of statistical learning theory. IEEE
Trans Neural Netw 10:988–999
13. Magenes G, Signorini MG, Arduini D (2000) Classification of
cardiotocographic records by neural networks. In: Proceedings of
the IEEE-INNSENNS international joint conference on neural
networks (IJCNN’00), vol 3, pp 637–641
14. Magenes G, Signorini MG, Sassi R, Arduini D (2001) Multi-
parametric analysis of fetal heart rate: comparison of neural and
statistical classifiers. In: 9th mediterranean conference on medical
and biological engineering and computing (MEDICON 2001),
IFMBE Proceedings, 12–15 June 2001, Pula, Croatia, vol 1,
pp 360–363
15. Georgoulas G, Stylios C, Bernardes J, Groumpos PP (2004)
Classification of cardiotocograms using Support Vector
Machines. In: Proceedings 10th IFAC symposium on large scale
systems: theory and applications (LSS’04), 26–28 July 2004,
Osaka, Japan
16. Pawlak Z (1982) Rough sets. Int J Comput Inform Sci 11(5):
341–356
17. Nizar Banu PK, Hannah Inbarani H (2012) Performance evalu-
ation of hybridized rough set based unsupervised approaches for
gene selection. Int J Comput Intell Inf 2(2):132–141
18. Costa A, Ayres-de-Campos D, Costa F, Santos C, Bernardes J
(2009) Prediction of neonatal acidemia by computer analysis of
fetal heart rate and ST event signals. Am J Obstet Gynecol
201(5):464.e1–464.e6
19. Georgoulas G, Stylios CD, Groumpos PP (2006) Feature
extraction and classification of fetal heart rate using wavelet
analysis and support vector machines. Int J Artif Intell Tools
15(3):411–432
20. Georgoulas G, Stylios C, Groumpos P (2006) Predicting the risk
of metabolic acidosis for newborns based on fetal heart rate
signal classification using support vector machines. IEEE Trans
Biomed Eng 53(5):875–884
21. Warrick P, Hamilton E, Precup D, Kearney R (2010) Classification
of normal and hypoxic fetuses from systems modeling of intra-
partum cardiotocography. IEEE Trans Biomed Eng 57(4):771–779
22. Chaffin DG, Goldberg CC, Reed KL (1991) The dimension of chaos
in the fetal heart rate. Am J Obstet Gynecol 165(4):1425–1429
23. Gough NA (1993) Fractal analysis of foetal heart rate variability.
Physiol Meas 14(3):309–315
24. Felgueiras CS, Marques de Sa JP, Bernardes J, Gama S (1998)
Classification of foetal heart rate sequences based on fractal
features. Med Biol Eng Comput 36(2):197–201
25. Kikuchi A, Unno N, Horikoshi T, Shimizu T, Kozuma S, Take-
tani Y (2005) Changes in fractal features of fetal heart rate during
pregnancy. Early Hum Dev 81(8):655–661
26. Georgoulas G, Gavrilis D, Tsoulos IG, Stylios C, Bernardes J,
Groumpos PP (2007) Novel approach for fetal heart rate classi-
fication introducing grammatical evolution. Biomed Signal Pro-
cess Control 2(2):69–79
27. Van Laar J, Porath M, Peters C, Oei S (2008) Spectral analysis of
fetal heart rate variability for fetal surveillance: review of the
literature. Acta Obstet Gynecol Scand 87(3):300–306
28. Van Laar J, Peters CHL, Houterman S, Wijn PFF, Kwee A, Oei
SG (2011) Normalized spectral power of fetal heart rate vari-
ability is associated with fetal scalp blood pH. Early Hum Dev
87(4):259–263
29. Hopkins P, Outram N, Zofgren N, Ifeachor EC, Rosen KG (2006)
A comparative study of fetal heart rate variability analysis tech-
niques. In: Proceedings of the 28th annual international confer-
ence of the ieee engineering in medicine and biology society,
pp 1784–1787
30. Pincus SM, Viscarello RR (1992) Approximate entropy: a regu-
larity measure for fetal heart rate analysis. Obstet Gynecol
79(2):249–255
31. Ferrario M, Signorini MG, Magenes G, Cerutti S (2006) Com-
parison of entropy based regularity estimators: application to the
fetal heart rate signal for the identification of fetal distress. IEEE
Trans Biomed Eng 53(1):119–125
32. Goncalves H, Bernardes J, Rocha AP, Ayres-de-Campos D
(2007) Linear and nonlinear analysis of heart rate patterns asso-
ciated with fetal behavioral states in the antepartum period. Early
Hum Dev 83(9):585–591
33. Ferrario M, Signorini M, Magenes G (2009) Complexity analysis
of the fetal heart rate variability: early identification of severe
intrauterine growth-restricted fetuses. Med Biol Eng Comput
47(9):911–919
34. Spilka J, Chudacek V, Koucky M, Lhotska L, Huptych M, Janku
P, Georgoulas G, Stylios C (2012) Using nonlinear features for
fetal heart rate classification. Biomed Signal Process Control
7(4):350–357
35. Questier F, Rollier IA, Walczak B, Massart DL (2002) Appli-
cation of rough set theory to feature selection for unsupervised
clustering. Chemometr Intell Lab Syst 63(2):155–167
36. Zhang J, Wang J, Li D, He H, Sun J (2003) A new heuristic
reduct algorithm base on rough sets theory. LNCS, vol 2762,
pp 247–253. Springer, Berlin
Neural Comput & Applic
123
37. Swiniarski RW, Skowron A (2003) Rough set methods in feature
selection and recognition. Pattern Recognit Lett 24(6):833–849
38. Thangavel K, Pethalakshmi A (2009) Dimensionality reduction
based on rough set theory: a review. Appl Soft Comput 9(1):1–12
39. Echeverrıa JC, 9Alvarez-Ramırez J, Pena MA, Rodrıguez E,
Gaitan MJ, Gonzalez-Camarena R (2012) Fractal and nonlinear
changes in the long-term baseline fluctuations of fetal heart rate.
Med Eng Phys 34(4):466–471
40. Skinner J, Garibaldi J, Ifeachor E (1999) A fuzzy system for fetal
heart rate assessment. In: Reusch B (ed) Computational intelli-
gence. Lecture notes in computer science, vol 1625. Springer,
Berlin, pp 20–29
41. Skinner J, Garibaldi J, Curnow J, Ifeachor E (2000) Intelligent
fetal heart rate analysis. In: 1st International conference on
advances in medical signal and information processing, pp 14–21
42. Keith R, Beckley S, Garibaldi J (1995) A multicentre compara-
tive study of 17 experts and an intelligent computer system for
managing labour using the cardiotocogram. Br J Obstet Gynaecol
102(9):688–700
43. Signorini M, de Angelis A, Magenes G, Sassi R, Arduini D,
Cerutti S (2000). Classification of fetal pathologies through fuzzy
inference systems based on a multiparametric analysis of fetal
heart rate. In: Computers in cardiology, pp 435–438. Cambridge,
MA
44. Arduini D, Giannini F, Magnes G, Signorini MG, Meloni P
(2001). Fuzzy logic in the management of new prenatal variables.
In: Proceedings of 5th world congress of perinatal medicine,
Barcelona, vol 1, pp 1211–1216
45. Huang YP, Huang YH, Sandnes FE (2006) A fuzzy inference
method-based fetal distress monitoring system. In: IEEE inter-
national symposium on industrial electronics, vol 1, pp 55–60,
9–13 July 2006, Montreal, Que
46. Hasbargen U (1994) Application of neural networks for intra-
partum surveillance. In: van Geijn H, Copray F (eds) A critical
appraisal of fetal surveillance. Elsevier Science (Excerpta Med-
ica), Amsterdam, New York, pp 363–367
47. Beksac M, Ozdemir K, Erkmen A, Karakas U (1994) Assessment
of antepartum fetal heart rate tracings using neural networks. In:
van Geijn H, Copray F (eds) A critical appraisal of fetal sur-
veillance. Elsevier Science (Excerpta Medica), Amsterdam, New
York, pp 354–362
48. Magenes G, Signorini M G, Arduini D (2000) Classification of
cardiotocographic records by neural networks. In: Proceedings
IEEE-INNS-ENNS international joint conference on neural net-
works IJCNN, vol 3, pp 637–641
49. Magenes G, Signorini M, Sassi R, Arduini D (2001). Multi-
parametric analysis of fetal heart rate: comparison of neural and
statistical classifiers. In: IFMBE proceedings of MEDICON, vol
1, pp 360–363
50. Noguchi Y, Matsumoto F, Maed K, Nagasawa T (2009) Neural
network analysis and evaluation of the fetal heart rate. Algo-
rithms 2:19–30
51. Jezewski M, Wrobel J, Horoba K, Gacek A, Henzel N, Leski J
(2007) The prediction of fetal outcome by applying neural net-
work for evaluation of CTG records. In: Kurzynski M, Puchala E,
Wozniak M, Zolnierek A (eds) Computer recognition systems 2.
Advances in intelligent and soft computing, vol 45. Springer,
Berlin, pp 532–541
52. Jezewski M, Czabanski R, Wrobel J, Horoba K (2010) Analysis
of extracted cardiotocographic signal features to improve
automated prediction of fetal outcome. Biocybernetics and Bio-
medical Engineering 30:39–47
53. Frize M, Ibrahim D, Seker H, Walker R, Odetayo M, Petrovic D,
Naguib R (2004) Predicting clinical outcomes for newborns using
two artificial intelligence approaches. In: Engineering in medi-
cine and biology society, IEMBS’04. Proceedings of 26th annual
international conference of the IEEE, vol 2, pp 3202–3205
54. Azar AT, Nizar Banu PK, Hannah Inbarani H (2013) PSORR—
An unsupervised feature selection technique for fetal heart rate.
In: Proceedings of the 5th international conference on modelling,
Identification and control (ICMIC 2013), Aug 31–Sept 2 2013.
Cairo, Egypt, pp 60–65
55. Komorowski J, Pawlak Z, Polkowski L, Skowron A (1999)
Rough sets: a tutorial. In: Pal SK, Skowron A (eds) Rough fuzzy
hybridization: a new trend in decision making. Springer, Berlin,
pp 3–98
56. Kalyani P, Karnan M (2011) A new implementation of attribute
reduction using quick relative reduct algorithm. Int J Internet
Comput 1(1):99–102
57. Lin TY, Cercone N (1997) Rough sets and data mining: analysis
of imprecise data. Kluwer Academic Publishers, Dordrecht
58. Hu XT, Lin TY, Han J (2003) A new rough sets model based on
database systems. In: Rough sets, fuzzy sets, data mining, and
granular computing. Lecture notes in computer science, vol 2639,
pp 114–121. doi:10.1007/3-540-39205-X_15
59. Hannah Inbarani H, Nizar Banu PK (2012) Unsupervised hybrid
PSO—relative reduct approach for feature reduction. In: Pro-
ceedings of the international conference on pattern recognition,
informatics and medical engineering (PRIME), pp 103–108.
doi:10.1109/ICPRIME.2012.6208295
60. Velayutham C, Thangavel K (2011) Unsupervised feature
selection using rough sets. In: Proceedings of the international
conference-emerging trends in computing, pp 307–314
61. Velayutham C, Thangavel K (2011) Unsupervised quick reduct
algorithm using rough set theory. J Electron Sci Technol
9(3):193–201
62. Bache K, Lichman M (2013) UCI machine learning repository.
http://archive.ics.uci.edu/ml. University of California, School of
Information and Computer Science, Irvine, CA
63. Davis JC (2002) Statistics and data analysis in geology, 3rd edn.
Wiley, NewYork
64. Breiman L, Friedman J, Olshen R, Stone C (1984) Classification
and regression trees. Wadsworth, Belmont, CA
65. Bridle JS (1989) Probabilistic interpretation of feedforward
classification network outputs, with relationships to statistical
pattern recognition. In: Fougelman-Soulie F (ed) Neurocomput-
ing: algorithms, architectures and applications. Springer, Berlin,
pp 227–236
66. Specht DF (1990) Probabilistic neural networks. Neural Netw
3(1):109–118
67. Breiman L (2001) Random forests. Mach Learn 45(1):5–32
68. De Franca OF, Ferreira HM, Von Zuben FJ (2007) Applying
biclustering to perform collaborative filtering. In: Proceedings of
the seventh international
69. Xi XL, Beni G (1991) A validity measure for fuzzy clustering.
IEEE Trans Pattern Anal Mach Intell 13(8):841–847
70. Davies DL, Bouldin DW (1979) A cluster separation measure.
IEEE Trans Pattern Anal Mach Intell 1(2):224–227
Neural Comput & Applic
123