features of traditional farming systems in selected...
TRANSCRIPT

Economics Program Progress Report 61
Features of Traditional Farming Systems in Selected Villages of Madhya Pradesh
R.P. Singh, B.L. Jain, and V. Bhaskar Rao
4 ICRISAT
International Crops Research Institute
Jawaharlal Nehru Krishi for the Semi - Arid Tropics
Vishwa Vidvalava
ICRISAT Patancheru P.O. Krishinagar, Jabalpur Andhra Pradesh 502 324, India
Madhya Pradesh 482 004, India
January 1984

PROGRESS REPORTS are informal communications about ongoing research, or thoughts of ICRISAT staff members, which are designed to stimulate thinking and comments of professional colleagues within and outside the Institute. These reports are not to be considered as formal publications bearing the endorsement of the Institute. Progress reports were earlier referred to as Occasional Papers/Discussion Papers.

Abstract
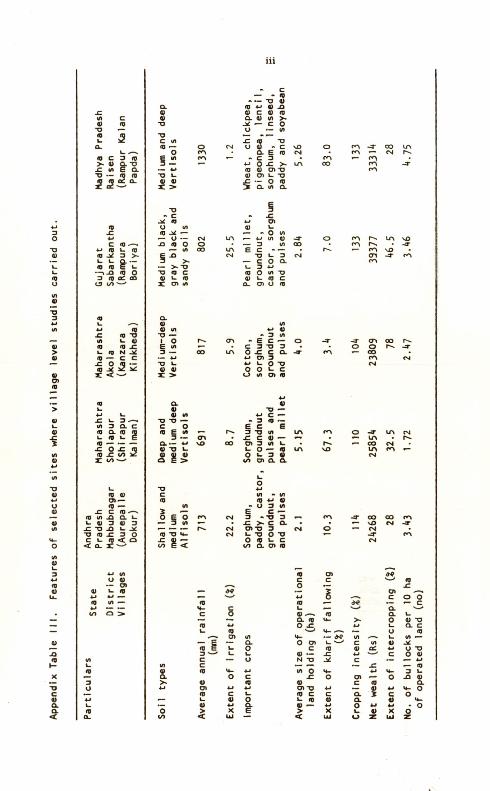
ICRISAT is conducting Village Level Studies (VLS) since 1975, with the objective to provide scientists with a better understanding of the traditional technologies and of the behavior of farm households in typical villages in the semi-arid tropics. In 1981-82 in collaboration with JNKVV VLS were extended into two villages selected to be representative of the high rainfall deep Vertisol area of Madhya Pradesh. In comparison to the villages included in VLS in the other regions, farmers in Rampur Kalan and Papda even though relatively well endowed with land and natural resources they have lowest literacy rates and are poorest in terms of percapita family income and farm income. The high proportion of land left fallow during the rainy season, common in both villages, offers opportunities to introduce technologies for rainy season cropping. Improving varieties and introduction of new crops (e.g. soybean) together with soil and water conservation and water harvesting for supplemental irrigation are some of the possibilities that need to be tested for technical and economic feasibility.

Features of Traditional Farming Systems in Selected Villages of Madhya Pradesh
R.P. Singh, B.L. Jain and V. Bhaskar Rao*
ICRISAT initiated its Village Level Studies (VLS) at six locations in May 1975 to gain better insight into the problems of agricultural development at a micro-level with a view to understanding existing farming systems. The broad objectives of these studies was to examine what farmers do and why and to identify constraints to increased crop production. In this way we feel we will be better able to define high payoff research and extension activities where adoption rates will also be high (Ryan 1974).
The areas where ICRISAT initiated its VLS were largely confined to sorghum, pigeonpea, cotton, paddy and castor growing regions. Information about pearl millet, groundnut and chickpea. important mandate crops of ICRISAT, was not adequately available in these areas. The second phase of the VLS, began in 1980-81 and focussed on the areas characterized by monsoon cropping on sandy soils, and kharif fallowing with postrainy season cropping on deep black soils with assured high rainfall. The latter high potential region was selected because of the emergence of an improved kharif cropping technology in the Farming Systems Research Program at ICRISAT.
The analysis based on secondary data helped identify an important chickpea growing and monsoon fallowing region in a high rainfall region covering Vidisha, Raisen and Sehore districts in Madhya Pradesh. Based on rainfall, cropping pattern, soil type and related information in different districts comprising this large tract, Raisen was selected (Table 1 and Map 1). Village Level Studies were initiated in May 1981 in collaboration with Jawaharlal Nehru Krishi Viswa Vidyalaya (JNKVV), Jabalpur.
Background of the Region
Madhya Pradesh is one of the biggest states ranking sixth in population and only fourteenth in population density in the Indian sub-continent. The state can broadly be divided into three resource development regions. Raisen, the district
*Economist, ICRISAT Economics Program, Patancheru, A.P. 502 324, Research Officer, M.P. VLS Project (Agricultural Scientist). JNKVV. Jabalpur, and Research Associate ICRISAT Economics Program, Patancheru. A.P. 502 324. India. The authors are thankful to M. von Oppen, T.S. Walker, and N.S. Jodha for their valuable comments and suggestions. They also thank R.R. Kashikar, Ramesh Shinde for their help in collecting the data.

Medium
black
Deep black and
shallow soil
Sehore
Medium and deep black
Average of 3 districts
Medium black
Features Districts
Vidisha Ralsen
Soil type
Table 1. Agroclimatic features of representing districts in the selected
regions of Madhya Pradesh (average of 1973- 75).
Annual rainfall (mm) 1253 1353 1572 1392 (1134) a (133o) (1245) (1236)
Monthly rainfall (mm)
May 0 0 0 0
June 53 66 73 64 July 415 384 508 436 August 505 673 571 583 September 82 144 129 118 October 0 0 0 0
November 26 23• 35 28 December 0 0 0 0
Area under main crops
and % to gross cropped area (actual area in '000 ha)
Groundnut 1.43 0.33 1.40 1.05 (0.3) b (0.1) (0.41 (0.3)
Pigeonpea 4.83 3.23 13.70 9.25 (1.0) (2.3) (3.9) (2.4)
Chickpea 102.60 71.60 42.70 72.30
(20.5) (18.1) (12.2) (16.11
Sorghum 44.10 13.00 55.40 37.50 (8.8) (3.3) (15.8) (9.31
Wheat 223.30 146.50 108.60 159-47 (44.6) (37.1) (31.0) C37.61
Rice 1.70 5.70 6.40 4.60 (0.4) (1.4) (1.8) (1.2)
Total kharif crops 116 86 155 199 TIT/OT) ha)
Total rabi crops 386 309 195 296
TWO ha)
% of kharif fallowing 77 78 56 71
Irrigated area as %
to net cropped area
0.9 2.6 5.2 2.9
Cropped area ('000 ha)
Net 491 391 340 407 Gross 501 395 35o 415
Source - Seasons and Crop Report.
aDenotes normal rainfall bDenotes % of gross cropped area.

431
SCALE
ime
B A Y 0 F 20
BENG A L
1 6 16
12
S i 7?1••1•101••A. nth BO
A. FIRST PHASE OF VLS (1975-76)
11.1 - Mahbubnagar, Andhra Prades' A.2 -Sholapur, Maharashtra A.3 -Akola, Maharashtra
B. SECOND PHASE OF VLS (1980-91i
8.1 -Sabarkantha, Gujarat B.2 -Raison, Madhya Pradesh
tive
INDIA
3
IN.so orl O..... .1
Figs Locations of ICRISAT village studies in India.

selected for study lies in the central plateau and hills where wheat is grown extensively (Government of India 1965). The overall composite index for agricultural development considering agricultural resources. adoption of new technology. agriculture and agricultural infrastructure. indicates that Raisen is one of the poorer districts (ranking 26th among 43 districts) of Madhya Pradesh.
Selection of Tehsil. Villages and Households
The first step in the selection of respondent households was the selection of a tehsil [11 in the district representing modal values of the region. Relevant information regarding cropping pattern. land holding. distribution. soil type. irrigation. bullock power. rainfall pattern. cropping system. implements. and other characteristics from 28 tehsils covering three adjoining districts representing broad agroclimatic zones was collected. Gairatganj tehsil was selected for the study where the average rainfall is about 1200 mms distributed mainly from July to September (Appendix Table 1).
Gairatganj tehsil is located at a distance of about 120 kms from Bhopal on the Bhopal-Sagar State highway. Its geographical area is 82.390 has of which about 36% is forest. Double cropping is not common as hardly 4% of the cultivated area is planted more than once a year. Kharif fallowing and postmonsoon cropping on residual soil moisture is the common practice. Irrigation facilities are not developed but some farmers have diesel and electric motor pumps for taking water from small rivers and canal. Based on 1981 data. the main crops of the tehsil are wheat (20.000 ha). chickpea (9.000 ha) lentil (6.800 ha), linseed (2.900 ha). soybean (2.430 ha) lathyrus (800 ha), mustard (125 ha) and vegetables (124 ha). Of the total 1,800 ha irrigated area in the tehsil, 44% is irrigated by wells and 56% is irrigated by rivers and canal. Most (or 91%) of the households are small and marginal farmers.
In the second step of site selection. two villages. Rampur Kalan and Papda. were chosen keeping in mind soil type, cropping pattern. and the modal values of a few other characteristics of the tehsil. The cooperation of the villagers was also taken into account. In the third stage a panel of 40 sample households from each village was selected randomly as in other continuing VLS villages (Binswanger and Jodha 1978).
The Villages
Rampur Kalan is located at about 14 km from Gairatganj. the
[1] Tehsil is a sub-division of a district for revenue administration.

5
tehail headquarters. During the rainy season. it is not approachable by bus. However. it is accessible by a forest approach road connected about 14 kms on the Gairatganj-Silwani metalled road. The direct road from Gairatganj to the village is under construction and in the near future it may be linked with the main Bhopal-Sagar state highway. The village is surrounded by forests from two sides but most of the cultivable land is flat with deep black soils.
Papda village is situated 12 km from Gairatganj on the Bhopal-Sagar state highway. An approach road from the village connects the highway at a distance of 3 km at Alampur village. The nearest railway station is Sager 78 km from the village. General information about Rampur Kalan and Papda is given in Appendix II, and a comparative picture with other VLS sites is presented in Appendix III.
Size of Farm Holdings
Table 2 presents size categories (dryland equivalent operated area) used to classify farm holdings in the selected villages on July. 1981. Households operating less than 0.20 ha of land were considered as landless labor. Households operating 0.20 to 2.50 ha of land in Rampur Kalan and 0.20 to 3.64 ha in Papda were classified as small farmers. Medium farmers were those who operated 2.51 to 5.00 has. of land, in Rampur Kalan and 3.65 to 6.10 ha of land in Papda. And the farmers who had operational holdings of 5.ha and above in Rampur Kalan and 6 ha and above in Papda were treated as large farmers (Table 2). But two farmers in Papda who had a very large holdings. one with 200 acres and the other with 125 acres were excluded in selection of households.
Selection of Sample Households
The proportion of selected sample households according to operated land holding class in selected villages on July, 1981 is presented in Table 3. The sample households cover 23% of total households in Rampur Kalan and 37% in Papda. The representation of different size categories of households is equal in their respective villages except for the labor class which has a little less (22%) representation in selection of Rampur Kalan and substantially less representation in Papda village.
Caste Structure
As evident from Tables 4 and 5 the caste structure in these selected villages is slightly different. -Harijan. Yaday. Dhobi, Gupta. Brahmin, Barber. Adivasi. Guzar and Lohar are common in both villages. Jain. Basod. Kachi. Silawat and Kumhar exist only in Rampur Kalan whereas Komi, Chadar, Mohmmadan. Tailor. Bhoj and Khagar are folmti only in Papda

6
Table 2. Size categories (dryland equivalent operated area) a used to classify far-A holdings In the selected villages, July 1981.
Farm size class (ha)
Rampura Kalan Papda
Labor Less than 0.20 ha Less than 0.20 ha
Small 0.40 - 2.50 0.20 - 3.64
Medium 2.51 - 5.00 3.65 - 6.10
Large 5.01 - 25 6.10 - 14.30
aOperational holding size adjusted for irrigated land.
Table 3. Proportion of selected sample households according landholding class in selected villages, July 1981.
to owned
Size group households
of Number of households Rampura Kalan Papda
Total Selected Total Selected
Labor 46 10 39 lo (27) (22) a (36) (26)
Small 42 lo 23 10 (24) (24) (21) (43)
Medium 42 10 23 10 (24) (24) (21) (43)
Large 42 10 23 10 (24) (24) (21) (43)
All 172 40 108 40 (100) (23) (100) (37)
aPercent of total selected households.

0 0 UN UN
01 el
0 re -7 re
-T
I IA
O
CI 01 -T 0 .
ON -I- S -7-
o 0 - I0 01
C. _C
0 n?
0. ✓ O 0
cs ✓ ✓
Kala
n
(Ma
dh
ya
Pra
desh
) v
ill
ag
e,
July
19
81.
aC
-0
4.1 IV 01 L
& ' O
0 0 • 4.4
►4. 4-•
O
O
le1
03
SD
8
0
O
ea
Less
tha
n 1%
.
0 F.
7
M Cr, —O a in CO 0.% .-- O -/e
▪ —
UN • In Cl re • 01 0 ^ -.3 el to
0 crN sCe r.... r∎ NA n.
re -I- ..- el el re —
0 0 CO to UN re 00 NO •-•
03 NO — — -T -1- — 0 1, 1, -7
re re 1,-..n n. n. n .... e... ea re. a NO -T 0 • • co -- ...- to in ell CO ..0 ..I3 en .-. CT 0:3 — -a- ...i. 0 -..7- -T el ea 04 ..- .— 01 .—
-3 0
▪
s N./1 rn -3- eV
co .4) re re ev re ea el so NO
▪
/0 el co 0 re en S UN re -1- •-•
ce 1 s S re re ea
• 03 -7 03
Us CO UN ^
•.0 ON 03 10 e•-• SD st3 -7 -.7 04 ea ea
c — —
— , .0 vl ... I- - ‘0 E 13 t/ 4../ 0 N. 40 1-
c7
.0 4., -0 0 -0 t > 4/ i I
C 0 a. .0 0 .._ 0 — —
2
g 7 I- f0 CO 1 13 g 0
co 03 03 4,{ 4.3 In -.I
Ah
lr/ Y
ad
av

8
as aD 43 N t.11 0,1 CA al C"... .1 01 •- LA 0 LIN CV en ON N
•
01 • .
O 1 s a M N S s <a a
LA " a) •- en to LA 07 1
O O
cr)
to
a
U
..c -0
5
a
CT
O
1.
a-
C
V
(1) CL.
U
4.1
>- Ja .er
O
0
0 C 0
7 .0
1- ✓
a
-0
• N L
Cs
O RP 4-1 O
e4' ✓
• a) I 4) 41
..c
O al
O
C 1 0 7 • 4.0 O to
• •-- rn 0 rn ,C) CD cV • as .0 en en <V CV1 Ni N Sn
O- O vs
Ws -0
0 0 _C
r"-- a en e■ UN -7 -.7
ts. o to en O N. O, .p s.0 to C4 cv 01 LA r's LA CV en -7 e.1 S N- CO -
en en -7 C.1 LA d V7 -7 .7 •- ON CO CV en en CV
• cca N O to Lea _a• en -7- ro, to
• 0 CA CO CO VJ 0N 01 en LA 05 Sr* CV -7 r".. 07 -1.
• en -7 01 ..7 -a- 4a 0 e,
43 en en - N
•
CV
en CA a) h.. N, en I", LA - •0 0.1
O 1,1 I- to
- LA rn s.0 •- CV CV en 1 CV en
oa en so h ca 0 en en co — .4)
reN re,
CO N.-7 rn ON .0 LA -7 -1- rn e 5 LA
La C
C M C m
M 1- 17 ,-- ,/, VI VI
E 1
- > 14 E E 21 23 43 I- - t. RI M V M .0 s•-■ ..C2 RI .0 4)
- , -0 10 -C 10 - e Ca t, ..c 0 _c
2 CU .0 3 z Aa IC a ›- L) z a
▪
a < 0 a
• eti
0 a. A,
O O
0 -0

9
village. The Lodhi caste is dominant in Rampur Kalan because of their large population (44% of the total population of ,the village). Jains are the second most (13%) important caste in Rampur Kalan. Basically they are traders but they also are progressive as well as prosperous farmers. Most of them have business in Gairatganj and other nearby towns. Caste dominance in Papda is not apparent as none of these castes have a majority. But there is group rivalry which is common in most of villages due to caste politics. After Lodhi. Harijan and Jain are the major castes in Rampur Kalan whereas in Papda. Harijan, Kurmil Gujar and Yadav are the major castes. The major three castes (Lodhi. Harijan and Jain) in Rampur Kalan jointly account for two-thirds of the total (67%) population of the village. In Papda. five major castes (Harijan. Kurmi. Gujar. Yadav and Chadar) account for two-third (68%) of the total households of the village.
Land Ownership
Land distribution is concentrated in a few castes. Tables 4 and 5 show that in Rampur Kalan about half (48%) of the land is occupied by Lodhis and a little less than one-fourth (22%) is held by Jains.
The castewise distribution indicates that as many as 9 out of 16 castes are landless in Rampur Kalan whereas only 1 caste (Lohar) is landless in Papda. In Rampur Kalan 67% Lohar are landless followed by Yadav (62%). Basod (50%). Dhobi (43%) and Brahmin (29%). In Papda most of the Mohammadans (86%) are landless followed by Khabas (75%). Dhobi (67%). Adivasi (50%) and Harijan (50%). etc.
Size of Family
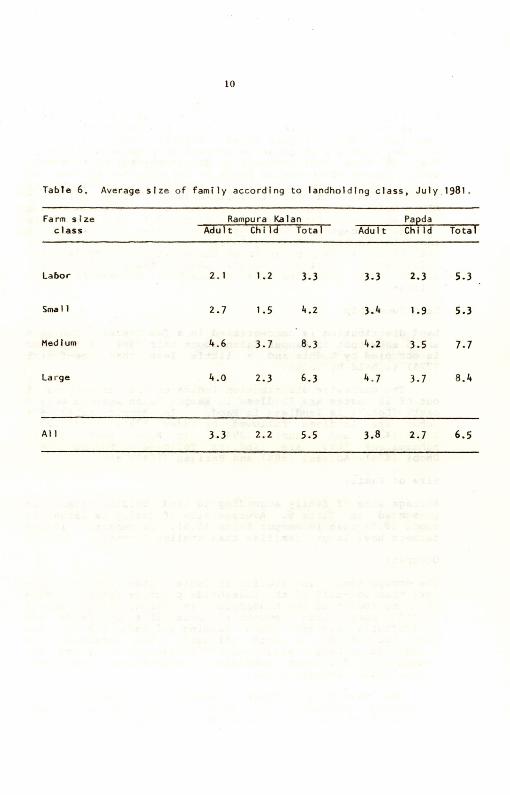
Average size of family according to land holding class is presented in Table 6. Average size of family is larger in Papda (6.5) than in Rampur Kalan (5.5). In general. larger farmers have larger families than smaller farmers.
Occupation
The occupational distribution in Table 7 shows that a little more than one-half of the households practice farming. More than one fourth of the households in Rampur Kalan and a little more than one-third households in Papda are agricultural laborers. Thus, farming and labor are the two main occupations in both villages. The remaining 13% households in Rampur Kalan and 11% households in Papda are engaged in different subsidiary occupations like trade. rural crafts. services. etc.
The lower part of Table 7 indicates the distribution of households according to number of sources of income. Nineteen % of the households in Rampur Kalan have one source
1 0
Table 6. Average size of family according to landholding class, July 1981.
Farm size Rampura Kalan Papda class Adult Child Total Adult Child Total
Labor 2.1 1.2 3.3 3.3 2.3 5.3
Small 2.7 1.5 4.2 3.4 1.9 5.3
Medium 4.6 3.7 8.3 4.2 3.5 7.7
Large 4.0 2.3 6.3 4.7 3.7 8.4
All 3.3 2.2 5.5 3.8 2.7 6.5

1 1
Table 7. Distribution of households by principal occupation in selected villages, July 1981.
Occupation No. of households
Rampura Kalan
% of total
Papda % of total
Farming 101 59 58 54
Agricultural labor 49 28 38 35
Trade 7 4 3 3
Rural crafts 5 3 3 3
Service 2 1 1 1
Others 8 5 5 4
Distribution of households accordtng to number of income sources (%)
One source 19 32 Two sources 51 49, Three sources 30 19

12
of income compared to 32% in Papda. About half of the households have two sources of income.
Owned Holdings
The distribution of land holdings into different size classes show that the average size of holding is smaller in Rampur Kalan (5.10 ha) than in Papda (6.79 ha). Holdings are unequally distributed in both villages. In Rampur Kalan, the proportion of smaller holdings up to 2 ha are more (35%) compared to Papda (18%). The Gini concentration ratio in the distribution of land is around 0.45 in these two villages.
Asset Structure
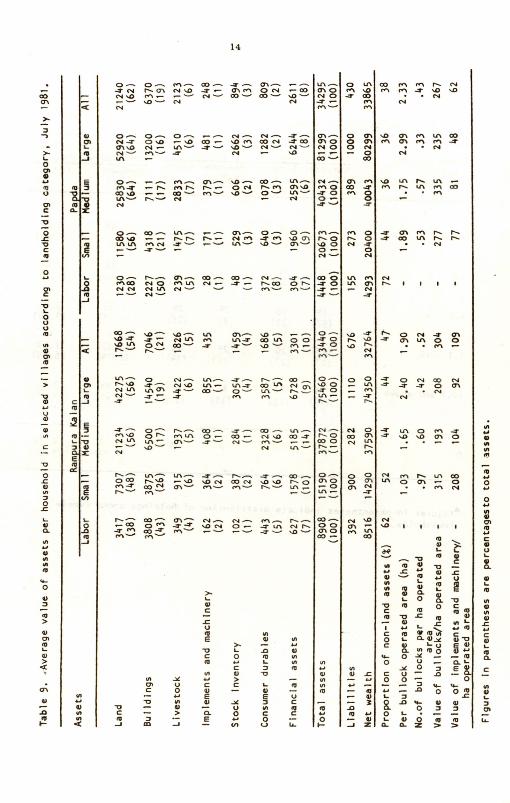
Table 9 shows that there is not much difference in the overall asset position of an average household in both the villages. But across farm-size classes, there is a significant difference. It is surprising that in Rampur Kalan labor households have double the assets than the labor households in Papda while other categories of households in Papda have higher assets than in Rampur Kalan. Land alone accounts for more than 50% to 60% of the total assets in Rampur Kalan and Papda villages, respectively. After land, buildings contribute about 21 and 19% value in total assets followed by financial assets, livestock, consumer durables, stock inventory, implements. and machinery in the two villages. It is an important point to observe that the implements and machinery which are mostly traditional and command only about 1% value in the total value of assets in both the villages. But on the other hand. some nonrespondent households have tractors. But tractor hiring is not a common practice though in this region tractor density is quite high. Bullock hiring is prevalent, but lack of draft power availability is a constraint to planting in the postrainy or rabi season.
The investment in "consumer durables is 5% and 2% in Rampur Kalan and Papda, respectively which suggests a higher standard of living in Rampur Kalan compared to Papda. In general. liabilities are substantially higher in Rampur Kalan particularly in labor and small farm households compared to Papda. The comparison of non-land assets given in Table 9 shows that proportion of non-land assets is higher (47%) in Rampur Kalan than in Papda (38%).
Livestock
Livestock is a supplementary enterprise to farming and provides additional income to the farmers. Table 10 depicts a comparative picture of the two villages in respect of average number and value of livestock across farm size classes as on July I. 1981. The number of bullocks per household in Rampur Kalan is relatively higher (1.93) than

13
Table 8. Distribution of owned holdings in selected villages, July 1981.
Size class of holdings
(ha)
% of holdings % Area Average size of owned
holding (ha) Rampura Kalan
Papda Rampura Kalan
Papda Rampura Kalan
Papda
Up to 1 9. 6 1 1 0.69 0.61
(0)- (7)a (0) (1) (0) (0.63)
1.1 - 2 26 12 8 2 1.64 1.47 (33) (20) (12) (6) (1.69) (1.59
2.1 - 5 34 49 24 28 3.53 3.82 (37) (33) (31) (25) (4.03) (3.90)
5.1 - 10 17 20 25 24 7.27 7.90 (17) (27) (24) (34) (6.79) (6.75)
10.1 and above 14 13 42 45 14.98 23.75 (13) (13) (33) (34) (11.62) (13.09)
All 100 100 100 100 5.10 6.79 (4.72) (5.20)
a Figures In parentheses indicate distribution of holdings among sample
households.
-J
-Average valu
e of assets
per
household in sele
cted villages accor ding to landholding category
, Ju
ly 1981,
- -10 V
E m
C4 en 0 co .--.. CO V)
U1 en N4 -7 •-•
c. T■ c.1
o co ^ co ^ N • co N 0, en UN N.- CO
c4 C4 e4 N•-•
CO rh 01,0
N
0^ O--- -7 en •13 al
471`-.
co .--.. •- CO-
S 0 N- u-%
47 "•-• so
▪
-•
CO CA a 0.4 •D CO -1' ,•••, ■-•
N U1
14
COQ -7 N Cn N .0 -7 m en 0 CO
U) c4 CO CO N v N
0 r..., 0^ O^ .- ---- N- N^ S^ NI -7 0 10 r-- st, CO ..- 13 en CON -7. CO 01 '0 N ••-• UN ■-• S— 4:1 ••-•' el ■-• C•4 ■-• e4 ''-' en ---• -7 N - •0 Let .-
0 •-•^ M .•-• -•-• •0 ••-• M 4.■ N CO .0 Cs, ■11 "•-•
N tV
se, ^ Le% O1^ •43 •-• - N UN en Ul S CO Ln O 44 co •-• S S"
uN.-- -3- CO -7 --- N.1 50 U1- 00 LIN N4
aN -7 CO aAv n--- aA -7 •-
to.-- -7 ..--- r.... .-- C4 CO N V:. •42 T■ CO s•-•
CO •-• 0
ON"... ---- ---. .--.. h. as OD •••• ‘14 e4 U1 NI N- 7
00 re% en M '-Si -7 10 ‘..°
• • NI
s0 01 e•N UN 00 M 01 ON en -7
• • NI
so Le% n U1 UN en CO
• • e.s
ON M cop 1".■
• • e4
N 1---1111
• 0 CV -7 CIN 01 Lel 0 0
• en
-7 0 N aD NA -T O al
• • N N
• LA 0 en •0 ON 0
01M h. uN In u% 0 ON
• • en NI
1
-.....
t ...... '17 V
C
CI V _
_. .4 L.... m U,_ . a 0. O -.
.
m 41 ge -C 01
I- in -C
...., 4.• 43 V 10 u; C Ci- 41 -Y V -0
'n 0 0 I e43 -NC .- .- U - ci. a- O 3 E V
- -0
- 0 - 3 .I._ 9-
-'3 0 0 0
4- 4/ 41 3 O 3 3 171
— .- o 71 e0 la- 2 7 7
0 LIN '0
-7 00 ON 0 N 0
• •-••
0% 0 cv
In
0 ON 0 01 Cs N •-• 0
CO
N - M 0 -7 0 0
0 00 O 0
ON en CO -T r•N 8
-7
en N. 0 0 NI -7
N
CO 0 -7 0 -7
LeN UN 01
N --T
-7 0 -7 0
U)
‘0
•43 0 -1' 0 UN a
CI 0
-- -7 e•-•
C..1 h 0 CO 0 h
0-. CT. 0 a 0 UI
N 0 CO ON C4 uN
1., M
0 O m M
CO 0 0
COO •-•
sO
M 111 CO
Net wealt
h
Tota
l assets
Liabilitie
s
(o
0 4.0
0
V O
C
rentheses a
• O
Proportio
n of non-land assets
(%
)
Consumer durables
Implements and machinery
Livestock
Fin
ancia
l assets
Stock In
ventory
operated area
Per
bullock
%CI •43 UN
N LeN N --7
-7 • •.0 c4
N
O
▪
00 M -7

CO r"... rel
• a
cr, 00 Ws
• 01
M 1-- 1,1 sO
• C.4
sO
CO 01 01 Ni
01 04 03
41 CO
0 01
Kt CO -.3. 04 04
CD
srs
r•1
C•4
r-- M U1 04 -1.
r4 u1 O1 04 04
She
co o cr, cr. r- O co
• ^ eel
To
tal va
lue
(Rs
)
15
Cn C .- sr* - Us .- 'V r-. 0 04 r- _ • va • (+3
O Q - .-
...0
.0 C C
O MY 04 en
CI, re, 0 04 1---
O , . 0... • re, 4.) 10 en 04
-1 0,
C
'CI L. co E , ,c, 04 --
O -0 - sb CO 04 CO
1./ 32 • Us • 04
U 10 0 01 04
C 0- X
C C 01 ^ 00 en us en eti ..- C.4 u‘ r• ■ - • LA • ,..-,
> -0 O 1... h. ■•••■ ,e) UN ..... 0 C-4 M rn 01
1.4 Xi O RI
- _I a) 0
c
-0 0.1 04 en CO vs Ln Lrt 0 en 0 s0 o- ON .- -I- -7 Vs ul CO e1 0 CO 04 • _1- • 04 - ,C) a, -
C
O c., _c C 0 Qt oN op co 0 al -a- ol 0 04
L.. L. • ON • us • N- • -.1. -.1.•
O C en -1- 04 Ni .- us en •-• -1.
O.
_C U 0 'la C 7 CO CD 00 us US CP Lel en r-..
O en 0.1 CO 1.-- Ni 0 N. Crs en
C - -0 • en • 04 • Les al
C 4- L.
• .- r-.. es)
CP -- 1.-- 04 .- 8 . . 0. ._ O 3
C co • • 04 • u1 01
•-• 3 ON
02C 3 .. , .-.
no > >. -0 3 L. 1.--- CD CO re. C --) I 0 I •-• LA in 0 W _a • en • ol
C
_o C 3
O
C
C .c
ce ce
_se
N 0 .10 4-1 E
C
3 ro C 0
-o C
oc
C1 N .0 E
111
Liv
es
toc
k
She
e bu
ffa
loes
0
,i1

16
in Papda (1.75). On an average. a pair of bullocks operates 4.66 has. in Papda compared to 3.80 has. In Rampur Kalan. no farmer owns a tractor while in Papda a farmers own tractors and the area operated by bullocks is less. Although the average number of bullocks per household is less in Papda the value is about one and half times more (Rs. 601) than in Rampur Kalan (Rs. 412), which indicates that the bullocks maintained by Papda farmers are of better quality. This may be because of the availability of more pasture land in Papda. The number of sheep and goats per household in Rampur Kalan is negligible (.03) compared to Papda (.43). This might be possibly because higher caste people do not prefer to maintain sheep and goats. In Rampur. Kalan Jain families are numerous who are more religious minded and prefer to maintain cows than sheep and goats.
Land Utilization Pattern
According to Table 11, average owned area per sampled household. is a little more (5.39 ha) in Papda than in Rampur Kalan (4.77 ha). Similarly. the operated area per household is also higher (5.41 ha) in Papda than in Rampur Kalan (5.12 ha). Leasing-in and leasing-out of land is practiced more in Rampur Kalan than in Papda. But compared to Sholapur and Akola villages the tenancy is less in these villages. Thus net area sown per household is comparatively more in Rampur Kalan (4.38 ha) than that in Papda (3.78 ha). Similarly. gross cropped area is also more (4.74 ha) in Rampur Kalan than in Papda (3.80 ha). It is also clear from the table that fallow grazing land is more in Papda (30% of operated area) than that in Rampur Kalan (14% of operated area) which may be one of the reasons for better quality of livestock in Papda. More fallow grazing land means that for all farm-size classes cropping intensity is higher in Papda.
Soil Type
Soil type in a locality determines to a great extent the crops to be planted. Generally. medium to deep black soil is found in both the selected villages. Table 12 shows that a little less than half of the land in Rampur Kalan (49%) and Papda (47%) is deep black soil. "Shallow black" soil is available only in 12% of the plots of Rampur Kalan near the foothills whereas it is not found in Papda. The total number of main plots. total area in ha and value of land per ha are also given in Table 12. Papda is costlier (Rs. 5.360/ha) than in Rampur Kalan (Rs. 4.984/ha).
Cropping Pattern
The sole crops planted in the villages are paddy, wheat. chickpea. linseed, lentil, pigeonpea etc. and the main mixed intercrops are wheat + chickpea; linseed + chickpea; wheat + linseed; lentil + linseed; wheat + chickpea + linseed;

Opera
ted a
rea
01 an .-...- rl - - O -1-
• • • • • ul O C.1 C.4 Le%
cr) E L. 1_
▪ 21 10 _...1
4) D.
17 a r-. 01..-.. -T.-. e4 E 1---. «1S eV 0 -
L. • • • • .
m ...1- O_ in U\ Q w _ ...—.
10
01 In 03 tn.—. IJI ..-.. c0
C Cn E — .13 04 --In LA 01 O 1.- L . • • . .
— 01 M c0 — a Le's cr, 1 J 4- -. ,...4 ....-.•
a) t.- E
7 7 . oo Ln en
E— 1! e..I
I rn 01
41 ID M -1- en
ce 4-
. Li, an E 1.-... 1....
g 'a; .-.. I •-• 0-
0 .c
U
C Cn
-0
0 _C
O
cr, C
0
0 U U
C O
C
cr)
a
0
U
U U
-o • —
o co .c crs
>- 0 ▪ z
o. • 41
ra
10
L -0
t.) w
■-• M 0
4) L try
Q. c a
E <
1.11 tn..-- 03 CA
• • 0 •--
▪ CO st3 CO 47)
• . •
N....-. 01 01 rl - C)
O• • . • •
r•-•
E O 10
• L E m
an 4.-
Pa
rt
icu
lars
Lease
d-o
ut
are
a
Le
ased-I
n a
rea
(ha
)
Ow
ned
are
a (
ha
)
17
co
en
1-11 CO
•
nA e4
CO en
-2-
...0
.0
r-.
C0 CO
en,
en U1
..-
..---- 0 .c
......
O N
N 41 L M
4) =
0 CO
• en
LA CO
0 en
rn
-.1- 1.--
..-
-Ir -.M.
co
0 0
-I-
..0. .o
.-
M .0 --
0
o
L N
0 L
C7
0 --
0 0
01 0
c)
CO 0
0 .-- .--
LA 0 0-
1.-- 0 .-
T N
N
C
CT C
a 0 L.
C.,
0 en
01
en
es)
-I- .--
00 .--
(,1
en •-
Cr, C N MI I.- CM
C 0 M L
M 0 73 ..- 41
4-, mi a) 4- 1._
4) 4- Q. 0 0
C 4- 0 0 - .4, -0 L C
2-2 0 L
0-
—
-0
10
. 4) 0 L lo
-0 v
0 4..•
VI a) a al 4-. C 41 U ,_ 4) O.
4) L. M
un 41 0 0
-C ... c 4) L. rt, o. c -
0 a) L.
C• —
La-10

U U
C
0
U
C C
-o
0
7
C
u-
-10 C
0
0
C cr,
33
0 U
W
-o
• 0
O. 01
O >-
O
•
)
3 1/
•
7 .0 al -
m
>
.0
h-
E
<
• N O E
• ,0 -I 4-
0
,3 a_ -
•
E0
0 .4- 0
- 0
2
E
C) 0 cr, E ■_
C m
o E I- 3 ul
3 • E • -0s- E I17 ‘11 X
CC
E - E
U
0 In
0
U'
C•4 CO
0 S0
CO 00 0
01 -7
C.' 01
CO t■I
-T en
CO In
Tota
l ar
ea
0 - a
C
0
• 0 C
0
0
O sO O'N --T
03 -a-
VI VI
-C
O
C 0 . _
0
0)
C
0
111
Shall
ow bla
ck
Medi
um bla
ck
W N.. C.4 cf1
--T sO •-••
18
M
1.11 (.1 LIN
-T V1 u -X 1 I
• V:1 -T -T 01
-.T '4 -
01 03 01 - ul 1..1 C.1 0
01 fn •- CO 0 01 -.T t./1 M N CV
00 01 CV - fol Ill .0
-0
•-• al 0 • 1IN My I
U
0)
tota
l plo
ts

19
sorghum + pigeonpea; pigeonpea + sesamum, among others. The proportion of area devoted to sole and mixed intercrops according to land holding class in the two selected villages is presented in Table 13. The table clearly shows that wheat is the main sole crop in both the villages. About half (51%) of the gross cropped area in Papda and a little over one-fourth (27%) in Rampur Kalan is devoted to this crop. Next to wheat. linseed is the sole crop commanding one-fourth (25%) of the gross cropped area in Papda and one-tenth (10%) of the gross cropped area in Rampur Kalan. Other sole crops are grown to a much lesser extent in both villages. In Papda hardly 10% of the area is intercropped compared to 60% in Rampur Kalan. The pattern of intercropping across farm size classes shows no discernible pattern except in Papda where the small and medium sized farmers appear to intercrop less than their larger counterparts.
Wheat and chickpea intercropped is a common cropping system in Rampur Kalan. Small farmers practice this cropping system more than the large farmers who proportionately plant linseed more often as an intercrop. As many as eight crop combinations are followed in Rampur Kalan whereas only two are practical in Papda. Kharif fallowing is a common feature as 76 to 90% of the cultivated area is left fallow in monsoon season in Rampur Kalan and Papda respectively. But recently Soybean crop has been introduced in these villages as a promising Kharif crop. The farmers take either chickpea or wheat after Soybean in postmonsoon season depending upon soil moisture and rainfall.
Location of Plots
Most of land of the sample households (91-96%) is located within the village boundary. Ninety one percent of the owned area in Rampur Kalan and Bl% of the owned area in Papda is cultivable and the remaining 9 and 19% is left fallow mostly for grazing the animals. Thus. it can be concluded that the owned area in the two villages is utilized fully and there is no scope of bringing more land under cultivation. But the practice of Kharif fallowing can be reduced to increase cultivated area per unit of time.
The location of plots also indirectly affects the choice of cropping and efficient management. Table 14 shows that about one-third of the plots in Rampur Kalan are located at an average distance of 2 kms and above while in Papda it is only 11%. A little less than half (45%) of the plots in Rampur Kalan and about two-thirds (67%) of the plots in Papda are situated at a distance of only one km from the village. The size of main plots are quite largecompared to existing Andhra and Maharashtra villages. Most of the land of large farmers is located closer to the village while land of small farms is farther away (more than 2 km).

Otercrops accordin
g to landho
ldings cla
ss
in se
lected
E -a
-0 L. C 0-
4) _C
0 -a m
▪ u -0 —
•-■ 1- 0 1, > 1/1
0 C1
C O 0
N --
c0
• c, 0
C o 0
,._ 0) m
— 0— L. — a_ >
E
co
4.) co E
L- 03 )0
Ul C3 40 e4 I cg en
eg ON en I (3 e4 I cg
n..... m^ I ON ,-- I I 04
O
0
0 V CI. 0. 4) - C C
Tu -Y - O- )- 4) "0 rt) U 0 J.) 4) In 0 - C C CY, 0 ,C _C - •- 4.) NLJ -I -.I 0- < CD
.-- Q L-
Io
•- E 1-
E o 0)
CL
E ro L- E m
'
•
••
0. 0
20
en - eg UN 01 eV I eg UN e4
-1r c.". -1r 01
-- ON 1 00 4r ,0 I I UN
to oN I IuN ,0
0
ro 0
N E cn
LIN tr, .-- O N <-4
en I I I III I
en en I ea
N NOD I en
,0 -- ON eN UN oN C4
h.rniiern-TII I en
C
m E m + 7 C
0 E - va M -0MCMMC 0 ..Ime 17 0 0 0 o X 0 • 0 4) 0) a 0 -1 0
• 0 o _1 a, 0 <L U .c N c tJ
U C a + + -C - -C U + U + T N +
4.1 + 13 +
▪
E 0. E - 7 C C 7 0
1)13 I-I 0 0 ). 0, 0 0 0, 4)
X 0 C 4) C I- 171 .0
.0 _C ,C 0 - 0 •. X 3 -1 3 J 3 tel 0- a In 0
LIN
CO
en Ln
O
O Ltl
O
O
col
r•-• ,0
O
N •
O M
UN N
S.0 • -3- en
en
Co
• CO
c.1 CO
csi •
O ,0
-7 UN
Co
O
• 0 N
- E
-0 C
C 1/3
F. 8 -8
Cn
12) I- X
E _sr
ro of 0
C, -0 c
0 - 0
C 0 -
CL -1 13
C
C M
I M 0 01
- 0 E 7 E
O 7 0 -- 00
0
7 0 •-• U 0 C
L
wo 4) a 4-, o c
-0 • 0
- X
• E
0)
▪
0 _C
0 0 M
gross cropped area
It) M 44 J., O 0 1- 1-
Intercro
+ o
the
r crops

VD
C
— C
-0 • ._
0
01 C
0
O IJ
113
.0
O
C 0
O. 0
c co Ie co
0
g —
g 0 _
> _ " u mu "
the v
illage
In the v
illa
ge
% cult
ivab
le area
2 an
d abo
ve
Loca
tio
n of plo
ts
21
0 A. AI 0 f- ON 0 Pe ON
Ca -I. 0 CO
O I 03
ON A. CO -Cr NCI LA IA 8 nI 8 c 8 --
c/N 0 M A. 0 IA UN
e•N N ni O. ON 0 CO f-
0
20 § 2.2
t. as+ 0 LA Al -.1. 0 s-. CA 8 0
cL N N ni en 0 ON 0 cm < .-
0
8
aRe
fer
s to owne
d ho
ldin
gs
s- Is. 0 0 CO Al
M 04 Al 0 8 — 0
c0 LA 0 n1 0 8
-7' 0 8 0
AI LA 1
-8
— O CO°1 "s■ 8
22 to rn E L. L.
10 C
2EE
"— E -0 L.
24!
IA
DA eV
I LA
C ort cr. - C
N IS I-
0
rt; VI U— .0
0 de I-

22
Conclusions
Rampur Kalan and Papda, selected for village studies in Madhya Pradesh are markedly different from the villages studied by ICRISAT in Maharashtra, Andhra Pradesh and Gujarat (See Appendix III). They also differ from one another especially in caste structure, cropping pattern, land utilization pattern, asset structure, and occupational profile. Both villages rely heavily on dryland agriculture; Rampur Kalan is toally rainfed whereas about 2.4% of the total operated area in Papda is irrigated. In Papda some area can be irrigated by a small river using diesel pumpsets. While in Rampur Kalan this facility does not exist but one or two wells provide limited irrigation. Papda is electrified, Rampur Kalan is not. there is as much as 90% kharif fallowing in Papda compared to 76% in Rampur Kalan. In Rampur Kalan some of the fields in low lying areas are double cropped. In Papda where most of the land is flat and double cropping is uncommon.
We conclude by highlighting the major problems of the two villages in particular and the region in general. Finding solutions to these problems can be the areas of possible mutual interest for ICRISAT and JNKVV to plan and conduct research in collaboration.
1. Kharif fallowing is a common practice and it is important to identify the factors responsible for this practice. Introduction of kharif cropping could dramatically increase production. In this respect collaborative research from farming systems researchers and plant breeders may be useful in generating suitable technologies to more efficient use of land.
2. With the introduction of soybeans as a crop well suited to the monsoon season the cropping patterns are already changing. There is a possibility to make further improvements in the new cropping system.
3. Wheat largely planted either as a sole crop or as intercrop with chickpea. Research on watershed cropping systems is required incorporating wheat and chickpeas.
4. Shallow to deep black soils are found in this region of importance. Research on soil and moisture conservation is needed particularly, to determine the technical and economic feasibility of water harvesting and supplemental irrigation from small tanks to establish the wheat crop in the postrainy season following the soybean crop in the rainy season.

23
5. Livestock is potentially an important source of income to the farming community of this region. There is a scope for studying possibilities to improve fodder crops and livestock based farming systems.
6. Locally available resources such as grazing land and other mostly common property resources could be improved and require study to understand employment and income-generating opportunities.
7. Heavy incidence of pests particularly (pod borer) and frost attack in chickpea and pigeonpea crops require attention of pulse breeders and entomologists.
8. Local wheat is grown mostly under rainfed condition and gives lower yields. It is also susceptible to rust. This requires attention of plant breeders and pathologists who need to develop rust resistant high yielding wheat varieties adapted to rainfed conditions.
9. High rainfall during kharif season makes it difficult for farmers to plan any crop because of stickiness of soil and heavy infestation of weeds, specially "Kane". However, the recent trend of increasing soybean shows that farmers are willing to do kharif cropping. This development is not solved.

Appendix Table 1. Distribution of rainfall In Gairatgunj Tehsil (Madhya Pradesh) during 1962 to 1981.
January- Aprli- July- October- Total rainfall March June September December (mm)
Years
1962 52.8 16.3 1165.6 32.6 1267.3
1963 - 12.2 1052.1 11.0 1075.3
1964 22.2 156.0 1165.3 - 1343.5
1965 - 49.0 873.7 36.0 958.7
1966
1967 20.8 155.8 999.1 125.2 1300.9
1968 4.0 70.0 841.1 915.10
1969 29.32 1573.81 26.06 1629.19
1970 - 157.0 1269.9 - 1426.9
1971 316.4 1045.8 179.6 1541.8
1972 65.6 1078.0 39.2 1182.8
1973 15.8 43.5 1712.5 33.6 1805.4
1974 113.0 899.0 63.0 1075.0
1975 65.0 110.0 1064.8 7.0 1246.8
1 976 - 87.5 876.5 8.1 972.1
1977 4.4 415.0 1326.2 39.3 1784.9
1978 63.5 138.5 552.8 56.2 811.0
1979 72.0 58.0 234.6 98.8 463.4
1 980. - 233.0 696.0 24.0 953.0
1981 22.0 85.6 620.40 45.0 727.0
Average 34.25 121.67 1002.39 51.53 1181.27
Coefficient of 76.0 86.0 . 35.0 90.0 30.0 variation (%)

Appendix II. General information of the selected villages of Madhya Pradesh, July, 1981.
S.No. Particulars Villages
Rampura Kalan Papda
1.
2.
3.
4.
5.
6.
Total no. of households
Total population
Percentage of Literacy
No. of landless labor/households
No. of land owners completely leased out or shared out
No. of operational holdings
172
1069
23.39
43
22
106
108
611
19.64
37
11
60
7. Area operated In hactares 558.50 424.65
8. Average size of land holdings in ha. 5.27 7.08
9. % of irrigated area to toral operated area 0 2.38
10. Distance from nearest town/Marketing centre
14 KM 9 KM
11. Distance from tehsil headquarters 14 KM 9 KM
12. Distance from nearest pukka road/ bus stand
14 KM 3.2 KM
13. Distance from nearest sub-post office 0 0
14. Road connection (All weather, fair weather, no road)
Fair weather Fair weather
15. Frequency of bus service (per day) 1 0
16. Educational facilities Middle school Upper primary
17. Hospital facilities Sub. P.H.C. ML
18. Drinking Water facilities (No. of wails)
5 4
19. Electrification No Yes
20. Weekly market Gairatganj Gairatganj
21. No. of Shops 8 3
22. No. of tea shops 0 3
23. No. of co-operative societies 1 0
24. No. of electric pumpsets 0 1 (10 HP)
25. No. of oil engines 0 1 ( 5 HP)

iia
S.No. Particulars Rampura Kalan Papda
26. No. of grinding mills 0
27. No. of tractors 0 2 (35 HP)
28. No. of thresher 0
29. No. of winnowers 0
30. Type of soil Medium to deep- black
Deep black
31. Average rainfall (mm) 1430 1430 (approx.)
32. Depth of water table 40' 35'
33. Crops grown In the village wheat, green wheat chickpea, gram, black sorght.m, green
gram, chickpea gram, Pigeonpea
maize, paddy, paddy sorghum
34. Seed use In the village Mostly local Mostly local
varieties varieties
35. Use of fertilizers and pesticides Negligible Negligible
Ln • C 7 m TO) Q. -0 .0
0 CL
- r0 M • CC 0-
0 V/
.0 1- 7 O 7 CI C CO 0. m m L. MI ,- E
-C 0 Z .0 N ,c
0) 0) 01 - -
..0 C--- al .0 0.
0.1 7 0)7 .0
'- y
-0 CO .0 0 C L m < < a Tom"
C
(13 4-1 MCMM
-0
a -
CL 0) 0 T C 0
- - C 0 m- 0 a,)
.0 MI -0 0 0) - C • 0 0 0'1
0 E .
rn en
0. E m - c 7
N4 In
r*-/ .--
7- ✓
.6-, 0 -C >-. CCI 0) 0, -0
Ln CO
-0 1- a) 0) S >
0) cn ,-- nn g -- Om
d 0 a..
-0 S - c - -C
Y M U 0
+-• 01 0) C.- - - 04)
_0 CO 0 NI 0
U . ./., 0 /1) -.1. co
0 en rn
- 0
S .° T
00 LA NI
E C - - -0 ,- 7
- C 0 O. NI
N. -
- T 07 -0 03 C
i_ 7 ..... 0:1 0 0 13
4) 4- m a) 4- m c S 01 0 0_ 01 L./ 01
CL a) 0 0 0
-0 - 4, 0)
- 7 0 1 0 4.-- .- cr. E .
- E C - C 7 -0 7
c) -3- -3- 0
- co Lr4 0 -C C o_
.1, a, 7 -3- cn -
"V I- 0 0)
..-. L. 0 -0 0 0 ,- C
Z 7. 4-4 . 04 4)
..... 0. v
0) -0 -
0) 0 4-, C - -0 -0 - C 0
7 44 E C E
M E 4i 7 - Cr,
N. 7 LI 0 .= C 4) -
UN --,
1..1 0
40 co 474 7 0 1.- C-. •-• 0) -0 L. 4) 0) 4)
I- 0 - 44) 0 0- 7 V
u-4 va
0 E> ,./1 CI, CL 0.
L. O
-0 ..., C 0 - 0 m 01 ..... 0)
. - u 7 .
30 E 0 - E - C -
M NI 3 Tv 7 - 7 . - .0 >- C 0. - -
N. c) cn 17 7 r-)
ro -0 4- 04 L. MI 0 "0
5, E i I.l, O. 0 10
N-1
irrig
ation
($)
Importan
t crops
i
Ne
t wealt
h
Exten
t o
f
111
Par
ticulars
Cropping intensity (%
)
C
•
C O
8 •_
a. m o .c
0
-
L C CO
N -0 Y
O 0 4- .0 o
rn 1:1 C
)- a) 4) ▪ - 11 X
-.I- 00 LN .- CLI N-crN f+1 -I- c•-■
N. Ln L.0 N. - -I- c•I LO • 01 -1- c•-, M
mco r-. 0 N. -3- CO rn N NI
.- -4. 11 \ (,.1
In N- 00 Ni u., en .-
03 03 01 • 13 N -I'
▪ -C
0 0 C
4) 'V o C
N -N O1 -14
C 0 4)
-
7 1- -0 4)
4- 0 0
44- • 0
0