feb. 2, 2005 1 the atmosphere and atmospheric ozone dr. paul a. newman nasa’s goddard space...
TRANSCRIPT

1
Feb. 2, 2005
The Atmosphere and Atmospheric OzoneThe Atmosphere and Atmospheric Ozone
Dr. Paul A. Newman
http://code916.gsfc.nasa.gov/People/Newman/
NASA’s Goddard Space Flight Center
2005 NASA Earth System Science Teacher Workshop
NASA GSFC
April 22, 2005
Dr. Paul A. Newman
http://code916.gsfc.nasa.gov/People/Newman/
NASA’s Goddard Space Flight Center
2005 NASA Earth System Science Teacher Workshop
NASA GSFC
April 22, 2005

2
Feb. 2, 2005
What are the main issues in atmospheric physics?
What are the main issues in atmospheric physics?
• Ozone depletion
• Atmospheric pollution
• Climate change
All 3 issues are related to changing atmospheric composition
• Ozone depletion
• Atmospheric pollution
• Climate change
All 3 issues are related to changing atmospheric composition

3
Feb. 2, 2005
OutlineOutline
• Atmospheric Basics & Solar Radiation
• Ozone: basics and photochemistry
• Ozone loss in the atmosphere• Summary• Educational activities
• Atmospheric Basics & Solar Radiation
• Ozone: basics and photochemistry
• Ozone loss in the atmosphere• Summary• Educational activities
4
Feb. 2, 2005
Atmospheric Basics
Atmospheric Basics

5
Feb. 2, 2005
180 200 220 240 260 280 300Temperature (K)
0
20
40
60
80
100
Alti
tude
(km
)
Troposphere
Stratosphere
Mesosphere
Thermosphere
Atmospheric StructureAtmospheric StructureA
ltitude (miles)
10
0
20
30
40
50
60
81oF45oF9oF-27oF-63oF-99oF-135oF

6
Feb. 2, 2005
0
20
40
60
80
100
Alti
tude
(km
)
Troposphere
Stratosphere
Mesosphere
Thermosphere
Atmospheric StructureAtmospheric StructureA
ltitude (miles)
10
0
20
30
40
50
60
Airliners fly at 30,000-40,000 feet

7
Feb. 2, 2005
0
20
40
60
80
100
Alti
tude
(km
)
Troposphere
Stratosphere
Mesosphere
Thermosphere
Atmospheric StructureAtmospheric StructureA
ltitude (miles)
10
0
20
30
40
50
60
ER-2 flies at 70,000 feet

8
Feb. 2, 2005
0
20
40
60
80
100
Alti
tude
(km
)
Troposphere
Stratosphere
Mesosphere
Thermosphere
Atmospheric StructureAtmospheric StructureA
ltitude (miles)
10
0
20
30
40
50
60
Oxygen (21%) Nitrogen (78%)

9
Feb. 2, 2005
Atmospheric CompositionAtmospheric Composition
• Nitrogen 0.781• Oxygen 0.209• Argon 0.009• Water 0.014 (tropics) 0.002 (poles) 0.000004 (stratosphere)• CO2 0.000360 • O3 0.0000100 (stratosphere) 0.0000001 (troposphere)
• Nitrogen 0.781• Oxygen 0.209• Argon 0.009• Water 0.014 (tropics) 0.002 (poles) 0.000004 (stratosphere)• CO2 0.000360 • O3 0.0000100 (stratosphere) 0.0000001 (troposphere)

10
Feb. 2, 2005
Solar Radiation: The photochemistry
driver
Solar Radiation: The photochemistry
driver

11
Feb. 2, 2005
The Electromagnetic SpectrumThe Electromagnetic Spectrum
10-1210-12 10-1010-10 10-810-8 10-610-6 10-410-4 10-210-2 11
-ray-ray X-rayX-ray UltraVioletUltraViolet VisVis InfraRedInfraRed RadioRadioMicrowaveMicrowave
Scale (meters)Scale (meters)
BaseballBaseballFleaFleaCellCellE. ColiE. ColiVirusVirusProteinProteinH2OH2O
Higher EnergyHigher Energy Lower EnergyLower Energy
1 nm = 1x10⁻⁹ m =1 billionth of a meter1 nm = 1x10⁻⁹ m =1 billionth of a meter

12
Feb. 2, 2005
Solar Energy Outside Earth’s Atmosphere(from space)
1 m = 1x10⁻⁶ m =1 millionth of a meter
Solar Energy at Earth’s Surface
UV IR

13
Feb. 2, 2005
Absorption of UV by ozoneAbsorption of UV by ozone
14
Feb. 2, 2005
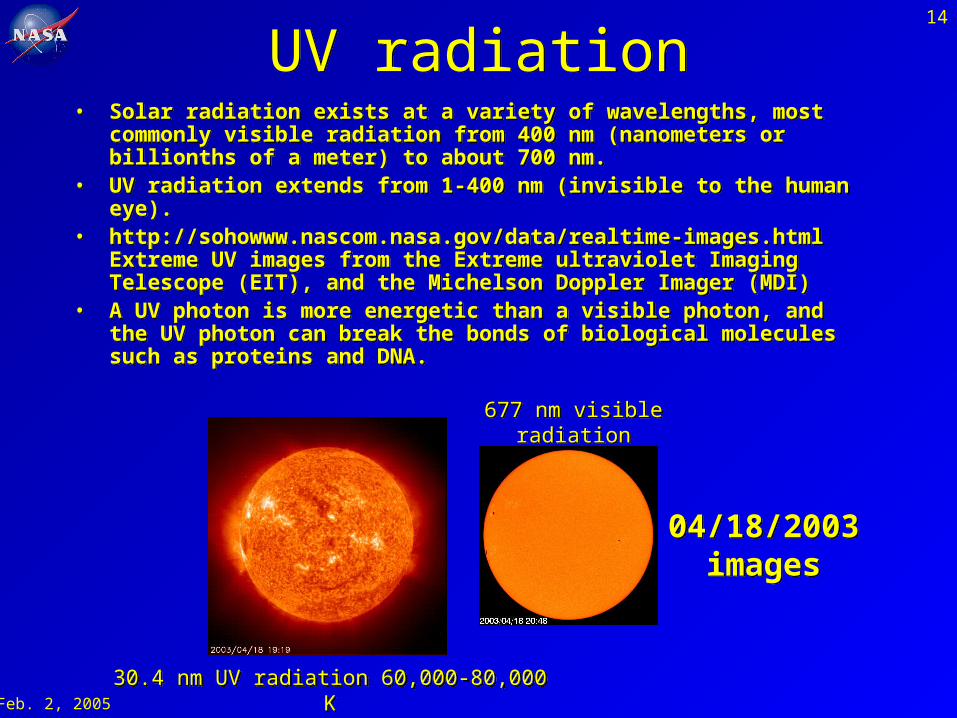
UV radiationUV radiation• Solar radiation exists at a variety of wavelengths, most commonly visible
radiation from 400 nm (nanometers or billionths of a meter) to about 700 nm.
• UV radiation extends from 1-400 nm (invisible to the human eye).• http://sohowww.nascom.nasa.gov/data/realtime-images.html Extreme UV
images from the Extreme ultraviolet Imaging Telescope (EIT), and the Michelson Doppler Imager (MDI)
• A UV photon is more energetic than a visible photon, and the UV photon can break the bonds of biological molecules such as proteins and DNA.
• Solar radiation exists at a variety of wavelengths, most commonly visible radiation from 400 nm (nanometers or billionths of a meter) to about 700 nm.
• UV radiation extends from 1-400 nm (invisible to the human eye).• http://sohowww.nascom.nasa.gov/data/realtime-images.html Extreme UV
images from the Extreme ultraviolet Imaging Telescope (EIT), and the Michelson Doppler Imager (MDI)
• A UV photon is more energetic than a visible photon, and the UV photon can break the bonds of biological molecules such as proteins and DNA.
30.4 nm UV radiation 60,000-80,000 K30.4 nm UV radiation 60,000-80,000 K
04/18/2003images
04/18/2003images
677 nm visible radiation
677 nm visible radiation
15
Feb. 2, 2005
What is ozone?What is ozone?

16
Feb. 2, 2005
0
20
40
60
80
100
Alti
tude
(km
)
Troposphere
Stratosphere
Mesosphere
Thermosphere
Atmospheric StructureAtmospheric StructureA
ltitude (miles)
10
0
20
30
40
50
60
Oxygen Ozone
17
Feb. 2, 2005
QuickTime™ and aTIFF (Uncompressed) decompressor
are needed to see this picture.
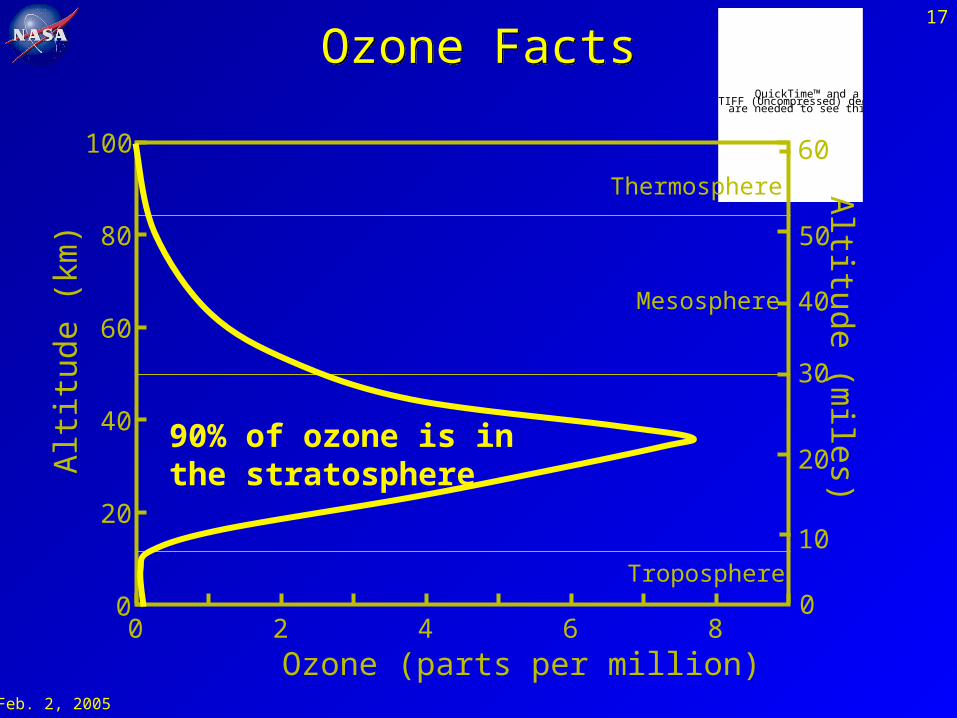
Ozone (parts per million)
0
20
40
60
80
100
Alti
tude
(km
)
Troposphere
Mesosphere
Thermosphere
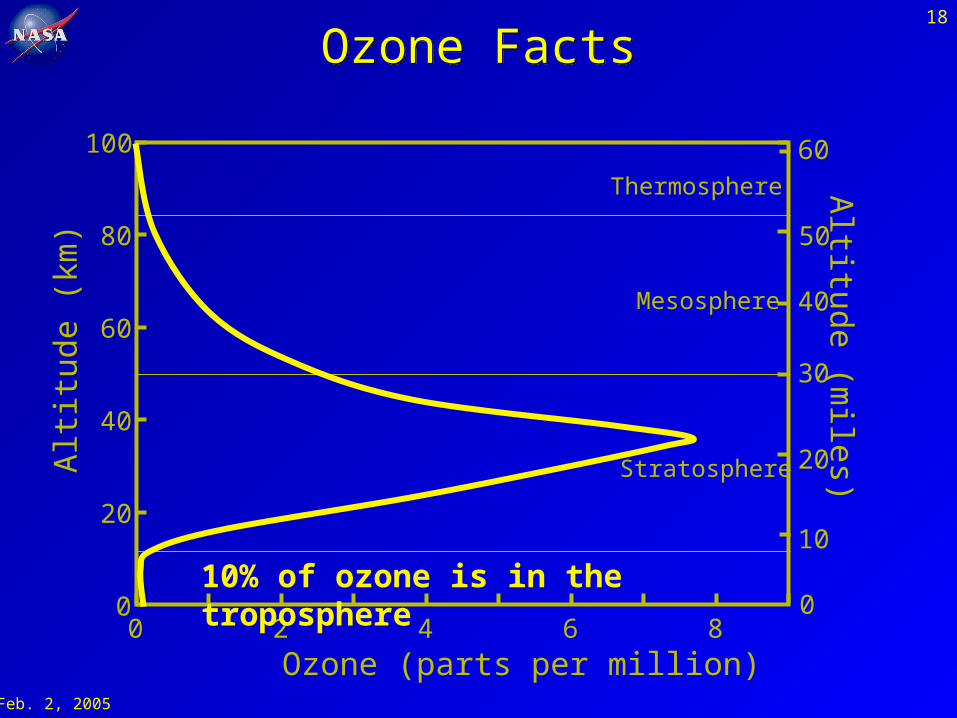
Ozone FactsOzone FactsA
ltitude (miles)
10
0
20
30
40
50
60
90% of ozone is in the stratosphere
0 2 4 6 8
18
Feb. 2, 2005
Ozone (parts per million)
0
20
40
60
80
100
Alti
tude
(km
)
Stratosphere
Mesosphere
Thermosphere
Ozone FactsOzone FactsA
ltitude (miles)
10
0
20
30
40
50
60
0 2 4 6 8
10% of ozone is in the troposphere

19
Feb. 2, 2005
What does ozone do?Absorbs UV radiationWhat does ozone do?Absorbs UV radiation

20
Feb. 2, 2005
Ozone (part per million)
0
20
40
60
80
100
Alti
tude
(km
)
Stratosphere
Ozone FactsOzone FactsA
ltitude (miles)
10
0
20
30
40
50
60
0 2 4 6 8
UVc - 100% AbsorptionUVb - 90% Absorption
UVa - 50% Absorption & Scattering
Ozone is the Earth’s natural sunscreen

21
Feb. 2, 2005
0
20
40
60
80
100
Alti
tude
(km
)
Troposphere
Stratosphere
Mesosphere
Thermosphere
Ozone FactsOzone Facts
Altitude (m
iles)
10
0
20
30
40
50
60
Ozone is a pollutant, lung and esophagus
irritant

22
Feb. 2, 2005
UV Health FactsUV Health Facts
• UV pluses: produces vitamin D in the skin - necessary to maintain levels of calcium and phosphorus (10-15 minutes twice a week)
• UV minuses:– Eye damage: cataracts, photokerititus
(snowblinding), ocular cancers – Skin cancers: basal, squamous,
melanoma– photoaging– Damage to various land speciesDamage
to aquatic species– Increased pollution levels in urban
environments
QuickTime™ and aTIFF (Uncompressed) decompressor
are needed to see this picture.
QuickTime™ and aTIFF (Uncompressed) decompressor
are needed to see this picture.
Cataract
Melanoma
Mexico City

25
Feb. 2, 2005
Ozone Photochemistry
Ozone Photochemistry

26
Feb. 2, 2005
Ozone Absorption of UVOzone Absorption of UV
UV radiation (200-300 nm) converted to heatNet: O3 + h O3
At 30 km, this reaction takes 0.1 seconds
1. O3 is split by UV radiation
1. O3 is split by UV radiation
2. An O2 reacts withAn O atom to reform O3
2. An O2 reacts withAn O atom to reform O3

27
Feb. 2, 2005
Ozone ProductionOzone Production
UV < 240 nm
O2 + h 2 O
O + O2 + M O3 + M
Ozone is created by oxygen molecules and energetic UV radiation
Net: O2 + h 2 O3

28
Feb. 2, 2005
Catalytic Ozone LossCatalytic Ozone Loss
Principal ingredients for ozone loss:UV radiation and a free radical
X = OH, NO, Cl, Br
1. O3 + h O2 + O2. O3 + X O2 + XO3. XO + O O2 + X
Net: 2 O3 3 O2
1.
2.
3.

29
Feb. 2, 2005
Photochemical balance
30
Feb. 2, 2005
Source gases for ozone lossSource gases for ozone loss

32
Feb. 2, 2005
16%
32%
23%
12%
7%5%
1%4%
0
3400
3000
2000
1000
(CH3CCl3)
(e.g., HCFC-22 = CHClF2)
(CCl2FCClF2)
Naturalsources
Other gasesMethyl chloroform
HCFCs
CFC-113
Carbon tetrachloride (CCl4)
CFC-11 (CCl3F)
CFC-12 (CCl2F2)
Methyl chloride (CH3Cl)
0
20
15
10
5
15%
27-42%
5-20%20%
14%
4%
Methyl bromide (CH3Br)
Halon-1211 (CBrCIF2)
Halon-1301 (CBrF3)
Other halons
Very-short lived gases (e.g., bromoform = CHBr3)
Source Gases
• Cl is much more abundant than Br• Br is about 50 times more effective at O3 destruction
From Ozone FAQ - see http://www.unep.org/ozone/faq.shtml

33
Feb. 2, 2005
Atmospheric Chlorine Trends from NOAA/CMDL -HATS Group
Atmospheric Chlorine Trends from NOAA/CMDL -HATS Group
Figure from Trends of the Commonly Used Halons Below Published by Butler et al. [1998]
CFC-12
50 years
102 years
5 years
42 years
85 years
Steady growth of CFCs up to 1992

34
Feb. 2, 2005
Photochemical balance

36
Feb. 2, 2005
What’s happened to polar ozone?
What’s happened to polar ozone?

37
Feb. 2, 2005
Antarctic MeasurementsAntarctic Measurements
Aurora over Halley Bay Station, Antarctica, 75.6ºS 26.5ºE Brunt Ice Shelf, Coats Land
105 days of continuous darkness, twice per year re-supply Population: 65 in summer, 15 in winter
Aurora over Halley Bay Station, Antarctica, 75.6ºS 26.5ºE Brunt Ice Shelf, Coats Land
105 days of continuous darkness, twice per year re-supply Population: 65 in summer, 15 in winter

38
Feb. 2, 2005
Digression: Dobson UnitsDigression: Dobson Units
3 mm = 300 Dobson Units3 mm = 300 Dobson Units
• Total Ozone is a measure of the total column amount above us. Measured in Dobson Units
• If we bring all of the ozone above us down to the Earth’s surface
• The thickness would be about 3 millimeters (~0.1 inches) = 300 Dobson Units (approximately the global average)
• 100 Dobson Units = 1 millimeter in thickness
The Dobson Unit is a convenient unit of measurement for total column ozone
The Dobson Unit is a convenient unit of measurement for total column ozone
2¢2¢10¢10¢
39
Feb. 2, 2005
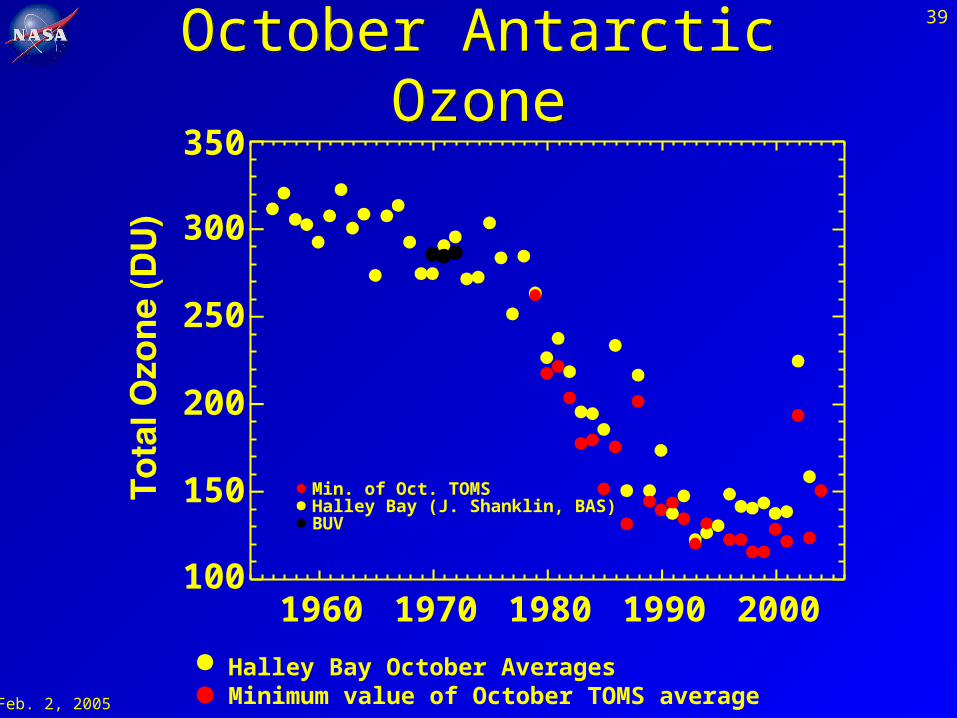
October Antarctic OzoneOctober Antarctic Ozone
Halley Bay October Averages Minimum value of October TOMS average
1960 1970 1980 1990 2000100
150
200
250
300
350
Min. of Oct. TOMSHalley Bay (J. Shanklin, BAS)BUV

40
Feb. 2, 2005
TOMS - August 31, 2003
Orange/Yellow indicates higher ozone levels.
Blue colors indicate low ozone values
Dark color over pole shows the extent of polar night, no
ozone observations
Antarctic ozone hole is defined as the
region covered by low ozone values

41
Feb. 2, 2005
The 2003 MovieThe 2003 Movie
Greg Shirah, NASA/GSFC SVS
QuickTime™ and aYUV420 codec decompressorare needed to see this picture.
42
Feb. 2, 2005
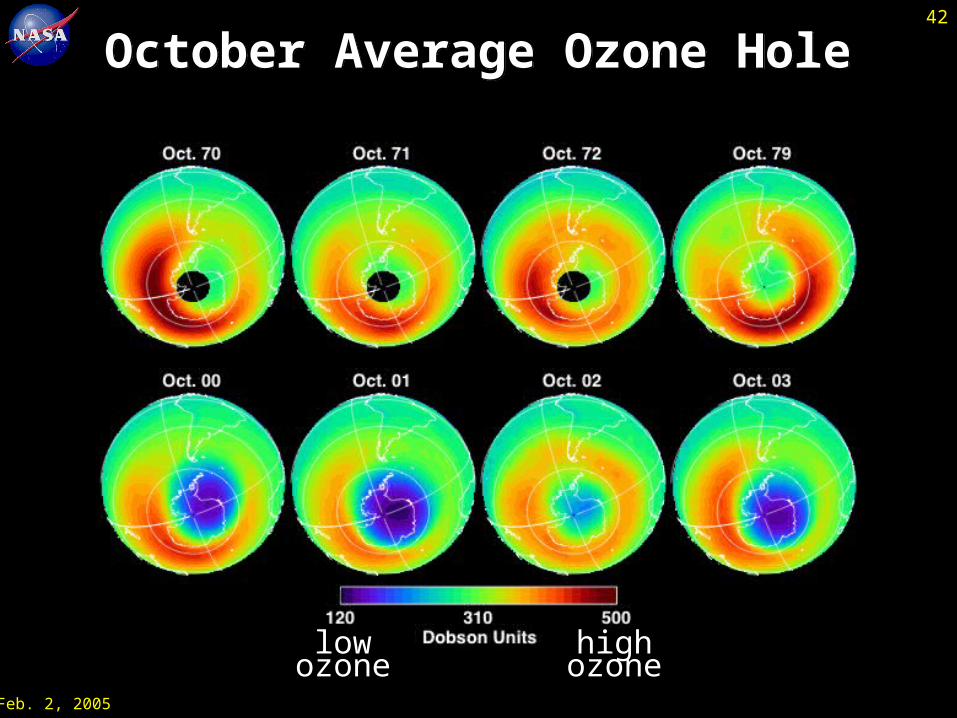
October Average Ozone HoleOctober Average Ozone Hole
lowozone
highozone
43
Feb. 2, 2005
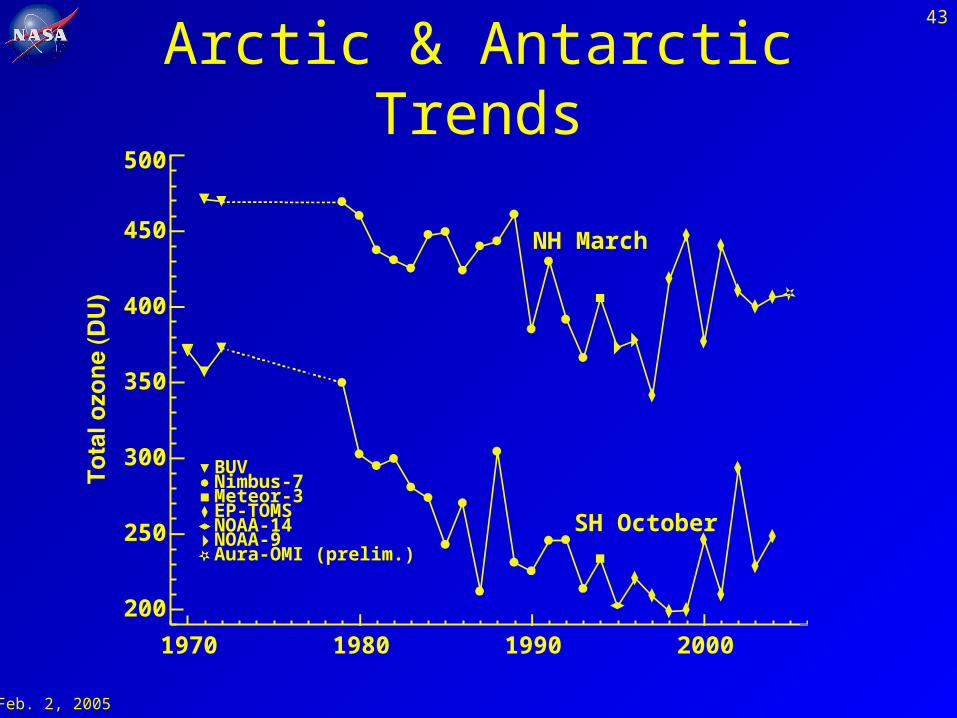
Arctic & Antarctic Trends
1970 1980 1990 2000
200
250
300
350
400
450
500
BUVNimbus-7Meteor-3EP-TOMSNOAA-14NOAA-9Aura-OMI (prelim.)
SH October
NH March

44
Feb. 2, 2005
Polar Stratospheric CloudsPolar Stratospheric Clouds
Central, Sweden January 14, 2003 - P. Newman
HCl and ClONO2 react on the surface of cloud particles, releasing Cl2. As the sun rises in the spring, the Cl2 is photolyzed by visible light, starting a catalytic
reaction that depletes ozone 1-2% per day!

45
Feb. 2, 2005
Global Total OzoneGlobal Total Ozone
1980 1985 1990 1995 2000 2005-20
-15
-10
-5
0
5
60˚S-60˚N60˚S-60˚N
Solar maximaSolar maximaVolcanoesVolcanoes
El C
hic
ho
nE
l Ch
ich
on
Pin
atu
bo
Pin
atu
bo
Quasi-biennial OscillationQuasi-biennial Oscillation

47
Feb. 2, 2005
What’s being done?What’s being done?

48
Feb. 2, 2005
Atmospheric Chlorine Trends from NOAA/CMDL -HATS Group
Atmospheric Chlorine Trends from NOAA/CMDL -HATS Group
Figure from Trends of the Commonly Used Halons Below Published by Butler et al. [1998]
CFC-12
50 years
102 years
5 years
42 years
85 years
U. S. CFC production stopped by President George Bush in 1992
Montreal Protocol Signed (1987)

49
Feb. 2, 2005
QuickTime™ and aTIFF (Uncompressed) decompressor
are needed to see this picture.
NASA continues to measure ozone and gases that destroy ozone
NASA continues to measure ozone and gases that destroy ozone
QuickTime™ and aTIFF (Uncompressed) decompressor
are needed to see this picture.
QuickTime™ and aTIFF (Uncompressed) decompressor
are needed to see this picture.
QuickTime™ and aTIFF (Uncompressed) decompressor
are needed to see this picture.
QuickTime™ and aTIFF (Uncompressed) decompressor
are needed to see this picture.
QuickTime™ and aTIFF (Uncompressed) decompressor
are needed to see this picture.QuickTime™ and aTIFF (Uncompressed) decompressorare needed to see this picture.QuickTime™ and a
TIFF (Uncompressed) decompressorare needed to see this picture.

50
Feb. 2, 2005
Future Antarctic Ozone Levels
WMO Assessment [2003]
1.Will CFCs and halons decrease as expected?2. Greenhouse gas warming of the lower atmosphere has a cooling affect in the stratosphere, increasing polar O3 loss
3. Stratospheric water vapor increases (of unknown origin) will increase polar O3 loss
Minimum Antarctic Ozone September-November
1960197019801990200020102020203020402050206050
100
150
200
250
300
TOMSCMAMUMETRAC
MAECHAM/CHEME39/CCCSR/NIESUIUC ULAQ
GISS 98 Assessment

51
Feb. 2, 2005
What Can You Do?What Can You Do?
• Avoid excessive solar exposure (limit sun between 11AM and 2PM).
• Wear and encourage others to wear sunscreen (SPF rating of 15). Even with sunscreen, prolonged exposure is not smart.
• Check your skin regularly.• Wear sunglasses that screen UV. • Hats and other coverings• Make note of the UV index on the news or web:
http://www.epa.gov/sunwise/uvindex.html

52
Feb. 2, 2005
Summary• Stratospheric ozone is a critical gas for
screening solar UV radiation.• Human produced ozone destroying
substances (ODS) have caused large losses of ozone over both poles and small global losses.
• ODSs have been regulated under international agreements and are slowly decreasing. Ozone levels should recover within the next 50-70 years.

53
Feb. 2, 2005
Educational Activities and Resources
Educational Activities and Resources
• Jeannie Allen (Sr. Science Education Specialist) [email protected] 301-614-6627
• See handout prepared by Jeannie• Chem Matters http://chemistry.
org/education/chemmatters.html
• Jeannie Allen (Sr. Science Education Specialist) [email protected] 301-614-6627
• See handout prepared by Jeannie• Chem Matters http://chemistry.
org/education/chemmatters.html
54
Feb. 2, 2005
ENDEND
Jan. 10, 2003 - local noon, Kiruna, SwedenJan. 10, 2003 - local noon, Kiruna, Sweden
58
Feb. 2, 2005
What About Global Warming?

59
Feb. 2, 2005
Greenhouse Effect
Without the greenhouse effect, the average surface temperature would be ~0º F!
UV-Vis radiation from the sun is absorbed by Earth’s surface.
Earth’s surface reemits heat as longwave radiation.
CO2
H2O
Atmospheric gases like CO2 and H2O trap outgoing radiation

61
Feb. 2, 2005
Historical Record of CO2
250
275
300
325
350
375
1000 1200 1400 1600 1800 2000
South Pole Flask Data NOAA/CMDL (2001)
Law Dome ice core Etheridge et al. (1999)
Atm
osp
her
ic C
O2 (
ppm
v)
Year

62
Feb. 2, 2005
Variations of the Earth’s surface temperature for the past 1,000 years

63
Feb. 2, 2005
The last 160,000 years (from ice cores) and the next 100 years:
Time (thousands of years)
160 120 80 40 Now
–10
0
10
100
200
300
400
500
600
700
CO2 now
Temperature
difference from today °C
CO
2 c
once
ntra
tion
(ppm
v)
Lowest possible CO2
stabilisation level by 2100
Double pre-industrial CO2
CO2 in 2100(with business as usual)

64
Feb. 2, 2005
OCEANS LAND
ATMOSPHERE
Only about ½ of the CO2 emitted each year shows up in the atmosphere. The rest is absorbed by the ocean or by plants on land.

65
Feb. 2, 2005
Feedbacks make predicting future climate challenging!
Positive Feedback:
More CO2Oceans WarmMore H2OMore Warming
Negative Feedback:
More CO2Oceans Warm More H2OMore High Clouds
More Reflected Sunlight
Cooling

84
Feb. 2, 2005
Ozone Hole Theory
Ozone Hole Theory

85
Feb. 2, 2005
Polar Ozone DestructionPolar Ozone Destruction
1. O3 + Cl ClO + O21. O3 + Cl ClO + O2
Only visible light (blue/green) needed for photolyzing ClOOClNo oxygen atoms required
Net: 2O3 + h 3O2
2 O32 O3 3 O23 O2
3. ClOOCl+h2 Cl+O23. ClOOCl+h2 Cl+O2
2. 2 ClO + M ClOOCl + M2. 2 ClO + M ClOOCl + M

86
Feb. 2, 2005
Polar ProcessesPolar ProcessesPolar ozone losses differ from the standard
photochemical balance:
1. Ozone usually has a very long lifetime: months to years
2. Ozone production is zero, losses are not compensated by production
3. Very cold conditions, cold enough to form clouds in the dry stratosphere.
Polar ozone losses differ from the standard photochemical balance:
1. Ozone usually has a very long lifetime: months to years
2. Ozone production is zero, losses are not compensated by production
3. Very cold conditions, cold enough to form clouds in the dry stratosphere.

87
Feb. 2, 2005
Polar Stratospheric CloudsPolar Stratospheric Clouds
Central, Sweden January 14, 2003 - P. Newman
88
Feb. 2, 2005
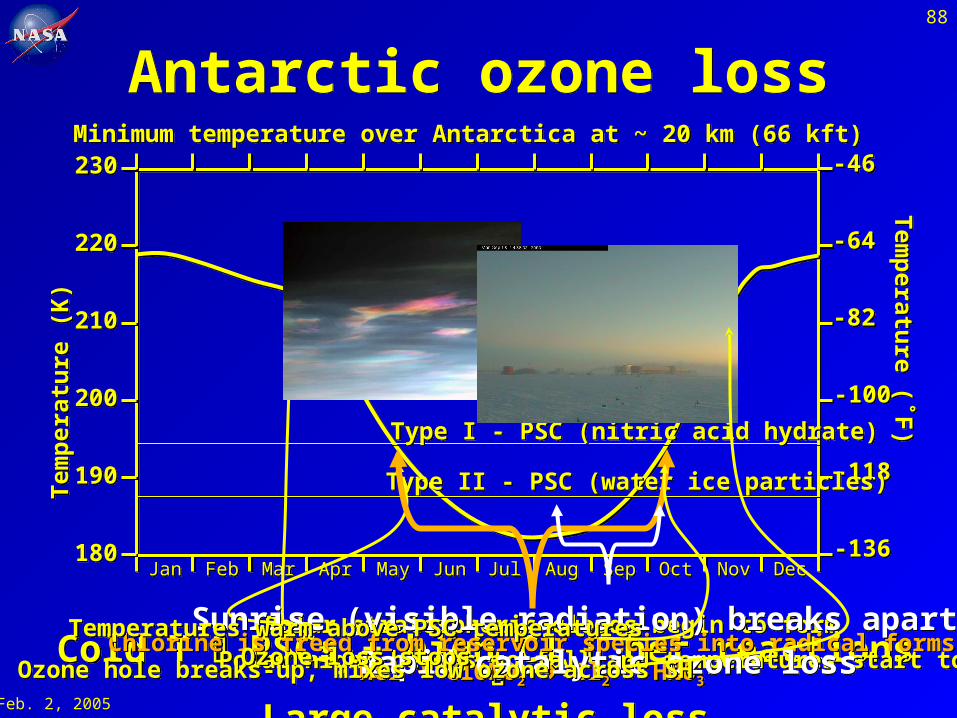
Antarctic ozone lossAntarctic ozone loss
Cold T PSCs + high Cly het reactions Large catalytic loss
Cold T PSCs + high Cly het reactions Large catalytic loss
JanJan FebFeb MarMar AprApr MayMay JunJun JulJul AugAug SepSep OctOct NovNov DecDec180180
190190
200200
210210
220220
230230
Tem
per
atur
e (K
)T
emp
erat
ure
(K)
-136-136
-118-118
-100-100
-82-82
-64-64
-46-46
Tem
perature (˚F
)T
emp
erature (˚F)
Minimum temperature over Antarctica at ~ 20 km (66 kft)Minimum temperature over Antarctica at ~ 20 km (66 kft)
Polar night begins to fall and temperatures start to coolPolar night begins to fall and temperatures start to cool
Type I - PSC (nitric acid hydrate)Type I - PSC (nitric acid hydrate)
Type II - PSC (water ice particles)Type II - PSC (water ice particles)
Polar stratospheric clouds begin to formPolar stratospheric clouds begin to formChlorine is freed from reservoir species into radical forms
HCl + ClONO2 Cl2 + HNO3
Chlorine is freed from reservoir species into radical formsHCl + ClONO2 Cl2 + HNO3
Sunrise (visible radiation) breaks apart Cl2
Rapid catalytic ozone loss
Sunrise (visible radiation) breaks apart Cl2
Rapid catalytic ozone lossTemperatures warm above PSC temperatures
Ozone loss stopsTemperatures warm above PSC temperatures
Ozone loss stopsOzone hole breaks-up, mixes low ozone across SHOzone hole breaks-up, mixes low ozone across SH

89
Feb. 2, 2005
Solomon et al. (1986), Wofsy and McElroy (1986), and Crutzen and Arnold (1986) suggest reactions
on cloud particle surfaces as mechanism for activating Chlorine
Solomon et al. (1986), Wofsy and McElroy (1986), and Crutzen and Arnold (1986) suggest reactions
on cloud particle surfaces as mechanism for activating Chlorine
HCl
ClONO2 HNO3
Cl2
Cl2 is easily photolyzed by UV & blue/green lightHNO3 is sequestered on PSC
Antarctic ozone hole theoryAntarctic ozone hole theory