february 11, 2010 | carolyn chau. improving organizations by providing business insights to all...
TRANSCRIPT

Deepdive: SQL Server Reporting Services &
Report Builder 3.0
February 11, 2010 | Carolyn Chau
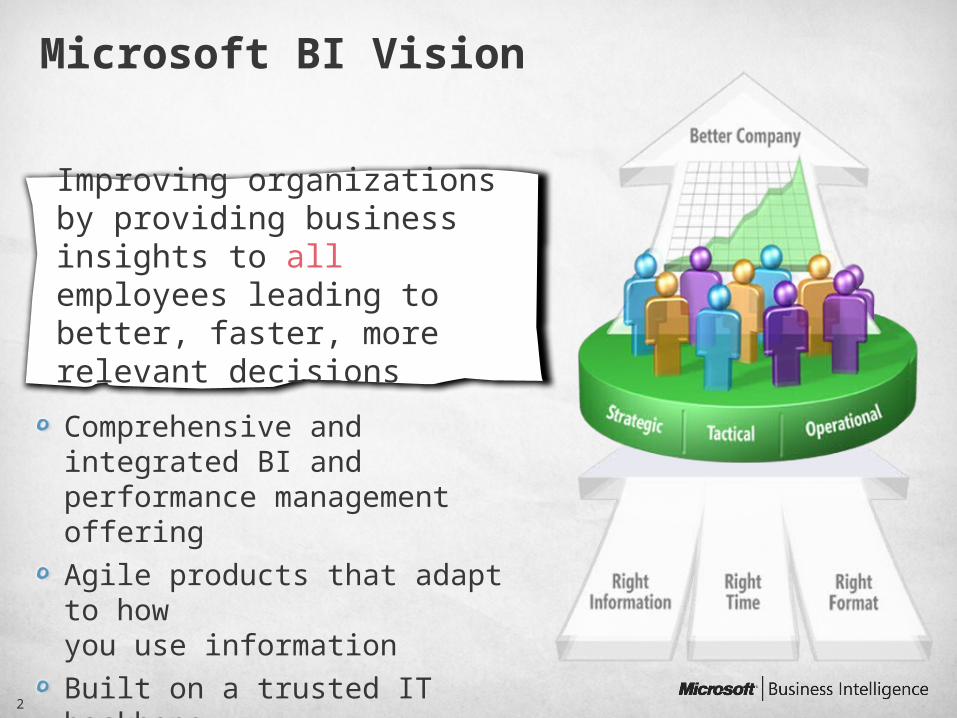
Improving organizations by providing business insights to all employees leading to better, faster, more relevant decisions
Comprehensive and integrated BI and performance management offering
Agile products that adapt to how you use information
Built on a trusted IT backbone
Microsoft BI Vision
2

The Microsoft BI Solution Stack
3
Business Collaboration Platform
Data Infrastructure & BI Platform
Business User Experience
Data Infrastructure and BI PlatformAnalysis ServicesReporting ServicesIntegration ServicesMaster Data ServicesData MiningData Warehousing
Business Collaboration PlatformDashboards & ScorecardsExcel ServicesWeb based forms & workflowCollaborationSearchContent ManagementLOB data integration
Familiar User Experience Self-Service access & insightData exploration & analysisPredictive analysisData visualizationContextual visualization

4
Addressing Today’s Customer Needs
Scale efficiently according to demand—Optimize performance, scale-up individual servers and scale-out very large data warehouses and gain real time insights from high performance, event based applications.
Reduce risk, gain agility—Improve IT’s ability to respond to business changes by enabling centralized management, policy-based control and rapid configuration and deployment.
Respond quickly to business opportunities—Make better, more timely decisions by empowering end users to access, integrate, analyze and share information using Microsoft Office tools they are already familiar with.
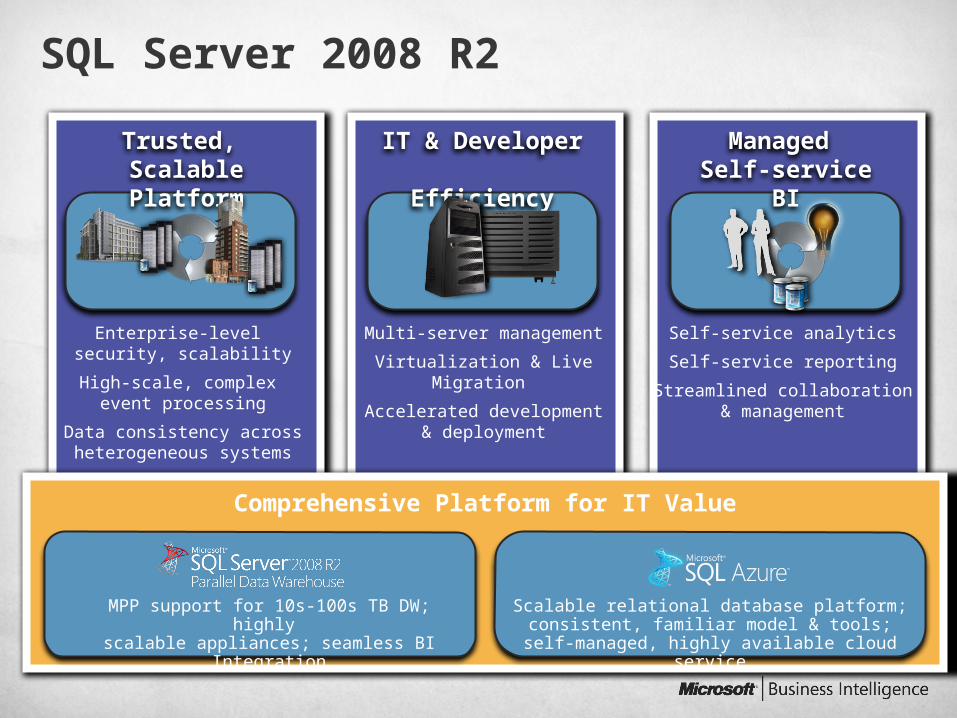
SQL Server 2008 R2
Trusted, Scalable Platform
IT & Developer Efficiency
Managed Self-service BI
Comprehensive Platform for IT Value
Enterprise-level security, scalability
High-scale, complex event processing
Data consistency across heterogeneous systems
Multi-server management
Virtualization & Live Migration
Accelerated development& deployment
Self-service analytics
Self-service reporting
Streamlined collaboration& management
MPP support for 10s-100s TB DW; highly scalable appliances; seamless BI Integration
Scalable relational database platform; consistent, familiar model & tools; self-managed, highly available cloud service

The ability to respond quickly to business opportunities and customer needs can be a huge differentiator.
Managed Self-Service BISelf Service Reporting
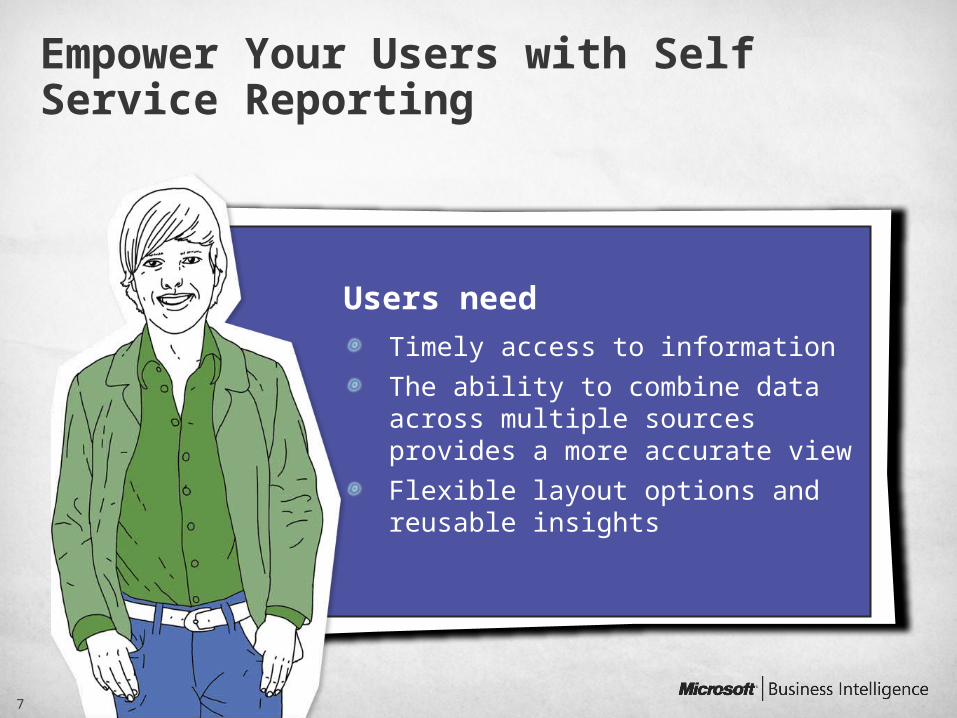
Empower Your Users with Self Service Reporting
7
Users need
Timely access to information
The ability to combine data across multiple sources provides a more accurate view
Flexible layout options and reusable insights

Empower Your Users with Self Service Reporting
8
Reporting Services & Report Builder 3.0Easy access to relational and multidimensional data
Productive reporting with familiar Microsoft Office interface
Highly flexible layout options, rich visualizations, re-usable report components
“Microsoft SQL Server 2008 R2 new Report Builder is fundamentally improving our relationship with our customers by giving them the power and flexibility to create and modify their own reports to meet their immediate needs, removing the delay and cost of needing a report developer. “
- Peter Hammond, CyberSavvy.NET
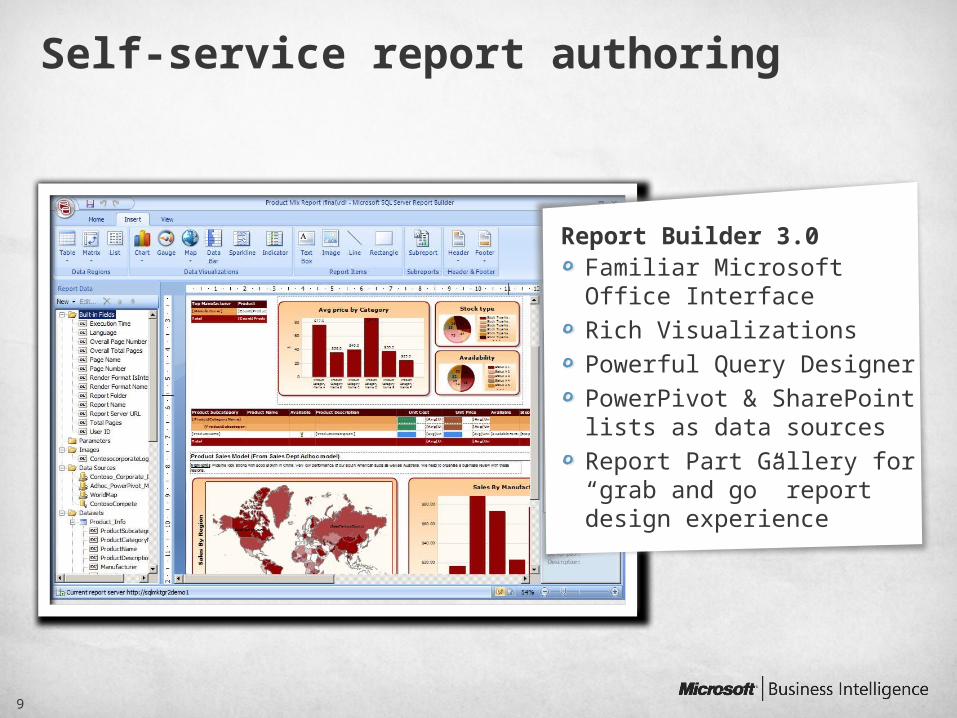
Self-service report authoring
Report Builder 3.0 Familiar Microsoft Office InterfaceRich VisualizationsPowerful Query DesignerPowerPivot & SharePoint lists as data sourcesReport Part Gallery for “grab and go” report design experience
9

Stepped or Block grouping
PivotCustom
SubtotalsNon-pivotcolumns
Nested controls Multi-Pivot
CustomHeaders
Highly flexible layout options
10

Sparklines
Sparklines“Data intense, word-sized graphics” – TufteAutomatic axis alignment. All charts can have the same data points, regardless of source data.Can be converted into full charts to support additional small multiple scenarios.
Data BarsUsually depicts a single value in a cell.Min and Max are automatically determined, but are configurable.
Data Bars
Tablix Visualizations: Sparklines and Data Bars
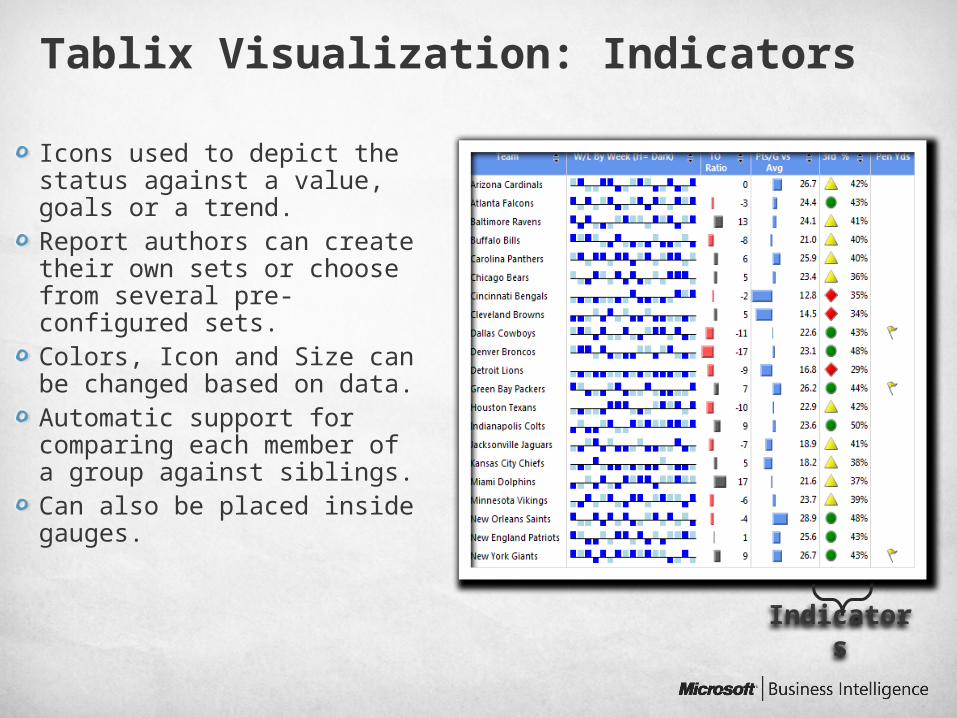
Icons used to depict the status against a value, goals or a trend.Report authors can create their own sets or choose from several pre-configured sets.Colors, Icon and Size can be changed based on data.Automatic support for comparing each member of a group against siblings.Can also be placed inside gauges.
Tablix Visualization: Indicators
Indicators

Map Features
Support for SQL SpatialIntegration with Virtual Earth tilesData Grouping—Equal intervals, equal distribution, optimal, user-definedMultiple Map layers
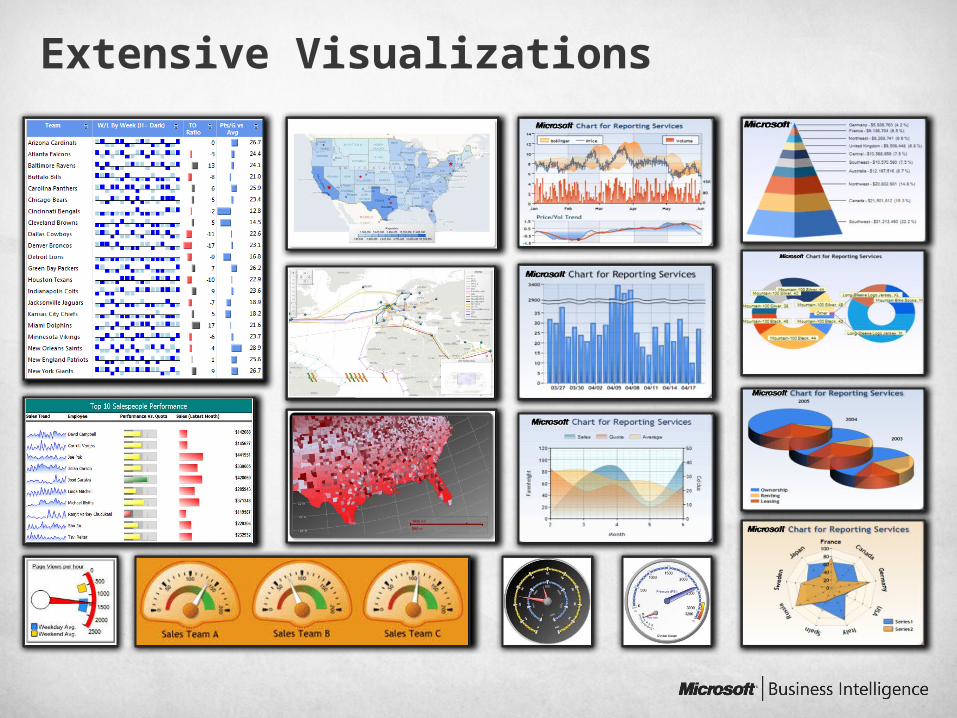
Extensive Visualizations

Enhanced Report Viewer and Report Manager Experience
Refreshed viewer look and feel
Smooth and fluid navigation experience (AJAX Report Viewer)
Updated Report Manager. Workflow optimized (no need to preview report to access its properties or manage it)
Updated Report Manager look and feel
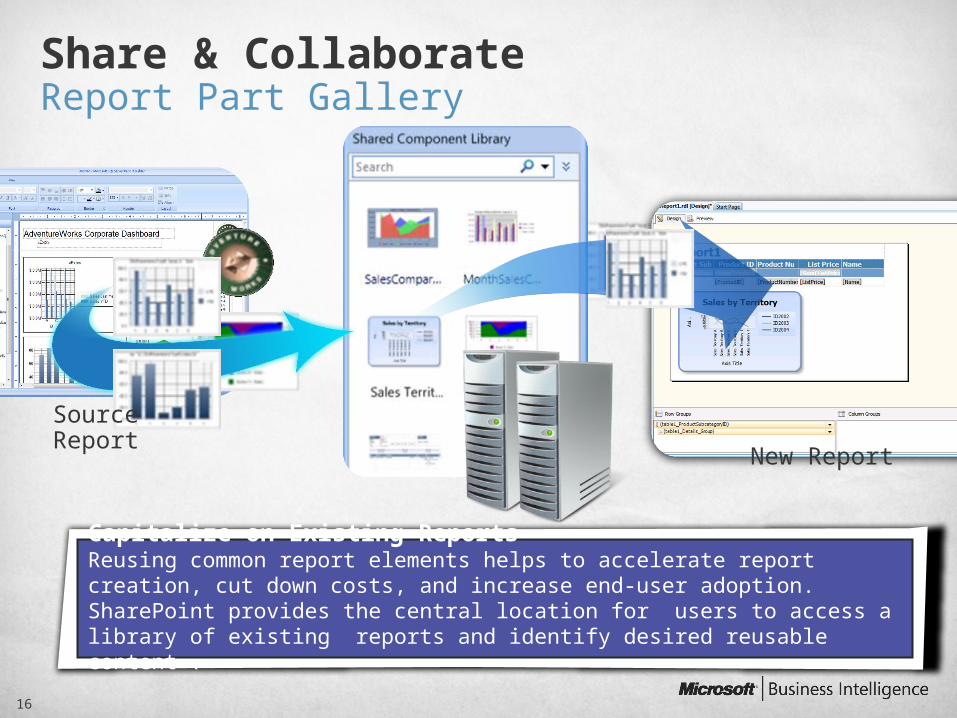
New Report
SourceReport
Share & Collaborate Report Part Gallery
16
Capitalize on Existing ReportsReusing common report elements helps to accelerate report creation, cut down costs, and increase end-user adoption. SharePoint provides the central location for users to access a library of existing reports and identify desired reusable content .

Publishing
Published
Reports
ATOM Feed
Data Import
Encapsulating Data Sources
17
Data Sources Encapsulating Reports
SharePoint Farm
SQL Server Reporting Services 2008 R2—Data feed capabilities are provided out of the box in every report.

Maximizing Business Insight
OLTP and OLAP Data
Sources

Report Builder 3.0

20
Managed Self-Service BI
Data consistency
across heterogeneous
systems
Empower Your People
Improve Organizational Effectiveness
Increase IT Efficiency
Central management
Access and re-use insights
Share & collaborate with ease
Intuitive authoring &
powerful analysis
Easily access and
integrate data
Deliver data securely
and efficiently
Automatic data refresh
Rich visualizations and flexible
layouts
“Kilimanjaro signifies a greater emphasis toward supporting the needs of end users by leveraging the capabilities of SQL Server and the ubiquity of Excel.”- Helena Schwenk, Ovum

Summary—Business Insight to All Employees
Unlock Your Data
Deliver Relevant
Information
Drive Actionable Insights
Increase IT and
Developer Efficiency
Empower your Users
21
Share and Collaborate
Early Feedback
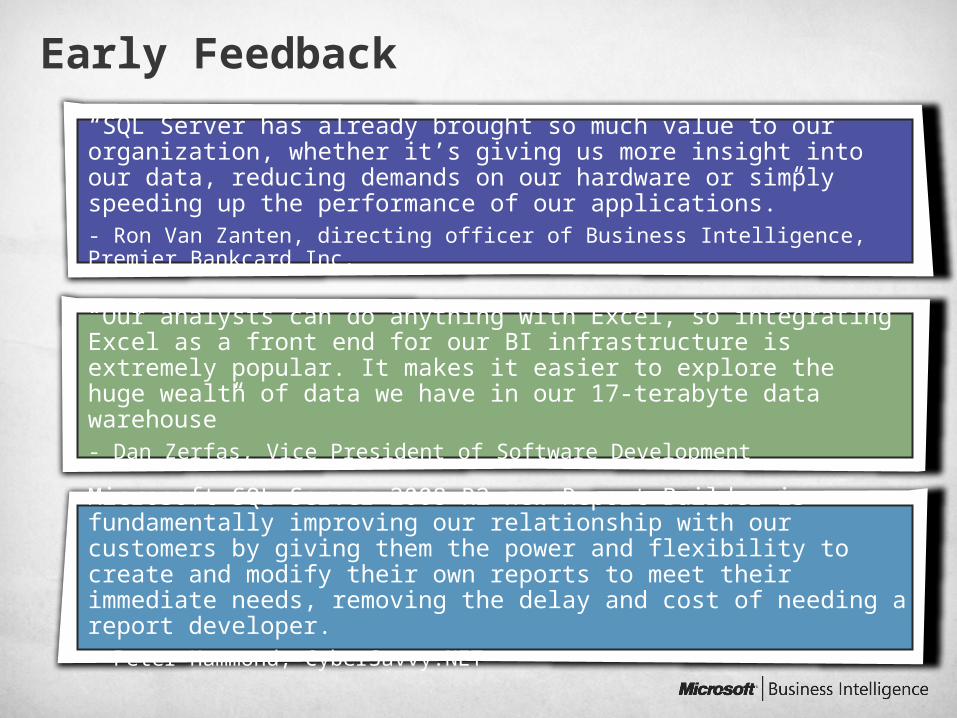
“SQL Server has already brought so much value to our organization, whether it’s giving us more insight into our data, reducing demands on our hardware or simply speeding up the performance of our applications.” - Ron Van Zanten, directing officer of Business Intelligence, Premier Bankcard Inc.
“Our analysts can do anything with Excel, so integrating Excel as a front end for our BI infrastructure is extremely popular. It makes it easier to explore the huge wealth of data we have in our 17-terabyte data warehouse”- Dan Zerfas, Vice President of Software Development
Microsoft SQL Server 2008 R2 new Report Builder is fundamentally improving our relationship with our customers by giving them the power and flexibility to create and modify their own reports to meet their immediate needs, removing the delay and cost of needing a report developer. - Peter Hammond, CyberSavvy.NET
Learn more about SQL Server 2008 R2 at www.microsoft.com/sqlserver
Evaluate SQL Server 2008 R2
Download Report Builder 3.0 today and evaluate it against any supported data source (doesn’t have to be R2)
Call to Action

© 2010 Microsoft Corporation. All rights reserved. Microsoft, Microsoft Dynamics, the Microsoft Dynamics logo, and [list other trademarks] are trademarks of the Microsoft group of companies.
The information herein is for informational purposes only and represents the current view of Microsoft Corporation as of the date of this presentation. Because Microsoft must respond to changing market conditions, it should not be interpreted to be a commitment on the part of Microsoft, and Microsoft cannot guarantee the accuracy of any information provided after the
date of this presentation. MICROSOFT MAKES NO WARRANTIES, EXPRESS, IMPLIED OR STATUTORY, AS TO THE INFORMATION IN THIS PRESENTATION.